original article formulation and in vitro evaluation of
TRANSCRIPT
Turk J Pharm Sci 10 (1), 69-86, 2013
Original article
FORMULATION AND IN VITRO EVALUATION OF GASTRORETENTIVE FLOATING DRUG DELIVERY SYSTEM OF
RITONAVIR
Moumita BISWAS1, Roop Narayan GUPTA1, Rabinarayan PARHI2*, Kalyan Kumar SETHI2, Suvendu Kumar SAHOO2.
1Birla Institute of Technology, Department of Pharmaceutical Sciences, Meshra, Ranchi, Jharkhand, INDIA
2GITAM University, GITAM Institute of Pharmacy, Gandhi Nagar Campus, Rushikunda, Visakhapatnam-530045, Andhra Pradesh, INDIA
Abstract The purpose of the research work was to develop a floating drug delivery system of ritonavir (RN) in
order to prolong the gastric residence time and increase its bioavailability. The floating tablets of RN were prepared by direct compression technique, using polymers such as different grades of hydroxypropyl methylcellulose (HPMC, Methocel E15LV, E50LV, K100LV and K4M) and polyvinyl pyrrolidone (PVP K30). Sodium bicarbonate was used as gas releasing agent. The formulations were optimized on the basis of matrix integrity, duration of floating, swelling behavior and in vitro drug release. Except series FA, where floating time was 10 hr, other series such as FB, FC and FD were showing more than 12 hr of floating time. The highest average swelling index of 170.68 ± 0.45 was found in FD3 batch. The in vitro drug release indicated extended release of RN and more than 62 percent of drug was released at the end of the 12 hr for all the batches. The mechanism ofRN release from the floating tablets for FA, FB and FC series is anomalous diffusion transport and follows zero order kinetics, but FD series indicated Higuchi kinetics with release rate exponent (n) of 0.44. Further, the scanning electron microscopy showed porous structured formed on the tablet surface at different times (0, 3, 6, 9 and 12 hr) of dissolution for the selected batch FC3. Finally, FC3 batch showed no significant change in above parameters after storage at room temperature (28-32°C), 40°C and 50°C for one month.
Key words: Ritonavir, Floating tablet, Extended release, Higuchi kinetics, Gas formation.
Ritonavir'in Gastroretentif Yiizen Ilac Tasiyici Sisteminin Formiilasyonu ve In Vitro Degerlendirilmesi
Bu galismamn amaci Ritonavir (RN) 'in gastrik kalis zamanim uzatmak ve biyoyararlammim artirmak igin yiizen Hag tasiyici sistemini hazirlmaktir. RN yiizen tabletleri, farkh hidroksipropil metil seluloz (HPMC, Methocel E15LV, E50LV, KlOOLVve K4M) andpolivinilpirolidon (PVP K30) turevleri kullamlarak direk basim teknigi He hazirlanmistir. Sodyum bikarbonat gaz salim ajani olarak kullamlmistir. Formulasyonlar matriks butunlugu, yttzme siiresi, sisme davranisi ve in vitro Hag sahmi temel almarak optimize edilmistir. Yüzme süresi 10 saat olan FA serisi hariç FB, FC ve FD gibi diger seriler 12 saatten fazla yuzme zamani gostermistir. En yiiksek ortalama sisme indeksi 170.68 ± 0.45 olarakFD3 serisinde tespit edilmistir. In vitro salon gahsmalarinda bütün serilerde 12 saat sonunda % 62 'den daha fazla RN uzatilmis sahmi elde edildigi bildirilmistir. FA, FB ve FC serilerinden RN salim mekanizmalan anormal difuzyon transportu ve takiben sifirinci derece kinetigi gostermistir ancak FD serileri salim hizi katsayisi (n) 0.44 olan Higuchi kinetigini gostermistir. Buna ilaveten, taramah elektron mikroskopisi segilmis seri olan FC3 igin degisikzaman araliklannda (0,3,6,9 ve 12 saat)tablet yuzeyinde poroz yapi olustugunu gostermistir. Sonug olarak FC3 serisinde oda sicakhgi (28-32°C), 40°C ve 50°C'de 1 ay saklama sonrasinda onemli bir degisiklik bulunmamistir.
Anahtar kelimeler: Ritonavir, Yiizen tablet, Uzatilmis salim, Higuchi kinetigi, Gaz olusumu. "Correspondence: E-mail: [email protected]; Mobile tel: 09052983544
69

Moumita BISWAS, Roop Narayan GUPTA, Rabinarayan PARHI, Kalyan Kumar SETHI, Suvendu Kumar SAHOO
INTRODUCTION
Ritonavir (RN) is a Protease Inhibitor widely prescribed in anti-retroviral regimen. It blocks the HIV protease, thereby reducing the viral load in the infected individual (1). In spite of its favorable clinical response, some specific problems associated with it are low oral bioavailability. This is due to degradation of RN by the cytochrome P45-3A4 (CYP3A4) isoenzymes in the distal intestine (2), efflux of the absorbed drug by counter transporter proteins (mainly P-glycoprotein) present in the distal intestine (3,4) and is unstable at alkaline pH (5). It shows pH dependent solubility and solution stability (solubility and solution stability decreases as pH increases) (6,7). It also shows high inter-individual variability in pharmacokinetics, with a greater than six fold variability in through concentrations among patients given 600 mg ritonavir every 12 hr. The major side effect associated with RN is gastro intestinal (GI) toxicity (dose-dependent) and is less common with lower doses (8). The short biological half life of drug (~3-5 hr) also favors development of extended release (ER) formulation (9).
Oral ingestion has long been the most convenient and commonly employed route of drug delivery for systemic effect. Indeed for ER systems, the oral route of administration has by far received the highest attention with respect to research on physiological drug constraints as well as design and testing of products. This is because there is more flexibility with regard to dosage form in case of oral route than in parenteral route (10).
ER dosage forms are now used with number of drugs due to following potential advantages such as reduction in dosing frequency leading to improved patient compliance, employ less total drug which minimizes or eliminates local side effects, obtain less potentiation or reduction of drug activity with chronic dosing, minimise loss of valuable drug substances which has high solubility and low permeability or those which utilise carrier mediated transport in gut, improve efficiency in treatment, improve control of disease condition by avoiding fluctuations in plasma drug level, improve bioavailability of some drugs (11,12). The popularity of simple ER Formulations is decreased due to certain drawbacks like decrease systemic availability due to incomplete release, poor in vitro - in vivo correlation, possibility of dose dumping, retrieval of drug is difficult in case of toxicity and high cost of formulation (13).
In addition to above, this simple pharmaceutical approach of ER could not be beneficial for oral delivery of certain drugs. For example: Drugs that have absorption window in upper gastrointestinal tract, drugs that are unstable in lower GI tract, either due to pH variation or enzymes present in intestinal brush border epithelium (P450 isoenzymes) or due to efflux proteins (P-glycoprotein), drugs that have poor solubility at higher pH e.g. RN, ofloxacin, drugs having adverse activity in colon, drugs given for local action in gastric region, drugs for acute conditions require greater physician adjustment of the dosage form than that provided by ER products and drugs with cumulative action and low therapeutic indices (e.g. Phenobarbital, Digoxin) are not suitable because of the technologic limitation of precise controls over release rates and the risk of dose dumping (14,15). Furthermore, the relatively short gastric emptying time can result in an incomplete release of drug from the drug delivery system, leading to a diminished efficacy of the administered dose (11). Therefore, an effective control of the placement of a delivery system in a specific region of the GI tract offers numerous advantages, especially for the drugs with specific absorption site in the GI tract or the drugs with stability problem. These considerations have led to the development of the ER dosage forms that possess gastric retention capability (16,17). Floating drug delivery system (FDDS) is one of gastro-retentive dosage forms that could prolong gastric residency time (GRT) to obtain sufficient drug bioavailability (12–15). The system basically floats in the gastric fluid because of its lower bulk density compared to that of the aqueous medium. Above system with a prolonged GRT are called Gastro Retentive Floating Drug Delivery System (GRFDDS) (18).
The object of the present study is to prepare FDDS of Ritonavir with four grades of HPMC (E15 LV, E50 LV, K100 LV and K4 M) along with gas-generating agent and PVP K30. The different tablet formulations were subjected to in vitro release, release profile comparision, drug release kinetics, scanning electron microscope (SEM) and stability study along with physical characterization.
70
Turk J Pharm Sci 10 (1), 69-86, 2013
MATERIALS AND METHODS
The drug, RN, was a gift sample of Cipla Ltd., Mumbai. HPMC E15 LV, HPMC E50 LV and HPMC K100 LV were obtained from Colorcon Asia Pvt. Ltd., Mumbai. HPMC K4 M and Cellulose Microcrystalline were purchased from Loba Chemie Pvt. Ltd., Mumbai and Thomas Baker (Chemicals) Pvt. respectively. Other chemicals were of analytical grade.
Preformulation Studies Solubility study of the drug
The solubility of RN was studied in 0.1N HCl, at 37±0.5ºC. An excess quantity of Ritonavir was taken in 25 ml of 0.1N HCl. The solutions were shaked in ‘water bath shaker’ for 24 hr at 37±0.5ºC. The solution was then passed through a Whatmann filter paper (No.1) and the amount of the drug dissolved was analyzed spectrophotometrically (UV- 1170, Systronics) at 246.2 nm after suitable dilutions.
Powder flow property The flow properties of powders were determined included the following: bulked density, tapped
density, flow through an orifice, compressibility index (Carr’s index), Hausner’s ratio and angle of repose. All the above properties were measured according to USP XXXI (19).
Preparation of gastroretentive floating tablets for Ritonavir Tablets were prepared by direct compression technique and the composition for each batch is
shown in Table 1 . Accurately weighed all ingredients (except magnesium stearate and talc) were taken in a mortar, mixed well and sifted through 18 mesh screen. Moisture content of blend was controlled and maintained between 2-3 % by using IR lamp. Final blending of powder, magnesium stearate (30 mesh) and talc (30 mesh) was performed in mortar for 5 min with the help of spatula. Above blend with the compression weight of 400 mg was compressed by using 11 mm normal flat punches (Cadmach tablet punching machine).
Table 1. Compositions of different tablet formulation. Composition (mg/tab) FA1 FA2 FA3 FB1 FB2 FB3 FC1 FC2 FC3 FD1 FD2 FD3
Drug 100 100 100 100 100 100 100 100 100 100 100 100
HPMC E15LV
100 150 200 ---- --- --- --- --- --- ---
HPMC E50LV --- --- 100 150 200 --- --- --- --- --- ---
HPMC K100LV --- --- --- --- --- --- 100 150 200 ---- ----
HPMC K4M ---- --- --- --- 100 150 200
Microcrystal line cellulose
150 100 50 150 100 50 150 100 50 150 100 50
All the formulations contains 30 mg of Sodium biocarbonate, 10 mg of PVP K30 and 5 mg each of Magnesium stearate and talc. The total weight of all the formulations were 400 mg.
Tablet properties In-process samples were tested for weight variation, hardness (Monsanto hardness tester),
friability (Roche friabilator), thickness (Vernier caliper) and drug content. For drug content, tablets
71
Moumita BISWAS, Roop Narayan GUPTA, Rabinarayan PARHI, Kalyan Kumar SETHI, Suvendu Kumar SAHOO
were powdered in a mortar and powder equivalent to 100 mg of RN was taken in a 100 ml volumetric flask. The powder was dissolved in a 70 ml of methanol, vortexed for 10 minutes and then volume was further adjusted with methanol. The solution was filtered through Whatmann filter paper (No.1). Then the solution was further diluted as per requirement and analyzed spectrophotometrically at 239.40 nm (UV-1170, Systronics).
Floating behavior of tablets The floating lag time and total time of floating was determined in the USP Dissolution Apparatus
II in an acid environment (0.1 N HCl). Volume of the medium was 900 ml and the temperature was maintained at 37 ± 0.5 ºC. The rotation speed was 50 rpm. The time interval between the introduction of the tablet into the dissolution medium and its buoyancy to the top of dissolution medium is taken as floating lag time and the total time of floating and dimensional stability was observed visually (15).
Swelling studies The extent of swelling was measured in terms of percent weight gain by the tablet. Three tablets
from each formulation were kept in petri dishes containing 0.1 N HCl. Periodically, tablets were withdrawn, blotted with absorbent tissue to remove any excess medium on the surface and weighed. Process was continued till the end of 12 hr (20). Swelling Index (% weight gain) was calculated by using the Eq. 1:
Swelling Index (SI) = {(Mt-Mo)/Mo} x 100 Eq. 1
where Mt is the weight of tablet at time t, and Mo is the weight of tablet at time t=0
In-vitro dissolution studies After verification of the drug content of the tablets, in vitro dissolution testing was performed by
the rotating paddle USP apparatus II, (TDT-08 L, Electrolab) at 37 ± 0.5°C and 50 rpm, using 900 ml of 0.1N HCl for 12 hours. Sink conditions were maintained throughout the test. Ten ml aliquots were collected at 0.5 , 1, 2, 3, 4, 5, 6, 7, 8, 9, 10, 11 and 12 hr and same volume of fresh medium maintained at same temperature was replaced into the dissolution vessel. The samples were filtered through Whatmann filter paper (No.1) and analyzed spectrophotometrically (UV-1700, Shimadzu, Japan) at 246.2 nm for RN content after suitable dilution.
Comparison of drug release profiles Release profiles were compared using dissolution efficiency (DE) and mean dissolution time
(MDT), which were calculated using following equations (21). The Dissolution Efficiency of a dosage from is defined as the area under the dissolution curve upto a certain time (t) and expressed as a percentage of the area under the rectangle described by 100% dissolution in the same time. Both DE and MDT are presented as Eq. 2 and Eq. 3.
. . . / y xdt
DE (%) = — X 100 Eq. 2 yioo xt
where y is drug percent dissolved at time t.
MDT = -£= Eq. 3
where j is the sample number, n is the number of dissolution sample times, ij is the time at the midpoint between ij and ij-1 [easily calculated with the expression (ij + ij-1)/2] and AMj is the additional amount of drug dissolved between ij and ij-1. One-way analysis of variance test (ANOVA) was performed with P< 0.05 as the level of significance.
72
Turk J Pharm Sci 10 (1), 69-86, 2013
Drug release kinetic modelling To investigate the effect of viscosity and concentration of polymer on the mechanism of Ritonavir
release from tablets, data were subjected to various mathematical kinetic models like Zero order, First order, Higuchi model and a semi-empirical model, known as the power law (22), which is given by the Eq. 4.
Mt / Mo, = ktn Eq. 4
where Mt is the mass of drug released at a time t, Moo is the total mass of released drug, k is a constant incorporating morphologic characteristics of the delivery system, and n is the release exponent which characterizes the mechanism of drug release, i.e. for cylindrical systems n = 0.45 for purely Fickian diffusion, 0.45<n<0.89 for anomalous (non-Fickian transport) controlled by both diffusion and swelling, n = 0.89 for zero-order release (swelling controlled drug release) systems, and values >0.89 indicate super case-II transport (23-25).
Fourier-transform infrared spectroscopy (FT-IR) The FT-IR absorption spectra in the range 4000-400 cm-1 for pure drug, drug with different
excipients in 1:1 ratio and the final formulation were obtained using KBr disc method (Shimadzu, Japan, FTIR-8400 S) and observed for characteristic peaks of drug.
Scanning electron microscopy of tablets The morphology of intact tablet surface of formulation FD2 and at 3rd, 6th, 9th, 12th hr of
dissolution was evaluated by a Scanning Electron Microscopy (SEM, JSM-6390LV, JEOL). Samples were coated with platinum using auto fine coater for 75 seconds with thickness 25 nm at a 40 mA operating current prior to viewing.
Stability study For the convenience of the study, only the final formulation batch was stored in room temperature
in desiccator (28-32°C), at 40°C and at 50°C for one month (26). The parameters studied were appearance, hardness, drug content and FT-IR.
RESULTS AND DISCUSSION
Preliminary studies were conducted in order to optimize lag time i.e. the time required for the dosage form for its buoyancy by taking various parameters into consideration such as concentration of sodium bicarbonate at three levels (20 mg, 25 mg and 30 mg per tablet), nature of diluents (microcrystalline cellulose and lactose at equal concentration) and effect of hardness at three levels i.e. 1.25, 2.5 & 5 kg.
The batch with highest concentration (30 mg per tablet) of sodium bicarbonate shows an acceptable lag time (16 sec) for floating and floats over desired period of time (11 hr). The tablets with MCC as diluent demonstrates dimensional stability (without disperson of tablets) for a longer period of time. This may be attributed to the insoluble nature and high crosslinking structure of MCC. In case of hardness, the medium hardness (2.5 kg) yields highest floating time (12 hr) and an acceptable lag time. Therefore, the highest level of SB, MCC as diluent and 2.5 kg hardness were selected for further formulation development
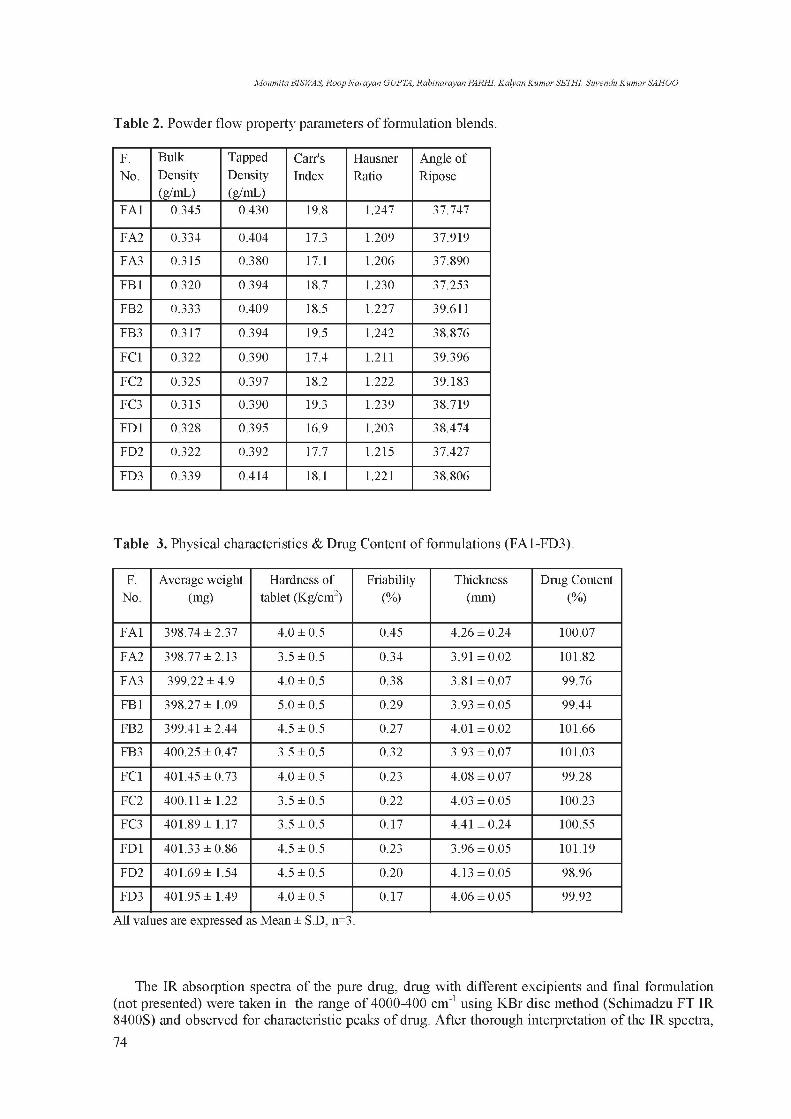
Flow property of precompression blend of different batches were determined by calculating Carr Index, Hausner Ratio & Angle of Repose. The observed values are presented in Table 2. The observed values of Carr’s Index, Hausner Ratio & Angle of repose were found to be in the range of powder having fair flow property.
73
Moumita BISWAS, Roop Narayan GUPTA, Rabinarayan PARHI, Kalyan Kumar SETHI, Suvendu Kumar SAHOO
Table 2. Powder flow property parameters of formulation blends.
F. No.
Bulk Density (g/mL)
Tapped Density (g/mL)
Carr's Index
Hausner Ratio
Angle of Ripose
FA1 0.345 0.430 19.8 1.247 37.747
FA2 0.334 0.404 17.3 1.209 37.919
FA3 0.315 0.380 17.1 1.206 37.890
FB1 0.320 0.394 18.7 1.230 37.253
FB2 0.333 0.409 18.5 1.227 39.611
FB3 0.317 0.394 19.5 1.242 38.876
FC1 0.322 0.390 17.4 1.211 39.396
FC2 0.325 0.397 18.2 1.222 39.183
FC3 0.315 0.390 19.3 1.239 38.719
FD1 0.328 0.395 16.9 1.203 38.474
FD2 0.322 0.392 17.7 1.215 37.427
FD3 0.339 0.414 18.1 1.221 38.806
Table 3. Physical characteristics & Drug Content of formulations (FA1-FD3).
F. No.
Average weight (mg)
Hardness of tablet (Kg/cm2)
Friability (%)
Thickness (mm)
Drug Content (%)
FA1 398.74 ± 2.37 4.0 ± 0.5 0.45 4.26 ± 0.24 100.07
FA2 398.77 ± 2.13 3.5 ± 0.5 0.34 3.91 ± 0.02 101.82
FA3 399.22 ± 4.9 4.0 ± 0.5 0.38 3.81 ± 0.07 99.76
FB1 398.27 ± 1.09 5.0 ± 0.5 0.29 3.93 ± 0.05 99.44
FB2 399.41 ± 2.44 4.5 ± 0.5 0.27 4.01 ± 0.02 101.66
FB3 400.25 ± 0.47 3.5 ± 0.5 0.32 3.93 ± 0.07 101.03
FC1 401.45 ± 0.73 4.0 ± 0.5 0.23 4.08 ± 0.07 99.28
FC2 400.11 ± 1.22 3.5 ± 0.5 0.22 4.03 ± 0.05 100.23
FC3 401.89 ± 1.17 3.5 ± 0.5 0.17 4.41 ± 0.24 100.55
FD1 401.33 ± 0.86 4.5 ± 0.5 0.23 3.96 ± 0.05 101.19
FD2 401.69 ± 1.54 4.5 ± 0.5 0.20 4.13 ± 0.05 98.96
FD3 401.95 ± 1.49 4.0 ± 0.5 0.17 4.06 ± 0.05 99.92
All values are expressed as Mean ± S.D, n=3.
The IR absorption spectra of the pure drug, drug with different excipients and final formulation (not presented) were taken in the range of 4000-400 cm-1 using KBr disc method (Schimadzu FT IR 8400S) and observed for characteristic peaks of drug. After thorough interpretation of the IR spectra, 74
Turk J Pharm Sci 10 (1), 69-86, 2013
it was found that the major peaks of pure drug were preserved in the drug with individual excipients and formulations, which concludes that there was no chemical interaction.
Various physical characteristics and drug content of the prepared batches were determined and the results obtained are presented in Table 3. Physical parameters and drug content of all the batches are within tolerance limits (27).
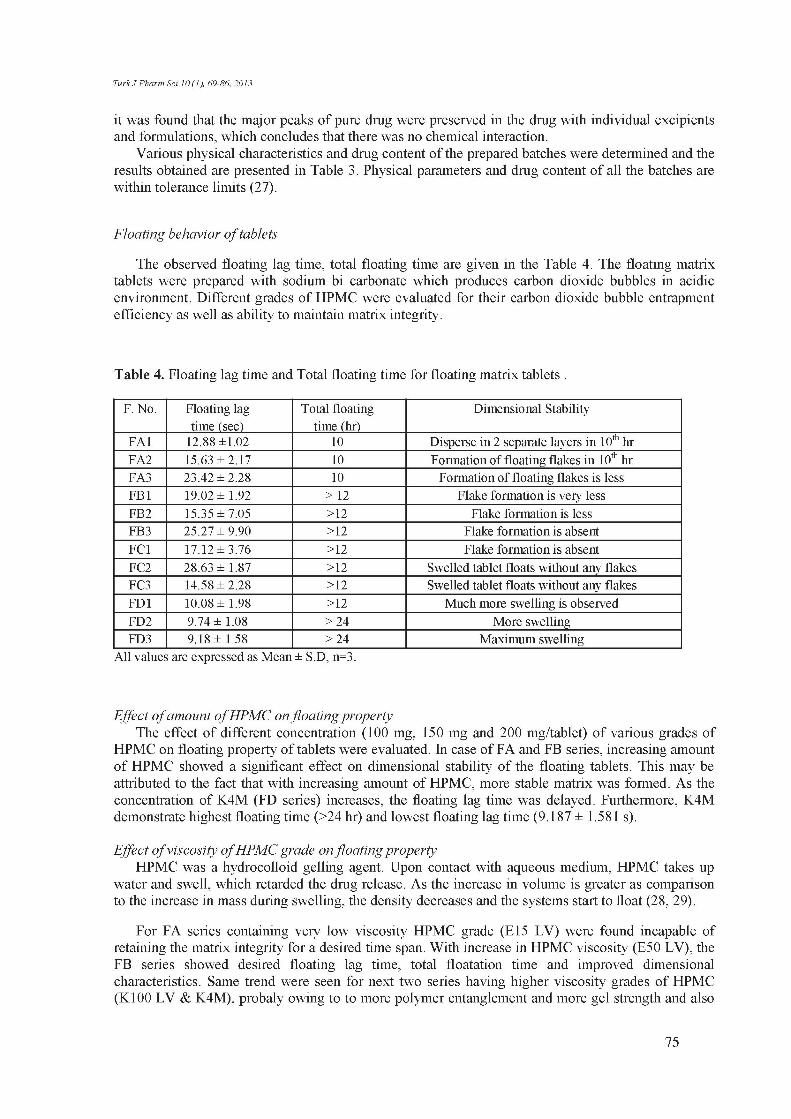
Floating behavior of tablets
The observed floating lag time, total floating time are given in the Table 4. The floating matrix tablets were prepared with sodium bi carbonate which produces carbon dioxide bubbles in acidic environment. Different grades of HPMC were evaluated for their carbon dioxide bubble entrapment efficiency as well as ability to maintain matrix integrity.
Table 4. Floating lag time and Total floating time for floating matrix tablets .
F. No. Floating lag time (sec)
Total floating time (hr)
Dimensional Stability
FA1 12.88 ±1.02 10 Disperse in 2 separate layers in 10th hr FA2 15.63 ± 2.17 10 Formation of floating flakes in 10th hr FA3 23.42 ± 2.28 10 Formation of floating flakes is less FB1 19.02 ± 1.92 > 12 Flake formation is very less FB2 15.35 ± 7.05 >12 Flake formation is less FB3 25.27 ± 9.90 >12 Flake formation is absent FC1 17.12 ± 3.76 >12 Flake formation is absent FC2 28.63 ± 1.87 >12 Swelled tablet floats without any flakes FC3 14.58 ± 2.28 >12 Swelled tablet floats without any flakes FD1 10.08 ± 1.98 >12 Much more swelling is observed FD2 9.74 ± 1.08 > 24 More swelling FD3 9.18 ± 1.58 > 24 Maximum swelling
All values are expressed as Mean ± S.D, n=3.
Effect of amount of HPMC on floating property The effect of different concentration (100 mg, 150 mg and 200 mg/tablet) of various grades of
HPMC on floating property of tablets were evaluated. In case of FA and FB series, increasing amount of HPMC showed a significant effect on dimensional stability of the floating tablets. This may be attributed to the fact that with increasing amount of HPMC, more stable matrix was formed. As the concentration of K4M (FD series) increases, the floating lag time was delayed. Furthermore, K4M demonstrate highest floating time (>24 hr) and lowest floating lag time (9.187 ± 1.581 s).
Effect of viscosity of HPMC grade on floating property HPMC was a hydrocolloid gelling agent. Upon contact with aqueous medium, HPMC takes up
water and swell, which retarded the drug release. As the increase in volume is greater as comparison to the increase in mass during swelling, the density decreases and the systems start to float (28, 29).
For FA series containing very low viscosity HPMC grade (E15 LV) were found incapable of retaining the matrix integrity for a desired time span. With increase in HPMC viscosity (E50 LV), the FB series showed desired floating lag time, total floatation time and improved dimensional characteristics. Same trend were seen for next two series having higher viscosity grades of HPMC (K100 LV & K4M), probaly owing to to more polymer entanglement and more gel strength and also
75
Moumita BISWAS, Roop Narayan GUPTA, Rabinarayan PARHI, Kalyan Kumar SETHI, Suvendu Kumar SAHOO
to the smaller effective molecular diffusion area at higher viscosity as compared with lower viscosity grades of HPMC.
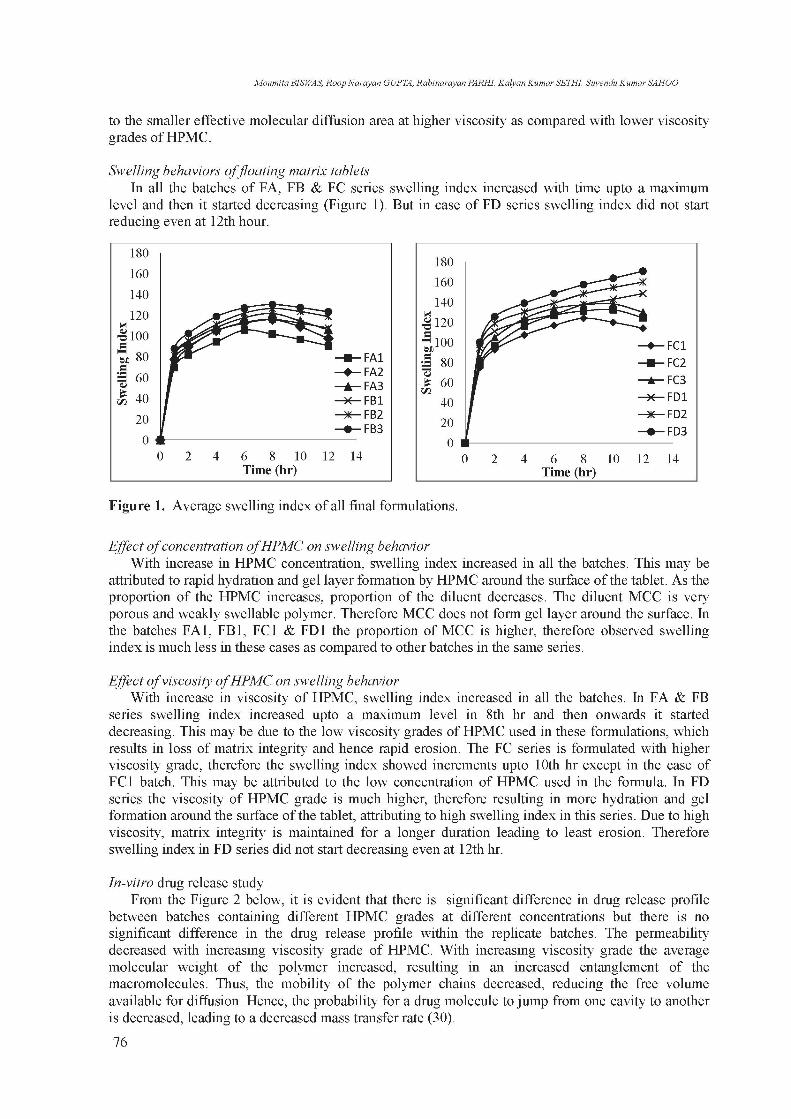
Swelling behaviors of floating matrix tablets In all the batches of FA, FB & FC series swelling index increased with time upto a maximum
level and then it started decreasing (Figure 1). But in case of FD series swelling index did not start reducing even at 12th hour.
180 160 140 120 100 80 W* B F A 1
60 f - * - F A 2 60 I -A-FA3
40 / X-FB1 20
0 1
/ * - F B 2 ' «-FB3
0 2 4 6 8 10 12 14 Time (hr)
Figure 1. Average swelling index of all final formulations.
Effect of concentration of HPMC on swelling behavior With increase in HPMC concentration, swelling index increased in all the batches. This may be
attributed to rapid hydration and gel layer formation by HPMC around the surface of the tablet. As the proportion of the HPMC increases, proportion of the diluent decreases. The diluent MCC is very porous and weakly swellable polymer. Therefore MCC does not form gel layer around the surface. In the batches FA1, FB1, FC1 & FD1 the proportion of MCC is higher, therefore observed swelling index is much less in these cases as compared to other batches in the same series.
Effect of viscosity of HPMC on swelling behavior With increase in viscosity of HPMC, swelling index increased in all the batches. In FA & FB
series swelling index increased upto a maximum level in 8th hr and then onwards it started decreasing. This may be due to the low viscosity grades of HPMC used in these formulations, which results in loss of matrix integrity and hence rapid erosion. The FC series is formulated with higher viscosity grade, therefore the swelling index showed increments upto 10th hr except in the case of FC1 batch. This may be attributed to the low concentration of HPMC used in the formula. In FD series the viscosity of HPMC grade is much higher, therefore resulting in more hydration and gel formation around the surface of the tablet, attributing to high swelling index in this series. Due to high viscosity, matrix integrity is maintained for a longer duration leading to least erosion. Therefore swelling index in FD series did not start decreasing even at 12th hr.
In-vitro drug release study From the Figure 2 below, it is evident that there is significant difference in drug release profile
between batches containing different HPMC grades at different concentrations but there is no significant difference in the drug release profile within the replicate batches. The permeability decreased with increasing viscosity grade of HPMC. With increasing viscosity grade the average molecular weight of the polymer increased, resulting in an increased entanglement of the macromolecules. Thus, the mobility of the polymer chains decreased, reducing the free volume available for diffusion. Hence, the probability for a drug molecule to jump from one cavity to another is decreased, leading to a decreased mass transfer rate (30).
76
180 160 140 120 100 80 60 40 20
0 4 6 8 10
Time (hr)
Turk J Pharm Sci 10 (1), 69-86, 2013
In case of polymer with very low viscosity (HPMC E15LV & E50LV), at 1:1 drug & polymer ratio i.e. FA1 & FB1 batches, drug release is more uniform with time indicating that erosion of the matrix is the main mechanism of drug release.
With increase in polymer concentration, significant difference in release pattern between formulation containing drug & polymer ratio 1:1 and 2:3 was observed. But in case of 2:1 drug and polymer ratio, release pattern is comparable with 2:3 ratio. This may be due to optimum formation of polymeric matrix in 2:3 ratio, which does not show any further increase in matrix rigidity on increasing the polymer concentration, for low viscosity grades of HPMC.
Initial burst release of drug was observed with formulations containing comparatively high viscosity grade HPMC K4M. With increase in polymeric concentration this burst effect and the drug release in later hrs of dissolution were reduced significantly. This may be attributed to greater gel formation resulting in increased diffusional path length for drug release (31). Each grade of polymer has a decreasing effect on the cumulative drug release with increase in their ratio in the formulations (Figure 2). But the major decrease is observed in case of the lowest viscosity grade polymer (FA series), especially in the later half of the dissolution study i.e. after 6 hr.
It is also clear that HPMC K4M can not control the initial drug release as much as the lower viscosity grades at least up to initial 3 hr (Figure 3). Then, it starts releasing drug in a more sustained manner than its counter parts irrespective of the polymer concentrations. This may be attributed to the inceasing swelling index of HPMC K4M over the entire dissolution time and at the same time decrease in swelling index was seen after a certain point of time in case of lower viscosity grades. It may also be assumed that increase in amount of lower grade polymers delays the onset of matrix erosion of the formulation, since higher the low grade polymer concentration, longer would be the time taken to obtain the optimum swelling index. The permeability increased at higher HPMC concentrations as upon hydration of the film water channels within the film become the major pathway for drug release (32).
Increasing the amount of K4M decreases the initial burst release which may be due to increased swelling of the high viscosity polymer with increasing amount forming greater matrix integrity and longer diffusional path length.
77

Moumita BISWAS, Roop Narayan GUPTA, Rahinarayan PARHI, Kalyan Kumar SETHI, Suvendu Kumar SAHOO
b
100
80
60
40
20
0 2 4 6
Time (hr)
d
Figure 2. Effect of HPMC concentration on m-vitro release of Ritonavir containing (a) E15LV (b) E50LV (c) KL100V (d) K4M.
a
c
78

Turk J Pharm Sci 10 (1), 69-86, 2013
b
100 -
80-
60 -
40 -
20 -
0 1
jtt^^j^^ ♦ FA2
80-
60 -
40 -
20 -
0 1
■ ' j * WiS —■—FB2 ^w^M^ir A FC2 * « ^ ■ FD2
80-
60 -
40 -
20 -
0 1
80-
60 -
40 -
20 -
0 1 0 2 4 6 8 10 12
Time (hr)
100
80
60
40
20
0 2 4 6
Time (hr)
Figure 3. Effect of HPMC viscosity on in-vitro release of Ritonavir (a) at 1:1 Drug & Polymer ratio (b) at 2:3 Drug & Polymer ratio (c) at 1:2 Drug & Polymer ratio.
a
c
79
Moumita BISWAS, Roop Narayan GUPTA, Rabinarayan PARHI, Kalyan Kumar SETHI, Suvendu Kumar SAHOO
Table 5. Dissolution efficacy and mean dissolution time of different formulations. Trial Dissolution Efficiency (%) Mean Dissolution Time (hr)
1 2 3 Avg. 1 2 3 Avg.
FA1 62.781 61.126 61.942 61.950 4.359 4.468 4.487 4.438
FA2 51.504 52.119 51.059 51.561 4.475 4.366 4.429 4.423
FA3 47.177 46.550 46.752 46.826 4.847 4.830 4.932 4.870
FB1 54.849 54.104 53.920 54.291 4.537 4.557 4.605 4.566
FB2 44.490 43.989 44.716 44.398 5.033 5.014 4.974 5.007
FB3 39.879 39.903 39.954 39.912 5.233 5.144 5.165 5.181
FC1 49.156 49.015 49.374 49.182 4.389 4.437 4.414 4.413
FC2 39.063 39.212 39.110 39.128 5.179 5.037 5.143 5.120
FC3 36.855 36.890 37.062 36.936 5.254 5.188 5.112 5.185
FD1 53.628 54.150 54.308 54.029 3.644 3.458 3.564 3.555
FD2 45.957 46.207 46.228 46.131 3.850 3.792 3.806 3.816
FD3 42.445 42.234 42.785 42.488 3.902 3.826 3.935 3.888
From the Table 5, it is evident that there is significant difference in drug release profile between different batches containing different HPMC grades but there is no significant difference in the drug release profile within the replicate batches.
From the kinetic data mentioned in Table 6, zero order kinetics were followed by the batches of FA, FB & FC series, whereas, FD series is mostly following Higuchi kinetics. This is attributed to the difference in viscosity of HPMC used in the formulations. For high viscosity grades of HPMC, the release of drug occurs mainly by diffusion through pores created on the surface gel layer of the matrix
Table 6. Dissolution Kinetics for Different Formulations of Ritonavir
Triala
No.
Drug Release Kinetic Model Triala
No.
Zero order First order Higuchi Korsmeyer-Peppas Triala
No. r2 r2 r2 r2 n FA1 0.922 0.859 0.978 0.973 0.505 FA2 0.988 0.981 0.99 0.987 0.526 FA3 0.992 0.974 0.982 0.982 0.602 FB1 0.988 0.931 0.977 0.979 0.466 FB2 0.995 0.970 0.960 0.954 0.595 FB3 0.993 0.984 0.978 0.988 0.696 FC1 0.980 0.987 0.974 0.952 0.556 FC2 0.993 0.982 0.962 0.959 0.650 FC3 0.994 0.990 0.979 0.994 0.764 FD1 0.965 0.987 0.988 0.984 0.406 FD2 0 977 0 993 0 992 0 990 0 443 FD3 0.966 0.994 0.998 0.997 0.465
tablet, which is the basis of Higuchi release kinetics and in case of low viscosity HPMC grades, main mechanism of drug release is erosion of the matrix.
80
Turk J Pharm Sci 10 (1), 69-86, 2013
For further corroboration, release exponent (n) values were obtained by fitting data into Power equation. Average release rate exponent (n) values for FA, FB, FC and FD are 0.54, 0.585, 0.65 and 0.44, respectively. All the values of ‘n’ , except the FD series, are within the range of 0.45 to 0.89 which corresponds to diffusion and swelling mechanism or mixed order kinetics. For FD series the calculated ‘n’ value is close to 0.45 value, so, it is assumed that it follows diffusion mechanism of drug release.
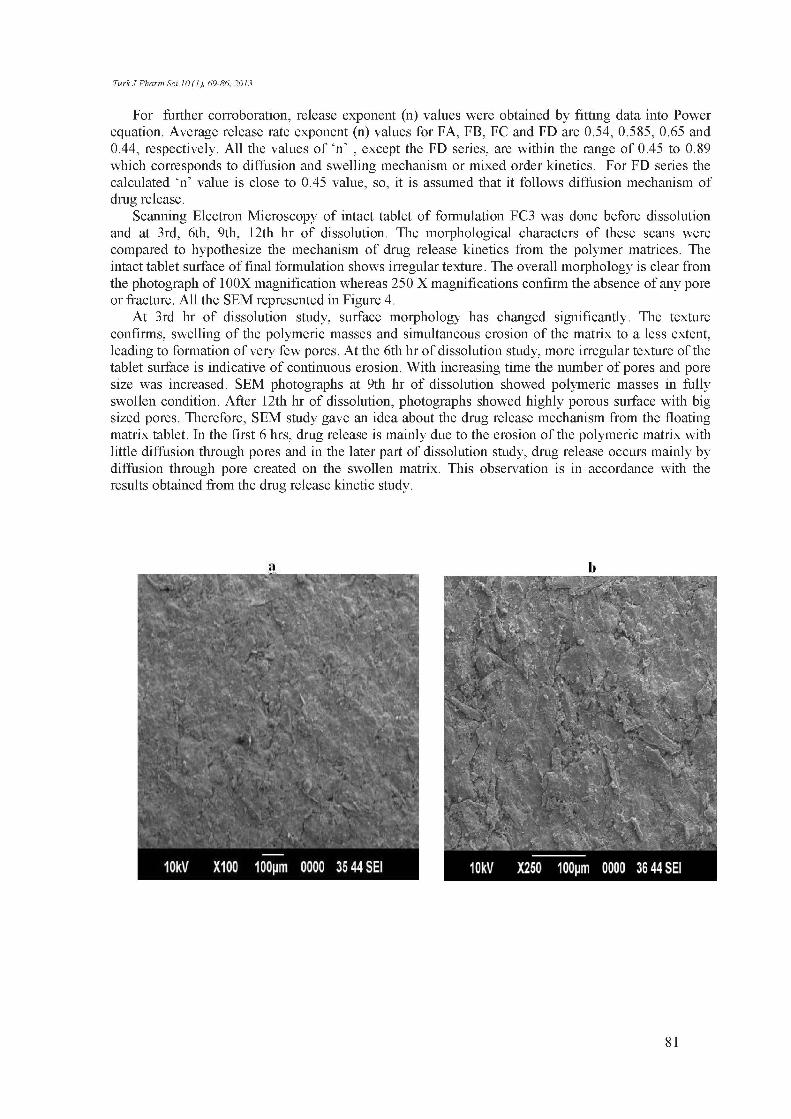
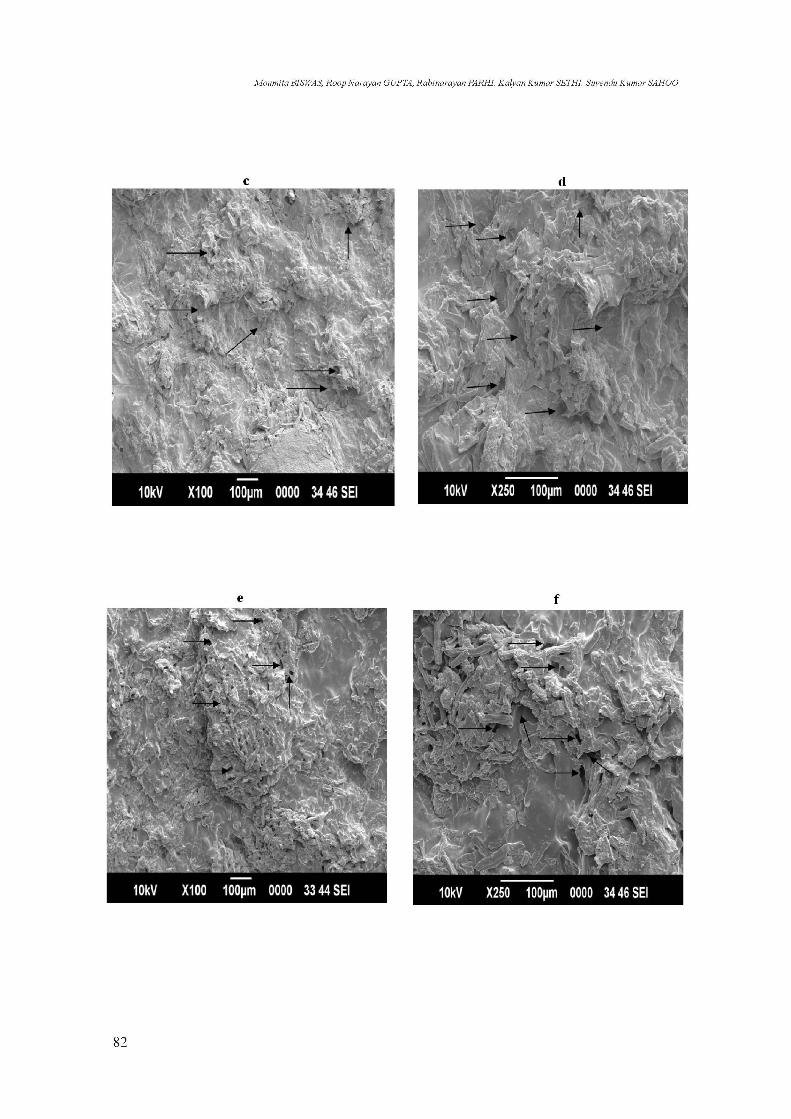
Scanning Electron Microscopy of intact tablet of formulation FC3 was done before dissolution and at 3rd, 6th, 9th, 12th hr of dissolution. The morphological characters of these scans were compared to hypothesize the mechanism of drug release kinetics from the polymer matrices. The intact tablet surface of final formulation shows irregular texture. The overall morphology is clear from the photograph of 100X magnification whereas 250 X magnifications confirm the absence of any pore or fracture. All the SEM represented in Figure 4.
At 3rd hr of dissolution study, surface morphology has changed significantly. The texture confirms, swelling of the polymeric masses and simultaneous erosion of the matrix to a less extent, leading to formation of very few pores. At the 6th hr of dissolution study, more irregular texture of the tablet surface is indicative of continuous erosion. With increasing time the number of pores and pore size was increased. SEM photographs at 9th hr of dissolution showed polymeric masses in fully swollen condition. After 12th hr of dissolution, photographs showed highly porous surface with big sized pores. Therefore, SEM study gave an idea about the drug release mechanism from the floating matrix tablet. In the first 6 hrs, drug release is mainly due to the erosion of the polymeric matrix with little diffusion through pores and in the later part of dissolution study, drug release occurs mainly by diffusion through pore created on the swollen matrix. This observation is in accordance with the results obtained from the drug release kinetic study.
81
Moumita BISWAS, Roop Narayan GUPTA, Rabinarayan PARHI, Kalyan Kumar SETHI, Suvendu Kumar SAHOO
82

Turk J Pharm Sci 10 (1), 69-86, 2013
Figure 4.SEM observations of Gastroretentive tablet surface (a,c,e,g and I at 100X and b,d,f,h and j at 250X). Surface morphology at Zero hr (a,b), at 3rd hr (c,d), at 6th hr (e,f), at 9th hr (g,h) and at 12th
hr (I,j). Arrow indicates the formation of pores on the surface.
Stability study The formulated floating tablets of FC3 batch were subjected to stability study. The samples were
stored in desiccator, at 40º C and 50º C for one month period. 83
Moumita BISWAS, Roop Narayan GUPTA, Rabinarayan PARHI, Kalyan Kumar SETHI, Suvendu Kumar SAHOO
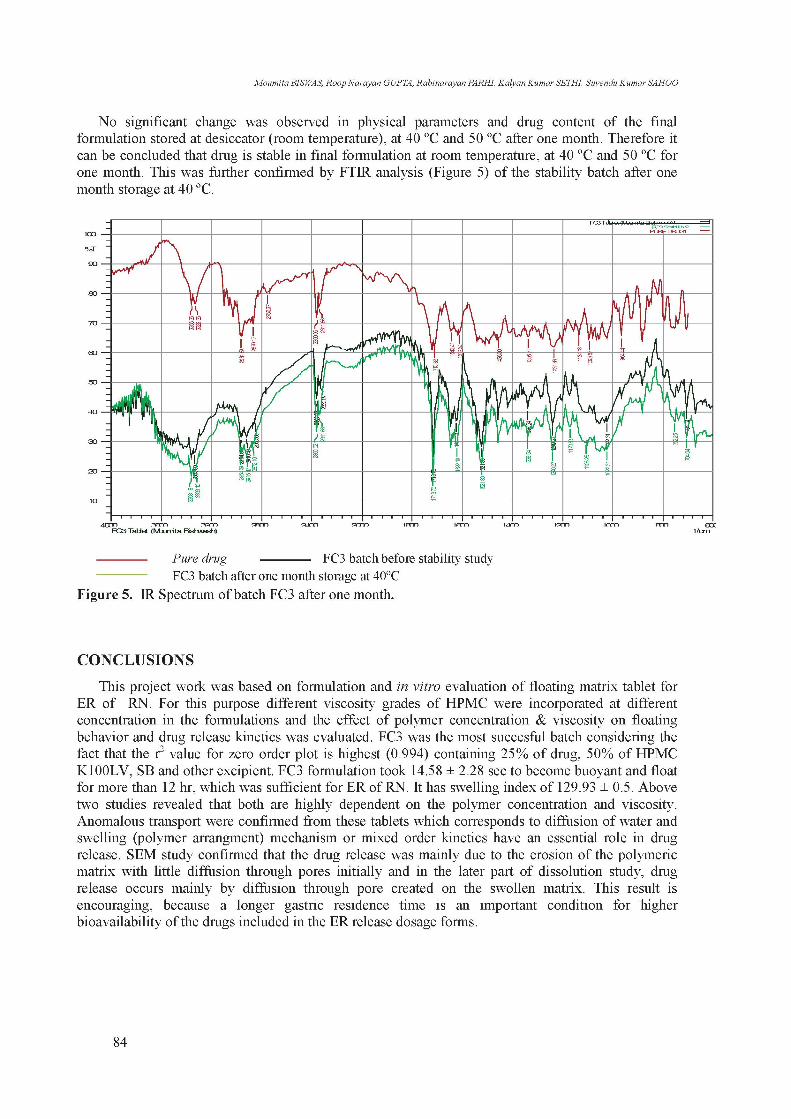
No significant change was observed in physical parameters and drug content of the final formulation stored at desiccator (room temperature), at 40 ºC and 50 ºC after one month. Therefore it can be concluded that drug is stable in final formulation at room temperature, at 40 ºC and 50 ºC for one month. This was further confirmed by FTIR analysis (Figure 5) of the stability batch after one month storage at 40 ºC.
Pure drug FC3 batch before stability study FC3 batch after one month storage at 40ºC
Figure 5. IR Spectrum of batch FC3 after one month.
CONCLUSIONS
This project work was based on formulation and in vitro evaluation of floating matrix tablet for ER of RN. For this purpose different viscosity grades of HPMC were incorporated at different concentration in the formulations and the effect of polymer concentration & viscosity on floating behavior and drug release kinetics was evaluated. FC3 was the most succesful batch considering the fact that the r2 value for zero order plot is highest (0.994) containing 25% of drug, 50% of HPMC K100LV, SB and other excipient. FC3 formulation took 14.58 ± 2.28 sec to become buoyant and float for more than 12 hr, which was sufficient for ER of RN. It has swelling index of 129.93 ± 0.5. Above two studies revealed that both are highly dependent on the polymer concentration and viscosity. Anomalous transport were confirmed from these tablets which corresponds to diffusion of water and swelling (polymer arrangment) mechanism or mixed order kinetics have an essential role in drug release. SEM study confirmed that the drug release was mainly due to the erosion of the polymeric matrix with little diffusion through pores initially and in the later part of dissolution study, drug release occurs mainly by diffusion through pore created on the swollen matrix. This result is encouraging, because a longer gastric residence time is an important condition for higher bioavailability of the drugs included in the ER release dosage forms.
IOC
% 9C
y .
7C
it.
5C
4C
-i.
2C
1C
84

Turk J Pharm Sci 10 (1), 69-86, 2013
REFERENCES
1. Pistell PJ, Gupta S, Knight AG, Domingue M, Uranga RM, Ingram DK, Kheterpal I, Ruiz C, Keller JN, Bruce-Keller AJ, Metabolic and neurologic consequences of chronic lopinavir/ritonavir administration to C57BL/6 mice, Antiviral Research 88, 334-342, 2010.
2. Law D, Schmitt EA, Marsh KC, Everitt EA, Wang W, Fort JJ, Krill SL, Qiu Y, Ritonavir- PEG 8000 Amorphous Solid Dispersions: In Vitro and In Vivo Evaluations, J Pharm Sci 93, 563-570, 2004.
3. Law D, Krill SL, Schmitt EA, Fort JJ, Qiu Y, Wang W, Porter WR, Physicochemical Consideration in the preparation of Amorphous Ritonavir- Poly(ethylene glycol) 8000 Solid Dispersions, J Pharm Sci 90,1015-1026, 2001.
4. United States Pharmacopoeia. US Pharmacopoeial Convention. Inc. Rockville MD. Asian ed; XXXI: pp. 3200-3201, 2008.
5. Williams GC, Sinko PJ, Oral absorption of the HIV protease inhibitors: a current update, Adv Drug Del Rev 39, 211-238, 1999.
6. Kim RB, From MF, Wandel C, Leake B, Wood AJJ, Roden DM, The drug transporter P-Glycoprotein limits oral absorption and brain entry of HIV-1 Protease Inhibitors, J Clin Invest 101, 289-294, 1998.
7. Aungst BJ, P-glycoprotein, secretory transport, and other barriers to the oral delivery of anti-HIV drugs, Adv Drug Del Rev 39, 105-116, 1999.
8. Tripathi KD, Essentials of Medical Pharmacology, 6th ed. Jaypee Brotheres Medical Publishers (P) Ltd; New Delhi, p. 772-774, 2008.
9. Ritonavir Oral, Facts and Comparisons. Wolters Kluwer Health, Inc. From http://www.factsandcomparisons.com. Accessed 29 Jun 2008.
10. Hui HW, Robinson JR, Design and fabrication of oral controlled release drug delivery systems, In: Robinson JR, Lee VHL, editors. Controlled Drug Delivery Fundamentals and Applications. 2nd ed. Marcel Dekker; New York, pp. 373-422, 1990.
11. Friend DR, Targeted GI Delivery,In: Touitou E, Barry BW, editors. Enhancement in Drug Delivery. CRC Press; New York, pp. 69-71, 2007.
12. Lee WY, Robinson JR, Controlled Release Drug Delivery System, In: Gennaro AR, editors. Remington: The Science and Practice of Pharmacy, 20th ed. Vol I; Lippincott Williams & Wilkins, pp. 903-29, 2000.
13. Collett JH, Moreton RC, Modefied Release peroral dosage forms, In: Aulton ME, editor. Aulton’s Pharmaceutics- The Design and Manufacture of Medicines, 3rd ed. Churchill Livingstone; Elsevier, pp. 483-499, 2007.
14. Streubel A, Siepmann J, Bodmeier R, Drug delivery to the upper small intestine window using gastroretentive technologies, Current Opini Pharmacol 6, 501-508, 2006.
15. Chavanpatil M, Jain P, Chaudhari S, Shear R, Vavia PR, Development of sustained release gastroretentive drug delivery system for ofloxacin: In vitro and in vivo evaluation, Int J Pharm 304,178-184, 2005.
16. Sungthongjeen S, Sriamornsak P, Puttipipatkhachorn S, Design and evaluation of floating multilayer coated tablets based on gas formation, Eur J Pharm Biopharm 69,255-263, 2008.
17. Davis SS, Formulation strategies for absorption windows, Drug Delivery Today 10, 249-257, 2005.
18. Vyas SP, Gastroretentive Systems. In: Vyas SP, Khar RK, editors. Controlled Drug Delivery-Concepts and Advances, 3rd ed. Vallabh Prakashan, Delhi,. pp. 196-217, 2007.
19. The United States Pharmacopeia 32/ National Formulary 27. U.S Pharmacopeial Convention, Rockville, MD, pp. 549, 725-727, 2009.
20. Jaimini M, Rana AC, Tanwar YS, Formulation and evaluation of famotidine floating tablets, Current Drug Deliv 4,51-55,2007.
21. Kumaravelrajan R, Narayanan N, Suba V, Bhaskar K, Simultaneous delivery of Nifedipine and Metoprolol tartarate using sandwiched osmotic pump tablet system, Int J Pharm 399, 60-70, 2010.
22. Korsmeyer RW, Gurny R, Doelker E, Buri P, Peppas NA, Mechanisms of solute release from porous hydrophilic polymers, Int J Pharm 15, 25-35, 1983.
85

Moumita BISWAS, Roop Narayan GUPTA, Rabinarayan PARHI, Kalyan Kumar SETHI, Suvendu Kumar SAHOO
23. Siepmann J, Peppas NA, Modeling of drug release from delivery systems based on hydroxypropyl methylcellulose (HPMC), Adv Drug Del Rev 48,139-157, 2001.
24. Siepmann J, Siepmann F, Mathematical modeling of drug delivery, Int J Pharm 364, 328-343, 2008.
25. Rekhi GS, Nellore RV, Hussain AS, Tillman LG, Malinowski HJ, Augsburger LL, Identification of critical formulation and processing variables for metoprolol tartrate extended-release (ER) matrix tablets, J Control Release 59, 327-342, 1999.
26. Shishu, Aggarwal N, Preparation of hydrogels of griseofulvin for dermal application, Int J Pharm 326, 20-24, 2006.
27. Lieberman HA, Lachman L, Schwartz JB, Pharmaceutical Dosage forms: Tablets, 2nd Ed. Revised and Expanded. Mercel Dekkar. Inc, New York Basel, 325-335, 2008.
28. Streubel A, Siepmann J, Bodmeier R, Gastroretentive drug delivery systems, Expert Opinion on Drug Delivery 3, 217-233, 2006.
29. Arora S, Ali J, Ahuja A, Khar RK, Baboota S, Floating Drug Delivery Systems: A Review, AAPS Pharm Sci Tech 6, E372-E390, 2005.
30. Ye ZW, Rombout P, Remon JP, Vervaet C, Van den Mooter G, Correlation between the permeability of metoprolol tartrate through plasticized isolated ethylcellulose/hydroxypropyl methylcellulose films and drug release from reservoir pellets, Eur J Pharmaceut Biopharmaceut 67, 485-490, 2007.
31. Narendra C, Srinath MS, B. Prakash Rao, Development of three layered buccal compact containing metoprolol tartrate by statistical optimization technique, Int J Pharmaceut 304, 102-114, 2005.
32. Sun YM, Chang CC, Huang WF, Liang HC, Fluidized-bed spray coated porous hydrogel beads for sustained release of diclofenac sodium, J Control Release 47, 247-260, 1997.
Received: 24.11.2011 Accepted: 09.02.2012
86