original proposal summary - university of notre damemjm/nsf_ner_macroporous_catalyst.pdfbeakers...
TRANSCRIPT
41
Designing nanostructured heterogeneous catalysts to exploit pulsing
in gas-liquid packed bed reactors
M. J. McCready ([email protected])E. J. Maginn ([email protected])University of Notre DameChemical and Biomolecular Engineering
Original Proposal Summary
This proposal describes work that is intended to develop new nanostructured catalysts
for gas-liquid reactions, which have a system of macro pores designed to take
advantage of oscillatory convection that can be created by large scale hydrodynamic
disturbances. Thus we are combining a nanoscale structure that provides the best
reaction environment with a macroscale structure that provides the highest possible
mass transfer rates. The net effect is a new catalyst that can lead to reductions in
volume of gas-liquid packed bed reactors (a.k.a. "trickle" beds) by an order of
magnitude or more because active, useful metal could be placed throughout the pellet
rather than just at the surface as is typical for gas-liquid reactions.
Porous silica structures having both a nanopore network (radius 1.5-10 nm) and a
macropore network (radius ~0.2 mm) will be synthesized. The nanopores will be
created using a surfactant-mediated templating process, while the macropores that
span the entire pellet will be added through use of sacrificial fibers. The silica
material will be impregnated with platinum to make it catalytically active for a test

42
reaction of phenylacetylene plus hydrogen going to styrene and then to ethylbenzene.
These pellets will be used in a recycle reactor that uses a novel catalyst configuration
that our previous work has shown can clearly differentiate the mass transfer effects of
pulsing flow compared to trickling flow at the same gas and liquid flowrates.
The spanning network of macro pores will enable convective mass transfer within the
pellet, in the pulsing flow regime, because it will take advantage of Taylor-Aris
oscillatory transport mechanism. That is, the pressure fluctuations associated with the
pulses, will cause an oscillatory flow within the macropores. If the macropore
diameter is chosen correctly for a given pulsing frequency, the time scale for radial
diffusion and axial transport will match, leading to a reduction in diffusion distance
from the pellet radius to just the macropore radius -- about an order of magnitude.
This study will comprise synthesis of this novel catalyst, mass transfer studies in
trickle and pulsing flow to prove the enhancement mechanism and reaction studies to
demonstrate the increased activity per unit reactor volume. The net effect is that the
length of packed bed reactors for gas-liquid reactions could be greatly reduced with
our new catalyst structure. The benefits of such a result would be a considerable
reduction in capital costs for full-scale plant retrofits and new construction, increased
application of gas-liquid packed bed reactors for "closet scale" distributed production
for chemicals that are hazardous to transport and possible use of this reaction scheme
for reforming or other types of fuel conversion on board motor vehicles.
43
The proposed work should impact the general problem of how to best exploit the
increasing potential of nano synthesis techniques to produce more active and selective
catalysts by addressing the mass transfer limitations, which are particularly acute in
gas-liquid reactions. It should encourage similar studies to look for links between
nanostructured materials for separation processes and the fluid dynamics of these
devices.
Much of the information below is contained in a thesis by N. S. Martino:
Hydrodynamics of a two-dimensional gas-liquid packed bed. Notre Dame Library.
Activities
Synthesis of Catalyst Support
The synthesis of mesoporous silica as a catalyst support is based on the
techniques used by Nooney et al. (2001). It was scaled up to attempt to produce the
catalyst faster. The following describes the experimental procedure used to produce
both the macroporous and non-macroporous catalyst supports. Several attempts were
made before a useable material was found. A full description of the experiments can
be found in the APPENDIX which is attached below. Only a successful run will be
detailed here.
The chemicals used in this synthesis were purchased and used as received from
Sigma-Aldrich. 4.5 g of cetyltrimethylammonium bromide (CTAB) is divided into
three groups of 1.5 g. Each of these individual groups is then dissolved in separate
beakers containing 83.33 g of deionized water each (total deionized water equals 250
g). A Fisher Scientific sonicater is used to speed up the dissolution. Once dissolved
these solutions are mixed together with 19.3 g of 2 molar NaOH in the reactor. This

44
brings the pH of the solution to about 12.7. Then 18.5 g of tetrabutyl orthosilicate
(TBOS) is added drop wise to the solution while it is stirring. The reaction is then
allowed to stir for 24 hours.
The product of this reaction is a viscous gel of silica. This gel is removed from
the reactor and washed with water. It is then broken up and molded into spheres of
approximately 5-6 mm in diameter. Half of these spheres are then stuck with a
minimum of 10 cellulose fibers of approximately 0.2 mm in diameter (sisal fibers
provided by International Fiber Corporation). Then all of the spheres are allowed to
dry in atmosphere for 24 hours before calcination.
It is important to note the chemistry that occurs to form the mesoporous silica.
The silica source, TBOS, forms an emulsion when mixed with water. CTAB is a
surfactant that has a hydrophobic tail and a hydrophilic head. Because of this it
buries its hydrophobic tail inside the TBOS drop leaving its head exposed to the
water. The presence of a base will accelerate this action along the water emulsion
interface creating a long rod. These rods pack hexagonally and form a sphere from
the emulsified drop of TBOS. The silica begins to grow along the TBOS water
interface and eventually grown into the bubble. Spheres form under the proper
reaction conditions but Nooney et al. (2001) showed that by altering the conditions a
multitude of products can be formed.
3.7 Removal of Template and Sacrificial Fibers
The product of the synthesis reaction is not porous until the CTAB template is
removed. This can be done either by chemical extraction or by thermal means. Both
are effective ways to leave a highly porous silica structure. Calcination was chosen
45
for this work because it can be used to remove the template and the sacrificial fibers
in one step. After being allowed to dry at atmospheric conditions the spheres were
calcined in a furnace controlled by an Omega temperature controller. The
temperature was ramped up at 1oC per minute to 620oC under flowing oxygen. The
slow ramp rate was used to avoid any cracking of the silica due to stress. It was then
held at that temperature for 10 hours to ensure complete burn out of the CTAB
template and the sacrificial fibers. Finally the samples were brought back down to
room temperature over 6 hours. It should be noted that there was no structural
difference between samples that were calcined after being dried at atmospheric
conditions compared to those that were calcined after being dried in a vacuum
furnace at 100oC to remove water.
3.8 Platinum Impregnation
After the mesoporous silica was made porous by calcination it needed to be
impregnated with platinum to make it an active catalyst. The procedure used was
identical to the one presented by Long and Yang (1998) who were able to impregnate
MCM-41 with up to 5 percent by weight platinum. Incipient wetness impregnation
method was used with hydrogen hexachloroplatinate (IV) hydrate 99.9%. After
initial impregnation by the salt, the samples were dried in atmospheric conditions for
24 hours. To reduce the platinum the samples were then calcined at 400oC for at least
5 hours in 5.34% H2 in N2.
3.9 Hydrogenation of Phenylacetylene
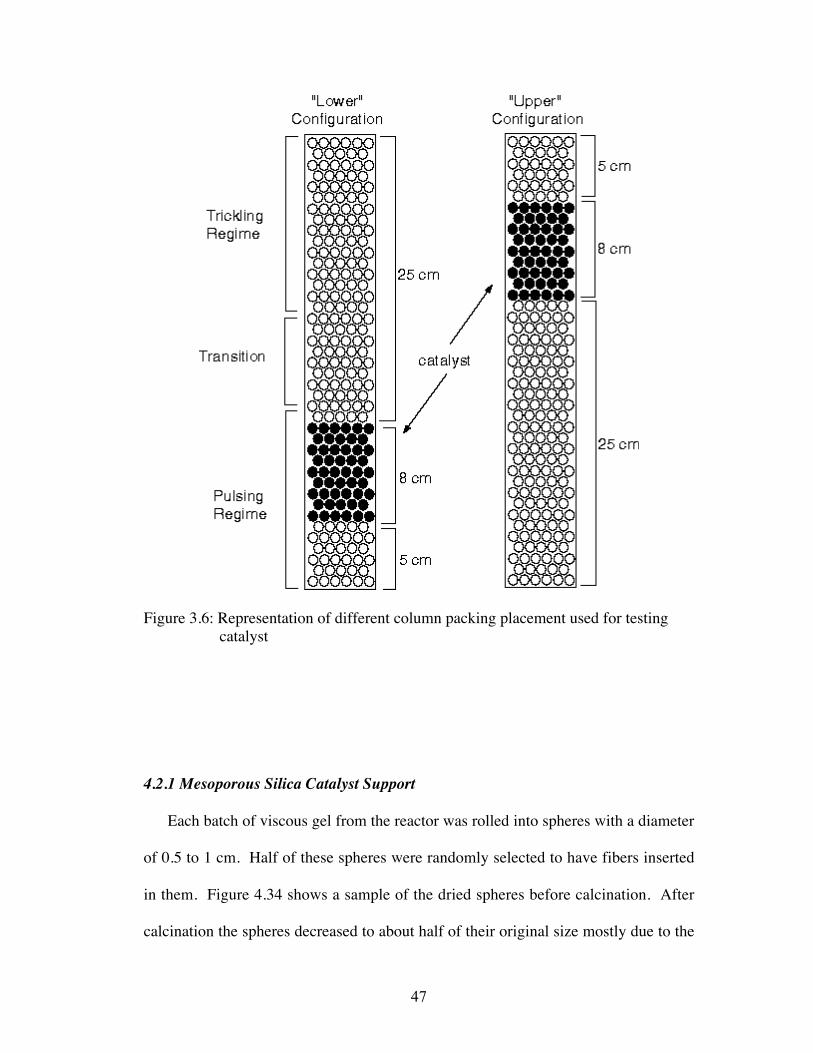
Four experiments were run to test this novel catalyst. For each experiment the
catalyst was placed in the upper or lower packing configurations. Figure 3.6 shows a

46
schematic of the packing configurations used. The macroporous catalyst was run in
one time in the upper and one time in the lower configuration. This was repeated for
the non-macroporous catalyst. One liter of tetradecane solvent and 1 ml of decane
GC international standard are added to the reservoir. The liquid is then circulated for
several minutes to assure complete wetting of the catalyst. Nitrogen is passed
through the gas loop for 15 minutes to remove any air that may have become trapped
inside. Once the gas loop was purged and the catalyst were wetted, phenylacetylene
was introduced by syringe and the reactor was sealed. The nitrogen in the gas loop is
then purged with hydrogen followed by opening the gas loop up to the reactor.
Additional hydrogen was added to the system to compensate any losses from
reaction. Samples were taken of the liquid phase at regular intervals and stored for
later analysis. The reaction is terminated by turning off the pump and hydrogen
supply and purging the system with nitrogen.
47
Figure 3.6: Representation of different column packing placement used for testing catalyst
4.2.1 Mesoporous Silica Catalyst Support
Each batch of viscous gel from the reactor was rolled into spheres with a diameter
of 0.5 to 1 cm. Half of these spheres were randomly selected to have fibers inserted
in them. Figure 4.34 shows a sample of the dried spheres before calcination. After
calcination the spheres decreased to about half of their original size mostly due to the

48
loss of entrapped water. Figure 4.35 shows a group of pellets after calcinations. As it
can be seen the pellets have an outside diameter ranging from 3 to 5 mm. Calcination
was used to remove the CTAB template from the silica spheres leaving a porous
catalyst support. The surface area of the calcined pellets was determined using
nitrogen adsorption and the Brunauer Emmett Teller (BET) equation. It was
determined to be 530 m2/g. The surface area was measured again after the test
reaction and found to be 330 m2/g. This shows the unstable porosity of the
mesoporous silica. An optical microscope with a digital camera attached was used to
take a photograph of the surface of one of the pellets with macropores in it. This can
be seen in Figure 4.36. The photograph was calibrated and a length scale was
attached. Figure 4.36 shows three macropores on the surface of the pellet. The
diameter of these pores ranges from about 0.2 to about 0.4 mm. This shows that the
pore size in the range that enhancement is expected. Only the macropores can be
seen since the mesopores are too small to be viewed with a standard optical
microscope.

49
(a) (b)
Figure 4.34: Dried silica spheres used as catalyst support (a) spheres with no fibers inserted (b) spheres with sacrificial fibers inserted to make the macropores
Figure 4.35: Mesoporous silica catalyst support after calcinations

50
Figure 4.36: Magnification of the surface of a macroporous silica catalyst support
4.2.2 Platinum Impregnation of Mesoporous Silica Catalyst Support
After calcination, the catalyst was stored under nitrogen until enough was
calcined to run eight reactions (2 each of macropore pulsing, macropore trickling, no
macropore pulsing, and no macropore trickling). Then each group was impregnated
and reduced together. This was stored under nitrogen until it was used for the test
reactions.
Platinum dispersion was measured using hydrogen adsorption. Microbursts of
hydrogen were injected into the sample and the exit concentrations of hydrogen were
measured. This was performed on a random sample twice for reproducibility. The
platinum dispersion was measured at 2.31%. This shows that there are large platinum
crystals on the surface and that much of the platinum on the catalyst was unavailable
for reaction. Even though there was a low platinum dispersion the reaction did

51
commence and conversions of up to 50% were accomplished within a reasonable
time. These results will be presented in the following section.
Findings
Support for the catalyst was made out of mesoporous silica. Spherical pellets of
approximately 5 mm to 10 mm diameter were molded out of a viscous gel of
mesoporous silica. Half of the pellets had cellulose fibers inserted in them. After
calcinations the pellets shrunk to about 3 mm to 5 mm in diameter. The loss in size
was mostly due to the loss of water from the pellet. The cellulose fibers left
macropores on the order of 0.2 mm. The surface are of the pellets was 530 m2/g after
calcination but measured 330 m2/g after the test reactions. Platinum was used as the
active material and was placed on the support using incipient wetness. The dispersion
of platinum was measured at 2.31%.
Test of Catalyst Using the Hydrogenation of Phenylacetylene
For each of the four test reactions run, dimensionless concentration profiles as a
function of time were made, where the dimensionless concentration was equal to the
component concentration divided by the initial phenylacetylene concentration. From
the decay of phenylacetylene concentration the initial rates of reaction can be
calculated and compared for each of the four cases. Figure 4.37 shows the
concentration profile for the first reaction run, no macropores in the trickling regime.
This reaction had the best performance of all four test reactions and reached a
conversion of almost 50% in 36 minutes. The reaction results for catalyst with no
52
macropores in the pulsing regime can be seen in Figure 4.38. This figure shows an
obvious decrease in reaction performance over the same time period compared to the
trickling reaction. This result is unexpected and was the first sign that the catalyst
used may not be reliable for experimentation. Figure 4.39 shows the reaction using
catalyst with macropores in the trickling flow regime. This reaction is supposed to be
comparable to the other trickling reaction but as it can be seen it more closely
compares to the pulsing reaction run with non-macroporous catalyst. The results of
the fourth reaction can be seen in Figure 4.40. This reaction was run with
macroporous catalyst in the pulsing regime. Large enhancements in reaction rate
were expected but not seen. In fact, this reaction again shows a poorer performance
for the pulsing regime compared to the trickling regime. Degradation of the catalyst
over time could be the major cause behind this type of behavior.

53
Figure 4.37: Reaction concentration profile as a function of time for non-macroporous catalyst placed in the trickling flow regime
Figure 4.38: Reaction concentration profile as a function of time for non-macroporous catalyst placed in the pulsing flow regime

54
Figure 4.39: Reaction concentration profile as a function of time for macroporous catalyst placed in the trickling flow regime
Figure 4.40: Reaction concentration profile as a function of time for macroporous catalyst placed in the pulsing flow regime

55
A comparison of the initial rates of reaction for each of the four experiments can
be seen in Figure 4.41. This shows the concentration profiles for phenylacetylene
with time. It gives a clearer picture of the unpredictable reaction performance of the
catalyst. Table 4.3 shows the initial rates of reaction for each of the four reactions
run. The initial rate of reaction was calculated by fitting a line to the data to get the
rate of decay of phenylacetylene as a function of time.
Figure 4.41: The decay of phenylacetylene as a function of time for each of the four reactions

56
Table 4.3: Initial rates of reaction for each of the four test reactions
Packing Set Up Initial Rate of Reaction, mol/(L min)No Macropores, Trickling 4.84 * 10-4
No Macropores, Pulsing 3.16 * 10-4
Macropores, Trickling 2.92 * 10-4
Macropores, Pulsing 2.72 * 10-4
Although the catalyst used for the tests was able to achieve up to 50% conversion
within 1 hour, overall it showed unreliable performance. The trickling regime always
showed increased initial reaction rates when compared to the pulsing regime. The
lowest initial rate of reaction was 0.000272 mol/(L min) and was for the macroporous
catalyst in the pulsing regime. The highest initial rate was seen for the non-
macroporous catalyst run in the trickling regime, it was 0.000484 mol/(L min).
Discussion
A novel macroporous catalyst was created to take advantage of the pressure
fluctuations in the pulsing flow regime. This catalyst uses the pressure fluctuations to
reduce the mass transfer resistance to its internal active sites. It was expected to
exhibit increased reaction rates when compared to a non-macroporous catalyst made
of the same material but it did not.

57
Two problems could have contributed to the situation. First a lot of
experimentation went into making a gel phase that could be formed into cm size
pellets and into which fibers could be inserted. Further it was necessary that the
pellets which result after calcinations have sufficient mechanical stability to stand up
to reaction conditions. We were able to accomplish these goals. Unfortunately this
was at the expense of much of the meso-porosity. The low dispersion of Pt indicates
that the final product was not a very active catalyst. A second problem could have
been that the pressure fluctuations that occurred in the pulsing regime were not strong
enough to cause the necessary oscillatory flow within the pellets to achieve the
reaction enhancements. So while no reaction enhancement occurred, we are not
certain that it would not occur in a much larger reactor (perhaps 10 cm in diameter
instead of 2 cm) which could generate larger pressure fluctuations. Unfortunately,
making the catalyst is very labor intensive and producing enough for our small
reactor was already difficult.
References:
Nooney, R.I., M. Kalyanaraman, G. Kennedy, and E.J. Maginn, “Heavy MetalRemediation Using Functionalized Mesoporous Silicas with ControlledMacrostructure,” Langmuir, 17: 528-533, 2001.
58
APPENDIX
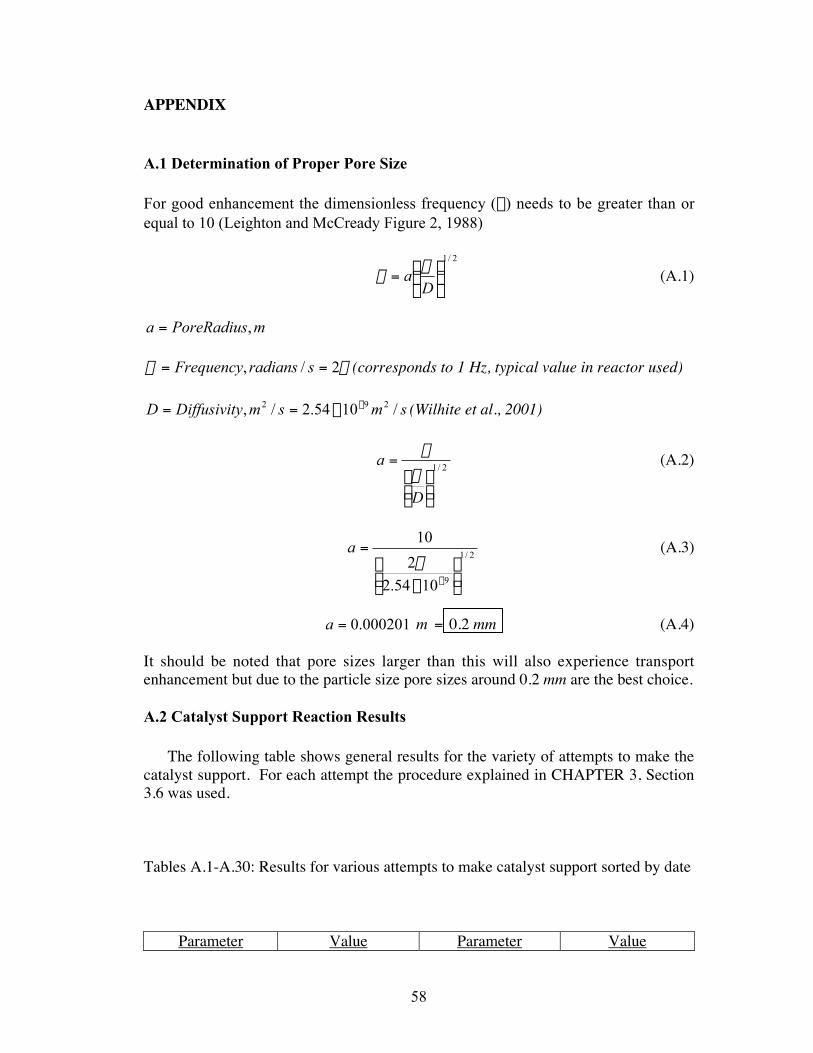
A.1 Determination of Proper Pore Size
For good enhancement the dimensionless frequency (b) needs to be greater than orequal to 10 (Leighton and McCready Figure 2, 1988)
2/1
˜¯
ˆÁË
Ê=D
aw
b (A.1)
mPoreRadiusa ,=
pw 2/, == sradiansFrequency (corresponds to 1 Hz, typical value in reactor used)
smsmyDiffusivitD /1054.2/, 292 -¥== (Wilhite et al., 2001)
2/1
˙̊˘
ÍÎ
È=
D
aw
b (A.2)
2/1
91054.2
2
10
˙̊˘
ÍÎ
È¥
=
-
pa (A.3)
000201.0=a m = 0.2 mm (A.4)
It should be noted that pore sizes larger than this will also experience transportenhancement but due to the particle size pore sizes around 0.2 mm are the best choice.
A.2 Catalyst Support Reaction Results
The following table shows general results for the variety of attempts to make thecatalyst support. For each attempt the procedure explained in CHAPTER 3, Section3.6 was used.
Tables A.1-A.30: Results for various attempts to make catalyst support sorted by date
Parameter Value Parameter Value

59
H2O (g) 250.10 Temperature (oC) 18CTAB (g) 4.50 Stir Rate (rpm) 200NaOH (g) 19.31 pH 12.13TBOS (g) 29.03 Reaction Time (hr) 24
Fibers Added (g) 1.16 Date 11/30/01Results: Too many fibers, light coating formed in needles around fibers
Parameter Value Parameter ValueH2O (g) 250.02 Temperature (oC) 25
CTAB (g) 4.50 Stir Rate (rpm) 275NaOH (g) 19.29 pH 12.20TBOS (g) 28.87 Reaction Time (hr) 24
Fibers Added (g) 0 Date 12/18/01Results: Gel like, did not hold together
Parameter Value Parameter ValueH2O (g) 250.06 Temperature (oC) 25
CTAB (g) 4.50 Stir Rate (rpm) 300NaOH (g) 19.29 pH 12.38TBOS (g) 28.87 Reaction Time (hr) 24
Fibers Added (g) 0 Date 1/16/02Results: Wax like material stuck on side of reactor, low yield of irregularly shapedparticles (2-3 cm), very brittle after drying
Parameter Value Parameter ValueH2O (g) 248.00 Temperature (oC) 25
CTAB (g) 4.50 Stir Rate (rpm) 350NaOH (g) 19.29 pH 12.46TBOS (g) 28.89 Reaction Time (hr) 24
Fibers Added (g) 0 Date 1/17/02Results: Total yield was wax like structure stuck to the side of the reactor, driedvery brittle
Parameter Value Parameter ValueH2O (g) 250.02 Temperature (oC) 25

60
CTAB (g) 4.51 Stir Rate (rpm) 175NaOH (g) 19.31 pH 12.45TBOS (g) 18.66 Reaction Time (hr) 24
Fibers Added (g) 0 Date 1/20/02Results: Wide size range of irregularly shaped particles (1 mm – 1 cm), disk like,dried hard
Parameter Value Parameter ValueH2O (g) 250.03 Temperature (oC) 25
CTAB (g) 4.50 Stir Rate (rpm) 175NaOH (g) 19.30 pH 12.46TBOS (g) 27.53 Reaction Time (hr) 24
Fibers Added (g) 0 Date 1/27/02Results: Low yield of irregularly shaped spheres (~ 1 cm diameter), mostly gelstuck to reactor, brittle upon drying
Parameter Value Parameter ValueH2O (g) 250.08 Temperature (oC) 25
CTAB (g) 4.50 Stir Rate (rpm) 200NaOH (g) 19.94 pH 12.47TBOS (g) 19.56 Reaction Time (hr) 24
Fibers Added (g) 0 Date 1/28/02Results: Wide size range of irregularly shaped particles (1 mm – 1 cm), disk like,dried hard
Parameter Value Parameter ValueH2O (g) 249.00 Temperature (oC) 25
CTAB (g) 4.50 Stir Rate (rpm) 250NaOH (g) 19.31 pH 12.50TBOS (g) 15.79 Reaction Time (hr) 24
Fibers Added (g) 0 Date 2/2/02Results: Sludge, some stuck to walls, breaks apart upon drying
Parameter Value Parameter ValueH2O (g) 250.10 Temperature (oC) 25

61
CTAB (g) 4.50 Stir Rate (rpm) 220NaOH (g) 19.28 pH 12.52TBOS (g) 16.94 Reaction Time (hr) 24
Fibers Added (g) 0 Date 2/3/02Results: Large ball of sludge, much like the sludge used to make the support usedfor experimentation but its use was not realized at the time
Parameter Value Parameter ValueH2O (g) 250.01 Temperature (oC) 35
CTAB (g) 4.50 Stir Rate (rpm) 200NaOH (g) 19.30 pH 12.35TBOS (g) 19.12 Reaction Time (hr) 24
Fibers Added (g) 0 2/5/02Results: Extremely low yield of large spheres ~ 1.5 cm diameter
Parameter Value Parameter ValueH2O (g) 250.02 Temperature (oC) 15
CTAB (g) 4.50 Stir Rate (rpm) 200NaOH (g) 19.29 pH 12.55TBOS (g) 19.22 Reaction Time (hr) 24
Fibers Added (g) 0 Date 2/6/02Results: Spheres of approximately 3 mm diameter, stuck together as soon as pulledout of solution
Parameter Value Parameter ValueH2O (g) 250.00 Temperature (oC) 15
CTAB (g) 4.50 Stir Rate (rpm) 200NaOH (g) 19.29 pH 12.53TBOS (g) 19.10 Reaction Time (hr) 24
Fibers Added (g) 0 Date 2/9/02Results: Attempt to reproduce spheres of 2/6/02 and try to separate them, stucktogether could not be separated
Parameter Value Parameter ValueH2O (g) 250.00 Temperature (oC) 15

62
CTAB (g) 4.50 Stir Rate (rpm) 200NaOH (g) 19.31 pH 12.63TBOS (g) 18.97 Reaction Time (hr) 24
Fibers Added (g) 0 2/12/02Results: Large amount of viscous sludge
Parameter Value Parameter ValueH2O (g) 250.02 Temperature (oC) 15
CTAB (g) 4.40 Stir Rate (rpm) 230NaOH (g) 19.63 pH 12.50TBOS (g) 19.18 Reaction Time (hr) 24
Fibers Added (g) 0 Date 2/15/02Results: Clay-like sludge, stuck to side of reactor
Parameter Value Parameter ValueH2O (g) 250.00 Temperature (oC) 20
CTAB (g) 4.50 Stir Rate (rpm) 230NaOH (g) 19.38 pH 12.47TBOS (g) 25.84 Reaction Time (hr) 24
Fibers Added (g) 0 2/16/02Results: Low yield, all stuck to sides of reactor, powder-like
Parameter Value Parameter ValueH2O (g) 250.07 Temperature (oC) 15
CTAB (g) 4.50 Stir Rate (rpm) 200NaOH (g) 19.29 pH 12.8TBOS (g) 19.37 Reaction Time (hr) 24
Fibers Added (g) 0 Date 3/27/02Results: Viscous gel, first attempt at molding, did not seem hard enough to use inreactor
Parameter Value Parameter ValueH2O (g) 250.04 Temperature (oC) 15

63
CTAB (g) 4.50 Stir Rate (rpm) 200NaOH (g) 14.96 pH 12.74TBOS (g) 19.37 Reaction Time (hr) 24
Fibers Added (g) 0 Date 3/29/02Results: Viscous gel, very brittle after drying
Parameter Value Parameter ValueH2O (g) 250.10 Temperature (oC) 15
CTAB (g) 4.51 Stir Rate (rpm) 200NaOH (g) 19.32 pH 12.75TBOS (g) 25.15 Reaction Time (hr) 24
Fibers Added (g) 0 4/2/02Results: Approximately 3 mm diameter spheres, dried very hard, shrunk upondrying and calcinations, lost over 1/2 of initial size
Parameter Value Parameter ValueH2O (g) 250.10 Temperature (oC) 15
CTAB (g) 4.51 Stir Rate (rpm) 175NaOH (g) 19.34 pH 12.58TBOS (g) 25.16 Reaction Time (hr) 24
Fibers Added (g) 0 Date 4/9/02Results: Large diameter particle, upwards of 1 cm diameter upon drying, much sizevariance, brittle after drying
Parameter Value Parameter ValueH2O (g) 250.04 Temperature (oC) 15
CTAB (g) 4.50 Stir Rate (rpm) 200NaOH (g) 14.96 pH 12.74TBOS (g) 19.37 Reaction Time (hr) 24
Fibers Added (g) 0 3/29/02Results: Viscous gel, very brittle after drying
Parameter Value Parameter ValueH2O (g) 250.00 Temperature (oC) 15

64
CTAB (g) 4.49 Stir Rate (rpm) 135NaOH (g) 19.94 pH 12.61TBOS (g) 25.27 Reaction Time (hr) 24
Fibers Added (g) 0 Date 4/18/02Results: Attempt to make spheres that will be large enough after drying, a uselesslow viscosity gel that could not be separated from solution
Parameter Value Parameter ValueH2O (g) 250.13 Temperature (oC) 15
CTAB (g) 4.51 Stir Rate (rpm) 150NaOH (g) 19.32 pH 12.66TBOS (g) 25.12 Reaction Time (hr) 24
Fibers Added (g) 0.08 Date 4/23/02Results: Attempt to get fibers in spheres, some spheres formed with fibersentrapped, became extremely brittle after calcination
Parameter Value Parameter ValueH2O (g) 250.11 Temperature (oC) 15
CTAB (g) 4.51 Stir Rate (rpm) 150NaOH (g) 19.27 pH 12.57TBOS (g) 28.21 Reaction Time (hr) 24
Fibers Added (g) 0.11 Date 4/24/02Results: Powdery gel with fibers in it, could not be molded, dried extremely brittle
Parameter Value Parameter ValueH2O (g) 250.10 Temperature (oC) 15
CTAB (g) 4.50 Stir Rate (rpm) 160NaOH (g) 19.28 pH 12.61TBOS (g) 25.14 Reaction Time (hr) 24
Fibers Added (g) 0.11 Date 4/30/02Results: Extremely small spheres with no fibers entrapped, fibers in bottom ofreactor with small amounts of gel on them
Parameter Value Parameter ValueH2O (g) 250.12 Temperature (oC) 15

65
CTAB (g) 4.50 Stir Rate (rpm) 150NaOH (g) 19.33 pH 12.64TBOS (g) 25.13 Reaction Time (hr) 24
Fibers Added (g) 0.10 Date 5/7/02Results: Mostly gel, a few irregularly shaped particles, dried extremely brittle
Parameter Value Parameter ValueH2O (g) 250.05 Temperature (oC) 15
CTAB (g) 4.50 Stir Rate (rpm) 110NaOH (g) 19.27 pH 12.58TBOS (g) 25.10 Reaction Time (hr) 24
Fibers Added (g) 0.10 5/9/02Results: Crystal like low viscosity gel, could not be separated from solution
Parameter Value Parameter ValueH2O (g) 250.10 Temperature (oC) 25
CTAB (g) 4.51 Stir Rate (rpm) 150NaOH (g) 19.30 pH 12.67TBOS (g) 25.12 Reaction Time (hr) 24
Fibers Added (g) 0.12 Date 5/7/02Results: Viscous gel with fibers entrapped, molded, very brittle after calcination
Parameter Value Parameter ValueH2O (g) 250.00 Temperature (oC) 20
CTAB (g) 4.50 Stir Rate (rpm) 150NaOH (g) 19.32 pH 12.60TBOS (g) 25.13 Reaction Time (hr) 24
Fibers Added (g) 0.12 Date 5/15/02Results: Lower viscosity gel than 5/7/02, again extremely brittle after calcination
Parameter Value Parameter ValueH2O (g) 250.00 Temperature (oC) 25

66
CTAB (g) 4.50 Stir Rate (rpm) 150NaOH (g) 19.29 pH 12.63TBOS (g) 25.11 Reaction Time (hr) 24
Fibers Added (g) 0 Date 5/21/02Results: Attempt to see if leaving fibers out makes a stronger material but stillbrittle after calcinations
Parameter Value Parameter ValueH2O (g) 250.00 Temperature (oC) 25
CTAB (g) 4.50 Stir Rate (rpm) 150NaOH (g) 19.29 pH 12.57TBOS (g) 29.58 Reaction Time (hr) 24
Fibers Added (g) 0.10 Date 5/7/02Results: Viscous gel, molded, attempted to use aluminum wire as support to addstrength, still brittle after calcinations