orlando paulo simões ochoa videira - técnico lisboa ... · braces of the composite trusses are...
TRANSCRIPT

Composite Truss Bridge Decks
Orlando Paulo Simões Ochoa Videira
October 2009

1. Introduction
The present work is focused on a particular concept of composite bridge decks. Composite truss bridge decks with a triangular cross section made of tubular elements.
Figure 1- Lully´s Viaduct cross-section. Germany [1]
This type of solution was firstly implemented in footbridges, being now used in some of the newest road bridges in Europe.
1.1 Important Aspects
In terms of aesthetics, the lightness and the transparency of these decks make it appropriate for a good integration in different environments. They are also characterized by a reduced construction time as the steel structure, may be easily launched and the decks may be made with prefabricated slabs. In terms of structural behaviour, this solution has a great flexural and torsional resistance, conferred by the axial rigidity of the diagonals. Comparing with the web girder section normally employed in composite decks, the braces of the composite trusses are dimensioned only to resist to the global shear force of the cross section. However, increasing the eccentric loads (traffic, nonsymmetrical loading) the secondary moments in the diagonals, associated with an high compression state, can seriously affect the behaviour of these elements.

2. Global Elastic Model
In this chapter, a global elastic model of a composite truss bridge deck is made. The span dimensions are created according to the typical real use of this solution, lateral spans of 30 metres and a central span of 41,25m, (Figure 2). The dimensions and the three-dimensional angles of the metallic elements are as similar as possible to real use of the experimental model, referred in chapter 4. All the elements are dimensioned to be Class 1 or Class 2 and being circular elements, are not susceptible to torsional deformations. The structure is subjected to a multi-component action, a combination of traffic and non-traffic loads defined accordingly to the EC1-2.
Figure 2- Experimental Model, cross-section [2]
It was verified that the dimensions of the upper chord were conditioned by the resistance to an Ultimate Limit State of bending, due to the local stresses imposed by the deck loading. The dimensions of the lower chords and diagonals were conditioned by the resistance to an Ultimate Limit State of combined bending and axial compression. In the particular case of the most compressed diagonals near the piers, it was verified that the equation given in EC3-2 (6.3.3), compared to the one in EC3-1-1 (6.3.3) was easier to apply and was conservative in a verification of combined bending and axial compression.

3. Circular Hollow Section Joints
There are two types of joints used in composite truss bridges with triangular cross-sections, the one where two brace members are connected to the continuous upper chord, named as K-Joint (Figure 3), and the one where four brace members are connected to the continuous bottom chord, named as KK-Joint (Figure 3).
Figure 3- Types of joints used in Composite Truss Bridges [3]
The KK joint in the bottom is the one that determines the optimum relation between the diameter of the diagonals and the diameter of the chord. For a good structural behaviour, it is recommended to choose a larger diameter for the bottom chord than the one in the diagonals in order to allow a good integration of the stresses coming from the diagonals. In this case, some eccentricity is tolerated where the bar axes meet. In cases where the differences in diameter of the diagonals and diameter of the chord are not so big (typically, the case of the upper joints, K-Joints) it is recommended to resort to overlapping.
The design of CHS joints is heavily influenced by the fatigue behaviour of the structure. The repeated loadings could lead the structure to a premature fatigue failure as the high stress concentrations in the structure increase, especially in geometric discontinuities, for example the welds of the joints. The fatigue assessment procedure present in EC3-1-9 for calculating the fatigue
strength for stresses is represented by a series of (log ∆σR) – (log N) curves and (log
∆τR) – (log N) curves (S-N-curves), which correspond to typical detail categories. Each

detail category is designated by a number, detail category, which represents in N/mm2,
the reference value ∆σC and ∆τC for the fatigue strength at 2 million cycles. This
depends on the direction, crack position, detail dimension and weld quality of each
welded joint. In bridge structures it was verified that the detail category cannot be
obtained from the tables present in EC3-1-9 as they impose geometrical dimensions,
for e.g., a bottom chord wall thickness lower than 8 mm, impossible to respect in these
structures.
Figure 4- S-N-curves [5]
In the present work the importance of non-proportional scaling of the joints was also verified. It has been seen that not only the changing in the dimensions of the fatigue critical member, but also in the dimensions of the attachment (braces) affect the fatigue strength of the joint
The casting process in tubular joint was also studied. This process allows a perfect flow of internal forces, reducing stress concentrations and increasing the static and fatigue resistance compared to welded joints. The fatigue resistance of cast steel nodes is always governed by the welds between the nodes and the tubular steel members. In the casting process, initial sizes of casting defects should be allowed as a function of the required fatigue resistance of the weld.
For standard joints types such as e.g. K- or KK joints where the braces can be directly welded to continuous chords, welded joints are a more economic solution than cast steel joints.
4. Experimental Model
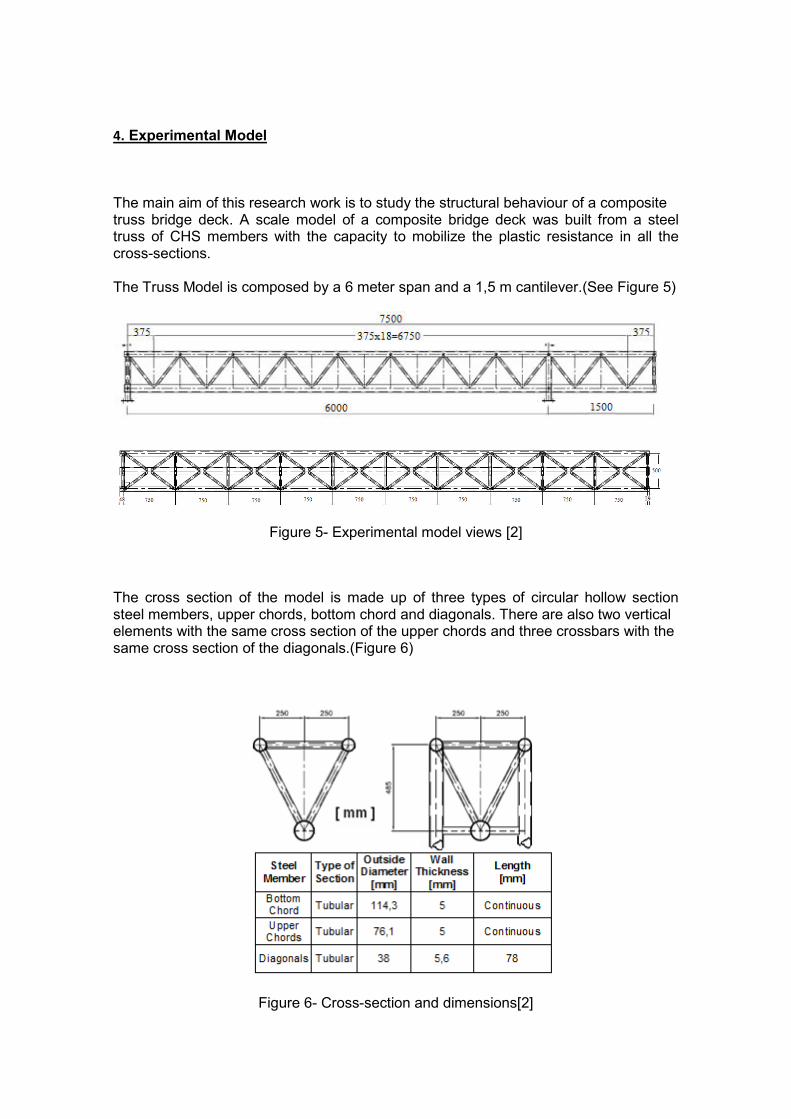
The main aim of this research work is to study the structural behaviour of a composite truss bridge deck. A scale model of a composite bridge deck was built from a steel truss of CHS members with the capacity to mobilize the plastic resistance in all the cross-sections. The Truss Model is composed by a 6 meter span and a 1,5 m cantilever.(See Figure 5)
Figure 5- Experimental model views [2]
The cross section of the model is made up of three types of circular hollow section steel members, upper chords, bottom chord and diagonals. There are also two vertical elements with the same cross section of the upper chords and three crossbars with the same cross section of the diagonals.(Figure 6)
Figure 6- Cross-section and dimensions[2]

In Figure 7 it can be seen the steel reinforcement bars and shear connectors used :
Figure 7- Steel reinforcement bars and shear connectors used [2]
A static load test was performed to determine the ultimate flexural capacity of mid-span
(S2) and support section (S1). The load procedure was started with the same load value
on both sections. After reaching the ultimate load (Pu1) corresponding to the ultimate´s
flexural capacity moment (Mu1) in the support section, the loading in the end span
section was maintained while P2 was increased until the mid-span´s ultimate flexural
capacity was reached.
Figure 8 shows loading instruments ready to start :
Figure 8- Loading Instruments [2]
Strain-data equipment were used on some of the members to study the extension due
to the loads. Also the displacements of the structure were measured in the end section
and in mid-span section. (Figure 9)

Figure 9- Strain-data equipment [2]
All the test results were anticipated by theoretical values calculated with a moment-
curvature numerical analysis and the virtual work principle. In the numerical analysis
the correct constitutive relations of the materials were used, as well as a simplification
that consists of a transformation of the triangular cross-section in a web girder section
with the same equivalent area.
To obtain the constitutive relations of the materials, a concrete uniaxial test on three
cubic specimen and a steel traction test on six specimen for steel reinforcement bars
and for the structural steel (bottom chord, upper chord and diagonal) were conducted.
Figure 10- Concrete, steel reinforcement bars and structural steel test specimen [2]

In Figure 11 the transformation of the cross-section of the structure in a web girder
section can be seen.
Figure 11- Transformation of the cross-section in a web girder section [2]
The contribution of diagonals for the global bending resistance of the cross-section was
not considered. Meanwhile, the global shear resistance of the cross section was
considered governed only by the axial rigidity of the diagonals.
The displacements of the structure were calculated using the virtual work principle in a
simple bending situation, considering only the elastic regime of the shear force
deformation.[4]
� = � ��� �� +
�´ ��� �� (1)
After the experimental procedure, the values obtained were compared with the
numerical results and the failure mode of the structure was studied.
In figure 12 there is an example of the numerical procedure , the moment-curvature
diagram for the mid-span section and the stress diagrams after the plastification of the
chord (left) and in U.L.S (right).
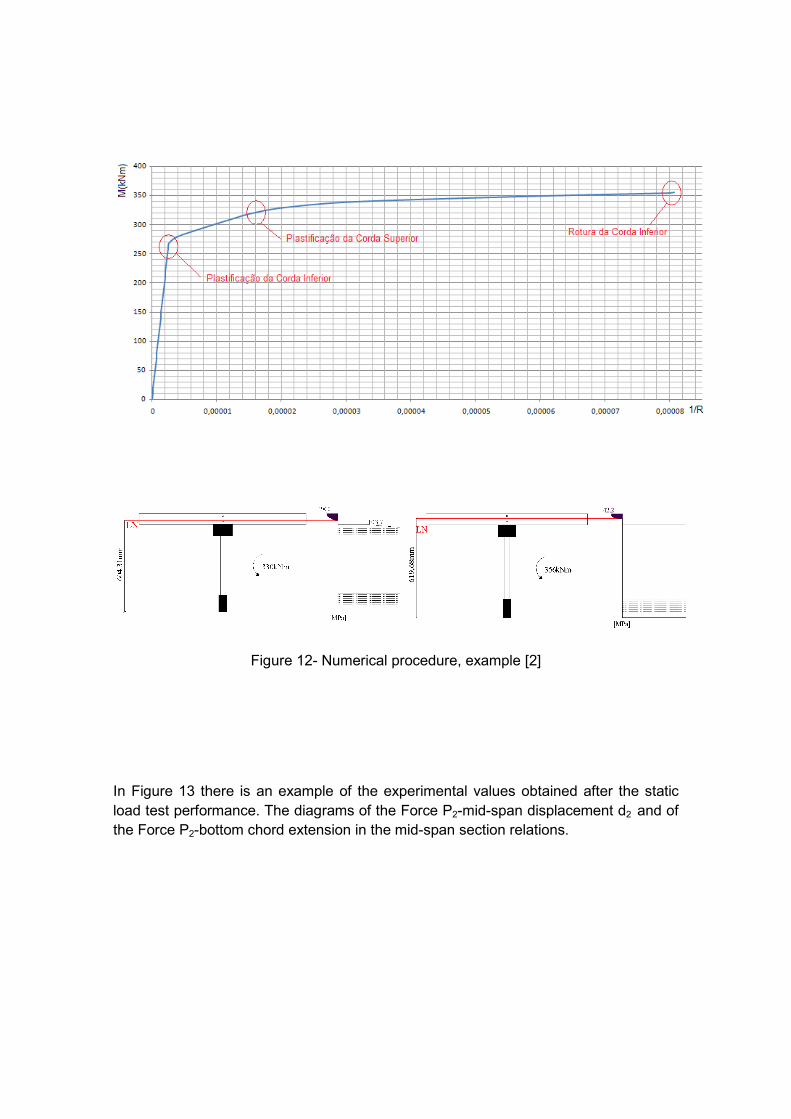
Figure 12- Numerical procedure, example [2]
In Figure 13 there is an example of the experimental values obtained after the static
load test performance. The diagrams of the Force P2-mid-span displacement d2 and of
the Force P2-bottom chord extension in the mid-span section relations.

Figure 13- Experimental values, example [2]
All the theoretical values were correctly predicted (Table 1) except the cracking of the
support section (Mcra and Pcra).
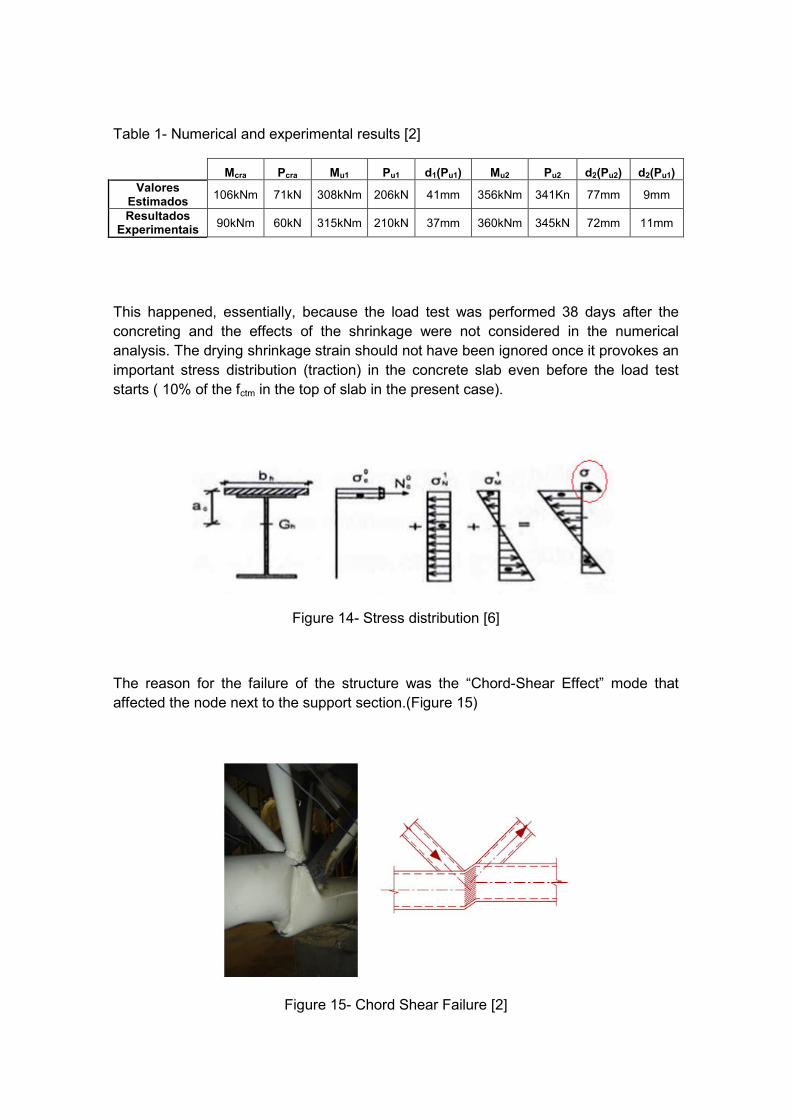
Table 1- Numerical and experimental results [2]
Mcra Pcra Mu1 Pu1 d1(Pu1) Mu2 Pu2 d2(Pu2) d2(Pu1)
Valores Estimados
106kNm 71kN 308kNm 206kN 41mm 356kNm 341Kn 77mm 9mm
Resultados Experimentais
90kNm 60kN 315kNm 210kN 37mm 360kNm 345kN 72mm 11mm
This happened, essentially, because the load test was performed 38 days after the
concreting and the effects of the shrinkage were not considered in the numerical
analysis. The drying shrinkage strain should not have been ignored once it provokes an
important stress distribution (traction) in the concrete slab even before the load test
starts ( 10% of the fctm in the top of slab in the present case).
Figure 14- Stress distribution [6]
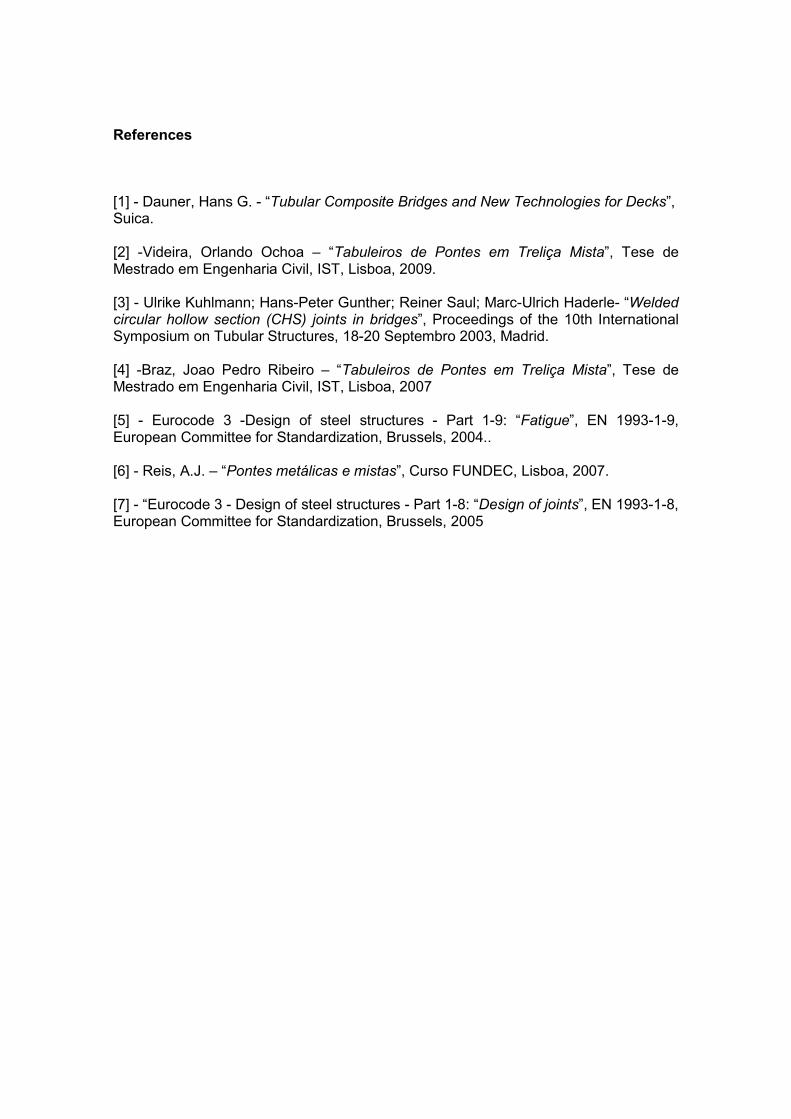
The reason for the failure of the structure was the “Chord-Shear Effect” mode that
affected the node next to the support section.(Figure 15)
Figure 15- Chord Shear Failure [2]

By Increasing the load in the mid-span section, we increase the shear force in the
chord. This force is transmited by diagonals with opposite flow of axial force. This
effect, associated to the higher compression that appears in the chord, due to the
bending moment of the structure leads to the failure mode described in EC3-Part 1.8.
In order not to have problems with local failure of the KK joint, the following condition
should be respected.[7]
��,����,��
+ �����,������,��
��
+ ����,������,��
≤ 0,9 (2)
With the help of a global elastic model it was verified that in plane moments and out
plane moments in the braces were almost zero, even for a joint that don´t respect all
the conditions given in table 2 [7] .
Table 2-Range of validity for welded joints between CHS brace members and CHS chords [7]
In that case, the equation (2) can be rewritten:
��,����,��
≤ 0,9 (3)

Where $%,�& is the design value of the resistance of the joint, expressed in terms of the
internal axial force in the brace members. In this case it is conditioned by two possible
local failure effects that govern chord shear failure.
Chord face failure
Punching shear failure
In this work it was proved that reducing the gap "g", distance between the toes of the
adjacent brace members along the length of the connecting face of the chord, would
result in a benefit by allowing an increase in $%,�&.
Figure 16- Relation between the resistance to Chord Shear Failure and the gap "g" [2]
Finally, it was verified that the optimal value of $%,�& would be the one that conduce
(alone, by itself) the bottom chord to plastification. Therefore, it is possible to determine
(maintaining all the other parameters) the optimal wall thickness of the bottom chord
that would prevent the structure from collapsing ( thanks to Chord Shear Failure )
before the Ultimate Limit State of the structure is reached.
In this particular case it would be necessary to increase the wall thickness in about
60% (5 to 8mm) in order prevent the chord shear failure.
References
[1] - Dauner, Hans G. - “Tubular Composite Bridges and New Technologies for Decks”, Suica. [2] -Videira, Orlando Ochoa – “Tabuleiros de Pontes em Treliça Mista”, Tese de Mestrado em Engenharia Civil, IST, Lisboa, 2009. [3] - Ulrike Kuhlmann; Hans-Peter Gunther; Reiner Saul; Marc-Ulrich Haderle- “Welded circular hollow section (CHS) joints in bridges”, Proceedings of the 10th International Symposium on Tubular Structures, 18-20 Septembro 2003, Madrid. [4] -Braz, Joao Pedro Ribeiro – “Tabuleiros de Pontes em Treliça Mista”, Tese de Mestrado em Engenharia Civil, IST, Lisboa, 2007 [5] - Eurocode 3 -Design of steel structures - Part 1-9: “Fatigue”, EN 1993-1-9, European Committee for Standardization, Brussels, 2004.. [6] - Reis, A.J. – “Pontes metálicas e mistas”, Curso FUNDEC, Lisboa, 2007. [7] - “Eurocode 3 - Design of steel structures - Part 1-8: “Design of joints”, EN 1993-1-8, European Committee for Standardization, Brussels, 2005