our cooling climate - freebeacon.com
TRANSCRIPT

Our Cooling Climate
David Archibald
Room 2325, Rayburn House Office Building
16th September, 2013

1. Has the world warmed?
2. Has warming happened in the past?
3. Is warming linked to CO2?
4. Is there a more logical reason for the
temperature rise of the 20th Century?
5. What is going to happen? 2

Source: Cryosphere Today as at 1st August 2013 No change over 33 years
Section 1: Has the World warmed?
3

The temperature of the planet is the
same as it was 30 years ago.
The satellite temperature record from www.drroyspencer.com 4

Antarctic Sea Ice has increased.
5

What has happened in Alaska.
-3.0
-2.0
-1.0
0.0
1.0
2.0
3.0
1949 1959 1969 1979 1989 1999 2009
Deg
rees C
elc
ius
Mean Annual Temperature Departure for Alaska 1949 - 2008
Negative PDO Positive PDO
The Great Pacific Climate
Shift of 1976
6
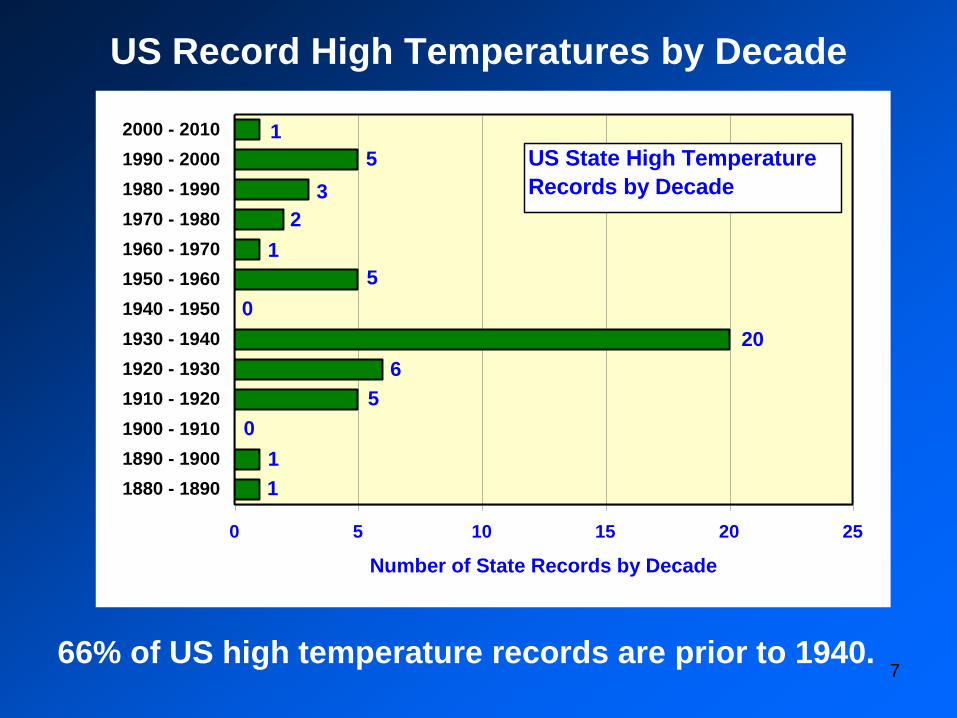
US Record High Temperatures by Decade
66% of US high temperature records are prior to 1940.
1
1
0
5
6
20
5
1
2
3
5
1
0
0 5 10 15 20 25
1880 - 1890
1890 - 1900
1900 - 1910
1910 - 1920
1920 - 1930
1930 - 1940
1940 - 1950
1950 - 1960
1960 - 1970
1970 - 1980
1980 - 1990
1990 - 2000
2000 - 2010
Number of State Records by Decade
US State High Temperature
Records by Decade
7

The biggest run of high temperatures in the US
is now over 80 years ago.
8

Northern Hemisphere Average Snow Cover
October - March
9

A 300 Year Thermometer Record Central England Temperature
Section 2: Has warming happened in the past?
10

11

The Holocene Optimum
12

Vostok Ice Core Temperature
0
2
4
6
8
10
12
14
-450000 -400000 -350000 -300000 -250000 -200000 -150000 -100000 -50000 0
Te
mp
era
ture
in
De
gre
es
Ce
lciu
s
Years Before Present
Holocene Eemian
13

Vostok Interglacials
Superimposed and
aligned on Peak
Temperature
Holocene
Eemian
Holocene
Eemian
3,000 years
14

The next glacial
period will be fully
developed in
55,000 years.
15

Section 3: Is warming linked to CO2?
16
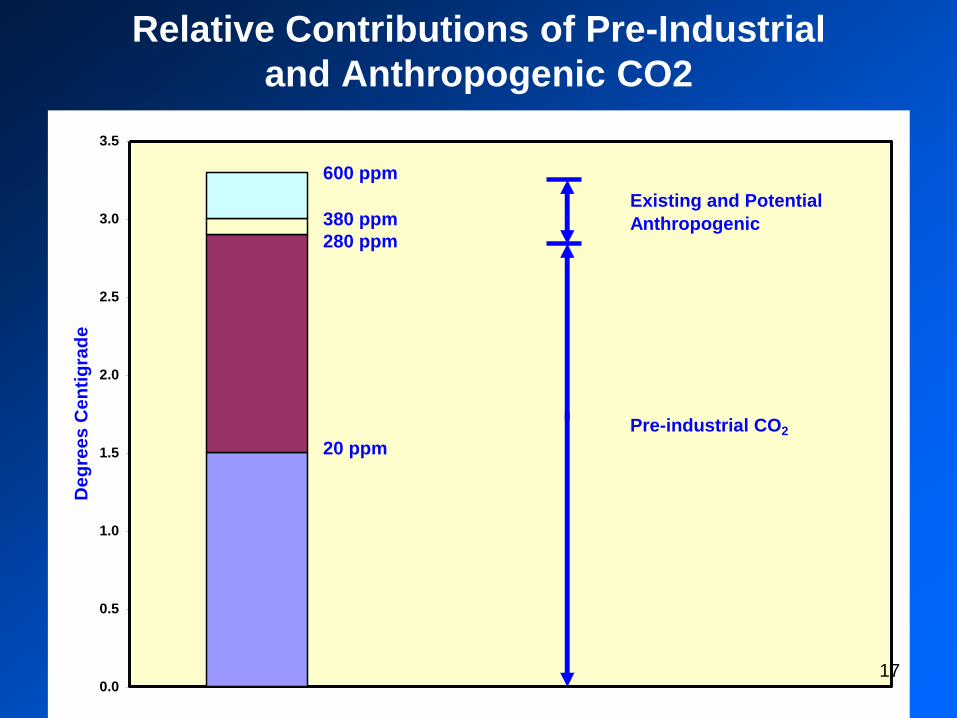
Relative Contributions of Pre-Industrial
and Anthropogenic CO2
0.0
0.5
1.0
1.5
2.0
2.5
3.0
3.5
De
gre
es
Ce
nti
gra
de
20 ppm
280 ppm
380 ppm
600 ppm
Existing and Potential
Anthropogenic
Pre-industrial CO2
17

What the AGW Belief System requires
18
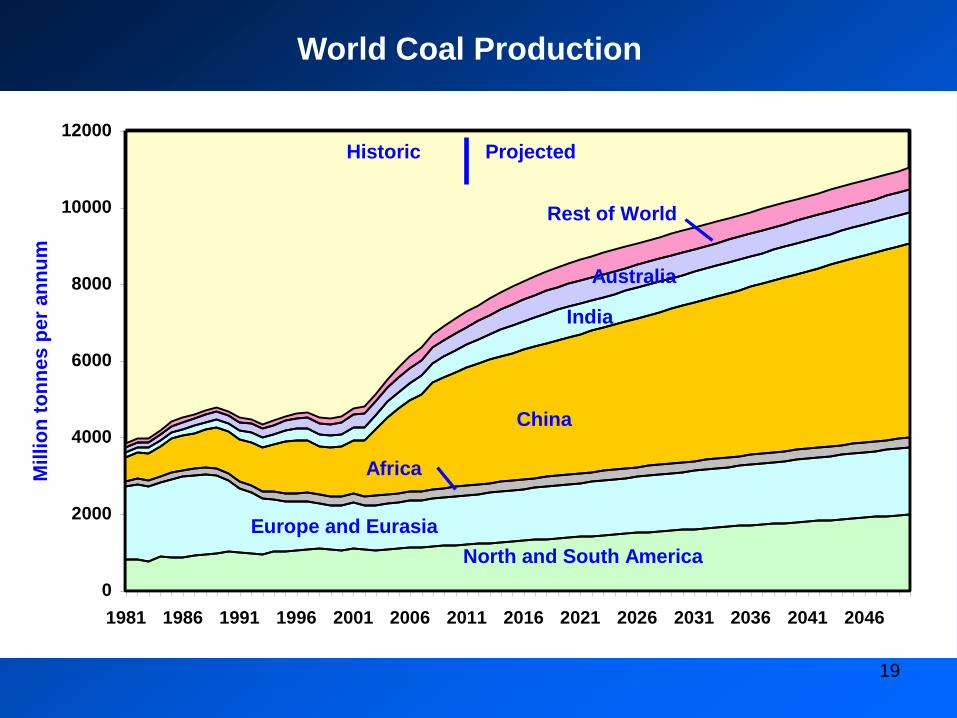
World Coal Production
0
2000
4000
6000
8000
10000
12000
1981 1986 1991 1996 2001 2006 2011 2016 2021 2026 2031 2036 2041 2046
Millio
n t
on
nes p
er
an
nu
m
North and South America
Europe and Eurasia
Africa
China
India
Australia
Rest of World
ProjectedHistoric
19
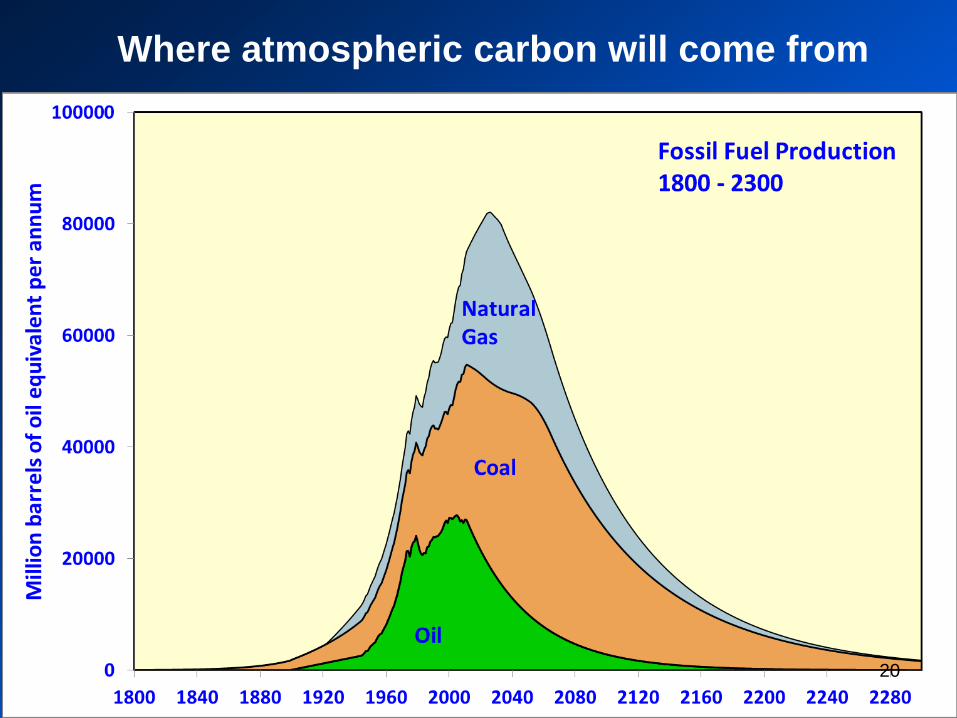
Where atmospheric carbon will come from
20

What that means for rate of increase of
atmospheric CO2
21

Ocean acidification – the last refuge of the global
warming scoundrel
Coral reef and bubbling carbon dioxide, Dobu Island, PNG
22
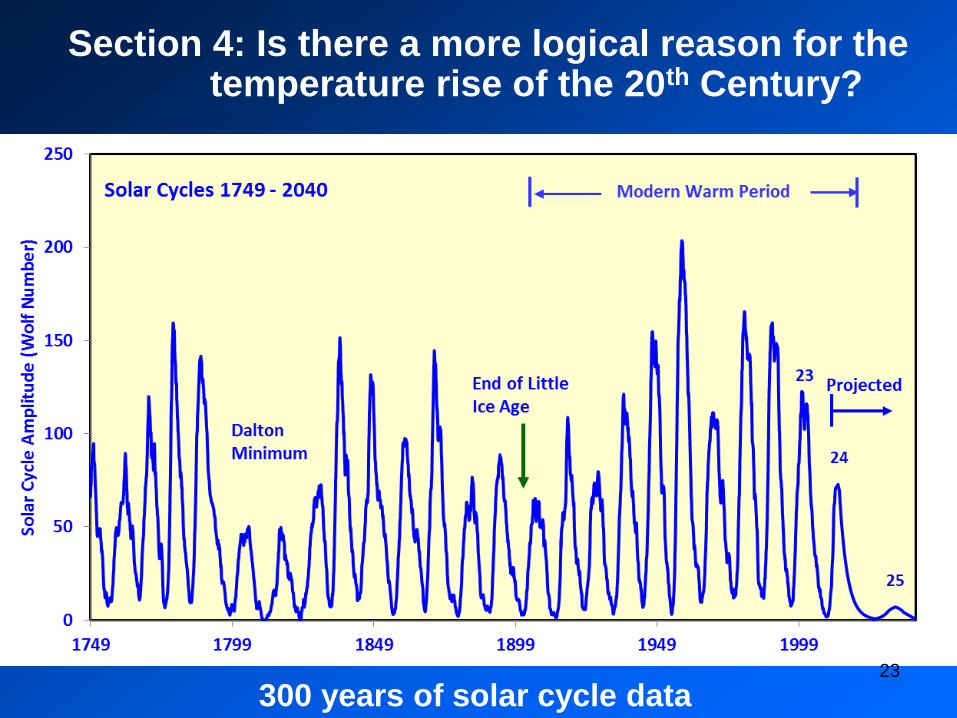
Section 4: Is there a more logical reason for the temperature rise of the 20th Century?
300 years of solar cycle data 23

The Sun was more active in the second half of the 20th
century than it had been in the previous 8,000 years.
24 Figure 1(a) from Steinhilber and Beer, 2013, Prediction of solar activity for the next 500 years JOURNAL OF GEOPHYSICAL RESEARCH: SPACE PHYSICS, VOL. 118, 1–7, doi:10.1002/jgra.50210, 2013

Sunspot Cycle Length Relative to Temperature Armagh, Northern Ireland 1796 – 1992 Butler and Johnson
Solar Cycle 22
Solar Cycle 23
25

Hanover, New Hampshire
5.0
5.5
6.0
6.5
7.0
7.5
8.0
8.5
9.0 9.5 10.0 10.5 11.0 11.5 12.0 12.5 13.0
Solar Cycle Length Years
De
gre
es
Ce
lciu
s
Hanover, NH
rsq = 0.53
Correlation = 0.73 degrees/annum
Solar Cycle 22
Solar Cycle 23
2.0°C
26

Friis-Christensen and Lassen
theory, using Butler and
Johnson methodolgy,
applied to Norway
- a 1.5° C cooling underway
Work by Professor
Jan-Erik Solheim
of Oslo University
27
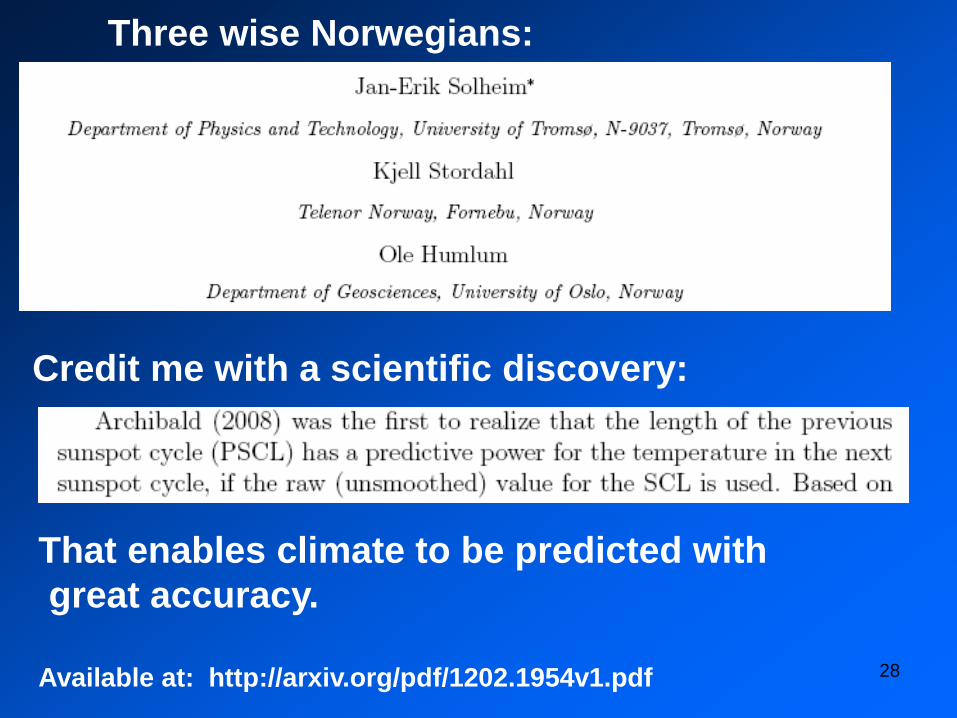
Three wise Norwegians:
Credit me with a scientific discovery:
That enables climate to be predicted with
great accuracy.
Available at: http://arxiv.org/pdf/1202.1954v1.pdf 28

Section 5: What is going to happen?
Predicted
decline
All the
warming
of the last
150 years
will be
reversed.
29

Dombaas, Norway
Predicted
Decline
30

Dombaas, Norway
Predicted
Decline
31
32
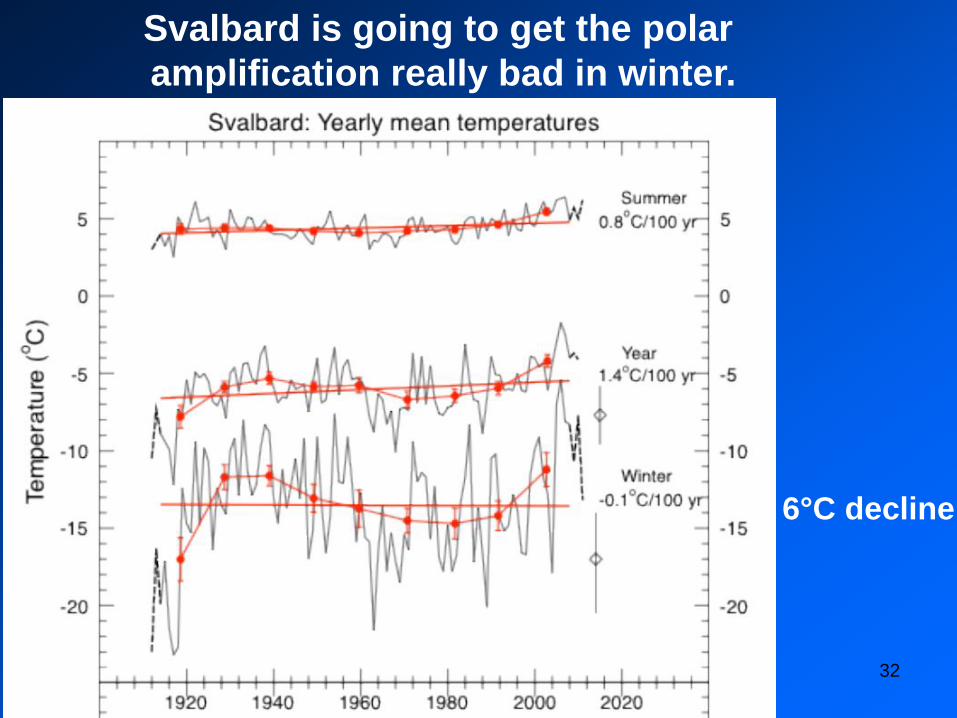
Svalbard is going to get the polar
amplification really bad in winter.
6°C decline

Combine that with a prediction of solar activity:
We can now predict climate to 2040. 33
Green Corona
Emissions

Using these
three tools:
34
Solar cycle length
- temperature
Solar activity forecast
Logarithmic heating effect of CO2
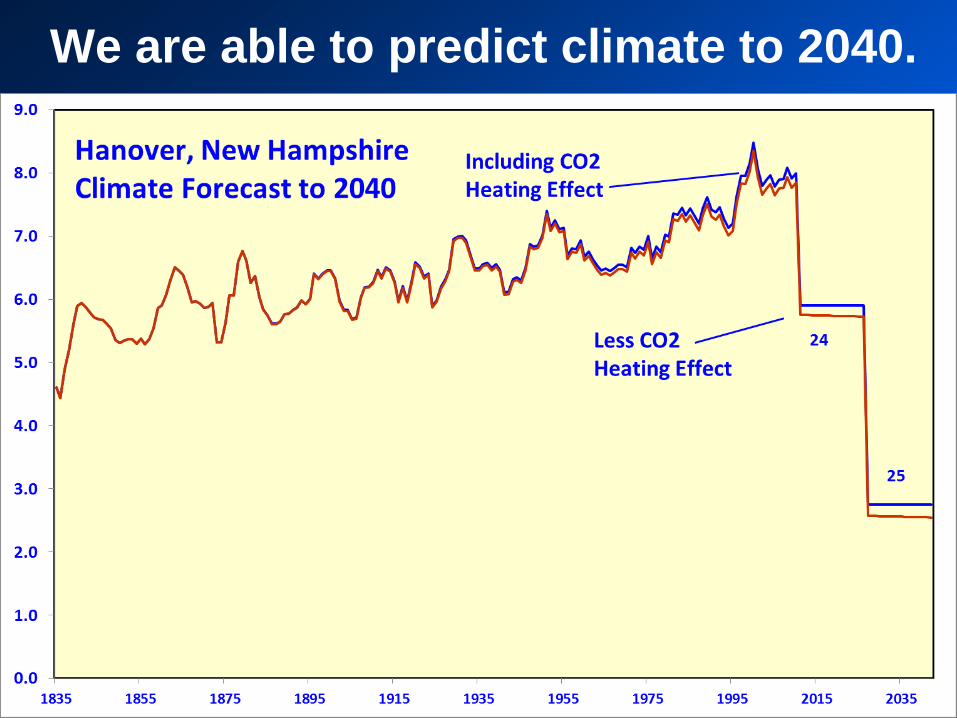
We are able to predict climate to 2040.
35

We see it in the thermometer record.
36

So far, tracking the Dalton Minimum
37

The rate of cooling is in line with the modeled prediction.
38
Snow in County Durham,
UK on 23rd May 2013
Central England Temperature
2000 - 2013

Predicting longer term solar activity
39 Ed Fix’s model: the hindcast match is very good.

Predicting longer term solar activity 2
40 Using low frequency oscillations with periods of 22, 53, 88, 106, 213
and 420 years
24
23

Yes, solar activity drives sea level.
41
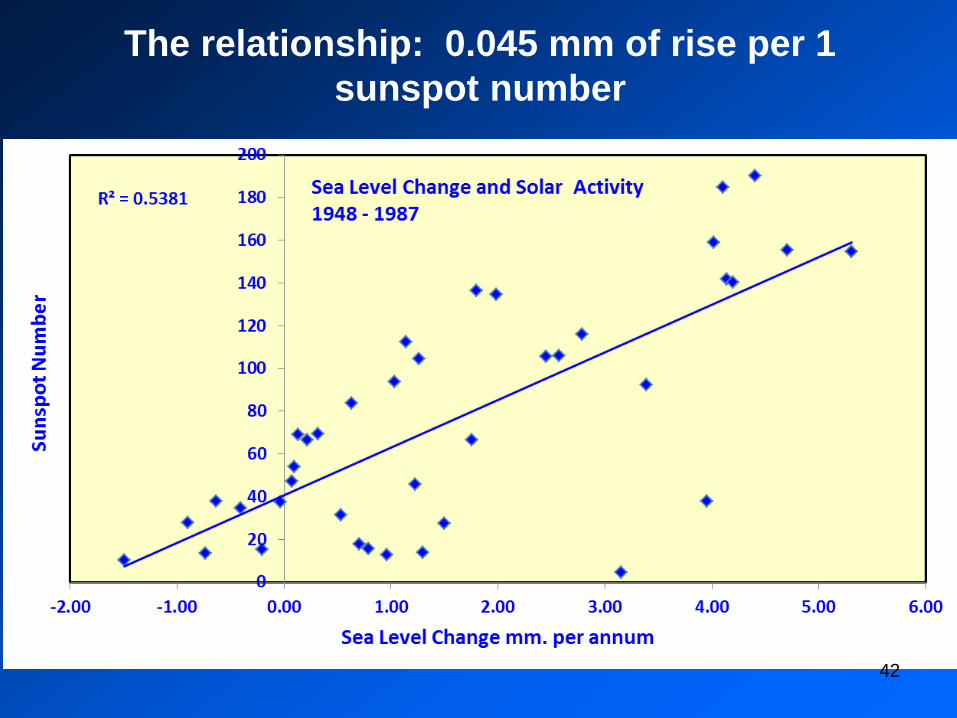
The relationship: 0.045 mm of rise per 1
sunspot number
42

Sea level will start falling again.
43

Official Sea Level Rise - University of Colorado
44 Three inches over 20 years – relentless, remorseless, unremitting
and certainly very frightening.

How that was created.
45
Raw data
Adjusted data
Cazenave, A., et al., Sea level budget over 2003–2008: A reevaluation from GRACE space gravimetry, satellite
altimetry and Argo, Glob. Planet. Change (2008), doi:10.1016/j.gloplacha.2008.10.004

Real Data
2 inches per century – not so frightening.

A prediction of Canadian agricultural response
dating from the last cooling event 40 years ago
A 1° C decrease would reduce the frost-free period by 15 days.
A 2° C decrease would not allow the wheat crop to ripen before the first frost.
A 5 ° C decrease – it’s all over.
47

The Corn Belt shifts south but total growing
area remains the same.
The shift in growing
conditions will be
144 km per degree C.
48

Arkansas
Iowa
Corn Belt shifts to
the Sun Belt
49

It has happened before in the US.
Limit of the Corn Belt
in the Medieval
Warm Period
Limit of the Corn
Belt in the Little
Ice Age
Distribution of prehistoric
ridge-furrow maize
gardens in relation to
present-day frost-free
seasons.
The northern limit of
prehistoric maize fields
appears to have retreated
up to 320 km southward
concurrently with cooling
in the thirteenth and
fourteenth centuries.
50

A return to conditions of 100 years ago would make
the Corn Belt erratic for high-yielding corn.
51

1974 CIA Climate Report
“The western world’s leading climatologists have confirmed recent
reports of a detrimental global climate change. The stability of
most nations is based upon a dependable source of food, but
this stability will not be possible under the new climatic era.
A forecast by the University of Wisconsin projects that the earth’s
climate is returning to that of the neo-boreal era (1600- 1850) –
an era of drought, famine and political unrest in the western world.”
“Climate has not been a prime consideration of intelligence analysis
because, until recently, it has not caused any significant
perturbations to the status of major nations. This is so because
during 50 of the last 60 years the Earth has, on the average,
enjoyed the best agricultural climate since the eleventh century.”
http://www.climatemonitor.it/wp-content/uploads/2009/12/1974.pdf
Premonitions of the Fall in Temperature 1
52

CIA Climate
Report of
1974
53

Hubert Lamb 1978: forecasting by wiggle matching
Premonitions of the Fall 2
54

Premonitions of the Fall 3
When she and Pandolfi project their curves into the future,
they show lower average temperatures from now through
the mid-1980s. “Then,” Dr. Libby added, “we see a warming
trend (by about a quarter of 1 degree Fahrenheit) globally
to around the year 2000. And then it will get really cold –
if we believe our projections. This has to be tested.”
How cold? “Easily one or two degrees,” she replied,
“and maybe even three or four degrees.”
Libby, L.M. and Pandolfi, L.J. 1979, Tree Thermometers and
Commodities: Historic Climate Indicators, Environment
International Vol 2, pp 317-333
55

Premonitions of the Fall 4
Finnish tree ring study predicts the biggest cold period
for 500 years.
Timonen, M., Helema, S., Holopainen, J., Ogurtsov, M.,
Eronen, M., Lindholm, M., Merilainen, J and Mielikainen, K.
2007 “Climate patterns in Northern Fennoscandinavia
during the Last Millenium” Xvii INQUA Congress
56

If a Mt Pinatubo-type eruption is overprinted on
a solar-driven cooling event:
Then we get an 1816 – type crop failure event. 57

1816 Event – 50% Chance
• Mt Tambora in Indonesia erupted on 10th April, 1815.
• Average global temperatures decreased by 0.4 – 0.7° C.
• On 4th June 1816, frosts were reported in Connecticut.
• On 6th June 1816, snow fell in Albany and Maine.
• Oats rose from 12 cents a bushel to 92 cents a bushel.
• For the last 500 years, major volcanic eruptions
averaged 45 years apart.
• One of these could easily reduce world grain
production by 400 million tonnes. 58

And sometimes severe cooling comes out of
the blue
59

Recommendations
1. Update the tree ring studies of Libby and Pandolfi
and others to further refine their forecasts.
2. Develop the planetary-solar model of Ed Fix.
3. Model what the Corn Belt would produce each year
for the period 1800 – 1850 using daily temperature
data for that period. This will give an idea of the
volatility in annual agricultural production coming.
60

61
Summary
1. The carbon dioxide heating effect is real but
minuscule.
2. Carbon dioxide’s heating effect is lost in the noise
of the climate system.
3. There is a major solar-driven cooling under way.
4. The growing season will lose two weeks or more at
each end with increased likelihood of killing frosts.
Contact details:
61 (0)410 664853
www.davidarchibald.info