our galaxy the milky way. overview & history stars, gas, dust, neutron stars, black holes our...
TRANSCRIPT
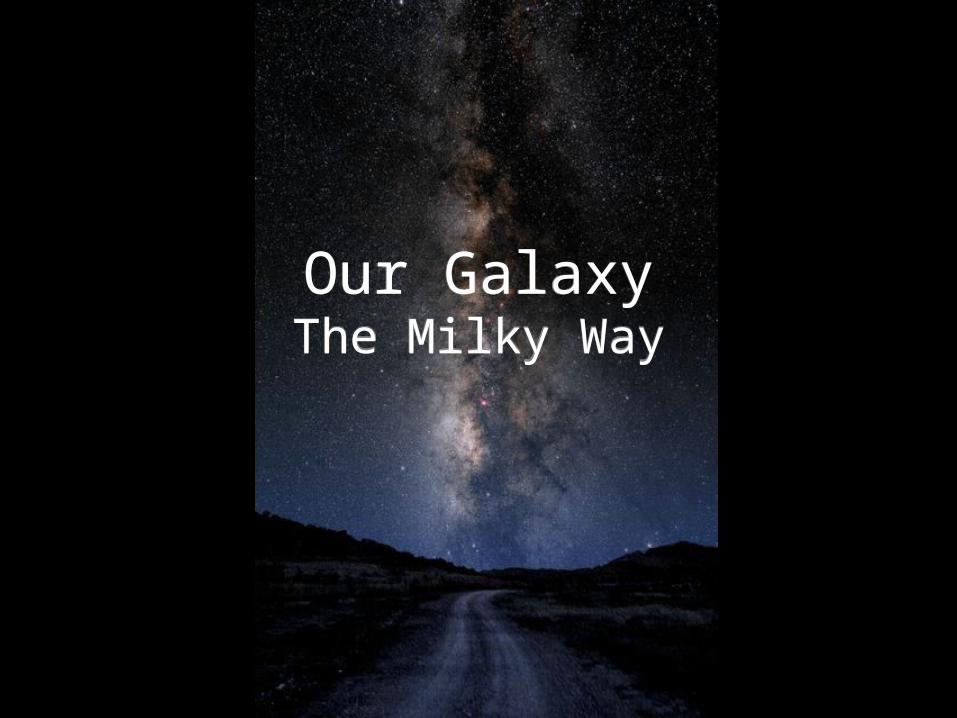
Our GalaxyThe Milky WayOur GalaxyThe Milky Way

Overview & HistoryOverview & HistoryOur Galaxy is a collection of stellar and
interstellar matter – stars, gas, dust, neutron stars, gas, dust, neutron stars, black holesstars, black holes – held together by gravity.
Our view of the Galaxy….
Our Galaxy is a collection of stellar and interstellar matter – stars, gas, dust, neutron stars, gas, dust, neutron stars, black holesstars, black holes – held together by gravity.
Our view of the Galaxy….

History of Galactic (& Extragalactic) Astronomy
1610 - Galileo discovered the Milky Way is comprised of many stars
1755 - Immanuel Kant theorized that the galaxy has a planar structure, some nebulae might actually be entire other galaxies or island universes
1774 -1781 - Messier catalog compiled including Andromeda galaxy as M31
1781-1802 - William and Caroline Herschel conducted first “all-sky survey” and cataloged 5000 nebulae, resolving some into their individual stars
1845 - William Parsons (Lord Rosse), using a 72-inch telescope, classified the nebulae into featureless ellipticals and whirlpool-like spiral nebulae
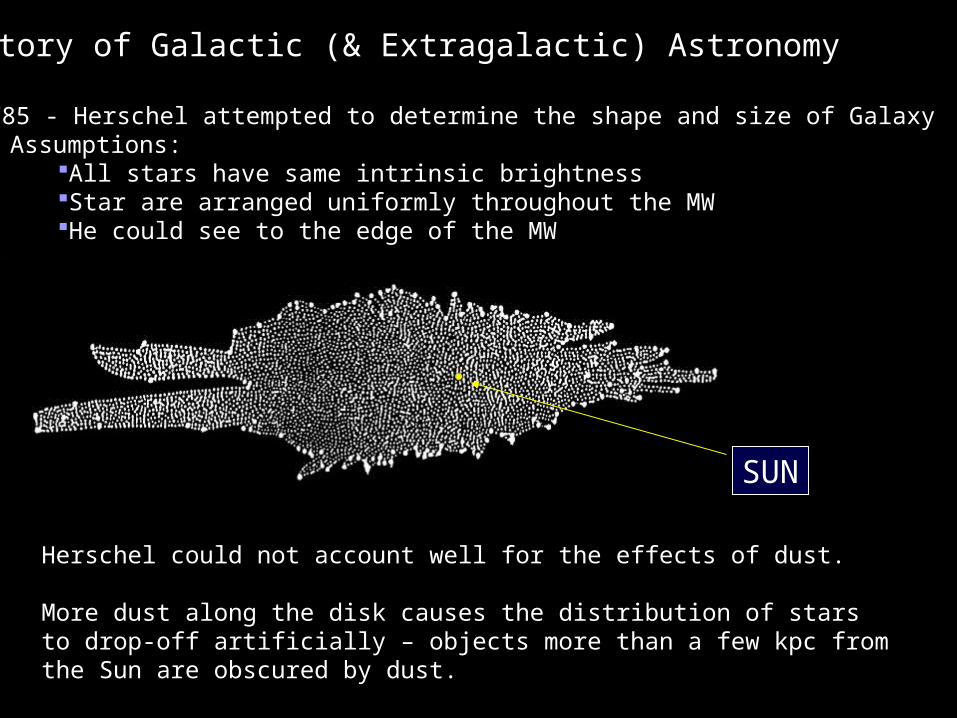
Herschel could not account well for the effects of dust.Herschel could not account well for the effects of dust.
More dust along the disk causes the distribution of stars to drop-off artificially – objects more than a few kpc from the Sun are obscured by dust.
1785 - Herschel attempted to determine the shape and size of GalaxyAssumptions:
All stars have same intrinsic brightnessStar are arranged uniformly throughout the MWHe could see to the edge of the MW
SUN
History of Galactic (& Extragalactic) Astronomy
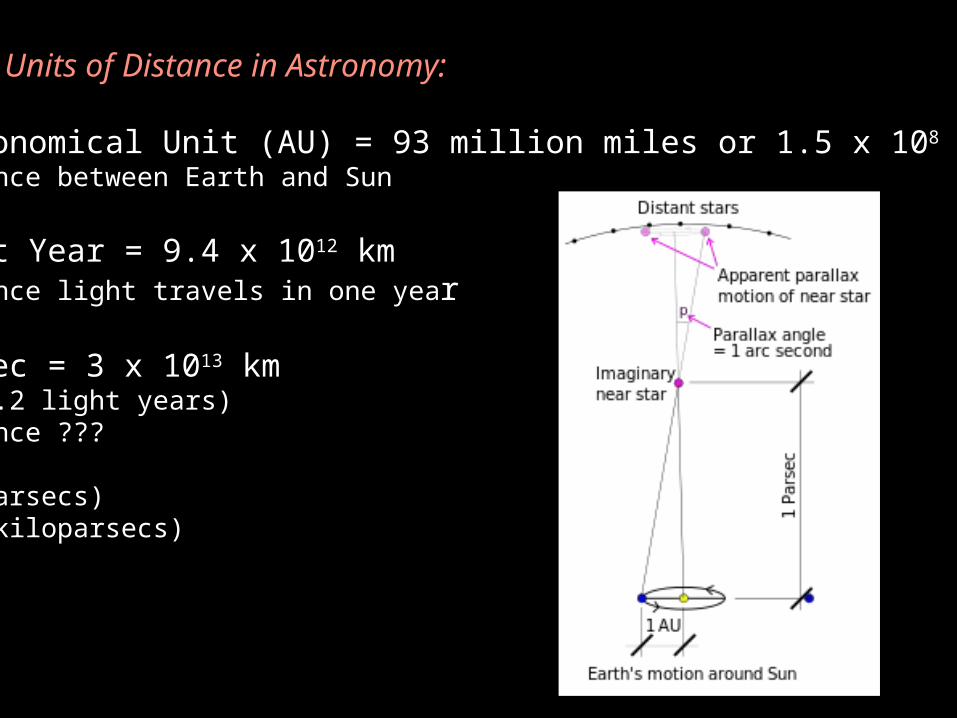
Weird Units of Distance in Astronomy:
Astronomical Unit (AU) = 93 million miles or 1.5 x 10⁸ kmDistance between Earth and Sun
Light Year = 9.4 x 10¹² kmDistance light travels in one year
Parsec = 3 x 10¹³ km (or 3.2 light years)Distance ???
pc (parsecs)kpc (kiloparsecs)
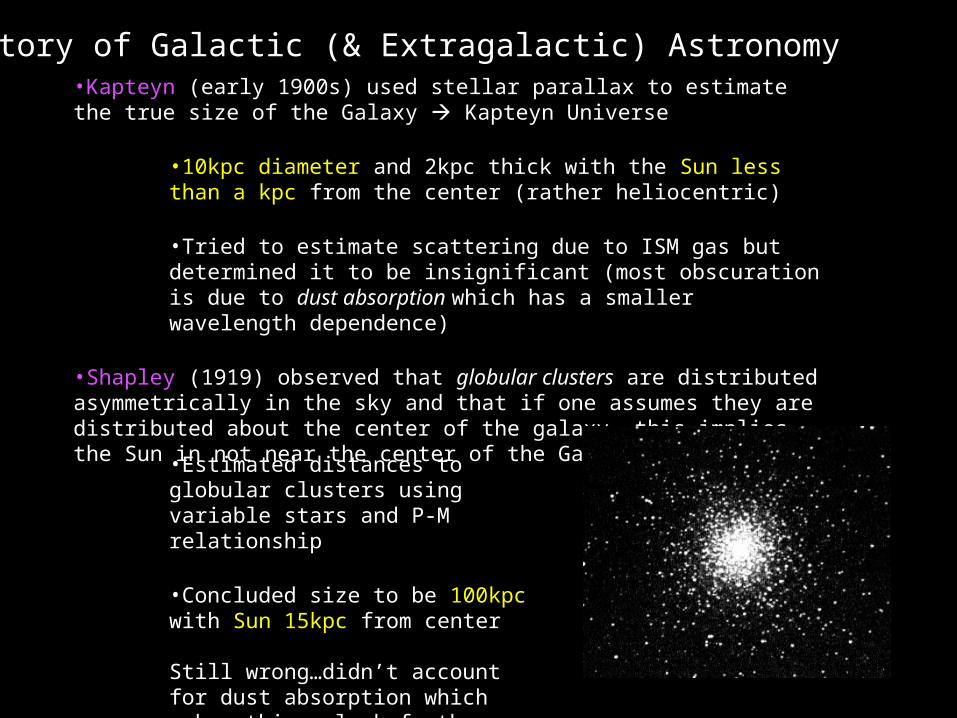
•Kapteyn (early 1900s) used stellar parallax to estimate the true size of the Galaxy Kapteyn Universe
•10kpc diameter and 2kpc thick with the Sun less than a kpc from the center (rather heliocentric)
•Tried to estimate scattering due to ISM gas but determined it to be insignificant (most obscuration is due to dust absorption which has a smaller wavelength dependence)
•Shapley (1919) observed that globular clusters are distributed asymmetrically in the sky and that if one assumes they are distributed about the center of the galaxy, this implies the Sun in not near the center of the Galaxy
•Estimated distances to globular clusters using variable stars and P-M relationship
•Concluded size to be 100kpc with Sun 15kpc from center
Still wrong…didn’t account for dust absorption which makes things look further away
History of Galactic (& Extragalactic) Astronomy

Shapley realized that the globular clusters are all orbiting the center of our Galaxy and map out the true extent of the Galaxy.
History of Galactic (& Extragalactic) Astronomy

In 1920, the National Academy of Science hosted the Great Debate concerning the nature of the Spiral Nebulae: were they island universes outside of the Milky Way?
•Shapley had MW size too big and therefore argued “NO”, they are part of the Milky Way
•Others at that time believed the Kapteyn model of a much smaller MW and argued “YES”, they are separate galaxies.
In 1922-1924 Edwin Hubble resolved the controversy using the superior 100-inch telescope at Mount Wilson. He observed Cepheid variables in Andromeda and, using the P-M relation (distance method), determined its distance to be 300kpc -- well outside of the MW (still off by a factor of 2 due to poor Cepheid calibrations)
History of Galactic (& Extragalactic) Astronomy
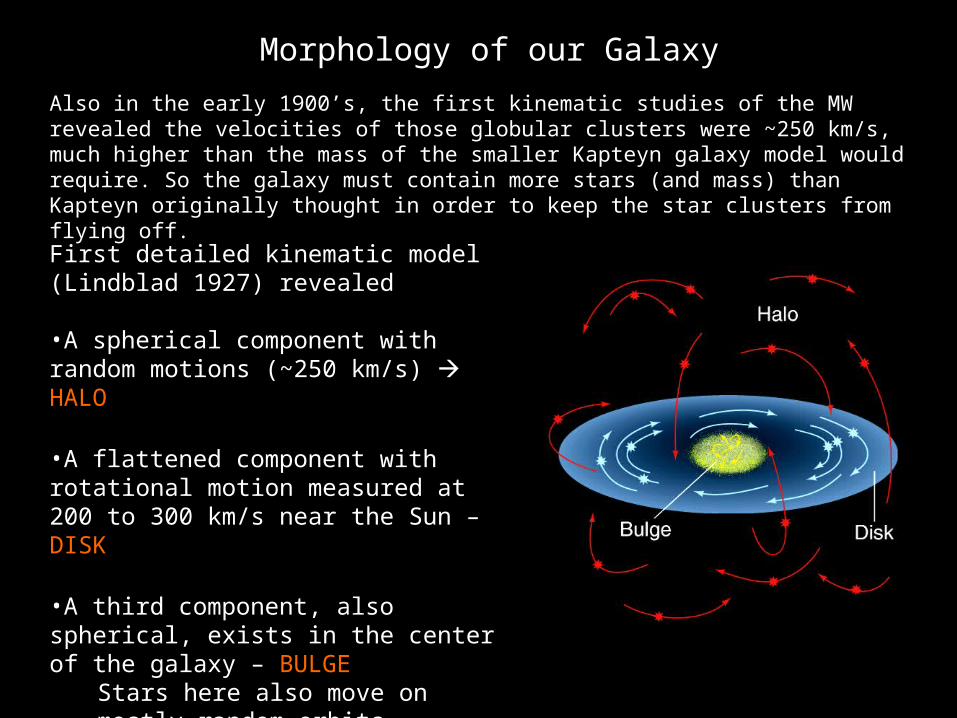
Also in the early 1900’s, the first kinematic studies of the MW revealed the velocities of those globular clusters were ~250 km/s, much higher than the mass of the smaller Kapteyn galaxy model would require. So the galaxy must contain more stars (and mass) than Kapteyn originally thought in order to keep the star clusters from flying off.
First detailed kinematic model (Lindblad 1927) revealed
•A spherical component with random motions (~250 km/s) HALO
•A flattened component with rotational motion measured at 200 to 300 km/s near the Sun – DISK
•A third component, also spherical, exists in the center of the galaxy – BULGE
Stars here also move on mostly random orbits
Morphology of our Galaxy
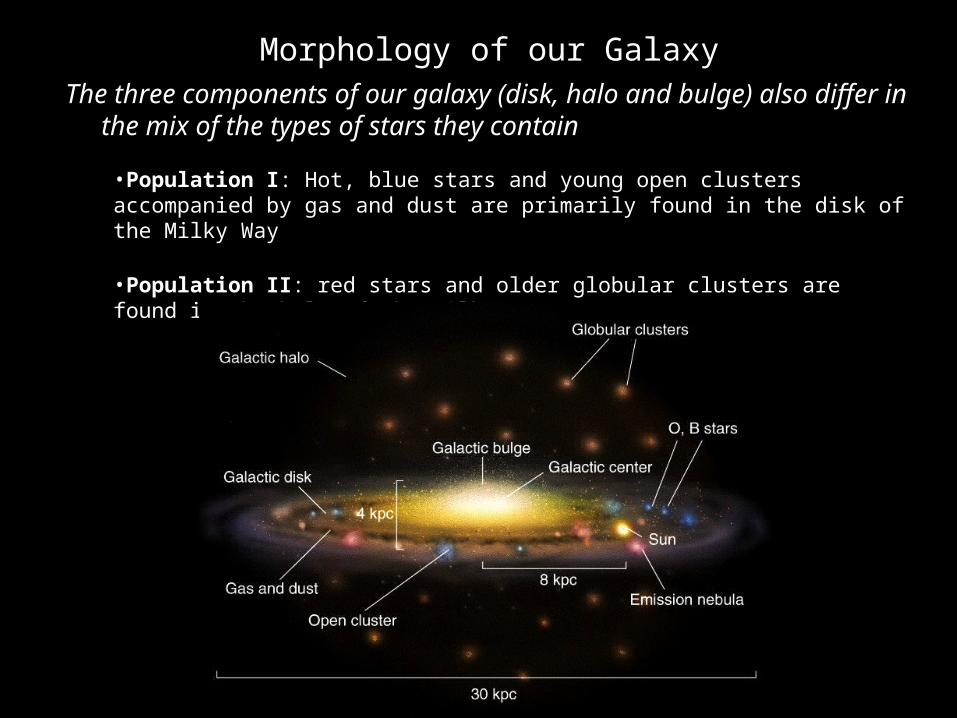
The three components of our galaxy (disk, halo and bulge) also differ in the mix of the types of stars they contain
•Population I: Hot, blue stars and young open clusters accompanied by gas and dust are primarily found in the disk of the Milky Way
•Population II: red stars and older globular clusters are found in the halo of the Milky Way
Morphology of our Galaxy
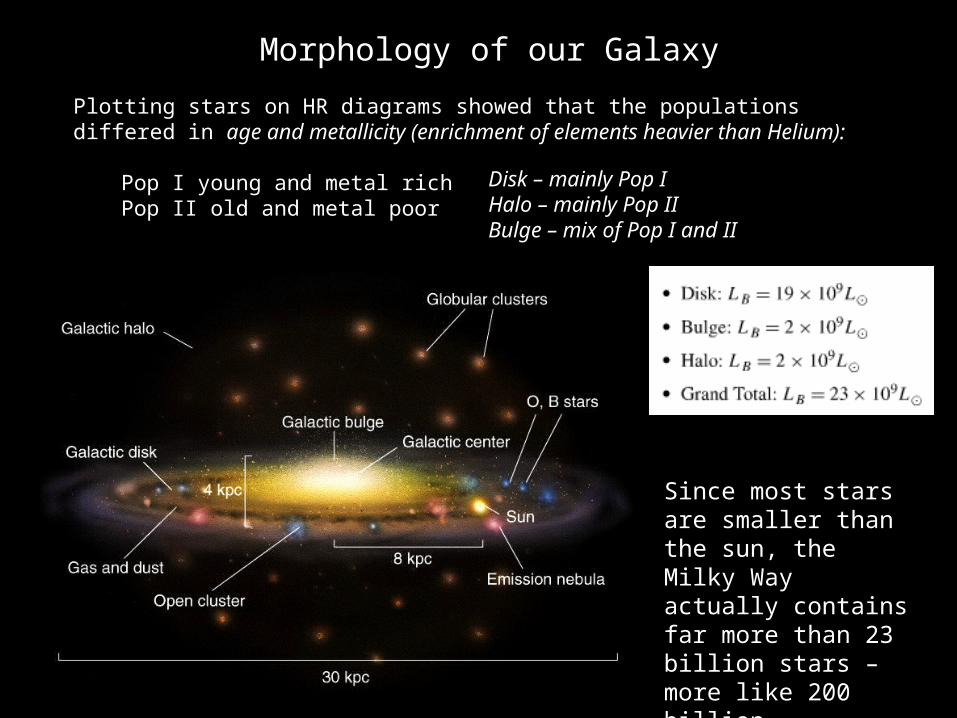
Plotting stars on HR diagrams showed that the populations differed in age and metallicity (enrichment of elements heavier than Helium):
Pop I young and metal richPop II old and metal poor
Since most stars are smaller than the sun, the Milky Way actually contains far more than 23 billion stars – more like 200 billion
Morphology of our Galaxy
Disk – mainly Pop IHalo – mainly Pop IIBulge – mix of Pop I and II

Differential RotationDifferential Rotation Everything in the Galaxy orbits around
the Galactic center
Material closer to the center travels on faster orbits (takes less time to make one full orbit)
Similar to the way the planets orbit the Sun
Orbital periods at different distances from the Galactic center can tell us the distribution of mass in the Galaxy
Examining motions of stars in the disk are most helpful for mapping the distribution of mass
Everything in the Galaxy orbits around the Galactic center
Material closer to the center travels on faster orbits (takes less time to make one full orbit)
Similar to the way the planets orbit the Sun
Orbital periods at different distances from the Galactic center can tell us the distribution of mass in the Galaxy
Examining motions of stars in the disk are most helpful for mapping the distribution of mass

M(R) = 0R (r) dV
Motion at distance R from center depends only on M(R)That mass behaves as if it were centrally concentrated
For an object with mass m at R, gravity must balance acceleration of circular motion
GM(R)m/R2 = mv2/RM(R) = v(R)2R/G
Measure v(R) and get M(R)
Let ω(R) = v(R)/R, thenM(R) = ω(R)2R3/G
v(R) or ω(R) gives the rotation curve of the Galaxy.
v
m
M
R
Differential Rotation
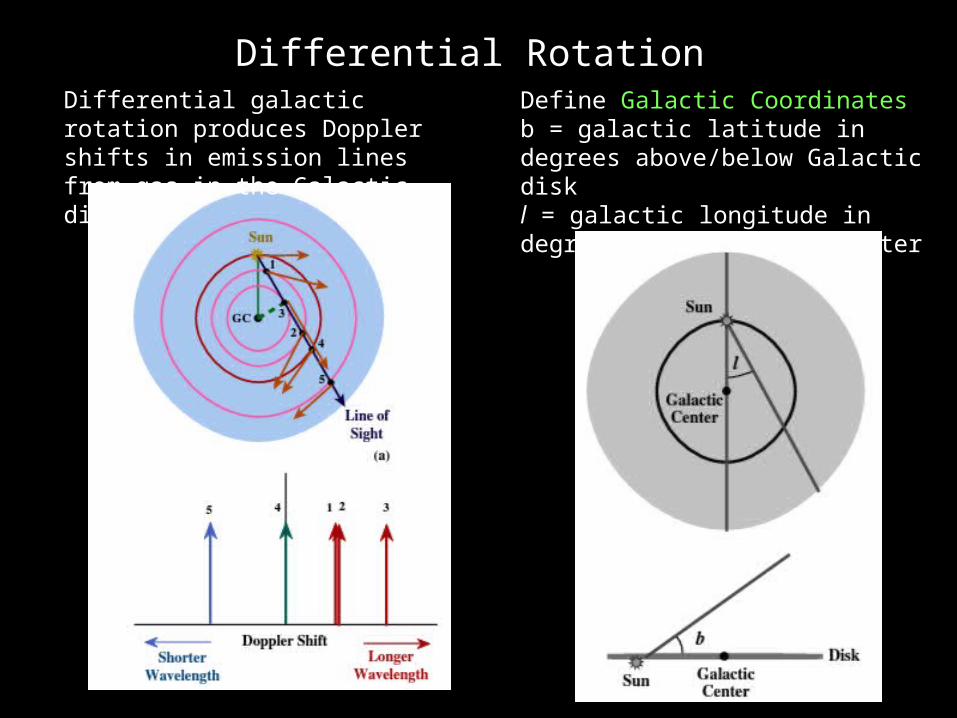
Differential galactic rotation produces Doppler shifts in emission lines from gas in the Galactic disk
Define Galactic Coordinatesb = galactic latitude in degrees above/below Galactic diskl = galactic longitude in degrees from Galactic Center
Differential Rotation
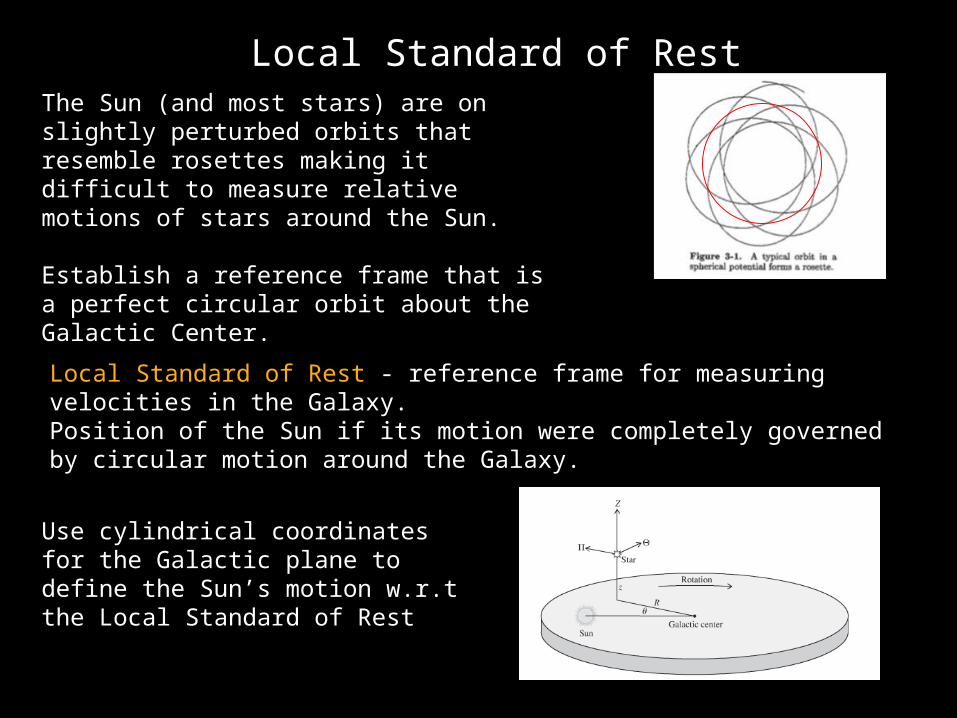
Use cylindrical coordinates for the Galactic plane to define the Sun’s motion w.r.t the Local Standard of Rest
The Sun (and most stars) are on slightly perturbed orbits that resemble rosettes making it difficult to measure relative motions of stars around the Sun.
Establish a reference frame that is a perfect circular orbit about the Galactic Center.
Local Standard of Rest - reference frame for measuring velocities in the Galaxy. Position of the Sun if its motion were completely governed by circular motion around the Galaxy.
Local Standard of Rest

To determine the Suns motion wrt to LSR, we observe the average motions of all stars in the Sun’s vicinity and measure the following:
Π - Πo = U (speed away from GC) = -10.4 km/s [7.5 +/-1 km/s]Z - Zo = W (speed towards NGP) = 7.3 km/s [6.8 (+/- 0.1) km/s]Θ - Θo = V (speed in direction of motion) = V = 14.8 km/s [13.5 (+/- 3) km/s]
The Sun is moving toward the Galactic center, faster than the LSR, and northward toward the NGP. Net motion is 19.5 km/s in the direction of constellation Hercules
Bracket values from Francis and Anderson (2009)
Local Standard of Rest
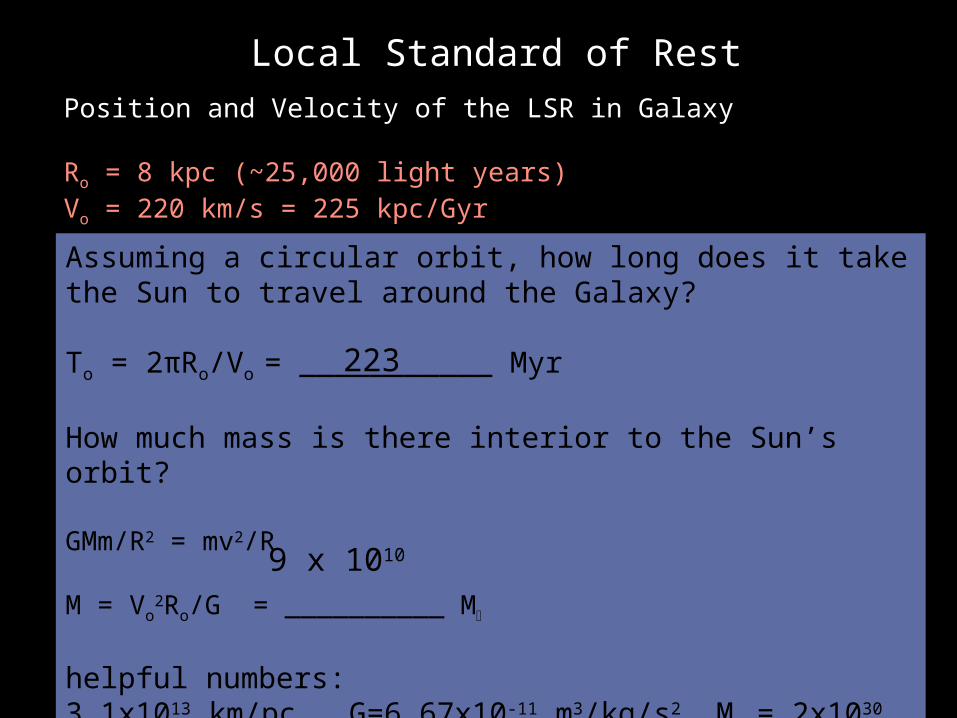
Position and Velocity of the LSR in Galaxy
Ro = 8 kpc (~25,000 light years)Vo = 220 km/s = 225 kpc/Gyr
Assuming a circular orbit, how long does it take the Sun to travel around the Galaxy?
To = 2πRo/Vo = ___________ Myr
How much mass is there interior to the Sun’s orbit?
GMm/R2 = mv2/R
M = Vo2Ro/G = __________ M
helpful numbers:3.1x10¹³ km/pc G=6.67x10⁻¹¹ m3/kg/s2 M = 2x1030 kg
Local Standard of Rest
223
9 x 10¹⁰
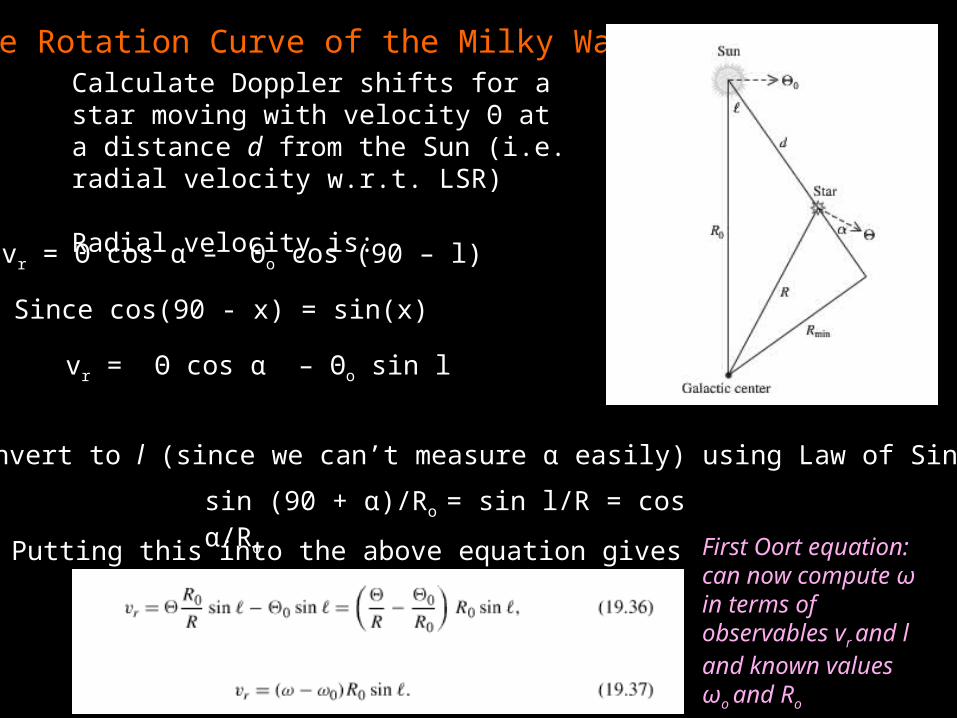
Calculate Doppler shifts for a star moving with velocity Θ at a distance d from the Sun (i.e. radial velocity w.r.t. LSR)
Radial velocity is:
Since cos(90 - x) = sin(x)
Convert to l (since we can’t measure α easily) using Law of Sines
Putting this into the above equation gives
The Rotation Curve of the Milky Way
vr = Θ cos α – Θo cos (90 – l)
vr = Θ cos α – Θo sin l
sin (90 + α)/Ro = sin l/R = cos α/Ro
First Oort equation: can now compute ω in terms of observables vr and l and known values ωo and Ro
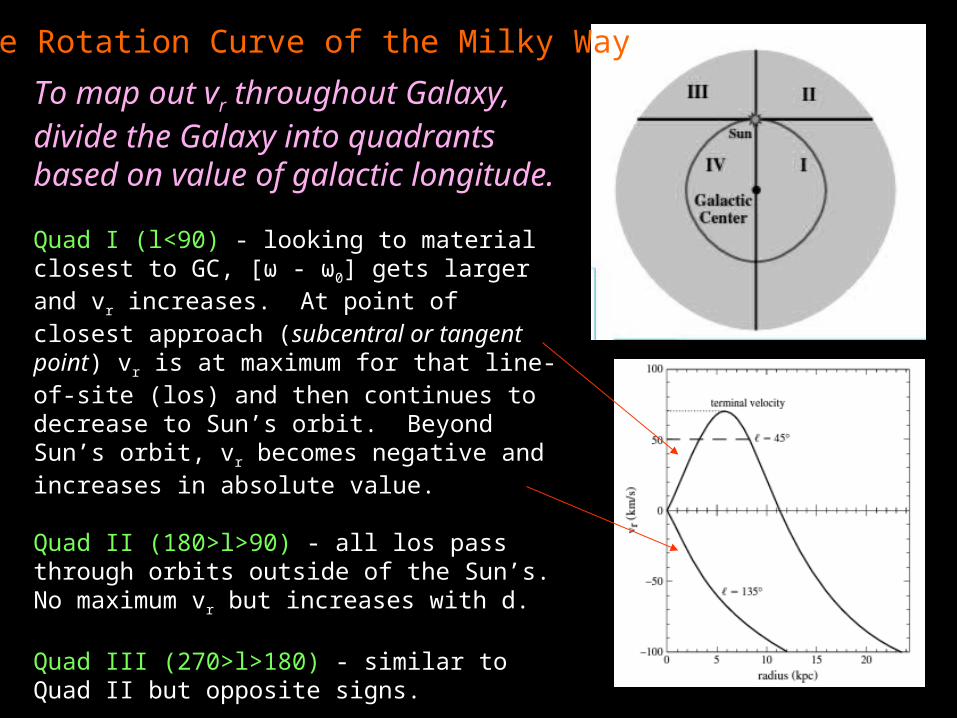
To map out vr throughout Galaxy, divide the Galaxy into quadrants based on value of galactic longitude.
Quad I (l<90) - looking to material closest to GC, [ω - ω0] gets larger and vr increases. At point of closest approach (subcentral or tangent pointsubcentral or tangent point) vr is at maximum for that line-of-site (los) and then continues to decrease to Sun’s orbit. Beyond Sun’s orbit, vr becomes negative and increases in absolute value.
Quad II (180>l>90) - all los pass through orbits outside of the Sun’s. No maximum vr but increases with d.
Quad III (270>l>180) - similar to Quad II but opposite signs.
Quad IV (l>270) - similar to Quad I except reverse signs.
The Rotation Curve of the Milky Way
Measuring the Rotation Curve of the Milky Way
Measuring the Rotation Curve of the Milky Way
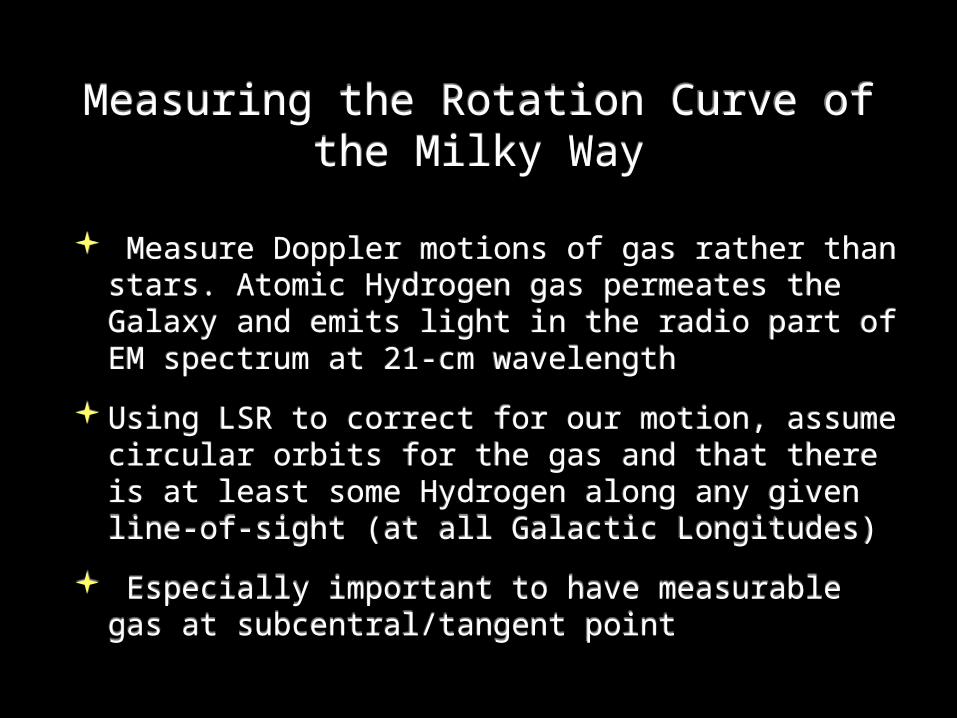
Measure Doppler motions of gas rather than stars. Atomic Hydrogen gas permeates the Galaxy and emits light in the radio part of EM spectrum at 21-cm wavelength
Using LSR to correct for our motion, assume circular orbits for the gas and that there is at least some Hydrogen along any given line-of-sight (at all Galactic Longitudes)
Especially important to have measurable gas at subcentral/tangent point

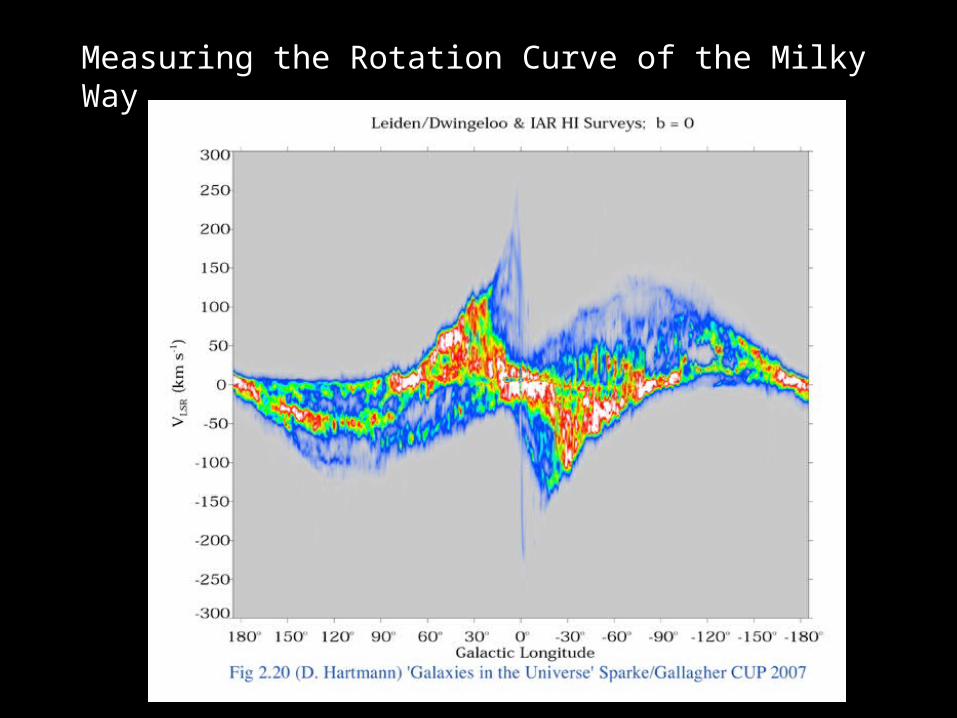
•Find maximum shift of 21-cm line along given line-of-sight (los)
•Assign that Doppler shift to material at the tangent point (closest approach to GC)
•Rmin = Ro sin l
•ω(Rmin) = [vmax/(Ro sin l)] + ωo
•By studying los longitude values from 0 to 90 degrees, Rmin will range from 0 to Ro
Limitations•No gas at subcentral point•Non-circular orbits•At Rmin = 0 and at Ro, difficult to measure curve due to small Doppler shifts
Measuring the Rotation Curve of the Milky Way
= Θo
= Θ
Measuring the Rotation Curve of the Milky Way

Since there is no maximum Doppler shift for los away from GC, rotation curve beyond Ro is more difficult to determine Need to measure the velocity and distance of material independentlyUse Molecular Clouds :
• get velocity from radial velocities of CO emission in gas clouds• get distance from spectroscopic parallax of stars forming in clouds
Measuring the Rotation Curve of the Milky Way
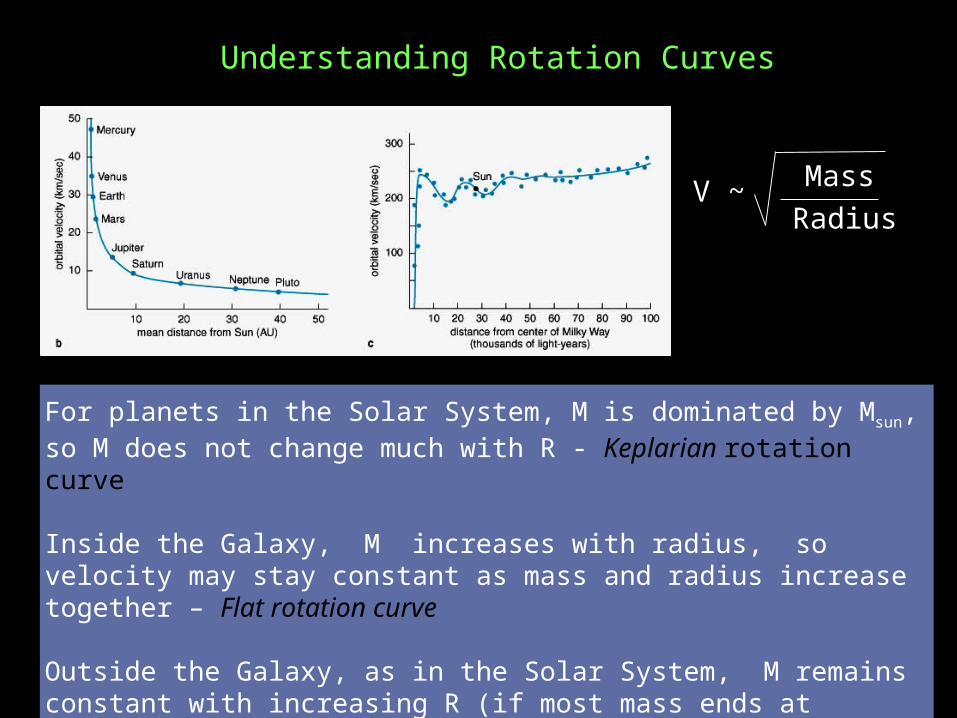
For planets in the Solar System, M is dominated by Msun, so M does not change much with R - Keplarian rotation curve
Inside the Galaxy, M increases with radius, so velocity may stay constant as mass and radius increase together – Flat rotation curve
Outside the Galaxy, as in the Solar System, M remains constant with increasing R (if most mass ends at visible edge). Then we would expect the rotation curve to slope downward in Keplarian-like motion.
Mass
RadiusV ~
Understanding Rotation Curves

Since the Milky Way rotation curve shows no drop in velocities beyond the visible edge of the disk (around R=15 kpc), this indicates the presence of some additional, non-luminous material Dark Matter (matter too dim or weakly interacting to be detected by current technology)
Even though Dark Matter is detected through measurements of the Galactic Disk, it is not necessarily confined to the disk and is likely to be distributed throughout the Galactic Halo. Most galaxies appear to exist within these Dark Matter Halos.
Understanding Rotation Curves
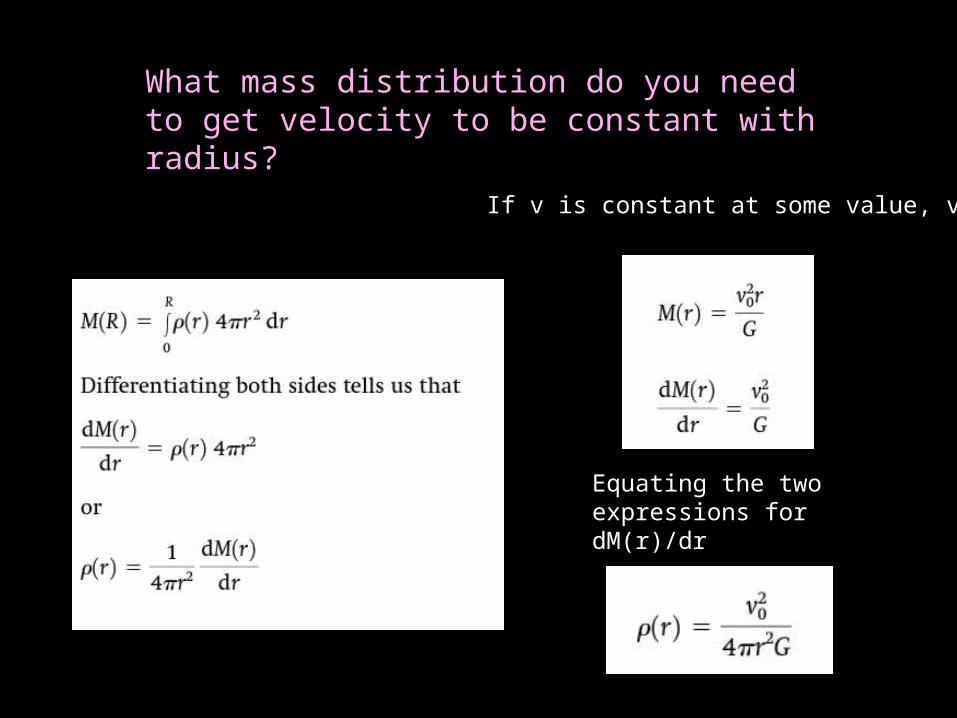
If v is constant at some value, vo
Equating the two expressions for dM(r)/dr
What mass distribution do you need to get velocity to be constant with radius?
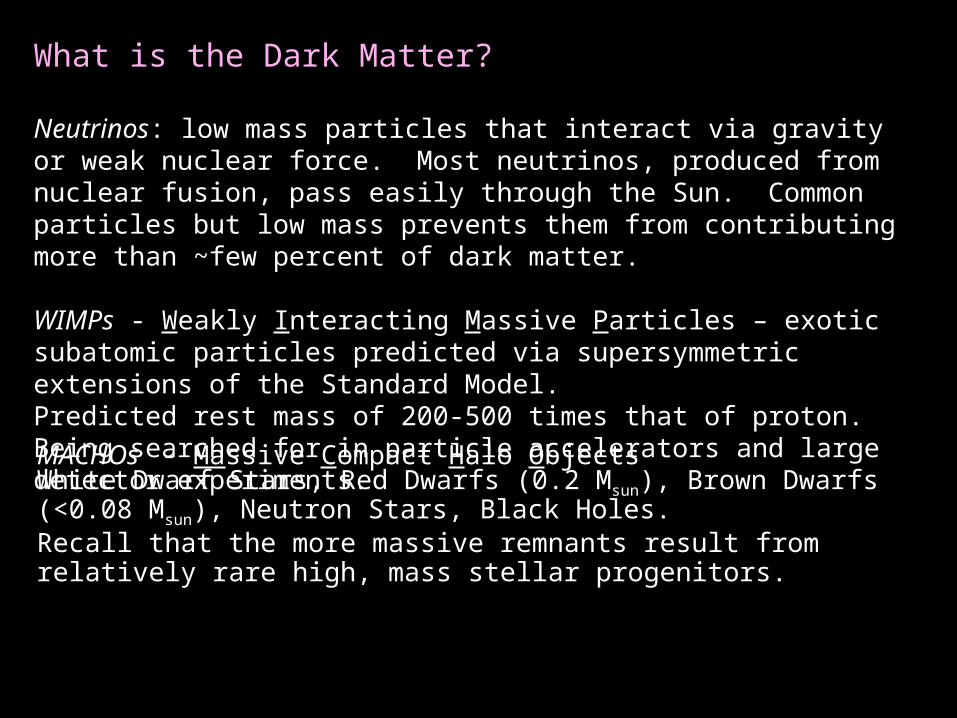
What is the Dark Matter?
Neutrinos: low mass particles that interact via gravity or weak nuclear force. Most neutrinos, produced from nuclear fusion, pass easily through the Sun. Common particles but low mass prevents them from contributing more than ~few percent of dark matter.
WIMPs - Weakly Interacting Massive Particles – exotic subatomic particles predicted via supersymmetric extensions of the Standard Model.Predicted rest mass of 200-500 times that of proton.Being searched for in particle accelerators and large detector experiments.
MACHOs - Massive Compact Halo Objects White Dwarf Stars, Red Dwarfs (0.2 Msun), Brown Dwarfs (<0.08 Msun), Neutron Stars, Black Holes.Recall that the more massive remnants result from relatively rare high, mass stellar progenitors.

The Search for Dark Matter (brown or white dwarfs): MACHOs
•The faint foreground object (brown or white dwarf) bends the light of the background star because of its gravitational field
•The light from the background star is focused or “lensed” by this effect and the star appears brighter.
•MACHO results acount for only ~20% of dark matter
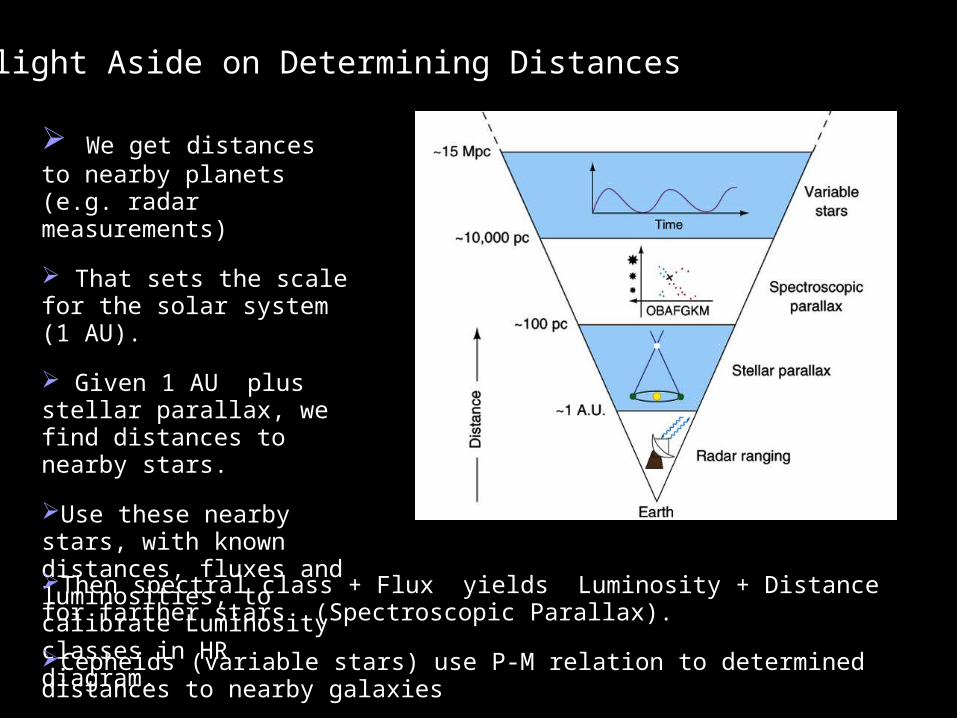
Slight Aside on Determining Distances
We get distances to nearby planets (e.g. radar measurements)
That sets the scale for the solar system (1 AU).
Given 1 AU plus stellar parallax, we find distances to nearby stars.
Use these nearby stars, with known distances, fluxes and luminosities, to calibrate Luminosity classes in HR diagram.
Then spectral class + Flux yields Luminosity + Distance for farther stars (Spectroscopic Parallax).
Cepheids (variable stars) use P-M relation to determined distances to nearby galaxies
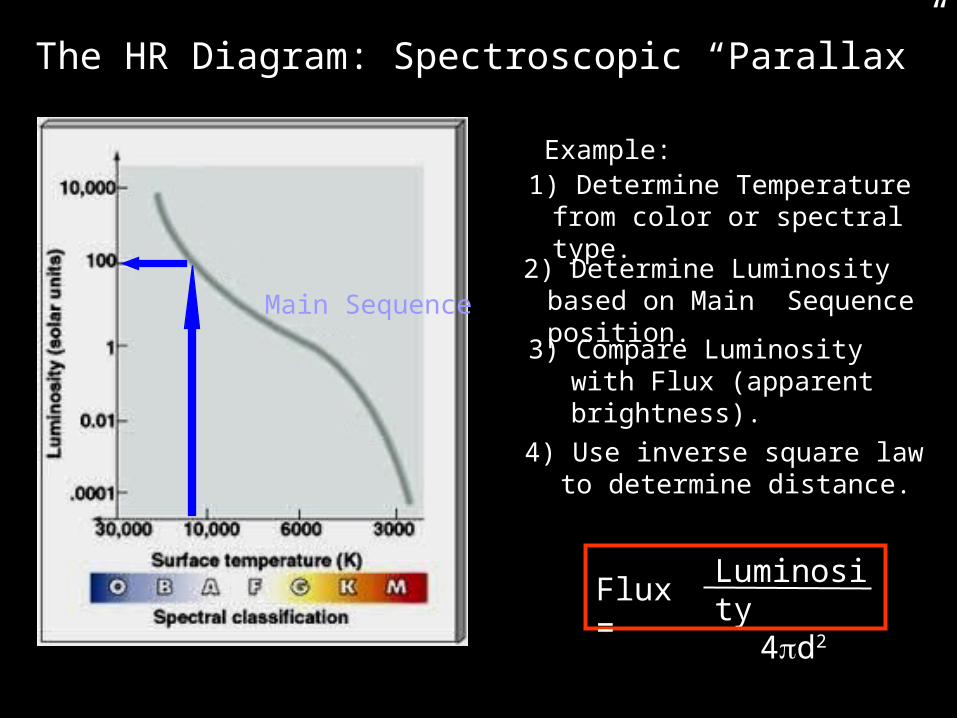
The HR Diagram: Spectroscopic “Parallax”
Main Sequence
1) Determine Temperature from color or spectral type.
2) Determine Luminosity based on Main Sequence position.
3) Compare Luminosity with Flux (apparent brightness).
4) Use inverse square law to determine distance.
Example:
Luminosity4d2Flux =
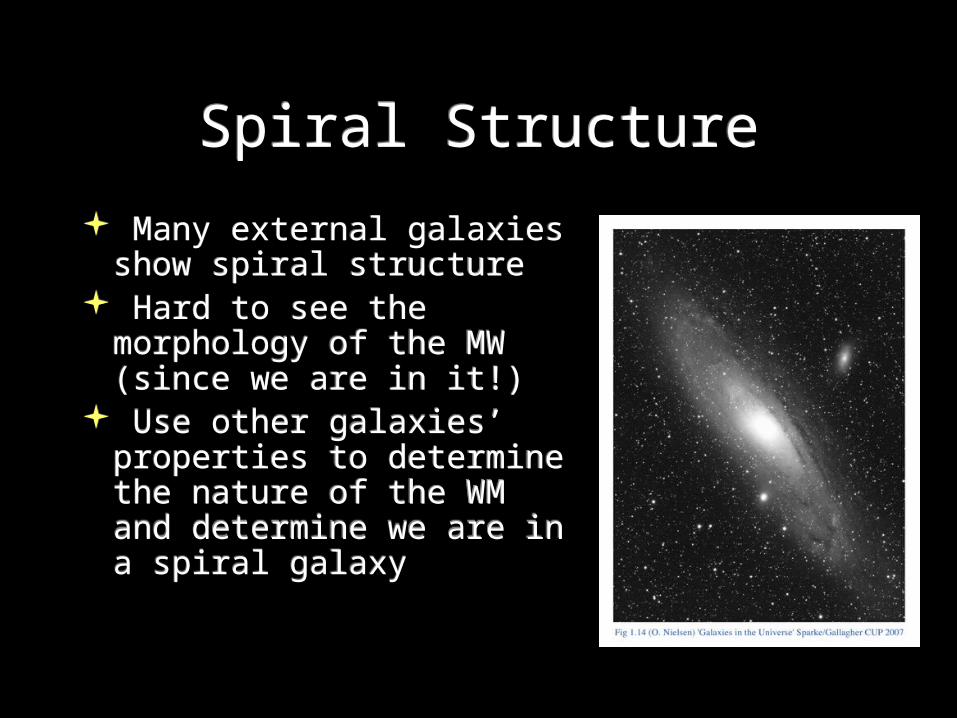
Spiral StructureSpiral Structure
Many external galaxies show spiral structure
Hard to see the morphology of the MW (since we are in it!)
Use other galaxies’ properties to determine the nature of the WM and determine we are in a spiral galaxy
Many external galaxies show spiral structure
Hard to see the morphology of the MW (since we are in it!)
Use other galaxies’ properties to determine the nature of the WM and determine we are in a spiral galaxy
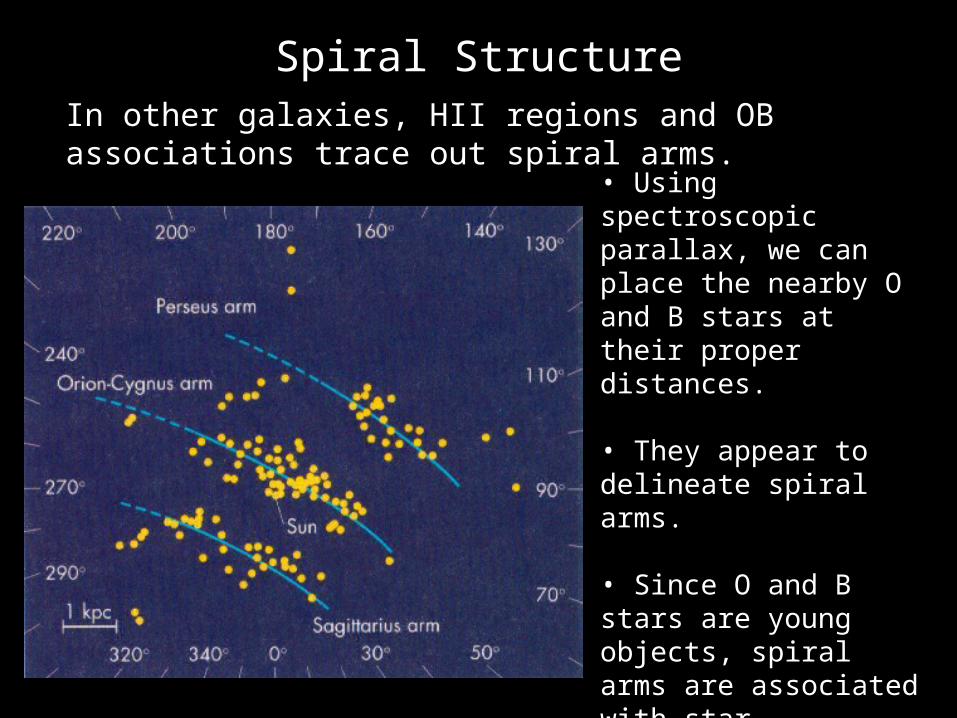
In other galaxies, HII regions and OB associations trace out spiral arms.
• Using spectroscopic parallax, we can place the nearby O and B stars at their proper distances.
• They appear to delineate spiral arms.
• Since O and B stars are young objects, spiral arms are associated with star formation.
•Problem: Can’t see very far in the optical…
Spiral Structure
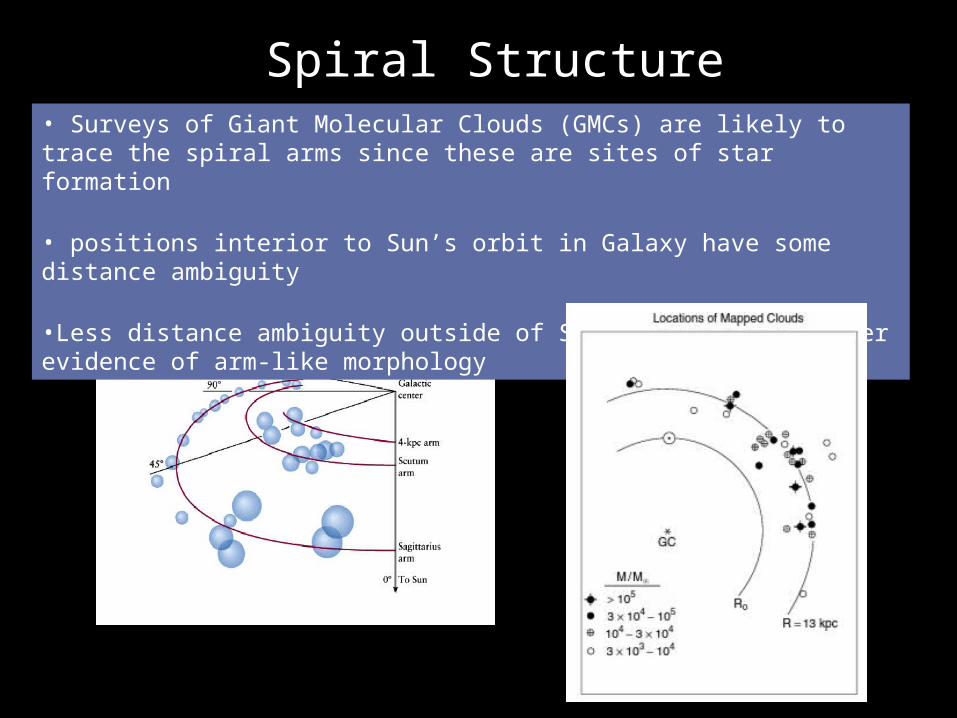
• Surveys of Giant Molecular Clouds (GMCs) are likely to trace the spiral arms since these are sites of star formation
• positions interior to Sun’s orbit in Galaxy have some distance ambiguity
•Less distance ambiguity outside of Solar orbit, and better evidence of arm-like morphology
Spiral Structure
The Galactic NucleusThe Galactic Nucleus
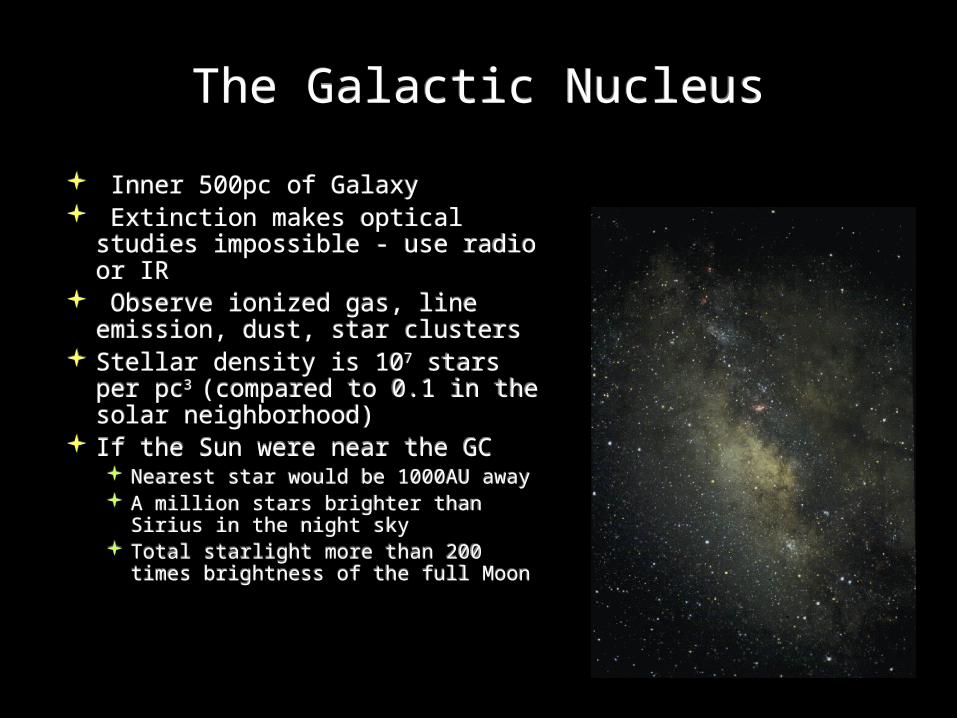
Inner 500pc of Galaxy Extinction makes optical studies
impossible - use radio or IR Observe ionized gas, line
emission, dust, star clusters Stellar density is 107 stars per
pc3 (compared to 0.1 in the solar neighborhood)
If the Sun were near the GC Nearest star would be 1000AU away A million stars brighter than Sirius in
the night sky Total starlight more than 200 times
brightness of the full Moon
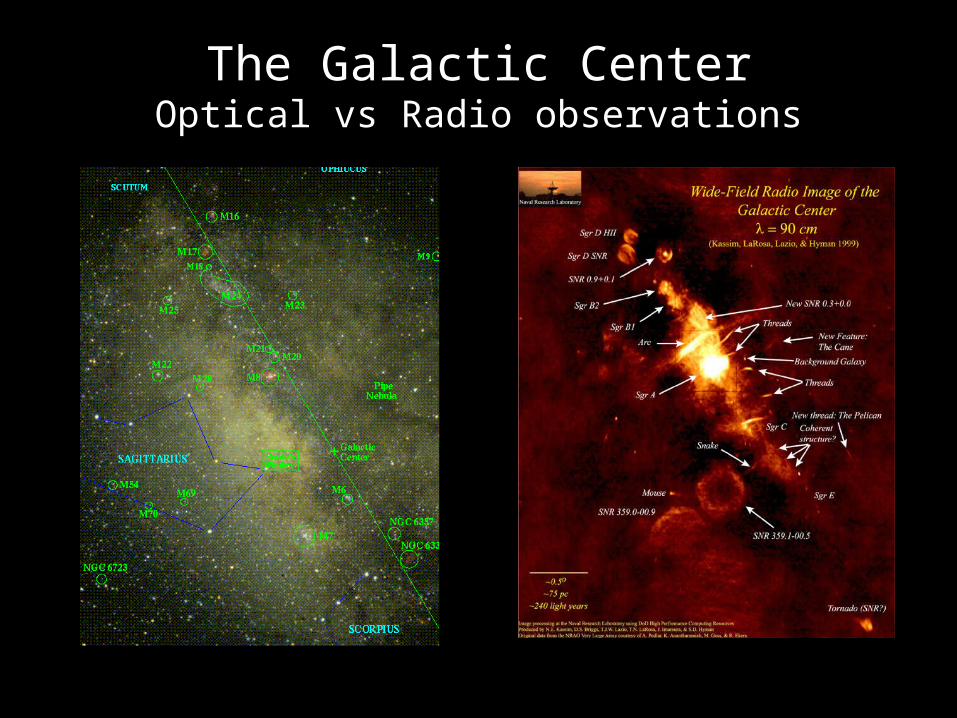
The Galactic CenterOptical vs Radio observations
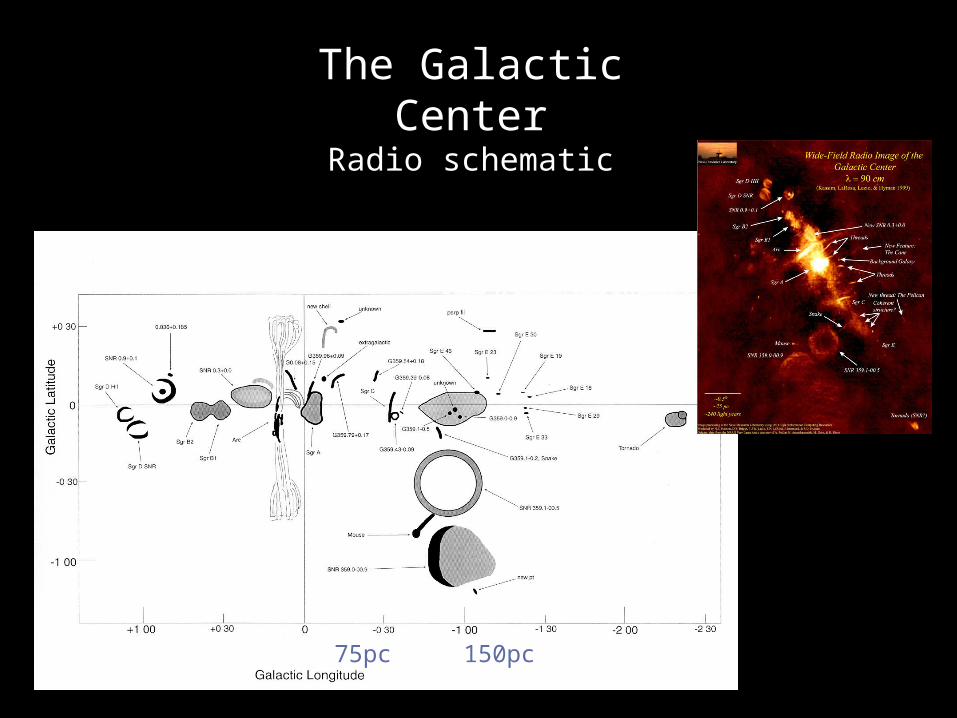
75pc 150pc
The Galactic CenterRadio schematic
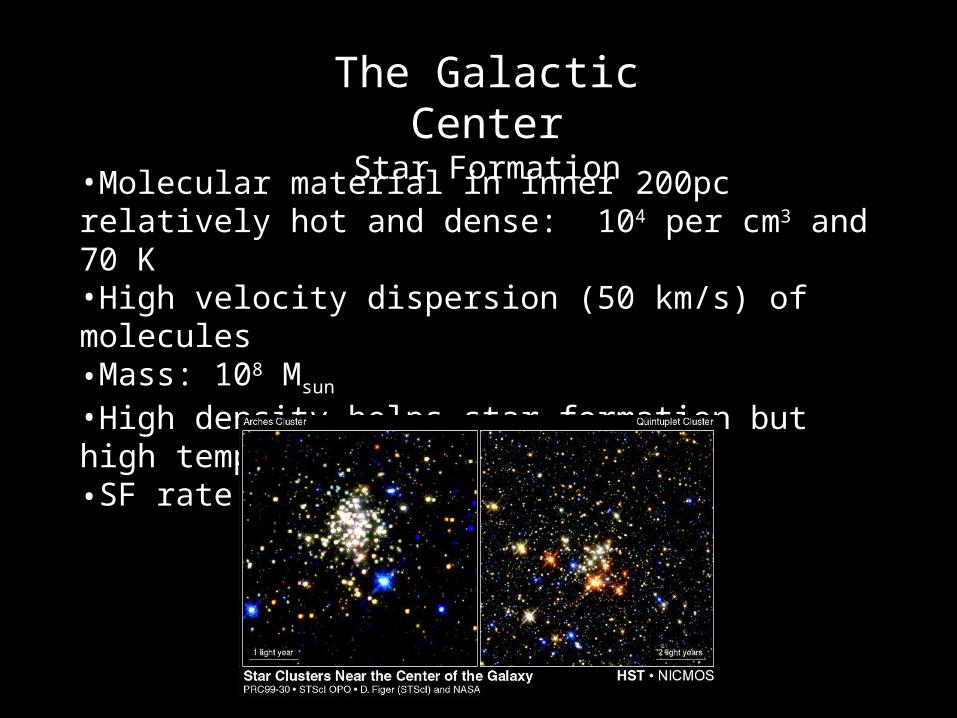
•Molecular material in inner 200pc relatively hot and dense: 104 per cm3 and 70 K•High velocity dispersion (50 km/s) of molecules•Mass: 108 Msun
•High density helps star formation but high temps don’t•SF rate ~ 1Msun/year
The Galactic CenterStar Formation
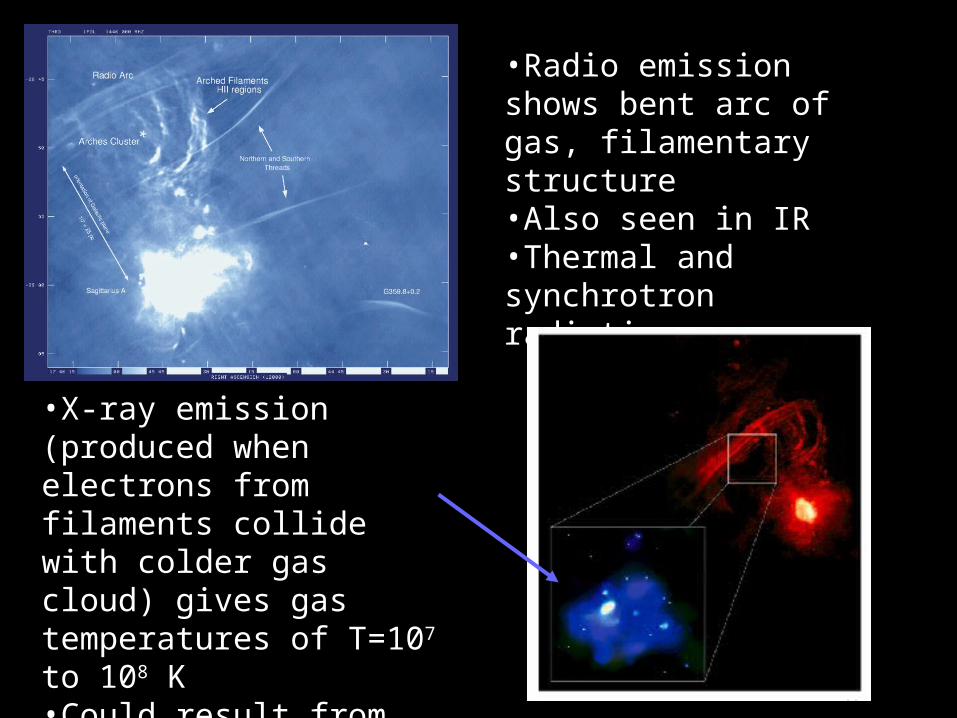
•Radio emission shows bent arc of gas, filamentary structure•Also seen in IR•Thermal and synchrotron radiation
•X-ray emission (produced when electrons from filaments collide with colder gas cloud) gives gas temperatures of T=107 to 108 K•Could result from past SN explosions
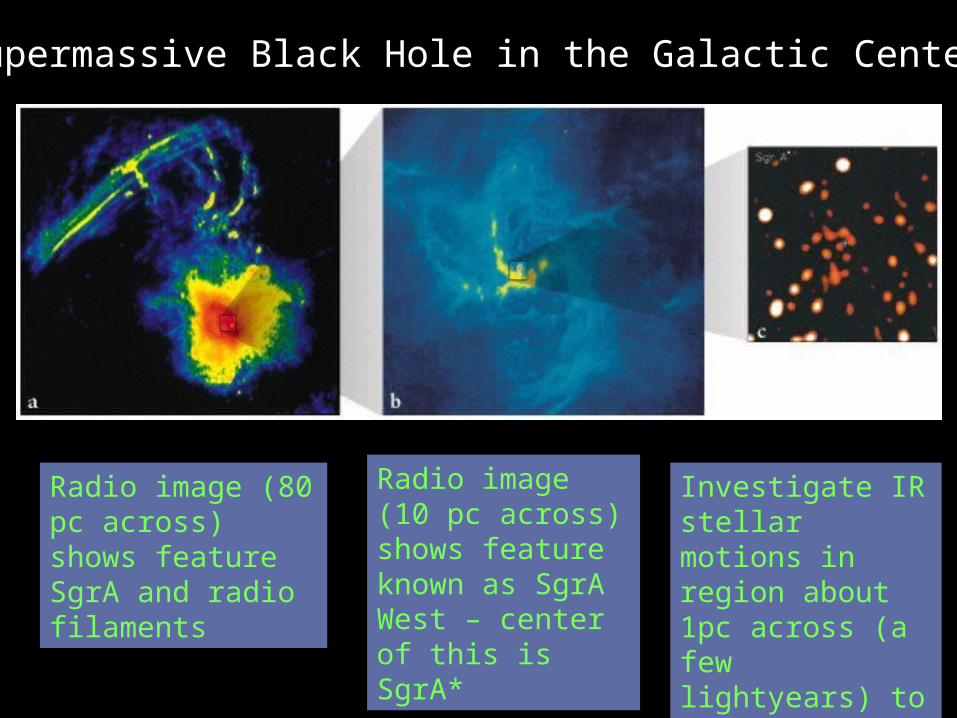
Supermassive Black Hole in the Galactic Center
Radio image (80 pc across) shows feature SgrA and radio filaments
Radio image (10 pc across) shows feature known as SgrA West – center of this is SgrA*
Investigate IR stellar motions in region about 1pc across (a few lightyears) to estimate BH mass

•Measure proper motions of stars around Galactic Center•Adaptive optics at large telescopes improved ground-based resolution to 0.5” in IR (stellar positions measured to 0.002”)•90 stars identified and proper motions (largest at 1400 km/s!) centered about SgrA* to within 0.1”•Velocities consistent with Keplarian motion (all mass at center)•M = 2.6 +/- 0.2 x 10⁶ Msun

Curvature of the paths near SgrA* constrain the volume of the mass to ~ Schwarzchild radius (few x 106 km) Supermassive Black Hole
•Chandra X-ray image of Sgr A* showing nucleus and several thousand other X-ray sources.
•During 2-week observation period, several X-ray flares occurred.
•Rapidity of flares indicates they originate near the Schwarzchild radius of the BH.
•Even during the flares, X-ray emission from the nucleus is relatively weak. Suggests that Sgr A* is a starved black hole, possibly because explosive events in the past have cleared much of the gas from around it.
Additional evidence - X-ray emissionX-ray emission