our people making a difference -...
TRANSCRIPT

Dimension Data Annual Report 2009 1
Dimension Data Annual Report 2009
Our people Making a difference

Dimension Data Annual Report 2009
Table of contents
Financial highlights 3
Business overview 4
Chairman’s letter 9
Strategy 12
Chief Executive Officer’s review 15
Chief Financial Officer’s review 23
Principal risks 36
Executive Committee 38
Board of Directors 40
Directors’ report 42
Corporate governance report 47
Corporate responsibility report 55
Remuneration report 62
Statement of Directors’ responsibilities 69
Independent auditors’ report 70
Annual financial statements 72
Shareholder information 125
Notice of annual general meeting 126
Contacts and corporate information ibc
For more information on this and other reports please visit us at www.dimensiondata.com

Dimension Data’s solutions are changing the world as we know it
World leaders in the provision
and management of specialist IT
infrastructure solutions that help our
clients achieve their business goals

2 Dimension Data Annual Report 2009
Enabling Africa’s greatest sporting eventWhen South Africa was announced as the host country for the 2010 Soccer World Cup, the country was given an exceptional opportunity to show that it was ready to deliver on a global stage. More than 400,000 international soccer fans are expected to attend the event, alongside billions of television viewers, all of whom will get a preview of South Africa’s unique heritage and culture. The Soccer World Cup has proven to be the catalyst for massive infrastructure investment across both country and continent. The Group has enabled the event across different sectors of the economy, including safety and security, transportation, venues, accommodation and
intelligent border control. Internet Solutions and Plessey have worked to ensure pervasive connectivity throughout the country, implementing extensive broadband capabilities, multiple hotspots and laying over 500 km of fibre optic cable.
The most high profile of the projects will be the sporting stadiums themselves; these needed to incorporate the latest ‘intelligent building’ technology, as well as being economically, socially and environmentally sustainable. Dimension Data was appointed Master Systems Integrator for ICT Systems at the Green Point Stadium in Cape Town and shortly thereafter at the now complete Nelson Mandela Bay Stadium in Port Elizabeth. We were subsequently awarded contracts at the Moses Mabhida Stadium in Durban, the Loftus Versfeld Stadium in Pretoria, the Vodacom Park Stadium in Bloemfontein and the Orlando Stadium in Soweto.
Dimension Data brought together an integrated solution covering voice, video and data, building automation systems such as heating, ventilation and air conditioning, and the physical security aspects of access control and surveillance. The solution is based on a central IP backbone which allows for a centrally monitored and controlled environment and has resulted in two multi-purpose stadiums – acknowledged to be amongst the most technologically sophisticated in the world.
South Africa
Systems Integration› Network Integration
› Converged Communications
› Security Solutions
Plessey› Infrastructure
› Connectivity
Internet Solutions› Connectivity
› Communications
Dimension Data’s solutions - changing the world as we know it
Dimension Data Annual Report 2009 3
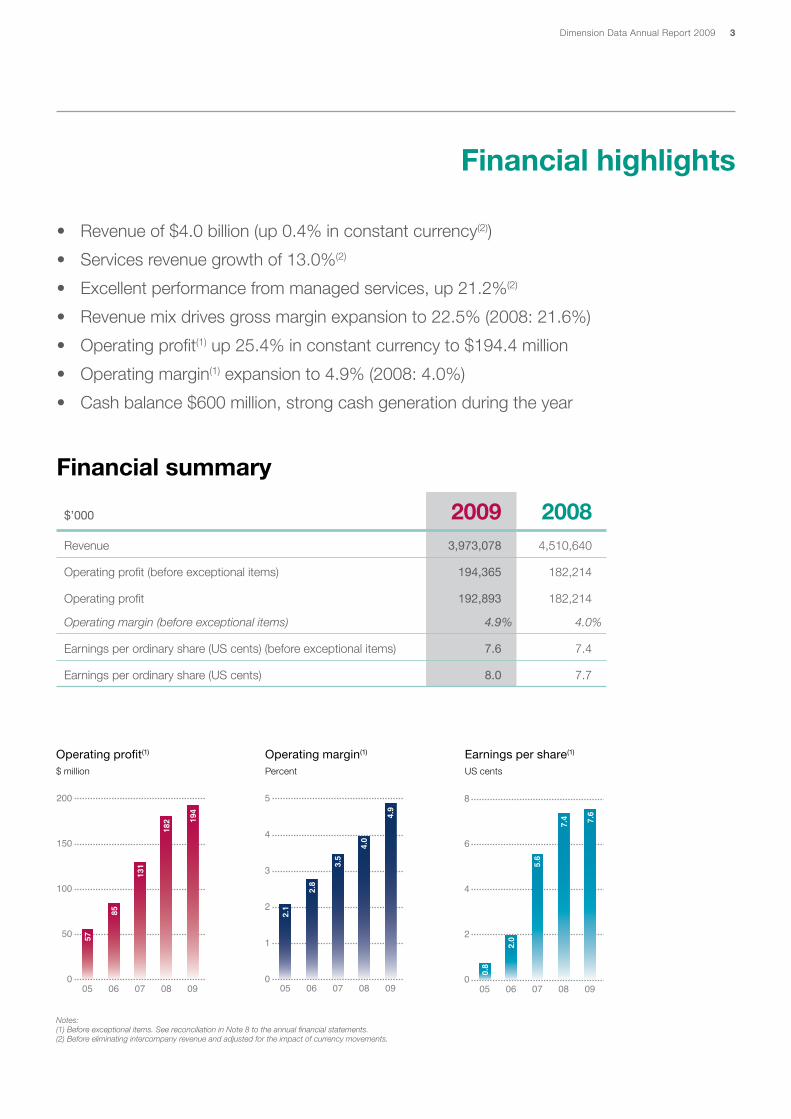
Financial highlights
• Revenue of $4.0 billion (up 0.4% in constant currency(2))
• Services revenue growth of 13.0%(2)
• Excellent performance from managed services, up 21.2%(2)
• Revenue mix drives gross margin expansion to 22.5% (2008: 21.6%)
• Operating profit(1) up 25.4% in constant currency to $194.4 million
• Operating margin(1) expansion to 4.9% (2008: 4.0%)
• Cash balance $600 million, strong cash generation during the year
Financial summary
$’000 2009 2008Revenue 3,973,078 4,510,640
Operating profit (before exceptional items) 194,365 182,214
Operating profit 192,893 182,214
Operating margin (before exceptional items) 4.9% 4.0%
Earnings per ordinary share (US cents) (before exceptional items) 7.6 7.4
Earnings per ordinary share (US cents) 8.0 7.7
Operating profit(1)
$ million
0
50
100
150
200
0908070605
57
85
131
182 19
4
0
1
2
3
4
5
0908070605
2.1
2.8
3.5
4.0
4.9
0
2
4
6
8
0908070605
0.8
2.0
5.6
7.4 7.6
Operating margin(1)
Percent
Earnings per share(1)
US cents
Notes:(1) Before exceptional items. See reconciliation in Note 8 to the annual financial statements.(2) Before eliminating intercompany revenue and adjusted for the impact of currency movements.

4 Dimension Data Annual Report 2009
81%Systems Integration
4%Plessey
9%Express Data 6%
Internet Solutions
59%Product
41%Services
15%Professional services
26%Managedservices
Business overview
Systems Integration
The Group’s Systems Integration (SI) business comprises 81% of our Group revenue and provides solutions and services around core IT infrastructures, including the network, voice and data communications (incorporating telephony and video), data centres, contact centres, operating systems and business productivity applications.
We offer our clients a full lifecycle of IT services, drawing on the experience and expertise embedded in our Network Integration, Security Solutions, Data Centre and Storage Solutions, Converged Communications, Customer Interactive Solutions and Microsoft Solutions lines of business. Furthermore, we constantly seek to improve the performance of our clients’ IT infrastructures, ensuring our solutions are structured to deliver real business benefits, today and into the future.
The SI business has a well established multi-national footprint; we have a direct presence in 48 countries and we extend our services beyond that through our preferred partner programme. We are a leading Global Cisco Gold Partner and a Microsoft Gold Partner on five continents, which emphasises the value we put on strong collaborative relationships with the leaders in our industry.
The Group operates in the Information and Communications Technology (ICT)
industry. We are a recognised global leader in the provision and management of
specialist IT infrastructure solutions and services, where we seek to differentiate
through exceptional client service.
Businesses by revenue
Systems Integration Breakdown

Dimension Data Annual Report 2009 5
Build Support Improve InnovatePlan Manage
Implement
Technology
Break Fix
and Monitoring
Commercialisation
of New Ideas
Strategy and
Evolution
Identify Business
Benefits
Manage
Project Risk
To Reduce Costs InnovationJustify Technology
Investment
Full Lifecycle Support of
Infrastructure and Systems
To Maximise Return on Investment
Service Delivery
(Service Level, Availability, Capacity,
IT Service Continuity and Financial Management)
Service Support
(Release, Change, Problem, Incident and
Configuration Management)
IT Alignment
Service Benchmarking
Breakthrough Use of
Technology
Maintain
(Uptime)
Procure
Integrate
Deploy
Consult
Design
Monitor
Identify Business Benefits
Consult Design
Implement Product
ProcureDeploy
Integrate
Break Fix and Monitoring
Maintain Monitor
Full Lifecycle Support of Infrastructure and Systems
Service Delivery Service Support
Strategy and Evolution
IT Alignment Service
Benchmarking
Commercialisation of New Ideas
Breakthrough Use of
Technology
Lifecycle of services
We provide a full lifecycle of services to our clients, incorporating the professional services, product fulfilment and managed services that are required to deliver the optimum performance of their IT operations. The Services Continuum describes the lifecycle of services, incorporating six critical stages of service delivery.
Services Continuum
Our professional services incorporate the plan and build service functions, and range from high value consulting and assessment services to technical design and architecture through product deployment and integration. In addition, we ensure that we manage the global supply chain and logistics requirements for our clients around the world.
Our product procurement services are a key component of the Systems Integration business. Supported by long standing relationships with market leading vendors and world class logistical capabilities, we successfully procure product for clients across the globe.
Our managed services incorporate the support, manage, improve and innovate services functions and extend from pure maintenance services (including device moves, adds, changes and deletes, performance assessments and licence renewals) to more advanced services where we take responsibility for monitoring and managing our clients’ IT infrastructure.
At a maintenance level we offer our clients service level agreements, which is a value-added support. Our managed services are supported by our five Global Service Centres using our delivery platform, the Global Services Operating Architecture, which ensures that we deliver a consistent service to clients around the world.
The lines of business
To pursue the market opportunity from a technology perspective we have six lines of business, of which Network Integration is the largest and the core around which the Systems Integration business has been built. We have an extensive track record of implementing and managing some of the most complex Internet Protocol (IP) networking projects in the world. The network is increasingly accepted as a critical business platform and is at the heart of the communication and interaction that defines today’s business landscape. This line of business is centred on creating a secure, manageable and optimised infrastructure, incorporating the local and wide area network and wired and wireless technologies, and focuses on ensuring excellence in end user experience and network performance.
6 Dimension Data Annual Report 2009
The Converged Communications line of business helps clients integrate traditional communication tools, like telephony and email, with collaboration technologies, such as instant messaging and video conferencing, to provide new ways to communicate from any location, using any device and accessing any application.
The Microsoft Solutions line of business provides licencing solutions, professional services and managed services around five related areas: unified communications, collaboration, desktop and server infrastructure, systems management and software asset management. The business supports our unified communications offering through its ability to integrate and support core Microsoft productivity and desktop applications, including Exchange, Office Communication and SharePoint.
The Data Centre and Storage Solutions line of business provides services around the data centre, including storage, archiving, backup and recovery, virtualisation and consolidation.
Our Customer Interactive Solutions line of business designs and builds contact centre solutions, leveraging the experience and skills resident in Merchants, the Group’s outsourced contact centre business.
Finally, the Security Solutions line of business designs and supports security solutions across all of our clients’ IT infrastructure, helping them to minimise threats to IT assets ranging from information theft to malicious code and unauthorised access.
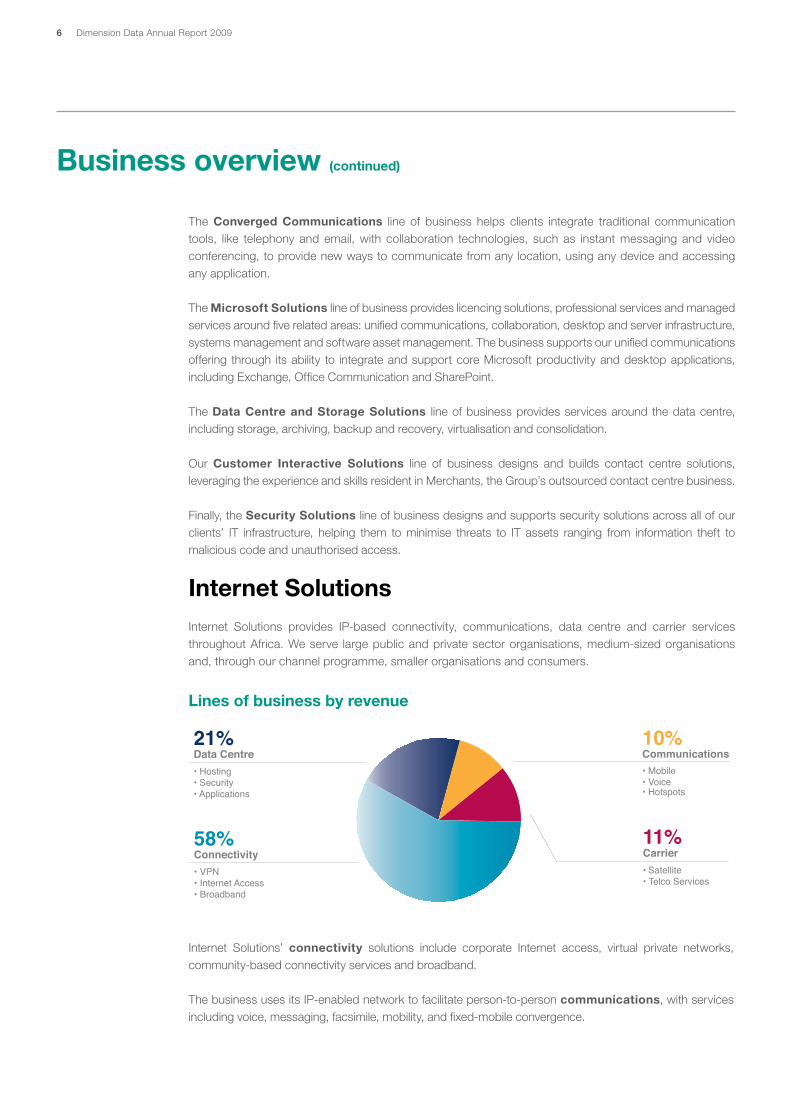
Internet SolutionsInternet Solutions provides IP-based connectivity, communications, data centre and carrier services throughout Africa. We serve large public and private sector organisations, medium-sized organisations and, through our channel programme, smaller organisations and consumers.
Business overview (continued)
58%Connectivity
10%Communications• Mobile• Voice• Hotspots
21%Data Centre• Hosting• Security• Applications
• VPN• Internet Access• Broadband
11%Carrier • Satellite• Telco Services
Lines of business by revenue
Internet Solutions’ connectivity solutions include corporate Internet access, virtual private networks, community-based connectivity services and broadband.
The business uses its IP-enabled network to facilitate person-to-person communications, with services including voice, messaging, facsimile, mobility, and fixed-mobile convergence.

Dimension Data Annual Report 2009 7
Our data centre services provide both physical computing infrastructure and applications in the cloud, primarily though the use of services such as lodging, hosting, and virtualisation of servers and storage.
Internet Solutions’ carrier offerings include the self-provision of physical connectivity services in cases where we are unable, through normal supplier relationships, to source these services at a competitive price or service level, or where attractive niche opportunities exist. Existing solutions include self-provisioning of wireless, satellite and local loop services and participation in undersea, national and metropolitan fibre networks.
PlesseyPlessey provides project management, engineering and logistical services to African telecommunications service providers. We have regional offices in 12 African countries from which we deliver a range of services, from core base station infrastructure to connectivity solutions.
Base station infrastructure solutions include the provision of civil works, equipment shelters, towers and masts, rectifier systems, generators, site electrification, solar systems and site fencing and security. These services ensure permanent uptime for service providers, particularly in regions where easy access to utilities can be challenging.
Plessey offers a number of connectivity solutions. Firstly, our broadband wireless solutions enable service providers to reach businesses and consumers in areas which are poorly serviced by fixed line networks. Secondly, we provide cable installation - both copper and fibre - for telecommunication network operators, as well as for water and power utility companies.
Plessey’s optical solutions are typically applied to transmission backbones and metro networks, although we also provide solutions for security monitoring, industrial control and highway communication. Finally, we offer broad geographic satellite coverage capabilities, particularly into remote areas where terrestrial networks are inadequate.
Express DataExpress Data is a distributor in Australia and New Zealand, distributing ICT technologies from a range of leading vendors. For many of these vendors, Express Data represents their largest channel to market in the region.
Express Data operates a world class distribution system and is recognised as a leader in networking infrastructure, unified communications, Software as a Service (SaaS), data centres, security, storage and server-centric computing. Typically, the technologies represented by Express Data are relatively complex to implement and support. This allows us to add value by managing the needs of the reseller channel at a lower cost than the vendors could achieve themselves. In addition, many resellers have migrated to a services led model in recent years, outsourcing more of the product fulfilment tasks to Express Data.
The rationale for vendors selling through the channel is further strengthened by the market trend away from capital expenditure towards utility based models. Here Express Data acts as an aggregator for the reseller channel, and provides billing, administration and collection services across multiple software and service providers.

8 Dimension Data Annual Report 2009
Scaling new heightsStanding at a commanding height of 165 metres, the Singapore Flyer – a giant observation wheel with 28 fixed, fully air-conditioned passenger capsules – is set to become one of Asia’s biggest iconic tourist attractions.
During the leisurely 30 minute ride, passengers on the Singapore Flyer are treated to a panoramic view of the city and the breathtaking sights of neighbouring Indonesian islands. In addition to the impressive hardware and awesome vista, the passengers enjoy an in-capsule, state-of-the-art audio and video entertainment system which plays continuously during the ride. This is linked to an advanced wireless local area network (WLAN) infrastructure for which the builder - Mitsubishi Heavy Industries (MHI) - turned to Datacraft to design, develop and install. The WLAN solution had to ensure a smooth
connection between the Flyer’s operation room, the IP phones and monitoring web cameras in each of the individual capsules.
However, the situation presented significant technical challenges. Typical WLAN deployments and signal strength propagation are horizontal in nature and due to the structure of the Singapore Flyer, normal methods to survey and implement the WLAN could not be used. Furthermore, the effective range of a typical WLAN network is 100m, which is insufficient to cover the entire observation wheel.
Datacraft’s ability to conceptualise a new technological idea and translate it into a reality was critical to the successful implementation of the Singapore Flyer project. Through detailed planning and evaluation, technical expertise and innovative project management, Datacraft succeeded in designing, developing and deploying a WLAN solution that is flexible, scalable and standards based. The WLAN deployment project on the Singapore Flyer marks the first time that any vendor has implemented a wireless solution for such a massive and continuously moving structure. As a result of the success, MHI is able to gain competitive advantage as the first manufacturer to build a fully functional landmark moving object.
Singapore
Systems Integration› Network Integration
Dimension Data’s solutions - changing the world as we know it

Dimension Data Annual Report 2009 9
Dimension Data delivered an excellent performance for financial year to September 2009 and continued to make good progress in its strategic journey towards becoming a world leader in the provision and management of specialist IT infrastructure solutions. The Group’s performance and progress are even more commendable given the severe recessionary environment of the past year, during which we saw significant falls in technology spend by governments and businesses around the world. Despite this, the Group has been able to meet its financial objectives - measured in constant currency terms revenues and profits have increased, the quality of revenue and returns have improved, and the balance sheet has continued to strengthen, ending the year with a cash balance of $600 million.
A number of key strengths within the Group have enabled us to continue to perform strongly, despite the underlying economic environment. Firstly, our geographic diversity and emerging market exposure have been important factors in our ability to grow revenues. Our Systems Integration (SI) business held up well despite the headwinds faced in the US and Asia, where a sharp slowdown in demand from our financial services, global and multinational clients took its toll. Slower growth in these regions was offset by strong growth in other regions, most notably Africa and Australia. In addition, overall Group revenues benefited from the strong performances in Express Data and Internet Solutions.
Integral to the Group’s success over the past year has been the ongoing execution of our services strategy. This strategy, which has centred on the Group’s evolution from IT infrastructure supplier to strategic IT partner, has enabled us to improve returns through increasing the value add in our offerings to clients. We have invested in executing on this strategy for a number of years now and in FY2009, it contributed to services revenue growth of 13.0%, which has substantially enhanced overall Group returns.
Finally, our financial strength has been reassuring to clients and vendors alike in an environment of immense economic uncertainty and has been a contributing factor to the market share gains that we have enjoyed over the past twelve months.
Jeremy Ord
Chairman
Chairman’s letter

10 Dimension Data Annual Report 2009
Chairman’s letter (continued)
To buffer the impact of the market slowdown, the Group adopted a conservative approach to the management of costs and acted quickly to cut costs in order to protect profitability in specific areas. Whilst we have been keenly focused on protecting short term performance we have continued to invest in areas which are important to the Group’s strategy, longer term positioning and growth prospects. Our working capital management has been strong, and when combined with the generation of healthy profits, has resulted in excellent cash generation for the year.
Dimension Data started paying dividends for the first time in the Group’s history in 2006 and over the past three years has balanced the need to invest in the business with our shareholders’ requirement for a cash yield on their investment. The strong growth that Dimension Data has delivered over the past three years, combined with the financial strength of the Group, has enabled us to increase the dividend payment by 70% over this period. For the FY2009 financial year the Board has proposed a dividend of 1.9 cents per share.
There are four cornerstones to the Group’s strategy: driving profitable growth, offering a world class client experience, delivering operational excellence and investing in our people and culture. I like to think of these strategies as the pillars that support the success of the Group; it is only through delivering on each of them that we will maintain our position at the forefront of our industry and continue to deliver superior returns to shareholders.
Dimension Data’s commitment to our four strategies is resonating with our clients, vendor partners, employees and shareholders. We continue to be encouraged by the progress that we are making, as measured by client retention and satisfaction rates, our share of their IT spend, our share of key vendor partners’ revenues, and the awards and accolades that we have won during the past twelve months. As part of the process of continually improving our market position, we monitor and benchmark our performance against both the industry and established best practice and work closely with our key vendor partners to deepen our understanding of their offerings, to ensure that we are able to deliver the solutions needed and demanded by our clients.
Our employees across the Group are aligned and incentivised to deliver on our strategies and we measure their success through Key Performance Indicators. Our people are the life force of our business and it is vital to acknowledge and thank the Dimension Data employees for their dedication in what has been a tough economic environment. Many of our employees are familiar with the

Dimension Data Annual Report 2009 11
machinations of economic downturns, most notably the IT industry downturn of the early 2000s, and therefore are well equipped in both experience and attitude to deal with adverse conditions. We are fortunate that our immediate industry has matured and lacks the excess capacity that made the last downturn so traumatic. Even so, our people’s dedication to operational excellence, delivering a superb client experience and protecting and developing the culture of the Group, has undoubtedly been a key factor in helping Dimension Data to continue to achieve its financial and strategic objectives.
In November 2008, we completed the buy out of the minority shareholders in Datacraft Asia, one of the leading IT services and solutions providers in Asia-Pacific. Dimension Data has held a majority stake in Datacraft Asia since 1997, during which time there has been an increasing alignment of the strategic and operating models of the two companies. As a result, no integration challenges or management changes arose following the completion of the transaction. Full ownership of Datacraft Asia has increased the Group’s exposure to attractive growth markets. Datacraft Asia’s position has been strengthened, providing it with the opportunity to leverage more effectively the resources of the wider Group and capitalise on opportunities in the market, with the result that returns in the year under review improved despite the tough trading environment.
In the year under review, the Board has remained unchanged and all committees have been reviewed and strengthened. Dorian Wharton-Hood, who has been a director of Dimension Data for nine years, will be retiring at the Annual General Meeting in February 2010. I would like to thank him for his dedicated service and invaluable advice over his time with the Group and wish him a very happy retirement.
I would also like to take this opportunity to thank our clients for their enduring loyalty to Dimension Data, our partners for continuing to collaborate and innovate with us and our employees for their unwavering commitment to excellence.
Jeremy OrdChairman
12 Dimension Data Annual Report 2009
Strategy
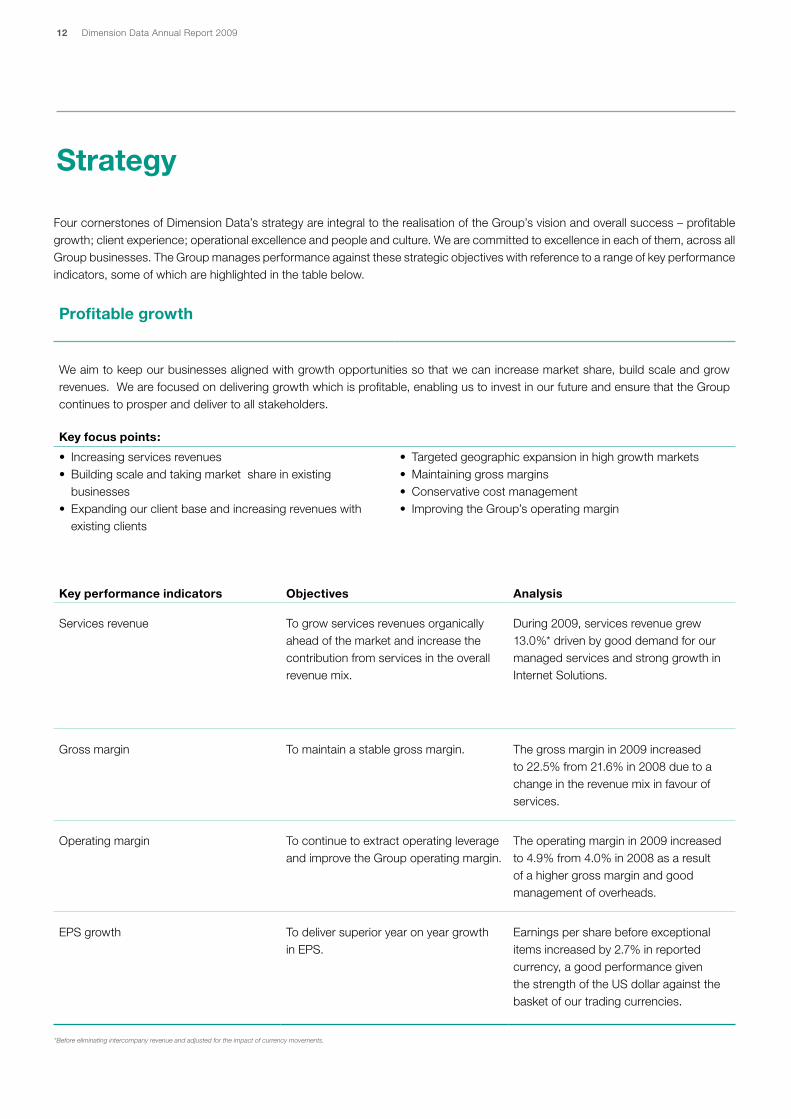
Four cornerstones of Dimension Data’s strategy are integral to the realisation of the Group’s vision and overall success – profitable growth; client experience; operational excellence and people and culture. We are committed to excellence in each of them, across all Group businesses. The Group manages performance against these strategic objectives with reference to a range of key performance indicators, some of which are highlighted in the table below.
Profitable growth
We aim to keep our businesses aligned with growth opportunities so that we can increase market share, build scale and grow revenues. We are focused on delivering growth which is profitable, enabling us to invest in our future and ensure that the Group continues to prosper and deliver to all stakeholders.
Key focus points:
• Increasingservicesrevenues• Buildingscaleandtakingmarketshareinexisting
businesses• Expandingourclientbaseandincreasingrevenueswith
existing clients
• Targetedgeographicexpansioninhighgrowthmarkets• Maintaininggrossmargins• Conservativecostmanagement• ImprovingtheGroup’soperatingmargin
Key performance indicators Objectives Analysis
Services revenue To grow services revenues organically ahead of the market and increase the contribution from services in the overall revenue mix.
During 2009, services revenue grew 13.0%* driven by good demand for our managed services and strong growth in Internet Solutions.
Gross margin To maintain a stable gross margin. The gross margin in 2009 increased to 22.5% from 21.6% in 2008 due to a change in the revenue mix in favour of services.
Operating margin To continue to extract operating leverage and improve the Group operating margin.
The operating margin in 2009 increased to 4.9% from 4.0% in 2008 as a result of a higher gross margin and good management of overheads.
EPSgrowth To deliver superior year on year growth inEPS.
Earningspersharebeforeexceptionalitems increased by 2.7% in reported currency, a good performance given the strength of the US dollar against the basket of our trading currencies.
*Before eliminating intercompany revenue and adjusted for the impact of currency movements.

Dimension Data Annual Report 2009 13
Client experience
We aim to deliver a world class client experience and to move the Group up the services value curve, from IT infrastructure supplier to strategic IT partner. This requires commitment to building long term client relationships, consistent quality delivery and an understanding of our client’s business requirements.
Operational excellence
We aim to ensure that we go to market with client centric offerings, that we have the technical skills to execute on our offerings, that our processes and systems are world class and that we ultimately meet or exceed client expectations.
People and culture
Our people and culture are of pivotal importance. By attracting, developing and retaining the right people and skills, we will be able to deliver a world class experience to our clients.
Key focus points Key performance indicators
• Demonstratingbusinessandtechnicalexpertise• Enhancingthequalityofdelivery• Meetingandexceedingclientexpectation• Fosteringclientintimacy
• Clientretentiontrends• Clientsatisfactiontrends• Managedservicescontractchurnrates• Servicesandlinesofbusinessperclient
Key focus points Key performance indicators
• Launchinganddrivingcompellingofferings• Improvinggo-to-marketeffectiveness• Maintainingworldclassoperationalprocessesandsystems
• Certificationlevelsandpartnerawards• Professionalservicesutilisationandrealisationrates• Dayssalesoutstanding• Inventorylevels
Key focus points Key performance indicators
• Attractingtherightpeople• Buildingcompetenciesanddevelopingourtalent• Fosteringacultureofexcellencethroughemphasison
the Group values of teamwork, commitment, professional excellence,proactivity,partnershipandmulti-culturalstrength
• Focusingoncareerdevelopment,succession,employeesatisfaction and retention
• Performancemanagement• Certificationstatisticsandtrends• Trainingspend• Employeesatisfactionratesandtrends• Employeeattrition

14 Dimension Data Annual Report 2009
Cutting edge technology for a cutting edge companyVirgin Media is a company for whom innovation comes as standard. In 2007 they became the first ‘quadplay’ media company in the United Kingdom, bringing together a service consisting of television, broadband, mobile and fixed-line telephone services. For a company at the forefront of ultrafast broadband and cutting edge entertainment solutions for UK home and businesses, it is to be expected that they would look to adopt a high definition video conferencing solution to enable them to enhance their business operations.
With regular calls and conferences with financial analysts and investors between London and New York, Virgin Media looked to implement an effective
video conferencing solution that would allow them to conduct these key business meetings as efficiently and effectively as possible.
Dimension Data implemented the TelePresence video conferencing solution to power a network of internal conference rooms in six locations across three countries. This solution provides Virgin Media with fully-fitted meeting rooms, high definition screens large enough to provide life-size images, lighting, speakers, microphones and cameras, and offers the interactivity, spontaneity and nuanced communications experience of an in-person meeting.
Above and beyond the immediate benefits to business operations, the solution has enabled Virgin Media to harness the productivity gains associated with having to spend less time travelling. An improved work/life balance and lower carbon footprint per employee meets their commitment to be a company people feel good about and really want to work for. In fact, Virgin Media have been so impressed by the TelePresence solution and its utilisation rates that they are now looking to expand video conferencing to their employee desktops, as well as using the solution to interoperate with their suppliers and partners.
United Kingdom
Systems Integration› Converged Communications
Dimension Data’s solutions - changing the world as we know it

Dimension Data Annual Report 2009 15
Chief Executive Officer’s review
In this review, growth rates are in relation to 2008 and are, unless otherwise indicated, calculated before
eliminating intercompany revenue and adjusted for the impact of currency movements (i.e. are constant
currency growth rates). Unless specifically indicated, exceptional items are excluded from the analysis.
Overview
The Group’s robust performance over the past financial year has resulted in improved returns and strong growth in profitability. Given the extremely challenging economic conditions that prevailed over the period we did well to report flat revenues overall in constant currency. Strong growth of 13.0% in services revenues drove an improvement in the gross margin and this, when combined with tight cost management, resulted in operating profit growth of 25.4%. The Group’s operating margin grew to 4.9%, an excellent increase on FY2008’s 4.0%. A further highlight of the results is good working capital management and strong cash generation, which resulted in a closing cash balance of $600 million.
Dimension Data’s strong financial results are testament to the ongoing progress with the Group’s profitable growth strategy, which was introduced in FY2005. The key elements of this strategy have been to grow revenues ahead of the market, to maintain gross margins and to reduce overheads as a percentage of revenues, thereby driving an improvement in the operating margin and profitability. Much progress has been made over the past four years. Over this period we have grown revenues ahead of the market, achieving a compound annual growth rate of 12.3%, our gross margin has moved up to 22.5% from 21.0%, costs as a percentage of revenues have reduced to 17.6% from 18.9% and operating profit has more than tripled to $194.4 million from $56.7 million in FY2005. The Group’s operating margin is now 4.9% compared to 2.1% in FY2005.
A key feature of the FY2009 results is the excellent growth in services revenues. This was driven primarily by 19.3% growth in managed services in our Systems Integration (SI) business and by revenue growth of 27.9% in Internet Solutions. Professional services revenues (within SI), which tend to be more closely correlated with product revenues, increased by a pleasing but more modest 2.3%. Growth in services revenues offset a decline of 7.5% in total product revenues, a commendable achievement in a tough market where demand was impacted by sharp cuts in capital expenditure in several of our traditional client segments.
Brett Dawson
Chief Executive Officer
20
21
22
23
0908070605
21.0 21
.1
21.5 21
.6
22.5
Gross marginPercent

16 Dimension Data Annual Report 2009
Chief Executive Officer’s review (continued)
At the first signs of the global slowdown affecting our business in late 2008, we moved quickly to counteract the impact of a slower demand environment by managing and cutting costs in specific areas where action was warranted, most notably in the US and Asia. These measures protected profitability and helped drive the operating leverage that the Group achieved during the year. Notwithstanding the significant focus on short term cost management, we have continued to invest in areas important to the Group’s longer term positioning and growth prospects.
We achieved good performances across the majority of the Group’s businesses. Our SI business, which accounts for 80.6% of total revenues, performed particularly well. The SI business strengthened its competitive position, successfully harnessing market trends from both a technology and client sourcing perspective. The SI business in particular benefited from strong growth in managed services which drove higher gross and operating margins for the Group.
Within the SI business, the Converged Communications, Security Solutions and Microsoft Solutions lines of business all delivered good growth as our clients embraced unified communications and focused on technologies which could optimise existing infrastructure and reduce costs. Growth in these areas compensated for a slowdown in Network Integration, Data Centre and Storage Solutions and Customer Interactive Solutions, following cuts and delays to more capital intensive projects.
Looking at our SI business from a regional perspective and in the context of an environment where product revenues came under enormous pressure, particularly in the US and Asia where product declined 34.5% and 23.7% respectively, it is gratifying to be able to report that all five regions delivered growth in services revenues, and that four out of five regions achieved significant operating profit expansion and improved operating margins. The performance of the Americas region started to show a recovery in the fourth quarter of the year. Strong operating leverage was achieved in the SI business following the mix driven improved gross margin and tight control over costs.
Internet Solutions performed well over the period, with outstanding revenue growth of 27.9%. The excellent performance was driven by a clear focus on protecting and growing Internet Solutions’ core connectivity and data centre based services whilst successfully building our competitive position in our newer communications and carrier services. Some pressure at the gross margin level was offset by cost efficiencies and operating leverage.
Plessey’s revenues declined marginally, impacted by the slow-down in capital expenditure and infrastructure rollouts by telecommunications service providers in Africa due to the prevailing economic conditions. Operating profit was impacted by some gross margin pressure and the increased overhead base introduced in FY2008 in order to secure future growth opportunities. In response to the market changes Plessey has adjusted its cost base.
Express Data strengthened its position as a premier value added distributor in Australia and New Zealand during the period. Revenue growth of 7.6% combined with stable margins and careful cost control resulted in strong expansion of operating profit.
We achieved good performances across the majority of the Group’s businesses. Our SI business, which accounts for 80.6% of total revenues, performed particularly well.

Dimension Data Annual Report 2009 17
Services progress
While Internet Solutions and Plessey have always been services-led businesses, Dimension Data’s focus over the years on transitioning the SI business to a services-led organisation has been a key contributor to success in building our client experience strategy, enhancing our brand, driving competitive differentiation and in delivering on the Group’s profitable growth strategy.
Our SI business journey
Over the past few years the SI business has made significant progress in evolving both its professional and annuity managed services offerings. Our professional service methodology and offerings have expanded significantly to include numerous assessment services, planning and design services, and implementation and consulting services. In our annuity services, our journey has been one of increasing our capabilities beyond basic maintenance towards offering clients true managed services where we pro-actively monitor and manage their IT assets and processes. During the period we also secured some encouraging wins in several geographies where we are taking responsibility for the management of our clients’ entire IT operations.
In FY2009 we continued to reap the benefits of our investment in services. Over the past four years the Group’s services revenues have grown by a compound annual growth rate of 17.3% and services revenues now represent 43.6% of Group revenue compared to 38.1% in FY2005.
Operational Excellence
Strategic ITPartner
Stra
tegi
c
Manage IT Operations
Managed services
Service led
Service attach
Technical expertise
Product fulfilmentIT Infrastructure
Supplier

18 Dimension Data Annual Report 2009
Chief Executive Officer’s review (continued)
Our clients
Continued focus on operational excellence remains a key tenet of the Group strategy around delivering a superior client experience, and during the year we were involved in multiple initiatives aimed at further enhancing this experience.
The key areas of client demand in FY2009 from a technology perspective have been around network optimisation, visual communications, IP telephony, virtualisation and consolidation of data centres and Windows 7 for Microsoft. Clients have focused on maintaining and optimising their existing IT infrastructure as capital budgets reduced. We have also benefited from a general trend towards standardisation and centralisation of IT to reduce costs and centralise control. This trend provides us with good managed services opportunities as multinational clients consolidate services suppliers and move to partners that can support multi-vendor technologies on a multinational basis.
Within our client segments, we experienced weakness in demand in our top 30 global clients, which make up 15% (18% in FY2008) of revenues, particularly in global financial services clients in North America and Asia. Financial services revenues overall were, nevertheless, relatively stable, with a strong performance in the regional and domestic financial services client base. We reacted to the slow-down in spend in our global client sector by broadening our exposure to clients in the large regional enterprise and commercial segments of the market where we saw relatively better opportunities.
The service provider vertical was quite resilient and our revenues increased due to our focus on services rather than technology fulfilment in this vertical. We have benefited from subcontracting opportunities in large service provider clients who have partnered with us to execute global contracts. We have also secured good business through partnering with second tier and mobile service providers.
The public sector vertical has been another area of focus and one in which we have performed well in FY2009. Our public sector business has been particularly strong in Australia and South Africa. We have also seen good contract wins across the Americas, Europe and Asia. We are planning further investment during FY2010 in this vertical across our regions.
People and culture
Dimension Data has always believed that our people and culture are key differentiators in the market and essential to the success of the Group. We work hard at cultivating a winning, high performance culture. The success of our efforts has been reflected in widespread recognition from industry leaders and the winning of a number of exceptional awards. These include the Australia and New Zealand Hewitt Best Employer for 2009 for Express Data, a ranking of 9th place in the Corporate Research Foundation’s 2009/2010 Best Employers in Middle East and Africa as well as 9th position for Datacraft India in Dataquest’s ‘Top 10 Best IT Employers in 2009’ award.
The total number of employees across the Group was 11,032 at year end which is flat on the prior year. Whilst our people and culture strategy is a key cornerstone of our Group strategy, it was necessary to respond to the prevailing economic environment during the year. Our approach was to take rapid action early in the year to reduce costs where necessary due to a reduced demand. In contrast, we also invested and sought to maximise opportunities for growth wherever possible. This dual approach resulted in head count reductions in some geographies and businesses, and growth in others.
We work hard at cultivating a winning, high performance culture. The success of our efforts has been reflected in widespread recognition from industry leaders and the winning of a number of exceptional awards.

Dimension Data Annual Report 2009 19
In addition, we invested in building people strength during the course of the year, adding to our Microsoft skills organically and through the Teksys acquisition, and increasing head count in Internet Solutions and our SI business through acquisitions in Angola, Mozambique and Australia.
During the year the Group made a number of investments in enabling, developing and retaining excellence in our people. We deployed Leading Talent, a tailored programme for all line managers aimed at further developing our key leaders in the Group. We continued to drive the Dimension Data Job Framework project, which helps employees identify and plot their optimal career paths. With the recent stabilisation that we have seen in some of our end markets and in anticipation of some growth in FY2010, we are once again looking at modest additions to our key technical and sales skills in select areas of the business.
Partners
The Group enjoys unrivalled relationships with our key vendor partners. These have strengthened over the past year as we have continued to work closely with and invest in keeping our go-to-market strategies aligned. Key differentiators for Dimension Data are the breadth of technical talent within the Group and its unparalleled ability to execute with multiple partners.
Dimension Data received a record number of awards and accolades over the past year, which are testament to our partners’ recognition of the breadth of the Group’s technical skills and experience. Key awards included Cisco Technology Excellence Partner along with 19 other Cisco awards, and Microsoft Global Partner of the Year in the three categories. In addition, we won awards from HP, Avaya, Tandberg, VMWare, BlueCoat, McAfee, Symantec, EMC, RSA and Nuance. Dimension Data achieved 21st place in Business Week’s Info Tech 100 list, which recognises top-performing technology companies across the globe.
Investing for growth
Dimension Data’s healthy balance sheet, strong cash balance and excellent cash generating abilities, enable the Group to continue to invest to position the business for long term growth.
The continued execution of our services strategy will be a priority for our SI business. We have made tremendous progress over the past few years and are excited about our prospects as we continue the journey. During the year we embarked upon a services acceleration programme with five key projects aimed at further enhancing our global services offerings. We will continue to invest in systems, processes and people to enhance our services offerings for our clients and improve our execution capabilities.
Our regional SI businesses are at varying levels of maturity along our services led strategy and we still have a way to go before our objective of offering a full lifecycle of services in all geographies is realised. It is however, clear to us that our services strategy is working and that we are on track to derive further benefits from its ongoing implementation in the years ahead.
We constantly seek to align our go-to-market offerings with current and upcoming market trends, to ensure that we offer our clients solutions relevant to their business issues. From a technology market trend perspective, we will look to invest further in our capabilities and offerings in the network (as the core business infrastructure enabler),

20 Dimension Data Annual Report 2009
unified communications and collaboration (including visual technologies) and virtualisation. For medium term opportunities we will be expanding our competence in cloud and service based infrastructure models.
Internet Solutions is well positioned to benefit from market trends, and to build on the strong market position established over the years. Internet Solutions was awarded two telecommunications licences in South Africa which provide additional market opportunity. We have also embarked upon the application process to acquire licensed wireless spectrum, which would enable us to connect to our clients using both fixed and wireless links.
We will continue to invest in Internet Solutions to secure our desired positioning as Africa’s leading internet-technology based service provider, offering a superior customer service experience. Our strategic priorities are, firstly, to invest in the required people, processes and capital expenditure required to secure the growth opportunity. We will also invest to enhance the customer service experience and we will expand our existing services offerings. Finally, we will continue to invest to secure lower input costs, such as our acquisition this year of local fibre capacity to service our clients, and our commitment during the year to a new submarine cable bringing enhanced bandwidth capacity to the continent.
The Group’s profitable growth strategy will largely be driven by organic growth in existing markets. We still have significant opportunity to increase our market share in existing geographies and we intend to expand into several cities in Brazil and China next year. We will, in addition, target two types of acquisitions - the first to expand our footprint and the second where we need additional skills to enhance the Group’s IP and hasten our route to market.
In addition to the purchase of the minority shareholding in Datacraft Asia, we made a few small acquisitions during the year. In Africa, we completed an acquisition in Mozambique and are currently in the process of completing two further acquisitions whereby we will be expanding our capability and presence in Angola and Morocco.
In November 2008 we made a strategic investment in Bluefire, a Sydney based IT services company which provides Infrastructure as a Service (IaaS) services. In February 2009 we purchased Teksys, a UK based Microsoft infrastructure and licencing services business which has given us scale and Large Account Reseller status in Europe.
Outlook
A key factor behind the resilience that Dimension Data has shown in the face of the challenging economic environment is the Group’s high performance culture, one in which our people are consistently encouraged to maximise opportunity whatever the prevailing market conditions. In addition, our chosen positioning in the global Information Technology market and the execution of our strategy have been successful.
We believe that Dimension Data is positioned in the sweet spot of IT and communications spend, and that the trends that have been driving superior growth in the Group over the past few years, have the momentum to continue to drive growth into the medium and longer term. Our network centric offerings are vital for our clients to be able to operate effectively in today’s IP and convergence powered environment, where the network is increasingly the core platform for all forms of IT and telecommunications. Our strengthening position in areas such as unified communications, collaboration, virtualisation and managed services position us for medium term growth. In the longer term, market developments such as cloud computing and services based models such as IaaS, provide additional opportunities for growth.
Chief Executive Officer’s review (continued)
We believe that Dimension Data is positioned in the sweet spot of IT and communications spend.

Dimension Data Annual Report 2009 21
The opportunity to deliver on Dimension Data’s profitable growth strategy, which is premised on both growth and leverage, lies across all our businesses. The opportunity to drive the SI margin higher lies in four factors. The first of these is the ongoing effective rollout of our services strategy; the second lies in harnessing the benefits of additional scale in a number of key markets; the third involves securing additional efficiency improvements; and the fourth relates to recovery in a few under-performing geographies. The low working capital requirements of the SI business make its return on assets the highest of all of the Group’s businesses.
We are optimistic that the ongoing deregulation of the telecommunications market in South Africa and the growth opportunities on the African continent will provide significant opportunities for Internet Solutions.
Plessey is well placed to benefit from the opening up of the African continent to growth in telecommunication services and we remain confident that the business has attractive medium term growth prospects. Express Data is a premier value added distributor with solid prospects.
We are encouraged by the recent stabilisation in our end markets, however much uncertainty remains over the resilience of the global recovery. We anticipate that the market segments in which Dimension Data operates will perform better in FY2010 and that the Group will be able to deliver modest constant currency revenue growth. Dimension Data is well placed to capitalise on long term market trends. Growth in excess of prevailing market rates and medium term operating leverage remain our key financial objectives.
Brett DawsonChief Executive Officer
The opportunity to deliver on Dimension Data’s profitable growth strategy, which is premised on both growth and leverage, lies across all our businesses.

22 Dimension Data Annual Report 200922 Dimension Data Annual Report 2009
Delivering quality care servicesBlue Care, an agency of UnitingCare, employs over 9,800 staff and consists of more than 260 care centres across Queensland and northern New South Wales. Blue Care staff and volunteers provide care for more than 12,500 people every day through nursing, allied health, personal care, domestic assistance, respite, social support, pastoral and volunteer services.
In order to execute on its strategic objectives and exploit competitive advantages, Blue Care identified in 2008 that it would need to invest and develop its capabilities over a three year period. Part of this capability is the establishment and operation of core systems that support the objectives of Blue Care’s business at an enterprise level, with common applications rolled out organisation-wide.
Dimension Data has deployed a second data centre to support the rollout of common applications, as well as providing Blue Care with enhanced disaster recovery capabilities.
To undergo this transformation Blue Care required a different suite of skills and expertise to that which it had available in-house. To meet this requirement Blue Care signed a five year managed services contract with Dimension Data in November 2008 that combines both ongoing support for Blue Care’s existing IT infrastructure, as well as the requirement to identify opportunities and establish a programme of works for IT service level enhancement over the next two to three years.
Blue Care’s existing IT skill base will continue to support front-line care delivery, IT strategy and new capability delivery, while Dimension Data will provide operating service support to manage Blue Care’s data centre, network, email services and end user devices.
Prior to signing the managed services contract Dimension Data was engaged to provide a range of products and services aimed at strengthening Blue Care’s IT backbone including enterprise system management, SQL database consolidation, hierarchical storage management and server virtualisation.
More recently, we were able to devise a solution to achieve the best possible outcomes as Blue Care moved to a new Microsoft Enterprise Agreement for software licencing.
Australia
Dimension Data’s solutions - changing the world as we know it
Systems Integration› Network Integration
› Converged Communications
› Microsoft Solutions
› Data Centre and Storage Solutions
› Customer Interactive Solutions
› Security Solutions

Dimension Data Annual Report 2009 23
In this review, growth rates are in relation to 2008 and are, unless otherwise indicated, calculated before
eliminating intercompany revenue and adjusted for the impact of currency movements (i.e. are constant
currency growth rates). Unless specifically indicated, exceptional items are excluded from the analysis.
Revenue for the year was $4.0 billion, a constant currency increase of 0.4% on 2008. The Group’s reported results were impacted by the appreciation in the average exchange rate for the year of the US dollar against most of the local currencies in which the Group trades, resulting in a decline in reported currency revenues of 11.9%. Product revenues in constant currency were down by 7.5%, while services revenues grew by 13.0%. The major contributor to this services growth was 19.3% growth in managed services in the Systems Integration business and 27.9% growth in Internet Solutions.
Product margins were firm, while services margins reduced slightly reflecting some margin pressure in Internet Solutions and a weaker performance from Plessey. The excellent growth in services revenues (accompanied by higher gross margins than product) resulted in a 0.9% expansion in the Group’s overall blended gross margin to 22.5%. Gross profit expanded by 4.8% to $892.8 million.
Overheads of $698.5 million were flat on 2008 (up by 0.2%). The Group’s cost base was carefully managed over the period, with prioritisation given to revenue generation and client support. Discretionary spend was reduced, while strategic projects, such as the rollout of the upgraded Global Services Operating Architecture (GSOA) platform, continued to receive focus and investment. Furthermore, investments made in technologies such as video conferencing and integrated collaboration reduced travel and associated costs. Although Group head count did not reduce as a whole, there were targeted head count reductions where appropriate.
This cost containment, coupled with the growth in gross profit, meant continued operating leverage for the Group, and a 0.9% expansion in the Group’s operating margin to 4.9% for the period. Operating profit increased by 25.4% to $194.4 million.
Chief Financial Officer’s review
Dave Sherriffs
Chief Financial Officer
The major contributor to this services growth was 19.3% growth in managed services in the Systems Integration business and 27.9% growth in Internet Solutions.
24 Dimension Data Annual Report 2009
Chief Financial Officer’s review (continued)
The share of results from associates increased to $7.8 million for the period (2008: $7.1 million). Interest and investment income was $8.1 million (2008: $17.5 million) mainly as a result of much reduced interest rates during the period, and finance costs were $29.9 million (2008: $31.0 million).
Property revaluation and other gains and losses include a gain on revaluation of the investment portion of the Campus property asset of $4.5 million (2008: $8.5 million).
The effective tax rate, excluding exceptional items, was 26.7% (2008: 25.9%). The Group recorded an $11.0 million exceptional tax credit (and a $1.5 million exceptional operating expense) flowing from the restructuring of the funding facility associated with the Campus land and buildings in South Africa.
Earnings per share before exceptional items were 7.6 cents, compared to 7.4 cents last year.
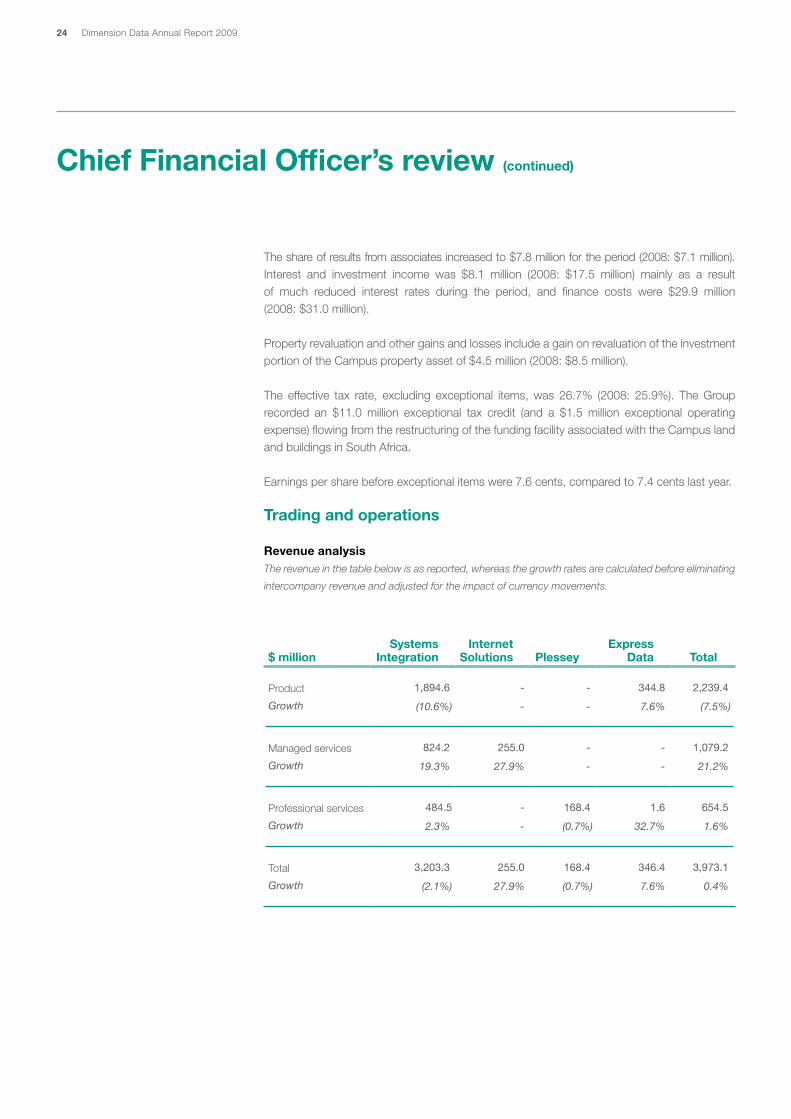
Trading and operations
Revenue analysisThe revenue in the table below is as reported, whereas the growth rates are calculated before eliminating
intercompany revenue and adjusted for the impact of currency movements.
$ millionSystems
IntegrationInternet
Solutions PlesseyExpress
Data Total
Product 1,894.6 - - 344.8 2,239.4
Growth (10.6%) - - 7.6% (7.5%)
Managed services 824.2 255.0 - - 1,079.2
Growth 19.3% 27.9% - - 21.2%
Professional services 484.5 - 168.4 1.6 654.5
Growth 2.3% - (0.7%) 32.7% 1.6%
Total 3,203.3 255.0 168.4 346.4 3,973.1
Growth (2.1%) 27.9% (0.7%) 7.6% 0.4%

Dimension Data Annual Report 2009 25
Systems Integration
Revenue streams (SI)Product revenues reduced by 10.6%, reflecting general caution in purchasing decisions as our clients elected to defer discretionary expenditure. The Americas were most severely impacted with product revenues down by 29.2%, as multinational corporation clients in general, and financial services industry clients in particular, reduced spend. Asia’s product revenues were similarly impacted, down by 23.7%.
Managed services grew by 19.3%. This excellent performance highlights the strength of our Uptime branded maintenance and support service, as well as our global focus on delivery excellence. Growth was supported by our clients’ focus on rationalising their own sourcing strategies, including the aggregation of support partners (particularly on a multinational level) and in selectively out-tasking IT functions.
Professional services (PS) revenues grew by 2.3%. This was a pleasing performance, with growth coming despite the fact that some components of PS revenues are highly correlated to product revenues.
The change in mix in revenues in favour of higher margin managed services meant gross margin expansion and - combined with good cost containment described elsewhere - strong operating leverage for the SI business.
Lines of business (SI)In the largest line of business, Network Integration, revenues declined by 8% driven mainly by a reduction in Asian and North American product revenues as a result of exposure to multinational corporations and financial services clients. In Middle East and Africa and Australia however, product revenues performed well due to demand for performance optimisation, wireless and mobility services. Services revenues showed good growth overall, led by a strong performance from managed services and this ensured a robust gross profit performance for this line of business.
Continuing strong demand for IP telephony and visual communications ensured growth of 9% in our Converged Communications line of business. Both product and services showed growth with managed services being the best performer as clients sought to outsource the management of the associated infrastructures to specialist providers.
The Microsoft Solutions line of business grew revenues by 28% or, excluding the impact of the Teksys acquisition in the UK, by 8%. Growth was supported by good license revenues in Australia and South Africa and solid demand for our consulting and deployment offerings in all regions as clients sought to exploit their existing investments in Microsoft technologies during times of budgetary cuts.
The change in mix in revenues in favour of higher margin managed services meant gross margin expansion and - combined with good cost containment described elsewhere - strong operating leverage for the SI business.
26 Dimension Data Annual Report 2009
Chief Financial Officer’s review (continued)
Data Centre and Storage Solutions declined by 6%, largely due to much lower revenues in North America. Elsewhere, the business performed well, with strong services growth supporting gross profit expansion. The growth in these regions was driven mainly by ongoing demand for server virtualisation and increased demand for Cisco UCS solutions.
We experienced a 15% decline in our Customer Interactive Solutions line of business, as organisations worldwide delayed large capital expenditure projects, impacting demand for our call centre solutions. Nonetheless, Merchants grew revenues by benefiting from wins in South Africa during the year, and improved traction associated with its hosted call centre technology solutions in the UK.
Security Solutions revenues increased by 5%. While traditional network security products declined in sync with network product revenues, we saw good growth in advanced security revenues. This growth supports our focus on building a multi-vendor capability, positioning us well to support organisations looking to consolidate complex vendor relationships in the security environment.
Internet Solutions
Internet Solutions revenues grew by 27.9%, reflecting ongoing demand across the business’s range of services. Growth in internet access, in virtual private networks, in voice traffic (‘Voice over Internet Solutions’) and in hosting services was particularly strong. Gross margins remained under pressure in a very competitive environment, with the stronger US dollar also adding pressure to input costs. The business continued to focus on operational efficiencies – for example the centralisation of its client services centre.
In January 2009, Internet Solutions was awarded two telecommunications licences allowing it to self-provide telecommunications infrastructure services in competition with incumbent operators. Internet Solutions can now, in circumstances where it makes commercial sense, build its own network. In response, we have commenced rolling out some fibre access for our top clients.
During the course of the year, Internet Solutions invested in the new Seacom undersea cable which provides enhanced international bandwidth capacity to the continent, connecting South Africa, Mozambique, Tanzania, Uganda and Kenya to Europe via an undersea fibre optic system. We acquired 16 STM1s from Seacom for $24.7 million, of which $14.3 million was paid this year with the balance due over the next two years.
During the year, Internet Solutions announced the acquisition of a 38.5% equity stake in Intra, a Mozambique based ISP, in partnership with Convergence Wireless Networks, providing an excellent base from which to deliver services to various landlocked East African countries. This acquisition will also enable us to leverage our investment in the Seacom cable.
Internet Solutions revenues grew by 27.9%, reflecting ongoing demand across the business’s range of services.

Dimension Data Annual Report 2009 27
Plessey
Plessey had a difficult year, with flat revenues accompanied by some gross margin pressure. Plessey’s primary client base is African telecommunications service providers and the global financial crisis led to a downturn in capital expenditure with network roll outs being delayed or cut back, and margins coming under pressure. This also led to a change in the way our clients are procuring, with network sharing, outsourcing and managed services becoming much more prevalent. Furthermore, merger and acquisition activity led to a reduction in spend by some of our clients during the period. However, the medium term prospects for mobile infrastructure rollout in Africa remain firmly in place.
In South Africa, the deregulation in the telecommunications market led to an increase in demand for fibre deployment services. In anticipation of this deregulation, Plessey invested in its fibre rollout capability, entrenching its position as the premier African provider of end to end fibre deployment. Plessey was awarded the contract to lay the first route of the MTN/Neotel National Long Distance (NLD) fibre network from KwaZulu-Natal to Gauteng, a total of 592km.
Express Data
Express Data grew revenues by 7.6%. This growth, in the face of the effects on the Australian ICT sector of the economic slowdown, was achieved through market share growth, as well as the extension of Express Data’s product range through the addition of some new vendor lines. Despite competitive pressures and exchange rate volatility, the business managed to maintain gross margin levels through value differentiation, and managing its product and customer mix. Express Data’s position within the market was acknowledged during the year with various industry awards.

28 Dimension Data Annual Report 2009
Americas Asia (trading as Datacraft) Australia
• ReduceddemandfrommultinationalandfinancialservicesclientsintheUS
• StrongrevenuegrowthfromBrazilandMexico
• Goodperformancefrommanagedservices
• Reduceddemandfrommultinationalandfinancialservicesclients
• Excellentmanagedservicesgrowth• Focusoncostmanagementensuredstrongexpansioninoperatingmargin
• GoodrevenuegrowthinSystemsIntegrationandExpressData
• Excellentmanagedservicesgrowth• Expansioninoperatingprofitfor theyear*
Revenue
$528.2mNumber of employees
833Operating countriesBrazil,Canada,Mexico
andUnitedStates
Revenue
$605.6mNumber of employees
1,473Operating countriesChina,HongKong,India,Indonesia,
Japan,Malaysia,NewZealand,Philippines,
Singapore,SouthKorea,Taiwan,Thailand
andVietnam
Revenue
$846.1mNumber of employees
1,551Operating countriesAustraliaandNewZealand
Our regional operations
Growth % 2009 2008
Revenue (22.4%) 528,177 686,393
Product (29.2%) 377,123 536,385
Services 1.2% 151,054 150,008
Grossmargin 17.9% 16.8%
Operatingprofit 5,473 19,570
Operatingmargin 1.0% 2.9%
Growth % 2009 2008
Revenue (10.5%) 605,630 719,601
Product (23.7%) 353,752 488,409
Services 18.5% 251,878 231,192
Grossmargin 22.1% 18.5%
Operatingprofit 52,984 44,203
Operatingmargin 8.7% 6.1%
Growth % 2009 2008
Revenue 8.8% 846,058 974,035
Product 9.6% 644,746 731,352
Services 5.9% 201,312 242,683
Grossmargin 18.5% 18.5%
Operatingprofit 39,664 40,376
Operatingmargin 4.7% 4.1%
*Adjusted for the impact of currency movements.
Dimension Data Annual Report 2009 29
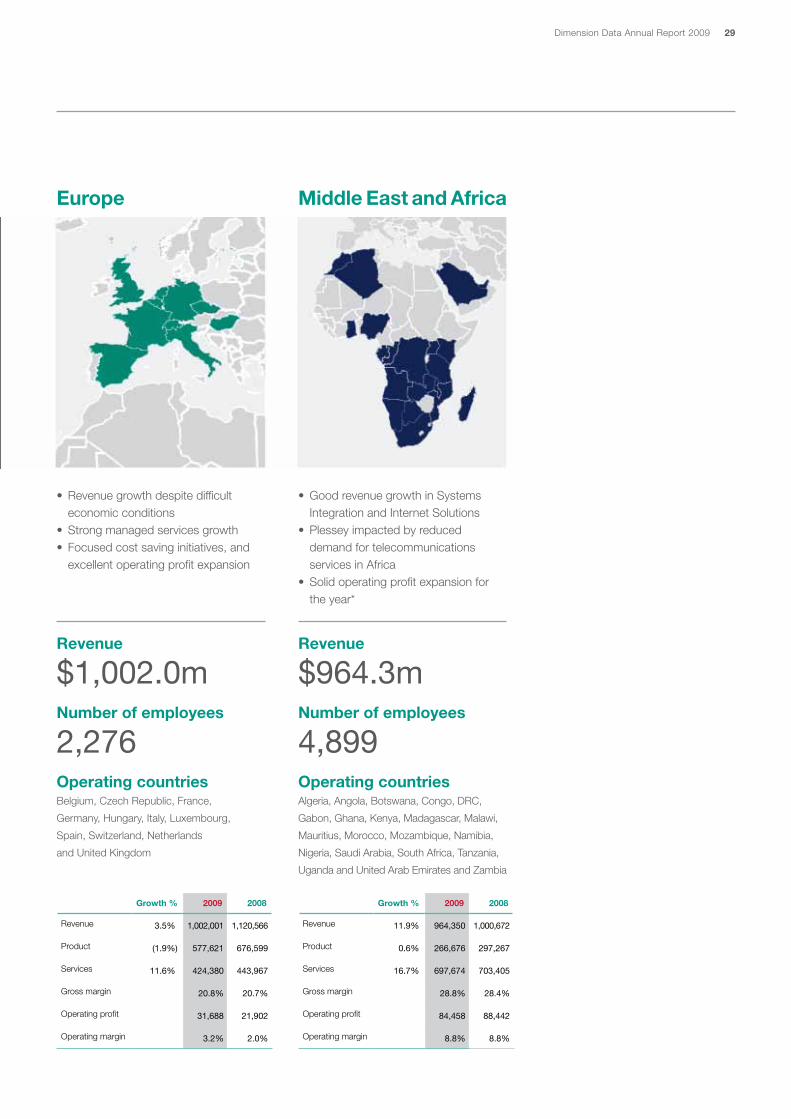
Europe Middle East and Africa
• Revenuegrowthdespitedifficulteconomicconditions
• Strongmanagedservicesgrowth• Focusedcostsavinginitiatives,andexcellentoperatingprofitexpansion
• GoodrevenuegrowthinSystemsIntegrationandInternetSolutions
• PlesseyimpactedbyreduceddemandfortelecommunicationsservicesinAfrica
• Solidoperatingprofitexpansionfortheyear*
Revenue
$1,002.0mNumber of employees
2,276Operating countriesBelgium,CzechRepublic,France,
Germany,Hungary,Italy,Luxembourg,
Spain,Switzerland,Netherlands
andUnitedKingdom
Revenue
$964.3mNumber of employees
4,899Operating countriesAlgeria,Angola,Botswana,Congo,DRC,
Gabon,Ghana,Kenya,Madagascar,Malawi,
Mauritius,Morocco,Mozambique,Namibia,
Nigeria,SaudiArabia,SouthAfrica,Tanzania,
UgandaandUnitedArabEmiratesandZambia
Growth % 2009 2008
Revenue 3.5% 1,002,001 1,120,566
Product (1.9%) 577,621 676,599
Services 11.6% 424,380 443,967
Grossmargin 20.8% 20.7%
Operatingprofit 31,688 21,902
Operatingmargin 3.2% 2.0%
Growth % 2009 2008
Revenue 11.9% 964,350 1,000,672
Product 0.6% 266,676 297,267
Services 16.7% 697,674 703,405
Grossmargin 28.8% 28.4%
Operatingprofit 84,458 88,442
Operatingmargin 8.8% 8.8%
30 Dimension Data Annual Report 2009
Chief Financial Officer’s review (continued)
Regional performance
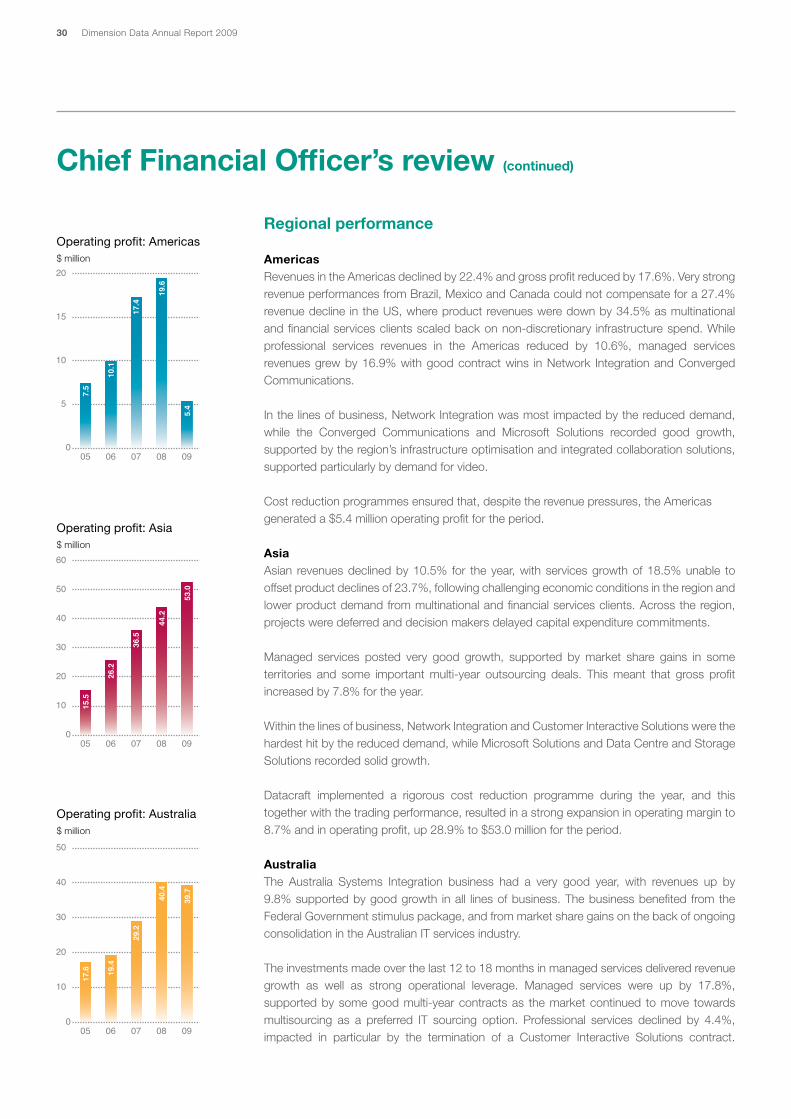
AmericasRevenues in the Americas declined by 22.4% and gross profit reduced by 17.6%. Very strong revenue performances from Brazil, Mexico and Canada could not compensate for a 27.4% revenue decline in the US, where product revenues were down by 34.5% as multinational and financial services clients scaled back on non-discretionary infrastructure spend. While professional services revenues in the Americas reduced by 10.6%, managed services revenues grew by 16.9% with good contract wins in Network Integration and Converged Communications.
In the lines of business, Network Integration was most impacted by the reduced demand, while the Converged Communications and Microsoft Solutions recorded good growth, supported by the region’s infrastructure optimisation and integrated collaboration solutions, supported particularly by demand for video.
Cost reduction programmes ensured that, despite the revenue pressures, the Americas generated a $5.4 million operating profit for the period.
AsiaAsian revenues declined by 10.5% for the year, with services growth of 18.5% unable to offset product declines of 23.7%, following challenging economic conditions in the region and lower product demand from multinational and financial services clients. Across the region, projects were deferred and decision makers delayed capital expenditure commitments.
Managed services posted very good growth, supported by market share gains in some territories and some important multi-year outsourcing deals. This meant that gross profit increased by 7.8% for the year.
Within the lines of business, Network Integration and Customer Interactive Solutions were the hardest hit by the reduced demand, while Microsoft Solutions and Data Centre and Storage Solutions recorded solid growth.
Datacraft implemented a rigorous cost reduction programme during the year, and this together with the trading performance, resulted in a strong expansion in operating margin to 8.7% and in operating profit, up 28.9% to $53.0 million for the period.
AustraliaThe Australia Systems Integration business had a very good year, with revenues up by 9.8% supported by good growth in all lines of business. The business benefited from the Federal Government stimulus package, and from market share gains on the back of ongoing consolidation in the Australian IT services industry.
The investments made over the last 12 to 18 months in managed services delivered revenue growth as well as strong operational leverage. Managed services were up by 17.8%, supported by some good multi-year contracts as the market continued to move towards multisourcing as a preferred IT sourcing option. Professional services declined by 4.4%, impacted in particular by the termination of a Customer Interactive Solutions contract.
Operating profit: Australia$ million
0
10
20
30
40
50
0908070605
17.6 19
.4
29.2
40.4
39.7
Operating profit: Asia$ million
0
10
20
30
40
50
60
0908070605
15.5
26.2
36.5
44.2
53.0
Operating profit: Americas$ million
0
5
10
15
20
0908070605
7.5
10.1
17.4
19.6
5.4

Dimension Data Annual Report 2009 31
During the period, the business took a majority shareholding in Bluefire, a company specialising in hosted infrastructure management, or Infrastructure as a Service (IaaS).
This trading performance, together with good cost management, meant that the business, together with Express Data, grew operating profit for the year by 23.6% to $39.7 million.
EuropeIn the face of challenging economic conditions, our European business recorded an excellent performance for the year, with revenue growth of 3.5%. Managed services were up by 18.0%, reflecting a focus on contract renewal and solutions delivery operational efficiencies for our clients. Product was down by 1.9% and professional services up by 1.3%.
Focused cost saving initiatives bore fruit across the region. These initiatives included the adoption of workflow systems and integrated working practices, and the extensive use of our internal unified communications infrastructure and visual communications facilities.
As a result, Europe’s operating profit expanded by 64.5% to $31.7 million, and operating margin increased to 3.2%.
During the period, we acquired Teksys, a UK based Microsoft solutions and services provider, which will support the region’s ability to provide Microsoft solutions on a pan-European basis.
Middle East and AfricaThe Middle East and Africa Systems Integration business had a very good year, with revenues up by 8.8%. Product revenues grew by 0.6 %, with declines in South Africa supported by growth in Emerging Africa. In South Africa, muted private sector demand (in particular the financial services and mining sectors) was offset by public sector demand for infrastructure investment generally and in particular in anticipation of the 2010 FIFA World Cup. Services revenues were up by 18.4%, supported in particular by very strong managed services.
Within the lines of business, Network Integration, Converged Communications and Microsoft Solutions all recorded growth. Teamsource, Middle East and Africa’s outsourcing business, had an excellent year recording some significant contract wins and contract renewals. The Advanced Infrastructure business, which offers cabling, data centre infrastructure, wireless connectivity, portable facilities and physical security solutions also recorded a very good performance, on the back of infrastructure roll out for the World Cup. Together with Plessey and Internet Solutions, the region grew operating profit by 12.9% to $84.5 million.
Operating profit: Europe$ million
Operating profit: Middle East and Africa$ million
0
5
10
15
20
25
30
35
0908070605
14.8
1.5
8.5
21.9
31.7
0
20
40
60
80
100
0908070605
43.4 49
.4
70.9
88.4
84.5
32 Dimension Data Annual Report 2009
Chief Financial Officer’s review (continued)
Central and OtherCostsCentral management costs, net of central trading income, reduced from $47.6 million to $35.2 million. This reflected several factors: firstly the benefits of local currency weakness, particularly the Rand in which a significant portion of the Group’s central costs are incurred; secondly reduced bonus provisions and other accruals at period end, and finally a sharp focus on cost management at Group level during the period. We continued to invest centrally in our core strategic initiatives, including in lines of business and in the development of the Group’s services offerings.
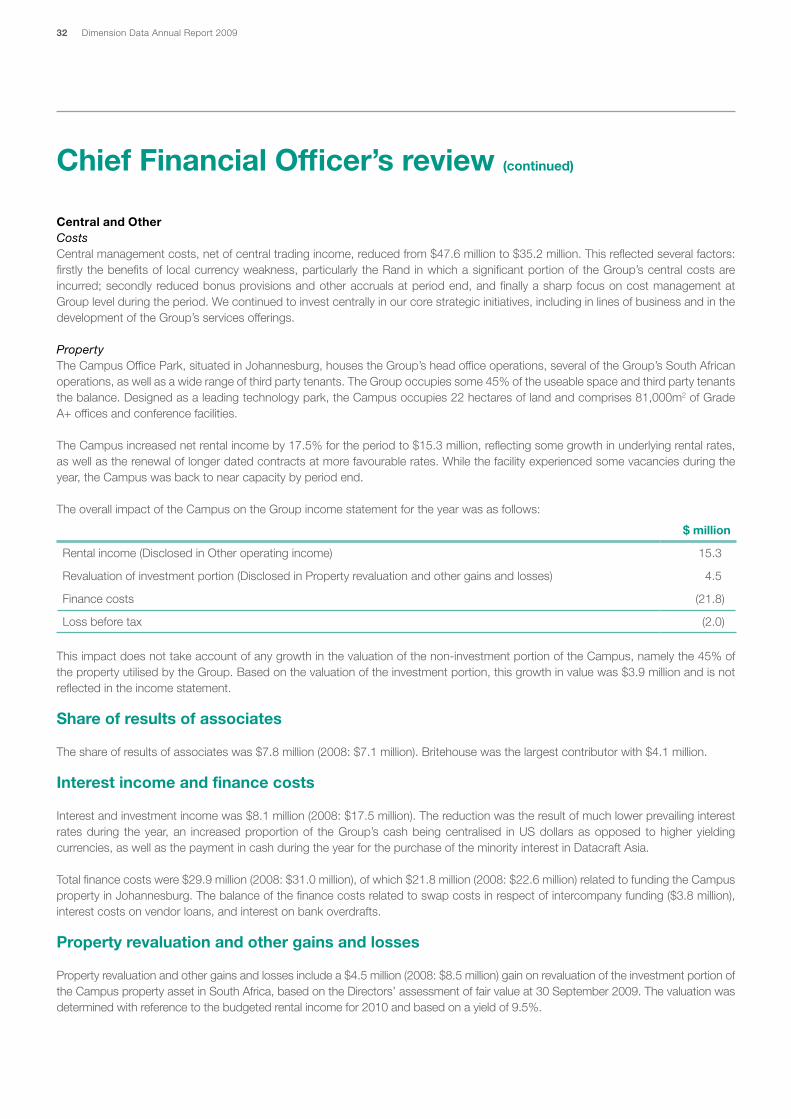
PropertyThe Campus Office Park, situated in Johannesburg, houses the Group’s head office operations, several of the Group’s South African operations, as well as a wide range of third party tenants. The Group occupies some 45% of the useable space and third party tenants the balance. Designed as a leading technology park, the Campus occupies 22 hectares of land and comprises 81,000m2 of Grade A+ offices and conference facilities.
The Campus increased net rental income by 17.5% for the period to $15.3 million, reflecting some growth in underlying rental rates, as well as the renewal of longer dated contracts at more favourable rates. While the facility experienced some vacancies during the year, the Campus was back to near capacity by period end.
The overall impact of the Campus on the Group income statement for the year was as follows:
$ million
Rental income (Disclosed in Other operating income) 15.3
Revaluation of investment portion (Disclosed in Property revaluation and other gains and losses) 4.5
Finance costs (21.8)
Loss before tax (2.0)
This impact does not take account of any growth in the valuation of the non-investment portion of the Campus, namely the 45% of the property utilised by the Group. Based on the valuation of the investment portion, this growth in value was $3.9 million and is not reflected in the income statement.
Share of results of associates
The share of results of associates was $7.8 million (2008: $7.1 million). Britehouse was the largest contributor with $4.1 million.
Interest income and finance costs
Interest and investment income was $8.1 million (2008: $17.5 million). The reduction was the result of much lower prevailing interest rates during the year, an increased proportion of the Group’s cash being centralised in US dollars as opposed to higher yielding currencies, as well as the payment in cash during the year for the purchase of the minority interest in Datacraft Asia.
Total finance costs were $29.9 million (2008: $31.0 million), of which $21.8 million (2008: $22.6 million) related to funding the Campus property in Johannesburg. The balance of the finance costs related to swap costs in respect of intercompany funding ($3.8 million), interest costs on vendor loans, and interest on bank overdrafts.
Property revaluation and other gains and losses
Property revaluation and other gains and losses include a $4.5 million (2008: $8.5 million) gain on revaluation of the investment portion of the Campus property asset in South Africa, based on the Directors’ assessment of fair value at 30 September 2009. The valuation was determined with reference to the budgeted rental income for 2010 and based on a yield of 9.5%.
Dimension Data Annual Report 2009 33
Income tax
The Group’s effective rate of tax on profit before tax, excluding exceptional items, increased slightly to 26.7% (2008: 25.9%). This change reflects the impact of the lower contribution from the US for the period where the Group pays a lower rate of tax, offset by the beneficial impact of some prior year adjustments.
During the year the Group, in conjunction with the lending banks and in agreement with the South African tax authorities (‘SARS’), restructured the financing arrangement underpinning the Campus land and buildings in South Africa. SARS allowed Dimension Data a once off tax deduction of $44.7 million as part of the settlement which resulted in the Group reporting, as an exceptional gain, a deferred tax asset of $11.0 million during the period. The effect of the restructure was to replace the finance lease with secured bank loans. While this led to a change in the assessed tax position relating to the funding, there was no significant change to the reported asset and liability, nor any change to the underlying cash flows or reported finance costs.
Minority interests
The minority interest in the result for the period reduced to $10.2 million (2008: $22.6 million) as a result of the acquisition of the remaining minority shares in Datacraft Asia in November 2008.
The bulk of the remaining interest relates to the Black Economic Empowerment consortium’s (‘the Consortium’) 16.02% interest in the Group’s African operations, through its shares in Dimension Data Middle East and Africa (Pty) Limited (‘DDMEA’). Based on the performance of DDMEA in 2009, with effect from 1 October 2009 a further estimated 2.02% vested to the Consortium, bringing their total interest to 18.04%.
Between 1 October 2009 and 30 September 2011, the Consortium has the option to sell (subject to the achievement of certain internal transformation objectives – as yet not achieved), and the Group has the option to acquire, any of its shares in DDMEA at fair value (as determined by an independent valuer). The Group would be entitled to settle the purchase price in either cash or Dimension Data Holdings plc shares.
If neither option is exercised then the Consortium will continue to vest shares in DDMEA (subject to performance targets) until 30 September 2011 whereafter the Consortium will have the option, subject to the Group’s pre-emptive right, to sell their shares subject to the Group’s approval of the purchaser.
Exceptional items
During 2009, the Group, in conjunction with the lending banks and in agreement with the South African taxation authorities (‘SARS’) restructured the financing arrangement underpinning the Campus land and buildings in South Africa. In concluding the restructuring, the Group made payment to the lending banks of $1.5 million, which refunded certain rebates received in prior periods. Pursuant to the restructuring, SARS allowed Dimension Data a once off tax deduction of $44.7 million. This deduction, net of temporary differences raised previously on the structure, resulted in the recognition of a deferred tax asset to the Group of $11.0 million.
Acquisitions and disposals
During the period, the Group completed the acquisition of the remaining minority shares in Datacraft Asia Limited. In terms of the transaction, shareholders were offered $1.33 per share, at a total cost of $282.1 million. Goodwill on acquisition amounted to $183.8 million.
The Group concluded three other acquisitions, none of which was material. In Australia, we acquired Bluefire, a company specialising in outsourced infrastructure management. In the UK, we acquired Teksys, a company specialising in Microsoft solutions and services, and Internet Solutions acquired a 38.5% interest in Intra Lda, an internet services provider (ISP) based in Mozambique.

34 Dimension Data Annual Report 2009
Chief Financial Officer’s review (continued)
Balance sheet
The Group retained a solid balance sheet position throughout the period, finishing the period with equity attributable to equity shareholders of the parent of $849.6 million, and cash, net of overdrafts, of $599.8 million. The retention of a strong cash position was and is expected to remain an important sign of strength and resilience to our global trading partners and clients, particularly in the current difficult economic conditions.
Minority interests reduced during the period from $138.2 million to $56.7 million as a result of the acquisition of the outstanding minority shares in Datacraft Asia.
Non-current assets of $767.7 million included investment property of $95.9 million. This relates to the 55% of the Campus property asset in South Africa occupied by third party tenants (the balance of the Campus is included in property, plant and equipment). The Campus was revalued at the end of the period, resulting in a revaluation gain to the investment property portion through the income statement of $4.5 million.
Non-current liabilities included bank loans which increased to $140.6 million mostly as a result of the termination of the Campus lease structure, and its replacement with secured bank loans. Obligations under finance leases reduced accordingly.
Net current liabilities (current liabilities less current assets, excluding net cash) were $253.3 million (2008: $119.2 million).
Cash flow
Cash and cash equivalents at the end of the period were $599.8 million (2008: $682.4 million).
Cash generated from operations was $319.0 million (2008: $336.2 million), including cash generated from a reduction in working capital of $45.5 million (2008: $79.2 million). The Group’s working capital management remained strong for the period, with a slight increase in Trade Receivable days sales outstanding to 47 days (2008: 46 days) and an increase in Trade Payable days outstanding to 77 days (2008: 70 days). The Group managed to secure improved trading terms with some of its vendors and, despite the difficult economic conditions, experienced no material bad debts during the period. Inventory levels reduced, largely as a result of lower product volumes.
Net cash used in investing activities was $345.3 million, including $282.1 million in respect of the acquisition of the minority interests in Datacraft Asia.
Capex amounted to $83.4 million (2008: $91.6 million). Internet Solutions invested $62.9 million during the period, up from $46.1 million in 2008. The increase related to a $24.7 million acquisition of international bandwidth in the form of 16 STM1s from Seacom, thereby securing undersea cable capacity off the east coast of Africa. Elsewhere, the Group’s capex reduced relative to the prior year, partly reflecting an emphasis on reducing discretionary spend, but also the fact that 2008 saw a relatively high investment in the Group’s GSOA services platform.
Dave SherriffsChief Financial Officer

Dimension Data Annual Report 2009 35
regional purchasing. As a result, the company was attempting to manage over 150 separate IT service contracts with over 50 different partners around the world. In addition, the client was burdened with a variety of legacy PBX systems and wished to upgrade to a Cisco IP telephony solution.
The company was conscious that it was not extracting maximum value from its sourcing arrangements and decided to engage the services of an objective, independent third-party with specific expertise, in order to validate its plans to move forward with a consolidation and rationalisation exercise.
Through a consulting engagement, Dimension Data worked with the company to evaluate its existing service contracts and restructure its multiple IT departments so that only one profit and loss centre would exist at its US headquarters. This was followed by a consolidation exercise, which involved reducing the number of service contracts to just eight, all of which are now overseen by Dimension Data. The new support service, Uptime powered by Cisco Services, is a solution offered by Dimension Data through its Global Services Alliance with Cisco. Dimension Data serves as the single point of accountability, but the client has the additional assurance of easy access to Cisco’s technical and product expertise. Furthermore, success on this front prompted the client to hand over responsibility for its global IP telephony rollout to Dimension Data.
Information technology geared for growth Our client, a US-based global manufacturer of equipment, has a dealer network that services customers in more than 200 countries and offers rental services through more than 1,000 outlets worldwide.
Like many forward-thinking organisations, our client recognised the opportunity for converging technologies to drive business change and improve efficiencies, but lacked the knowledge of where and how to go about rationalising and consolidating its existing infrastructure, while introducing new technologies.
At the time, the company operated hundreds of different profit and loss centres throughout the world and lacked appropriate controls and governance with respect to
United States of America
Systems Integration› Network Integration› Converged Communications
Dimension Data’s solutions - changing the world as we know it

36 Dimension Data Annual Report 2009
As required by the UK Companies Act 2006, the following table provides a list of some of the principal risks and uncertainties facing the Group. It should not be seen as comprehensive. The Group’s process for managing these risks and uncertainties is detailed in the Corporate Governance report.
Risk description Impact Mitigating factors
Macroeconomic risk: The Group derives a significant portion of its revenue from clients in certain market sectors, including the financial services sector, the telecommunications sector and multinational or global clients. As a consequence, it is exposed to any adverse macroeconomic impact in any of these sectors.
To the extent that our clients in these sectors are impacted by the current economic downturn, the Group is exposed to the risk of revenue declines or working capital deterioration.
Many of the Group’s solutions are mission critical to its clients, and in addition are often used to reduce their costs and improve their productivity.
Certain revenue streams from these clients are contracted on an annuity basis which provides insulation to economic downturn.
No single client accounts for more than 5% of the Group’s revenue and therefore the risk of the loss of an individual client is contained.
Exposure to country risk: The Group operates across a wide range of political and economic environments and as a result is exposed to adverse developments in these environments. Countries to which the Group is materially exposed include South Africa, Australia, the United Kingdom, India and the United States.
Political or economic disruption in any of the Group’s major trading territories could impact the Group’s profitability.
The Group operates in a large number of countries, both developed and developing, which to a certain extent provides a hedge against this exposure. With regard to containing exposure in any one territory, the Group monitors developments closely, and also focuses on maintaining strong local management capability.
Vendor risk: The Group has close and mutually beneficial partnerships with leading technology vendors, enabling it to provide its clients with the most advanced and flexible technology solutions. The Group’s relationship with these partners is important to its continued success.
Any changes to the terms and conditions of purchase from key vendors may result in lower market share or lower profitability.
The Group’s geographic footprint and local client relationships make it an important channel to market for its partners, and there is a mutual dependency on promoting stable and long term relationships. The Group also invests substantial time and resources in promoting and managing its vendor relationships.
Deal complexity risk: The growth in global business, the Group’s drive towards services-led solutions, the industry’s trend towards annuity based or cloud computing arrangements, are some of the factors contributing to the increasing complexity of client engagements.
This risk could result in the Group’s failure to deliver against contractual obligations, which in turn would result in reduced profitability, regulatory repercussions or reputational damage.
The Group has bid and commercial management methodologies, which are managed through defined governance processes. This has led to a relatively low incidence of failure in the past, supported by the quality and skill of employees involved in deal construction and negotiation.
Principal risks

Dimension Data Annual Report 2009 37
Risk description Impact Mitigating factors
Regulatory risk: The Group operates in many different countries, and the complexities of cross border transactions contribute to the risk of regulatory non-compliance, especially in relation to transfer pricing and taxation.
Risks include possible legal sanction, inefficient taxation and damage to reputation.
The Group invests significant resource in understanding the relevant transfer pricing and regulatory environments, and in ensuring that it is fully compliant with the laws and regulations of all territories within which it operates.
Employee retention risk: The risk of not being able to attract, develop and retain key employees.
Inability to attract and retain key talent would harm the Group’s ability to execute its strategy.
The Group places a heavy emphasis on attracting and retaining world class employees. Key initiatives include; a consistent and effective recruitment process to enhance candidate experience, effective induction programmes to ensure rapid assimilation into the Group, development of enhanced people management capabilities to engage, motivate, and retain talent. Further information on employees is set out in the Corporate Responsibility report.
Business continuity risk: An element of the Group’s managed services revenue depends on remote infrastructure management, which in turn depends on resilient systems and internal IT infrastructure.
Business continuity risks associated with operational or IT systems and data security failure could have a significant impact on our business.
Our business continuity plans are constantly being refined, including ensuring that alternative solutions are in place to adapt to unforeseen disruption to critical business processes.
Balance sheet risk: Risks relating to the management of the Group’s balance sheet include liquidity risk, credit risk and currency risk.
Liquidity risk is the risk that the Group will be unable to meet its financial obligations when they fall due.
Credit risk refers to the risk that a counterparty will default on its obligations to the Group.
Currency risk refers to the risk that the value of assets and liabilities may fluctuate due to changes in exchange rates.
Liquidity risk management within the Group focuses on working capital metrics, cash balances and cash flow planning, coupled with funding facilities.
With regard to trade receivables, Group policy is only to deal with counterparties with an appropriate credit rating. Our clients are also spread across diverse industries and geographical areas and tend to be high quality organisations.
Financial assets and liabilities are generally economically hedged using forward exchange contracts, limiting transactional exposures that would give rise to currency gains and losses in the income statement. The Group does not hedge fluctuations in earnings and in the balance sheet as a result of translation of subsidiaries into the reporting currency of the Group.

38 Dimension Data Annual Report 2009
Executive Committee
1. Jeremy Ord Executive Chairman Dimension Data Holdings plc
2. Brett Dawson Chief Executive Officer Dimension Data Holdings plc
3. David Sherriffs Chief Financial Officer Dimension Data Holdings plc
4. Steve Nola Chief Executive Officer Dimension Data Australia
5. Allan Cawood Chief Executive Officer Dimension Data Middle East & Africa
6. Stephen Joubert Group Executive Global Solutions
7. Russell Bolan Chief Executive Officer Dimension Data Europe*
8. Jere Brown Chief Executive Officer Dimension Data Americas
9. Andrew Briggs Group Executive Sales
10. Marilyn Williams Group Executive Human Resources
11. Patrick Quarmby Director Corporate Finance
12. Ettienne Reinecke Chief Technology Officer and Group Executive Network Integration

Dimension Data Annual Report 2009 39
13. Bruce Watson Group Executive Cisco Alliance
14. Bill Padfield Chief Executive Officer Datacraft Asia Ltd
15. Connie de Lange Group Executive Marketing
12
3
456 7
89
10 11 12 13 14 15
*to 30 September 2009

40 Dimension Data Annual Report 2009
Executive directorsJeremy John Ord (52) nExecutive ChairmanJeremy Ord was appointed as Chairman of DimensionDataHoldingsplcat the timeof its listing inLondonandJohannesburg in 2000. He held the combined role of ChairmanandChiefExecutiveOfficeruntil1March2004,when Brett Dawson was appointed as Chief ExecutiveOfficer.JeremypreviouslyservedasExecutiveChairmanofDimensionDataHoldingsLimitedfrom1987,astheGroup’sManagingDirectorand inotherseniorpositionssincetheGroup’s1983inception.Jeremyisanon-executivedirectorofParaconHoldingsLimited.
Brett William Dawson (45)Chief Executive OfficerBrettDawsonwasappointedasChiefExecutiveOfficerofthe Group and to the Board of Dimension Data Holdings plcon1March2004.Priortothisappointmentheservedas Dimension Data’s Chief Operating Officer from 2002.He joined the Group in 1997 as Financial Director of the Group’s joint venture, OmniLink. He was instrumental ingrowing the business, which exceeded all business plan objectives and claimed a dominant market share in the South Africanmarket. Following themerger of OmniLinkandInternetSolutions,BrettwasappointedCEOofInternetSolutions. In September 2001 he relocated to take on the roleofCFOofDimensionDataNorthAmerica,wherehefocusedonintegratingacquisitionsinthatterritory.Priortojoining Dimension Data, Brett was responsible for corporate strategyandplanningatNationalBrandsLimitedandheldcorporatefinancepositionsatAnglovaalLimitedandKPMG.He graduated from the University of the Witwatersrand and isaCharteredAccountant(SA).
Stephen Michael Joubert (51)Group Executive: Global SolutionsStephen Joubert was appointed to the Board of Dimension DataHoldingsplcat the timeof its listing inLondonandJohannesburgin2000.Priortothatappointmentheservedas a director of Dimension Data Holdings Limited from1998. He joined the Group in 1996 as Group Financial DirectorinNetworkServices.Beforethat,hewasapartnerat PricewaterhouseCoopers for a number of years. Hegraduated from the University of the Witwatersrand and is a CharteredAccountant(SA).
Patrick Keith Quarmby (55)Director: Corporate FinancePatrickQuarmbywasappointedtotheBoardofDimensionDataHoldingsplcatthetimeofitslistinginLondonandJohannesburg in 2000. Prior to that appointment heservedontheBoardofDimensionDataHoldingsLimitedfrom1996.HewasappointedasChairmanofDatacraft
Board of Directors
AsiainJuly2002.PreviouslyheworkedasataxpartneratErnst&YoungSouthAfricaandwasadirectorofStandardBankinLondonandHongKong.HegraduatedfromtheUniversityofCapeTownand isaCharteredAccountant(SA).
David Brian Sherriffs (46)Chief Financial OfficerDavid Sherriffs was appointed as Chief Financial Officeron 1 March 2004, and was appointed to the Board of Dimension Data Holdings plc on 9 June 2004. He joined the Group in 1997 as a member of the finance team, primarily involved in corporate finance activities. In2000,DavidwasappointedVicePresidentofBusinessDevelopmentforEuropeandrelocatedtoGermany.From2003, David served as Group Executive Operations andwas responsible for business case assessments relating to strategic projects. Prior to joining theDimensionDataGroup, David served in various financial, corporate finance and strategy roles for Anglo American plc, includingExecutiveAssistanttothechairman.DavidisaCharteredAccountant (SA) and received his MPhil in ManagementStudies at the University of Oxford.
Non-executive directorsRupert George Barclay (52) • nSenior independent non-executive directorRupert Barclay joined the Board of Dimension Data Holdings plc as an independent non-executive director with effectfrom9June2004andisamemberoftheAuditCommitteeand the Nomination Committee. Rupert is a partner ofCairneagleAssociatesLLPandisanon-executivedirectorof Lowland Investment Company plc and serves on theboards of a number of private companies. He previously served inanexecutivecapacityasCFOofLombardRiskManagementplc,DirectorofGroupStrategyDevelopmentat Reuters plc and Director of Group Strategy at AlliedDomecqplc.HeisagraduateofCambridgeUniversity,hasanMBAfromINSEADandisaCharteredAccountant.
Leslie Frank Bergman (65) •Independent non-executive directorLeslie Bergman joined the Board of Dimension DataHoldings plc as an independent non-executive directorwith effect from 14 August 2007. Leslie was previouslywith Accenture working in the United States, the UnitedKingdom,SouthAfricaandinCentralandEasternEurope.At the time of his retirement from Accenture in October2001, he was Regional Managing Partner, EmergingMarkets.LeslieisadirectorofLeder&Schuh(Austria).HehasaBScinEngineeringfromtheUniversityofCapeTownandanMBAfromCarnegie-MellonUniversity.
Dimension Data Annual Report 2009 41
Peter John Liddiard (44) •Non-executive directorPeterLiddiardwasappointed to theBoardofDimensionDataHoldingsplcasanon-executivedirectoron2October2006andisamemberoftheAuditCommittee.HeservesasanexecutiveofVenFinLimitedandisontheboardsofvariouscompaniesincludingSailGroupLimited,BritehouseHoldings(Pty)LimitedandCIVFibreNetworkSolutions(Pty)Limited.HegraduatedfromtheUniversityofPortElizabethandisaCharteredAccountant(SA).
Wendy Lucas-Bull (56) *Independent non-executive directorWendy Lucas-Bull joined the Board of Dimension DataHoldings plc as an independent non-executive directoron1July2005andistheChairmanoftheRemunerationCommittee.SheisamemberoftheEskomHoldingsLimitedboardandtheDevelopmentBankofSouthernAfricaandisChairmanofLafarge IndustriesSouthAfrica (Pty)Limited.She graduated from the University of the Witwatersrand with a Bachelor of Science degree.
Josua (Dillie) Malherbe (53) *Non-executive directorDillieMalherbewasappointedto theBoardofDimensionDataHoldingsplc inNovember2003asanon-executivedirectorandisamemberoftheRemunerationCommittee.Dillie is the deputy chairman of VenFin Limited. He alsoserves on the boards of Sabido (Pty) Limited (e-tv) andRemgro Limited. He graduated from the University ofStellenbosch with a Bachelor of Commerce degree andqualified as a Chartered Accountant (SA) through theUniversityofCapeTown.
Moses Modidima (Moss) Ngoasheng (52)Independent non-executive directorMoss Ngoasheng was appointed to the Board inSeptember 2002. He also serves as a non-executivedirectorontheboardofDimensionDataMiddleEastandAfrica(Pty)Limited.Heisexecutivechairmanofinvestmentcompany Safika Holdings (Pty) Limited. He also servesas a non-executive director of The Kelly Group Limited.Moss graduated from the University of South Africa andhasanMPhilfromSussexUniversity.SafikaHoldings(Pty)Limited,amongstitsotheractivities,hasformedaminoritypartoftheconsortiuminvolvedintheBEEtransactionwithDimensionDataMiddleEastandAfricaandhasaninterestin Britehouse Holdings (Pty) Limited. The Company hasreviewedthisinvolvement,andconsidersthatMossshouldcontinue to be considered as fully independent.
Roderick (Rory) Michael Scott (50) • *Independent non-executive directorRory Scott was appointed to the Board of Dimension Data Holdings plc as a non-executive director at the time ofits listing in LondonandJohannesburg in2000.Hehadpreviouslyservedasanon-executivedirectorontheBoardof Dimension Data Holdings Limited, and before thatserved as the Group Financial Director from 1987 to 1991. HeispresentlyManagingDirectoroftheScottishKnitwearGroupSA(Pty)Limited.RorygraduatedfromtheUniversityoftheWitwatersrandandisaCharteredAccountant(SA).Heservesaschairmanof theAuditCommitteeandasamemberoftheRemunerationCommittee.Giventhelengthof time that has elapsed since his service as an executive director,theCompanyconsidershimtobeindependent.
Peter Dorian (Dorian) Wharton-Hood (70) * n
Independent non-executive directorDorian Wharton-Hood was appointed to the Board ofDimensionDataHoldingsplcasanon-executivedirectoratthetimeofitslistinginLondonandJohannesburgin2000.HeisamemberoftheRemunerationCommitteeandtheNominationCommittee.Hewas vice-chairman of LibertyLife for eight years.Hewas chairmanof the LifeOffice’sAssociationofSAonthreeoccasionsandpresidentoftheInsurance Institute of SA.Hewas also amember of theCouncilof theSAFoundationandadirectorofBusinessAgainstCrime.In1998hewaschairmanoftheGoverningBody of Business SA (now called Business Unity SA) ofwhich he is now a trustee. He graduated from Stellenbosch UniversitywithaBachelorofCommercedegree.
•MemberoftheAuditCommittee.* MemberoftheRemunerationCommittee.nMemberoftheNominationCommittee.
42 Dimension Data Annual Report 2009
Directors’ report
The Directors of Dimension Data Holdings plc (‘theCompany’)presenttheirannualreportandauditedfinancialstatements for the year ended 30 September 2009.
Principal activitiesTheCompanyholdsvariousinterestsintheInformationandCommunications Technology (ICT) services industry. BycontinuallybuildingonourknowledgeandexpertiseinICTinfrastructure technologies, we have become a recognised global leader in the provision and management of specialist IT infrastructure solutions. Details of the principal subsidiary and associated entities are provided on page 124.
There have been no significant changes to the Group’s activities during the year under review and the Directors are not aware, at the date of this report, of any likely significant changes in the Group’s activities in the new financial year.
Business reviewIntroductionThe business and financial reviews, as required by the CompaniesAct2006,are included intheChiefExecutiveOfficer’s review and the Chief Financial Officer’s reviewrespectively, the Corporate Responsibility report and thisDirectors’ report, which provide information about the Group’s operations, its financial performance during the year and expected future developments.
Position of the Group at year endThe full year results as at 30 September 2009 are presented underInternationalFinancialReportingStandards(‘IFRS’),asadoptedbytheEuropeanUnion.
Information about the performance of the business of the GroupduringthefinancialyearinresponsetoS417(3)(b)oftheCompaniesAct2006(‘theCompaniesAct’)isincludedintheChiefFinancialOfficer’sreview.
Business performance indicatorsThe Group focuses on various businesses, including:• theSystemsIntegrationbusiness(tradingasDimensionDatagloballyandDatacraftinAsia);
• InternetSolutions,anAfricanInternetServiceProvider;• Plessey, a leading provider of telecoms infrastructuresolutionsinAfrica;
• Express Data, Australia and New Zealand’s leadingdistributor of enterprise networking technologies.
The Board uses various financial measures to assess the financial position and overall performance of its operations, including revenue and gross profit growth, gross margin,
operating profit growth, operating margin, fixed and variable overhead costs, as well as trade receivables days and other measures to determine the effectiveness of working capital management. Non-financial performance indicators arealso reviewed, including client and employee satisfaction surveys, productivity ratios and employee attrition and retention statistics.
Information and analyses using financial key performance indicators and other business key performance indicators in response to S417(6) of the Companies Act 2006 areincluded on pages 12 and 13.
Trends impacting future development, performance and position of the business Trends impacting future development, performance and the positionofthebusinessareincludedintheChiefExecutiveOfficer’s review.
Contractual arrangements essential to the businessContracts form the basis of all commercial relationshipswithin the Group and between Group companies and their vendors, clients and other stakeholders. While there are many contracts entered into on an almost daily basis, all of which are important to the Group, the contracts that are essential to the Group are the global contracts entered intowith itsprimaryvendors, inparticular thatwithCiscoSystems. In the aggregate, its agreements with its clients are essential, although no single client accounts for more than 5% of the Group’s revenue.
Principal risks and uncertaintiesThe principal risk factors affecting the Group’s prospects are discussed on pages 36 and 37 and further discussed in Note 38 to the financial statements. These includevendor/supply chain risk, macroeconomic risk, country risk, deal complexity risk, retention risk, business continuity risk, regulatory risk and balance sheet risk. The Group’s performance could be affected by other risks, and those identified in this report should not be regarded as complete or comprehensive.
Fixed assetsThe only fixed assets where market value differs materially from book value are land and buildings, reflected at a book valueof$145.9million (2008:$122.4million) inproperty,plant and equipment and investment property in the balance sheet, compared to the market value of approximately $178.1million(2008:$149.8million).Disposaloflandandbuildings at the estimated market value would give rise to a tax liability of approximately $12.4 million.
Dimension Data Annual Report 2009 43
Group financial instrumentsThe Group’s financial instruments comprise cash and cash equivalents, as well as items such as trade receivables and trade payables that arise directly from the Group’s operations. Details of the Group’s financial instruments are setoutinNote38tothefinancialstatements.
Significant acquisitions, disposals, financing transactions, investments and material developments during the yearDetails of acquisitions are set out in the Chief FinancialOfficer’s review and Note 31 to the annual financialstatements. There were no significant disposals, financing transactions or investments during the year.
Post balance sheet eventsDetailsofpostbalancesheeteventsaresetoutintheChiefFinancialOfficer’sreviewandNote40totheannualfinancialstatements.
Capital structure Authorised share capitalTheauthorisedsharecapitalof theCompany is£50,000,divided into 50,000 deferred shares of £1 each, and$30 million, divided into 3 billion ordinary shares of 1 US cent each.
The holders of the deferred shares have no right to receive notice of any general meeting of the Company, nor theright to attend, speak or vote at such general meetings. The deferred shares have no rights to dividends and on a returnofassets inawinding-up,entitle theholder to therepayment of the amounts paid on the deferred shares, after repayment of the capital paid up on the ordinary shares plus the payment of $10 million per ordinary share.
Issued share capitalAs at 30 September 2009, the Company’s issued sharecapitalwas50,000deferredsharesof£1each(comprising0.003%oftheissuedshares)and1,698,781,169ordinaryshares of 1 US cent each (comprising 99.997% of theissuedshares).
During the year ended 30 September 2009, options were exercised pursuant to the Company’s share incentiveschemes, resulting in the allotment of 4,321,488 new ordinaryshares.Nofurthernewordinaryshareshavebeenallotted under these schemes since the end of the financial year to the date of this report.
Acquisition of own sharesThe Company has current authority to purchase up to84,722,900ofitsordinaryshares(being5%oftheissued
sharecapitalasat30September2008)inthemarket,eitherfor cancellation or to hold as treasury shares. During the yeartheCompanyitselfdidnotpurchaseanyshares.TheEmployeeShareTrusthoweveracquired29,189,111sharesof 1 US cent each at an aggregate purchase consideration of $18.7 million to meet obligations in terms of the Group’s shareschemes.Duringtheyear,theEmployeeShareTrustdisposed of 6,674,164 ordinary shares of 1 US cent each at an aggregate amount of $3.8 million. The EmployeeShare Trust awarded 46,487,978 shares to employees in settlement of obligations in terms of the Group’s share schemes.Asat30September2009,theEmployeeShareTrust held 10,531,897 ordinary shares, representing 0.62% oftheissuedsharecapitaloftheCompany.
Rights and restrictions attaching to sharesUnder the Company’s Articles of Association, holders ofordinary shares are entitled to participate in the payment of dividends pro rata to their holding. The Board may propose and pay interim dividends and recommend a final dividend outofprofitsavailablefordistributionunderEnglishlawinrespectofanyaccountingperiod.Afinaldividendmaybedeclared by the shareholders in general meeting by ordinary resolution, but no dividend may be declared in excess of the amount recommended by the Board.
At anygeneralmeeting a resolutionput to the vote shallbe decided on a show of hands unless a poll is properly demanded. On a show of hands every member who is present in person or by proxy shall have one vote. On a poll every member who is present in person or by proxy shall have one vote for every ordinary share of which they are the holder.
No person holds securities in the Company carryingspecial rightswithregardtocontrolof theCompany.TheCompanyisnotawareofanyagreementsbetweenholdersof securities that may result in restrictions on the transfer of securities or voting rights.
Restrictions on transfer of sharesTheCompany’sArticlesofAssociationallowDirectors, intheir absolute discretion, to refuse to register the transfer of a share in certificated form which is not fully paid. They may also refuse to register a transfer of a share in certificated form unless the usual form of transfer is lodged, duly stamped, at theregisteredofficeoftheCompanyoratsuchotherplaceas the Directors may appoint and is accompanied by the share certificate to which the transfer relates and such other evidence as the Directors may reasonably require to show the right of the transferor to make the transfer.
44 Dimension Data Annual Report 2009
Directors’ report (continued)
The Directors may refuse to register a transfer of a share in uncertificated form in any case where the Companyis entitled to refuse under the Uncertificated Securities Regulations to register the transfer. The Directors may also refuse to register any transfer in favour of more than four transferees.
The Company has irrevocable authority at any time toappoint any person to execute on behalf of the holders of the deferred shares a transfer of the deferred shares of an agreement to transfer and/or to acquire the deferred shares (inaccordancewith theprovisionsof theCompaniesActand subject to the minimum capital requirements contained in theCompaniesAct),andwithoutmakinganypaymentto or obtaining the sanction of the holders of the deferred shares, tosuchpersonsas theCompanymaydetermineas custodian of the deferred shares and, pending such transfer and/or acquisition, to retain the certificate for the deferred shares.
Major shareholdersDetails of the shareholders holding 3% or more of the issued sharecapitaloftheCompanyaresetoutonpage125.
DividendThe Directors recommend the payment of a dividend of 1.9UScentspershare (2008:1.7UScents).Subject toshareholders’ approval at the Annual General Meetingon Wednesday, 3 February 2010, the final dividend will be paid on Friday, 19 March 2010 to shareholders onthe share register at the close of business on Friday, 19 February 2010.
The dividend will be paid in Sterling to shareholders on the UKregisterand inSouthAfricanrandtoshareholdersontheSouthAfricanregister,convertedfromUSdollarsasatthe close of business on Thursday, 4 February 2010.
The following are the salient dates for the payment of the proposed dividend:
Announcementof conversion rate Friday, 5 February 2010LastdaytotradeontheJSE Friday,12February2010Date trading commences ‘ex’thedividendontheJSE Monday,15February2010Date trading commences ‘ex’thedividendontheLSE Wednesday,17February2010RecorddateontheJSEandLSE Friday,19February2010Paymentofdividend Friday,19March2010
NotransfersbetweentheUKandSouthAfricanregistersmay take place during the period Friday, 5 February 2010andFriday,19February2010 (bothdays inclusive).Shareholders on the South African register should notethat, in accordance with the requirements of Strate, share certificates may not be dematerialised or rematerialised betweenMonday,15February2010andFriday,19February2010(bothdatesinclusive).
Powers of directorsThe Directors have the power to manage the business of theCompany,subjecttotheprovisionsoftheCompaniesAct, theMemorandumandArticles of Association of theCompany,andtoanydirectionsgivenbyspecialresolution,including the Company’s power to purchase its ownshares. The Company’s Articles of Associationmay onlybe amended by a special resolution of the Company’sshareholders. The Company will be proposing a specialresolution to adopt new Articles of Association to alignthemwithprovisionsoftheCompaniesAct2006.
Change of controlThe Group’s share incentive schemes contain provisions relating to a change of control. Outstanding options under the share option schemes would normally vest and become exercisable on a change of control. Outstanding grants under the Long Term IncentivePlanand Share Appreciation Rights Scheme would normallybecome exercisable on a change of control subject to the satisfaction of any performance conditions at that time and pro rata to the proportion of the performance period that has expired.
SomeofthecontractsthattheCompanyhasenteredintowith its clients and vendors contain provisions that entitle, but not oblige, the other party to terminate the specific contract in the event of a change of control. Most ofthese provisions are further restricted to instances where the change of control is to a competitor of the other party and not just a mere change of control. However, the aforementioned contracts are confidential and subject to stringentnon-disclosureprovisionsandcan thereforenotbe disclosed in this Directors’ report.
Trade payables payment policyThe Group is committed to maintaining a sound commercial relationship with its creditors. The Group has no fixed payment policies but negotiates the best possible terms with its suppliers.
TheCompanyhadnotradepayablesattheyearend.

Dimension Data Annual Report 2009 45
DirectorsThe current Directors and their biographical details are set out on pages 40 and 41. Details of the members of the Board, all of whom served throughout the year, are given below:
Name Position Appointed
Jeremy Ord ExecutiveChairman May2000Brett Dawson ChiefExecutiveOfficer March2004Stephen Joubert GroupExecutive:GlobalSolutions July 2000PatrickQuarmby Director:CorporateFinance July 2000David Sherriffs ChiefFinancialOfficer June 2004Rupert Barclay Seniorindependentnon-executivedirector June 2004LeslieBergman Independentnon-executivedirector August2007PeterLiddiard Non-executivedirector October 2006WendyLucas-Bull Independentnon-executivedirector July 2005DillieMalherbe Non-executivedirector November2003MossNgoasheng Independentnon-executivedirector September 2002Rory Scott Independentnon-executivedirector July 2000DorianWharton-Hood Independentnon-executivedirector July 2000
At the forthcoming Annual General Meeting, BrettDawson, Patrick Quarmby, Peter Liddiard and DillieMalherbe retire by rotation and offer themselves for re-election inaccordancewiththeArticlesofAssociation.Rory Scott andDorianWharton-Hood, having served onthe Board for nine years, are required to retire annually in accordance with the Articles of Association. Whilst RoryScottisavailableforre-electionforafurtheroneyeartermincompliancewiththeCombinedCode,DorianWharton-Hoodwillnotseekre-election.
TheNominationCommitteeandChairmanconfirmthattheDirectorsseekingre-electioncontinuetobeeffectiveintheirrolesasdirectorsoftheCompany,byvirtueoftheirskills,experience and contribution to the Board. Biographical details of those directors seeking re-election are set outon pages 40 and 41. Reasons for and recommendations regarding the re-election of non-executive directors, aswellasdirectors’membershipsofBoardCommitteesareset out in the Corporate Governance Report. Details ofdirectors’ service contracts, remuneration and interests in shares are set out in the Remuneration Report. Details of the directors’ interests in any Group company can also be found in the Remuneration Report.
Reasons for and recommendations regarding the re-electionofnon-executivedirectorsaswellasdirectors’membership of Board Committees are set out in theCorporate Governance Report, which is included onpage 49.
To the extent permitted by law and the Articles ofAssociation, the Group has made qualifying third partyindemnity provisions for the benefit of its directors and officers, which remain in force at the date of this report.
Going concernThe Group’s business activities, together with the factors likely to affect its future development, performance and position are set out in the Chief Executive Officer’s andChief Financial Officer’s reviews. The financial position ofthe Group, its cash flows, liquidity position and borrowing facilities are described in the Chief Financial Officer’sreview and in Note 38 to the financial statementswhichincludes the Group’s objectives, policies and processes for managing capital, details of financial instruments and hedging activities, as well as exposures to credit and liquidity risk.
The Directors believe that the Group is well placed to manage its business risks successfully. After makingenquiries, the Directors have a reasonable expectation that the Group has adequate resources to continue to operate for the foreseeable future, despite the current uncertain economicenvironment.Accordingly,theycontinuetoadoptthe going concern basis of accounting in preparing the annual financial statements.
IT systemsThe Group made progress during the period regarding the implementation in its Systems Integration business of an upgrade to its Global Services Operating Architecturewhichwill enable enhanced infrastructuremanagementcapabilitiesaroundtheworld.Elsewhere,the Group continued to invest in enhancing IT systems capabilities, and to review the opportunities for the extraction of scale efficiencies across the Group’s operating model.

46 Dimension Data Annual Report 2009
Directors’ report (continued)
Research and developmentThe Group does not incur research and development expenditure in the conventional sense. However, it continuestoinvestinitsstrategyofestablishingworld-class expertise in the lines of business and service delivery capabilities in its Systems Integration business.
Corporate responsibilityDimension Data’s policies for environmental, social, ethics and governance matters are detailed in the CorporateResponsibility report on pages 55 to 61. Charitabledonations and grants made during the year amounted to $281,000(2008:$229,000).
In line with its policy, the Company made no politicaldonationsintheyearunderreview(2008:nil).
EmployeesAs at 30 September 2009, the Group employed11,032 employees. Details of employee related costs are included in Note 7 to the financial statements. Furtherinformation on the Group’s employees is included in the CorporateResponsibilityreportonpages55to58.
AuditorsResolutions to reappoint Deloitte LLP as the Group’sauditors and authorising the Directors to determine their remunerationwillbeproposedat the forthcomingAnnualGeneralMeeting.
Eachof thepersonswho isadirectorat the timeof thisreport confirms that: • so far as the director is aware there is no relevantaudit informationofwhich theCompany’sauditorsareunaware; and
• thedirectorhastakenallthestepsthatheorsheoughtto have taken as a director in order to make himself/herself aware of any relevant audit information and to establishthattheCompany’sauditorsareawareofthatinformation.
This information is given and should be interpreted in accordancewiththeprovisionsofS418oftheCompaniesAct2006. Annual General MeetingThe notice convening the Annual General Meeting andexplanatory notes on the proposed resolutions is enclosed with this document.
DetailsofspecialbusinesstobetransactedattheAnnualGeneralMeetingcanbefoundinthenoticeonpages126and 127.
Donation of sharesThe Company supports the ShareGift charity sharedonation scheme (registered charity number 1052686).ShareGift provides a solution to shareholders on the UKregister who hold very small numbers of shares that may be uneconomical to sell, by facilitating donation of such shares to charity. ShareGift aggregates and sells such donated shares and passes the proceeds on to a wide range of UK charities. Donating shares to charity doesnot give rise to gains or losses from a UK capital gainsperspective and UK taxpayers may be able to claim anincome tax deduction on the value of the donation. Whilst the service is generally free, there may be an indemnity charge for lost or destroyed share certificates. Further details may be obtained directly from 17 Carlton HouseTerrace, London SW1Y 5AH Telephone 020 7930 3737or email [email protected], or from their website www.ShareGift.org.
ForshareholdersregisteredontheSouthAfricanregister,StrateCharitySharesprovides a similar service.StrateCharity Shares is a non-profit company, formed byStrate for the specific purpose of enabling shareholders to turn small holdings to good account by donating them to charity. The scheme has the full support of the JSE Limited and benefits from the enthusiasticco-operation of many issuing companies and otherconcerned institutions. All securities donated are soldand the proceeds distributed to selected charities registeredasPublicBenefitOrganisations,mostnotablycharities engaged in the care of children, the elderly and the victims of AIDS. More information may beobtainedbycallingTollfree0800202363 (or ifoutsideSouthAfrica+27118708207)[email protected].
Company SecretaryThe Company Secretary is S Heydenrych (details insidebackcover).
By Order of the Board
Sanet HeydenrychSecretary
17November2009

Dimension Data Annual Report 2009 47
Corporate governance report
The Board is committed to maintaining high standards of corporate governance, which it regards as critical to business integrity and maintaining shareholders’ trust. This report, together with the Directors’ Report and the Remuneration Report, sets out how the Company hasappliedtheprinciplesoftheCombinedCodeonCorporateGovernance(‘theCode’)issuedbytheFinancialReportingCouncil(‘FRC’)inJune2008.Thesereports,readtogether,contain the information required by Section 7 of the Financial Services Authority Disclosure and Transparency Rules.Copies of the Code are available from the FRC websitewww.frc.org.uk.
Structure, governance and operation of the Board of DirectorsCompositionTheCompany’sBoardconsistsoffiveexecutivedirectors,includingtheChairman,andeightnon-executivedirectors,all of whom served throughout the 2009 financial year. Directors’ biographies are provided on pages 40 and 41. The Board considers all non-executive directors, withthe exceptionofDillieMalherbeandPeterLiddiard, tobeindependent.RupertBarclayistheseniorindependentnon-executive director.
Operation of the BoardThe Board is accountable to shareholders for determining strategy and the overall conduct of the business of the Group. The Board has final responsibility for the management and performance of the Group and its businesses and is required to exercise objective judgement, independent from management, on corporate matters.
AcorporategovernanceframeworkintheformofaGroupauthorities matrix defines the roles and responsibilities of the constituent elements of the Group’s management structure. This enables the Board to plan, execute, control and monitor the Group’s activities in accordance with strategic objectives. The Group authorities matrix determines levels of authority for subsidiary boards and their directors in respect of financial and operational decision making, including major investments, capital expenditure and contractual engagements. The Group’s internal audit function monitors compliance with these authority levels.
In addition to the delegation of authority in terms of the Group authorities matrix, the Board has delegated specific responsibilities to a number of committees which operate within terms of reference approved by the Board.
The Board has reviewed and approved revised terms of reference for the Audit Committee, RemunerationCommitteeandNominationCommitteeandhasadopteda board charter, in terms of which a number of matters are reserved for the Board, including:• approvaloftheGroup’sstrategyandannualbudget;• reviewofGroupperformance;• approvalofmajorcapitalexpenditureordisposals,
material contracts, material acquisitions and developments;
• monitoringandreviewingoftheeffectivenessoftheGroup’s internal controls and risk management system;
• changestotheCompany’scapitalstructureandtheMemorandumandArticlesofAssociation;
• recommendationofdividends;• communicationwithshareholders,includingapproval
of all circulars, prospectuses and major public announcements;
• determinationofthetermsofreferenceofBoardcommittees;
• appointment,removalandremunerationofdirectorsandtheCompanySecretary;
• changestoemployeeshareplansandlongtermincentive programmes;
• approvaloftheinterimstatementandAnnualReportandaccounts(includingreviewofcriticalaccountingpolicies and judgements and assessment of the Group’spositionandprospects);and
• appointmentofexternalauditors.
Division of responsibilitiesThedivisionofresponsibilitiesbetweentheChairmanandChief Executive Officer is defined in the board charterandapprovedbytheBoard.TheChairmanisresponsiblefor leadership, promoting the highest standards of governance and effectiveness of the Board. He facilitates contributions by non-executive directors and ensuresa productive relationship between executive and non-executive directors. The Chairman meets regularly withnon-executivedirectorstodiscussmatterswithoutotherexecutivedirectorsbeingpresent.WiththeChiefExecutiveOfficer and the Company Secretary, the Chairmanensures that the Board is at all times properly informed and consulted on all matters reserved for it. Through the Nomination Committee, which he chairs, the Chairmanensures that the Board comprises individuals with an appropriate mix of skills, knowledge and experience. The Chairmanfurthermoremaintainseffectivecommunicationwith shareholders, represents the Group at the highest leveland,inconjunctionwiththeChiefExecutiveOfficer,develops and maintains strategic key customer and vendor relationships.
48 Dimension Data Annual Report 2009
Corporate governance report(continued)
inductionprocessledbytheChairman,withtheassistance
of the Company Secretary, to familiarise them with the
operations of the Group, its business environment,
executive management and to make them aware of their
fiduciary duties and responsibilities, applicable legislation
and regulations. Directors are continually updated on
the Group’s businesses and the regulatory and industry
specific environment in which the Group operates. The
same applies to corporate governance and regulatory
issues, either by means of written briefings or presentations
by executives or external sources. Individual directors
are expected to identify any additional individual training
needs and to take the necessary steps to ensure that
they are adequately informed. Directors are able, at the
Company’sexpense, toobtain independentprofessional
advice on Board matters.
The Chairman and executive directors have service
agreements, the details of which are reported in the
Remuneration Report. Non-executive directors are
appointed in terms of Letters of Appointment and the
Company’sArticlesofAssociation.Theyareconsequently
subject to retirement by rotation and are subject to review
by theNominationCommitteeprior tobeingconsidered
forre-election.LettersofAppointmentwillbeavailablefor
inspectionattheAnnualGeneralMeeting.
Evaluation and independence
A formal performance evaluation of the Board, its non-
executive directors and committees is conducted annually
by means of a series of self evaluation questionnaires
basedontheCombinedCode,withtheaimofevaluating
and improving effectiveness of the Board, its committees
and individual contributions. Results of the evaluation
identify potential knowledge and skills gaps on the Board
or its committees and provide a basis for continuous
improvement of the Board’s procedures and objectives
for the following year.Non-executivedirectors review the
leadershipandperformanceoftheChairman.
Performanceoftheexecutivedirectorsisevaluatedannually
using the performance management system implemented
throughout the Group, with the Chief Executive Officer
reviewing the executive directors’ performance and
the Chairman reviewing the Chief Executive Officer’s
performance. Based on the annual evaluations undertaken
in September 2009, the Board is satisfied that all directors
are committed to their roles and that the Board and its
committees are effective.
The Chief Executive Officer is responsible for theleadership and operational management of the Group within the strategy as agreed by the Board. The ChiefExecutiveOfficerensuresthattheGrouphasappropriatemanagement structures and a management team to effectively implement the Group’s objectives, strategy and business plans and brings to the Board’s attention all matters that materially affect or are capable of affecting the performance of the Group and the achievement of its strategy.
The Senior Independent Director is available to shareholders if they have concerns which have not been resolved through the normal channels of the Chairman,ChiefExecutiveOfficerorChiefFinancialOfficer,orwheresuch contact is inappropriate.
TheCompanySecretary isaccountabletotheBoardandensures that the rules and procedures applicable to the conduct of the affairs of the Board are complied with and reviewed whenever deemed necessary. The CompanySecretary provides the Board as a whole and directors individually with advice and guidance as to how their responsibilities should be properly discharged in the best interests of theCompany. In addition to statutory duties,theCompanySecretaryisacentralsourceofguidanceandadvicetotheBoard,andwithintheCompany,onmattersof good corporate governance and ethics. All directorshave access to the services of the Company Secretary.Appointmentandremovalof theCompanySecretary isamatter reserved for the Board as a whole.
MeetingsThe Board has at least four scheduled meetings annually. In addition to the four scheduled meetings, the Board met on four further occasions during the past year to discuss specific matters of importance. Over and above these meetings, the Board devoted one full day to overall strategic planning of the Group. A table indicating attendance bydirectorsatBoardandCommitteemeetings issetoutonpage54.Non-executivedirectorsmetwith theChairmansix times during the year, without the other executive directors present.
Appointments, induction and developmentAppointment of both executive and non-executivedirectors is a matter for consideration and approval by the Board as a whole, upon recommendation by the Nomination Committee. The Board ensures thatprocedures for appointments to the Board are formal,
rigorous and transparent. All new directors undergo an
Dimension Data Annual Report 2009 49
reached their ninth year of appointment as independent non-executive directors in July 2009.Whilst Rory Scottwillbeavailableforre-election,DorianWharton-Hoodwillnotseekre-election.
Re-election of all directors seeking re-election isrecommended.
Conflict of interestDuring the year the Board reviewed its procedures in the light of the Companies Act 2006, and put in placeprocedures for the review of actual or potential conflicts of interest and authorisation by the Board if deemed appropriate. During the 2009 financial year, none of the Company’s directors was materially interested in anyproposed transactions.
VenFin Limited is a 25% shareholder in Seacom, anunderseafibrecompanywhichrunsfromSouthAfricaupthe east coast connecting various African countries andultimately terminating in London and Mumbai. InternetSolutions has acquired a 20 year Indefeasible Right of Use (IRU)ontheSeacomCableatthegoingcommercialrateinanarm’slengthtransaction(refertoNote17).
Board committeesThe Board delegates specific responsibility to three committees,namelytheAuditCommittee,RemunerationCommittee andNomination Committee, which operatewithin written terms of reference available on request from the Company Secretary or on the Company’swebsitewww.dimensiondata.com.AllBoardcommitteesare authorised to engage services of external advisors at theCompany’sexpense,whereappropriate.
Executive CommitteeThe Executive Committee, which meets fortnightly, hasresponsibility for the day-to-day running of the businessandtheexecutionoftheGroup’sstrategy.MembersoftheExecutiveCommitteearelistedonpages38and39.
Audit CommitteeMembershipRory Scott (Chairman)Rupert BarclayLeslieBergmanPeterLiddiard
During the year ended 30 September 2009 the AuditCommitteecomprised fournon-executivedirectors, threeofwhomareconsideredindependent.WhilstPeterLiddiard
is not regarded as independent given his association
In order to be regarded as independent, non-executivedirectors are required to be independent of judgement and character and free from business or other relationships that could materially interfere with the exercise of their judgement. The Company believes that the value ofcontribution and evidence of continued display of independent judgement should be the point of reference for determining tenure of Board members, rather than subjective term limits.
Whilst Rory Scott has served as an independent non-executive director since July 2000, it is the view of the Nomination Committee and the Board that he remainsindependent. He continues to act in the interests of the Group, with the primary aim to maximise shareholder return and to grow the Group in line with its strategic goals. His tenureasnon-executivedirectordoesnotinterferewithhisability to maintain his independent judgement and character or his ability to effectively execute his responsibilities as independentnon-executivedirector.Givenhisexperienceand long term perspective on the Group’s business, he continues to make a valuable contribution to the Board, the RemunerationCommitteeandtheAuditCommittee,whichhe chairs. Although Dillie Malherbe and Peter Liddiardare not regarded as independent, given their association withVenFinLimitedandVenFinDDHoldingsLimited, theCompany regards their contribution to the Board andcommittees on which they serve as beneficial to both theCompanyand its shareholders.Rory,Dillie andPetercontinue to constructively challenge strategy proposed by theChiefExecutiveOfficer,scrutiniseperformanceacrossthe Group, assess risk and integrity of financial information and ensure that remuneration and succession planning arrangements are appropriate.
Retirement by rotationIntermsoftheArticlesofAssociationdirectorsareobligedto retire in the third calendar year following the year in which theywereelectedorlastre-electedbytheCompany,afterwhich theymay be available for re-election. In addition,alldirectorsappointedsincethepreviousAnnualGeneralMeeting are required to stand for election at the firstAnnualGeneralMeetingfollowingtheirappointmenttotheBoard. Brett Dawson, Patrick Quarmby, Dillie MalherbeandPeterLiddiardretirebyrotationandwillbeavailableforre-election.
The Articles of Association further provide that all non-executive directors that have served for a period exceeding nine years are obliged to retire annually and may be available for re-election. Accordingly, Dorian Wharton-Hood and Rory Scott are required to retire annually as they

50 Dimension Data Annual Report 2009
Corporate governance report(continued)
Committeeensuresthatkeyauditpartnersarerotated
atappropriate intervals.UnderthecurrentUKAuditing
Practices Board Ethical Standards, no audit partner
should act as engagement partner on an account for
more than five years. The partner currently responsible
for the Group audit has held that position for five years
and, accordingly, following the completion of the audit
of the 2009 financial year, a new audit partner has been
selected for the 2010 financial year.
Following consideration of the performance and
independence of the external auditors, the Audit
Committeerecommendedthecontinuedappointmentof
DeloitteLLPforthe2010financialyearandaresolution
proposingthereappointmentofDeloitteLLPasauditors
to the Group will be put to shareholders at the upcoming
AnnualGeneralMeeting.
DeloitteLLPhasbeentheauditorsof theGroupsince
listing in 2000. The audit has not been put out to tender
during this period. The Audit Committee will continue
to review the position annually. There are currently no
contractual obligations that restrict the Group’s choice
of external audit firm.
Priortocommencementoftheaudit,theCommittee
discusses and reviews the scope of the audit,
particular areas of focus or concern and the Group
materiality level with the external auditors. The
Committeealso reviewsandapproves theLetterof
Engagement.
To ensure independence, approval must be obtained
fromtheAuditCommitteeattheendofthefinancial
year for audit and tax servicesprovided.Non-audit
services exceeding $50,000 on an individual basis or
$250,000 in total must be separately approved by the
AuditCommittee.Detailsof thesplitbetweenaudit
and non-auditwork can be found inNote 6 of the
annualfinancialstatements.TheAuditCommitteeis
of the opinion that the approvals required for audit
andnon-auditservices,togetherwithothercontrols
in place within the Group, are sufficient to ensure
the objectivity and independence of the external
auditors. During the period, the Audit Committee
met with the external auditors four times, once
withoutmanagementpresent.TheAuditCommittee
Chairman also met with the auditors on two other
occasions.
withVenFinLimitedandVenFinDDHoldingsLimited, the
knowledge, skill and experience he contributes to the
Audit Committee is highly valued and it was decided to
retain him as a member of the Audit Committee. Given
that Rory Scott has been a member of the Board for a
periodofnineyears,theNominationCommitteeandBoard
considered his independence and are of the opinion that he
is sufficiently independent of judgement and character to
remain independent of management despite his long tenure
as non-executive director. The Board considers that the
Committee members have sufficiently broad commercial
knowledge and recent and relevant financial experience
for purposes of the Combined Code. Three members,
beingRory Scott, Rupert Barclay and Peter Liddiard are
qualifiedcharteredaccountants.LeslieBergmanhasaBSc
inEngineeringandanMBA.
During the year the Audit Committee reviewed and
updated its terms of reference, incorporating the changes
recommended in the FRC’s 2008 Guidance on Audit
Committees,andrecommendedapprovalbytheBoard.
Meetings
TheAuditCommitteetypicallyhasfourscheduledmeetings
annually,beingNovember,February,MayandSeptember.
Additionalmeetingsmaybecalledasandwhenrequired.
A table showing attendance at committee meetings is
availableonpage54.TheAuditCommitteemeetswiththe
external auditors without management present on at least
oneoccasion.Theexternalauditors,ChiefFinancialOfficer,
Group Risk Manager and Internal Audit team, although
not members of the Audit Committee, attend meetings
upon invitation by the Chairman of the Committee. The
ChairmanoftheCommitteereportsonproceedingsatthe
next meeting of the Board and minutes of meetings are
circulated to all members of the Board.
Role and activities
The roleandactivitiesof theAuditCommitteeduring the
2009 financial year can be summarised as follows:
• Externalaudit
The Audit Committee considers appointment,
reappointment, resignation or dismissal of external
auditors and makes recommendations to the Board for
appropriate action. It also reviews the performance and
independence of the external auditors and considers and
approves the proposed audit fees. When considering
their independence, the safeguards and procedures
undertaken by the external auditors are reviewed
to ensure their independence and objectivity. The

Dimension Data Annual Report 2009 51
• Financialstatements TheAuditCommitteereviewsthehalfyearandannual
financial statements for the period, and considers matters such as the appropriateness of accounting policies, decisions requiring a major element of judgement, compliance with accounting standards, a review of business and key performance indicators, the going concern assumption and the statement on internal control.
• Performanceevaluation The Audit Committee evaluates its performance and
effectiveness as part of the formal annual Board evaluation process. Self evaluation questionnaires are utilised for this purpose. Based on the results of the September2009evaluation,theCommitteeandBoardbelieve that the Committee functions effectively andcomplies with its terms of reference.
Remuneration CommitteeMembershipWendyLucas-Bull(Chairman)DillieMalherbeRory ScottDorianWharton-Hood
DetailsoftheRemunerationCommitteeanditsactivitiesarecontained in the Remuneration Report on pages 62 to 68.
Nomination CommitteeMembershipJeremy Ord (Chairman)DorianWharton-HoodRupert Barclay
Role and activitiesThe Nomination Committee is responsible forrecommending board appointments and considering succession planning to ensure that the Board and its committees comprise executive and non-executivedirectors with an appropriate balance of experience, knowledge and skills to deliver the strategic direction and leadership required for the Group’s success. Whilst Jeremy Ordisnotindependent,heis,asChairmanoftheBoard,considered to be the most appropriate person to chair the Nomination Committee. Rupert Barclay, the seniorindependentnon-executivedirector, isalsoamemberoftheNominationCommittee.
The Committee met once during the year under reviewand reviewed thesizeandcompositionof theBoardand its committees as well as Board succession. It furthermore
• Internalauditandriskmanagement The Group’s internal audit work is performed by the InternalAuditteamaswellasPricewaterhouseCoopers.The Audit Committee reviews and approves thescope, effectiveness and results of the internal audit programme within the Group. It also considers and makes recommendations to the Board with regard to the resource requirements within the internal audit department.
TheCommitteereviewstheeffectivenessoftheGroup’sinternal controls, including financial, operational and compliance controls, as well as its procedures and systems for identification, assessment and reporting of risks. It reviews and considers reports on risk management processes and procedures to ensure that material business risks, including IT security and fraud, are identified and appropriately managed. Management’s responsiveness to findings andrecommendations of the internal audit function is also closely monitored.
The Committee reviews the Group’s assessment ofthe risk of fraud and the design and implementation of internal controls to prevent and detect fraud. The Committee furthermoreassesses the risk thatfinancialstatements may be materially misstated as a result of fraud.
The Committee reviews and monitors processes fordealing with complaints and submissions in terms of the Company’s Ethics Code and WhistleblowingPolicy (copies of which are available on theCompany’s website), ensuring that such complaintsand submissions are sufficiently and independently investigated and followed up. The Ethics Code andWhistleblowingPolicyareintendedtoassistindividualswho believe they have discovered serious malpractice to take appropriate action. The Audit Committeeis satisfied that these arrangements provide for proportionate and independent investigation of matters reportedandforappropriatefollowupaction.TheAuditCommittee monitored two whistleblowing mattersduring the year, all having been thoroughly investigated and satisfactorily resolved.
The heads of the PricewaterhouseCoopers internalaudit team and the Internal Audit team have directaccess to theChairmen of both the Audit Committeeand the Board. The internal audit teams met with the Audit Committee four times during the period underreview and separately with the Chairman of the AuditCommitteeontwofurtheroccasions.

52 Dimension Data Annual Report 2009
Corporate governance report(continued)
The Annual General Meeting provides an opportunity tocommunicate directly with shareholders. The chairmen of the Audit, Remuneration and Nomination committeesare available at the meeting to answer questions from shareholders. Notice of the Annual General Meeting isenclosedwithin this Annual Report. Separate resolutionsare proposed on each substantially different issue. The Companypublisheson itswebsitedetails of proxy votestogether with a summary of the business conducted at theAnnualGeneralMeeting.Directorsareencouragedtoattend the Annual General Meeting and the chairmen ofBoard committees are required to attend to answer relevant questions from shareholders.
In addition to the interim and annual reports, and interim management statements, shareholders can obtain information about the Group posted on the website www.dimensiondata.com.
IntermsoftheCompany’sArticlesofAssociationadoptedat theAnnualGeneralMeetingheldon30January2008,the Company is able to communicate electronically withshareholders. Shareholders have subsequently been given the opportunity to indicate whether they wish to receive hard copies of the Annual Report, Interim Results andother shareholder communications. Shareholders who had not indicated a preference to receive hard copies, receive notification of the availability of shareholder communications ontheCompany’swebsitewww.dimensiondata.comeithervia email or post. Shareholders may at any time revoke a previous instruction.
Ethics and whistleblowingThe Group embraces the highest standards of professional and ethical conduct in its business activities, operating in accordancewith an EthicsCode that is distributed toemployees via the corporate intranet. Our business approach is competitive but also characterised by integrity, frankness and goodwill. Trust and openness are vital components of our interactionswith clients and shareholders. A copyof the Ethics Code is available on the Group’s website, www.dimensiondata.com.
The Group has a formal Whistleblowing Policy whichsupports the Ethics Code by providing a channel foremployees, clients, vendors and other stakeholders to voice concerns in a responsible and effective manner. It ensures that any suspicions or misgivings that arise can be actioned and resolved without fear of reprisal or prejudice. Harassment or victimisation of whistleblowers is not tolerated. Concerns included in the scope of theWhistleblowingPolicyinclude:
reviewed the contributions made to the Board by Dillie Malherbe, Peter Liddiard and Rory Scott, all ofwhomare retiringby rotation at the forthcomingAnnualGeneral Meeting. The Committee concluded that whilstDillie Malherbe and Peter Liddiard are not regardedas independent given their association with VenFin Limited and VenFin DD Holdings Limited, they make avaluable contribution to the experience, knowledge and effectiveness of the Board and committees of which they are members.
Given that Rory Scott has completed his ninth year as an independent non-executive director, the Committeeconsidered his independence and concluded that he remains sufficiently independent of judgement and character to be considered independent of management. His contribution to the effectiveness of the Board, AuditCommittee and Remuneration Committee was alsoregarded as significant and the Committee recommendshisre-electionasnon-executivedirector.HissuccessionasChairmanof theAuditCommittee isbeingconsideredbytheNominationCommittee.
The Nomination Committee is in the process ofconsidering the appointment of an independent non-executivedirector to replaceDorianWharton-Hoodwhois retiring, as well as one additional independent non-executive director, at least one of whom would be required to have industry specific knowledge and experience. Discussions with potential candidates are still in progress andnorecommendationhasyetbeenmade.Neitheranexternal search consultancy nor open advertising has been considered at this stage.
Communication with shareholdersThe Group is committed to honest, open and regular communication with shareholders on financial and non-financialmatters.
The Group reports its half year and full year results formally to shareholders and provides interim management statements twice a year. Effectivecommunication with institutional investors, analysts and the media is maintained through presentations by executives and senior management. Meetings areheld to update the market on the Group’s strategies, operations and performance. Executive and seniormanagement attend these meetings on a regular basis. Briefings and meetings are conducted in line with the Group’swrittenguidelinestoensurecontroloverprice-sensitive information and equality of disclosure.

Dimension Data Annual Report 2009 53
• financialmalpractice,improprietyorfraud;• failuretocomplywithlegalobligations;• dangerstohealth,safetyortheenvironment;• criminalactivity;and• improperconductorunethicalbehaviour.
Procedures for making a disclosure are set out in theWhistleblowingPolicy,acopyofwhich isavailableonthewebsite.PrincipalcontactsfordisclosurepurposesaretheGroupRiskManager,CompanySecretaryandChairmanoftheAuditCommittee.
Risk management and internal controlUltimate responsibility forRiskManagementStrategyandsetting the Group’s risk appetite lies with the Board.
TheGroup’sRiskManagementframeworkconsistsofthreedistinct areas:(1) Functionsowningandmanagingrisk:TheGroupChief
Executive,supportedbytheRegionalChiefExecutivesandtheGroupExecutiveCommittee(OpsExco),hasoverall responsibility for the management of risk.
(2) Functionsoverseeingthemanagementofrisk:ThisismadeupoftheGroupRiskManager,supportedbytheGroup Risk and Regional Risk functions.
(3) Functions providing independent assurance: TheGroup Audit Committee, supported by the InternalAudit function, provides independent assurance onthe effectiveness of Risk and Control managementsystems throughout the Group.
TheRiskManagement programme provides assuranceto the Board on all matters concerning Group Risk, including strategic, operational, financial risk and compliance, focusing in particular on the risks to the achievement of Dimension Data’s business objectives. During September 2009, Group executives participated in a formal risk identification and evaluation process to refresh the Group Risk Register, which describes and rates risks and mitigation strategies. The Group’s currentkeyrisksarediscussedunderPrincipalrisksanduncertainties on pages 36 and 37.
Internal controls are designed to manage rather than eliminate risks, and to provide reasonable, rather than absolute assurance against material misstatement or loss. The internal audit function performs a structured review of internal controls based on risk assessment.
TheAuditCommitteeregularlyreviewstheworkplanandkey findings of the internal and external audit process and
monitors progress to ensure that areas of weakness are addressed. Responsibility for implementing controls and improvements lies with business unit or regional level management. The Audit Committee has delegated theday-to-day responsibility for review of the Group RiskRegistertotheGroupRiskManagerandtheInternalAuditteam.
The Board is satisfied that the necessary actions that are reasonable in the circumstances have been or are being taken to remedy minor failings and weaknesses identified from review of the system of internal control.
The processes described above have been in place for the yearunderreviewuptothedateofapprovaloftheAnnualReportandaccounts.TheAuditCommitteeandtheBoardregularly review these and are satisfied that the system of InternalControl is in linewith the revisedguidance assetout in ‘InternalControl:Guidance forDirectorsontheCombinedCode’issuedbytheFRCinOctober2005.
Financial reportingTheChief Financial Officer is responsible for establishingGroupfinancialpolicyand,withtheChiefExecutiveOfficer,for execution thereof. TheChief ExecutiveOfficer is alsoresponsible for the integrity of forecast information upon whichexecutivedecisionsarebased.Abudgetingprocesstakes place annually, culminating in review and approval by the Board. Each business unit reports actual and forecast revenue,profitabilityandcashpositionmonthlytotheChiefFinancialOfficer.TheChiefFinancialOfficerconsiderstheseagainstprevious forecasts and budget, and reports to the Board quarterly.Inaddition,theChiefFinancialOfficerdistributesmonthly management accounts to the directors.
Controls over business unit risks include reviews againstperformance indicators and exception reporting. Business units’ senior management are responsible for identifying, evaluating and managing business risks. There are channels of communication available to report significant risks to the Board if necessary.
Financial reporting is performed according to a strict schedule. Non-executive directors are provided withinformation to enable them to reach independent conclusions on matters brought to their attention at Board meetings. The Board ensures that each director is provided with appropriate and timely information in order to exercise his or her judgement.

54 Dimension Data Annual Report 2009
Corporate governance report(continued)
AuditCommitteeinSeptember2007)arenotconsideredtobeindependentduetotheirassociationwithVenFinLimitedandVenFinDDHoldingsLimited.
The Board considered the implications of the roles of both Dillie Malherbe and Peter Liddiard at VenFin Limited andVenFin DDHoldings Limited and concluded that this wouldnot compromise the independence of their input to these committees. Given their representation of a major shareholder, the Board strongly believes that they are well-aligned withshareholder concerns, particularly with regard to remuneration. Asat30September2009VenFinDDHoldingsLimitedheld25.34%oftheCompany’ssharecapital.
Political donationsThe Group made no political donations during the year. It remains theCompany’s policy that no company in theGroup will make contributions in cash or in kind to any political party.
Compliance statementThroughout the year ended 30 September 2009 the Company has been in compliance with the provisionssetoutinSection1ofthe2008FRCCombinedCodeonCorporateGovernancewiththeexceptionthat:
DillieMalherbe(appointedtotheRemunerationCommitteeinSeptember2004)andPeterLiddiard (appointed to the
Attendance at meetings during the period
Name Board (8) Audit (4) Remuneration (4) Nomination (1)
JJ Ord 8 – – 1BW Dawson 8 1* – –SMJoubert 7 – – –PKQuarmby 8 – – –DB Sherriffs 8 4* – –RGMLBarclay 8 4 – 1LFBergman 7 4 – –PJLiddiard 8 3 – –WLucas-Bull 7 – 4 –JMalherbe 7 – 4 –MMNgoasheng 7 – – –RMScott 8 4 4 –PDWharton-Hood 8 – 4 1
*By invitation
By Order of the Board
Sanet HeydenrychSecretary
17November2009
Dimension Data Annual Report 2009 55
Corporate responsibility report
OverviewDimension Data operates globally, spanning five
continents and over 48 countries. The Group is aware of
its responsibilities as a global corporate citizen not only
to deliver value and profit to shareholders, but also to
adhere to a code of ethical conduct; to provide a fair and
unprejudiced employment framework for its employees;
to deliver solutions that answer the environmental
requirements of our clients; and to ensure that we operate
as sustainably as is practical.
During the year ended 30 September 2009 we have
continued to review our corporate responsibility programme,
including the risks to the value of the Group associated with
ethical, environmental and social issues.
Our responsibility to our employees is one of our key
responsibilities, and the enthusiasm and dedication of our
people is essential for our continued success. Information
on our policies in relation to our people and culture is
included in this report.
Dimension Data aims to integrate its Corporate
Responsibility programme into the Group’s values,
operations and business decisions at all levels, promoting
an ethical and sustainable corporate culture. This report
focuses on the progress made during the year in relation to
our people, our environmental and our social programmes.
Further details on ethics and governance can be found in
theCorporateGovernanceReport.
People and cultureAs a global organisation, Dimension Data embraces the
differences that every employee brings to the Group,
recognising that a workforce which reflects the diversity
of the clients it serves, is better able to understand their
expectations and more likely to have the skills and
knowledge needed to deliver innovative products and
services.
Global employment policies
The Group’s employment policies are developed to reflect
local legal, cultural and employment requirements. The
Group seeks to maintain high standards wherever we
operate, so as to ensure that we are recognised as an
employer of choice.
Human rightsDimension Data’s operations globally support the principles as outlined in the Universal Declaration of Human Rights. In particular:• DimensionData does not employ underage staff. The
minimum age for employment should be no less than the age for completing compulsory schooling.
• Employeesarenotrequiredtoworkmorethana40hourweek unless contractually agreed otherwise with employees because of the online service nature of their employment.
• Group companies adhere to the global equalopportunities policy, and there is a global policy of freedom of association.
Equal opportunities and diversityDimension Data is committed to providing a working culture that is inclusive to all. It is Group Policy to ensure andpromote equal employment opportunities to all applicants for employment and to all employees throughout their period of employment with the company, regardless of their race, colour, sex, sexual orientation, religion, creed or national origin. The Group recognises its obligations to ensure that people with disabilities are afforded equal opportunities and progress within the company. Should existing members of staff become disabled, steps will be taken, through appropriate adjustments to their work environment or retraining or redeployment if necessary, to enable them to remain in employment within the Group wherever possible.
Health, safety and wellbeingThe Group takes responsibility for the health and safety of its members of staff and of all visitors to its sites. It aims to create a flexible, ordered environment which facilitates and supports its business and in which it maintains, so far as is practicable, safe and healthy conditions, equipment and systems of work for everyone. In pursuing this objective, it provides its members of staff with the relevant information, training and supervision, which they need to ensure their health and safety at work. The Group has a continuous focus on the implementation of wellbeing initiatives across the business.
Ethical CodeTheDimensionDataGrouphasapubliclyavailableEthicalCodethatstatesthatitembracesthehigheststandardsinits business activities. It is open, honest and considerate in its dealings with clients, suppliers, employees, associates

56 Dimension Data Annual Report 2009
Corporate responsibility report(continued)
and all groups and individuals with whom it has contact and dealings. The Group will observe the laws of any country in which its business is transacted. Employeesshould take adequate measures to ensure that, in the areas of their involvement, the company complies with all legal requirements and regulations, including but not limited to tax and exchange laws and regulations. Whenever possible, and excluding contracts drawn up under a global contract arrangement, contracts will be drawn up under the law of the country in which the Groupcompanyistrading.Corruptorillegalpracticeswillnot be countenanced. All business transactions will becompletelyandproperlyrecorded.Clientsaretreatedwiththe utmost confidentiality. The Group does not participate inanyillegalanti-competitiveactivity.
Our employeesThe Group employed an average of 10,915 people worldwideduringthefinancialyear(2008:10,355).Detailsof employee related costs are included in Note 7 to thefinancial statements.
The Group’s people and culture strategy aims to attract, engage, develop and retain the best people by providing a stimulating and safe working environment, offering attractive performance based incentives and rewarding career opportunities.
AttractWe believe that talent drives competitive advantage. During the year ended 30 September 2009 we completed a project to redefine and illustrate our Employee ValueProposition(EVP) to improveourability toattractandengagequalitytalent.TheEVPenablesDimensionDatatodistinguishouremployment offer, to attract more candidates with a better fit to the Group culture and to enhance retention through improvedloyaltyandcommitment.Anewcareersbrochure,a range of emotive posters and a variety of electronic and print materials have been developed and deployed both internally and in the marketplace to communicate our value proposition. Our careers site on our external website, www.dimensiondata.com, has been updated to feature our EVPandgreatestmomentsstories.
Akeyelementofourrecruitmentstrategyduringtheyearended 30 September 2009 has been the deployment of the internationallyrecognised,e-recruitmentapplication,Taleo.To date we have rolled out the Taleo system for our Group staff and to four of our regions.
Engage
We believe that a common value system encourages the
positive behaviours that help us to achieve our vision and
which make Dimension Data a great place to work. Our
values serve as a guide to how we treat our clients, our
people, our shareholders and our associates. The values
that we aspire to are:
• Teamwork – working together and sharing ideas,
knowledge and resources across teams and borders
so as to achieve the desired objectives;
• Commitment–beingaccountable,passionate,
dedicated and driven, and ensuring we get the job
done;
• ProfessionalExcellence–buildingbusinessandclient
relationships on a solid foundation of trust and pride
and consistently delivering the highest quality service;
• Proactivity–lookingfornewopportunitiestoaddvalue
and continually improve performance;
• Partnerships–developinglongtermrelationshipswith
stakeholders based on integrity and honesty; and
• MulticulturalStrength–respectingeveryindividualand
leveraging the diversity of opinions and cultures so that
we can learn from others.
We regularly communicate information to our employees
on matters of concern, including financial and economic
factorsaffectingtheperformanceoftheCompany,bothat
agroupand regional level.Communication iscarriedout
through regular face to face meetings, quarterly reviews,
Leadership Forum engagements, Global and Regional
CEO columns and our bi-weeklyGlobalWeeklyWindow
newsletter on our Dimension Data Intranet. Employee
feedback and questions on matters that affect them are
always invited in these communications.
Performance management is a further key aspect of
employee engagement. The Dimension Data performance
management philosophy is to build a high-performance
organisation through setting and measuring agreed
goals and rewarding sustained and improved levels of
performance. We operate a globally consistent performance
management process, which is formalised, understood,
fair and consultative, and which requires each individual’s
performance to be reviewed formally with his or her manager
every six months. In the year ended 30 September 2009,
93% of employees completed a performance promise
(2008:94%).

Dimension Data Annual Report 2009 57
At Dimension Data performance management aligns
employeeperformancewithGroupperformance.Annual
goals are set at the beginning of the financial year and
then reviewed mid-year and at year end, which affects
employee short term incentives. We also have long term
incentives in the form of share incentive schemes which
extend beyond the Board to include key talent throughout
the organisation. Details of these incentive schemes
appearintheRemunerationReportandinNote37tothe
AnnualFinancialStatementsonpages107to111.
Develop
Dimension Data is committed to helping its people
reach their full potential through ongoing training and
development.OurCorporateUniversityDDUoffersavariety
of development resources that encourage professional
and personal development at every level throughout the
organisation. DDU provides a broad range of initiatives,
including technical and sales training, management,
leadership and personal development.
DDU online is our repository of all online learning, both
licensed and custom built. During the year ended
30 September 2009 we significantly increased the number
of online titles available to all employees from 62 to 135
titles – providing employees with flexible access to a world
of knowledge. During the year ended 30 September 2009
$8.0 million was spent on training and 19,549 module
registrations were received on DDU online.
Within the Group, career development is supported by a well
defined career process and a global career development
centre.
During the period under review the Dimension Data Job
Framework was executed against the majority of our
technical job families within the Group. The Job Framework
is a structure of job definitions and sets out competency
requirements for different jobs, roles, and the training,
assessmentandcertificationsneededtofacilitatehorizontal
and vertical career development.
Retain
Succession planning and the identification and development
of our leadership talent remains a key priority for the Group.
TheLeadershipForumisaglobalinitiativefocusingonthis
businessneed.TheLeadershipForumcomprisesaselected
group of approximately 500 of our key leaders around the
world, with the objective of identifying and growing leaders
within the business. During the year ended 30 September
2009,theforumcontinuedtoemploya‘Connect-Develop-
Deploy’ methodology to further the leadership abilities of
participants.
In order to support and develop our managers, and to
improveourcapacity to lead,wedesignedaworld-class
development programme for all line managers. ‘Leading
Talent @ Dimension Data’ focuses on the role and impact
managers have on the rational and emotional commitment
of our people, thereby driving high performance and
retention. This programme has become Dimension Data’s
flagship management development programme and was
rolled out to 969 managers globally.
Dimension Data’s aim is to embed a culture of recognition
throughout the organisation by means of a variety of global
and local recognition programmes. These range from
employeedrivenprogrammes,suchasSpotAwardsand
High5intheAmericasorAppreciationAwardsinAustralia,
to formal quarterly or annual programmes such as the
European Excellence Award or CEO Excellence Awards.
Wealsohavehealth-orientedprogrammessuchasActive
forLifewhichencourageandcelebratehealthandfitness,
and long service awards, celebrating long term commitment
to the Group.
During the year ended 30 September 2009 we
launched the worldwide Dimension Data Hall of Fame,
a recognition programme which acknowledges the
outstanding contributions of our top technical talent.
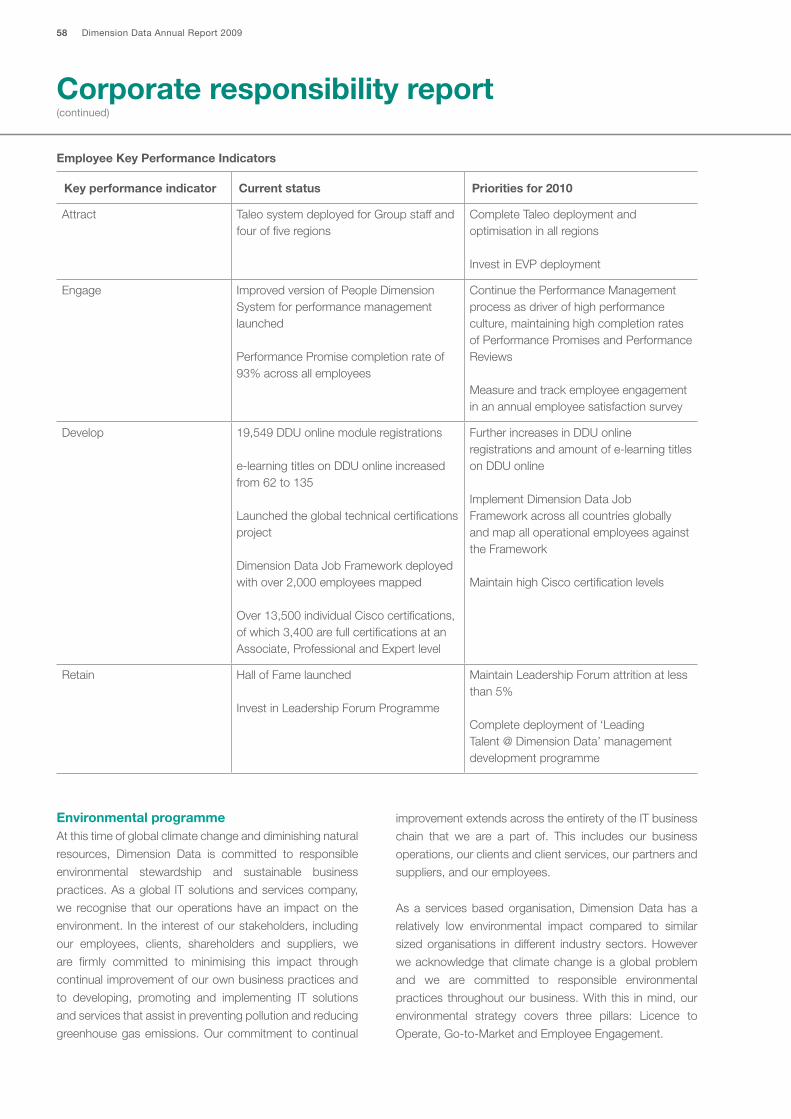
58 Dimension Data Annual Report 2009
Corporate responsibility report(continued)
Employee Key Performance Indicators
Key performance indicator Current status Priorities for 2010
Attract Taleo system deployed for Group staff and four of five regions
CompleteTaleodeploymentandoptimisation in all regions
InvestinEVPdeployment
Engage ImprovedversionofPeopleDimensionSystem for performance management launched
PerformancePromisecompletionrateof93% across all employees
ContinuethePerformanceManagementprocess as driver of high performance culture, maintaining high completion rates ofPerformancePromisesandPerformanceReviews
Measureandtrackemployeeengagementin an annual employee satisfaction survey
Develop 19,549 DDU online module registrations
e-learningtitlesonDDUonlineincreasedfrom 62 to 135
Launchedtheglobaltechnicalcertificationsproject
Dimension Data Job Framework deployed with over 2,000 employees mapped
Over13,500individualCiscocertifications,of which 3,400 are full certifications at an Associate,ProfessionalandExpertlevel
Further increases in DDU online registrationsandamountofe-learningtitleson DDU online
Implement Dimension Data Job Framework across all countries globally and map all operational employees against the Framework
MaintainhighCiscocertificationlevels
Retain Hall of Fame launched
InvestinLeadershipForumProgramme
MaintainLeadershipForumattritionatlessthan 5%
Completedeploymentof‘LeadingTalent @ Dimension Data’ management development programme
Environmental programmeAtthistimeofglobalclimatechangeanddiminishingnatural
resources, Dimension Data is committed to responsible
environmental stewardship and sustainable business
practices.Asaglobal ITsolutionsandservicescompany,
we recognise that our operations have an impact on the
environment. In the interest of our stakeholders, including
our employees, clients, shareholders and suppliers, we
are firmly committed to minimising this impact through
continual improvement of our own business practices and
to developing, promoting and implementing IT solutions
and services that assist in preventing pollution and reducing
greenhouse gas emissions. Our commitment to continual
improvement extends across the entirety of the IT business
chain that we are a part of. This includes our business
operations, our clients and client services, our partners and
suppliers, and our employees.
Asa servicesbasedorganisation,DimensionDatahas a
relatively low environmental impact compared to similar
sizedorganisations indifferent industry sectors.However
we acknowledge that climate change is a global problem
and we are committed to responsible environmental
practices throughout our business. With this in mind, our
environmental strategy covers three pillars: Licence to
Operate,Go-to-MarketandEmployeeEngagement.

Dimension Data Annual Report 2009 59
Licence to Operate:This aspect of our environmental policy covers our compliance with local and international environmental legislation and our commitment to measuring, monitoring and ultimately reducing our carbon footprint. In 2009, Dimension Data responded to the Carbon DisclosureProject (www.cdproject.net) for the second time,including transparent reporting of our global Greenhouse Gas Emissions (‘GHG’) inventory. Dimension Data alsocommenceddeploymentofanEnvironmentalManagementSystem(‘EMS’)inthreepilotgeographies–UnitedKingdom,South Africa and Australia. Our EMS employs the ISO14001 framework and provides a platform for developing programmes to manage our energy consumption, business travel and waste management.
Go-to-Market:Dimension Data offers a range of solutions and services that can significantly reduce business energy consumption and business travel for our clients. These offerings support our clients’ requirements to reduce their environmental impact and include: data centre virtualisation and consolidation, data centre power and cooling, data centre design and
architecture, virtual meeting options using a variety of visual communications technologies, e-Procurement, andnetwork assessment tools.
Employee Engagement:Conservation of the environment is a cause that ouremployees take seriously. In response to requests from employees for further information, and as a method to facilitate information sharing, we deployed Greenpoint, an environmental site on our intranet which contains white papers, presentations and general environmental education. Through Greenpoint, the Group deployed a Green PhotoCompetition in2009,seekingsubmissionsofphotographsfrom employees on the beauty of our environment, as well as evidence of its destruction through human behaviour. We also established environmental thinktanks in all of our regions where employees volunteer from all divisions within Dimension Data to meet on a regular basis with the charter to ensure the enhancement of our environmental strategy in their region. In 2010, Dimension Data will launch an environmental e-learning module as part of our DDUdevelopment tool which will provide all employees with an overview of our sustainability strategy.
Environmental Key Performance Indicators
Key performance indicator Current status Priorities for 2010
Environmentalcompliance Continuedtoworkwithaspecialistprofessional services firm to manage our GHGinventoryanddevelopourEMS
CompletedoursecondsubmissiontotheCarbonDisclosureProject(CDP)
CompletedfirstrevisionofourCarbonManagementPlan
CommenceddeploymentofourEMSinthreepilotgeographies–UnitedKingdom,SouthAfricaandAustralia–usingtheISO14001 framework
ContinuetheimplementationofourEMSwith the potential to expand to further geographies
Energyconsumption Energyefficiencyimprovementshavebeencarried out in our own data centres with ongoing reductions in numbers of servers inNorthAmerica,EuropeandAustralia
GlobalandEuropeanITsystemstobe hosted in two data centres with a significant commitment to consolidation and virtualisation
PilotofpowermanagementsoftwareinEuropetoreducepowerconsumptionofnetwork devices
Continuetoreduceouremissionsintensitythrough emissions reduction programmes outlinedinourEMS

60 Dimension Data Annual Report 2009
Corporate responsibility report(continued)
Key performance indicator Current status Priorities for 2010
Business travel Deployment of 140 Tandberg and eight TelePresenceunitsgloballytoreducetravelcosts and increase efficiency
Continuetosupportgroupandlocaltravelpolicies in reduction of business travel
Internal communications and education on the use of collaborative tools
Electronicwaste Focus on the management of electronic wasteaskeyaspectofourEMS
Workshops held in each of the three pilot geographies to identify current process, gaps and required improvements
Develop robust programmes to ensure the responsible disposal of electronic waste internally as well as on behalf of our clients
in their communities and assisting disabled students. InAustralia over $200,000worthof staff timehasbeenvolunteered during the year ended 30 September 2009. The volunteering programme there is organised in each state by a volunteering team leader who co-ordinatesactivity, ensuring that the volunteering programme makes a meaningful difference to local communities, and affords staff with the opportunity to develop their skills and talents increativeand innovativeways.Anexample is theworkundertakenattheMarianCentre,arefugeforwomenandchildren, where, following on from the refurbishment of a LearningRoom,DimensionDatastaffnowvolunteeratthecentre every Thursday afternoon to supervise and engage with the children.
Charitable donationsAsia’s Carecraft programme provides one of many
examples of charitable giving throughout the Group. The
programme has operated in partnership with World Vision
since 2005 and in January 2009 achieved the objective of
one child sponsored per nine employees, exceeding the
target of one child sponsored per ten employees set in
September 2008. Total charitable donations for the Group
for the year ended 30 September 2009 were $281,000
(2008:$229,000).
Black Economic Empowerment (‘BEE’) in South AfricaDimensionDatahasaligned itsBEEstrategy to theSouth
AfricanDepartmentofTradeandIndustry’sCodesofGood
Practice issued in termsofSection9of theBroad-Based
Black Economic Empowerment Act No. 53 of 2003 (‘the
Codes’). Intheyearended30September2009,wemade
further strides to achieving our transformation targets through
a continued focus on equity ownership, management
control, employment equity, skills development, preferential
procurement,enterprisedevelopmentandsocio-economic
Social and communityOur social and community engagement initiatives are regionally organised and employee inspired. Regional schemes such as Asia’s Carecraft initiative, America’sNetwork of Hope and Australia’s Heads, Hearts andHands programme ensure that the activities undertaken are sensitive to local legal frameworks, respect local sensibilities and social mores, and reflect community requirements and priorities. Community initiatives,volunteering projects and to a lesser extent, charitable donations, including donations through workplace giving, are all promoted under these regional programmes, with BlackEconomicEmpowerment (‘BEE’) remaining a vitalpartoftheprogrammeinSouthAfrica.
Community initiativesExamples of our community initiatives include theDimension Data Saturday School in South Africa whichwas established in 1995 and has now expanded to include theDimensionData e-Learning programme andDimension Data Bursary Scheme. In the financial year ended 30 September 2009, 51 learners attended the Saturday school while 50 schools and 5,000 learners participatedinthee-Learningprogramme.Altogetherover11,000 learners have participated in these schemes since their inception and the Bursary scheme has now assisted 13 underprivileged learners to study at University.
VolunteeringThroughout the Group employees are encouraged to take up volunteering opportunities. In America eight hoursper annum per employee are allotted for volunteering activities, with employees having the ability to volunteer in a planned office activity or their own personal choice of volunteer activity. In the current year Americanemployees have volunteered over 680 hours to activities such as working in homeless shelters, providing painting, landscaping and fencing work to assist the less fortunate

Dimension Data Annual Report 2009 61
development. During the financial year our suppliers were
providedwithassistance inbecomingBEEcompliantwith
the aim of contributing towards Enterprise Development
aswellas increasingthepercentageofBEEsuppliersthat
Dimension Data does business with. This financial year also
marked the launch of our Employment Equity and Skills
Development Forum whose mission includes promoting
the equitable representation of employees from designated
groups through recruitment, training, retention strategies and
support mechanisms. Dimension Data has always believed
in empowering up and coming entrepreneurs and through
our enterprise development initiatives we have successfully
done so.
OurBEEinitiativesaimto:
• Continuetotransformourorganisationalandemployee
profile at every level, as per our employment equity plan,
toreflectthedemographicrepresentationofSouthAfrica
across race and gender; and
• Create capacity in our broader industry, through
facilitating skills development from secondary, and
specialised training to tertiary level and capacity creation
through preferential procurement and enterprise
development, joint ventures and investments.
Details of Dimension Data’s rating in terms of the
Codes can be found on our corporate website
www.dimensiondata.com.
Highlights of the advances we have made in the year ended
30 September 2009 include:
• Equity ownership. In accordance with the Codes,
Dimension Data (Pty) Limited is regarded as being
41.6% black owned and its percentage female
ownership is 3.23%. In the year ended 30 September
2009 we achieved a Level Three BEE Contributor
Rating and a 137.5% BEE Procurement Recognition
Level, qualifying Dimension Data (Pty) Limited as a
ValueAddingSupplier.
• Management control. We continue to see operational
management participation as the heart of our BEE
strategy. The South African organisation has now
exceeded our commitment to achieving a set target of
40%black executive directorship bymid-2006. In the
year ended 30 September 2009, 54% of the executive
directors of Dimension Data (Pty) Limited represent
previously disadvantaged individuals (PDIs) using the
AdjustedRecognitionforgender.
• Employment equity. The ultimate goal for Dimension
Data is to have a demographic profile that is reflective
of our areas of operation. This profile includes both
racial and gender complements. For the year ended
30 September 2009, Dimension Data (Pty) Limited,
SouthAfrica,attainedthefollowingpercentagesofPDI
employees:
º 22%(2008:30%)ofemployeesatseniormanagementlevel;
º 25%(2008:22%)ofemployeesatmiddlemanagementlevel; and
º 61%(2008:53%)ofemployeesatjuniormanagementlevel.
• Skills development. Ongoing training and skills
development forms the bedrock of transformation, and
is an imperative for any company aiming to develop a
competitive edge. Dimension Data recognises the long
term benefits of keeping employees motivated and more
adept. During the year ended 30 September 2009,
1,298 (2008: 3,052) people were provided with
opportunities for further education, learning and
development activities.
• Preferential procurement. Various initiatives are in
place, including preferential payment terms for black
exempted micro enterprises and qualifying small
enterprisesof 15daysandBEEvendor education to
ensurethatoursuppliersbecomeBEEcompliant.Inthe
yearended30September2009,50.7%(2008:19.1%)
of Dimension Data (Pty) Limited’s total procurement
spendwaschannelledtoBEEsuppliers.Eachsupplier
is vetted through a verification agency accredited by the
AssociationofBEEVerificationAgenciestodetermine
their ‘Broad-Based Black Economic Empowerment’
status.
• Enterprisedevelopment.DimensionDataacknowledges
the regional realities of the countries we work in. One of
thekey realities inSouthAfrica is the lackofBEE ICT
companies capable of supporting large enterprise and
public sector clients. We are committed to addressing
this challenge through our Enterprise Development
Programme,andintheyearended30September2009
contributed 20.1% of net profit after tax from Dimension
Data (Pty) Limited, South Africa, to this programme
(2008:3.8%).
• Socio-economic development (corporate social
investment).DimensionData hasmade thedecision to
focus the majority of its socio-economic development
spend on initiatives that focus on education and access to
ICT.Detailsofsomeoftheseinitiativesareincludedinthe
Community Initiatives section above. In the year ended
30 September 2009 Dimension Data (Pty) Limited has
spent over 5.8% of net profit after tax on these initiatives.

62 Dimension Data Annual Report 2009
Remuneration report
TheRemunerationCommittee presents its RemunerationReport, which was approved by the Board of Directors on 17November2009.
IntroductionThis report has been prepared in accordance with Schedule8(QuotedCompanies:Directors’RemunerationReport) to the Large and Medium Sized Companiesand Groups (Accounts and Reports) Regulations 2008(the ‘Regulations’). The report also meets the relevantrequirementsoftheListingRulesoftheFinancialServicesAuthorityanddescribeshowtheBoardappliesthePrinciplesof Good Governance relating to directors’ remuneration. As required by the Regulations, a resolution to approvethereportwillbeproposedattheAnnualGeneralMeetingof theCompany,atwhichthefinancialstatementswillbeapproved. The Regulations require the auditors to report to theCompany’smembersoncertainpartsoftheDirectors’Remuneration Report and to state whether, in their opinion, those parts of the report have been properly prepared in accordancewiththe2008CombinedCode.Thereporthastherefore been divided into separate sections for audited and unaudited information.
The Group’s remuneration policy aims, via an equitable and fair remuneration approach, to encourage a commitment to the Group and personal growth, to focus on business objectives and to encourage high performance. In the course of this year several enhancements to the Directors’ RemunerationPolicyhavebeenapproved.Specifically:• Shareholding guidelines have been introduced for
executive directors;• InadditiontotheexistinglimitontheexpectedvalueofLTIPawards,thefacevalueofannualLTIPawardswillbemonitored;
• Unconditional LTIPs have been discontinued as partof routine awards and will only be made in exceptional circumstances; and
• Thepracticeofdeferralofbonusintosharesshouldbeencouraged. The Remuneration Committee is of theopinion that this encourages retention and a focus on sustained performance. The Dimension Data Deferred Bonus Plan will be tabled for approval at the AnnualGeneralMeetingforthispurpose.
Unaudited informationThe Remuneration CommitteeTheRemunerationCommittee is responsible for agreeingwiththeBoard,thepolicyfortheremunerationoftheChiefExecutiveOfficer,ChairmanandexecutivedirectorsoftheCompany.Italsohasresponsibilityfortheremunerationofmembers of the ExecutiveCommittee. The remunerationfor other employees of the Group is determined by regional remuneration committees. However, the remuneration
philosophy and principles applicable to the directors summarised in this report are applied consistently to those employees.
The Remuneration Committee members for the periodunder review were as follows:WendyLucas-Bull(Chairman)DillieMalherbeRory ScottDorianWharton-Hood
The members of the Remuneration Committee areconsidered by the Company to be independent non-executivedirectors,withtheexceptionofDillieMalherbe.Dillie Malherbe was appointed as a member of theRemunerationCommittee inSeptember2004and isnotconsidered to be independent due to his association with VenFinLimitedandVenFinDDHoldingsLimited(‘VenFin’).The Board considered the implications of the role of DillieMalherbeatVenFinandconcluded that thiswouldnot compromise the independence of his input to the RemunerationCommitteeandgivenhisrepresentationofamajorshareholder,theBoardbelievesthatheiswell-alignedwith shareholder concerns, particularly with regard to remuneration.AllmembersoftheRemunerationCommitteeare free from conflicts of interest in considering matters relating to remuneration of executives. The Remuneration Committeemetfourtimesduringtheperiodunderreview.AcopyofthefulltermsofreferencefortheRemunerationCommittee is available on the Company’s website www.dimensiondata.com.
No director or manager is involved in any decisionsrelating to his or her own remuneration. The Remuneration Committeehasinternalandexternalresourcesavailabletoit to assist in the performance of its duties.
TheChairman, theChiefExecutiveOfficerandtheGroupExecutive Human Resources provide information oncurrent remuneration and performance of directors and senior management, and are available to the Remuneration Committee to answer any questions thatmay arise. TheCompanySecretaryprovidesassistanceandadvicetotheRemunerationCommitteewithrespecttogovernance,theoperation of the long term incentive plans and regulatory compliance.
PricewaterhouseCoopers was appointed by theRemuneration Committee to provide benchmarkinginformationinrelationtoLTIPawardsgrantedtoexecutivedirectors, benchmarks of total remuneration (for allemployees)asapercentageofrevenueandprofits,andareviewoftheDirectors’RemunerationPolicy.

Dimension Data Annual Report 2009 63
Policy on executive and non-executive directors’ remunerationThe Group’s business depends on the attraction, retention and motivation of high calibre executives and staff. With a presence on five different continents the Group’s international scope is much greater than many companies of a similar size, and the Group competes with largemultinational organisations to attract and retain top staff. TheRemunerationCommitteehasconsideredthefollowingprinciples in setting remuneration:• Remunerationwillbedesigned tosupport theGroup’s
business strategy in line with best practice standards. In particular, the performance measures influencing variable pay are aligned with the key outcomes of the Group’s strategy: profitable growth, effective working capital management and encouragement of value creation which translates into competitive shareholder returns;
• Levels of total reward will be competitive within therelevant market and location;
• The remuneration structure has a substantialperformance related element;
• The expected value of combined grants under theSARSandLTIPshallnotexceedonetimestheannualcosttocompanyoftheparticipantperannum(i.e. thetotal annual cost to the company including benefits, but excluding the annual bonus plan and long term incentive awards).Inaddition,thefacevalueofannualawardswillbemonitoredbytheRemunerationCommittee;and
• Performance conditions attaching to the long termincentiveplanswillbechallenging.LTIPconditionsrelateto performance against a peer group of companies.
In setting the remuneration policies referred to in this report, theRemunerationCommitteeensuresthattheyadequatelyreflect the Group’s environmental, social and governance responsibilities and do not encourage executives to take excessive risks of a financial or non-financial nature. Inaddition, the principles applied by the Remuneration Committee in terms of setting the remuneration of theexecutive directors are consistent with those used to set the remuneration of employees within the Group.
The policy relating to each component of remuneration for the executive directors is summarised below:
Base salaryThe base salary provides a fixed annual remuneration for the executive director’s service and is set with reference to the executive’s role and responsibility. The base salary of the executive directors is subject to benchmarking review and is set with reference to external market data relating to similarcompaniesbased inSouthAfrica,Europe, theUKand the US and taking into account the primary location of thedirectorsconcerned.Considerationisgiventothesize,market sector, business complexity and international reach of the comparator companies. According to the latestavailable benchmarks the current levels of base salary for the executive directors are in the lower quartile based on UKandUSmarketdata.
Annual on-target bonus planEach of the executive directors participates in an annualon-target bonus plan. The annual on-target bonus isdesigned to ensure that directors’ remuneration is aligned withtheinterestsoftheCompany’sshareholdersandotherstakeholders. During the 2009 financial year, awards under theannualon-targetbonusplanweremade toexecutivedirectors. For the 2009 financial year, performance criteria included earnings per share, Group and regional operating profit and working capital management, together with an amount relating to individual performance. Individual performance is measured with reference to General Role Expectations(‘GREs’),KeyPerformanceIndicators(‘KPIs’),LeadershipeffectivenessandDimensionDatavalues.Theannualon-targetbonushasamaximumvalueof100%ofbase salary, and the targets are related to the achievement oftheGroup’sBudget.TheRemunerationCommitteeisofthe opinion that the Budget represents a genuine challenge in the context of the prevailing business environment and achievement thereof warrants receipt by the directors of the on-targetannualbonus.
Thefollowingtableindicatesthestructureoftheannualon-target bonus for each executive director relative to business and individual measures:
Measure JJ Ord BW Dawson SM Joubert PK Quarmby DB Sherriffs
Group operating profit 37.5% 37.5% 50% 40% 37.5%
Earningspershare 37.5% 37.5% – 15% 18.75%
Working capital – – – – 18.75%
Solutions group profit – – 25% – –
DatacraftAsiaprofit – – – 20% –
Individual performance 25% 25% 25% 25% 25%
Maximum on-target bonus % 100% 100% 100% 100% 100%

64 Dimension Data Annual Report 2009
Remuneration report(continued)
Additional bonusIn the case of exceptional performance, in the context of the prevailing business environment, the Remuneration Committeemayawardanadditionalbonus. If thisawardis substantial in relation to base salary, a portion will be deferredintoashareaward(deferredbonusshares),whichwill vest only after three years, subject to the participant’s continued employment within the Group. The grant of deferred bonus shares is subject to the approval of the DimensionData Deferred Bonus Plan being approved attheAnnualGeneralMeeting.
Long term incentivesThe purpose of the Group’s long term incentives is to provide awards to the executive directors and to other key talent within the Group that recognises their continued contribution to the Group, aligns management and shareholders’ objectives and provides a reward for performance. The Group has four long term incentive plans. New awards are no longer made under the two optionschemes, although the executive directors have options outstanding under these schemes. The two current long term incentive plans are the Share Appreciation RightsScheme(‘SARS’)andtheLongTermIncentivePlan(‘LTIP’).FurtherdetailsoftheseschemesarepresentedinNote37to the annual financial statements.
SARS awardsUnder the SARS, participants receive a conditional rightto receive shares equal in value to the difference between the share price on the date of exercise and the share price on the date of award of a particular number of shares, i.e. the share price appreciation, subject to the satisfaction of performance targetsandcontinuedemployment.AwardswerelastgrantedundertheSARSon8July2005andnoawardshavebeenmadeundertheSARSintheyearended30 September 2009.
LTIP awardsTheLTIPprovidesforthedeliveryofsharestoparticipants,subject to their continued employment, and satisfaction of a performance condition. The awards vest after three years provided that the employment condition has been met and to the extent that the performance condition has been satisfied. The expected value of annual awards is compared to benchmarks and the number of such awards is determined accordingly. The performance condition for the LTIP is the Total Shareholder Return(‘TSR’) (capital appreciation plus dividend yield) of apeer group of sixteen companies, compared to that of the Company over the three year vesting period.The LTIP vests in full if the Company ranks within theupperquartileof thepeergroupand therewill bezerovestingiftheCompanyperformsbelowthemedian.IftheCompanyperformsatthemedianofthepeergroup,then50% of the award vests, with linear vesting from median to upper quartile performance. Details of the peer group
for the LTIP can be found on the corporate website: www.dimensiondata.com. When the peer group is constitutedforanLTIPaward,several’reserves’arealsoselected. In the event that one of the peer companies can no longer be utilised due to a market transaction such as a merger, takeover or delisting, then a reserve company will be substituted. The TSR for this company will be measured over the entire performance period. The use of TSR as the only performance condition governing the vestingoftheLTIPawardsisconsideredtobeappropriatedue to the significant correlation between earnings and share price experienced over the preceding years, and the focus on financial and operational measures which areconsideredintheannualon-targetbonus.
Unconditional LTIPsIn prior years certain awards of ’Unconditional LTIPs’were made where the awards vest only on the basis of the participants’ continued tenure and not subject to the satisfaction of the TSR condition specified above. These awards will only be made in exceptional circumstances in thefuture.NounconditionalLTIPswereawardedduringthecurrent financial year.
Deferred bonus shares In line with emerging international practice, the Remuneration Committeeisoftheopinionthatitisappropriatetodeferaportion of the additional bonus into deferred bonus shares where this is substantial relative to base salary. This practice encourages retention and a focus on the sustainability of profits.ToenabletheCompanytoimplementsuchawardstheDimensionDataDeferredBonusPlanwillbetabledforapprovalattheAnnualGeneralMeeting.TheRemunerationCommittee has provisionally approved an award of1,140,000 deferred bonus shares to Brett Dawson, related to performance in the 2008 financial year and deferred bonus shares to the value of $750,000 related to performance in the 2009 financial year. These awards are subject to shareholder approvaloftheDimensionDataDeferredBonusPlanattheAnnualGeneralMeeting. Thedetails of this allocation andplan are disclosed in Appendix 1 to theNotice of AnnualGeneralMeeting.
Pensions and other benefitsThe executive directors each receive life insurance, disability insurance, medical cover benefits and certain other benefits which reflect the practice in the countries in which they are primarily resident. The cost to the Group is shown in the tableonpage66.NoCompanycontributionsaremadeforthe executive directors to the Group’s provident fund.
Service contractsThe executive directors have identical service contracts. These contracts are rolling and contain a three month notice period. On termination, except by reason of cause, illness, death, injury or retirement, the executive director will be entitled to payments equal to 12 months’ base salary plus
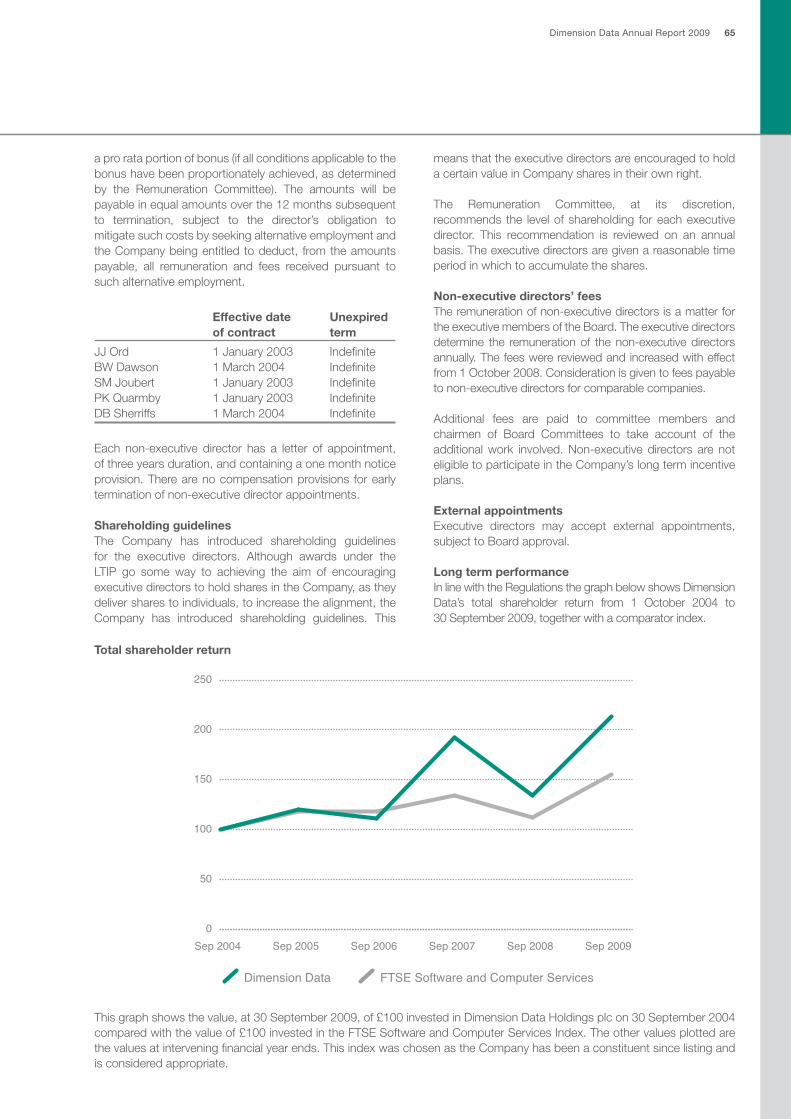
Dimension Data Annual Report 2009 65
aprorataportionofbonus(ifallconditionsapplicabletothebonus have been proportionately achieved, as determined by the Remuneration Committee). The amounts will bepayable in equal amounts over the 12 months subsequent to termination, subject to the director’s obligation to mitigate such costs by seeking alternative employment and theCompanybeingentitledtodeduct, fromtheamountspayable, all remuneration and fees received pursuant to such alternative employment.
Effective date Unexpired of contract term
JJ Ord 1 January 2003 IndefiniteBWDawson 1March2004 IndefiniteSMJoubert 1January2003 IndefinitePKQuarmby 1January2003 IndefiniteDBSherriffs 1March2004 Indefinite
Each non-executive director has a letter of appointment,of three years duration, and containing a one month notice provision. There are no compensation provisions for early terminationofnon-executivedirectorappointments.
Shareholding guidelinesThe Company has introduced shareholding guidelinesfor the executive directors. Although awards under theLTIP go some way to achieving the aim of encouragingexecutivedirectorstoholdsharesintheCompany,astheydeliver shares to individuals, to increase the alignment, the Company has introduced shareholding guidelines. This
means that the executive directors are encouraged to hold acertainvalueinCompanysharesintheirownright.
The Remuneration Committee, at its discretion,recommends the level of shareholding for each executive director. This recommendation is reviewed on an annual basis. The executive directors are given a reasonable time period in which to accumulate the shares.
Non-executive directors’ fees Theremunerationofnon-executivedirectorsisamatterforthe executive members of the Board. The executive directors determine the remunerationof thenon-executivedirectorsannually. The fees were reviewed and increased with effect from1October2008.Considerationisgiventofeespayabletonon-executivedirectorsforcomparablecompanies.
Additional fees are paid to committee members andchairmen of Board Committees to take account of theadditionalwork involved.Non-executive directors are noteligibletoparticipateintheCompany’slongtermincentiveplans. External appointmentsExecutive directors may accept external appointments,subject to Board approval.
Long term performanceIn line with the Regulations the graph below shows Dimension Data’s total shareholder return from 1 October 2004 to 30 September 2009, together with a comparator index.
Total shareholder return
0
50
100
150
200
250
Sep 2009Sep 2008Sep 2007Sep 2006Sep 2005Sep 2004
Dimension Data FTSE Software and Computer Services
Thisgraphshowsthevalue,at30September2009,of£100investedinDimensionDataHoldingsplcon30September2004comparedwiththevalueof£100investedintheFTSESoftwareandComputerServicesIndex.Theothervaluesplottedarethevaluesatinterveningfinancialyearends.ThisindexwaschosenastheCompanyhasbeenaconstituentsincelistingandis considered appropriate.

66 Dimension Data Annual Report 2009
Remuneration report(continued)
Audited informationDirectors’ remuneration Provident/ Life Disability Directors’ Basic pension insurance insurance Medical Total Total fees salary fund benefit benefit aid Other Bonus 2009 2008 $’000 $’000 $’000 $’000 $’000 $’000 $’000 $’000 $’000 $’000
RGMLBarclay 110 – – – – – – – 110 67LFBergman 80 – – – – – – – 80 61BW Dawson – 637 12 5 3 7 2 1,413* 2,079 1,921SMJoubert – 368 14 3 2 10 6 375 778 728PJLiddiard 80 – – – – – – – 80 65WLucas-Bull 90 – – – – – – – 90 77JMalherbe 80 – – – – – – – 80 65MMNgoasheng 70 – – – – – – – 70 61JJ Ord – 587 42 4 2 9 27 764 1,435 1,310PKQuarmby – 356 16 3 1 9 6 386 777 742RMScott 100 – – – – – – – 100 81DB Sherriffs – 337 6 2 1 3 1 532 882 818PDWharton-Hood 90 – – – – – – – 90 69
Totals 700 2,285 90 17 9 38 42 3,470 6,651 6,065
*An additional bonus of $750,000 to be settled in deferred bonus shares, subject to approval of the Dimension Data Deferred Bonus Plan at the Annual General
Meeting, has been approved by the Remuneration Committee.
Thehighestpaiddirector’saggregateremunerationwas(excludingthedeferredbonussharesreferredtoabove)$2.8million,made up of emoluments of $2.1 million and gains on long term incentives of $750,000.
Annual bonusForthe2009financialyeartheRemunerationCommitteehasreceivedassessmentsoftheperformanceofeachexecutivedirectorrelativetohisachievementagainstKPIsandagainstbusinesstargets.Followingtheseassessments,theexecutivedirectorswillreceivethebonusamountof$3.5millionasdetailedabove(2008bonus:$2.9million).
Long term incentives The outstanding awards under the Group’s long term incentive plans, and the movements during the financial year, are tabulated below. Opening Closing balance balance Grant Value on Date of 1 October 30 September price settlement Expiry PerformanceDirector Plan grant 2008 2009 (£/R) $’000 date conditions
JJ Ord Options 01/10/1998 1,625,000 – R22.00 Lapsed 01/10/2008 Satisfied Options 17/05/1999 1,360,000 – R24.00 Lapsed 17/05/2009 Satisfied Options 01/10/1999 2,222,222 2,222,222 R24.30 – 01/10/2009 Satisfied Options 21/11/2002 1,700,000 1,700,000 £0.25 – 21/11/2012 Satisfied Options 11/12/2003 750,000 750,000 £0.37 – 11/12/2013 Satisfied SARS 15/02/2005 600,000 600,000 £0.39 – 15/02/2011 Satisfied LTIP 22/11/2005 920,000 – – 563 22/11/2008 Satisfied LTIP 22/11/2005 230,000 – – 113 22/11/2008 Satisfied LTIP 08/03/2006 150,000 – – 74 08/03/2009 Satisfied LTIP 01/12/2006 218,500 218,500 – – 01/12/2009 Subject to continued employment LTIP 01/12/2006 874,000 874,000 – – 01/12/2009 SubjecttoTSRCondition LTIP 10/12/2007 825,000 825,000 – – 10/12/2010 SubjecttoTSRCondition LTIP 03/12/2008 – 1,500,000 – – 03/12/2011 SubjecttoTSRCondition
Total 750
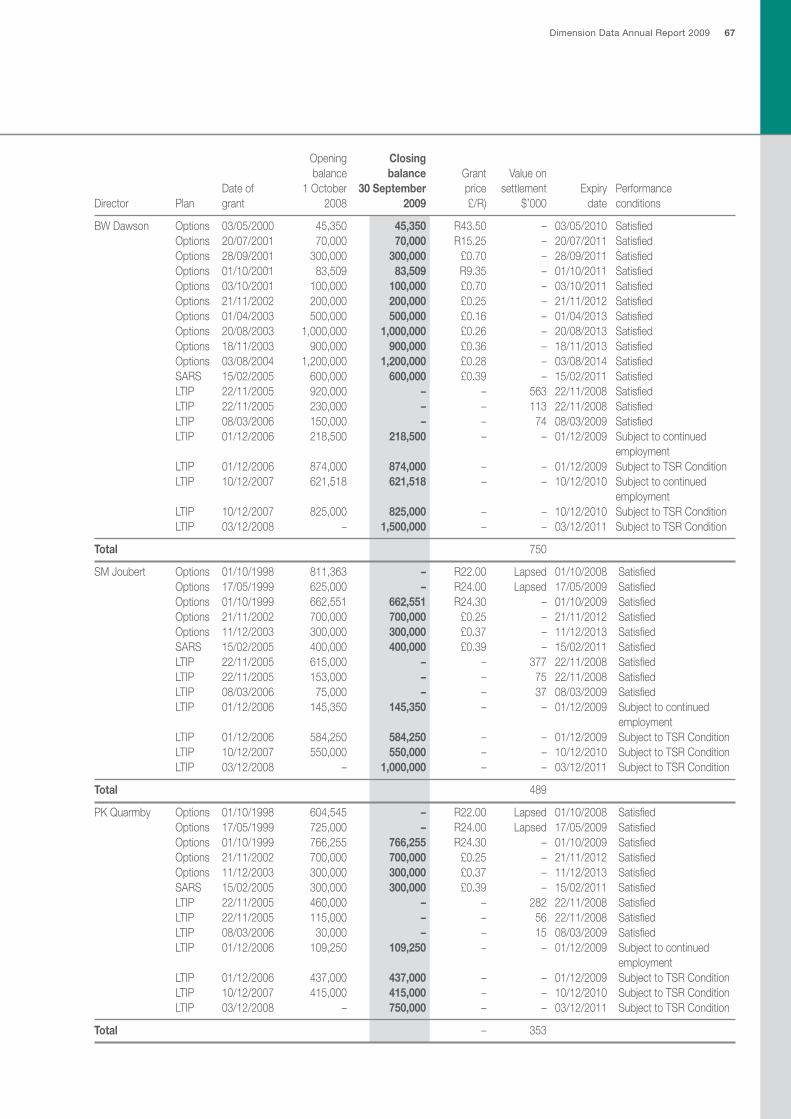
Dimension Data Annual Report 2009 67
Opening Closing balance balance Grant Value on Date of 1 October 30 September price settlement Expiry PerformanceDirector Plan grant 2008 2009 £/R) $’000 date conditions
BW Dawson Options 03/05/2000 45,350 45,350 R43.50 – 03/05/2010 Satisfied Options 20/07/2001 70,000 70,000 R15.25 – 20/07/2011 Satisfied Options 28/09/2001 300,000 300,000 £0.70 – 28/09/2011 Satisfied Options 01/10/2001 83,509 83,509 R9.35 – 01/10/2011 Satisfied Options 03/10/2001 100,000 100,000 £0.70 – 03/10/2011 Satisfied Options 21/11/2002 200,000 200,000 £0.25 – 21/11/2012 Satisfied Options 01/04/2003 500,000 500,000 £0.16 – 01/04/2013 Satisfied Options 20/08/2003 1,000,000 1,000,000 £0.26 – 20/08/2013 Satisfied Options 18/11/2003 900,000 900,000 £0.36 – 18/11/2013 Satisfied Options 03/08/2004 1,200,000 1,200,000 £0.28 – 03/08/2014 Satisfied SARS 15/02/2005 600,000 600,000 £0.39 – 15/02/2011 Satisfied LTIP 22/11/2005 920,000 – – 563 22/11/2008 Satisfied LTIP 22/11/2005 230,000 – – 113 22/11/2008 Satisfied LTIP 08/03/2006 150,000 – – 74 08/03/2009 Satisfied LTIP 01/12/2006 218,500 218,500 – – 01/12/2009 Subject to continued employment LTIP 01/12/2006 874,000 874,000 – – 01/12/2009 SubjecttoTSRCondition LTIP 10/12/2007 621,518 621,518 – – 10/12/2010 Subject to continued employment LTIP 10/12/2007 825,000 825,000 – – 10/12/2010 SubjecttoTSRCondition LTIP 03/12/2008 – 1,500,000 – – 03/12/2011 SubjecttoTSRCondition
Total 750
SMJoubert Options 01/10/1998 811,363 – R22.00 Lapsed 01/10/2008 Satisfied Options 17/05/1999 625,000 – R24.00 Lapsed 17/05/2009 Satisfied Options 01/10/1999 662,551 662,551 R24.30 – 01/10/2009 Satisfied Options 21/11/2002 700,000 700,000 £0.25 – 21/11/2012 Satisfied Options 11/12/2003 300,000 300,000 £0.37 – 11/12/2013 Satisfied SARS 15/02/2005 400,000 400,000 £0.39 – 15/02/2011 Satisfied LTIP 22/11/2005 615,000 – – 377 22/11/2008 Satisfied LTIP 22/11/2005 153,000 – – 75 22/11/2008 Satisfied LTIP 08/03/2006 75,000 – – 37 08/03/2009 Satisfied LTIP 01/12/2006 145,350 145,350 – – 01/12/2009 Subject to continued employment LTIP 01/12/2006 584,250 584,250 – – 01/12/2009 SubjecttoTSRCondition LTIP 10/12/2007 550,000 550,000 – – 10/12/2010 SubjecttoTSRCondition LTIP 03/12/2008 – 1,000,000 – – 03/12/2011 SubjecttoTSRCondition
Total 489
PKQuarmby Options 01/10/1998 604,545 – R22.00 Lapsed 01/10/2008 Satisfied Options 17/05/1999 725,000 – R24.00 Lapsed 17/05/2009 Satisfied Options 01/10/1999 766,255 766,255 R24.30 – 01/10/2009 Satisfied Options 21/11/2002 700,000 700,000 £0.25 – 21/11/2012 Satisfied Options 11/12/2003 300,000 300,000 £0.37 – 11/12/2013 Satisfied SARS 15/02/2005 300,000 300,000 £0.39 – 15/02/2011 Satisfied LTIP 22/11/2005 460,000 – – 282 22/11/2008 Satisfied LTIP 22/11/2005 115,000 – – 56 22/11/2008 Satisfied LTIP 08/03/2006 30,000 – – 15 08/03/2009 Satisfied LTIP 01/12/2006 109,250 109,250 – – 01/12/2009 Subject to continued employment LTIP 01/12/2006 437,000 437,000 – – 01/12/2009 SubjecttoTSRCondition LTIP 10/12/2007 415,000 415,000 – – 10/12/2010 SubjecttoTSRCondition LTIP 03/12/2008 – 750,000 – – 03/12/2011 SubjecttoTSRCondition
Total – 353

68 Dimension Data Annual Report 2009
Opening Closing balance balance Grant Value on Date of 1 October 30 September price settlement Expiry PerformanceDirector Plan grant 2008 2009 £/R) $’000 date conditions
DB Sherriffs Options 18/11/2003 700,000 700,000 £0.36 – 18/11/2013 Satisfied SARS 15/02/2005 400,000 400,000 £0.39 – 15/02/2011 Satisfied LTIP 22/11/2005 615,000 – – 377 22/11/2008 Satisfied LTIP 22/11/2005 153,000 – – 75 22/11/2008 Satisfied LTIP 08/03/2006 30,000 – – 15 08/03/2009 Satisfied LTIP 01/12/2006 145,350 145,350 – – 01/12/2009 Subject to continued employment LTIP 01/12/2006 584,250 584,250 – – 01/12/2009 SubjecttoTSRCondition LTIP 10/12/2007 550,000 550,000 – – 10/12/2010 SubjecttoTSRCondition LTIP 03/12/2008 – 1,000,000 – – 03/12/2011 SubjecttoTSRCondition
Total 467
On10December2008JPMorganEquitiesLimitedconfirmedthatDimensionData’sTSRhadrankedinfifthplaceinthepeergroupoverthethreeyearperformanceperiod.Accordingly,theLTIPawardsmadeon22November2005toexecutivedirectorsandemployeesintheGroupvestedinfull.TheCompany’ssharepriceon10December2008was£0.41.Accordingly,theLTIPvalueonvestingreceivedbytheexecutivedirectorswas$2.2million(2008:$2.7million).
Unconditional LTIPs (i.e. LTIPs subject to continued employment only), which were awarded to executive directors on22November2005and8March2006,vestedon12November2008.TheCompany’ssharepriceon12November2008was£0.30.Accordingly,theLTIPvalueonvestingreceivedbytheexecutivedirectorswas$432,000(2008:Nil)and$215,000(2008:Nil),respectively.
ShareAppreciationRights(SARS)andshareoptionsarenolongergrantedbytheCompany.However,theexecutivedirectorshaveoutstandingSARSandoptionsasdetailedabove.
TheCompany’ssharepriceat30September2009was£0.63andR7.61.ThehighandlowmarketpricesoftheCompany’sshares during the year are reflected below. Sterling SA rand
High 0.65 8.16Low 0.24 4.14
Directors’ interests in ordinary shares
Name Non-beneficial Beneficial Total2009
Total2008
RG Barclay – 60,000 60,000 60,000 BW Dawson – 1,352,532 1,352,532 457,532 SMJoubert – 1,038,555 1,038,555 455,955 JJ Ord – 11,596,858 11,596,858 10,701,858 PKQuarmby – 1,019,125 1,019,125 598,625 DB Sherriffs – 659,238 659,238 –RMScott 179,319 – 179,319 181,830 PDWharton-Hood – 200,000 200,000 200,000 Directors’shareholdingsareunchangedasat17November2009.
Other than the shareholdings listed above, the Directors hold no interests in other Group companies.
By Order of the Board
Wendy Lucas-BullChairman of the Remuneration Committee
17November2009
Remuneration report(continued)
Dimension Data Annual Report 2009 69
Statement of Directors’ responsibilities
TheDirectorsareresponsibleforpreparingtheAnnualReport,Directors’RemunerationReportandthefinancialstatementsinaccordance with applicable law and regulations.
CompanylawrequirestheDirectorstopreparefinancialstatementsforeachfinancialyear.TheDirectorsarerequiredbytheIASRegulationtopreparetheGroupfinancialstatementsunderInternationalFinancialReportingStandards(IFRSs)asadoptedbytheEuropeanUnionandhavealsoelectedtopreparetheparentCompanyfinancialstatementsinaccordancewithIFRSsasadoptedbytheEuropeanUnion.ThefinancialstatementsarealsorequiredbylawtobeproperlypreparedinaccordancewiththeCompaniesAct2006andArticle4oftheIASRegulation.
InternationalAccountingStandard(IAS)1requiresthatfinancialstatementspresentfairlyforeachfinancialyeartheGroupandCompany’sfinancialposition,financialperformanceandcashflows.Thisrequiresthefaithfulrepresentationoftheeffectsoftransactions, other events and conditions in accordance with the definitions and recognition criteria for assets, liabilities, income andexpensessetoutintheInternationalAccountingStandardsBoard’s‘FrameworkforthePreparationandPresentationofFinancial Statements’.
In virtually all circumstances, a fair presentation will be achieved by compliance with all applicable IFRSs. However, Directors are also required to:• Properlyselectandapplyaccountingpolicies;• Present information, including accounting policies, in a manner that provides relevant, reliable, comparable and
understandable information; • ProvideadditionaldisclosureswhencompliancewiththespecificrequirementsinIFRSsareinsufficienttoenableusersto
understand the impact of particular transactions, other events and conditions on the entity’s financial position and financial performance; and
• MakeanassessmentoftheGroup’sabilitytocontinueasagoingconcern.
The Directors are responsible for keeping proper accounting records that disclose with reasonable accuracy at any time thefinancialpositionoftheGroupandCompanyandenablethemtoensurethatthefinancialstatementscomplywiththeCompaniesAct2006.TheyarealsoresponsibleforsafeguardingtheassetsoftheGroupandCompanyandhencefortakingreasonable steps for the prevention and detection of fraud and other irregularities.
The Directors are responsible for the maintenance and integrity of the corporate and financial information included on the Company’swebsite.LegislationintheUnitedKingdomgoverningthepreparationanddisseminationoffinancialstatementsmay differ from legislation in other jurisdictions.
We confirm to the best of our knowledge:• The financial statements prepared in accordance with International Financial Reporting Standards as adopted by theEuropeanUnion,giveatrueandfairviewoftheassets,liabilities,financialpositionandprofitorlossoftheCompanyandthe undertakings included in the consolidation taken as a whole; and
• Themanagementreport,which is incorporatedintotheDirectors’report, includesafairreviewofthedevelopmentandperformanceofthebusinessandthepositionoftheCompanyandtheundertakingsincludedintheconsolidationtakenasa whole, together with a description of the principal risks and uncertainties they face.
ByorderoftheBoardon17November2009.
Brett Dawson Dave SherriffsChief Executive Officer Chief Financial Officer

70 Dimension Data Annual Report 2009
Independent auditors’ report
To the members of Dimension Data Holdings plcWe have audited the financial statements of Dimension Data Holdings plc for the year ended 30 September 2009 which comprisetheConsolidatedIncomeStatement,theConsolidatedandparentCompanyBalanceSheet,theConsolidatedandparentCompanyCashFlowstatementandtheConsolidatedandparentCompanystatementofchangesinequityandtherelatednotes1to40and(a)to(g).ThefinancialreportingframeworkthathasbeenappliedintheirpreparationisapplicablelawandInternationalFinancialReportingStandards(IFRSs)asadoptedbytheEuropeanUnionandasregardstheparentCompanyfinancialstatements,asappliedinaccordancewiththeprovisionsoftheCompaniesAct2006.
ThisreportismadesolelytotheGroup’smembers,asabody,inaccordancewithsections495,496and497oftheCompaniesAct2006.OurauditworkhasbeenundertakensothatwemightstatetotheGroup’smembersthosematterswearerequiredto state to them in an auditors’ report and for no other purpose. To the fullest extent permitted by law, we do not accept or assume responsibility to anyone other than the Group and the Group’s members as a body, for our audit work, for this report, or for the opinions we have formed.
Respective responsibilities of Directors and auditorsAsexplainedmorefullyintheDirectors’ResponsibilitiesStatement,theDirectorsareresponsibleforthepreparationofthefinancial statements and for being satisfied that they give a true and fair view. Our responsibility is to audit the financial statements inaccordancewithapplicable lawand InternationalStandardsonAuditing (UKand Ireland). ThosestandardsrequireustocomplywiththeAuditingPracticesBoard’s(APB’s)EthicalStandardsforAuditors.
Scope of the audit of the financial statementsAnauditinvolvesobtainingevidenceabouttheamountsanddisclosuresinthefinancialstatementssufficienttogivereasonableassurance that the financial statements are free from material misstatement, whether caused by fraud or error. This includes anassessmentof:whethertheaccountingpoliciesareappropriatetotheGroup’sandtheparentCompany’scircumstancesand have been consistently applied and adequately disclosed; the reasonableness of significant accounting estimates made by the Directors; and the overall presentation of the financial statements.
Opinion on financial statementsIn our opinion:• thefinancialstatementsgivea trueand fairviewof thestateof theGroup’sandof theparentCompany’saffairsasat
30 September 2009 and of the Group’s profit for the year then ended;• theGroupfinancialstatementshavebeenproperlypreparedinaccordancewithIFRSsasadoptedbytheEuropeanUnion;• the parent Company financial statements have been properly prepared in accordancewith IFRSs as adopted by theEuropeanUnionandasappliedinaccordancewiththeprovisionsoftheCompaniesAct2006;and
• thefinancialstatementshavebeenprepared inaccordancewith the requirementsof theCompaniesAct2006and,asregardstheGroupfinancialstatements,Article4oftheIASRegulation.
Opinion on other matters prescribed by the Companies Act 2006In our opinion:• thepartoftheDirectors’RemunerationReporttobeauditedhasbeenproperlypreparedinaccordancewiththeCompaniesAct2006;and
• the information given in the Directors’ Report for the financial year for which the financial statements are prepared isconsistent with the financial statements.

Dimension Data Annual Report 2009 71
Matters on which we are required to report by exceptionWe have nothing to report in respect of the following:
UndertheCompaniesAct2006wearerequiredtoreporttoyouif,inouropinion:• adequateaccountingrecordshavenotbeenkeptbytheparentCompany,orreturnsadequateforouraudithavenotbeen
received from branches not visited by us; or• theparentCompanyfinancial statementsand thepartof theDirectors’RemunerationReport tobeauditedarenot in
agreement with the accounting records and returns; or• certaindisclosuresofDirectors’remunerationspecifiedbylawarenotmade;or• wehavenotreceivedalltheinformationandexplanationswerequireforouraudit.
UndertheListingRuleswearerequiredtoreview:• theDirectors’statementcontainedwithintheDirectors’reportinrelationtogoingconcern;and• thepartoftheCorporateGovernanceStatementrelatingtotheGroup’scompliancewiththenineprovisionsoftheJune2008CombinedCodespecifiedforourreview.
Peter O’Donoghue FCASenior Statutory AuditorForandonbehalfofDeloitteLLPChartered Accountants and Statutory Auditors London,UnitedKingdom
17November2009

72 Dimension Data Annual Report 2009
2009 2008 Notes $’000 $’000
Revenue 4 3,973,078 4,510,640Costofsales (3,080,257) (3,537,347)
Gross profit 892,821 973,293Other operating income 27,311 36,895Selling and distribution costs (254,388) (320,453)Administrativeexpenses (437,869) (494,582)Other operating expenses (34,982) (12,939)
Operating profit 6 192,893 182,214Share of results of associates 7,814 7,113Interest and investment income 9 8,105 17,516Finance costs 10 (29,915) (31,025)Propertyrevaluationandothergainsandlosses 11 4,895 13,194
Profit before tax 183,792 189,012Tax 8,12 (38,422) (47,973)Profit for the year 145,370 141,039
Attributable to:Equityshareholdersoftheparent 135,175 118,410Minorityinterest 10,195 22,629 145,370 141,039
US cents US cents
Earnings per ordinary shareBasic 13 8.0 7.7Diluted 13 7.7 7.3
Consolidated income statementfor the year ended 30 September 2009

Dimension Data Annual Report 2009 73
Consolidated balance sheetas at 30 September 2009
2009 2008 Notes $’000 $’000
AssetsNon-current assetsProperty,plantandequipment 14 190,231 170,560Investment property 15 95,911 81,208Goodwill 16 291,500 95,820Other intangible assets 17 48,102 18,856Investments in associates 18 42,509 34,426Other investments 19 4,133 3,602Deferred tax assets 27 47,730 31,862Trade and other receivables 21 47,571 38,163 767,687 474,497
Current assetsInventories 20 169,013 181,885Trade and other receivables 21 997,709 1,023,984Other financial instruments 108 12,173Taxation authorities receivable 22 26,617 23,390Cashandcashequivalents 601,129 686,499 1,794,576 1,927,931Total assets 2,562,263 2,402,428
Equity and liabilitiesCapital and reservesShare capital 23 16,958 16,675Share premium 319,984 288,115Total other reserves 24 251,458 222,884Retained earnings 261,194 182,527Equityattributabletoequityshareholdersofparent 849,594 710,201Minorityinterest 56,653 138,211Total equity 906,247 848,412
Non-current liabilitiesBank loans 30 140,553 3,841Other long term liabilities 25 45,571 38,574Obligations under finance leases 26 14,099 139,906Deferred tax liabilities 27 1,021 715Provisions 28 6,678 6,186 207,922 189,222
Current liabilitiesTrade and other payables 29 1,281,396 1,202,104Other financial instruments 12,755 10,269Taxation authorities payable 22 123,073 134,740Bank loans 30 23,321 2,256Bank overdrafts 1,313 4,146Provisions 28 6,236 11,279 1,448,094 1,364,794Total liabilities 1,656,016 1,554,016Total equity and liabilities 2,562,263 2,402,428
ThefinancialstatementswereapprovedbytheBoardofDirectorson17November2009.
Brett Dawson Dave SherriffsChief Executive Officer Chief Financial Officer

74 Dimension Data Annual Report 2009
2009 2008 Note $’000 $’000
Operating activitiesOperating profit 192,893 182,214Adjustmentsfor:Depreciation of property, plant and equipment 46,499 52,151Lossondisposalofproperty,plantandequipment 416 1,559Netimpairmentsonproperty,plantandequipment (188) –Amortisationofintangibleassets 6,428 7,444Profitondisposalofintangibleassets (756) –Impairment of intangible assets 1,627 –Movementinprovisions 536 885Share-basedpaymentexpensed 20,052 16,726Othernon-cashitems 6,080 (4,000)
Cashgeneratedbeforeworkingcapitalmovements 273,587 256,979Decrease in inventories 18,875 2,403Decrease/(increase)intradeandotherreceivables 46,915 (99,334)(Decrease)/increaseintradeandotherpayables (20,328) 176,140
Cashgeneratedfromoperations 319,049 336,188Income taxes paid (47,957) (36,000)Interest paid (28,977) (26,638)
Net cash from operating activities 242,115 273,550
Investing activitiesInterest received 8,105 17,516Income from associates 1,268 1,129Acquisitionsofinvestments (336) (607)Proceedsondisposalofinvestments – 3,002Proceedsondisposalofassociates 194 –Proceedsondisposalofsubsidiaries – 6,472Acquisitionofproperty,plantandequipment (50,137) (78,297)Proceedsondisposalofproperty,plantandequipment 868 500Acquisitionofintangibles (24,600) (13,338)Proceedsondisposalofintangibleassets 923 –Movementininvestmentinassociates 4,232 3,162Acquisitionofsubsidiaries 31 (4,294) (15,754)Changeinholdingsofsubsidiaries 31 (280,051) –Cashmovementduetoacquisitionofsubsidiaries (7) 525Cashmovementduetodisposalofsubsidiaries – (2,714)Treasury share buy back of own shares by a subsidiary – (1,169)Deferred consideration paid (1,488) (2,654)
Net cash used in investing activities (345,323) (82,227)
Financing activitiesSharespurchasedbyEmployeeShareTrust (18,697) (33,143)ProceedsonsaleofsharesbyEmployeeShareTrust 3,847 –Share options exercised by employees of a subsidiary company (2,961) –Proceedsonissueofnewsharesnetofexpenses 2,040 121,034Repayment of borrowings (21,564) (21,755)Newbankloansandfinanceleasesraised 60,943 22,570Dividends paid to ordinary shareholders (28,505) (22,821)Dividends paid to minorities (159) (9,655)
Net cash (used in)/from financing activities (5,056) 56,230
Net (decrease)/increase in cash and cash equivalents (108,264) 247,553Cashandcashequivalentsatbeginningofyear 682,353 455,758Exchangedifferencesoncashandcashequivalents 25,727 (20,958)
Cash and cash equivalents at end of year 599,816 682,353
Made up as follows:Cashandcashequivalents 601,129 686,499Bank overdrafts (1,313) (4,146)
599,816 682,353
Consolidated cash flow statementfor the year ended 30 September 2009

Dimension Data Annual Report 2009 75
Consolidated statement of changes in equityfor the year ended 30 September 2009 Attributable to equity Share Share Total other Retained holders of Minority Total capital premium reserves* earnings parent interest equity $’000 $’000 $’000 $’000 $’000 $’000 $’000
1 October 2007 15,371 180,794 261,703 104,079 561,947 128,242 690,189Profitfortheyear – – – 118,410 118,410 22,629 141,039***Items recognised directly intoequity 1,304 107,321 (38,819) (39,962) 29,844 (12,660) 17,184***
Share incentive schemes – – 14,982 – 14,982 – 14,982Deferred tax on share incentiveschemes – – (3,409) – (3,409) – (3,409)**Shareoptionreserveutilised – – (5,943) (15,595) (21,538) – (21,538)Currencyadjustments – – (44,176) – (44,176) (7) (44,183)Deferred tax arising on revaluation of loans – – 702 – 702 – 702**Dividendspaid – – – (22,821) (22,821) (4,529) (27,350)Shares issued 1,429 119,605 – – 121,034 – 121,034SharesheldinEmployeeTrust (125) (12,284) – – (12,409) – (12,409)Subsidiaries acquired/ changesinholdings – – – – – (10,742) (10,742)VestingunderBEEscheme – – (2,507) – (2,507) 2,507 –Netgainoncashflowhedging – – 340 – 340 – 340Transferstoincomestatement – – (405) – (405) – (405)Other deferred tax – – 56 – 56 – 56**Other – – (5) – (5) 111 106Transfers – – 1,546 (1,546) – – –
1 October 2008 16,675 288,115 222,884 182,527 710,201 138,211 848,412Profitfortheyear – – – 135,175 135,175 10,195 145,370***Items recognised directly intoequity 283 31,869 28,574 (56,508) 4,218 (91,753) (87,535)***
Share incentive schemes – – 17,451 – 17,451 – 17,451Deferred tax on share incentive schemes – – 5,646 3,195 8,841 – 8,841**Shareoptionreserveutilised – – (16,034) (32,865) (48,899) – (48,899)Currencyadjustments – – 33,079 – 33,079 (1,388) 31,691Dividendspaid – – – (28,505) (28,505) (159) (28,664)Shares issued 43 1,997 – – 2,040 – 2,040SharesheldinEmployeeTrust 240 29,872 – – 30,112 – 30,112Changesinholdingsof subsidiaries – – – – – (98,278) (98,278)VestingunderBEEscheme – – (8,008) – (8,008) 8,008 –Lossesoncashflowhedges deferredinequity – – (5,378) – (5,378) – (5,378)Hedging losses capitalised to other intangible assets – – 2,856 – 2,856 – 2,856Transfers to income statement – – (289) – (289) – (289)Other – – 967 (49) 918 64 982Transfers – – (1,716) 1,716 – – –
30 September 2009 16,958 319,984 251,458 261,194 849,594 56,653 906,247
*Refer to Note 24.
**The aggregate deferred tax charged/credited to equity amounts to $8.8 million (2008: $2.7 million).
***Aggregate profit for the year and items recognised in equity is $57,835 (2008: $158,223).

76 Dimension Data Annual Report 2009
1. Basis of preparationTheconsolidatedandcompanyfinancialstatementshavebeenpreparedonagoingconcernbasis(assetout intheDirectors’reportonpage45inaccordancewithInternationalFinancialReportingStandards(IFRS)asadoptedbytheEU,andthosepartsoftheCompaniesAct2006applicabletothosecompaniesreportingunderIFRS.
The preparation of financial statements in conformity with generally accepted accounting principles requires the Directors to make estimates and assumptions that affect the reported amounts of assets and liabilities at balance sheet date, and the reported amounts of revenue and expenses during the reported period. Whilst these estimates and assumptions are based on the Directors’ best knowledge of the amount, events or actions, actual results may differ from those estimates.
Restatement of the Company resultsInaccordancewithIAS21‘TheEffectsofChangesinForeignExchangeRates’the2008Companyaccountshavebeenrestated to account for the effects of exchange differences. This has resulted in an increase to the opening retained earnings at 1 October 2007 of $30.9 million and a decrease in the profit for the year ended 30 September 2008 of $41.8 million. These exchange differences were previously recorded in equity. This restatement does not impact the Company’snetassetposition.TherestatementtotheCompanyreserveshasnoeffectontheGroupresultsorreservesposition.
New Accounting StandardsIn the current year, the Group has adopted all of the new and revised Standards and Interpretations issued by the InternationalAccountingStandardsBoard(‘IASB’)andtheInternationalFinancialReportingInterpretationsCommittee(‘IFRIC’) of the IASB that are relevant to its operations and effective for annual reporting periods beginning on 1 October 2008. The adoption of these new and revised Standards and Interpretations has resulted in changes to the Group’s accounting policies in the following areas but has not affected the amounts reported for the current or prior years:
IAS39 ‘ReclassificationofFinancialAssets’–AmendmentstoIAS39‘FinancialInstruments’ Thisamendmentdealswiththetransferoffinancialassetsfromavailable-for-saletoloansandreceivablesand
alsothereclassificationofnon-derivativefinancialassetsoutofthetradingcategoryincertaincircumstances.These amendments are effective for reclassifications of financial assets after 1 July 2008 and have had no material impact on the financial statements of the Group.
IFRIC ThefollowingIFRICinterpretationshavebeenadoptedinthecurrentyearbuthavehadnomaterialimpactonthe financial statements of the Group:
• IFRIC12‘ServiceConcessionArrangements’, • IFRIC13‘CustomerLoyaltyProgrammes’, • IFRIC14‘IAS19–TheLimitonaDefinedBenefitAsset:Minimumfundingrequirementsandtheirinteraction’, • IFRIC16‘HedgesofaNetInvestmentinaForeignOperation’,and • IFRIC18‘TransferofAssetsfromCustomers’.
Atthedateofauthorisationofthesefinancialstatements,thefollowingStandardsandInterpretations,whichhavenotbeen applied in these financial statements, were issued but not effective:
Pronouncement Name
IFRS2 ‘Share-basedPayment’Amendments IFRS3 ‘BusinessCombinations’Revision IFRS5 ‘Non-currentAssetsHeldforSaleandDiscontinuedOperations’Amendments IFRS7 ‘ImprovingDisclosuresaboutFinancialInstruments’ IFRS8 ‘OperatingSegments’ IAS1 ‘PresentationofFinancialStatements’RevisionandAmendments IAS16 ‘Property,PlantandEquipment’Amendments IAS19 ‘EmployeeBenefits’Amendments IAS20 ‘GovernmentGrantsandDisclosureofGovernmentAssistance’Amendments IAS23 ‘BorrowingCosts’Amendments IAS27 ‘ConsolidatedandSeparateFinancialStatements’Amendments IAS28 ‘InvestmentinAssociates’Amendments
Notes to the financial statementsfor the year ended 30 September 2009

Dimension Data Annual Report 2009 77
Pronouncement Name
IAS29 ‘FinancialReportinginHyperinflationaryEconomies’Amendments IAS31 ‘InterestsinJointVentures’Amendments IAS32 ‘FinancialInstruments:Presentation’Amendments IAS36 ‘ImpairmentofAssets’Amendments IAS38 ‘IntangibleAssets’Amendments IAS39 ‘FinancialInstruments:RecognitionandMeasurement’Amendments IAS40 ‘InvestmentProperty’Amendments IAS41 ‘Agriculture’Amendments IFRIC9 ‘EmbeddedDerivatives’Amendments IFRIC15 ‘AgreementsfortheConstructionofRealEstate’ IFRIC17 ‘DistributionsofNon-cashAssetstoOwners’
Alltheabovepronouncementsareeffectivefortheyearending30September2010.
The Directors are in the process of evaluating the measurement and disclosure requirements that the adoption of these Standards and Interpretations will have in future periods when the relevant standards come into effect for the Group.
2. Significant accounting policiesThe accounting policies set out below have been used in preparation of the consolidated financial statements and theCompanyfinancialstatementswhereapplicable.Theconsolidatedfinancial informationhasbeenpreparedonthehistorical cost basis, except for the revaluation of certain financial instruments and the investment property. The principal accounting policies adopted are set out below.
Basis of consolidationTheconsolidatedfinancialstatementsincorporatethefinancialstatementsoftheCompanyandentities(includingspecialpurposeentities)controlledbytheCompany(itssubsidiaries).ControlisachievedwheretheCompanyhasthepowertogovern the financial and operating policies of an investee enterprise so as to obtain benefits from its activities.
The results of subsidiaries acquired or disposed of during the year are included in the consolidated income statement from the effective date of acquisition or up to the effective date of disposal, as appropriate.
Where necessary, adjustments are made to the financial statements of subsidiaries to bring the accounting policies used in line with those used by other members of the Group.
Allintra-grouptransactions,balances,incomeandexpensesareeliminatedonconsolidation.
MinorityinterestsinthenetassetsofconsolidatedsubsidiariesareidentifiedseparatelyfromtheGroup’sequitytherein.Minority interests consist of the amount of those interests at the date of the original business combination and theminority’sshareofchangesinequitysincethecombination.Lossesapplicabletotheminorityinexcessoftheminority’sinterest in the subsidiary’s equity are allocated against the interest of the Group except to the extent that the minority has a binding legal obligation and is able to make additional investment to cover the losses.
Business combinationsThe acquisition of subsidiaries is accounted for using the purchase method. The cost of the acquisition is measured at the aggregate of the fair values, at the date of exchange, of assets given, liabilities incurred or assumed, and equity instruments issued by the Group in exchange for control of the acquiree, plus any costs directly attributable to the business combination.
On acquisition, the assets and liabilities and contingent liabilities of a subsidiary are measured at their fair values at the dateofacquisition,exceptfornon-currentassets(ordisposalgroups)thatareclassifiedasheldforsaleinaccordancewithIFRS5‘Non-CurrentAssetsHeldforSaleandDiscontinuedOperations’,whicharerecognisedandmeasuredatthelower of carrying amount and fair value less cost to sell.

78 Dimension Data Annual Report 2009
Anyexcessofthecostofacquisitionoverthefairvaluesoftheidentifiablenetassetsacquiredisrecognisedasgoodwill.Anydeficiencyof thecostofacquisitionbelowthe fairvaluesof the identifiablenetassetsacquired (i.e.discountonacquisition)iscreditedtotheincomestatementintheperiodofacquisition.
The interest of minority shareholders in the acquiree is initially measured at the minority’s proportion of the net fair value of the assets, liabilities and contingent liabilities recognised.
When there is a change in shareholding in a subsidiary, the assets and liabilities are not remeasured to reflect their fair values at the date of the transaction. The entire difference between the purchase amount and the change in minority interests is reflected as goodwill.
Investments in associatesAnassociateisanentityoverwhichtheGroupisinapositiontoexercisesignificantinfluence,butnotcontrol,throughparticipation in the financial and operating policy decisions of the investee.
The results and assets and liabilities of associates are incorporated in these financial statements using the equity method ofaccountingexceptwhenclassifiedasheldforsale(seebelow).Investmentsinassociatesarecarriedinthebalancesheetatcostasadjustedbypost-acquisitionchangesintheGroup’sshareofthenetassetsoftheassociate,lessanyimpairment in the valueof individual investments.Lossesof theassociate inexcessof theGroup’s interest in thoseassociates are not recognised.
AnyexcessofthecostofacquisitionovertheGroup’sshareofthefairvaluesofthe identifiableassets, liabilitiesandcontingent liabilitiesof the associate at thedateof acquisition is recognisedasgoodwill. Anydeficiencyof the costof acquisition below the Group’s share of the fair values of the identifiable net assets of the associate at the date of acquisition(i.e.discountonacquisition)iscreditedintheincomestatementintheperiodofacquisition.Thegoodwillisincluded within the carrying amount of the investment and is assessed for impairment as part of the investment.
Where a Group company transacts with an associate of the Group, profits and losses are eliminated to the extent of theGroup’sinterestintherelevantassociate.Lossesmayprovideevidenceofanimpairmentoftheassettransferred,inwhich case appropriate provision is made for impairment.
Non-current assets held for saleNon-currentassets(anddisposalgroups)classifiedasheldforsalearemeasuredatthelowerofcarryingamountandfair value less costs to sell.
Non-currentassetsanddisposalgroupsareclassifiedasheldforsaleiftheircarryingamountswillberecoveredthrougha sale transaction rather than through continuing use. This condition is regarded as being met only when the sale is highly probableandtheasset(ordisposalgroup)isavailableforimmediatesaleinitspresentcondition.Managementmustbecommitted to the sale which should be expected to qualify for recognition as a completed sale within one year from the date of classification.
GoodwillGoodwill arising on consolidation represents the excess of the cost of acquisition over the Group’s interest in the fair value of the identifiable assets, liabilities and contingent liabilities of a subsidiary or associate at the date of acquisition.
Goodwill is recognised as an asset at cost and is subsequently measured at cost less any accumulated impairment losses.
For thepurposeof theannual impairment testing,goodwill isallocated toeachof theGroup’scash-generatingunitsexpectedtobenefit fromthecombination.Cash-generatingunitstowhichgoodwillhasbeenallocatedaretestedforimpairment annually, or more frequently when there is an indication that the unit may be impaired. If the recoverable amountofthecash-generatingunitislessthanthecarryingamountoftheunit,theimpairmentlossisallocatedfirsttoreduce the carrying amount of any goodwill allocated to the unit and then to the other assets of the unit pro rata on the basisofthecarryingamountofeachassetintheunit.Anyimpairmentisrecognisedimmediatelyintheincomestatementand is not subsequently reversed.
Notes to the financial statementsfor the year ended 30 September 2009 (continued)

Dimension Data Annual Report 2009 79
On disposal of a subsidiary or associate, the attributable amount of goodwill is included in the determination of the profit or loss on disposal.
GoodwillarisingonacquisitionsbeforethedateoftransitiontoIFRShasbeenretainedatthepreviousUKGAAPamountssubject to being tested for impairment at that date.Goodwillwritten off to reserves underUKGAAP has not beenreinstated and is not included in determining any subsequent profit or loss on disposal.
Settlement of share obligation of Group employer companiesThe Dimension Data Employee Share Trust purchases shares in the Company to be used for the settlement of itsobligations under its share incentive schemes. When such purchases occur, these amounts are deducted from share capitalandsharepremium,inlinewithcommonSouthAfricanpracticeandnotpresentedasaseparatenegativereserve,whichiscommonpracticeintheUK.
Revenue recognitionRevenue is measured at the fair value of the consideration received or receivable and represents amounts receivable for goodsandservicesprovidedinthenormalcourseofbusiness,netofdiscounts,VATandothersalesrelatedtaxes.
Sales of goods are recognised when goods are delivered and title has passed.
RevenuefromcontractsisrecognisedinaccordancewiththeGroup’saccountingpolicyoncontracts(seebelow).
Licencefeesarebroughttoaccountovertherelevantcontractperiods.
Maintenancerevenueisbroughttoaccountovertherelevantcontractperiods,onastraightlinebasis.
Where the Group acts as agent and is remunerated on a commission basis, the commission is included in revenue. Where the Group acts as principal, the total value of business handled is included in revenue.
Interest income is accrued on a time basis, by reference to the principal outstanding and at the effective interest rate applicable, which is the rate that exactly discounts estimated future cash receipts through the expected life of the financial asset to that asset’s net carrying amount.
Dividend income from investments is recognised when the shareholders’ rights to receive payment have been established.
Vendor rebates are offset against cost of sales.
ContractsAllServicesrevenueisderivedfromcontracts.
Where the outcome of a contract can be estimated reliably, revenue and costs are recognised by reference to the stage of completion of the contract activity at the balance sheet date. This is measured by the proportion that contract costs incurred for work performed to date bear to the estimated total contract costs. Variations in contract work, claims and incentive payments are included to the extent that it is probable that they will result in revenue, and they are capable of being reliably measured.
Where the outcome of a contract cannot be estimated reliably, contract revenue is recognised to the extent of contract costsincurredthatitisprobablewillberecoverable.Contractcostsarerecognisedasexpensesintheperiodinwhichthey are incurred.
When it is probable that total contract costs will exceed total contract revenue, the expected loss is recognised as an expense immediately.

80 Dimension Data Annual Report 2009
Revenueformaintenancecontractsthatarepaidforinadvancebycustomersisrecognisedas‘deferredincome’inthebalance sheet. Revenue relating to these maintenance contracts is recognised on the straight line basis over the relevant period of the contract. Related maintenance contract costs which the Group pays for in advance are expensed in the incomestatementonastraightlinebasisoverthetermoftherelevantcontract.Costswhicharenotyetexpensedarerecognisedonthebalancesheetas‘prepayments’.
Contactcentrerevenueisrecognisedonastraightlinebasisovertheperiodofthecontract.
LeasingLeasesareclassifiedasfinanceleaseswheneverthetermsoftheleasetransfersubstantiallyalltherisksandrewardsofownership to the lessee.
Allotherleasesareclassifiedasoperatingleases.
The Group as lessorAmountsduefromlesseesunderfinanceleasesarerecordedasreceivablesattheamountoftheGroup’snetinvestmentin the leases. Finance lease income is allocated to accounting periods so as to reflect a constant periodic rate of return on the Group’s net investment outstanding in respect of the leases.
Rental income from operating leases is recognised on a straight line basis over the term of the relevant lease. Initial direct costs incurred in negotiating and arranging an operating lease are added to the carrying amount of the leased asset and recognised on a straight line basis over the lease term.
The Group as lesseeAssetsheldunderfinanceleasesarerecognisedasassetsoftheGroupattheirfairvalueor,iflower,atthepresentvalueof the minimum lease payments, each determined at the inception of the lease. The corresponding liability to the lessor isincludedinthebalancesheetasafinanceleaseobligation.Leasepaymentsareapportionedbetweenfinancechargesand reduction of the lease obligation so as to achieve a constant rate of interest on the remaining balance of the liability. Finance charges are charged directly in the income statement.
Rentals payable under operating leases are charged to income on a straight line basis over the term of the relevant lease.
Benefits received and receivable as an incentive to enter into an operating lease are also spread on a straight line basis over the lease term.
Foreign currenciesThe individual financial statements of each Group entity are presented in the currency of primary economic environment inwhichtheentityoperates(itsfunctionalcurrency).Forthepurposeoftheconsolidatedfinancialstatements,theresultsandfinancialpositionofeachentityareexpressedinUSdollars,whichisthefunctionalcurrencyoftheCompany,andthepresentation currency for the consolidated financial statements. The Group has elected to present its results in US dollars as this is the currency predominantly used when the Group transacts.
Transactions in currencies other than the functional currency of the entities are recorded at the rates of exchange prevailing onthedatesofthetransactions.Ateachbalancesheetdate,monetaryassetsandliabilitiesthataredenominated inforeigncurrenciesareretranslatedattheratesprevailingonthebalancesheetdate.Non-monetaryassetsandliabilitiescarried at fair value that are denominated in foreign currencies are translated at the rates prevailing at the date when the fair value was determined. Gains and losses arising on retranslation are included in the income statement for the period,exceptforexchangedifferencesarisingonnon-monetaryassetsandliabilitieswherethechangesinfairvaluearerecognised directly in equity.
Non-monetary itemsthataremeasured intermsofhistoricalcost in foreigncurrencyarenotretranslated. Inordertohedgeitsexposuretocertainforeignexchangerisks,theGroupentersintoforwardcontractsandoptions(seebelowfordetailsoftheGroup’saccountingpoliciesinrespectofsuchderivativefinancialinstruments).
Notes to the financial statementsfor the year ended 30 September 2009 (continued)

Dimension Data Annual Report 2009 81
For the purpose of presenting consolidated financial statements, the assets and liabilities of the Group’s foreign operations are translated at exchange rates prevailing on the balance sheet date. Income and expense items are translated at the averageexchangeratesfortheperiod,unlessexchangeratesfluctuatesignificantly.Exchangedifferencesarising,ifany,are classified as equity and transferred to the Group’s translation reserve. Such translation differences are recognised as income or as expenses in the period in which the operation is disposed of.
Exchangedifferencesonmonetaryitemsreceivablefromorpayabletoaforeignoperationforwhichsettlementisneitherplanned nor likely to occur, which form part of the net investment in a foreign operation, are recognised in the translation reserve.
Goodwill and fair value adjustments arising on the acquisition of a foreign entity are treated as assets and liabilities of the foreign entity and translated at the closing rate.
Exchange ratesThefollowingtablereflectstheaverageandperiodendexchangeratesagainst theUSdollar forSouthAfricanrand,Australiandollar,SterlingandEuro:
2009 2008Average Period end Average Periodend
Australiandollar 1.382 1.136 1.098 1.251Euro 0.735 0.682 0.659 0.699SouthAfricanrand 8.828 7.388 7.518 8.290Sterling 0.647 0.621 0.507 0.553
Borrowing costsBorrowing costs directly attributable to the acquisition, construction or production of qualifying assets, which are assets that necessarily take a substantial period of time to get ready for their intended use or sale, are added to the cost of those assets, until such time as the assets are substantially ready for their intended use or sale. Investment income earned on the temporary investment in specific borrowings pending their expenditure on qualifying assets is deducted from the borrowing costs eligible for capitalisation.
Allotherborrowingcostsarerecognisedintheincomestatementintheperiodinwhichtheyareincurred.
Government grantsGovernmentgrantstowardsstaffre-trainingcostsarerecognisedasincomeovertheperiodsnecessarytomatchthemwith the related costs and are deducted in reporting the related expense.
Government grants relating to property, plant and equipment are treated as deferred income and released to the income statement over the expected useful lives of the assets concerned.
Operating profitProfitfromoperationsisstatedafterchargingrestructuringcostsbutbeforetheshareofresultsofassociates,investmentincome, finance costs, and property revaluation and other gains and losses.
Exceptional itemsExceptionalitemsarethoseitemsoffinancialperformancethatarematerialandnon-recurringinnaturethattheGroupbelieves should be disclosed separately within the financial statements to assist in the understanding of the financial performance of the Group.
Retirement benefit costsPaymentstodefinedcontributionretirementbenefitplansarechargedasanexpenseastheyfalldue.Paymentsmadetostate-managedretirementbenefitschemesaredealtwithaspaymentstodefinedcontributionplanswheretheGroup’sobligations under the schemes are equivalent to those arising in a defined contribution retirement benefit plan.

82 Dimension Data Annual Report 2009
TaxationThe tax expense represents the sum of the tax currently payable and deferred tax.
The tax currently payable is based on taxable profit for the year. Taxable profit differs from net profit as reported in the income statement because it excludes items of income or expense that are taxable or deductible in other years and it further excludes items that are never taxable or deductible. The Group’s liability for current tax is calculated using tax rates that have been enacted or substantively enacted by the balance sheet date.
Deferred tax is the tax expected to be payable or recoverable on differences between the carrying amounts of assets and liabilities in the financial statements and the corresponding tax bases used in the computation of taxable profit, and is accounted for using the balance sheet liability method.
Deferred tax liabilities are generally recognised for all taxable temporary differences and deferred tax assets are recognised to the extent that it is probable that taxable profits will be available against which deductible temporary differences can be utilised. Such assets and liabilities are not recognised if the temporary difference arises from goodwill or from the initial recognition(otherthaninabusinesscombination)ofotherassetsandliabilitiesinatransactionthataffectsneitherthetaxprofit nor the accounting profit.
Deferred tax liabilities are recognised for taxable temporary differences arising on investments in subsidiaries and associates, and interests in joint ventures, except where the Group is able to control the reversal of the temporary difference and it is probable that the temporary difference will not reverse in the foreseeable future.
The carrying amount of deferred tax assets is reviewed at each balance sheet date and reduced to the extent that it is no longer probable that sufficient taxable profits will be available to allow all or part of the asset to be recovered.
Deferred tax is calculated at the tax rates that have been enacted or substantively enacted by the balance sheet date. Deferred tax is charged or credited in the income statement, except when it relates to items charged or credited directly to equity, in which case the deferred tax is also dealt with in equity.
Deferred tax assets and liabilities are offset when there is a legally enforceable right to set off current tax assets against current tax liabilities and when they relate to income taxes levied by the same taxation authority and the Group intends to settle its current tax assets and liabilities on a net basis.
Deferred tax assets and liabilities are not discounted.
Property, plant and equipmentItems of property, plant and equipment are carried at cost less accumulated depreciation and any accumulated impairment losses. Depreciation is charged so as to write off the depreciable value of the assets over their estimated useful lives, using the straight line method, on the following basis:
Campusproperty(Owneroccupied) 2%perannumLeaseholdland,buildingsandimprovements OvertheleasetermComputerandworkshopequipment 14%–33%perannumMotorvehicles 25%perannumOffice furniture and equipment 10% per annum
Certaincostsofpurchase,developmentandinstallationofmajorinformationsystems(includingpackagedsoftware)arecapitalisedandamortisedovertheirexpectedusefullives(generallythreetofiveyears)onastraightlinebasis.
Assetsheldunderfinanceleasesaredepreciatedovertheirexpectedusefullivesonthesamebasisasownedassetsor,where shorter, the term of the relevant lease.
The gain or loss arising on the disposal or retirement of an asset is determined as the difference between the sales proceeds and the carrying amount of the asset and is recognised in the income statement.
Notes to the financial statementsfor the year ended 30 September 2009 (continued)

Dimension Data Annual Report 2009 83
The estimated useful lives, residual values and depreciation methods are reviewed at each year end, with the effect of any changes in estimates accounted for on a prospective basis.
Investment propertyInvestment property, which is property held to earn rentals and/or for capital appreciation, is measured initially at its cost, including transaction costs. Subsequent to initial recognition, investment property is measured at fair value. Gains and losses arising from changes in the fair value of investment property are included in the income statement for the period in which they arise.
Intangible assetsAcquired intangible assetsPurchasedintangibleassets,whichincludecustomerlists,intellectualpropertyandrightofuseassets,arecapitalisedand amortised over their useful economic lives on a straight line basis.
Computer softwareComputersoftwareisstatedatcostlessaccumulatedamortisationand,whereappropriate,provisionforimpairmentinvalue or estimated loss on disposal.
Acquired computer software is capitalised on the basis of costs incurred to acquire and bring into use the specificsoftware.Amortisationisprovidedtowriteoffthecostofassetsonastraightlinebasisovertheirestimatedusefullivesofbetweenthreetofiveyears.Thesoftwareiswrittenoffoversevenyears.Costsassociatedwithdevelopingormaintainingcomputer software are recognised as an expense as incurred, unless they increase the future economic benefits of the asset, in which case they are capitalised.
Internally generated computer software is capitalised at cost if the project is technically and commercially feasible and the economic benefits that are expected to be generated exceed one year. The expenditure capitalised includes the cost of materials, direct labour and an appropriate proportion of overheads. Subsequent expenditure is capitalised only when itincreasesthefutureeconomicbenefitsembodiedinthespecificassetstowhichitrelates.Amortisationisprovidedtowrite off the cost of assets on a straight line basis between three and seven years.
Right of use assetTherightofuseassetisstatedatcostlessaccumulatedamortisation.Amortisationisprovidedtowriteoffthecostoftheasset on a straight line basis over twenty years.
Internally-generated intangible assets – research and developmentExpenditureonresearchactivitiesisrecognisedasanexpenseintheperiodinwhichitisincurred.
Aninternally-generatedintangibleassetarisingfromtheGroup’sSolutionsbusinessisrecognisedonlyifallofthefollowingconditions are met:• Anassetiscreatedthatcanbeidentified(suchassoftwareandnewprocesses);• Itisprobablethattheassetcreatedwillgeneratefutureeconomicbenefits;and• Thedevelopmentcostoftheassetcanbemeasuredreliably.
Internally-generatedintangibleassetsareamortisedonastraightlinebasisovertheirusefullives,generallybetweenthreeandfiveyears.Wherenointernally-generatedintangibleassetcanberecognised,developmentexpenditureisrecognisedas an expense in the period in which it is incurred.
Patents and trademarksPatentsand trademarksaremeasured initiallyatpurchasecostandareamortisedonastraight linebasisover theirestimated useful lives.
The estimated useful lives, residual values and depreciation methods are reviewed at each year end, with the effect of any changes in estimates accounted for on a prospective basis.
84 Dimension Data Annual Report 2009
Impairment of tangible and intangible assets excluding goodwillAteachbalancesheetdate,theGroupreviewsthecarryingamountsofitstangibleandintangibleassetstodeterminewhether there is any indication that those assets have suffered an impairment loss. If any such indication exists, the recoverableamountof theasset isestimated inorder todetermine theextentof the impairment loss (ifany).Wherethe asset does not generate cash flows that are independent from other assets, the Group estimates the recoverable amountofthecash-generatingunittowhichtheassetbelongs.Anintangibleassetwithanindefiniteusefullifeistestedfor impairmentannuallyandwhenever there isan indication that theassetmaybe impaired.Management’sfinancialprojections used for purposes of impairment testing do not exceed five years.
Recoverable amount is the higher of fair value less costs to sell and value in use. In assessing value in use, the estimated future cash flows are discounted to their present value using a pre-tax discount rate that reflects current marketassessments of the time value of money and the risks specific to the asset for which the estimates of future cash flows have not been adjusted.
Iftherecoverableamountofanasset(orcash-generatingunit)isestimatedtobelessthanitscarryingamount,thecarryingamountoftheasset(cash-generatingunit)isreducedtoitsrecoverableamount.Animpairmentlossisrecognisedasanexpense immediately.
Whereanimpairmentlosssubsequentlyreverses,thecarryingamountoftheasset(cash-generatingunit)isincreasedtothe revised estimate of its recoverable amount, but so that the increased carrying amount does not exceed the carrying amountthatwouldhavebeendeterminedhadnoimpairmentlossbeenrecognisedfortheasset(cash-generatingunit)inprioryears.Areversalofanimpairmentlossisrecognisedasincomeimmediately.
InventoriesInventoriesarestatedatthelowerofcostandnetrealisablevalue.Costcomprisesdirectmaterialsand,whereapplicable,direct labour costs and those overheads that have been incurred in bringing the inventories to their present location and condition.Costiscalculatedusingtheweightedaveragemethod.
Netrealisablevaluerepresentstheestimatedsellingpricelessallestimatedcostsofcompletionandcoststobeincurredin marketing, selling and distribution.
Financial instrumentsFinancial instrumentsFinancial assets and financial liabilities are recognised in the Group’s balance sheet when the Group becomes a party to the contractual provisions of the instrument.
Trade receivablesTrade receivables are measured at initial recognition at fair value, and are subsequently measured at amortised cost usingtheeffectiveinterestratemethod.Appropriateallowancesforestimatedirrecoverableamountsarerecognisedinthe income statement when there is evidence that the asset is impaired. The allowance recognised is measured as the difference between the asset’s carrying amount and the present value of estimated future cash flows discounted at the effective interest rate computed at initial recognition.
InvestmentsInvestments are recognised and derecognised on a trade date where a purchase or sale of an investment is under a contract whose terms require delivery of the investment within the timeframe established by the market concerned, and are initially measured at cost, including transaction costs.
Atsubsequentreportingdates,debtsecuritiesthattheGrouphastheexpressedintentionandabilitytoholdtomaturity(held-to-maturity debt securities) aremeasured at amortised cost using the effective interest ratemethod, less anyimpairmentlossrecognisedtoreflectirrecoverableamounts.Animpairmentlossisrecognisedintheincomestatementwhen there is objective evidence that the asset is impaired, and is measured as the difference between the investment’s carrying amount and the present value of estimated future cash flows discounted at the effective interest rate computed at initial recognition.
Notes to the financial statementsfor the year ended 30 September 2009 (continued)

Dimension Data Annual Report 2009 85
Impairment losses are reversed in subsequent periods when an increase in the investment’s recoverable amount can be related objectively to an event occurring after the impairment was recognised, subject to the restriction that the carrying amount of the investment at the date the impairment is reversed shall not exceed what the amortised cost would have been had the impairment not been recognised.
Investments other than held-to-maturity debt securities are classified as either investments held for trading or asavailable for sale, and are measured at subsequent reporting dates at fair value. Where securities are held for trading purposes, gains and losses arising from changes in fair value are included in the income statement for the period. For available for sale investments, gains and losses arising from changes in fair value are recognised directly in equity, until the security is disposed of or is determined to be impaired, at which time the cumulative gain or loss previously recognised in equity is included in the income statement for the period. Impairment losses recognised in the income statement for equity investments classified as available for sale are not subsequently reversed through the income statement. Impairment losses recognised in the income statement for debt instruments classified as available for sale are subsequently reversed if an increase in the fair value of the instrument can be objectively related to an event occurring after the recognition of the impairment loss.
For investments where there is no active market, fair value is determined using valuation techniques. Such techniques include using recent arm’s length market transactions, reference to the current market value of another instrument that is substantially the same, discounted cash flows analysis or other valuation models.
Changes invariousassumptionsmade inorder tovalue these investmentswouldnotmakematerialchanges to thevalues thereof.
Investments in subsidiaries are carried in the parent company balance sheet at cost less provisions for impairments.
Cash and cash equivalentsCashandcashequivalentscomprisecashonhandanddemanddeposits,andothershorttermhighlyliquidinvestmentsthat are readily convertible to a known amount of cash and are subject to an insignificant risk of changes in value.
Financial liabilities and equitiesFinancial liabilities and equity instruments are classified according to the substance of the contractual arrangements entered into.
AnequityinstrumentisanycontractthatevidencesaresidualinterestintheassetsoftheGroupafterdeductingallofitsliabilities.
Bank borrowingsInterest-bearingbankloansandoverdraftsareinitiallymeasuredatfairvalue,andaresubsequentlymeasuredatamortisedcost,usingtheeffectiveinterestratemethod.Anydifferencebetweentheproceeds(netoftransactioncosts)andthesettlement or redemption of borrowings is recognised over the term of the borrowings in accordance with the Group’s accountingpolicyforborrowingcosts(seeabove).
Trade payablesTrade payables are initially measured at fair value, and are subsequently measured at amortised cost, using the effective interest rate method.
Equity instrumentsEquityinstrumentsissuedbytheCompanyarerecordedattheproceedsreceived,netofdirectissuecosts.
Derivative financial instrumentsThe Group uses derivative financial instruments (primarily foreign currency forward contracts) to hedge its risksassociated with foreign currency fluctuations relating to certain firm commitments and forecasted transactions. Such derivatives are initially recorded at fair value, if any, and are remeasured to fair value at subsequent reporting dates. The Group does not use derivative financial instruments for speculative purposes. The use of financial derivatives is governed by the Group’s policies approved by the Board of Directors, which provide written principles on the use of financial derivatives.

86 Dimension Data Annual Report 2009
Changesinfairvalueofderivativefinancialinstrumentsthatarenotdesignatedandeffectiveashedgesoffuturecashflowsarerecognisedinfinancecoststotheextenttheyrelatetotheprovisionofinter-companyloanfinancing.Inallothercases, the change in the fair value is recognised as part of operating profit.
Changesinthefairvalueofderivativefinancialinstrumentsthataredesignatedandeffectiveashedgesoffuturecashflows are recognised directly in equity and the ineffective portion is recognised immediately in the income statement. If thecashflowhedgeofafirmcommitmentorforecastedtransactionresultsintherecognitionofanon-financialassetoranon-financialliability,then,atthetimetheassetorliabilityisrecognised,theassociatedgainsorlossesonthederivativethat had previously been recognised in equity are included in the initial measurement of the asset or liability. For hedges that do not result in the recognition of an asset or a liability, amounts deferred in equity are recognised in the income statement in the same period in which the hedged item affects the income statement.
Changesinthefairvalueofdesignatedfairvaluehedgesandderivativefinancialinstrumentsthatdonotqualifyforhedgeaccounting are recognised in the income statement as they arise.
Hedge accounting is discontinued when the hedging instrument expires or is sold, terminated or exercised, or no longer qualifiesforhedgeaccounting.Atthattime,anycumulativegainorlossonthehedginginstrumentrecognisedinequityisretained in equity until the forecasted transaction occurs. If a hedged transaction is no longer expected to occur, the net cumulative gain or loss recognised in equity is transferred to the income statement for the period.
Derivativesembeddedinotherfinancialinstrumentsornon-derivativehostcontractsaretreatedasseparatederivativeswhen their risks and characteristics are not closely related to those of host contracts and the host contracts are not carried at fair value with unrealised gains or losses reported in the income statement.
ProvisionsProvisionsarerecognisedwhentheGrouphasapresentlegalorconstructiveobligation,asaresultofpastevents,forwhich it is probable that an outflow of economic benefits will be required to settle the obligation, and a reliable estimate can be made for the amount of the obligation. Where the effect of discounting to present value is material, provisions are adjusted to reflect the time value of money.
Provisionsforwarrantycostsarerecognisedatthedateofsaleoftherelevantproducts,attheDirectors’bestestimateof the expenditure required to settle the Group’s liability.
ProvisionsforrestructuringcostsarerecognisedwhentheGrouphasadetailedformalplanfortherestructuringthathasbeen communicated to affected parties.
Share-based paymentTheGrouphasappliedtherequirementsofIFRS2‘Share-basedPayment’.Inaccordancewiththetransitionalprovisions,IFRS2hasbeenappliedtoallgrantsofequityinstrumentsafter7November2002thatwereunvestedasof1January2005.
TheGroupissuesequity-settledshare-basedpaymentstocertainemployees.Equity-settledshare-basedpaymentsaremeasuredatfairvalueatthedateofgrant.Thefairvaluedeterminedatthegrantdateoftheequity-settledshare-basedpayments is expensed on a straight line basis over the vesting period, based on the Group’s estimate of the shares that will eventually vest.
Fair value is measured by use of a binomial model. The expected life used in the model has been adjusted, based on management’sbestestimate,fortheeffectsofnon-transferability,exerciserestrictionsandbehaviouralconsiderations.
Notes to the financial statementsfor the year ended 30 September 2009 (continued)

Dimension Data Annual Report 2009 87
3. Critical accounting judgements and key sources of estimation uncertaintyIn the process of applying the Group’s accounting policies, management is required to make estimates and assumptions that affect the reported amounts of income, expenses, assets, liabilities and disclosure of contingent assets and liabilities. Managementusesallavailable informationandtheapplicationof judgement is inherent intheformationofestimates.Actualresults inthefuturecoulddifferfromtheseestimates,andanysubsequentchangesareaccountedforwithaneffect in income at the time such information becomes available.
Revenue and profit recognitionRevenue and profit on contracts are generally recognised on a percentage of completion basis when the outcome of a contractcanbeestimatedreliably.Managementisrequiredtousejudgementindeterminingwhetheracontract’soutcomecanbeestimatedreliably.Managementalsomakesestimatesoftotalcontractcosts,whichareusedindeterminingthevalueofamountsrecoverableoncontracts.RefertoNote21.
Share-based paymentThe expense for the share schemes is determined by estimating the fair value of the options granted. Details of the valuationmethodsandassumptionsusedaresetoutinNote37.
Provision for bad debtsProvision is made for bad debts based onmanagement’s estimate of the prospect of recovering the debt.Wheremanagementhasdeterminedthatadebtisnolongerrecoverable,theamountiswrittenoff.RefertoNote21.
Provision for inventoryInventory is counted at least once a year and any shortages and obsolete stock identified are written off immediately. Anallowanceismadeforslowmovingandobsoleteinventorybasedonhistoricaltrends.Provisionagainstslowmovingandobsoletestockat30September2009amountedto$90.1million(2008:$86.4million).
Impairment of goodwillManagementisrequiredtoestimatewhetherornotgoodwillhasbeenimpaired.Thisrequiresestimationofthevalueinuseofthecash-generatingunitstowhichgoodwillhasbeenallocated.Thevalueinusecalculationincludesestimatesabout the future financial performanceof the cash-generating units, includingmanagement’s estimatesof long termoperatingmarginsandlongtermgrowthrates.RefertoNote16.
Income taxesManagementmakesestimatesofthelikelyoutcomeofdecisionsbytaxauthoritiesontransactionsandeventswhosetreatment for tax purposes is uncertain. When the final outcome of such matters is different, or expected to be different, from previous assessments made by management, a change to the tax provision will be recorded in the period when that decision is made.
Residual value on property, plant and equipmentIn general no residual values are attached to the Group’s property, plant and equipment due to the nature of these items. However,managementhaveappliedaresidualvaluetotheCampusasset.Residualvalueisanestimateoftheamountthat the Group would currently obtain from disposal of the asset, after deducting the estimated costs of disposal, if the asset were already of the age and in the condition expected at the end of its useful life.
Valuation of investment propertyTheportionoftheCampuspropertyheldtoearnrentalsorforcapitalappreciationhasbeenclassifiedas investmentpropertyandisstatedatfairvalue.Managementhavecarriedoutavaluationbasedonarentalincomeyield.RefertoNote15.
LitigationTheGroupissubjecttoclaimswhichariseintheordinarycourseofbusiness.Eachclaimisevaluatedbymanagement,together with their legal advisers, and a decision made on whether financial settlement is probable, in which case appropriate provisions are made.

88 Dimension Data Annual Report 2009
Restated*
2009 2008 $’000 $’000
4. RevenueThe Group’s revenue is analysed as follows:Sale of goods 2,239,372 2,735,941Services rendered 1,733,706 1,774,699 3,973,078 4,510,640Other operating income 27,311 36,895Interest and investment income 8,105 17,516 4,008,494 4,565,051*Revenue of $36.6 million has been reclassified from services to product in the Asia Region.
5. Geographic and business segmentsGeographic segments
For management purposes, the Group is organised regionally and these regions are the basis on which the Group reports its primary segment information, which is based on the location of assets.
Geographic segment information about these regions is presented below.
Segment Segment Revenue results Revenue results 2009 2009 2008 2008 $’000 $’000 $’000 $’000
Revenue and resultsAmericas 532,446 5,473 690,835 19,570Asia 605,630 52,984 719,601 44,203Australia 990,576 39,664 1,146,094 40,376Europe 1,027,418 31,688 1,152,860 21,902MiddleEastandAfrica 1,062,916 84,458 1,112,067 88,442CentralandOther 34,255 (19,902) 19,412 (32,279)Inter-companyrevenues* (280,163) (330,229)
3,973,078 194,365 4,510,640 182,214Exceptionalitems (1,472) –
Operating profit 192,893 182,214Share of results of associates** 7,814 7,113Interest and investment income 8,105 17,516Finance costs (29,915) (31,025)Propertyrevaluationandothergainsandlosses 4,895 13,194
Profit before tax 183,792 189,012Tax (38,422) (47,973)
Profit after tax 145,370 141,039
*Inter-company revenues are charged at prevailing market prices.
**88% of associate income is derived from the Middle East and Africa region.
Notes to the financial statementsfor the year ended 30 September 2009 (continued)

Dimension Data Annual Report 2009 89
Capital Other Capital Other and Depreciation significant and Depreciation significant intangible and non-cash intangible and non-cash additions amortisation expense* additions amortisation expense* 2009 2009 2009 2008 2008 2008 $’000 $’000 $’000 $’000 $’000 $’000
5. Geographic and business segments (continued)
Other informationAmericas 2,703 2,941 2,208 2,368 2,488 1,607Asia 1,212 7,540 2,048 7,650 8,371 1,700Australia 3,113 3,301 2,746 5,158 4,809 2,675Europe 2,620 5,423 3,877 7,571 7,312 2,121MiddleEastandAfrica 68,210 31,555 4,994 59,218 33,567 4,515CentralandOther 5,556 2,167 4,179 9,670 3,048 4,108
83,414 52,927 20,052 91,635 59,595 16,726
* Share-based payment.
Segment Segment Segment Segment assets liabilities assets liabilities 2009 2009 2008 2008 $’000 $’000 $’000 $’000
Balance sheetAmericas 282,035 208,088 301,108 229,022Asia 618,409 205,317 396,464 148,283Australia 297,577 254,011 266,623 224,806Europe 444,688 346,211 401,472 369,977MiddleEastandAfrica 578,211 357,141 536,311 224,906CentralandOther 236,504 211,690 422,818 273,946
2,457,424 1,582,458 2,324,796 1,470,940Investments in associates 42,509 – 34,426 –Unallocated assets and liabilities* 62,330 73,558 43,206 83,076
2,562,263 1,656,016 2,402,428 1,554,016
* Includes income and deferred tax assets and liabilities.
Business segmentsRevenue streamsTheGroupisfocusedonvariousbusinesses,includingSystemsIntegration,InternetSolutions,Plessey,ExpressDataand other smaller regional businesses.
The Group also offers a full life cycle of IT Services to clients – including planning, building, support and management. This is reported as three streams of revenue: product (the resale of non-proprietary product), managed services (ofannuityorrecurringnature)andprofessionalservices(project-basedengagements).

90 Dimension Data Annual Report 2009
5. Geographic and business segments (continued)Business segments (continued)Revenue streams (continued) Systems Internet Express Integration Solutions Plessey Data Total $’000 $’000 $’000 $’000 $’000
2009Product 1,894,581 – – 344,791 2,239,372Managed services 824,245 255,015 – – 1,079,260Professional services 484,450 – 168,396 1,600 654,446
Total 3,203,276 255,015 168,396 346,391 3,973,078
2008 Restated*Product 2,341,062 – – 394,879 2,735,941Managed services 797,295 224,951 – – 1,022,246Professional services 553,203 – 199,250 – 752,453
Total 3,691,560 224,951 199,250 394,879 4,510,640
*The items previously disclosed in other have been reclassified to Systems Integration.
2009 2008 $’000 $’000
6. Operating profitOperating profit has been arrived at after charging/(crediting):Net foreign exchange losses/(gains) 4,842 (4,782)Depreciation of property, plant and equipment 46,499 52,151Loss on disposal of property, plant and equipment 416 1,559Net impairment of property, plant and equipment (188) (529)Amortisation of intangible assets 6,428 7,444Profit on disposal of intangible assets (756) –Impairment of intangible assets 1,627 –Operating lease expenses– Hire of property, plant and equipment 34,391 39,076– Other operating leases 6,865 6,935Write-down of inventories 2,092 44Staff costs (Note 7) 793,868 834,261Share incentive costs (Note 5) 20,052 16,726
Auditors’ remunerationFees payable to the Company’s auditor for the audit of the Company’s annual accounts 473 413The audit of the Company’s subsidiaries pursuant to legislation 4,265 4,125
Total audit fees 4,738 4,538
Fees payable to the Company’s auditor and its associates for other services:– Other services supplied pursuant to such legislation 420 540– Other services relating to taxation 475 1,220– Corporate finance services 208 333– All other services 57 190
Total non-audit fees 1,160 2,283
5,898 6,821
In the current year, as in the prior year, remuneration in the ‘All other services’ category relates to company secretarial services and advisory services in certain overseas countries.
A description of the work of the Audit Committee is set out in the Corporate Governance report on pages 50 and 51 and includes an explanation of how auditors’ objectivity and independence is safeguarded when non-audit services are provided by the auditors.
Notes to the financial statementsfor the year ended 30 September 2009 (continued)

Dimension Data Annual Report 2009 91
7. Staff costsAveragenumberofpersonsemployedbytheGroup(includingexecutivedirectors)was10,915(2008:10,355).
Staff costs incurred during the year in respect of these employees were:
2009 2008 $’000 $’000
Wages and salaries 719,310 764,914Social security costs 51,181 48,169Pensioncosts 23,377 21,178 793,868 834,261
Disclosures on Directors’ remuneration, pension entitlements, shareholding and share incentive schemes required by the CompaniesAct2006,theDirectors’RemunerationReportRegulations2002andthosespecifiedforauditbytheFinancialServicesAuthority,aresetoutintheRemunerationReportonpages62to68.
2009 2008 Notes $’000 $’000
8. Exceptional itemsExceptional operating costsCampusfinancerestructure (a) (1,472) –Total exceptional operating costs (1,472) –Other exceptional gains (b) – 4,064Exceptional taxDeferredtaxcredit (a) 10,976 –Total exceptional tax 10,976 –Exceptional items after tax 9,504 4,064Minorities’shareofexceptionalitems (1,647) –Net exceptional income 7,857 4,064
(a) During2009, theGroup, inconjunctionwith the lendingbanksand inagreementwith theSouthAfricantaxationauthorities(‘SARS’)restructuredthefinancingarrangementunderpinningtheCampuslandandbuildingsinSouthAfrica.Inconcludingtherestructuring,theGroupmadepaymenttothelendingbanksof$1.5million,whichrefundedcertainrebatesreceivedinpriorperiods.Pursuanttotherestructuring,SARSallowedDimensionDataaonceofftaxdeduction of $44.7 million. This deduction, net of temporary differences raised previously on the structure, resulted in the recognition of a deferred tax asset to the Group of $11.0 million.
(b) ProfitonsaleoftheGroup’s92.3%interestinAutomatetoBritehouse.
2009 2008 $’000 $’000
Reconciliation of statutory amounts to adjusted amountsStatutory operating profit 192,893 182,214Exceptionaloperatingcosts 1,472 –Adjustedoperatingprofit 194,365 182,214Statutory attributable profit after tax 135,175 118,410–Exceptionaloperatingcosts 1,472 –– Other exceptional gains – (4,064)–Exceptionaltaxitems (10,976) ––Minorities’share 1,647 –Adjustedattributableprofitaftertax 127,318 114,346

92 Dimension Data Annual Report 2009
Notes to the financial statementsfor the year ended 30 September 2009 (continued)
2009 2008 $’000 $’000
9. Interest and investment incomeInterest on cash and cash equivalents 6,806 14,075Interest earned on finance lease receivables 298 43Other investment income 1,001 3,398Total 8,105 17,516
10. Finance costsInterest on bank overdrafts and loans 19,436 4,037Interest on obligations under finance leases 8,713 24,288Other interest 1,766 2,700 29,915 31,025
11. Property revaluation and other gains and lossesRevaluationofinvestmentproperty(Note15) 4,535 8,528Profitonsaleofsubsidiariesandinvestments 174 5,269Other 186 (603) 4,895 13,194
12. TaxCurrenttax 42,860 42,886Withholding and other taxes 3,907 2,973Adjustmentstoprioryears’taxprovision (5,560) 1,510Total current tax 41,207 47,369Deferredtaxation(refertoNote27) Current (614) 1,678Adjustmentstoprioryear’sdeferredtaxprovision (2,171) (1,074)Total deferred tax (2,785) 604Total tax charge 38,422 47,973
The tax charge for the year is reconciled to the profit before tax using the corporatetaxrateofSouthAfrica,thejurisdictioninwhichtheparentcompany is domiciled.Profitbeforetax: 183,792 189,012ExpectedtaxchargeatSouthAfricancorporatetaxrateof28%(2008:28%) 51,462 52,923Expensesnotdeductible 6,753 7,147Short term temporary differences (2,935) (9,848)Nettaxlossescreated 4,791 4,962Campusfinancerestructure(RefertoNote8) (10,976) –Adjustmentswithrespecttoprioryears (7,731) 436Non-taxableprofits/zerotaxjurisdictions (11,826) (11,678)International corporate tax differentials and other 8,716 3,917Effectofratechange – 915SecondaryTaxonCompanies 2,359 1,189Share of associates’ tax (2,191) (1,990)Actualtaxcharge 38,422 47,973

Dimension Data Annual Report 2009 93
2009 2008 US cents US cents
13. Earnings per shareBasic earnings per share 8.0 7.7Diluted earnings per share 7.7 7.3Basic earnings per share before exceptional items 7.6 7.4Diluted earnings per share before exceptional items 7.2 7.1
The calculation of earnings per share is based on the following data:
2009 2008 $’000 $’000
EarningsEarningsforthepurposeofbasicanddilutedearningspersharebeingnetprofit attributable to equity holders of the parent 135,175 118,410Earningsforthepurposeofadjustedbasicearningspersharebeingnetprofitattributable to equity holders of the parent 135,175 118,410Exceptionalitems (7,857) (4,064)Earningsbeforeexceptionalitems 127,318 114,346
2009 2008 ’000 ’000
Number of sharesWeighted average number of ordinary shares for the purposes of basic earnings per share 1,683,829 1,540,733Effectofdilutivepotentialordinaryshares:Shareschemes 74,455 75,469Weighted average number of ordinary shares for the purposes of diluted earnings per share 1,758,284 1,616,202
JSE Limited requirementsDisclosureofheadlineearningspershareisarequirementforentitieslistedontheJSELimitedinSouthAfricaand,asaresult, the Group has calculated and presented the headline earnings reconciliation below. Headline earnings are arrived atintermsoftheguidanceinCircular3/2009issuedbytheSouthAfricanInstituteofCharteredAccountants.
2009 2008 ’000 ’000
Weighted average number of ordinary shares:– for headline earnings per share 1,683,829 1,540,733– for diluted headline earnings per share 1,758,284 1,616,202
$’000 $’000
Earningsforbasicanddilutedearningspershare 135,175 118,410Adjustmentsforheadlineearnings (2,003) (8,614)Headline earnings 133,172 109,796
US cents US cents
Headline earnings per share 7.9 7.1Diluted headline earnings per share 7.6 6.8
The adjustments for headline earnings include the revaluation of the Campus investment property of $4.5 million(2008:$8.5million),profitsandlossesonthesaleofsubsidiariesandinvestmentsof$0.4million(2008:$4.7million),profitandlossonsaleofproperty,plantandequipmentandintangibleassetsof$0.3million(2008:$1.6million),andimpairmentofproperty,plantandequipmentandintangibleassetsof$1.4million(2008:nil),netoftaxandminoritiesof$1.8million(2008:$3.0million).

94 Dimension Data Annual Report 2009
Notes to the financial statementsfor the year ended 30 September 2009 (continued)
Freehold Computer
and leasehold and Office
land, buildings workshop Motor furniture and
and improvements equipment vehicles equipment Total
$’000 $’000 $’000 $’000 $’000
14. Property, plant and equipmentCostAt1October2007 95,431 253,581 5,146 62,165 416,323Additions 2,060 64,117 2,103 10,017 78,297Subsidiaries acquired 99 2,350 153 163 2,765Disposals(includingsubsidiaries) (98) (16,163) (631) (1,989) (18,881)Transfer from investment property 3,799 – – – 3,799Exchangedifferences (14,515) (26,583) (116) (5,921) (47,135)At1October2008 86,776 277,302 6,655 64,435 435,168Additions 2,148 41,810 920 5,259 50,137Subsidiaries acquired 546 4,244 9 138 4,937Disposals (1,290) (19,648) (835) (6,748) (28,521)Transfer from investment property 530 – – – 530Exchangedifferences 8,084 21,801 (398) 2,468 31,955At 30 September 2009 96,794 325,509 6,351 65,552 494,206Accumulated depreciationAt1October2007 23,601 177,025 2,483 48,200 251,309Chargefortheyear 3,368 40,237 1,431 7,115 52,151Subsidiaries acquired 39 74 20 58 191Disposals(includingsubsidiaries) (65) (14,120) (363) (1,562) (16,110)Assetimpairmentreversal (529) – – – (529)Exchangedifferences (3,129) (14,971) 17 (4,321) (22,404)At1October2008 23,285 188,245 3,588 49,490 264,608Chargefortheyear 2,707 36,079 1,200 6,513 46,499Subsidiaries acquired 444 2,781 – 104 3,329Disposals (127) (18,621) (589) (6,910) (26,247)Assetimpairmentreversal (452) – – – (452)Assetimpairmentrecognised 164 – 100 – 264Exchangedifferences 1,779 12,524 (177) 1,848 15,974At 30 September 2009 27,800 221,008 4,122 51,045 303,975Net book value30 September 2009 68,994 104,501 2,229 14,507 190,23130 September 2008 63,491 89,057 3,067 14,945 170,560
TheportionoftheCampuspropertyinSouthAfricaheldtoearnrentalsorforcapitalappreciationisclassifiedasinvestmentproperty.Fordetailsofassetscededassecurity,refertoNote38.3.1.
Theimpairmentlossreversedin2009was$0.5million(2008:$0.5million)andrelatedtotheCentralandOthersegment.

Dimension Data Annual Report 2009 95
2009 2008 $’000 $’000
15. Investment propertyAt1October2008 81,208 92,805Transferred to property, plant and equipment (530) (3,799)Increaseinfairvalueduringtheyear(Note11) 4,535 8,528Exchangedifferences 10,698 (16,326)
At 30 September 2009 95,911 81,208
TheelementoccupiedbythirdpartytenantsoftheCampusisclassifiedas investmentproperty.ThefairvalueoftheGroup’s investment property at 30 September 2009 has been carried out by management, based on a forward rental yieldof9.5%(2008:9.2%).
Rentalincomeof$13.8million(2008:$15.0million)includingrentalschargedtoGroupcompanies,wasgeneratedbytheCampus,comprisingboththeinvestmentpropertyandtheportionassetincludedinproperty,plantandequipment.
FordetailsofinvestmentpropertycededassecurityrefertoNote38.3.1.
2009 2008 $’000 $’000
16. GoodwillAt1October2008 95,820 90,557Recognisedonacquisitionofsubsidiariesandbusinesses(Note31) 7,599 17,076Changeinholdingsinsubsidiaries 183,399 3,910Eliminatedondisposalofsubsidiaries – (5,001)Exchangedifferences 4,682 (10,722)
At 30 September 2009 291,500 95,820
The goodwill balance is allocated to the following regions:Americas 3,069 2,444Asia 200,845 17,041Australia 6,980 3,943Europe 13,543 7,626MiddleEastandAfrica 67,063 64,766
291,500 95,820
Goodwillacquiredinabusinesscombinationisallocatedtocash-generatingunits(‘CGUs’)thatareexpectedtobenefitfromthatbusinesscombination,andtheseidentifiedCGUsareatalowerlevelthanregionallevel.
TheGrouptestsgoodwillannuallyforimpairmentattheCGUlevel,ormorefrequentlyifthereareindicationsthatgoodwillmight be impaired. There has been no impairment to goodwill recorded in 2009 or 2008.
The recoverable amounts of theCGUs are determined from value in use calculations. The key assumptions for thevalue in use calculations are those regarding the discount rates, growth rates and expected changes in selling prices anddirectcostsduringtheperiod.Managementestimatesdiscountratesusingpre-taxratesthatreflectcurrentmarketassessmentsofthetimevalueofmoneyandrisksspecifictotheCGUs.Thegrowthratesarebasedonindustrygrowthforecasts.Changesinsellingpricesanddirectcostsarebasedonpastpracticesandexpectationsoffuturechangesinthe market.
The Group has prepared forecasts based on the most recent financial budgets approved by the Board, which look one year hence. The discount rates used range between 7.3% and 15.0%. Growth factors applied to expected earnings were between 5% to 25%. These rates are consistent with growth rates of the industry in which the Group operates.
ThemostsignificantcomponentofgoodwillwithintheAsiaregionrelatestoDatacraftAsia.TheCGUrecoverableamountin respect of that goodwill was determined using management’s budget for 2010, thereafter applying a growth rate of 15% to 25% with a terminal growth rate of 15% at an equivalent discount rate for six years after which a growth rate of 15% is extrapolated into perpetuity.
ThemostsignificantcomponentofgoodwillwithintheMiddleEastandAfricaregionrelatestoInternetSolutions.TheCGUrecoverableamountinrespectofthatgoodwillwasdeterminedusingmanagement’sbudgetfor2010,thereafterapplying a growth rate of 10% to 15% with a terminal growth rate of 14% at an equivalent discount rate for five years after which a growth rate of 14% is extrapolated into perpetuity.
Managementbelieves thatany reasonablechange in thekeyassumptionswouldnotcause thecarryingamounts toexceed their recoverable amounts.

96 Dimension Data Annual Report 2009
Notes to the financial statementsfor the year ended 30 September 2009 (continued)
Computer Right software of use Other Total $’000 $’000 $’000 $’000
17. Other intangible assetsCostAt1October2007 27,238 – 3,078 30,316Additions 13,338 – – 13,338Disposals(includingdisposalofsubsidiaries) (4,886) – – (4,886)Exchangedifferences (3,271) – (131) (3,402)
At1October2008 32,419 – 2,947 35,366Additions 8,615 24,662 – 33,277Disposals (2,362) (1,541) – (3,903)Arisingonacquisitionofasubsidiary 312 – – 312Exchangedifferences 3,404 4,507 (57) 7,854
At 30 September 2009 42,388 27,628 2,890 72,906
Accumulated amortisationAt1October2007 11,451 – 1,951 13,402Chargefortheyear 6,532 – 912 7,444Disposals(includingdisposalofsubsidiaries) (2,594) – – (2,594)Exchangedifferences (1,441) – (301) (1,742)
At1October2008 13,948 – 2,562 16,510Chargefortheyear 6,158 97 173 6,428Assetimpairmentrecognised 1,627 – – 1,627Disposals (2,018) – – (2,018)Exchangedifferences 2,215 19 23 2,257
At 30 September 2009 21,930 116 2,758 24,804
Net book value30 September 2009 20,458 27,512 132 48,10230 September 2008 18,471 – 385 18,856
Includedinadditionstocomputersoftwareareinternallygeneratedintangibleassetsof$2.7million(2008:nil)resultingfrom investment in the Group’s IT service management platform. The additions of $24.7 million in the right of use category represents the purchase of an indefeasible right of use in the subsea fibre optic communications system from Seacom Limited,ofwhich$14.3millionwaspaidthisyearwiththebalancedueoverthenexttwoyears.
2009 2008 $’000 $’000
18. Investments in associatesUnquoted associates 42,509 34,426
The carrying amount is made up as follows: Costofinvestmentinassociates 7,936 6,412Shareofpost-acquisitionprofits/(losses),netofdividendsreceived 6,236 (746)Loans,lessprovisions 37,398 36,446Deferral of unearned profit (9,061) (7,686)
42,509 34,426
Directors’ value of unlisted associates 69,298 63,124
Analysisofmovementsininvestmentsinassociates:At1October 34,426 30,381Acquisitions 1,005 943Deferral of unearned profit – (4,135)Share of current year’s profit 7,814 7,113Impairment on carrying value of associates – (42)Dividends received (1,268) (1,129)Other disposals and transfers (252) (127)Movementinloanstoassociates (2,515) 7,210Exchangedifferences 3,299 (5,788)
At 30 September 42,509 34,426
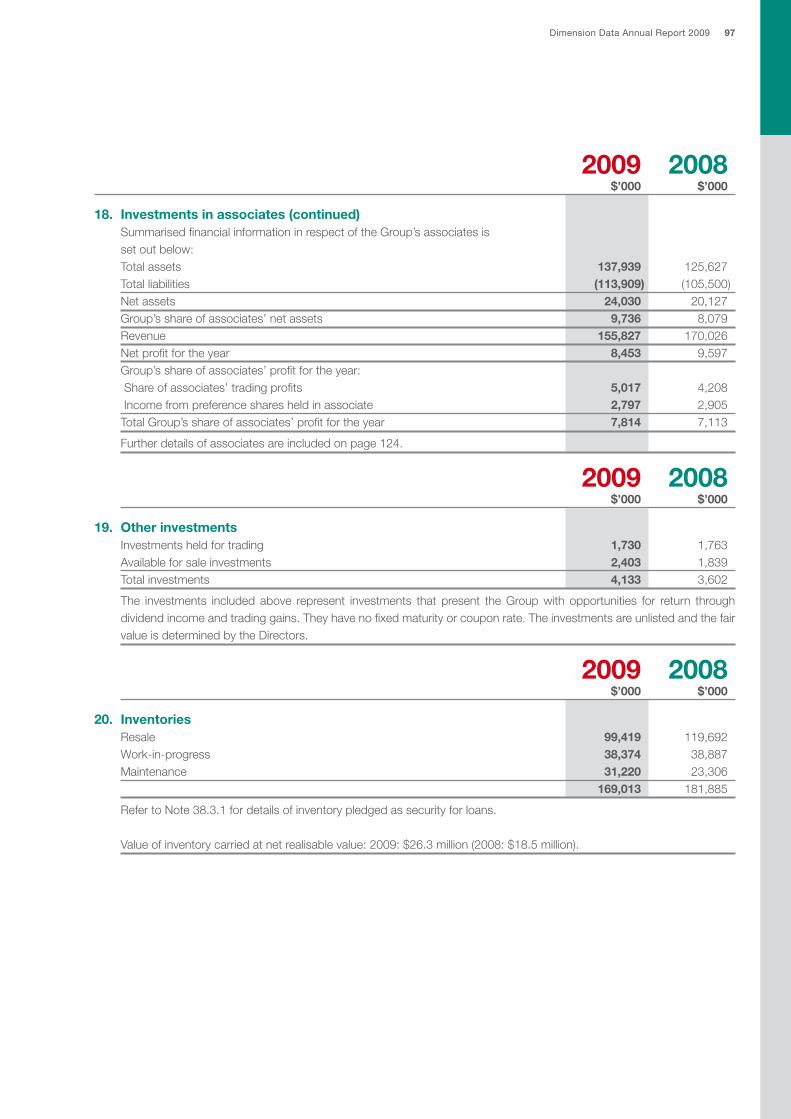
Dimension Data Annual Report 2009 97
2009 2008 $’000 $’000
18. Investments in associates (continued)Summarised financial information in respect of the Group’s associates is set out below:Total assets 137,939 125,627Total liabilities (113,909) (105,500)Netassets 24,030 20,127Group’s share of associates’ net assets 9,736 8,079Revenue 155,827 170,026Netprofitfortheyear 8,453 9,597Group’s share of associates’ profit for the year: Share of associates’ trading profits 5,017 4,208 Income from preference shares held in associate 2,797 2,905Total Group’s share of associates’ profit for the year 7,814 7,113
Further details of associates are included on page 124.
2009 2008 $’000 $’000
19. Other investmentsInvestments held for trading 1,730 1,763Availableforsaleinvestments 2,403 1,839Total investments 4,133 3,602
The investments included above represent investments that present the Group with opportunities for return through dividend income and trading gains. They have no fixed maturity or coupon rate. The investments are unlisted and the fair value is determined by the Directors.
2009 2008 $’000 $’000
20. InventoriesResale 99,419 119,692Work-in-progress 38,374 38,887Maintenance 31,220 23,306 169,013 181,885
RefertoNote38.3.1fordetailsofinventorypledgedassecurityforloans.
Valueofinventorycarriedatnetrealisablevalue:2009:$26.3million(2008:$18.5million).

98 Dimension Data Annual Report 2009
Notes to the financial statementsfor the year ended 30 September 2009 (continued)
2009 2008 $’000 $’000
21. Trade and other receivablesTrade receivables, net of provisions 679,546 766,797Unbilled trade receivables 81,281 37,879Other receivables 58,727 59,995Prepaidvendormaintenancecontracts 157,658 149,374 Other prepayments 56,585 35,435Finance lease receivables 11,483 12,667 1,045,280 1,062,147Analysedasfollows:Longtermportion 47,571 38,163 Short term portion 997,709 1,023,984 1,045,280 1,062,147
Interest is not typically charged on outstanding receivable balances.
RefertoNote38fordetailsoftradereceivablespledgedassecurityforloans.
2009 2008Provision for impairment of trade receivables $’000 $’000
Balance as at 1 October 32,597 27,363 Chargefortheyear 10,585 16,459Utilised in the year (2,229) (7,271)Unused amounts reversed (3,741) (1,437)Other movements 1,024 864 Exchangedifferences 898 (3,381)Balance as at 30 September 39,134 32,597
Provisions of $8.2 million (2008: $13.2 million) have been established against specific trade receivables of $8.3million(2008:$26.1million).
TheGrouphasreviewedtradereceivablesoutstanding(netofimpairmentprovisions)andconsidersthecreditqualitytobe good and the carrying amount to approximate fair value. The Group considers these collectible and fairly stated at periodend.(ReferNote38.3.2)
Trade receivables past due date (refer to credit risk in Note 38.3.2) Of the year end trade receivables balance, net of impairments, the following were past due at 30 September:
Middle East & Central $’000 Americas Asia Australia Europe Africa & other Total
2009Trade receivables that are neither past due nor impaired 54,859 82,265 95,444 128,122 82,189 4,198 447,077Trade receivables that are past due but not impaired 28,861 21,696 26,336 67,057 87,301 1,089 232,340
Lessthan30days 20,402 7,268 18,805 39,175 32,700 770 119,12031 to 60 days 7,085 9,408 6,477 20,195 13,886 296 57,34761 to 90 days 403 1,395 1,054 6,403 10,586 23 19,864Over 90 days 971 3,625 – 1,284 30,129 – 36,009
83,720 103,961 121,780 195,179 169,490 5,287 679,417
Individually impaired trade receivables not provided for 129Total 679,546

Dimension Data Annual Report 2009 99
21. Trade and other receivables (continued) Middle East & Central$’000 Americas Asia Australia Europe Africa & other Total
2008Trade receivables that are neither past due nor impaired 85,897 61,974 84,035 168,360 97,823 6,760 504,849 Trade receivables that are past due but not impaired 37,571 70,715 28,124 56,473 54,625 1,582 249,090
Lessthan30days 28,460 28,014 20,307 31,912 24,707 449 133,84931 to 60 days 3,997 20,564 4,524 15,993 11,284 491 56,853 61 to 90 days 4,322 9,326 2,451 5,726 7,816 274 29,915 Over 90 days 792 12,811 842 2,842 10,818 368 28,473
123,468 132,689 112,159 224,833 152,448 8,342 753,939
Individually impaired trade receivables not provided for 12,858 Total 766,797
Thebalancesover90daysintheMiddleEastandAfricaregionareconcentratedoutsideofSouthAfrica,inEmirates,NigeriaandMalawi.TheGroupbelieves thatnoprovision is requiredagainst these receivablesas thedebtorsaregenerally high quality companies and local conditions determine that receivables in these countries take longer to settle than elsewhere.
Thebalancesinover90daysintheAsiaregionsareconcentratedinChina,HongKong,India,SingaporeandVietnam.These receivable are from high quality companies and the Group believes that no provision is required.
Theaveragecreditperiodprovidedonsaleofgoodswas47days(2008:46days).
Approximately25%oftheGroup’srevenuesaregeneratedfrombusinesswithfinancialservicesorganisations,andasimilar proportion from business with service providers. Trade receivables reflect a similar exposure to clients within these market sectors.
Finance lease receivables The Group enters into finance lease arrangements for the sale of certain computer equipment. All leases aredenominated in the functional currency of the relevant lessor. The average term of finance leases entered into is three years.
The interest rates inherent in the leases are fixed at the contract date for all of the lease term at an inherent rate of between 4%and11%(2008:5%and11.25%).
The Group considers the fair value of finance lease receivables to approximate their carrying amounts at 30 September 2009.
Payment profile of finance lease receivables Present value Minimum lease of minimum payments lease payments 2009 2008 2009 2008 $’000 $’000 $’000 $’000
Within one year 5,304 4,743 4,993 4,716 Two to five years 7,493 9,082 6,490 7,779 Subsequent to five years – 306 – 172 12,797 14,131 11,483 12,667 Less: unearned finance income (1,314) (1,464) n/a n/a 11,483 12,667 11,483 12,667

100 Dimension Data Annual Report 2009
Notes to the financial statementsfor the year ended 30 September 2009 (continued)
2009 2008 $’000 $’000
22. Taxation authorities receivable and payableReceivableIncome taxes 14,600 11,344Indirect taxes 7,763 7,197Payrolltaxes 21 4Other 4,233 4,845 26,617 23,390PayableIncome taxes 72,537 82,361Indirect taxes 35,847 39,796Payrolltaxes 13,274 11,447Other 1,415 1,136 123,073 134,740
2009 2008 Number of Numberof shares $’000 shares $’000
23. Share capitalAuthorisedDeferredsharesof£1each 50,000 75 50,000 75Ordinary shares of 1 US cent each 3,000,000,000 30,000 3,000,000,000 30,000 30,075 30,075Called up, allocated and fully paid upDeferredsharesof£1each 50,000 75 50,000 75Ordinary shares of 1 US cent each 1,698,781,169 16,988 1,694,459,681 16,945 17,063 17,020SharesheldbyTheEmployeeShareTrust (10,531,897) (105) (34,504,928) (345) 16,958 16,675Ordinary shares issued:Opening balance 1,694,459,681 16,945 1,551,599,171 15,516AcquisitionofDatacraftAsiaminorities – – 136,121,909 1,361Employeeshareoptionschemes 4,321,488 43 6,738,601 68 1,698,781,169 16,988 1,694,459,681 16,945
Shares held by The Employee Share Trust:Opening balance 34,504,928 345 22,033,259 220Share purchases 29,189,111 292 30,183,055 302Share awards in terms of share incentive schemes (46,487,978) (465) (17,659,996) (177)Share sales (6,674,164) (67) (51,390) – 10,531,897 105 34,504,928 345
4,321,488(2008:6,738,601)ordinaryshareswereissuedintermsoftheShareOptionScheme,foratotalconsiderationof$2.0million(2008:$3.9million).
ThesharesheldbyTheEmployeeShareTrustwillbeusedtosettletheGroup’sobligationsunder itsshare incentiveschemes. These shares have been set off against share capital and share premium in the Group balance sheet, as the Trust has been consolidated.
The terms of the deferred shares appear in the Directors’ Report on page 43.

Dimension Data Annual Report 2009 101
Capital Translation Hedging Other Total other reserves reserve reserve reserves* reserves $’000 $’000 $’000 $’000 $’000
24. Total other reserves1 October 2007 83,043 42,125 248 136,287 261,703Itemsrecogniseddirectlyintoequity 3,123 (43,483) 293 1,248 (38,819)
Share incentive schemes 14,982 – – – 14,982Deferredtaxonshareincentiveschemes (3,409) – – – (3,409)Shareoptionreserveutilised (5,943) – – – (5,943)Currencyadjustments – (44,528) (43) 395 (44,176)Deferred tax arising on revaluation of loans – 702 – – 702VestingunderBEEscheme (2,507) – – – (2,507)Netgainoncashflowhedging – – 340 – 340Transferstoincomestatement – 343 – (748) (405)Other deferred tax – – – 56 56Other – – (4) (1) (5)Transfers – – – 1,546 1,546
1October2008 86,166 (1,358) 541 137,535 222,884Itemsrecogniseddirectlyintoequity 1,266 30,577 (2,483) (786) 28,574
Share incentive schemes 17,451 – – – 17,451Deferred tax on share incentive schemes 5,558 88 – – 5,646Shareoptionreserveutilised (16,034) – – – (16,034)Currencyadjustments – 33,290 (204) (7) 33,079VestingunderBEEscheme (5,767) (2,459) 532 (314) (8,008)Lossesoncashflowhedgesdeferred inequity – – (5,378) – (5,378)Hedging losses capitalised to other intangible assets – – 2,856 – 2,856Transferstoincomestatement – – (289) – (289)Other 58 (342) – 1,251 967Transfers – – – (1,716) (1,716)
30 September 2009 87,432 29,219 (1,942) 136,749 251,458
*Other reserves principally comprise consolidation reserves arising prior to the unbundling of the underlying assets into the Company at
the time of its LSE listing in 2000.
2009 2008 $’000 $’000
25. Other long term liabilitiesUnsecured long term loans 17,647 11,877Deferred income relating to customer maintenance contracts 18,894 24,057Trade payables 6,750 –Deferred consideration 2,280 2,640
45,571 38,574
Unsecured long term loans include trade loans bearing interest at rates of 4% to 4.25%. These loans are repayable betweenOctober2010andMay2012.
Trade payables relate to the long term portion of the deferred payment on the purchase of other intangible assets, refer toNote17.

102 Dimension Data Annual Report 2009
Notes to the financial statementsfor the year ended 30 September 2009 (continued)
Present value Minimum lease of minimum payments lease payments 2009 2008 2009 2008 $’000 $’000 $’000 $’000
26. Obligations under finance leasesAmountspayableunderfinanceleases:Within one year 10,117 25,262 9,092 6,278Two to five years 14,874 113,200 14,099 15,963Subsequent to five years – 164,826 – 123,943 24,991 303,288 23,191 146,184Less: future finance charges (1,800) (157,104) n/a n/aPresentvalueofleaseobligations 23,191 146,184 23,191 146,184Less: amounts due for settlement within12months(shownascurrentliabilities) (9,092) (6,278)Amountdueforsettlementafter12months 14,099 139,906
In the prior year, the obligations under finance leases related mainly to the Campus property in South Africa. During2009,thefinancingontheCampuspropertywasrestructured.RefertoNote30fordetailsoftherestructuring.
Asset Liability Total $’000 $’000 $’000
27. Deferred taxAt1October2007 41,248 (2,295) 38,953(Charge)/credittoincomestatementfortheyear (1,000) 396 (604)Other movements 20 28 48(Charge)/credittoequityfortheyear (3,472) 821 (2,651)Acquisition/disposalofsubsidiaries – 303 303Exchangedifferences (4,934) 32 (4,902)At1October2008 31,862 (715) 31,147Credit/(charge)toincomestatementfortheyear 3,043 (258) 2,785Othermovements (21) – (21)Credittoequityfortheyear 8,841 – 8,841Acquisition/disposalofsubsidiaries (194) – (194)Exchangedifferences 4,199 (48) 4,151At 30 September 2009 47,730 (1,021) 46,709
Deferred tax components Campus Share- revalu- Deferred Prepay- Provi- based Tax $’000 ation income ments sions payments losses Other Total
At1October2008 (5,623) 12,276 (352) 24,383 6,652 951 (7,140) 31,147 Income statement
charge – in respect of currentyear (1,270) 17 (6,414) 9,293 (3,215) 67 2,136 614
Income statement charge – in respect of prioryear – 76 47 532 (119) 675 960 2,171
Credittoequityforthe period – – – – 8,841 – – 8,841
Othermovements – – – (608) – (160) 553 (215) Exchangedifferences (933) 1,470 (1,455) 4,607 (434) 241 655 4,151 At 30 September 2009 (7,826) 13,839 (8,174) 38,207 11,725 1,774 (2,836) 46,709
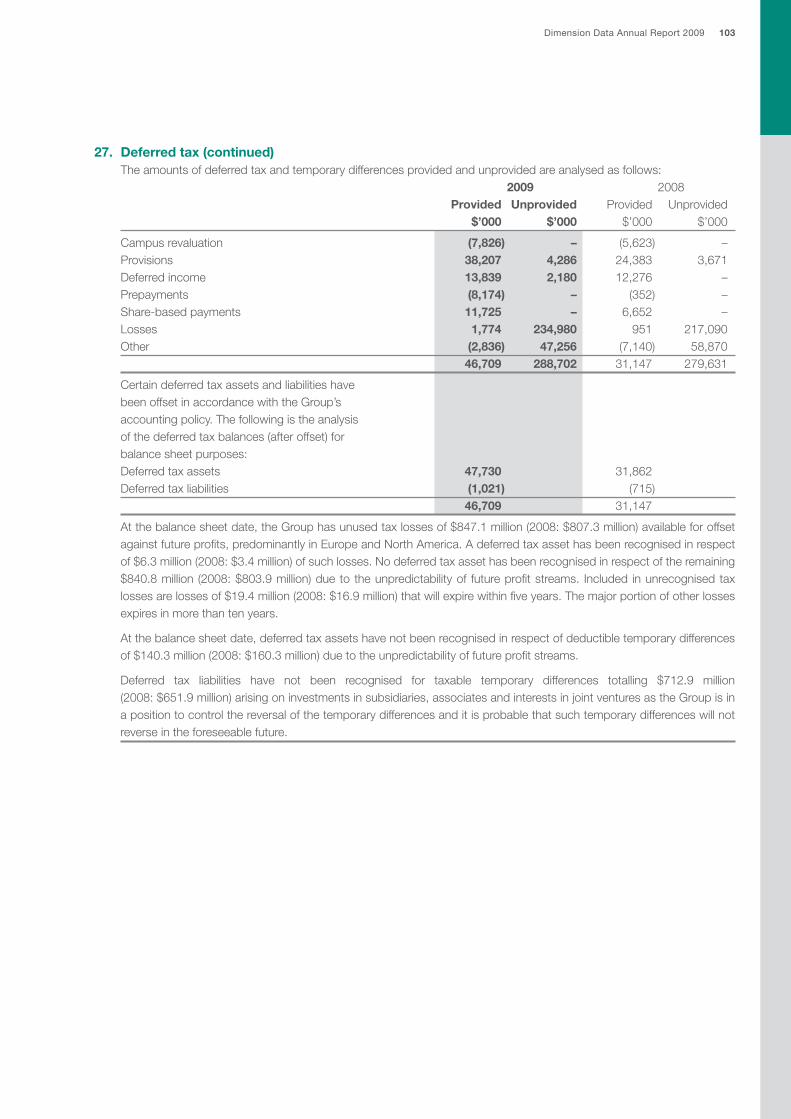
Dimension Data Annual Report 2009 103
27. Deferred tax (continued)The amounts of deferred tax and temporary differences provided and unprovided are analysed as follows: 2009 2008 Provided Unprovided Provided Unprovided $’000 $’000 $’000 $’000
Campusrevaluation (7,826) – (5,623) –Provisions 38,207 4,286 24,383 3,671Deferred income 13,839 2,180 12,276 –Prepayments (8,174) – (352) –Share-basedpayments 11,725 – 6,652 –Losses 1,774 234,980 951 217,090Other (2,836) 47,256 (7,140) 58,870 46,709 288,702 31,147 279,631
Certaindeferredtaxassetsandliabilitieshavebeen offset in accordance with the Group’s accounting policy. The following is the analysis ofthedeferredtaxbalances(afteroffset)forbalance sheet purposes:Deferred tax assets 47,730 31,862 Deferred tax liabilities (1,021) (715) 46,709 31,147
Atthebalancesheetdate,theGrouphasunusedtaxlossesof$847.1million(2008:$807.3million)availableforoffsetagainstfutureprofits,predominantlyinEuropeandNorthAmerica.Adeferredtaxassethasbeenrecognisedinrespectof$6.3million(2008:$3.4million)ofsuchlosses.Nodeferredtaxassethasbeenrecognisedinrespectoftheremaining$840.8million (2008:$803.9million)duetotheunpredictabilityof futureprofitstreams. Included inunrecognisedtaxlossesarelossesof$19.4million(2008:$16.9million)thatwillexpirewithinfiveyears.Themajorportionofotherlossesexpires in more than ten years.
Atthebalancesheetdate,deferredtaxassetshavenotbeenrecognisedinrespectofdeductibletemporarydifferencesof$140.3million(2008:$160.3million)duetotheunpredictabilityoffutureprofitstreams.
Deferred tax liabilities have not been recognised for taxable temporary differences totalling $712.9 million (2008:$651.9million)arisingoninvestmentsinsubsidiaries,associatesandinterestsinjointventuresastheGroupisina position to control the reversal of the temporary differences and it is probable that such temporary differences will not reverse in the foreseeable future.
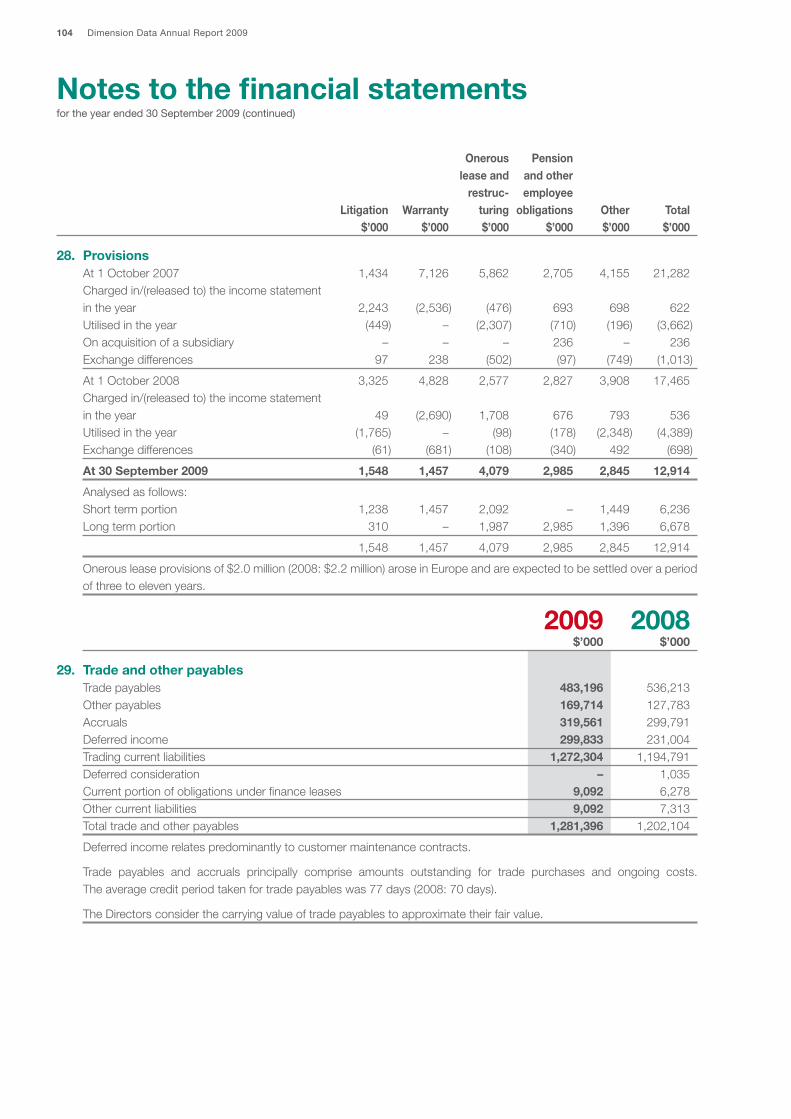
104 Dimension Data Annual Report 2009
Notes to the financial statementsfor the year ended 30 September 2009 (continued)
Onerous Pension lease and and other restruc- employee Litigation Warranty turing obligations Other Total $’000 $’000 $’000 $’000 $’000 $’000
28. ProvisionsAt1October2007 1,434 7,126 5,862 2,705 4,155 21,282Chargedin/(releasedto)theincomestatement intheyear 2,243 (2,536) (476) 693 698 622Utilisedintheyear (449) – (2,307) (710) (196) (3,662)On acquisition of a subsidiary – – – 236 – 236Exchangedifferences 97 238 (502) (97) (749) (1,013)
At1October2008 3,325 4,828 2,577 2,827 3,908 17,465Chargedin/(releasedto)theincomestatement intheyear 49 (2,690) 1,708 676 793 536Utilisedintheyear (1,765) – (98) (178) (2,348) (4,389)Exchangedifferences (61) (681) (108) (340) 492 (698)
At 30 September 2009 1,548 1,457 4,079 2,985 2,845 12,914
Analysedasfollows:Short term portion 1,238 1,457 2,092 – 1,449 6,236 Longtermportion 310 – 1,987 2,985 1,396 6,678
1,548 1,457 4,079 2,985 2,845 12,914
Onerousleaseprovisionsof$2.0million(2008:$2.2million)aroseinEuropeandareexpectedtobesettledoveraperiodof three to eleven years.
2009 2008 $’000 $’000
29. Trade and other payablesTrade payables 483,196 536,213Other payables 169,714 127,783Accruals 319,561 299,791Deferred income 299,833 231,004Trading current liabilities 1,272,304 1,194,791Deferred consideration – 1,035Currentportionofobligationsunderfinanceleases 9,092 6,278Other current liabilities 9,092 7,313Total trade and other payables 1,281,396 1,202,104
Deferred income relates predominantly to customer maintenance contracts.
Trade payables and accruals principally comprise amounts outstanding for trade purchases and ongoing costs. Theaveragecreditperiodtakenfortradepayableswas77days(2008:70days).
The Directors consider the carrying value of trade payables to approximate their fair value.

Dimension Data Annual Report 2009 105
2009 2008 $’000 $’000
30. Bank loansAmountspayableunderbankloans 163,874 6,097Less: amounts due for settlement within 12 months (23,321) (2,256)
Amountdueforsettlementafter12months 140,553 3,841
Bankloansincludealoanof$139.4million(ZAR1.03billion)relatingtothefinancingoftheCampuspropertyinSouthAfrica.ThefinancingoftheCampuspropertywasrestructuredfromafinanceleasetoabankloanduringthecurrentyear.The loan incorporates fixed interest at 17.37%. The current monthly loan repayments are $1.5 million payable in advance andescalateat11%perannum.TheCompanyactsassuretyandguarantoragainstanydefault.Inaddition,theloanissecured by the title over the property. The loan agreement terminates on 31 January 2018.
RefertoNote38.3.1(cessionofassets)foradditionalinformationregardingbankloans.
31. Acquisitions and changes in holdings of subsidiaries
Changes in holdings of subsidiariesOn 22 July 2008 Dimension Data and Datacraft jointly announced that they had entered into an agreement whereby Datacraftwouldbecomeawholly-ownedsubsidiaryofDimensionData.On15October2008theDatacraftshareholdersvoted in favour of the offer by Dimension Data to purchase the remaining 44.9% interest that it did not already own. On6November2008theCourtsanctionedtheschemeandtheDatacraftsharesweredelistedon11November2008,whereafter the cash consideration was settled.
Intermsofthetransaction,whichwaseffectedbywayofaSchemeofArrangementunderSingaporelaw,shareholderswere offered $1.33 per share, a 34% premium to Datacraft’s closing share price of $0.99 on 21 July 2008. The total cost of the acquisition was $282.1 million, and was financed by cash, part of which was raised by an equity issuance. Thegoodwillontheacquisitionamountedto$183.8million.ThepremiumpaidfortheminorityshareinDatacraftAsiarepresentsthestrengtheningofDatacraft’spositionintheAsianmarketsbybringingitfullywithintheDimensionDataGroup. In addition, cost reductions and improved efficiencies will be gained through the acquisition. Following the acquisition of the minorities, a share ownership scheme was established covering 4.75% of the entity over a period of four years. This is considered to be an equity settled scheme and accordingly the share based expense at grant date amounted to $1.8 million. The acquisition of these shares has been funded by the Group. The appreciation in this equity interest will be determined by a valuation, which will be reduced by the outstanding financing.
In arriving at the value of the award, the Black Scholes optic model was applied using the following inputs:– risk free interest rate 3.9%– expected volatility 30%– dividend yield of 4.9%
Transaction costs capitalised to the cost of the investment were $4.2 million.
Other immaterial changes in holdings in subsidiaries during the year amounted to a net payment of $2.1 million.
AcquisitionsDuring theperiod, theGroupmade two small acquisitionsof subsidiaries, Teksys (100%) andBluefire (65%), for anaggregate consideration of $4.3 million, and $5.1 million for the assumption of a shareholder’s loan. This resulted in $7.6 million being recognised as goodwill on acquisition. The net assets and liabilities for these acquisitions amounted to $1.2 million and $0.6 million respectively. Teksys and Bluefire were acquired effective January 2009 and October 2008 respectively. Since the date of acquisition, Teksys and Bluefire have contributed revenue of $22.5 million and $6.8 million and loss for the period of $0.5 million and profit of $0.5 million, respectively. Had these acquisitions taken place at 1 October 2008, additional revenue of $27.8 million and profit for the period of $0.8 million would have been recognised.

106 Dimension Data Annual Report 2009
Notes to the financial statementsfor the year ended 30 September 2009 (continued)
2009 2008 $’000 $’000
31. Acquisitions and changes in holdings of subsidiaries (continued)The carrying amounts of each class of assets, liabilities and contingent liabilities relatingtotheseacquisitionsweredeterminedinaccordancewithIFRS3‘Business Combinations’.The amounts are as follows:Property,plantandequipment 1,608 2,574Other intangible assets 312 –Inventories 342 7,466Trade and other receivables 12,415 14,595Netcashandcashequivalents (7) 525Other long term liabilities (2,138) –Short term liabilities, including minorities (10,691) (25,143)Netassetvalueofacquisitions 1,841 17Purchaseconsideration 9,440 17,093Goodwillonacquisition(Note16) 7,599 17,076Net cash outflow arising on acquisitionCashconsideration 4,294 15,754Netcashandcashequivalentsacquired (7) (525) 4,287 15,229Cashconsideration 4,294 15,754Deferred consideration – 1,339Shareholder’s loan 5,146 –Purchaseconsideration 9,440 17,093
The carrying amounts of the acquired assets equate to the book values. The acquisition of Bluefire and Teksys have been accounted for on a provisional basis because the fair values assigned to the acquiree’s intangible assets can only be provisionally determined at 30 September 2009.
2009 2008 $’000 $’000
32. Operating lease arrangementsThe Group as lesseeAtthebalancesheetdate,theGrouphadoutstandingcommitmentsforfuture minimumleasepaymentsundernon-cancellableoperatingleases,whichfalldue as follows: Within one year 45,375 35,938Two to five years 87,200 68,459Subsequent to five years 21,245 14,021 153,820 118,418
The Group as lessorAtbalancesheetdate,theGrouphadcontractedwithtenantsforthefollowingminimum lease payments:Within one year 6,531 5,472Two to five years 12,968 13,171Subsequent to five years 1,353 4,274 20,852 22,917

Dimension Data Annual Report 2009 107
33. Contingent liabilitiesTheGroupissubjecttovariousclaimswhichariseintheordinarycourseofbusiness.At30September2009,contingentliabilities in respectof theGroup’ssubsidiariescompriseaggregateamountsof$84.2million (2008:$88.5million) inrespect of guarantees given to banks and other third parties, which are primarily in respect of performance guarantees for contracts.
2009 2008 $’000 $’000
34. Capital commitmentsAuthorised,contractedfor 113,725 67,751Authorisedbutnotyetcontractedfor 48,691 62,979 162,416 130,730
35. Related-party transactionsRelated parties are entities with common direct or indirect shareholders and/or directors. The principal shareholders of the Group are listed on page 125. The Group and its subsidiaries, in the ordinary course of business, enter into various sale, purchase, service and investment transactions with associates and others in which the Group has an interest. These transactions are under terms that are no more favourable than those arranged with third parties. For details on loans to associates,refertonote18.Fortheyearended30September2009,theinter-companysalesofgoodsandprovisionofservicesamountedto$280.2million(2008:$330.2million).
DetailsrelatingtoDirectors’remunerationandshareholdingsintheCompanyaredisclosedintheRemunerationReport.
36. Pension schemesIn most countries, the employing company provides either defined contribution or insured retirement plans to their employees. The relevant company, and in some cases employees, pay regular contributions to the plans. Once contributions are made, the relevant company has no liability in respect of these plans.
PensioncostsaredisclosedinNote7.
EmployeesinFrance,ItalyandKoreaareentitledtolump-sumterminationindemnitypaymentsuponleaving.Provisionshave been established in respect of these liabilities.
37. Share-based payment37(a) Dimension Data’s schemes
Dimension Data Holdings plc share option schemeThe Dimension Data Holdings plc share option scheme provides for the grant of share options to employees. Alloutstandingshareoptionsgrantedundertheschemehavevested,andexpire10yearsfromgrantdate.
NumberofoptionsonordinarysharesintheCompanyoutstandingintermsoftheoptionschemes:
2009 2008Opening balance 84,669,225 94,040,491Exercisedandpaid (4,301,488) (6,738,601)Lapsed (19,079,781) (2,632,665)Closingbalance 61,287,956 84,669,225
TotalweightedaveragepriceforoptionsexercisedandpaidwasR3.84and£0.29.
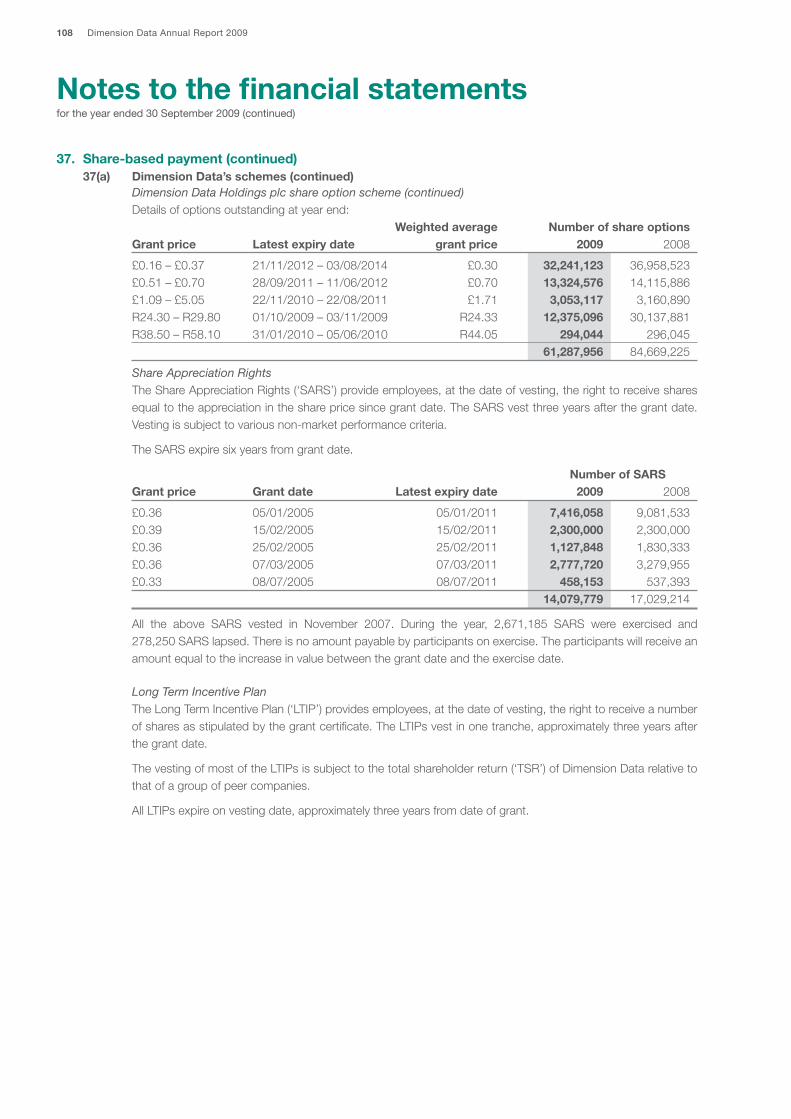
108 Dimension Data Annual Report 2009
Notes to the financial statementsfor the year ended 30 September 2009 (continued)
37. Share-based payment (continued)37(a) Dimension Data’s schemes (continued)
Dimension Data Holdings plc share option scheme (continued)Details of options outstanding at year end: Weighted average Number of share optionsGrant price Latest expiry date grant price 2009 2008
£0.16–£0.37 21/11/2012–03/08/2014 £0.30 32,241,123 36,958,523£0.51–£0.70 28/09/2011–11/06/2012 £0.70 13,324,576 14,115,886 £1.09–£5.05 22/11/2010–22/08/2011 £1.71 3,053,117 3,160,890 R24.30 – R29.80 01/10/2009 – 03/11/2009 R24.33 12,375,096 30,137,881 R38.50 – R58.10 31/01/2010 – 05/06/2010 R44.05 294,044 296,045 61,287,956 84,669,225
Share Appreciation RightsTheShareAppreciationRights(‘SARS’)provideemployees,atthedateofvesting,therighttoreceivesharesequaltotheappreciationinthesharepricesincegrantdate.TheSARSvestthreeyearsafterthegrantdate.Vestingissubjecttovariousnon-marketperformancecriteria.
TheSARSexpiresixyearsfromgrantdate.
Number of SARSGrant price Grant date Latest expiry date 2009 2008
£0.36 05/01/2005 05/01/2011 7,416,058 9,081,533£0.39 15/02/2005 15/02/2011 2,300,000 2,300,000£0.36 25/02/2005 25/02/2011 1,127,848 1,830,333£0.36 07/03/2005 07/03/2011 2,777,720 3,279,955£0.33 08/07/2005 08/07/2011 458,153 537,393 14,079,779 17,029,214
All the above SARS vested in November 2007. During the year, 2,671,185 SARS were exercised and 278,250SARSlapsed.Thereisnoamountpayablebyparticipantsonexercise.Theparticipantswillreceiveanamount equal to the increase in value between the grant date and the exercise date.
Long Term Incentive PlanTheLongTermIncentivePlan(‘LTIP’)providesemployees,atthedateofvesting,therighttoreceiveanumberofsharesasstipulatedbythegrantcertificate.TheLTIPsvestinonetranche,approximatelythreeyearsafterthe grant date.
ThevestingofmostoftheLTIPsissubjecttothetotalshareholderreturn(‘TSR’)ofDimensionDatarelativetothat of a group of peer companies.
AllLTIPsexpireonvestingdate,approximatelythreeyearsfromdateofgrant.

Dimension Data Annual Report 2009 109
37. Share-based payment (continued)37(a) Dimension Data’s schemes (continued)
Long Term Incentive Plan (continued) Approximate Number of LTIPsGrant price Grant date vesting date 2009 2008
£0.36 22/11/2005 December2008 – 43,901,449£0.46 08/03/2006 December2008 – 435,000£0.37 20/06/2006 December2008 – 1,444,391£0.39 21/11/2006 December2009 40,225,902 43,040,498£0.60 18/12/2007 December2010 3,786,518 3,786,518£0.46 18/01/2008 December2010 25,357,111 27,174,075£0.32 14/11/2008 November2011 42,820,000 –£0.36 03/12/2008 December2011 6,890,000 – 119,079,531 119,781,931
There is no amount payable on vesting. The participants will be awarded rights to ordinary shares in the Company.
Valuation methodsThefairvalueofthegrantsintermsoftheDimensionDataHoldingsplcshareoptionscheme(post2000)andSARSisestimatedusinganactuarialbinomialoptionpricingmodel.
FortheLTIPvaluation,theMonteCarloSimulationprocessisusedtomodelpossibleoutcomeswithstochasticproperties.Anexampleofsuchaprocessisthemovementinshareprices.Sharepriceshaveanunderlyingdistribution, which can be estimated and used to calculate likely distribution of future share prices. Taking into accounttheexpectedgrowthinshareprice,assumingalog-normaldistribution,themodelprojectsthefutureshare prices.
Inputs into the modelThefollowinginputswereusedtovaluetheoptions,SARSandLTIPsgrants:
Weighted average Exercise Expected Expected Risk-freeFinancial share price at option Expected dividend interest years ended price grant date lifetime volatility yield rate 30 September years % % %Share Option Scheme (Post2000)2003–JSE R3.94 R3.71 7 59.2–62.4 –10.06–11.12Share Option Scheme (Post2000)2003–LSE £0.26 £0.25 7 59.2–63.7 – 3.80–4.56Share Option Scheme (Post2000)2004–JSE R4.03 R4.03 7 63.7 – 9.69Share Option Scheme (Post2000)2004–LSE £0.34 £0.33 7 63.3–64.3 – 4.91–5.18SARS2005 £0.37 £0.37 4 70.1–70.5 – 4.49–4.81LTIPs2007 £0.39 3 43.26 – 4.79LTIPs2008 £0.48 338.95–40.51 0.88 4.65–4.29LTIPs2009 £0.34 348.33–49.10 3.00 2.53–2.81
NochangesinassumptionsweremadetotheShareOptionScheme(Post2000)subsequentto2004.
The expected option lifetimewas arrived at based onmanagement’s best estimate for the effects of non-transferability,exerciserestrictionsandexercisebehaviourconsiderations.TheestimatedattritionrateforSARSandLTIPswasbetween0%to12%(2008:0%to8%).
The expected volatility was determined based on the rolling historical volatility over the expected option lifetime that prevailed at the grant date.

110 Dimension Data Annual Report 2009
Notes to the financial statementsfor the year ended 30 September 2009 (continued)
37. Share-based payment (continued)37(a) Dimension Data’s schemes (continued)
Inputs into the model (continued)Therisk-freeinterestrateusedistheyieldonthezero-couponSouthAfricangovernmentbondsandaUKgiltstrip of a term consistent with the expected option lifetime.
37(b) Datacraft Asia’s (‘Datacraft’) schemesAsdisclosedinNote31,DimensionDataacquiredtheoutstandingsharesinDatacraft.Intermsoftheagreementamendments were made to the Datacraft Share Option Schemes as follows:– In-the-moneyvestedoptions:DimensionDatapaidacashamountofthedifferencebetweentheconsideration
payable and the exercise price.– Out-of-the-moneyvestedoptions:HolderswillreceiveDimensionDatashares,basedonaformuladerived
from the consideration payable and the Dimension Data share price on the effective date. This will occur whentheoptionsareexercised,whichwillonlybeoncetheyarein-the-money.
– Unvested options: On vesting, holders will receive Dimension Data shares, based on a formula derived from the consideration payable and the Dimension Data share price on the effective date.
– Awards under the Datacraft Performance Share Plan: On vesting, holders will receive Dimension Datashares, based on a formula derived from the consideration payable and the Dimension Data share price on the effective date.
Consequentlythenumberofshareoptionsoutstandingandtheweightedaverageexercisepriceshavebeenadjusted to reflect the equivalent number of Dimension Data options and the Dimension Data weighted average exercise prices.
Nocomparativeshavebeenpresentedastheyarenolongerrelevant.
The incremental fair value granted in respect of the conversion of Datacraft existing schemes was actuarially valued at $225,000.
Datacraft option schemes
DatacraftAsiahastwoshareoptionschemes,namelythePreviousSchemeandtheScheme2003.ThePreviousSchemewasadoptedin1996.Duringthefinancialyearended30September2003,thePreviousSchemewasterminated and replaced by the Scheme 2003.
NumberofoptionsonordinarysharesintheCompanyoutstandingintermsofthePreviousScheme: 2009
Opening balance after buy out 14,201,707 Exercisedandpaid (1,934,994)Lapsed (2,879,338)
Outstanding at end of the year 9,387,375
Exercisableatendoftheyear 9,387,375
DetailsofPreviousSchemeoptionsoutstandingatyearend:
Grant price Latest expiry date Number of options
£0.52 25/01/2012 6,628,232 £0.98 29/06/2011 1,778,886 £0.94 12/04/2011 283,126 £1.40–£1.92 10/04/2010–13/02/2011 697,131
9,387,375
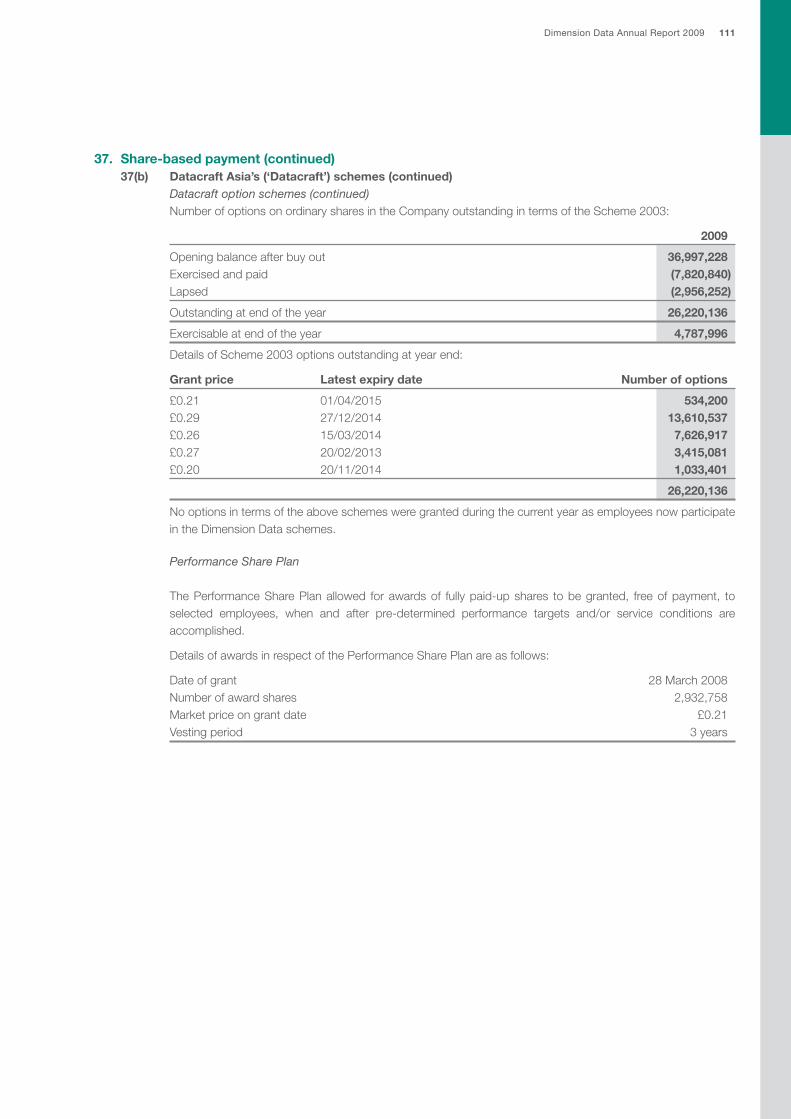
Dimension Data Annual Report 2009 111
37. Share-based payment (continued)37(b) Datacraft Asia’s (‘Datacraft’) schemes (continued) Datacraft option schemes (continued)
NumberofoptionsonordinarysharesintheCompanyoutstandingintermsoftheScheme2003:
2009
Opening balance after buy out 36,997,228 Exercisedandpaid (7,820,840)Lapsed (2,956,252)
Outstanding at end of the year 26,220,136
Exercisableatendoftheyear 4,787,996
Details of Scheme 2003 options outstanding at year end:
Grant price Latest expiry date Number of options
£0.21 01/04/2015 534,200 £0.29 27/12/2014 13,610,537 £0.26 15/03/2014 7,626,917 £0.27 20/02/2013 3,415,081 £0.20 20/11/2014 1,033,401
26,220,136
Nooptionsintermsoftheaboveschemesweregrantedduringthecurrentyearasemployeesnowparticipatein the Dimension Data schemes.
Performance Share Plan
ThePerformanceSharePlanallowed forawardsof fullypaid-upshares tobegranted, freeofpayment, toselected employees, when and after pre-determined performance targets and/or service conditions areaccomplished.
DetailsofawardsinrespectofthePerformanceSharePlanareasfollows:
Dateofgrant 28March2008Numberofawardshares 2,932,758Marketpriceongrantdate £0.21Vesting period 3 years

112 Dimension Data Annual Report 2009
Notes to the financial statementsfor the year ended 30 September 2009 (continued)
38. Financial instruments38.1 Financial assets
The Group has various financial assets including investments, loans, trade and other receivables and cash.
2009 2008 Non- Non- Financial financial Financial financial instruments instruments instruments instruments Category $’000 $’000 $’000 $’000
Investments held Fair value through for trading 1,730 – 1,763 – profit and lossAvailablefor sale investments 2,403 – 1,839 – AvailableforsaleLoanstoassociates 37,398 – 36,446 – LoansandreceivablesTrade and other receivables 706,283 326,926 808,571 239,607 LoansandreceivablesFinance lease receivables 11,483 – 12,667 – Held to maturityLoansreceivable 588 – 1,302 – LoansandreceivablesDerivative financial Fair value through instruments 108 – 12,173 – profit and lossCashandcash equivalents 601,129 – 686,499 – Loansandreceivables
Total 1,361,122 326,926 1,561,260 239,607
The Group considers these financial assets to approximate their fair value, and to encompass the Group’s maximum exposure to credit risk.
38.2 Financial liabilitiesThe Group’s principal financial liabilities comprise trade and other payables, finance leases, and bank loans and overdrafts. 2009 2008 Non- Non- Financial financial Financial financial instruments instruments instruments instruments Category $’000 $’000 $’000 $’000
Trade and other payables 808,707 463,597 909,787 286,039 AmortisedcostFinance lease obligations 23,191 – 146,184 – AmortisedcostDerivative financial Fair value through instruments 12,755 – 10,269 – profit and lossBank overdrafts and loans 165,187 – 10,243 – AmortisedcostOther long term liabilities 26,677 18,894 14,517 24,057 Amortisedcost
Total 1,036,517 482,491 1,091,000 310,096
WiththeexceptionoftheCampuspropertyloan,thecarryingamountsofallfinancialliabilitiesapproximatetheirfairvalues.ThecarryingamountoftheCampuspropertyloanis$139.4million(2008:$123.9million)whilstitsfairvalueis$183.9million(2008:$162.7million).
Net losses on financial instruments relating to ‘fair value through profit and loss’ amounted to $9.4million (2008:gains$3.8million).
Financial liabilities by geography Middle East & Central$’000 Americas Asia Australia Europe Africa & other Total
Trade and other payables 142,752 87,774 138,770 191,009 218,396 30,006 808,707Finance lease obligations – – 6,479 5,494 11,121 97 23,191Derivative financial instruments – 595 667 1,245 6,566 3,682 12,755Bank overdrafts and loans – 20,000 – – 2,094 143,093 165,187Other long term liabilities – – – 4,875 10,532 11,270 26,677
Total 142,752 108,369 145,916 202,623 248,709 188,148 1,036,517

Dimension Data Annual Report 2009 113
38. Financial instruments (continued)38.3 Risk management of financial instruments
The Board has approved and monitored the risk management processes, including treasury policies, counterparty limits and reporting structures in relation to the management of financial instruments risk.
The principal risks arising from the Group’s financial instruments are liquidity risk, credit risk and market risk, which include currency and interest rate risk.
These risks, and the way they are managed, are detailed below.
38.3.1 Liquidity riskLiquidityriskistheriskthattheGroupwillbeunabletomeetitsobligationsassociatedwithfinancialliabilities.LiquidityriskmanagementwithintheGroupfocusesonworkingcapitalmetrics,cashbalancesandcashflowplanning, coupled with liquidity support arrangements including access to on-demand funding. IndividualentitieswithintheGroupultimatelysourcetheirliquidityrequirementsfromtheGroup’sCentraltreasury.
Cashflowsprofileofmaturityrelatingtofinancialliabilities:
Bank Trade and Other overdrafts Finance Derivative other long term and loans leases liabilities payables liabilities Total $’000 $’000 $’000 $’000 $’000 $’000
2009Within one year 44,929 10,117 12,755 808,707 – 876,508Within two to five years 159,221 14,874 – – 27,130 201,225Morethanfiveyears 110,856 – – – – 110,856
315,006 24,991 12,755 808,707 27,130 1,188,589
2008Within one year 6,835 25,262 10,269 909,787 – 952,153Within two to five years 3,351 113,200 – – 15,416 131,967Morethanfiveyears 2,652 164,826 – – – 167,478
12,838 303,288 10,269 909,787 15,416 1,251,598
The Group considers its liquid resources to be adequate to meet its financial liabilities now and for the foreseeable future.
Cession of assetsTheGrouphascededtheCampuspropertywithabookvalueof$50.0millioninproperty,plantandequipmentand$95.9millionininvestmentpropertyassecurityforthebankloan(refertoNote30).
In the US, in respect of an extended credit facility, the Group has ceded an amount of $69.7 million (2008:$122.7million)oftradereceivablesand$9.1million(2008:$7.7million)ofinventory.Thefacilityissubjectto various covenants relating to working capital and liquidity ratios.
In Botswana, in respect of overdraft limits, the Group has ceded various fixed deposits and bank balances totalling $0.4 million.
TheGrouphadundrawnborrowingfacilitiesat30September2009of$123.3million(2008:$134.7million).
38.3.2 Credit riskThe Group’s financial assets are investments, loans, trade and other receivables, finance lease receivables, derivatives and cash and cash equivalents.
Creditriskreferstotheriskthatacounterpartywilldefaultonitsobligationsinrespectoftheseinstrumentstothe Group.
With regard to trade receivables and finance lease receivables, Group policy is only to deal with counterparties with an appropriate credit rating. Furthermore, credit risk relating to trade receivables is considered lower than average due to the nature of our clients, mostly being large blue chip corporates and government organisations. Ourclientsarealsospreadacrossdiverse industriesandgeographicalareas.Appropriatecreditchecksareundertaken on potential customers before sales commence.
67%ofloanstoassociatesrepresentsbalancesduebyBritehouseHoldings(Pty)Limited.
The credit crisis which has affected the global economy, has increased the generic risk associated with trade receivables. The Group has reviewed the trade receivables outstanding, net of impairment provisions, and consider these to be collectible and fairly stated at period end.
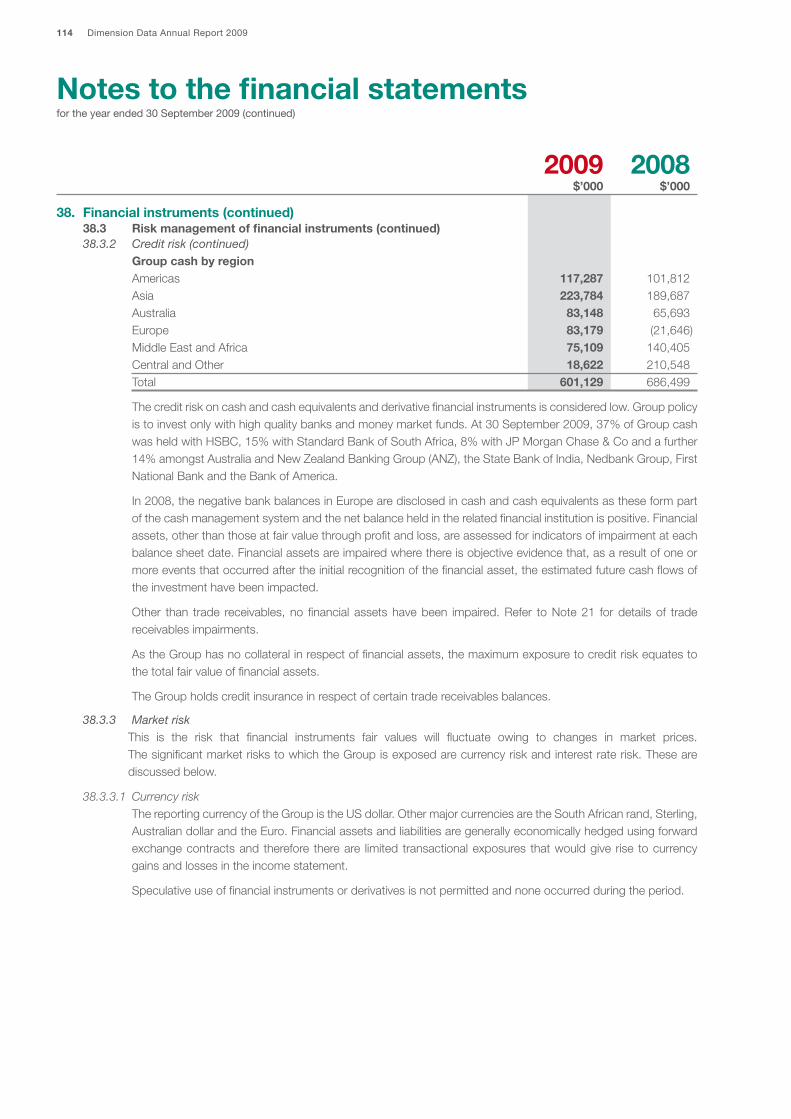
114 Dimension Data Annual Report 2009
Notes to the financial statementsfor the year ended 30 September 2009 (continued)
2009 2008 $’000 $’000
38. Financial instruments (continued)38.3 Risk management of financial instruments (continued)38.3.2 Credit risk (continued)
Group cash by regionAmericas 117,287 101,812 Asia 223,784 189,687 Australia 83,148 65,693 Europe 83,179 (21,646)MiddleEastandAfrica 75,109 140,405 CentralandOther 18,622 210,548 Total 601,129 686,499
The credit risk on cash and cash equivalents and derivative financial instruments is considered low. Group policy istoinvestonlywithhighqualitybanksandmoneymarketfunds.At30September2009,37%ofGroupcashwasheldwithHSBC,15%withStandardBankofSouthAfrica,8%withJPMorganChase&Coandafurther14%amongstAustraliaandNewZealandBankingGroup(ANZ),theStateBankofIndia,NedbankGroup,FirstNationalBankandtheBankofAmerica.
In2008,thenegativebankbalancesinEuropearedisclosedincashandcashequivalentsastheseformpartof the cash management system and the net balance held in the related financial institution is positive. Financial assets, other than those at fair value through profit and loss, are assessed for indicators of impairment at each balance sheet date. Financial assets are impaired where there is objective evidence that, as a result of one or more events that occurred after the initial recognition of the financial asset, the estimated future cash flows of the investment have been impacted.
Other than trade receivables, no financial assetshavebeen impaired.Refer toNote21 fordetailsof tradereceivables impairments.
AstheGrouphasnocollateralinrespectoffinancialassets,themaximumexposuretocreditriskequatestothe total fair value of financial assets.
The Group holds credit insurance in respect of certain trade receivables balances.
38.3.3 Market riskThis is the risk that financial instruments fair values will fluctuate owing to changes in market prices. The significant market risks to which the Group is exposed are currency risk and interest rate risk. These are discussed below.
38.3.3.1 Currency riskThereportingcurrencyoftheGroupistheUSdollar.OthermajorcurrenciesaretheSouthAfricanrand,Sterling,AustraliandollarandtheEuro.Financialassetsandliabilitiesaregenerallyeconomicallyhedgedusingforwardexchange contracts and therefore there are limited transactional exposures that would give rise to currency gains and losses in the income statement.
Speculative use of financial instruments or derivatives is not permitted and none occurred during the period.

Dimension Data Annual Report 2009 115
2009 2008 Financial Financial Financial Financial assets liabilities assets liabilities $’000 $’000 $’000 $’000
38. Financial instruments (continued)38.3 Risk management of financial instruments (continued)38.3.3 Market risk (continued)38.3.3.1 Currency risk (continued)
The currency profile of the Group’s financial instruments was as follows:Australiandollars 185,679 113,918 165,362 151,855Euro 179,048 72,407 168,327 106,650Sterling 64,278 46,602 61,272 49,130US dollars 430,860 418,828 685,703 403,624SArand 250,798 290,211 283,424 263,845Other 250,459 94,551 197,172 115,896 1,361,122 1,036,517 1,561,260 1,091,000
At the balance sheet date, the total fair value of open forward foreign exchange contracts (FECs)wasas below:
2009 2008 $’000 $’000
Assets 108 12,173Liabilities (12,755) (10,269) (12,647) 1,904
Forward exchange contracts are measured using quoted forward exchange rates and yield curves derived from quoted interest matching maturity contracts.
In certain operations, hedges of firm commitments to purchase services are designated as cash flow hedges. Lossesandgainson these forwardexchangecontracts that aredesignatedaseffectivecash flowhedgesamounting to lossof$5.4million (2008:gain$0.3million)havebeendeferred inequity.$2.9million (2008:nil)wasremovedfromequityandincludedintheinitialcarryingvalueofnon-financialassetsduringtheyear.$0.3million(2008:$0.7million)hasbeenrecognisedintheincomestatementfortheineffectiveportionofthesecash flow hedges.
The Group has a number of loans between its subsidiaries. Where settlement is neither planned nor likely to occur in the foreseeable future these loans are part of the Group’s net investment in those subsidiaries and the exchange differences arising on those loans are included in translation differences in the statement of changes in equity. When these loans are settled, or the underlying operation disposed of, translation differences previously includedinequityareincludedintheincomestatement.Duringtheyearnoamounts(2008:$1.8million)wererecycled through the income statement.
38.3.3.2 Interest rate riskInterest rate risk is the risk that the fair value of future cash flows of a financial instrument will fluctuate because ofchanges inmarket interest rates.Other than theCampus leaseobligation, theGroup isnotexposed tosignificant fixed rate financial assets or liabilities. The Group does not make use of interest rate derivatives.
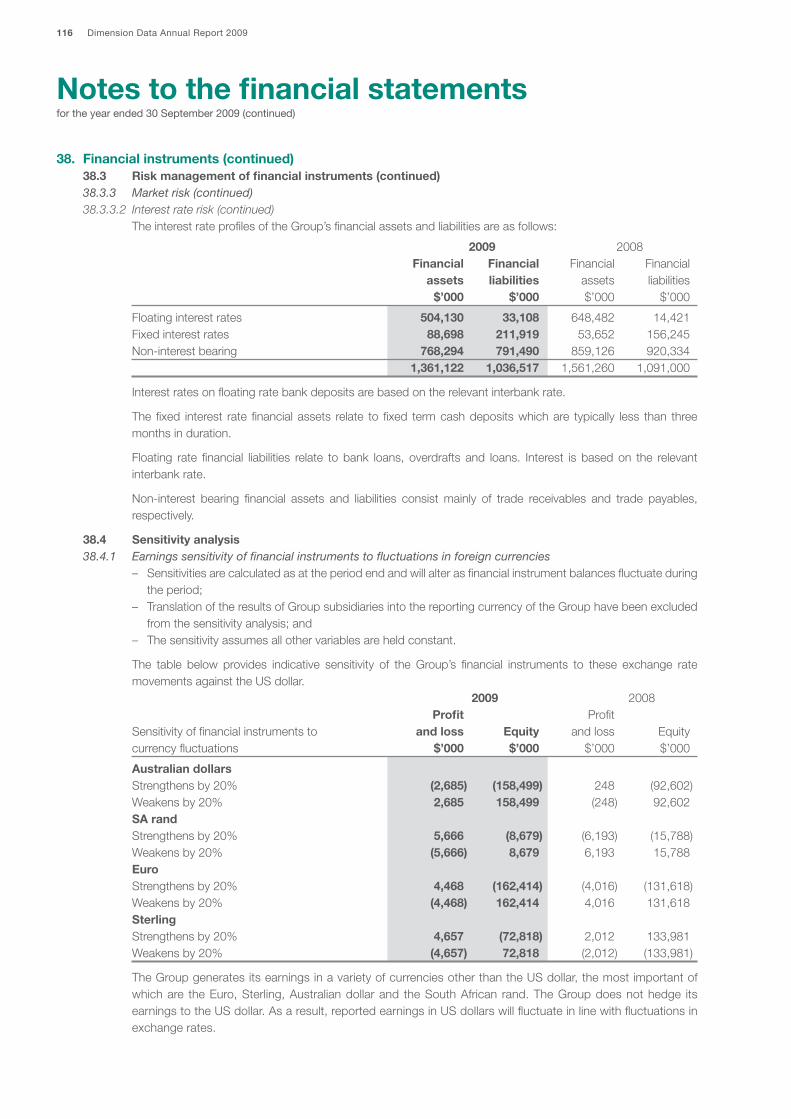
116 Dimension Data Annual Report 2009
Notes to the financial statementsfor the year ended 30 September 2009 (continued)
38. Financial instruments (continued)38.3 Risk management of financial instruments (continued)38.3.3 Market risk (continued)38.3.3.2 Interest rate risk (continued)
The interest rate profiles of the Group’s financial assets and liabilities are as follows:
2009 2008 Financial Financial Financial Financial assets liabilities assets liabilities $’000 $’000 $’000 $’000
Floating interest rates 504,130 33,108 648,482 14,421Fixed interest rates 88,698 211,919 53,652 156,245Non-interestbearing 768,294 791,490 859,126 920,334 1,361,122 1,036,517 1,561,260 1,091,000
Interest rates on floating rate bank deposits are based on the relevant interbank rate.
The fixed interest rate financial assets relate to fixed term cash deposits which are typically less than three months in duration.
Floating rate financial liabilities relate to bank loans, overdrafts and loans. Interest is based on the relevant interbank rate.
Non-interest bearing financial assets and liabilities consistmainly of trade receivables and trade payables,respectively.
38.4 Sensitivity analysis38.4.1 Earnings sensitivity of financial instruments to fluctuations in foreign currencies – Sensitivities are calculated as at the period end and will alter as financial instrument balances fluctuate during
the period; – Translation of the results of Group subsidiaries into the reporting currency of the Group have been excluded
from the sensitivity analysis; and – The sensitivity assumes all other variables are held constant.
The table below provides indicative sensitivity of the Group’s financial instruments to these exchange rate movements against the US dollar. 2009 2008 Profit ProfitSensitivity of financial instruments to and loss Equity andloss Equitycurrency fluctuations $’000 $’000 $’000 $’000
Australian dollarsStrengthens by 20% (2,685) (158,499) 248 (92,602)Weakens by 20% 2,685 158,499 (248) 92,602SA randStrengthens by 20% 5,666 (8,679) (6,193) (15,788)Weakens by 20% (5,666) 8,679 6,193 15,788 EuroStrengthens by 20% 4,468 (162,414) (4,016) (131,618)Weakens by 20% (4,468) 162,414 4,016 131,618 SterlingStrengthens by 20% 4,657 (72,818) 2,012 133,981 Weakens by 20% (4,657) 72,818 (2,012) (133,981)
The Group generates its earnings in a variety of currencies other than the US dollar, the most important of whichare theEuro,Sterling,Australiandollarand theSouthAfrican rand.TheGroupdoesnothedge itsearningstotheUSdollar.Asaresult,reportedearningsinUSdollarswillfluctuateinlinewithfluctuationsinexchange rates.

Dimension Data Annual Report 2009 117
38. Financial instruments (continued)38.4 Sensitivity analysis (continued)38.4.2 Earnings sensitivity of financial instruments to changes in interest rates
A100basispointincreasehasbeenusedinthesensitivitypresented.Thisrepresentsmanagement’sassessmentof a reasonably possible change.
Profit and loss Equity 2009 2008 2009 2008Interest rate sensitivity $’000 $’000 $’000 $’000
100 basis point increase in interest rates 4,710 5,193 – –100 basis point decrease in interest rates (4,710) (5,193) – –
38.5 Capital risk managementThe Group manages its capital to ensure that entities in the Group will be able to continue as going concerns while maximising the return to shareholders through the optimisation of the debt and equity balance.
The capital structure of the Group consists of cash and cash equivalents, debt, which includes the borrowings disclosedinNotes25,26and30andequityattributabletoequityholdersoftheparent,comprisingissuedcapital,reservesandretainedearningsasdisclosedintheStatementofChangesinEquity,andNotes23and24.
39. DividendAfinaldividendof1.7centspersharewaspaidon13March2009.
Theproposeddividendof1.9centspershare issubject toapprovalbyshareholdersat theAnnualGeneralMeetingandhasnotbeenincludedasaliabilityinthesefinancialstatements.IntermsofthedefinitionofadividendforSAtaxpurposes,theremaybeSecondaryTaxonCompaniespayableonpaymentofthedividend,amountingtoamaximumof 10%.
40. Post balance sheet events
Black Economic Empowerment (‘BEE’) transactionInSeptember2004,DimensionDataHoldingsplcfinalisedanequityshareholdingtransactionwithaBEEconsortium,which would result in the BEE consortium receiving a 25.01% interest in Dimension Data Middle East and Africa (Pty)Limited(‘DDMEA’),overaperiodoffiveandahalftosevenyears.Theinterestwouldvestbasedontheresultsofthe DDMEAbusiness.ThetransactionalsoincorporatedaTransformationCharterwhichdetailedcertainBEEobjectivesasoutlined in the announcement on 1 September 2004.
Between1October2009and30September2011,theConsortiumhastheoptiontosell(subjecttotheachievementofcertaininternaltransformationobjectives–asyetnotachieved),andtheGrouphastheoptiontoacquire,anyofitssharesinDDMEAatfairvalue(asdeterminedbyanindependentvaluer).TheGroupwouldbeentitledtosettlethepurchasepricein either cash or Dimension Data Holdings plc shares.
IfneitheroptionisexercisedthentheConsortiumwillcontinuetovestsharesinDDMEA(subjecttoperformancetargets)until30September2011whereaftertheConsortiumwillhavetheoption,subjecttotheGroup’spre-emptiveright,toselltheir shares subject to the Group’s approval of the purchaser.

118 Dimension Data Annual Report 2009
Company balance sheet for Dimension Data Holdings plcas at 30 September 2009 Restated
2009 2008 Notes $’000 $’000
AssetsNon-current assetsProperty,plantandequipment (a) 75 24Investmentinsubsidiaries (b) 836,553 567,526 836,628 567,550Current assetsTradeandotherreceivables (c) 24 6,018Cashandcashequivalents 50,024 152,978 50,048 158,996Total assets 886,676 726,546
Equity and liabilities Capital and reservesShare capital 23 17,063 17,020Share premium 327,652 325,655Capitalreserves 74,980 57,574Retained earnings 286,715 312,401Total equity 706,410 712,650Current liabilitiesPayables (d) 5,981 13,896Bankoverdraft (g) 174,285 – 180,266 13,896Total equity and liabilities 886,676 726,546
ThefinancialstatementswereapprovedbytheBoardofDirectorson17November2009.
Brett Dawson Dave SherriffsChief Executive Officer Chief Financial Officer

Dimension Data Annual Report 2009 119
Company cash flow statement for Dimension Data Holdings plcfor the year ended 30 September 2009 Restated
2009 2008 $’000 $’000
Operating activitiesOperating loss (28,911) (44,750)Adjustmentsfor:Depreciation of property, plant and equipment 13 4Othernon-cashitems–valuationofopenFECcontracts 26,338 47,543Cash(used)/generatedbeforeworkingcapitalmovements (2,560) 2,797Decrease in trade and other receivables 5,994 943Decrease in payables (5,855) (3,022)Movementoninter-companyloanaccounts 68,938 (53,426)Cashgeneratedfrom/(usedin)operations 66,517 (52,708)Income taxes paid (3,685) (1,888)Interest paid (4,607) (17,622)Net cash from/(used in) operating activities 58,225 (72,218)Investing activitiesInterest received 6,584 20,641Acquisitionofsubsidiary (117,064) (1,077)Changesinholdings (256,374) –Proceedsonchangesinholdingofasubsidiary 23,924 –Acquisitionofproperty,plantandequipment (64) –Dividends received 28,719 108,367Net cash (used in)/from investing activities (314,275) 127,931Financing activitiesProceedsonissueofnewsharesnetofexpenses 2,040 121,034Dividends paid (23,229) (12,557)Net cash (used in)/from financing activities (21,189) 108,477Net movement in cash and cash equivalents (277,239) 164,190Cashandcashequivalentsatbeginningofyear 152,978 (11,212)Cash and cash equivalents at end of year (124,261) 152,978Madeupasfollows:Cashandcashequivalents 50,024 152,978Bank overdrafts (174,285) – (124,261) 152,978

120 Dimension Data Annual Report 2009
Company statement of changes in equity forDimension Data Holdings plcfor the year ended 30 September 2009
Share Share Capital Retained Total capital premium reserves earnings equity $’000 $’000 $’000 $’000 $’000
1 October 2007 – restated 15,591 206,050 42,353 247,735 511,729Profitfortheyear–restated – – – 77,223 77,223Itemsrecogniseddirectlyintoequity 1,429 119,605 15,221 (12,557) 123,698
Share incentive schemes – – 15,221 – 15,221Shares issued 1,429 119,605 – – 121,034Dividendspaid – – – (12,557) (12,557)
1 October 2008 – restated 17,020 325,655 57,574 312,401 712,650Lossfortheyear – – – (2,457) (2,457)Itemsrecogniseddirectlyintoequity 43 1,997 17,406 (23,229) (3,783)
Share incentive schemes – – 17,406 – 17,406Shares issued 43 1,997 – – 2,040Dividendspaid – – – (23,229) (23,229)
30 September 2009 17,063 327,652 74,980 286,715 706,410
Theconsolidatedsharecapitalandsharepremiumhavebeenadjustedby$105,000(2008:$345,000)and$7.7million(2008:$37.5million)respectively,forsharesheldbyTheEmployeeShareTrust.
Dividends paid relate mainly to shareholders on the United Kingdom principal register excluding dividends waived by TheEmployeeShareTrust.AportionofthedividendspaidtoshareholdersontheSouthAfricanregisteraredistributedbyaSouthAfricansubsidiaryinaccordancewiththetermsoftheDividendAccessShareTrust.

Dimension Data Annual Report 2009 121
Notes to Company balance sheet for Dimension Data Holdings plcas at 30 September 2009
(a) Property, plant and equipment Office Computer furniture equipment and fittings Total $’000 $’000 $’000CostAt1October2008 - 46 46Additions 43 21 64
At 30 September 2009 43 67 110
Accumulated depreciationAt1October2008 - 22 22Depreciation charge for the year 8 5 13
At 30 September 2009 8 27 35
Net book value30 September 2009 35 40 7530 September 2008 – 24 24
2009 2008 $’000 $’000
(b) Investment in subsidiariesShares in subsidiaries 1,483,460 1,082,585Amountsduetosubsidiaryundertakings (646,907) (515,059) 836,553 567,526Analysisofmovementinsharesinsubsidiaries:Balance at beginning of year 1,082,585 675,127Netacquisitionsandrecapitalisationofsubsidiaries 153,187 392,237Changesinholdingofsubsidiary 230,282 –Share incentive costs 17,406 15,221 1,483,460 1,082,585
Investments in subsidiaries represents the investments in SpectrumHoldings Inc, Dimension DataMiddle East andAfrica (Pty) Limited, Dimension Data Network Services Limited, Dimension Data Global Management Services (Pty)Limited,DimensionData(SouthAfrica)Holdings(Pty)Limited,DimensionDataAustraliaPtyLimited,DatacraftAsiaLimitedandthepreferencesharesinDimensionDataCommerceCentreLimitedandDimensionData(Jersey)Limited.Details of the principal subsidiaries appear on page 124.
2009 2008 $’000 $’000
(c) Trade and other receivablesPrepaymentsandotherreceivables 24 102Financial instruments – derivatives – 5,916
24 6,018
(d) PayablesAccrualsandtaxationauthoritiespayable 2,315 3,865Derivative financial instruments 3,666 10,031 5,981 13,896
(e) Loss for the yearAspermittedbysection408of theCompaniesAct2006, theCompanyhaselectednot topresent itsown incomestatementfortheyear.TheCompanyreportedalossfortheyearof$2.5million(2008:profit$77.2million).
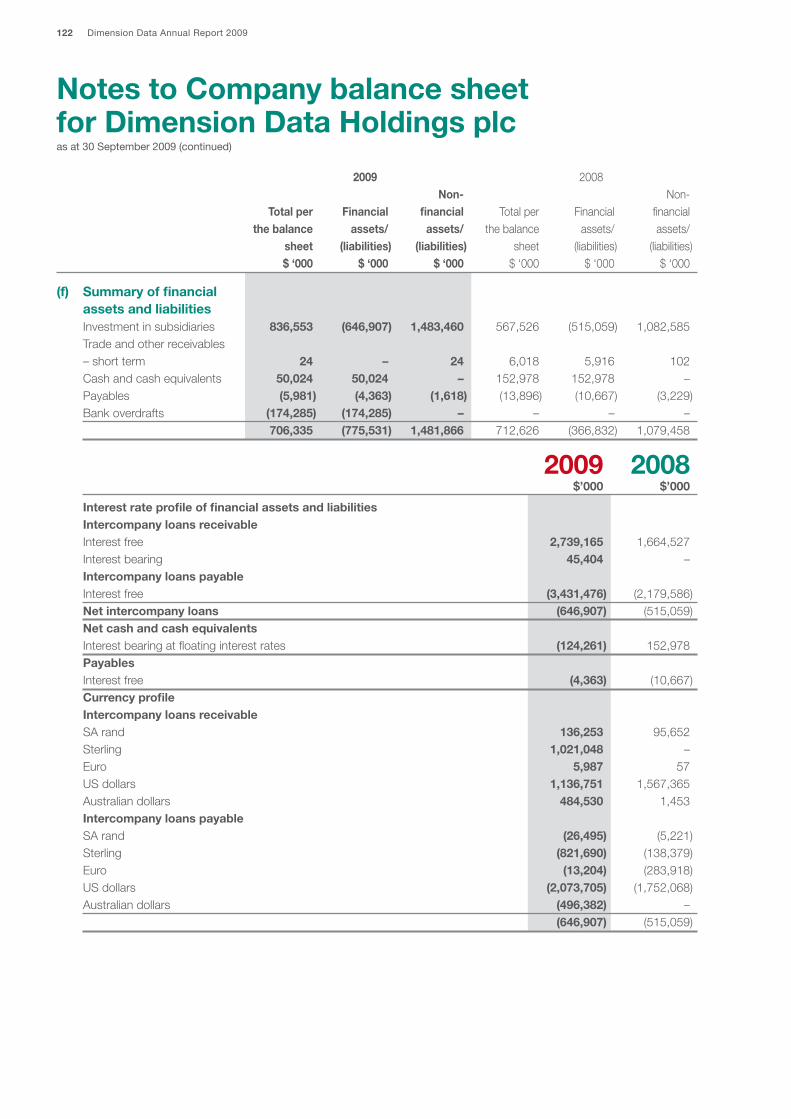
122 Dimension Data Annual Report 2009
Notes to Company balance sheet for Dimension Data Holdings plcas at 30 September 2009 (continued)
2009 2008 Non- Non- Total per Financial financial Total per Financial financial the balance assets/ assets/ the balance assets/ assets/ sheet (liabilities) (liabilities) sheet (liabilities) (liabilities) $ ‘000 $ ‘000 $ ‘000 $‘000 $‘000 $‘000
(f) Summary of financial assets and liabilities
Investment in subsidiaries 836,553 (646,907) 1,483,460 567,526 (515,059) 1,082,585Trade and other receivables – short term 24 – 24 6,018 5,916 102 Cashandcashequivalents 50,024 50,024 – 152,978 152,978 – Payables (5,981) (4,363) (1,618) (13,896) (10,667) (3,229)Bank overdrafts (174,285) (174,285) – – – – 706,335 (775,531) 1,481,866 712,626 (366,832) 1,079,458
2009 2008 $’000 $’000
Interest rate profile of financial assets and liabilitiesIntercompany loans receivableInterest free 2,739,165 1,664,527 Interest bearing 45,404 – Intercompany loans payable Interest free (3,431,476) (2,179,586)Net intercompany loans (646,907) (515,059)Net cash and cash equivalentsInterest bearing at floating interest rates (124,261) 152,978 PayablesInterest free (4,363) (10,667)Currency profileIntercompany loans receivableSArand 136,253 95,652 Sterling 1,021,048 – Euro 5,987 57 US dollars 1,136,751 1,567,365 Australiandollars 484,530 1,453 Intercompany loans payableSArand (26,495) (5,221)Sterling (821,690) (138,379)Euro (13,204) (283,918)US dollars (2,073,705) (1,752,068)Australiandollars (496,382) – (646,907) (515,059)

Dimension Data Annual Report 2009 123
2009 2008 $’000 $’000
(f) Summary of financial assets and liabilities (continued)Trade and other receivables long and short termUS dollars – 5,916 Net cash and cash equivalentsPredominantlyUSdollars (124,261) 152,978 PayablesUS dollars (4,363) (10,667)
Increase/ Increase/ (decrease) (decrease) in equity in equity 2009 2008Sensitivity of financial instruments to $’000 $’000
USdollarsweakensby20%againstSArand 21,952 18,086 USdollarsstrengthensby20%againstSArand (21,952) (18,086)US dollars weakens by 20% against Sterling 39,872 (27,673)US dollars strengthens by 20% against Sterling (39,872) 27,673 USdollarsweakensby20%againstEuro (1,443) (56,772)USdollarsstrengthensby20%againstEuro 1,443 56,772
(g) Bank overdraftsBankoverdraftsof$174.3million(2008:nil)areincludedintheHSBCcashmanagementsystem.
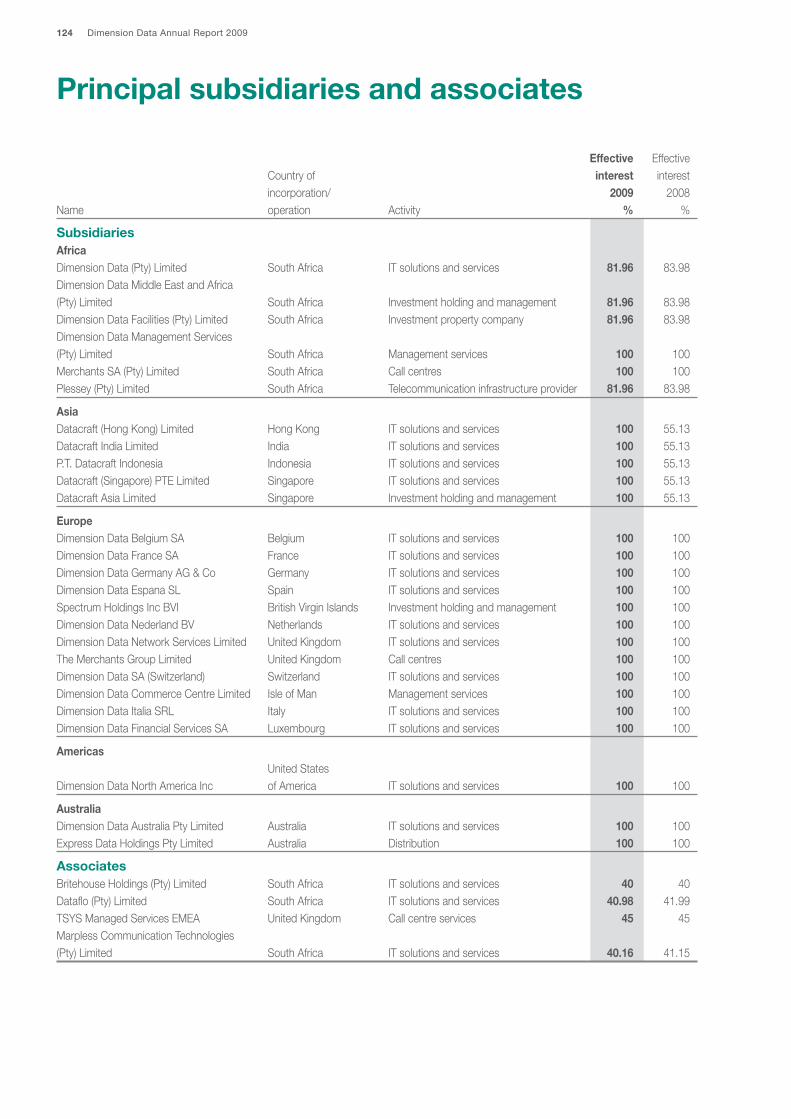
124 Dimension Data Annual Report 2009
Principal subsidiaries and associates
Effective Effective Countryof interest interest incorporation/ 2009 2008Name operation Activity % %
SubsidiariesAfricaDimensionData(Pty)Limited SouthAfrica ITsolutionsandservices 81.96 83.98DimensionDataMiddleEastandAfrica (Pty)Limited SouthAfrica Investmentholdingandmanagement 81.96 83.98DimensionDataFacilities(Pty)Limited SouthAfrica Investmentpropertycompany 81.96 83.98DimensionDataManagementServices (Pty)Limited SouthAfrica Managementservices 100 100MerchantsSA(Pty)Limited SouthAfrica Callcentres 100 100Plessey(Pty)Limited SouthAfrica Telecommunicationinfrastructureprovider 81.96 83.98
Asia Datacraft(HongKong)Limited HongKong ITsolutionsandservices 100 55.13DatacraftIndiaLimited India ITsolutionsandservices 100 55.13P.T.DatacraftIndonesia Indonesia ITsolutionsandservices 100 55.13Datacraft(Singapore)PTELimited Singapore ITsolutionsandservices 100 55.13DatacraftAsiaLimited Singapore Investmentholdingandmanagement 100 55.13
Europe DimensionDataBelgiumSA Belgium ITsolutionsandservices 100 100DimensionDataFranceSA France ITsolutionsandservices 100 100DimensionDataGermanyAG&Co Germany ITsolutionsandservices 100 100DimensionDataEspanaSL Spain ITsolutionsandservices 100 100Spectrum Holdings Inc BVI British Virgin Islands Investment holding and management 100 100DimensionDataNederlandBV Netherlands ITsolutionsandservices 100 100DimensionDataNetworkServicesLimited UnitedKingdom ITsolutionsandservices 100 100TheMerchantsGroupLimited UnitedKingdom Callcentres 100 100DimensionDataSA(Switzerland) Switzerland ITsolutionsandservices 100 100DimensionDataCommerceCentreLimited IsleofMan Managementservices 100 100DimensionDataItaliaSRL Italy ITsolutionsandservices 100 100DimensionDataFinancialServicesSA Luxembourg ITsolutionsandservices 100 100
Americas United States DimensionDataNorthAmericaInc ofAmerica ITsolutionsandservices 100 100
AustraliaDimensionDataAustraliaPtyLimited Australia ITsolutionsandservices 100 100ExpressDataHoldingsPtyLimited Australia Distribution 100 100
AssociatesBritehouseHoldings(Pty)Limited SouthAfrica ITsolutionsandservices 40 40Dataflo(Pty)Limited SouthAfrica ITsolutionsandservices 40.98 41.99TSYSManagedServicesEMEA UnitedKingdom Callcentreservices 45 45MarplessCommunicationTechnologies (Pty)Limited SouthAfrica ITsolutionsandservices 40.16 41.15

Dimension Data Annual Report 2009 125
Shareholder information
Shareholders’ diaryFinancial year end 30 SeptemberAnnualprofitannouncement November2009Dividenddeclaration November2009Dividendpayable March2010AnnualReport December2009AnnualGeneralMeeting February2010Interimprofitannouncement May2010
DividendsTheDirectorsrecommendthepaymentofafinaldividendof1.9UScents.Subjecttoshareholders’approvalattheAnnualGeneralMeetingon3February2010,thefinaldividendwillbepaidon19March2010toshareholdersontheshareregisteratthe close of business on 19 February 2010.
Corporate websiteThis report and other information on the Group’s activities and financial information are available on the website at www.dimensiondata.com.
Analysis of ordinary shareholders at 30 September 2009 Number of Number of Percentage ofSize of shareholding shareholders shares issued capital
1 – 1,000 11,233 3,429,463 0.20 1,001 – 5,000 4,638 11,744,630 0.69 5,001 – 10,000 1,235 9,578,012 0.56 10,001 – 25,000 789 12,635,983 0.74 25,001 – 50,000 366 13,289,083 0.78 50,001 – 100,000 181 13,500,794 0.80 100,001 – 250,000 178 29,193,357 1.72 250,001 – 500,000 130 47,619,701 2.81 500,001 – 1,000,000 114 81,667,405 4.81 Over 1,000,000 209 1,476,122,741 86.89Total 19,073 1,698,781,169 100.00
Substantial interestsAsat30September2009theCompanyhasbeennotified,inaccordancewithChapter5oftheDisclosureandTransparencyRules,ofthefollowinginterestsin3%ormoreoftheissuedsharecapitaloftheCompany:
Number of Percentage ofShareholder shares issued capital
AllanGrayInvestmentCouncil 440,849,973 25.95VenFinDDHoldingsLimited 430,467,810 25.34PublicInvestmentCorporation 98,282,697 5.79LegalandGeneralInvestmentManagementLimited 70,903,798 4.17M&GInvestmentManagementLimited 62,538,860 3.68

126 Dimension Data Annual Report 2009
Notice of annual general meeting
NoticeisherebygiventhattheeleventhAnnualGeneralMeetingofDimensionDataHoldingsplcwillbeheldatFleetPlaceHouse,2FleetPlace,London,EC4M7RTat15h00(UKtime),17h00(SAtime)onWednesday,3February2010totransactthe following business:
Ordinary businessTo consider and, if thought fit, pass the following ten resolutions, each of which will be proposed as an ordinary resolution:
1. To receive and adopt the annual financial statements comprising the consolidated financial statements of the Dimension Data Group and the financial statements of Dimension Data Holdings plc incorporated therein, and the reports of the Directors and the auditors for the year ended 30 September 2009.
2. Todeclareafinaldividendof1.9UScentspershare,inaccordancewiththeCompany’sArticlesofAssociation,payableonFriday,19March2010totheholdersofordinarysharesregisteredatthecloseofbusinessonFriday,19February2010.
3. To approve the Directors’ Remuneration Report for the year ended 30 September 2009.
4. Tore-electasanexecutivedirectorBrettDawsonwhoisretiringinaccordancewiththeArticlesofAssociation.
5. Tore-electasanexecutivedirectorPatrickQuarmbywhoisretiringinaccordancewiththeArticlesofAssociation.
6. Tore-electasanon-executivedirectorJosuaMalherbe(Dillie)whoisretiringinaccordancewiththeArticlesofAssociation.
7. Tore-electasanon-executivedirectorPeterLiddiardwhoisretiringinaccordancewiththeArticlesofAssociation.
8. Tore-electforatermexpiringonthedateoftheCompany’sAnnualGeneralMeetingin2011asanon-executivedirectorRoryScottwhoisretiringinaccordancewiththeArticlesofAssociation.
9. ToreappointDeloitteLLPasauditorsoftheCompanytoholdofficeuntiltheconclusionofthenextgeneralmeetingatwhichfinancialstatementsarelaidbeforetheCompany.
10. To authorise the Directors to fix the remuneration of the auditors.
Special businessTo consider and, if thought fit, pass the following four resolutions which will be proposed as ordinary resolutions:11. ThattheauthorityconferredontheDirectorspursuanttoArticle8.2oftheCompany’sArticlesofAssociationandSection
551of theCompaniesAct2006 toallotsharesbe reneweduntil thedateof theCompany’sAnnualGeneralMeetingin2011or2May2011,whichever istheearlierandforsuchperiod(withouttaking intoaccount forthispurposeanyallotmentofsharespursuant toanofferoragreementmadeprior tosuchperiod) theDirectorsshallbegenerallyandunconditionallyauthorisedtoexerciseallthepowersoftheCompanytoallotsharesuptoanaggregatenominalamountof $849,391 or 84,939,058 ordinary shares.
12. ThattherulesoftheDimensionDataHoldingsplcDeferredBonusPlan2009(‘DBP’)containedinthedocumentproducedtothemeetingandsignedbytheChairmanforthepurposeofidentification,andassummarisedinthenoticeofAnnualGeneralMeeting,beapprovedandadoptedandthattheBoardbeauthorisedtotakeallnecessarystepstoimplementoperationoftheDBP.
13. That the award of 1,140,000 deferred bonus shares to Brett Dawson in respect of exceptional performance in the 2008 financialyear,asprovisionallyapprovedbytheRemunerationCommittee,beapprovedandgrantedunderthetermsoftheDimensionDataHoldingsplcDeferredBonusPlan2009.
14. That an award of deferred bonus shares to Brett Dawson to the value of $750,000 in respect of exceptional performance in the2009financialyear,asprovisionallyapprovedbytheRemunerationCommittee,beapprovedandthattheRemunerationCommittee be authorised to determine the number of shares to be granted under the termsof theDimensionDataHoldingsplcDeferredBonusPlan2009.
To consider and, if thought fit, pass the following two resolutions, each of which will be proposed as a special resolution:15. ThattheCompanybegenerallyandunconditionallyauthorisedforthepurposesofSection701oftheCompaniesAct2006
tomakeoneormoremarketpurchases(withinthemeaningofSection693(5)oftheAct)ontheLondonorJohannesburgStockExchangesofordinarysharesofoneUScenteachinthecapitaloftheCompanyofuptoatotalof84,939,058shares, and may hold such shares as treasury shares, provided that:

Dimension Data Annual Report 2009 127
• Themaximumnumberofsharesheldintreasurywillneverexceed5%oftheissuedsharecapitaloftheCompany; • Themaximumpricewhichmaybepaidforsuchordinarysharesshallnotbemorethan5%abovetheaverageofthe
marketvaluesforanordinaryshareasderivedfromtheLondonStockExchange’sDailyOfficialListforthefivebusinessdays immediately preceding the date on which the ordinary shares are purchased;
• TheminimumpricewhichmaybepaidforsuchsharesisoneUScentperordinaryshare;and • TheauthorityconferredbythisresolutionshallexpireonthedateoftheCompany’sAnnualGeneralMeetingin2011or
2May2011,whicheveristheearlier(exceptinrelationtoanypurchaseofsharesthecontractforwhichwasconcludedbeforesuchdateandwhichwouldormightbeexecutedwhollyorpartlyaftersuchdate).
16. That (a) theArticlesofAssociationoftheCompanybeamendedbydeletingalltheprovisionsoftheCompany’sMemorandum
ofAssociationwhich,byvirtueofSection28of theCompaniesAct2006,are tobe treatedasprovisionsof theCompany’sArticlesofAssociation;and
(b) thattheArticlesofAssociationproducedtothemeetingandinitialledbytheChairmanofthemeetingforthepurposeofidentificationbeadoptedastheArticlesofAssociationoftheCompanyinsubstitutionfor,andtotheexclusionof,theexistingArticlesofAssociation.
By order of the Board
S HeydenrychSecretary
17November2009
Notes1. Anymemberentitledtoattendandvoteatthemeetingmayappointoneormoreproxiestoexercisealloranyoftheir
rights toattend,speakandvote insteadofhim.Aproxyneednotbeamemberof theCompany.A formofproxy isenclosed which may be used to make such appointment and give proxy instructions. If you do not have a proxy form and believethatyoushouldhaveone,orifyourequireadditionalformspleasecontacttheappropriateComputershareofficementionedinNote3below.
2. Completionandreturnofaformofproxy,othersuchinstrumentoranyCRESTProxyInstruction,doesnotprecludeamember from attending and voting at the meeting in person.
3. Tobevalid,theenclosedformofproxy,togetherwiththepowerofattorneyorotherauthority(ifany)underwhichitissigned,mustbelodgedwithComputershareInvestorServicesPLC,ThePavilions,BridgwaterRoad,BristolBS996ZYintheUK(formembersregisteredontheCompany’sprincipalregisterofmembers)orComputershare InvestorServices(Proprietary) Limited, 70 Marshall Street, Johannesburg 2001 or PO Box 61051, Marshalltown 2107 (for membersregisteredontheCompany’sSouthAfricanregisterofmembers)orviatheCompany’swebsitewww.dimensiondata.comineachcasenotlaterthan15h00(UKtime),17h00(SAtime)on1February2010.
4. CRESTmemberswhowishtoappointaproxyorproxiesthroughtheCRESTelectronicproxyappointmentservicemaydosobyusingtheproceduresdescribedintheCRESTmanual.CRESTPersonalMembersorotherCRESTsponsoredmembers,andthoseCRESTmemberswhohaveappointedserviceprovider(s),shouldrefertotheirCRESTsponsororvotingserviceprovider(s),whowillbeabletotakeappropriateactionontheirbehalf.
5. InorderforaproxyappointmentorinstructionmadeusingtheCRESTservicetobevalidtheappropriateCRESTmessage(a ‘CREST Proxy Instruction’) must be properly authenticated in accordance with Euroclear UK & Ireland Limited’sspecifications,andmustcontaintheinformationrequiredforsuchinstruction,asdescribedintheCRESTManual(availableviawww.euroclear.com/CREST).Themessage,regardlessofwhetheritconstitutestheappointmentofaproxyorisanamendment to the instruction given to a previously appointed proxy, must, in order to be valid, be transmitted so as to be receivedbytheissuer’sagent(ID3RA50)notlaterthan18h00(UKtime)on1February2010.Forthispurposethetimeofreceiptwillbetakentobethetime(asdeterminedbythetimestampappliedtothemessagebytheCRESTApplicationHost)fromwhichtheissuer’sagent isabletoretrievethemessagebyenquirytoCRESTinthemannerprescribedbyCREST.TheCompanymaytreatasinvalidaCRESTProxyInstructioninthecircumstancessetoutinRegulation35(5)(a)of the Uncertificated Securities Regulations 2001.

128 Dimension Data Annual Report 2009
Notice of annual general meeting(continued)
6. TobeentitledtoattendandvoteattheAnnualGeneralMeeting(andforthepurposeofdeterminationbytheCompanyofthevotestheymaycast)shareholdersmustberegisteredontheRegisterofMembersat15h00(UKtime),17h00(SAtime)on1February2010or,iftheAnnualGeneralMeetingisadjourned,ontheregisterofmembers48hours(excludingnon-workingdays)beforethetimeofanyadjournedmeeting,andshallbeentitledtoattendorvoteatthemeeting inrespectofthenumberofordinarysharesregisteredintheirnameatthatrelevanttime.Changestoentriesontheregisterofmembersafter15h00(UKtime),17h00(SAtime)on1February2010or,iftheAnnualGeneralMeetingisadjourned,onthe register of members less than 48 hours before the time of any adjourned meeting, shall be disregarded in determining the rights of any person to attend or vote at the meeting.
7. Anypersontowhomthisnoticeissentwhoisapersonnominatedundersection146oftheCompaniesAct2006toenjoy information rights (a ‘NominatedPerson’)may,underanagreementbetweenhim/herand theshareholderbywhomhe/shewasnominated,havetherighttobeappointed(ortohavesomeoneelseappointed)asaproxyfortheAnnualGeneralMeeting.IfaNominatedPersonhasnosuchproxyappointmentrightordoesnotwishtoexerciseit,he/she may, under any such agreement, have a right to give instructions to the shareholder as to the exercise of voting rights.Thestatementsoftherightsofshareholdersinrelationtotheappointmentofproxiesinparagraphs1-3abovedoesnotapplytoNominatedPersons.TherightsdescribedintheseparagraphscanonlybeexercisedbyshareholdersoftheCompany.
8. UnderSection527of theCompaniesAct2006membersmeeting the threshold requirementssetout in thatsectionhavetherighttorequiretheCompanytopublishonawebsiteastatementsettingoutanymatterrelatingto:(i)theauditof theCompany’saccounts (includingtheauditor’s reportandtheconductof theaudit) thatare tobe laidbefore theAnnualGeneralMeeting;or(ii)anycircumstanceconnectedwithanauditoroftheCompanyceasingtoholdofficesincethepreviousmeetingatwhichannualaccountsandreportswerelaidinaccordancewithSection437oftheCompaniesAct2006.TheCompanymaynotrequiretheshareholdersrequestinganysuchwebsitepublicationtopayitsexpensesincomplyingwithSections527or528of theCompaniesAct2006.WheretheCompany is requiredtoplacesuchastatementonawebsiteunderSection527oftheCompaniesAct2006,itmustforwardthestatementtotheCompany’sauditor not later than the time when it makes the statement available on the website. The business which may be dealt withattheAnnualGeneralMeetingincludesanystatementthattheCompanyhasbeenrequiredunderSection527oftheCompaniesAct2006topublishonawebsite.
9. UnderSection338andSection338AoftheCompaniesAct2006,membersmeetingthethresholdrequirements inthosesectionshavetherighttorequiretheCompany(i)togive,tomembersoftheCompanyentitledtoreceivenoticeof the meeting, notice of a resolution which may properly be moved and is intended to be moved at the meeting and/or(ii) to includeinthebusinesstobedealtwithatthemeetinganymatter(otherthanaproposedresolution)whichmaybeproperlyincludedinthebusiness.Aresolutionmayproperlybemovedoramattermayproperlybeincludedin thebusinessunless (a) (in thecaseofa resolutiononly) itwould, ifpassed,be ineffective (whetherby reasonofinconsistencywithanyenactmentortheCompany’sconstitutionorotherwise),(b)it isdefamatoryofanyperson,or(c)itisfrivolousorvexatious.Sucharequestmaybeinhardcopyorinelectronicform,mustidentifytheresolutionofwhich notice is to be given, or the matter to be included in the business, must be authorised by the person or persons makingit,mustbereceivedbytheCompanynotlaterthan22December2009beingthedatesixclearweeksbeforethemeeting,and(inthecaseofamattertobeincludedinthebusinessonly)mustbeaccompaniedbyastatementsetting out the grounds for the request.
10. Anymemberattendingthemeetinghastherighttoaskquestions.TheCompanymustcausetobeansweredanysuchquestionrelatingtothebusinessbeingdealtwithatthemeetingbutnosuchanswerneedbegivenif(a)todosowouldinterfereundulywiththepreparationforthemeetingorinvolvethedisclosureofconfidentialinformation,(b)theanswerhasalreadybeengivenonawebsiteintheformofananswertoaquestion,or(c)itisundesirableintheinterestsoftheCompanyorthegoodorderofthemeetingthatthequestionbeanswered.
11. FromthedateofthisnoticeandforthefollowingtwoyearsthefollowinginformationwillbeavailableontheCompany’swebsite and can be accessed at www.dimensiondata.com:
(i) thematterssetoutinthisnoticeofmeeting; (ii) thetotalnumberofsharesintheCompanyandsharesineachclass,inrespectofwhichmembersareentitledto
exercise voting rights at the meeting; and

Dimension Data Annual Report 2009 129
(iii) thetotalsofthevotingrightsthatmembersareentitledtoexerciseatthemeetinginrespectofthesharesofeachclass.
Anymembers’statements,members’resolutionsandmembers’mattersofbusinessreceivedbytheCompanyafterthedate of this notice will be added to the information already available on the website as soon as reasonably practicable and will also be made available for the following two years.
12. HoldersofordinarysharesareentitledtoattendandvoteatgeneralmeetingsoftheCompany.ThetotalnumberofissuedordinarysharesintheCompanyon17November2009,whichisthelatestpracticabledatebeforethepublicationofthisdocument,is1,698,781,169.TheChairmanintendstocallapolloneverysubstantiveissue.
13. Mobilephonesmaynotbeusedinthemeetingroom,andcameras,tapeorvideorecordersarenotallowedinthemeetingroom.
14. Documents available for inspection – the following documents are available for inspection at the registered office of the Company and at TheWanderers, TheCampus, 57 Sloane Street, Bryanston, Sandton, South Africa, during normalbusinesshoursfromthedateofthisnoticeuntilthedateoftheAnnualGeneralMeeting:
– CopiesofthecontractsofserviceofthedirectorsemployedbytheCompanyandofthelettersofappointmentofthenon-executivedirectors.
– CopiesoftheexistingArticlesofAssociationandtheproposedrevisedArticlesofAssociation. – CopiesoftherulesoftheDimensionDataHoldingsplcDeferredBonusPlan2009.
ThesedocumentswillalsobeavailableforinspectionduringtheAnnualGeneralMeetingandforatleastfifteenminutesbefore it begins.
15. Acopyof thisnotice,andother information requiredbySection311Aof theCompaniesAct2006,canbe foundat www.dimensiondata.com.
16. Membersmayview(butnotparticipatein)theAnnualGeneralMeetingfromSouthAfricaviaavideolinkwhichwillbeavailableatTheWanderers,TheCampus,57SloaneStreet,Bryanston,Sandton,SouthAfrica from14h45 (UKtime),16h45(SAtime)on3February2010.
Explanatory notesThepurposeofeachoftheresolutionsproposedattheAnnualGeneralMeetingisasfollows:
Resolution 1ToreceiveandadopttheAnnualFinancialStatementsforthefinancialyearwhichendedon30September2009.
Resolution 2 – Authority to pay dividendTheDirectorsrecommendthepaymentofadividendof1.9UScentspersharetobepaidon19March2010toshareholdersregistered on the share register at the close of business on 19 February 2010.
Resolution 3To approve the Directors’ Remuneration Report for the year ended 30 September 2009. In line with Section 439 of the CompaniesAct2006, theCompany is requiredtoputaresolutiontoapprovetheDirectors’RemunerationReport for thefinancial year to shareholders in a general meeting. The Remuneration Report for the year ended 30 September 2009 is set out onpages62to68oftheAnnualReport.
Resolutions 4 to 8 – Reappointment of DirectorsTheseresolutionswillbeproposedreappointingBrettDawson,PatrickQuarmby,DillieMalherbe,PeterLiddiardandRoryScottwhoretireattheAnnualGeneralMeetinginaccordancewiththeCompany’sArticlesofAssociation.RoryScottisstandingforelectiononanannualtermtoexpireattheAnnualGeneralMeetingin2011ashereachedtheendofhisninthyearofappointmentasindependentnon-executivedirectorinJuly2009.TheNominationCommitteeisintheprocessofreviewingsuccessionplanningforindependentnon-executivedirectors.
BiographicaldetailsofeachoftheabovedirectorsandtherestoftheBoardaresetoutonpages40and41oftheAnnualReport, and other relevant information is contained in the Directors’ Report, the Corporate Governance Report and theDirectors’ Remuneration Report.

130 Dimension Data Annual Report 2009
Notice of annual general meeting(continued)
Resolutions 9 and 10 – AuditorsResolution9will,ifpassed,reappointDeloitteLLPasauditorsoftheCompanyandResolution10willauthorisetheDirectorstodeterminetheirremuneration.Companylawrequiresthat,ateachgeneralmeetingatwhichaccountsarelaid,theCompanyshould appoint auditors who will remain in office until the next general meeting at which accounts are laid.
Resolution 11 – Authority to allot sharesThisgivesDirectorsthegeneralauthoritytoallotupto84,939,058ordinaryshares(beinganamountapproximatelyequalto5%oftheissuedordinarysharecapitaloftheCompanyasat30September2009exclusiveoftreasurysharesheldbytheCompany).TheCompanydidnotholdtreasurysharesat30September2009.TheDirectorshavenopresent intentiontoexercise the authority, other than to satisfy share options under the existing share option scheme. This authority, if given, will expireatthenextAnnualGeneralMeetingor2May2011,whicheverisearlier.Thisresolutionwillbeproposedasanordinaryresolution.
Resolution 12 – Approval and adoption of DBPThisresolutionseeksshareholders’authority for the introductionof theDimensionDataHoldingsplcDeferredBonusPlan2009(the‘DBP’).AsdetailedintheDirectors’RemunerationReportintheAnnualReportandAccounts,theRemunerationCommitteeisoftheopinionthatitisappropriatetodeferaportionofanyannualbonusawardedtoexecutivedirectorsandemployees into deferred shares where this is substantial relative to base salary.
Thecurrentintentionistoimplementthispracticeinrespectofthe‘AdditionalBonus’,asdefinedintheDirectors’RemunerationReport.
The practice of deferring a bonus into shares encourages retention and a focus on the sustainability of profits. It is also in line withemerginginternationalpractice.TheDBPwillenabletheCompanytoimplementsuchawards.
Resolutions 13 and 14 – Approval of deferred bonus awards to BW DawsonThese resolutions seek shareholders’ authority for the grant of two awards to Brett Dawson under the Dimension Data Holdings plcDeferredBonusPlan2009(the‘DBP’).Thefirstawardisof1,140,000deferredbonussharesandhasbeenprovisionallyapprovedbytheRemunerationCommittee.Itrelatestoperformanceinthe2008financialyear.Thenumberofsharessubjectto the award has been calculated by reference to the market value of a share on 12 December 2008, which is the date on whichtheawardwasprovisionallyapprovedbytheRemunerationCommittee.Thesecondawardisfordeferredbonussharestothevalueof$750,000andhasbeenprovisionallyapprovedbytheRemunerationCommitteerelatingtoperformanceinthe2009financialyear.TheawardswillbesubjecttotherulesoftheDBP,assummarisedinAppendix1tothisdocument.
Resolution 15 – Purchase of own sharesThis resolutionenables theCompany topurchaseup to84,939,058of itsordinaryshares,being5%of the issuedsharecapital as at 30 September 2009 in the market, either for cancellation, or to hold as treasury shares. The total number of outstandingoptionstosubscribeforequitysharesintheCompanyat30September2009is61,287,956whichrepresents3.6%ofissuedsharecapitaloftheCompany(excludingtreasuryshares).Iftheauthoritytobuybacksharesisfullyexercised,thesewouldrepresent3.8%oftheissuedsharecapitaloftheCompany(excludingtreasuryshares).TheDirectorswouldonlyuse this authority after careful consideration, taking into account market conditions prevailing at the time, other investment opportunities,appropriategearinglevelsandtheoverallpositionoftheCompany.TheDirectorswouldonlypurchasesuchshares after taking into account the effects on earnings per share and the benefits for shareholders. This authority, if given, will expireatthenextAnnualGeneralMeetingor2May2011,whicheverisearlier.Thisresolutionwillbeproposedasaspecialresolution.
Resolution 16 – Adoption of Articles of AssociationFollowingchangesinEnglishlawasaresultoftheCompaniesAct2006,theArticlesofAssociationwereamendedbytheCompanyatthe2008AGM.AstheimplementationoftheCompaniesAct2006hasbeeninstages,thecurrentArticlesrequirefurtheramendment tobring them into linewith thefinal implementationof theCompaniesAct2006which tookplaceon 1October2009andtotakeaccountofthecomingintoforceoftheCompanies(Shareholders’Rights)Regulations2009.
Theprincipalchangesbeingmadearedetailed inAppendix2tothisdocument.Otheramendmentswhichareofaminor,technicalorclarifyingnature(includingthosewhichmerelyreflectchangesmadebytheCompaniesAct2006orconformthelanguageoftheNewArticleswiththatusedinthemodelarticlesforpubliccompaniessetoutintheCompanies(ModelArticles)Regulations2008havenotbeennotedinAppendix2.
TherevisedArticlesareavailableforinspection,asnotedonpage129ofthisdocument.

Dimension Data Annual Report 2009 131
RecommendationYourDirectorsbelievethatalltheproposalstobeconsideredattheAnnualGeneralMeetingareinthebestinterestsoftheCompanyanditsshareholdersasawhole.Theyrecommendthatyouvoteinfavouroftheproposedresolutions.TheDirectorsintendtovotetheirownshareholdingsintheCompanyinfavouroftheproposedresolutions.
Attendance at the annual general meetingTheAnnualGeneralMeetingisbeingheldinLondon.Shareholdersunabletoattendthemeetingmayappointoneormoreproxiestoattendandvoteinsteadofhimorher.Aproxyneednotbeashareholder.AProxyFormisenclosedwiththisNotice.Details of proxy votes received will be displayed at the meeting, will be available to shareholders following the meeting, and willbeplacedontheCompany’swebsite.ApollwillbecalledforeachresolutiontobevotedattheAGM.Avideo-conferencefacility toviewthemeeting inLondonfromSouthAfricawillbesetupatTheWanderers,TheCampus,57SloaneStreet,Bryanston,Sandton,SouthAfrica.Shareholdersattendingattheviewingfacilitywillbeabletoviewbutwillnotbeabletoparticipateinthemeeting.ImmediatelyfollowingthemeetingtheDirectorspresentinLondonwillbeavailableviathevideo-conferencefacilitytoanswerquestionsfromshareholdersattendingtheSouthAfricanvideo-conference.
Action to be takenYouwillfindenclosedwiththisdocumentaProxyFormforuseattheAnnualGeneralMeeting.MemberswhoareregisteredontheprincipalregisterofmembersintheUKandcertificatedandownnamedematerialisedshareholderswhoareregisteredontheSouthAfricanregisterarerequested,whetherornottheyintendtobepresentattheAnnualGeneralMeeting,tocompletetheProxyForminaccordancewiththeinstructionsprintedonitandreturnittoComputershareInvestorServicesPLC,POBox82,ThePavilions,BridgwaterRoad,BristolBS997NHintheUK(formembersregisteredontheCompany’sprincipalregisterofmembersintheUK)orComputershareInvestorServices(Proprietary)Limited,70MarshallStreet,Johannesburg2001orPOBox61051,Marshalltown2107(formembersregisteredontheCompany’sSouthAfricanregisterofmembers),assoonaspossible,butinanyeventsoastobereceivednotlaterthan15h00(UKtime),17h00(SAtime)on1February2010.ThereturnofthecompletedformwillnotpreventyoufromattendingtheAnnualGeneralMeetingandvotinginperson,shouldyouso wish.
Dematerialised shares in Strate on the South African registerMemberswhohavedematerialisedtheirDimensionDatasharesinStratemustinstructtheirCSDPorbrokeroftheirvotinginstructions.MembersshouldcontacttheirCSDPorbrokerwithregardtothecut-offtimeforreceivingtheirinstructions.If,however,suchmemberswishtoattendtheAnnualGeneralMeetinginperson,thentheywillneedtorequesttheirCSDPorbroker to provide them with the necessary authority in terms of the custody agreement entered into between the dematerialised shareholderandtheCSDPorbroker.

132 Dimension Data Annual Report 2009
Appendix 1 – Salient features of the Dimension Data Holdings plc Deferred Bonus Plan 2009 (‘the DBP’)
1. Introduction This summary outlines the main features of the DBP, under which the Companymay grant conditional awards
of shares or restricted shares where the employee is the owner of the shares from the date of award but subject to forfeiture and restrictions on transfer during the vesting period. Unless otherwise specified, all awards have substantially the same terms.
AwardsmaybemadetoemployeesoftheGroup,includingexecutivedirectorsandseniorexecutivesoftheCompany.TheDBPalsoprovidesflexibilitytosettleconditionalawardsincashif,forexample,thisisdeemedtobeappropriategivenlocal tax or regulatory considerations.
Thevestingofallawardswillbedependentoncontinuedemploymentduringathreeyearvestingperiod.Astheawardsrelate to the deferral of a portion of a bonus payment, which has been earned due to the satisfaction of the bonus performance targets set, the awards will not be subject to the satisfaction of further company performance conditions.
2. Operation Awardswill normally bemadeonlywithin 42days after the announcement of theCompany’s results for anyperiod.
Awardsmayalsobemadeatothertimesinexceptionalcircumstances.Itisintendedtomakethefirstawardsshortlyaftershareholder approval.
Inaddition,asdetailedinResolutions13and14,theRemunerationCommitteehasprovisionallyapprovedawardswhichrelatetoexceptionalperformanceachievedinthe2008and2009financialyears.TheseawardswillbemadeaftertheDBPhas been approved by shareholders and are subject to shareholders approving each specific award.
3. Eligibility AllemployeesandexecutivedirectorsoftheCompany,orofanysubsidiaryoftheCompany,areeligibletoparticipatein
theDBP.ParticipationwillberecommendedtotheRemunerationCommitteebytherelevantemployercompanyandtheparticipantsandthetermsoftheirawardswillbeapprovedbytheRemunerationCommittee.
4. Deferred bonus TheRemunerationCommitteewilldeterminetheportionoftheannualbonustobepaidincashandtheportiontobepaid
indeferredshares,bywayofanawardundertheDBP.
The current intention is to implement this practice in respect of the ‘Additional Bonus’, as defined in the Directors’Remuneration Report.
The number of shares subject to the award will be calculated by dividing the amount of the portion of the bonus to be deferred by the market value of a share on the date of grant.
In respect of the award detailed in Resolution 13, the number of shares subject to the award has been calculated by dividing the amount of the bonus to be deferred by the market value of a share on the date that the award was approved bytheRemunerationCommittee.
5. Structure of awards Awardscanbegrantedintheformofconditionalawardsorrestrictedshares.
Aconditionalaward isaconditionalrighttoacquiresharesonthevestingdatefornoconsideration.Untilvesting,theparticipant has no rights in respect of the shares.
Anawardofrestrictedsharesgivestheparticipantownershipofthesharesfromthedateofgrantandheisentitledtoreceive dividends and exercise his voting rights. However, the shares are held by a third party agent for the duration of the vesting period and the participant is prohibited from transferring or otherwise dealing in the shares. In addition, the shares are subject to a risk of forfeiture during the vesting period. On vesting, the shares will be released from the agent.
6. Vesting conditions The vesting of awards will be subject to the participant remaining employed within the Group for a period of three years
after the date of grant.
Astheawardsrelatetothedeferralofaportionofabonuspayment,whichhasbeenearnedduetothesatisfactionofthe bonus performance targets set, the awards will not be subject to the satisfaction of further company performance conditions.

Dimension Data Annual Report 2009 133
7. Termination of employment Where a participant’s employment is terminated prior to the vesting date by reason of resignation or dismissal for
misconduct, his award will lapse on the date of termination of employment and it will be forfeited in its entirety, unless the RemunerationCommittee,initsdiscretion,determinesotherwise.
Where a participant’s employment is terminated prior to the vesting date by reason of death, retirement, redundancy, a saleoftheemployingbusinessorcompanyorforotherreasonsallowedbytheRemunerationCommittee,theawardwillvest in full at date of termination of employment.
Whereaparticipant’semployment isterminatedprior tothevestingdatebyreasonof ill-health, injuryordisability, theRemunerationCommitteehasdiscretiontodeterminewhetherornottheawardwillvestonthedateofterminationofemployment and, if it does vest, to what extent.
8. Change of control, merger or other reorganisations On a takeover, scheme of arrangement, merger or other corporate reorganisation, the awards will vest in full on the date
of the event.
9. Variations ParticipantswillbenotifiedbytheCompanywherethereisavariationinthesharecapitaloftheCompany,ademerger
oraspecialdividend.UponsuchaneventtheRemunerationCommitteemayadjustthenumberofsharessubjecttoconditional awards in any way it considers appropriate to take account of the effect of the transaction on the value of the awards.
Inthecaseofrestrictedshares,participantswillhavethesamerightsasanyothershareholder.Anysharesallottedtoparticipantsasaconsequenceofthevariation(otherthanwheretheyhavebeenacquiredwithnewconsiderationprovidedbytheparticipant)willbetreatedasthoughtheywereawardedatthesametimeastherestrictedsharesinrespectofwhichtherightswereconferredandwillbesubjecttotherulesoftheDBP.
Additionally,wheretheRemunerationCommitteeisawarethattheCompanywillbe,orisexpectedtobe,affectedbyademerger, dividend in specie or super dividend, and it is of the view that the current or future value of the awards will be affected by that event, it can exercise its discretion to allow the awards to vest in whole or in part prior to the occurrence of the event.
10. Dividend equivalents Conditional awardswill not enjoy any shareholder rights until the shares havebeen acquiredby the participant after
vesting.However, theRemunerationCommittee has discretion to determine that dividend equivalentswill be paid inrespect of conditional awards. Where this determination is made, participants may receive a payment in cash or shares of an amount equal to the dividends which would have been payable on the shares received during the period from the date of grant up to the vesting date.
` In the case of restricted shares, as participants are entitled to receive dividends, they will not attract dividend equivalents.
11. Rights Awardsarenottransferable,exceptondeath.
AnysharesissuedundertheDBPwillrankequallywithsharesofthesameclassandinissueonthedateofallotment,except in respect of rights by reference to a record date prior to the date of allotment. For so long as shares are listed on theOfficialListoftheUKListingAuthorityandtradedontheLondonStockExchangeandlistedandtradedontheJSELimitedinSouthAfrica,theCompanywillapplyforalistingofsharesissuedundertheDBPassoonaspracticableaftertheir allotment.
AwardsundertheDBParenotpensionable.
12. Limits Inany10yearperiod,notmorethat10%oftheissuedordinarysharecapitaloftheCompanymaybeissuedunderthe
DBPandtheexistingShareAppreciationRightsSchemeandLongTermIncentivePlanoperatedbytheCompany.
AwardsheldundertheDBPbyanyonepersonatanytimeshallnotexceed0.25%oftheissuedordinarysharecapitaloftheCompany.
134 Dimension Data Annual Report 2009
Appendix 1 – Salient features of the Dimension Data Holdings plc Deferred Bonus Plan 2009 (‘the DBP’) (continued)
13. Amendments to the DBP TheBoardmayamendtheDBPasitconsidersappropriate.However,shareholderapprovalwillberequiredtoamend
certainprovisionsoftheDBPiftheyaretotheadvantageoftheparticipants(exceptforminoramendmentstobenefittheadministrationoftheDBPtotakeaccountofchangesinlegislationortoobtainormaintainfavourabletax,exchangecontrolorregulatorytreatment).Theseprovisionsrelateto:eligibility;planlimits;thebasisfordeterminingentitlementstoshares;rightsintheeventofavariationintheCompany’ssharecapital;andtheamendmentpowers.
14. Termination TheBoardmayterminatetheDBPatanytime.Inanyevent,noawardscanbegrantedundertheDBPafterthetenth
anniversaryofthedateonwhichshareholdersapprovetheDBP.
TherulesoftheDBPwillbeavailableforinspectionasdetailedinNote14tothenotesattachedtotheNoticeofAnnualGeneralMeetingonpage129.

Dimension Data Annual Report 2009 135
Appendix 2 – Summary of principal changes in the New Articles
1. Memorandum of Association TheArticlesofAssociationwillbeamendedbydeletingalltheprovisionsoftheCompany’sMemorandumofAssociation
which,byvirtueofSection28oftheCompaniesAct2006,aretreatedasprovisionsoftheCompany’sArticlesofAssociation
from 1 October 2009.
TheprovisionsregulatingtheoperationsoftheCompanyarecurrentlysetoutintheCompany’sMemorandumandArticles
ofAssociation.TheCompany’sMemorandumcontains,amongotherthings,theobjectsclausewhichsetsoutthescope
oftheactivitiesthattheCompanyisauthorisedtoundertake.
Thisisdraftedtogiveawidescope.TheCompaniesAct2006hassignificantlyreducedtheconstitutionalsignificanceof
theMemorandumbyprovidingthatamemorandumwillrecordonlythenamesofsubscribersandthenumberofshares
each subscriber has agreed to take in a company.
Under the Companies Act 2006 the objects clause, and all other provisions which are currently contained in the
Memorandum,aredeemedtobecontained in theArticlesbut theCompany isallowed to remove theseprovisions
byspecial resolution.FurthertheCompaniesAct2006statesthatunlessacompany’sarticlesprovideotherwise,a
company’s objects are unrestricted. This abolishes the need for companies to have objects clauses. For this reason
theCompanyisproposingtoremoveitsobjectsclausetogetherwithallotherprovisionsofitsMemorandumwhich,
byvirtueoftheCompaniesAct2006,aretobetreatedasformingpartoftheCompany’sArticlesofAssociationfrom
1 October 2009.
2. Authorised share capital and unissued shares Asfrom1October2009theCompaniesAct2006hasabolishedtherequirementforacompanytohaveanauthorised
sharecapital.TheproposedchangesintheNewArticlesreflectthis.TheDirectorswillstillbelimitedastothenumberof
sharestheycanallotatanytimebecausetheCompaniesAct2006stillrequiresthemtohaveallotmentauthority(savein
respectofemployeeshareschemes)aswellasadheretoanystatutorypre-emptionrights.
3. Authority to purchase own shares, consolidate and sub-divide shares and reduce share capital Previously,acompanyrequiredspecificenablingprovisionsin itsarticlestopurchaseitsownshares,toconsolidate
orsub-divideitssharesandtoreduceitssharecapitalorotherundistributablereservesinadditiontotheshareholder
authority given to undertake the relevant action. The articles currently include these enabling provisions. Under the
CompaniesAct2006acompanywillonlyrequireshareholderauthoritytodoanyofthesethingsanditwillnolongerbe
necessaryforarticlestocontainenablingprovisions.Accordinglytherelevantenablingprovisionshavebeenremoved
intheNewArticles.
4. Redeemable shares Previously,ifacompanywishedtoissueredeemableshares,itmusthaveincludedinitsarticlesthetermsandconditions
andmannerofredemption.Since1October2009theCompaniesAct2006hasenabledtheDirectorstodeterminesuch
mattersinstead,providedtheyaresoauthorisedtodosobytheArticles.TheNewArticlescontainsuchanauthorisation.
TheCompanycurrentlyhasnoplanstoissueredeemableshares.
5. Use of seals Previously,acompanyrequiredauthorityinitsarticlestohaveanofficialsealforuseabroad.UndertheCompanies
Act2006,suchauthority isno longerrequired.Accordinglytherelevantauthorisationhasbeenremovedfromthe
NewArticles.
6. Voting by proxies on a show of hands TheShareholders’RightsRegulations2009haveamendedtheCompaniesAct2006sothatitnowprovidesthateach
proxy appointed by a member has one vote on a show of hands unless the proxy is appointed by more than one member in which case the proxy has one vote for and one vote against if the proxy has been instructed by one or more members tovotefortheresolutionandbyoneormorememberstovoteagainsttheresolution.TheNewArticlescontainamendedprovisions that reflect this change.

136 Dimension Data Annual Report 2009
Appendix 2 – Summary of principal changes in the New Articles(continued)
7. Voting by Corporate Representatives The Shareholders’ Rights Regulations 2009 have amended the Companies Act 2006 in order to enable multiple
representatives appointed by the same corporate member to vote in different ways on a show of hands and a poll. The NewArticlescontainamendmentswhichreflectthesechanges.
8. Notice of general meetings TheShareholders’RightsRegulations2009amendtheCompaniesAct2006torequiretheCompanytogive21clear
days’noticeofgeneralmeetingsunlesstheCompanyoffersmembersanelectronicvotingfacilityandaspecialresolutionreducingtheperiodofnoticetonotlessthan14dayshasbeenpassed.Annualgeneralmeetingsmustbeheldon21cleardays’notice.TheNewArticlesamendtheprovisionstobeconsistentwiththenewrequirements.However,theCompanyis not proposing to reduce the period of notice required for general meetings.
9. Chairman’s casting vote in general meetings ThenewArticlesremovetheprovisiongivingtheChairmanacastingvoteintheeventofanequalityofvotesatageneral
meetingasthisisnolongerpermittedundertheCompaniesAct2006.
10. Adjournments for lack of quorum UndertheCompaniesAct2006asamendedbytheShareholders’RightsRegulations2009,generalmeetingsadjourned
forlackofquorummustbeheldatleast10cleardaysaftertheoriginalmeeting.TheNewArticlesreflectthisrequirement.
11. Voting record date UndertheCompaniesAct2006asamendedbytheShareholders’RightsRegulations2009,theCompanymustdetermine
the right of members to vote at a general meeting by reference to the register not more than 48 hours before the time for theholdingof themeeting,not takingaccountofdayswhicharenotworkingdays.TheNewArticles reflect thisrequirement.
12. Directors’ conflicts of interest UndertheCompaniesAct2006,theCompanymustnowhaveanenablingprovisioninitsArticlesinordertoallowthe
Boardtoauthorisebywayofboardresolutionotherdirectors’conflictsofinterest.TheNewArticlesreflectthisrequirement.
13. General GenerallytheopportunityhasbeentakentoclarifytheArticlesandmakeotherminorandtechnicalchangestobringthe
ArticlesintolinewiththeCompaniesAct2006.

Contacts and corporate information
Dimension Data Holdings plc(IncorporatedinEnglandandWalesundertheCompaniesAct2006withregisterednumber3704278)(RegisteredasanexternalcompanyintheRepublicofSouthAfricawithregistrationnumber2000/009053/10)
Company SecretarySanet [email protected]
Registered officeDimension Data HouseBuilding 2WaterfrontBusinessParkFleet RoadFleetHampshireGU513QT
Head officeThe WanderersTheCampus57 Sloane Street, BryanstonSandton2191,SouthAfricaTelephone:+27115750000
PostalAddressPrivateBoxX127Bryanston2021,SouthAfrica
AuditorsDeloitteLLPLondonUnitedKingdom
UK Transfer SecretariesComputershareInvestorServicesPLCThePavilionsBridgwater RoadBristolBS996ZYUnitedKingdom
South African Transfer SecretariesComputershareInvestorServices(Pty)Limited70MarshallStreetJohannesburg2001,SouthAfrica(POBox61051,Marshalltown2107)
South African legal advisersEversheds22 Fredman DriveSandton,SouthAfrica
Investor relationsKarenCramé[email protected]:+442076517000
Dimension Data websitewww.dimensiondata.com
Regional head office contact details
AmericasOnePennPlaza,Suite1600,NewYork,NY10119Tel:+12126131220Fax:+12125637279
Asia*6TemasekBoulevard,#26-01/05
Suntec Tower Four, Singapore 038986Tel:+6563226688Fax:+6563237933
*trading as Datacraft Asia Limited
Australia121-127HarringtonStreet,TheRocks,NSW2000Australia
Tel:+61(0)282495000Fax:+61(0)282495369
EuropeDimensionDataHouse,Building2,WaterfrontBusinessParkFleetRoad,Fleet,HampshireGU513QT,UnitedKingdomTel:+44(0)1252779000Fax:+44(0)1252779010
Middle East and AfricaTheCampus,57SloaneStreet,Bryanston,Sandton,2191,SouthAfrica
Tel:+27(0)115750000Fax:+27(0)115760000
www.dimensiondata.com