our process our recommendation case study - schreiber foods
TRANSCRIPT

Water Working Group
C O N T E N T S
Our FOCUS: Working Together to Reduce Water
Our PROCESS
Our RECOMMENDATIONCase Study
Our RESULTS
Water Working Group Report 2016
NEXT: Our Focus
Interactive
CLICK theCONTENTS
BAR tonavigate.
CLICK HEREfor a printable version

Water Working Group
C O N T E N T S
Our FOCUS: Working Together to Reduce Water
Our PROCESS
Our RECOMMENDATIONCase Study
Our RESULTS
WORKING TOGETHER TO REDUCE WATER
Water reduction is important to Schreiber Foods and is a key component of our sustainability program. Our customers expect us to set water reduction goals and work to meet or exceed our objectives. That’s why we’ve recently joined forces with our suppliers and industry leaders to reduce water usage on a continuous basis.
OU
R F
OC
US
“We never know the worth of water till the well is dry.”
-Thomas Fuller
2
Water Working Group
C O N T E N T S
Our FOCUS: Working Together to Reduce Water
Our PROCESS
Our RECOMMENDATIONCase Study
Our RESULTS
WATER WASTE WORKING GROUP
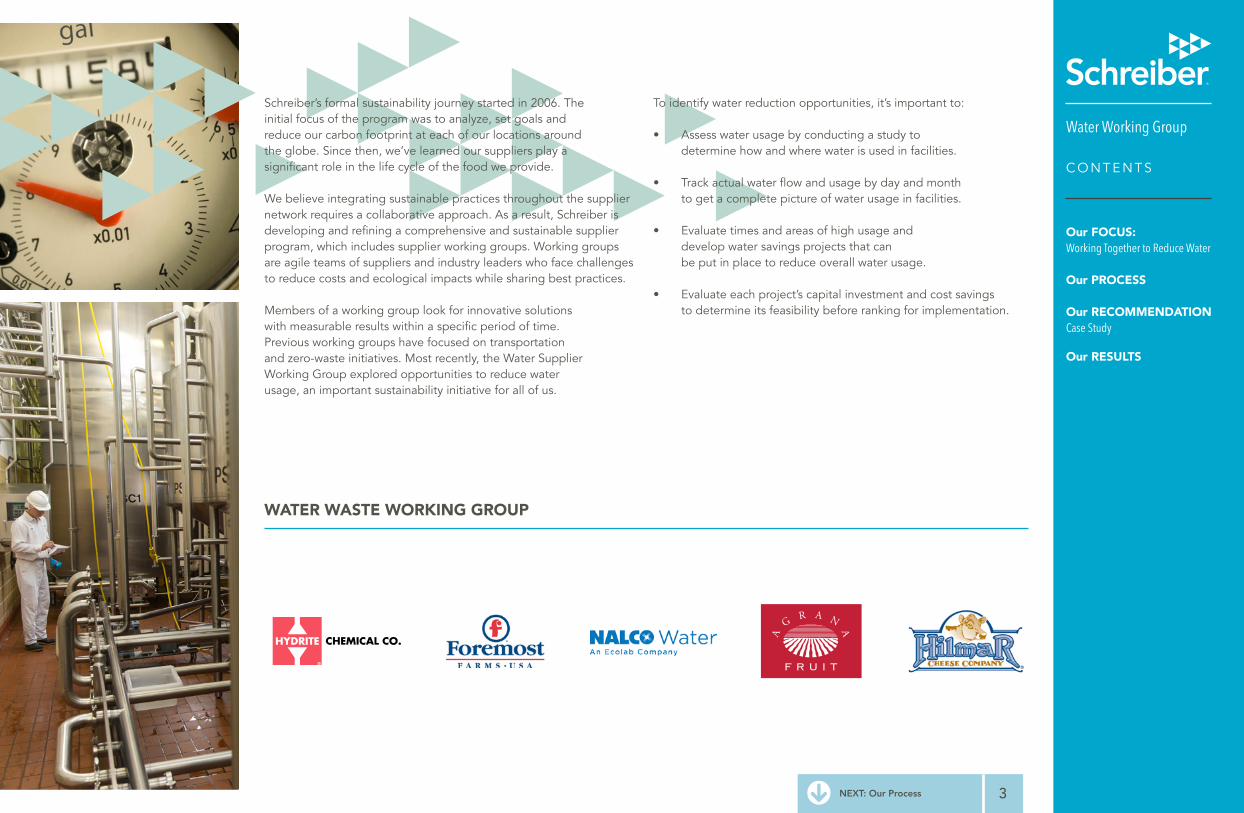
Schreiber’s formal sustainability journey started in 2006. The initial focus of the program was to analyze, set goals and reduce our carbon footprint at each of our locations around the globe. Since then, we’ve learned our suppliers play a significant role in the life cycle of the food we provide.
We believe integrating sustainable practices throughout the supplier network requires a collaborative approach. As a result, Schreiber is developing and refining a comprehensive and sustainable supplier program, which includes supplier working groups. Working groups are agile teams of suppliers and industry leaders who face challenges to reduce costs and ecological impacts while sharing best practices.
Members of a working group look for innovative solutions with measurable results within a specific period of time. Previous working groups have focused on transportation and zero-waste initiatives. Most recently, the Water Supplier Working Group explored opportunities to reduce water usage, an important sustainability initiative for all of us.
To identify water reduction opportunities, it’s important to:
• Assess water usage by conducting a study to determine how and where water is used in facilities.
• Track actual water flow and usage by day and month to get a complete picture of water usage in facilities.
• Evaluate times and areas of high usage and develop water savings projects that can be put in place to reduce overall water usage.
• Evaluate each project’s capital investment and cost savings to determine its feasibility before ranking for implementation.
3NEXT: Our Process

Water Working Group
C O N T E N T S
Our FOCUS: Working Together to Reduce Water
Our PROCESS
Our RECOMMENDATIONCase Study
Our RESULTS
Tools and best practices for water measurement/metering:The first step in any case study is to accurately measure and/or estimate water usage in different areas of a plant. At minimum, a plant that purchases water should be able to obtain incoming water usage from water supply meters. A plant with a wastewater treatment system also will commonly measure effluent flow. Having accurate flow measurement is essential in mapping water usage at a plant.
Water use measurement varied at facilities represented by members of the Water Supplier Working Group. Several suppliers relied on basic monitoring, like an incoming water meter. Other suppliers installed meters on water softeners, boilers, production areas and departments, for example, to measure water usage during various stages
of production. One supplier had a custom modeling system that closely estimated each facility’s water usage.
The group concurred that regularly checking a plant’s metrics is crucial to making progress on water reduction. Real-time monitoring can help reduce water usage and pinpoint areas of concern faster, but it is expensive to implement.
Best Water Reduction Practices: The group discussed the idea of developing a best practices guide, but decided it would be better to conduct a case study and instead focus on steps facilities can take to identify and implement water savings practices.
OUR PROCESS
Members of the Water Supplier Working Group included Schreiber Foods partners (employees) from our home office and two facilities, along with representatives from five suppliers that provide us with everything from ingredients to sanitation chemicals. Project deliverables included:
Identifying tools and best practices for water measurement/metering.
Listing best practices (feasible and non-feasible) for reducing water use at a facility.
Conducting a case study at one or more plant locations to identify potential water reduction opportunities that could be implemented across facilities.
1
2
3
4NEXT: Our Recommendation

Water Working Group
C O N T E N T S
Our FOCUS: Working Together to Reduce Water
Our PROCESS
Our RECOMMENDATIONCase Study
Our RESULTS
OUR RECOMMENDATION
WATER MAP- PLANT CASE STUDY
Case Study
The group conducted a case study for a plant in California that checked some water meters weekly and others on a monthly basis. The plant measured wastewater flow daily. As part of the case study, the plant was asked to reduce its water usage by 28 percent from 2014.
Members of the working group visited the plant to conduct water mapping and identify water reduction projects. The team also enlisted the help of the plant’s chemical provider to help identify water savings projects. In addition, the group evaluated a water and energy savings study performed by the plant’s utilities provider.
The first step was to develop a water map of the facility to determine:
• Where water is used at the plant.• Where water is measured, including meter locations.• The estimated amount of water used in processes
where water usage is not measured.
A. Clean-in-place circuits – Worked with the chemical vendor to determine the amount of water used for each circuit, based on the system’s programming and how often the circuits are run.
B. Other water uses without meters – Using a known-size container and a watch or timer, find a place to measure water being used or lost. Estimate the water flow rate and number of hours a day the equipment is running to get an approximate total. Hose stations and leaks on process equipment are two examples of places that could benefit from this method to estimate water use.
C. After calculating the measured and estimated water data to fill in the water mapping, make estimates on other items left that can be subtracted from the meters or estimates to determine a final amount.
TO THE RIGHT is the water map for our case study facility.
5NEXT: Our Recommendation
Water Working Group
C O N T E N T S
Our FOCUS: Working Together to Reduce Water
Our PROCESS
Our RECOMMENDATIONCase Study
Our RESULTS
OUR RESULTS
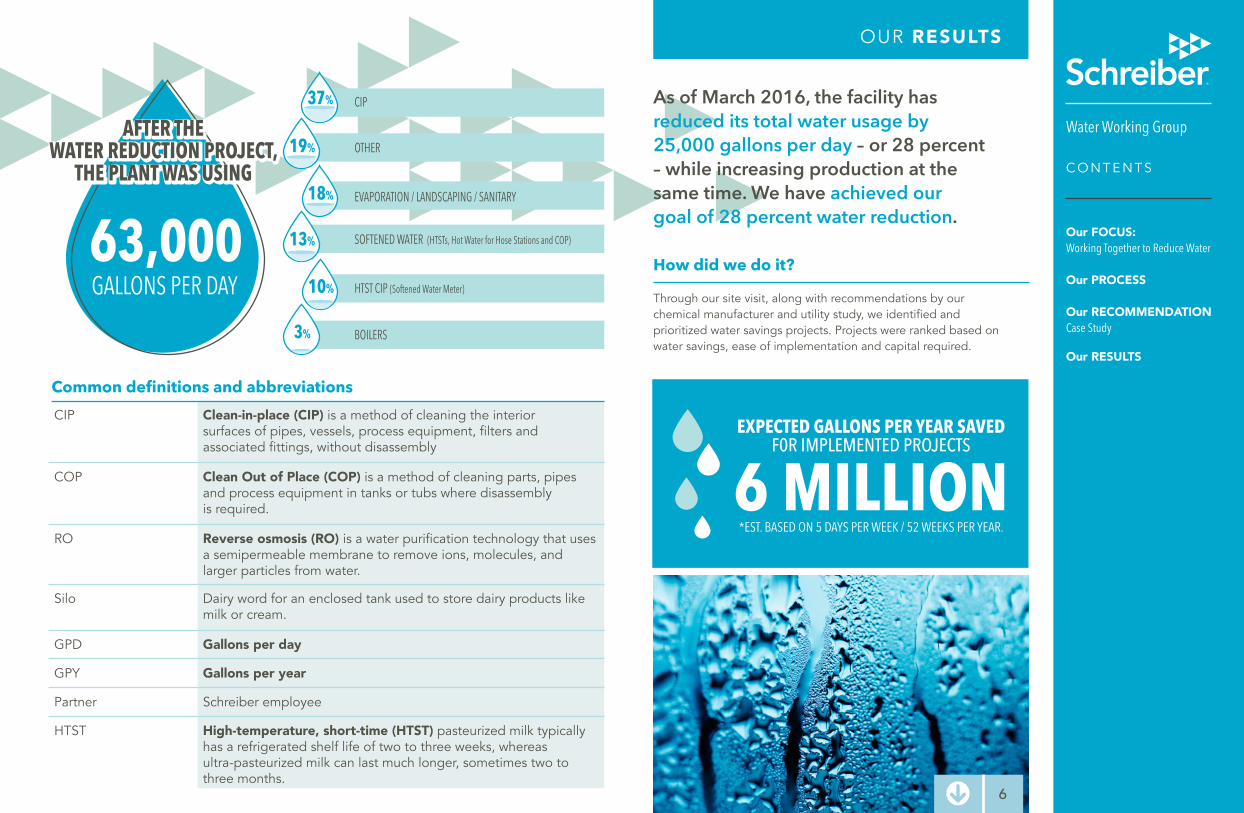
How did we do it?
Through our site visit, along with recommendations by our chemical manufacturer and utility study, we identified and prioritized water savings projects. Projects were ranked based on water savings, ease of implementation and capital required.
As of March 2016, the facility has reduced its total water usage by 25,000 gallons per day – or 28 percent – while increasing production at the same time. We have achieved our goal of 28 percent water reduction.
CIP Clean-in-place (CIP) is a method of cleaning the interior surfaces of pipes, vessels, process equipment, filters and associated fittings, without disassembly
COP Clean Out of Place (COP) is a method of cleaning parts, pipes and process equipment in tanks or tubs where disassembly is required.
RO Reverse osmosis (RO) is a water purification technology that uses a semipermeable membrane to remove ions, molecules, and larger particles from water.
Silo Dairy word for an enclosed tank used to store dairy products like milk or cream.
GPD Gallons per day
GPY Gallons per year
Partner Schreiber employee
HTST High-temperature, short-time (HTST) pasteurized milk typically has a refrigerated shelf life of two to three weeks, whereas ultra-pasteurized milk can last much longer, sometimes two to three months.
Common definitions and abbreviations
EXPECTED GALLONS PER YEAR SAVEDF0R IMPLEMENTED PROJECTS
6 MILLION*EST. BASED ON 5 DAYS PER WEEK / 52 WEEKS PER YEAR.
6

Water Working Group
C O N T E N T S
Our FOCUS: Working Together to Reduce Water
Our PROCESS
Our RECOMMENDATIONCase Study
Our RESULTS
OUR RESULTS
water map category: softened water
water map category: other
* *
* *
* *
* Estimated based on 5 days per week / 52 weeks per year7
Water Working Group
C O N T E N T S
Our FOCUS: Working Together to Reduce Water
Our PROCESS
Our RECOMMENDATIONCase Study
Our RESULTS
OUR RESULTS
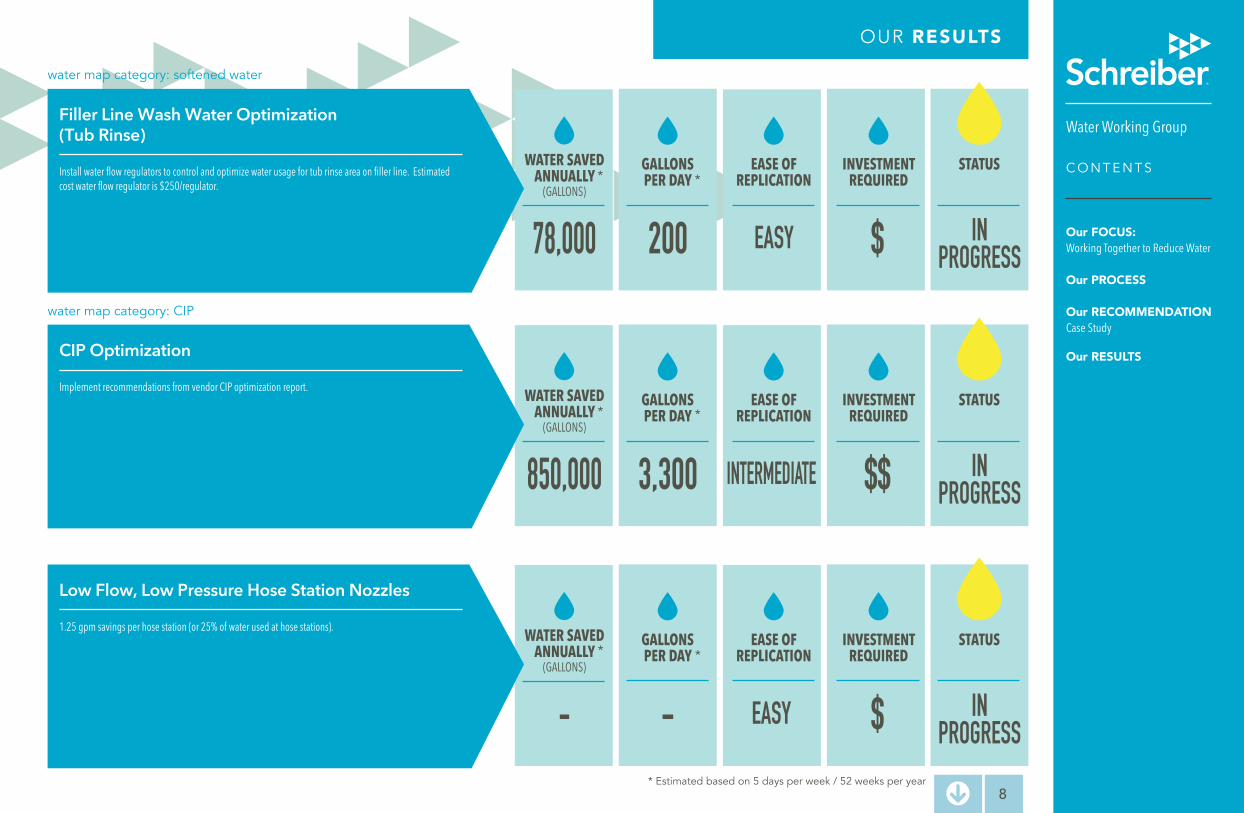
water map category: CIP
* *
* *
* *
water map category: softened water
* Estimated based on 5 days per week / 52 weeks per year8
Water Working Group
C O N T E N T S
Our FOCUS: Working Together to Reduce Water
Our PROCESS
Our RECOMMENDATIONCase Study
Our RESULTS
OUR RESULTS
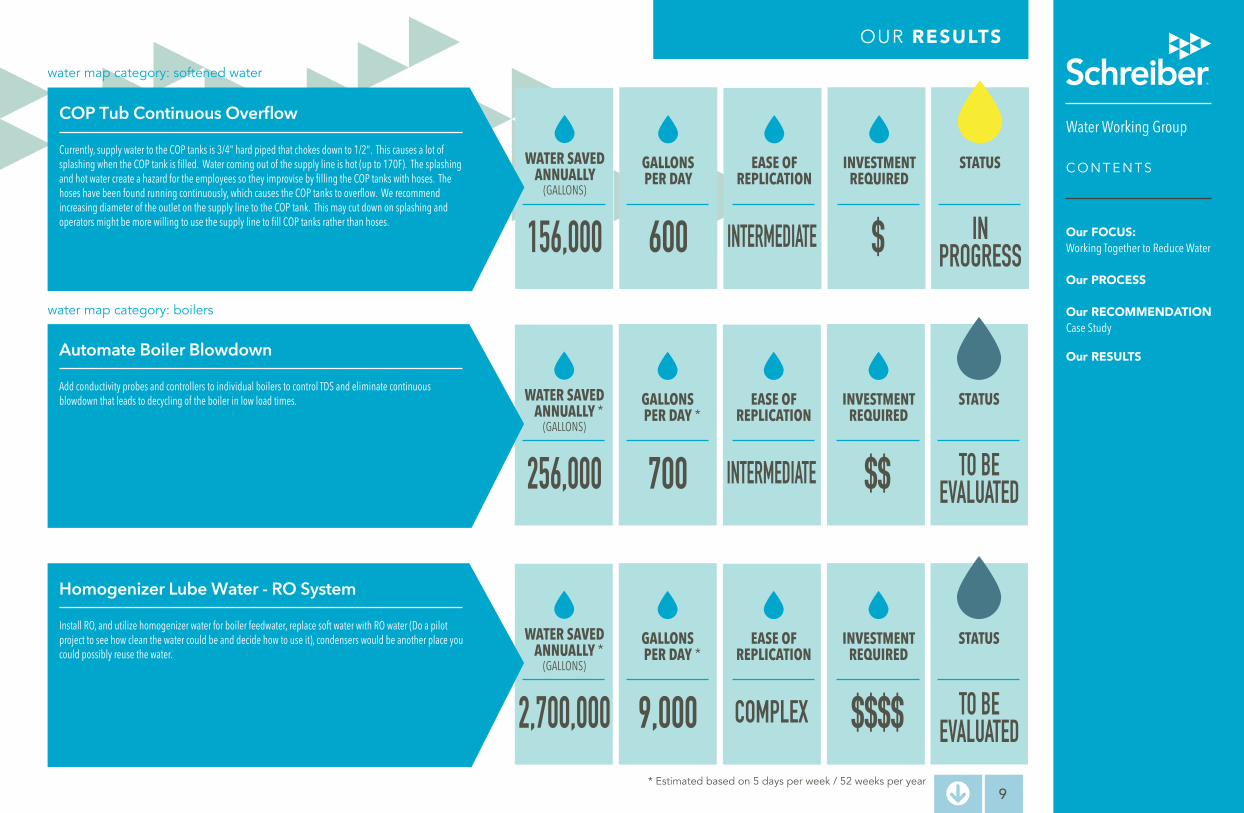
water map category: boilers
* *
* *
* *
water map category: softened water
* Estimated based on 5 days per week / 52 weeks per year9
Water Working Group
C O N T E N T S
Our FOCUS: Working Together to Reduce Water
Our PROCESS
Our RECOMMENDATIONCase Study
Our RESULTS
OUR RESULTS
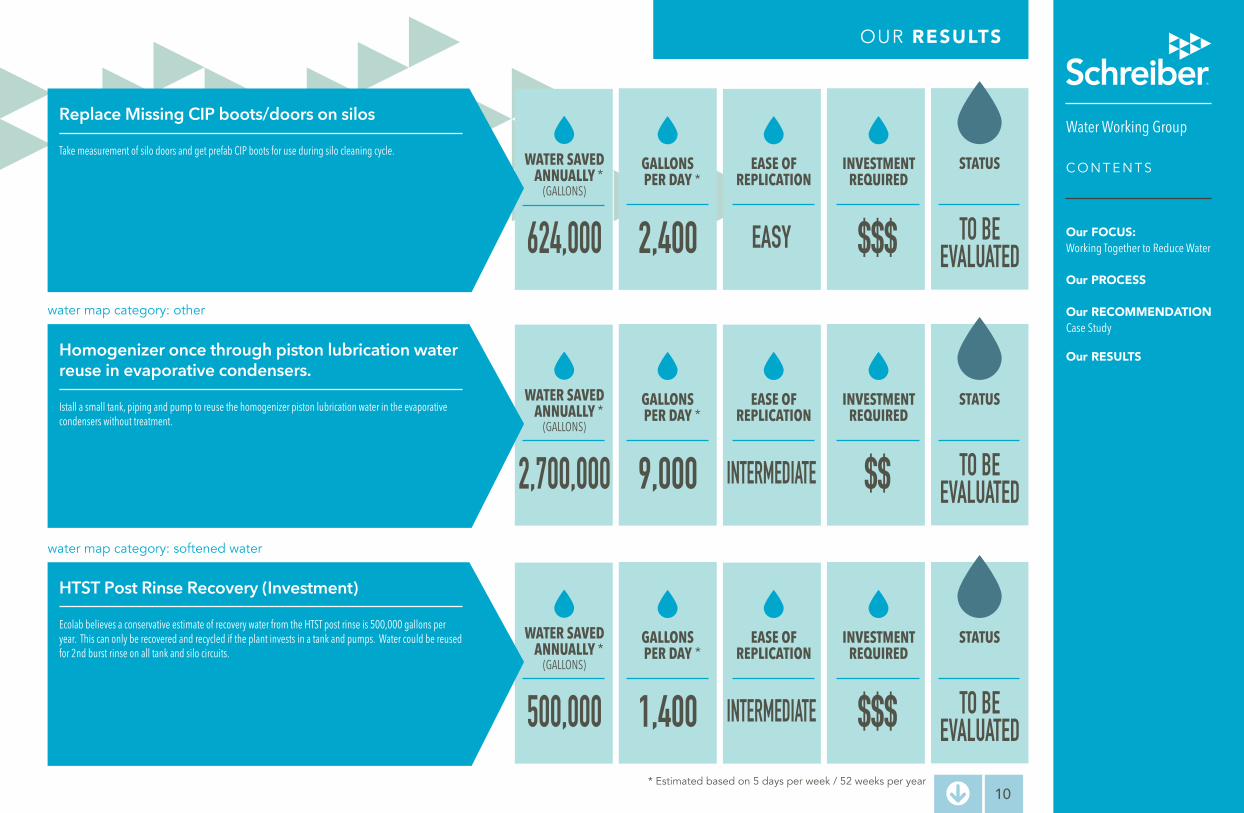
water map category: other
water map category: softened water
* *
* *
* *
* Estimated based on 5 days per week / 52 weeks per year10
Water Working Group
C O N T E N T S
Our FOCUS: Working Together to Reduce Water
Our PROCESS
Our RECOMMENDATIONCase Study
Our RESULTS
SHARE THE GOOD NEWS
Our Sustainability Working Group is dedicated to assisting suppliers and industry leaders in communicating the potential positive impacts of this case study. Contact us for additional documentation, presentations and analysis to guide you as we continue to strengthen our sustainability partnership together.
Schreiber Foods 400 N Washington Street Green Bay, WI 54301 920-437-7601 Email: [email protected]
11

Water Working Group Report 2016

WORKING TOGETHER TO REDUCE WATER
Water reduction is important to Schreiber Foods and is a key component of our sustainability program. Our customers expect us to set water reduction goals and work to meet or exceed our objectives. That’s why we’ve recently joined forces with our suppliers and industry leaders to reduce water usage on a continuous basis.
OU
R F
OC
US
“We never know the worth of water till the well is dry.”
-Thomas Fuller

WATER WASTE WORKING GROUP
Schreiber’s formal sustainability journey started in 2006. The initial focus of the program was to analyze, set goals and reduce our carbon footprint at each of our locations around the globe. Since then, we’ve learned our suppliers play a significant role in the life cycle of the food we provide.
We believe integrating sustainable practices throughout the supplier network requires a collaborative approach. As a result, Schreiber is developing and refining a comprehensive and sustainable supplier program, which includes supplier working groups. Working groups are agile teams of suppliers and industry leaders who face challenges to reduce costs and ecological impacts while sharing best practices.
Members of a working group look for innovative solutions with measurable results within a specific period of time. Previous working groups have focused on transportation and zero-waste initiatives. Most recently, the Water Supplier Working Group explored opportunities to reduce water usage, an important sustainability initiative for all of us.
To identify water reduction opportunities, it’s important to:
• Assess water usage by conducting a study to determine how and where water is used in facilities.
• Track actual water flow and usage by day and month to get a complete picture of water usage in facilities.
• Evaluate times and areas of high usage and develop water savings projects that can be put in place to reduce overall water usage.
• Evaluate each project’s capital investment and cost savings to determine its feasibility before ranking for implementation.

Tools and best practices for water measurement/metering:The first step in any case study is to accurately measure and/or estimate water usage in different areas of a plant. At minimum, a plant that purchases water should be able to obtain incoming water usage from water supply meters. A plant with a wastewater treatment system also will commonly measure effluent flow. Having accurate flow measurement is essential in mapping water usage at a plant.
Water use measurement varied at facilities represented by members of the Water Supplier Working Group. Several suppliers relied on basic monitoring, like an incoming water meter. Other suppliers installed meters on water softeners, boilers, production areas and departments, for example, to measure water usage during various stages
of production. One supplier had a custom modeling system that closely estimated each facility’s water usage.
The group concurred that regularly checking a plant’s metrics is crucial to making progress on water reduction. Real-time monitoring can help reduce water usage and pinpoint areas of concern faster, but it is expensive to implement.
Best Water Reduction Practices: The group discussed the idea of developing a best practices guide, but decided it would be better to conduct a case study and instead focus on steps facilities can take to identify and implement water savings practices.
OUR PROCESS
Members of the Water Supplier Working Group included Schreiber Foods partners (employees) from our home office and two facilities, along with representatives from five suppliers that provide us with everything from ingredients to sanitation chemicals. Project deliverables included:
Identifying tools and best practices for water measurement/metering.
Listing best practices (feasible and non-feasible) for reducing water use at a facility.
Conducting a case study at one or more plant locations to identify potential water reduction opportunities that could be implemented across facilities.
1
2
3

OUR RECOMMENDATION
WATER MAP- PLANT CASE STUDY
Case Study
The group conducted a case study for a plant in California that checked some water meters weekly and others on a monthly basis. The plant measured wastewater flow daily. As part of the case study, the plant was asked to reduce its water usage by 28 percent from 2014.
Members of the working group visited the plant to conduct water mapping and identify water reduction projects. The team also enlisted the help of the plant’s chemical provider to help identify water savings projects. In addition, the group evaluated a water and energy savings study performed by the plant’s utilities provider.
The first step was to develop a water map of the facility to determine:
• Where water is used at the plant.• Where water is measured, including meter locations.• The estimated amount of water used in processes
where water usage is not measured.
A. Clean-in-place circuits – Worked with the chemical vendor to determine the amount of water used for each circuit, based on the system’s programming and how often the circuits are run.
B. Other water uses without meters – Using a known-size container and a watch or timer, find a place to measure water being used or lost. Estimate the water flow rate and number of hours a day the equipment is running to get an approximate total. Hose stations and leaks on process equipment are two examples of places that could benefit from this method to estimate water use.
C. After calculating the measured and estimated water data to fill in the water mapping, make estimates on other items left that can be subtracted from the meters or estimates to determine a final amount.
TO THE RIGHT is the water map for our case study facility.

OUR RESULTS
How did we do it?
Through our site visit, along with recommendations by our chemical manufacturer and utility study, we identified and prioritized water savings projects. Projects were ranked based on water savings, ease of implementation and capital required.
As of March 2016, the facility has reduced its total water usage by 25,000 gallons per day – or 28 percent – while increasing production at the same time. We have achieved our goal of 28 percent water reduction.
CIP Clean-in-place (CIP) is a method of cleaning the interior surfaces of pipes, vessels, process equipment, filters and associated fittings, without disassembly
COP Clean Out of Place (COP) is a method of cleaning parts, pipes and process equipment in tanks or tubs where disassembly is required.
RO Reverse osmosis (RO) is a water purification technology that uses a semipermeable membrane to remove ions, molecules, and larger particles from water.
Silo Dairy word for an enclosed tank used to store dairy products like milk or cream
GPD Gallons per day
GPY Gallons per year
Partner Schreiber employee
HTST High-temperature, short-time (HTST) pasteurized milk typically has a refrigerated shelf life of two to three weeks, whereas ultra-pasteurized milk can last much longer, sometimes two to three months.
Common definitions and abbreviations
EXPECTED GALLONS PER YEAR SAVEDF0R IMPLEMENTED PROJECTS
6 MILLION*EST. BASED ON 5 DAYS PER WEEK / 52 WEEKS PER YEAR.

OUR RESULTS
water map category: softened water
water map category: other
* *
* *
* *
* Estimated based on 5 days per week / 52 weeks per year

OUR RESULTS
water map category: CIP
* *
* *
* *
* Estimated based on 5 days per week / 52 weeks per year
water map category: softened water

OUR RESULTS
water map category: boilers
* *
* *
* *
* Estimated based on 5 days per week / 52 weeks per year
water map category: softened water

OUR RESULTS
water map category: other
water map category: softened water
* *
* *
* *
* Estimated based on 5 days per week / 52 weeks per year

SHARE THE GOOD NEWS
Our Sustainability Working Group is dedicated to assisting suppliers and industry leaders in communicating the potential positive impacts of this case study. Contact us for additional documentation, presentations and analysis to guide you as we continue to strengthen our sustainability partnership together.
Schreiber Foods P.O. Box 19010 Green Bay, WI 54307-9010 920-437-7601 Email: [email protected]