our ref: p-red16-054/eb/r1/rev0 15 - coventry
TRANSCRIPT
Our Ref: P-RED16-054/EB/R1/Rev0Client Ref:
15th August 2016
Ian LivingstonTerex ConstructionPrologis PkCentral BoulevardKeresley EndCoventry CV6 4BX
Dear Ian
Re: Emissions Monitoring
Please find enclosed a copy of your report for the monitoring carried out during May 2016.
I trust the enclosed is satisfactory but if you have any questions please contact me on the numbers below or directly on 07971 628431.
Yours sincerely
Elena Berek BSc (Hons), MSc, CSci, CChem MRSCDirector

PROJECT TEAM
Project work carried out by: Elena Berek – Team Leader
Philip Butler – Env Consultant
Report prepared by: Elena Berek - Director
Signature: _______
Date: 7th June 2016
Report reviewed by: Philip Butler - Director
Signature:
Date: 9th June 2016
Report authorised by: Philip Butler
Signature:
Date: 9th June 2016

MAY 2016
EMISSIONS MONITORING
REPORT
Ian LivingstonTerex Construction
Prologis PkCentral Boulevard
Keresley EndCoventry CV6 4BX
Tel: 02476 339634
Prepared By
Redwing Environmental LtdUnit 7, Manor Road Business Park
Manor RoadAtherstone
Warwickshire CV9 1TE
Tel: 0844 686 7000 – Fax: 0844 686 7070
Report Number P-RED16-054/EB/R1/Rev0
7th June 2016

Contents
Contents
Executive Summary
1.0 Introduction Page 1
1.0 Monitoring Programme Pages 1 - 2
1.5 Monitoring Results, comparison to emission limits Pages 3 – 5
2.0 Supporting Info Page 6
2.1 General Info Page 6
2.1.1 MCerts information Page 6
2.2 Methods Pages 6 – 7
3.0 Quality Assurance Page 8
4.0 Disclaimer Page 8
Appendix A – Particulate, Isocyanate & Velocity Results Appendix Pages 1 to 35
Appendix B – VOC Raw Data
Appendix C – VOC Charts
Calibration Certificates are available upon request
Appendix Pages 36 to 40
Appendix Pages 41 to 45

Terex Construction Redwing Environmental Ltd
EXECUTIVE SUMMARY (Page 1 of 1)
The following document details the emissions to air monitoring survey undertaken by Elena Berek & Philip Butler of Redwing Environmental Ltd at Terex Construction on the 4th to the 6th May 2016.
All results pertain to the dates monitored only.
A summary of results is shown below:-
Emission point referenceStack No
Total Particulate Matter at reference conditions
(mg/m3)
* Highest 30 minute mean
VOC at reference conditions
(mg/m3)
Isocyanate Concentration at reference conditions
(mg/m3)
Velocity corrected to
reference conditions
(m/s)
Volume flow corrected to
reference conditions
(m3/hr)Primer Spray Booth
12.00 ± 0.36 -- -- 8.2 59,416
Primer Spray Booth 2
2.30 ± 0.41 -- -- 8.6 61,896
PrimerFlash-off
0.50 ± 0.15 -- -- 9.3 16,781
Topcoat Spray Booth 1
37.9 ± 0.15 -- <0.04 7.0 50,577
Topcoat Spray Booth 2
1.00 ± 0.13 -- <0.04 7.8 56,158
Topcoat Flash-off 5.00 ± 0.89 -- <0.04 12.5 35,452
Topcoat Curing Oven
1.90 ± 0.45 -- <0.04 12.8 92,711
Preparation Booth 1 0.19 ± 0.13 -- -- 12.6 17,531
Preparation Booth 2 0.52 ± 0.16 -- -- 13.0 18,007
Spray Bake Booth 1 -- -- <0.02 13.0 23,463
Spray Bake Booth 2 -- -- <0.02 13.1 23,685
Scissor 1 Booth 1 4.90 ± 0.92 79.9 ± 4.1(67.8)
-- 9.2 12,790
Scissor 1 Booth 2 26.4 ± 0.92 49.0 ± 2.6(44.0)
-- 9.5 13,213
Scissor 1 Oven 0.58 ± 0.22 -- -- 6.6 751
Scissor 2 Booth 1 14.9 ± 0.56 22.5 ± 1.2(20.2)
-- 8.7 12,085
Scissor 2 Booth 2 3.90 ± 0.29 80.4 ± 4.1(23.9)
-- 7.8 10,739
Scissor 2 Oven 0.43 ± 0.19 -- -- 5.6 632
* Figure in brackets represent the average VOC for the duration of the monitoring
NOTE 1: Reference conditions are standard Temperature (273K) and standard pressure (101.3kPa), without correction for water vapour

Terex Construction Redwing Environmental Ltd
P-RED16-054/EB/R1/Rev0Page 1 of 8
1.0 INTRODUCTION
1.1 The exhausts listed below were monitored with respect to quotation Q-RED16-054/EB/v0 for the compliance check monitoring of emissions to air. The substances requested for monitoring at each emission point are listed below:
Monitoring Programme
Stack reference/Proposed method
Total Particulate Matter
BS EN 13284-1
Volatile Organic Compounds
BS EN 12619
Isocyanates
USEPA CTM36
Main Paint Facility
Primer spray booth - 1
Primer spray booth – 2
Primer Flash off
Topcoat Spray booth -1
Topcoat spray booth – 2
Topcoat Flash off
Topcoat Curing Oven
Preparation Booth 1
Preparation Booth 2
Spray Bake Booth 1
Spray Bake Booth 2
Scissor 1 Booth 1
Scissor 1 Booth 2
Scissor 1 Oven
Scissor 2 Booth 1
Scissor 2 Booth 2
Scissor 2 Oven
1.2 Terex United Kingdom Limited operate a metal and plastic coating process at their site in Coventry, the process is governed by the Secretary of States Process Guidance Note PG6/23 – Coating of Metal and Plastic.

Terex Construction Redwing Environmental Ltd
P-RED16-054/EB/R1/Rev0Page 2 of 8
1.3 The emission limits are listed below:
Process Guidance Note PG6/23: Coating of Metal and Plastic
EMISSION LIMITS
ANALYTE TOTAL PARTICULATE
TOTAL VOC TOTAL ISOCYANATES
Emission Limit 50 mg/m 150 mg/m 0.1mg/m3
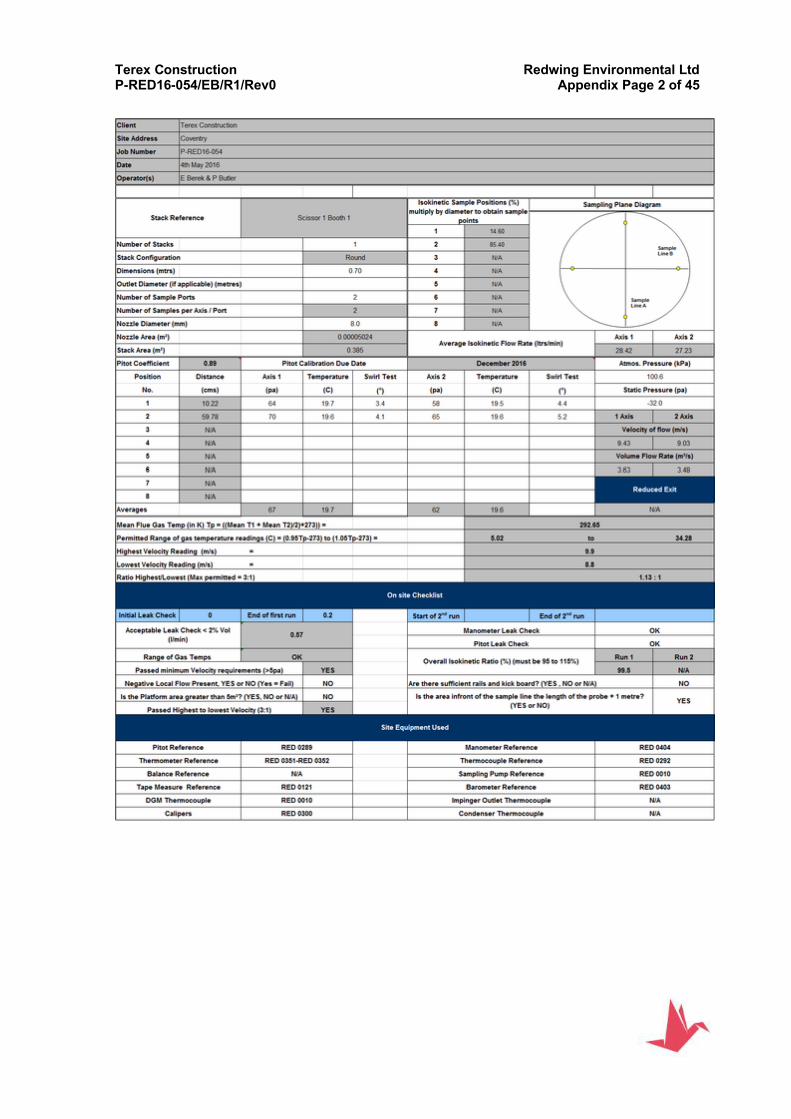
1.4 The velocity and temperature profile were within the required parameters of 3:1 metres/second and ± 1% for temperature profile. This information indicates that the sample ports are in ideal positions to collect the samples under representative conditions.

Terex Construction Redwing Environmental Ltd
P-RED16-054/EB/R1/Rev0Page 3 of 8
1.5 Monitoring Results
Emission Point
Reference
Substance to be Monitored
Emission Limit Value
Periodic Monitoring
Result
Units Reference Conditions 273 K, 101.3
kPa
Date of Sampling
Start and End Times
Monitoring Method
Reference
Operating Status
Primer Spray Booth 1
Total Particulate Matter
50 2.00 ± 0.36 mg/m3 273K, 101.3kPa
05/05/16 0910 – 1010 BS EN 13284-1 Normal
Primer Spray Booth 2 Total Particulate
Matter50 2.30 ± 0.41 mg/m3 273K,
101.3kPa05/05/16 1022 – 1122 BS EN 13284-1 Normal
Primer Flash-off
Total Particulate Matter
50 0.50 ± 0.15 mg/m3 273K, 101.3kPa
05/05/16 1140 - 1240 BS EN 13284-1 Normal
Top Coat Spray Booth 1
Total Particulate Matter
50 37.9 ± 0.15 mg/m3 273K, 101.3kPa 05/05/16 0921 – 1021
BS EN 13284-1Normal
Isocyanates 0.1 <0.04 mg/m3 USEPA 36
Top Coat Spray Booth 2
Total Particulate Matter
50 1.00 ± 0.13 mg/m3
273K, 101.3kPa
05/05/16 1034 - 1134BS EN 13284-1
Normal
Isocyanates 0.1 <0.04 mg/m3 USEPA 36

Terex Construction Redwing Environmental Ltd
P-RED16-054/EB/R1/Rev0Page 4 of 8
Emission Point Reference
Substance to be Monitored
Emission Limit Value
Periodic Monitoring
Result
Units Reference Conditions 273
K, 101.3 kPa
Date of Sampling
Start and End Times
Monitoring Method
Reference
Operating Status
Topcoat Flash-offTotal Particulate
Matter50 5.00 ± 0.89 mg/m3
273K, 101.3kPa 05/05/16 1147 - 1247BS EN 13284-1 Normal
Isocyanates 0.1 <0.04 mg/m3 USEPA 36
Topcoat Curing Oven Total Particulate Matter
50 1.90 ± 0.45 mg/m3 273K, 101.3kPa 05/05/16 1322 – 1422 BS EN 13284-1 Normal
Preparation Booth 1 Total Particulate Matter
50 0.19 ± 0.13 mg/m3 273K, 101.3kPa 06/05/16 0840 – 0940 BS EN 13284-1 Normal
Preparation Booth 2 Total Particulate Matter
50 0.52 ± 0.16 mg/m3 273K, 101.3kPa 06/05/16 0945 – 1045 BS EN 13284-1 Normal
Spray Bake Booth 1 Isocyanates 0.1 <0.02 mg/m3 273K, 101.3kPa 06/05/16 0825 – 0925 USEPA 36 Normal
Spray Bake Booth 2 Isocyanates 0.1 <0.02 mg/m3 273K, 101.3kPa 06/015/16 0933 – 1033 USEPA 36 Normal
Scissor 1 Booth 1
Total Particulate Matter
50 4.90 ± 0.92 mg/m3
273K, 101.3kPa 04/05/161045 – 1145 BS EN 13284-1
Normal
Volatile Organic Compounds
150 79.9 ± 4.1 mg/m3 1045 – 1145 BS EN 12619
Scissor 1 Booth 2Total Particulate
Matter50 26.4 ± 0.92 mg/m3
273K, 101.3kPa 04/05/161155 – 1255 BS EN 13284-1 Normal
Volatile Organic Compounds
150 49.0 ± 2.6 mg/m3 1145 - 1245 BS EN 12619

Terex Construction Redwing Environmental Ltd
P-RED16-054/EB/R1/Rev0Page 5 of 8
Emission Point Reference
Substance to be Monitored
Emission Limit Value
Periodic Monitoring
Result
Units Reference Conditions 273 K, 101.3
kPa
Date of Sampling
Start and End Times
Monitoring Method
Reference
Operating Status
Scissor 1 Oven Total Particulate Matter
50 0.58 ± 0.22 mg/m3 273K, 101.3kPa
04/05/16 1315 - 1415 BS EN 13284-1 Normal
Scissor 2 Booth 1Total Particulate
Matter50 14.9 ± 0.56 mg/m3
273K, 101.3kPa 04/05/16
1050 – 1150 BS EN 13284-1 Normal
Volatile Organic Compounds
150 22.5 ± 1.2 mg/m3 1252 – 1352 BS EN 12619 Normal
Scissor 2 Booth 2Total Particulate
Matter50 3.90 ± 0.29 mg/m3
273K, 101.3kPa
04/05/161200 – 1300 BS EN 13284-1 Normal
Volatile Organic Compounds
150 80.4 ± 4.1 mg/m3 1353 – 1453 BS EN 12619 Normal
Scissor 2 Oven Total Particulate Matter
50 0.43 ± 0.19 mg/m3 273K, 101.3kPa
04/05/16 1312 - 1412 BS EN 13284-1 Normal
Terex Construction Redwing Environmental Ltd
P-RED16-054/EB/R1/Rev0Page 6 of 8
2 Supporting Information (Held by Redwing Environmental Ltd)
2.1 General Information
2.1.1 Redwing Environmental Ltd staff detailsElena Berek and Philip Butler
2.2 Redwing Environmental Ltd method details
2.2.1 Volatile organic compounds (BS EN 12619: 2013)
2.2.2 Monitoring to determine VOC emission concentrations was in accordance with BS EN 12619: 2013.
2.2.3 Volatile organic compound concentrations were measured using a Signal portable heated VOC analyser. The analyser works by burning the gas sample in a hydrogen flame. This ionises any organic compounds present and the current produced across an electric field is proportional to the number of carbon atoms.
2.2.4 The analyser and heated line were zeroed and calibrated with a test gas (80 ppm and or 800ppm propane) prior to each sampling run. VOC sampling was undertaken over a period of at least 60 minutes to cover any process variation.
2.2.5 All data was logged onto a Grant Squirrel data logger set at 5 second logging.
2.2.6 A heated line from the sample point to analyser was used to ensure that condensation did not occur leading to the loss of sample concentration.Volatile organic compounds.
2.3 Stack Velocity, Pressure and Temperature Measurements
2.3.1 The stack velocity, pressure and temperature will be measured by full pitot traverses of the duct using the points provided. Measurements will be taken at the relevant positions based on the particulate standard followed.
2.4 Leak tests for extractive techniques
2.4.1 All extractive-sampling techniques were tested for leaks before sampling proceeded. Any leaks present were eliminated prior to sampling and will be reported.
2.4.2 Leak checks are carried out during the calibrating procedure, as the concentration of the calibration gas is known it is readily indentified if air is entering the sample line and diluting the gas.

Terex Construction Redwing Environmental Ltd
P-RED16-054/EB/R1/Rev0Page 7 of 8
2.5 Particulate matter BS EN 13284-1: 2002
2.5.1 Total particulate matter was sampled using a Zambelli isokinetic sampling system in accordance with BS EN 13284-1: 2002 – Determination of Low Range Mass Concentration of dust (< 50mg/m3).
2.5.2 The Zambelli sampling system monitors temperature, static pressure and velocities within the duct using an S-type pitot tube and K-type thermocouple. The sampling rate was continuously monitored and adjusted relative to the duct velocity to ensure isokinetic-sampling conditions were maintained throughout the monitoring period.
2.5.3 Exhaust gases were drawn under isokinetic conditions from the exhaust points using the Zambelli sampling probe, particulate matter was then collected on a pre-weighed glass fibre filter (or most suitable filter for process) contained within the filter cassette holder, and the total particulate matter determined gravimetrically.
2.5.4 It is also necessary to wash the probe and nozzle out with water and then acetone between sampling and the weight of the probe washing added to that collected on the sample filter. Analysis of an acetone/water blank will be carried out and the result corrected accordingly.
2.5.5 The sample positions were calculated with respect to BS EN 13284-1: 2002 –Stationary source emissions – Determination of Low Range Mass Concentration of dust.
2.5.6 Sampling may be carried out internally or externally, the method used will be reported and provided there are no deviations from the method the uncertainty for the monitoring procedure is reported to be within the requirements specified by the Hazardous Waste Directive (HWD) as stated in the Environment Agency Technical Document M2
Uncertainty: + 30%
2.5.7 ISO 9096: 2003 and BS EN 13284-1: 2002 are very similar methods but BS EN 13284-1: 2002 recommends the use of an 8mm nozzle and nozzles less than 6mm should not be used.
2.6 Isocyanates (USEPA CTM 36a)
2.6.1 There are several Isocyanates; these include TDI, MDI, HDI and IPDI. The isocyanate to be monitored is HDI (1,6 – hexamethylene diisocyanate). All Isocyanates follow the same procedure for sampling and analysis.
2.6.2 Isocyanates can be sampled non-isokinetically following MDHS 25 or isokinetically following the USEPA CTM 36
2.6.3 The method used was isokinetic method. A sample probe was placed inside the stack; the sample probe was heated.
2.6.4 The samples are stored in brown glass bottles and submitted for analysis. The samples will be ‘blown down’ to dryness using air and made upto 1ml using the most suitable

Terex Construction Redwing Environmental Ltd
P-RED16-054/EB/R1/Rev0Page 8 of 8
matrix (usually acetonitrile). The sample will then be ready for analysis by HPLC (High Pressure Liquid Chromatography).
3.0 Quality Assurance
3.1 Redwing Environmental Ltd will always endeavour to follow the methods specified in the Environment Agency Technical Guidance M2. Redwing Environmental Ltd is a member of the Source Testing Association (STA) and therefore operates under the STA’s code of practice.
3.2 Redwing Environmental Ltd is accredited to ISO 9001:2008, ISO 14001:2004 and ISO 17025:2005.
4.0 Disclaimer
4.1 Redwing Environmental Ltd confirms that in preparing this report all reasonable skill and care has been exercised.
4.1.1 Unless specifically assigned or transferred within the terms of the agreement, Redwing Environmental Ltd asserts and retains all copyright, and other Intellectual Property Rights, in and over the report and its contents.

Terex Construction Redwing Environmental LtdP-RED16-054/EB/R1/Rev0 Appendix Page 1 of 45
APPENDIX A
Particulate, Isocyanate & Velocity Results
Terex Construction Redwing Environmental LtdP-RED16-054/EB/R1/Rev0 Appendix Page 2 of 45

Terex Construction Redwing Environmental LtdP-RED16-054/EB/R1/Rev0 Appendix Page 3 of 45

Terex Construction Redwing Environmental LtdP-RED16-054/EB/R1/Rev0 Appendix Page 4 of 45

Terex Construction Redwing Environmental LtdP-RED16-054/EB/R1/Rev0 Appendix Page 5 of 45

Terex Construction Redwing Environmental LtdP-RED16-054/EB/R1/Rev0 Appendix Page 6 of 45

Terex Construction Redwing Environmental LtdP-RED16-054/EB/R1/Rev0 Appendix Page 7 of 45

Terex Construction Redwing Environmental LtdP-RED16-054/EB/R1/Rev0 Appendix Page 8 of 45

Terex Construction Redwing Environmental LtdP-RED16-054/EB/R1/Rev0 Appendix Page 9 of 45

Terex Construction Redwing Environmental LtdP-RED16-054/EB/R1/Rev0 Appendix Page 10 of 45

Terex Construction Redwing Environmental LtdP-RED16-054/EB/R1/Rev0 Appendix Page 11 of 45

Terex Construction Redwing Environmental LtdP-RED16-054/EB/R1/Rev0 Appendix Page 12 of 45

Terex Construction Redwing Environmental LtdP-RED16-054/EB/R1/Rev0 Appendix Page 13 of 45

Terex Construction Redwing Environmental LtdP-RED16-054/EB/R1/Rev0 Appendix Page 14 of 45

Terex Construction Redwing Environmental LtdP-RED16-054/EB/R1/Rev0 Appendix Page 15 of 45

Terex Construction Redwing Environmental LtdP-RED16-054/EB/R1/Rev0 Appendix Page 16 of 45

Terex Construction Redwing Environmental LtdP-RED16-054/EB/R1/Rev0 Appendix Page 17 of 45

Terex Construction Redwing Environmental LtdP-RED16-054/EB/R1/Rev0 Appendix Page 18 of 45

Terex Construction Redwing Environmental LtdP-RED16-054/EB/R1/Rev0 Appendix Page 19 of 45

Terex Construction Redwing Environmental LtdP-RED16-054/EB/R1/Rev0 Appendix Page 20 of 45

Terex Construction Redwing Environmental LtdP-RED16-054/EB/R1/Rev0 Appendix Page 21 of 45

Terex Construction Redwing Environmental LtdP-RED16-054/EB/R1/Rev0 Appendix Page 22 of 45

Terex Construction Redwing Environmental LtdP-RED16-054/EB/R1/Rev0 Appendix Page 23 of 45

Terex Construction Redwing Environmental LtdP-RED16-054/EB/R1/Rev0 Appendix Page 24 of 45

Terex Construction Redwing Environmental LtdP-RED16-054/EB/R1/Rev0 Appendix Page 25 of 45

Terex Construction Redwing Environmental LtdP-RED16-054/EB/R1/Rev0 Appendix Page 26 of 45

Terex Construction Redwing Environmental LtdP-RED16-054/EB/R1/Rev0 Appendix Page 27 of 45

Terex Construction Redwing Environmental LtdP-RED16-054/EB/R1/Rev0 Appendix Page 28 of 45

Terex Construction Redwing Environmental LtdP-RED16-054/EB/R1/Rev0 Appendix Page 29 of 45

Terex Construction Redwing Environmental LtdP-RED16-054/EB/R1/Rev0 Appendix Page 30 of 45

Terex Construction Redwing Environmental LtdP-RED16-054/EB/R1/Rev0 Appendix Page 31 of 45

Terex Construction Redwing Environmental LtdP-RED16-054/EB/R1/Rev0 Appendix Page 32 of 45

Terex Construction Redwing Environmental LtdP-RED16-054/EB/R1/Rev0 Appendix Page 33 of 45

Terex Construction Redwing Environmental LtdP-RED16-054/EB/R1/Rev0 Appendix Page 34 of 45

Terex Construction Redwing Environmental LtdP-RED16-054/EB/R1/Rev0 Appendix Page 35 of 45

Terex Construction Redwing Environmental LtdP-RED16-054/EB/R1/Rev0 Appendix Page 36 of 45
APPENDIX BVOC Raw Data

Terex Construction Redwing Environmental LtdP-RED16-054/EB/R1/Rev0 Appendix Page 37 of 45

Terex Construction Redwing Environmental LtdP-RED16-054/EB/R1/Rev0 Appendix Page 38 of 45

Terex Construction Redwing Environmental LtdP-RED16-054/EB/R1/Rev0 Appendix Page 39 of 45

Terex Construction Redwing Environmental LtdP-RED16-054/EB/R1/Rev0 Appendix Page 40 of 45

Terex Construction Redwing Environmental LtdP-RED16-054/EB/R1/Rev0 Appendix Page 41 of 45
APPENDIX C
VOC Charts

Terex Construction Redwing Environmental LtdP-RED16-054/EB/R1/Rev0 Appendix Page 42 of 45

Terex Construction Redwing Environmental LtdP-RED16-054/EB/R1/Rev0 Appendix Page 43 of 45

Terex Construction Redwing Environmental LtdP-RED16-054/EB/R1/Rev0 Appendix Page 44 of 45

Terex Construction Redwing Environmental LtdP-RED16-054/EB/R1/Rev0 Appendix Page 45 of 45