our roadmap into the future
TRANSCRIPT

Our Roadmap into the Future.
xecuteEvolveExpandE
Annual Report 2017-18

For over 20 years, we have leveraged our EPC expertise, equipment inventory, IT infrastructure and in-house integration to set an unprecedented track record of executing some of the most challenging road infrastructure projects across 15 states in India.
We are now realigning our business model and expanding operational focus areas to move forward with greater momentum.
We are –
Shifting focus to HAM (hybrid annuity model) projects
Bidding for larger and complex projects having better margins,
Investing in better technologies and equipment and building in-house and people competencies to enhance operational efficiency,
Diversifying to newer segments of rail and expanding to newer geographies.
We believe, these strategic will enable us to improve balance sheet health, reduce business cyclicality, enhance business sustainability and generate good profits.
Execute-Evolve-ExpandThis is our roadmap into the future with a single-minded focus on maximising stakeholders’ worth.
26 Directors’ Report
Statutory Reports26-46
02 An Integrated EPC Company Striving to Bridge India’s Infrastructure Gap
04 Turning Stepping Stones in Milestones
06 Performing Sustainbly Over the Years
07 Standalone Financial Highlights
08 A message from the Managing Director
10 Board of Directors
11 Senior Management Team
12 Key Ongoing Projects of FY 2017-18
14 Built on a Solid Foundation
16 Growing Industry Momentum
18 Building the Roadmap to a Better Future
19 Focus on Road EPC Business
20 Enhance In-house Competencies and Focus on Technology and Operational Efficiency
22 Diversify Within the EPC Space
23 Building an Engaging and Learning Organisation
24 Awards and Accolades
25 Corporate Information
Corporate Overview01-25
47 Independent Auditors’ Report
54 Balance Sheet
55 Statement of Profit and Loss
56 Statement of Changes in Equity
57 Cash Flow Statement
59 Notes to the Financial Statements
119 Independent Auditors’ Report
124 Balance Sheet
125 Statement of Profit and Loss
126 Statement of Changes in Equity
128 Cash Flow Statement
130 Notes to the Financial Statements
Financial Statements47-200
Standalone
Consolidated
Forward looking statements
In this Annual Report, we have disclosed forward-looking information to enable investors to comprehend our prospects and take investment decisions. This report and other statements - written and oral - that we periodically make contain forward-looking statements that set out anticipated results based on the management’s plans and assumptions. We have tried, wherever possible, to identify such statements by using words such as ‘anticipate’, ‘estimate’, ‘expects’, ‘projects’, ‘intends’, ‘plans’, ‘believes’, and words of similar substance in connection with any discussion of future performance. We cannot guarantee that these forward-looking statements will be realised, although we believe we have been prudent in our assumptions. The achievements of results are subject to risks, uncertainties and even inaccurate assumptions. Should known or unknown risks or uncertainties materialise, or should underlying assumptions prove inaccurate, actual results could vary materially from those anticipated, estimated or projected. Readers should keep this in mind. We undertake no obligation to publicly update any forward-looking statement, whether as a result of new information, future events or otherwise.
To view the report online or download it, please log on to www.grinfra.com

Late Shri Gumani Ram AgarwalBorn on 22.05.1930 | Demise : 22.09.2017
A visionary and the fore founder of M/s. G R Infraprojects Limited, you are an idol for many. Your love, goodness and compassion have always shown higher level of being.
Your life was inspirational, helping us develop strong will power to work ethically. You have always believed in sacrificing for the society and taught us the same.
ॐ ईशा वास्यमिदि ्सवर् ्यत्किं च जग््यािं जगत,तेन ््यके्न भिंजुीथा िा गधृ: कस्य तसवधदनि ्|
(Whatsoever is there in the entire universe is pervaded and controlled by God. By renouncing these, one shall enjoy pure delight. One should resist coveting the wealth of any creature unjustly.)
G R Infraprojects is an outcome of your pious ideology. Your preaching ‘today is better than yesterday and tomorrow shall be better than today’ has encouraged us to get better every passing day. You have been a growth engine and we remain thankful for your invaluable contribution.
We remain committed to reaching new heights and envisaging new horizons that you envisioned. You may not be with us today, but your memories and teachings will always be a guiding force for us on our path to progress and excellence.
In MemoriamFrom the entire G R Infraprojects Limited family

02
An Integrated Epc company Striving to Bridge India’s Infrastructure Gap
Our business areas
What we doProvide EPC services by undertaking detailed engineering design, procuring necessary equipment and materials and constructing a functioning facility
CompetenciesConstruction of state and national highways, bridges, culverts, flyovers, airport runways, rail over-bridges
New ventures Railways sector – Construction which includes earthwork, material supply, track linking, bridge construction
What we doDevelop, operate and maintain infrastructure assets, generate revenues through annuities and transfer assets back to the government after end of concession term
What we doProcess bitumen, manufacturethermoplastic road-marking paintand road signage and fabricateand galvanise metal crashbarriers which are required in projects
Facilities • 30,000 MT emulsion facility
and fabrication unit in Udaipur, Rajasthan.
• 30,000 MT emulsion facility in Guwahati, Assam.
• 24,000 MT metal crash barrier fabrication and galvanising unit in Ahmedabad, Gujarat.
Civil constructionDevelop roads and highways on BOT basis Manufacturing activities
Chappara-Gopalganj Project Nagaur-Mukundgarh Project Emulsion Plant, Udaipur
Annual Report 2017-18
G R Infraprojects Limited
03
COR
PO
RATE O
VER
VIEW
Statu
tor
y rep
or
tSFin
an
cial S
tatemen
tS
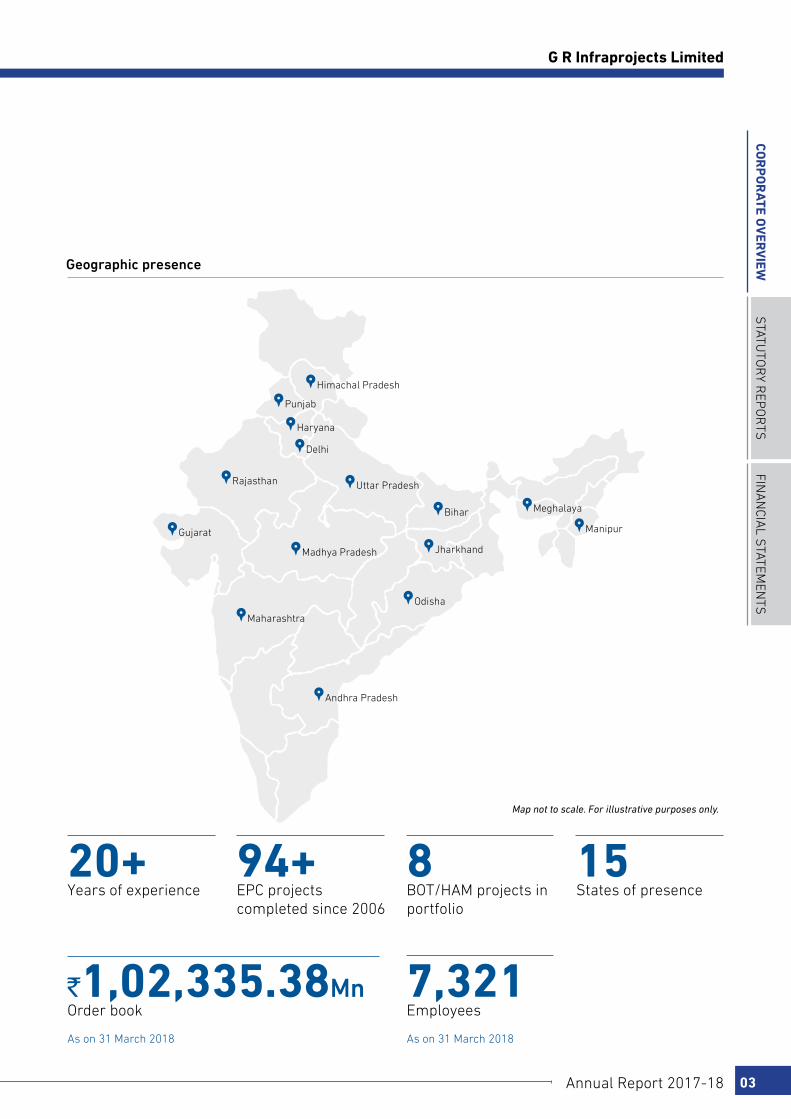
20+ Years of experience
15 States of presence
`1,02,335.38Mn Order book
94+ EPC projects completed since 2006
8 BOT/HAM projects in portfolio
7,321 Employees
Geographic presence
Rajasthan
Madhya Pradesh
Maharashtra
Andhra Pradesh
Punjab
Himachal Pradesh
Haryana
Delhi
Jharkhand
Odisha
Bihar Meghalaya
Manipur
Uttar Pradesh
Gujarat
Map not to scale. For illustrative purposes only.
As on 31 March 2018 As on 31 March 2018
04
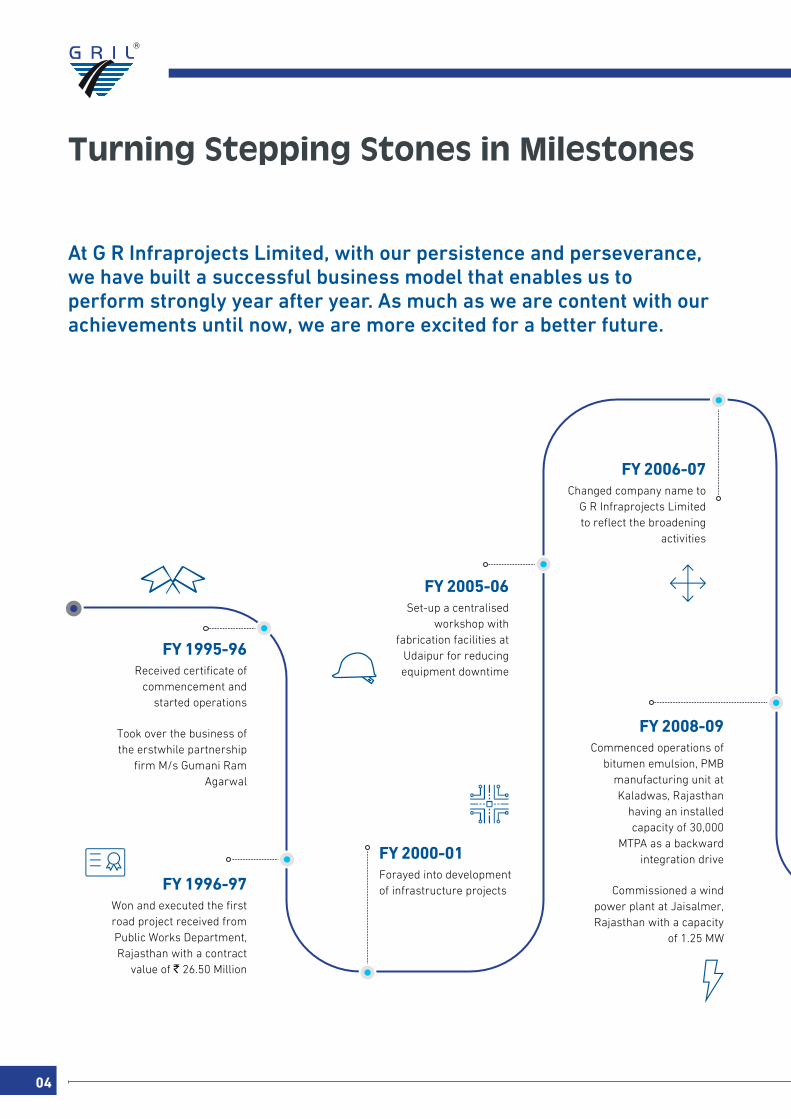
Turning Stepping Stones in Milestones
At G R Infraprojects Limited, with our persistence and perseverance, we have built a successful business model that enables us to perform strongly year after year. As much as we are content with our achievements until now, we are more excited for a better future.
FY 1995-96Received certificate of
commencement and started operations
Took over the business of the erstwhile partnership
firm M/s Gumani Ram Agarwal
FY 2005-06Set-up a centralised
workshop with fabrication facilities at
Udaipur for reducing equipment downtime
FY 2006-07Changed company name to
G R Infraprojects Limited to reflect the broadening
activities
FY 2008-09Commenced operations of
bitumen emulsion, PMB manufacturing unit at Kaladwas, Rajasthan
having an installed capacity of 30,000
MTPA as a backward integration drive
Commissioned a wind power plant at Jaisalmer, Rajasthan with a capacity
of 1.25 MW
FY 2000-01Forayed into development of infrastructure projectsFY 1996-97
Won and executed the first road project received from Public Works Department, Rajasthan with a contract
value of ` 26.50 Million
Annual Report 2017-18
G R Infraprojects Limited
05
COR
PO
RATE O
VER
VIEW
Statu
tor
y rep
or
tSFin
an
cial S
tatemen
tS
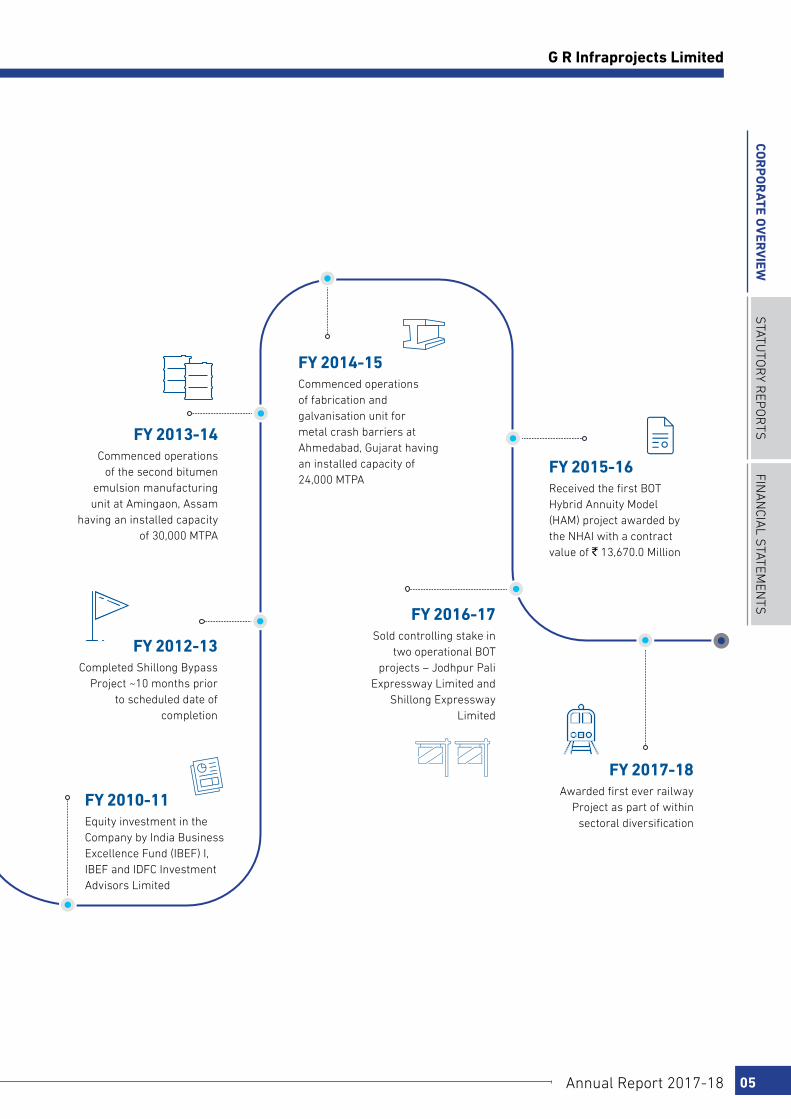
FY 2012-13Completed Shillong Bypass
Project ~10 months prior to scheduled date of
completion
FY 2014-15Commenced operations of fabrication and galvanisation unit for metal crash barriers at Ahmedabad, Gujarat having an installed capacity of 24,000 MTPA
FY 2016-17Sold controlling stake in
two operational BOT projects – Jodhpur Pali
Expressway Limited and Shillong Expressway
Limited
FY 2010-11Equity investment in the Company by India Business Excellence Fund (IBEF) I, IBEF and IDFC Investment Advisors Limited
FY 2013-14Commenced operations
of the second bitumen emulsion manufacturing unit at Amingaon, Assam
having an installed capacity of 30,000 MTPA
FY 2015-16Received the first BOT Hybrid Annuity Model (HAM) project awarded by the NHAI with a contract value of ` 13,670.0 Million
FY 2017-18Awarded first ever railway
Project as part of within sectoral diversification

performing Sustainably Over the Years
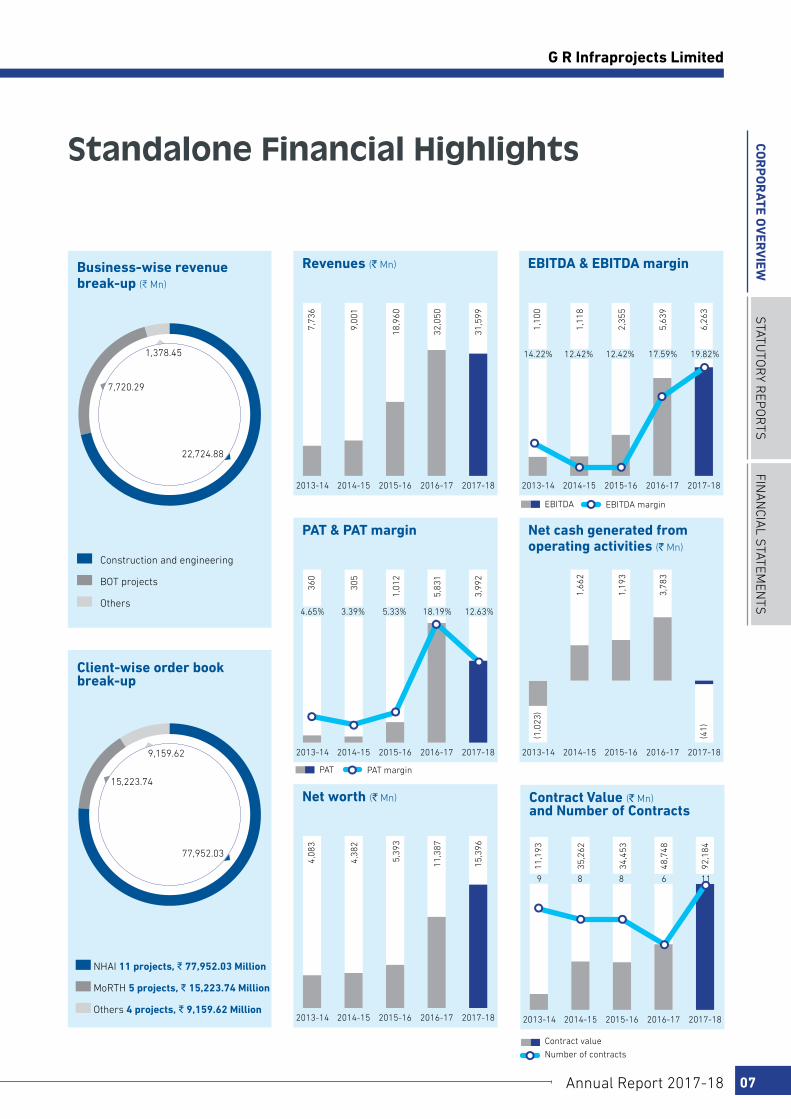
Revenues
42.16%
EBITDA
54.46%
Profit after Tax
82.52%
Key performance indicators (Standalone)
4-year CAGR Growth (FY 2013-14 to FY 2017-18)
06
Nagaur-Mukundgarh Project
Net cash generated from operating activities (` Mn)
2013-14 2014-15 2015-16 2016-17 2017-18
3,78
3
1,19
3
1,66
2
(1,0
23)
Revenues (` Mn)
2013-14 2014-15 2015-16 2016-17 2017-1831
,599
32,0
50
18,9
60
9,00
1
7,73
6
Business-wise revenue break-up (C Mn)
Construction and engineering
BOT projects
Others
Client-wise order book break-up
NHAI 11 projects, D 77,952.03 Million
MoRTH 5 projects, D 15,223.74 Million
Others 4 projects, D 9,159.62 Million
EBITDA & EBITDA margin
2013-14 2014-15 2015-16 2016-17 2017-18
14.22% 12.42% 12.42% 17.59% 19.82%
6,26
3
5,63
9
2,35
5
1,11
8
1,10
0PAT & PAT margin
2013-14 2014-15 2015-16 2016-17 2017-18
4.65% 3.39% 5.33% 18.19% 12.63%
3,99
2
5,83
1
1,01
2
305
360
Net worth (` Mn)
2013-14 2014-15 2015-16 2016-17 2017-18
15,3
96
11,3
87
5,39
3
4,38
2
4,08
3
22,724.88
1,378.45
7,720.29
9,159.62
15,223.74
77,952.03
Standalone Financial Highlights
Contract Value (` Mn) and Number of Contracts
2013-14 2014-15 2015-16 2016-17 2017-18
9 8 6 11
92,1
84
48,7
48
34,4
53
35,2
62
11,1
93
Contract value
Number of contracts
8
PAT PAT margin
EBITDA EBITDA margin
(41)
Annual Report 2017-18
G R Infraprojects Limited
07
COR
PO
RATE O
VER
VIEW
Statu
tor
y rep
or
tSFin
an
cial S
tatemen
tS

08
A message from the Managing Director
It Is wIth GReAt pLeAsuRe thAt I pResent tO yOu the AnnuAL RepORt Of the COMpAny At the end Of yet AnOtheR sAtIsfyInG yeAR. fy 2017-18 In MAny wAys CAn be suMMed As A yeAR Of fOCussInG On GROwth AReAs, whILe COnsOLIdAtInG CORe stRenGths. hAvInG MAde A huMbLe yet COnfIdent stARt, we ARe tOdAy pOsItIOned As An InteGRAted InfRAstRuCtuRe pLAyeR wIth sCALe, InfRAstRuCtuRe And RIGht COMpetenCIes tO sustAIn busIness.
`6,263 Mn An increase by 11.06% over FY 2016-17
EBITDA
New Orders
`92,184 Mn Bagged 11 new orders in FY 2017-18
Annual Report 2017-18
G R Infraprojects Limited
09
COR
PO
RATE O
VER
VIEW
Statu
tor
y rep
or
tSFin
an
cial S
tatemen
tS
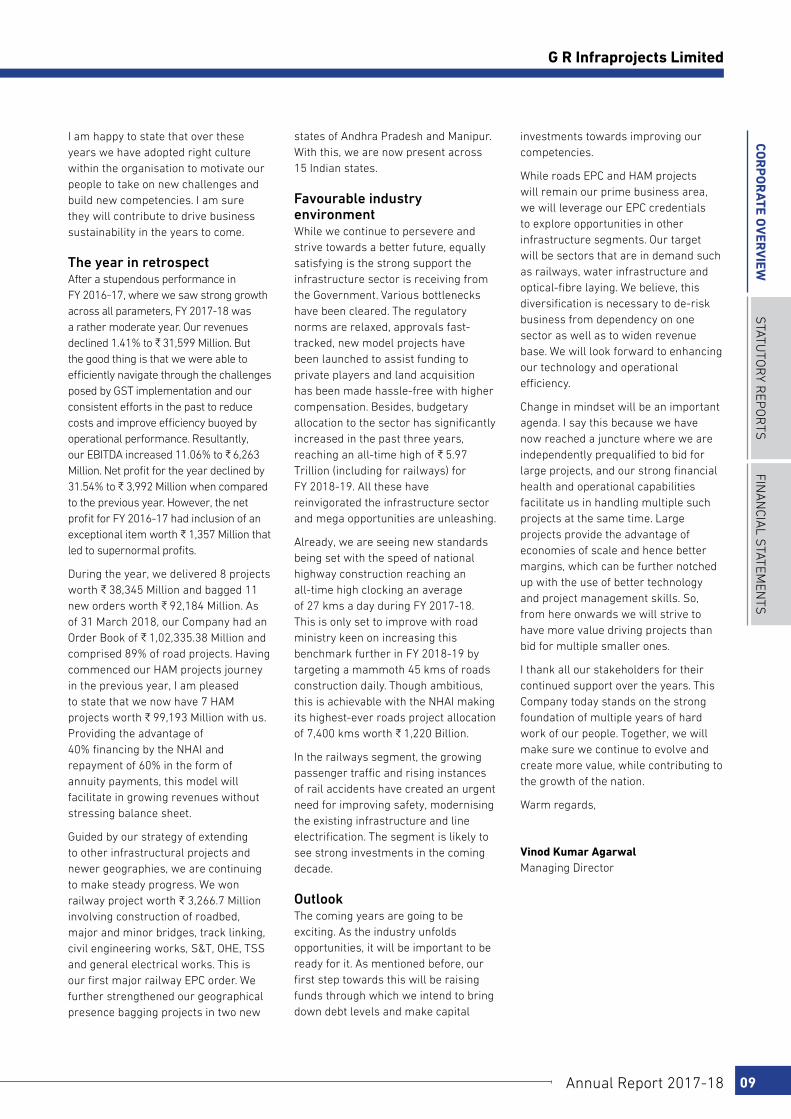
I am happy to state that over these years we have adopted right culture within the organisation to motivate our people to take on new challenges and build new competencies. I am sure they will contribute to drive business sustainability in the years to come.
the year in retrospect After a stupendous performance in FY 2016-17, where we saw strong growth across all parameters, FY 2017-18 was a rather moderate year. Our revenues declined 1.41% to C 31,599 Million. But the good thing is that we were able to efficiently navigate through the challenges posed by GST implementation and our consistent efforts in the past to reduce costs and improve efficiency buoyed by operational performance. Resultantly, our EBITDA increased 11.06% to C 6,263 Million. Net profit for the year declined by 31.54% to C 3,992 Million when compared to the previous year. However, the net profit for FY 2016-17 had inclusion of an exceptional item worth C 1,357 Million that led to supernormal profits.
During the year, we delivered 8 projects worth C 38,345 Million and bagged 11 new orders worth C 92,184 Million. As of 31 March 2018, our Company had an Order Book of C 1,02,335.38 Million and comprised 89% of road projects. Having commenced our HAM projects journey in the previous year, I am pleased to state that we now have 7 HAM projects worth C 99,193 Million with us. Providing the advantage of 40% financing by the NHAI and repayment of 60% in the form of annuity payments, this model will facilitate in growing revenues without stressing balance sheet.
Guided by our strategy of extending to other infrastructural projects and newer geographies, we are continuing to make steady progress. We won railway project worth C 3,266.7 Million involving construction of roadbed, major and minor bridges, track linking, civil engineering works, S&T, OHE, TSS and general electrical works. This is our first major railway EPC order. We further strengthened our geographical presence bagging projects in two new
states of Andhra Pradesh and Manipur. With this, we are now present across 15 Indian states.
favourable industry environmentWhile we continue to persevere and strive towards a better future, equally satisfying is the strong support the infrastructure sector is receiving from the Government. Various bottlenecks have been cleared. The regulatory norms are relaxed, approvals fast-tracked, new model projects have been launched to assist funding to private players and land acquisition has been made hassle-free with higher compensation. Besides, budgetary allocation to the sector has significantly increased in the past three years, reaching an all-time high of C 5.97 Trillion (including for railways) for FY 2018-19. All these have reinvigorated the infrastructure sector and mega opportunities are unleashing.
Already, we are seeing new standards being set with the speed of national highway construction reaching an all-time high clocking an average of 27 kms a day during FY 2017-18. This is only set to improve with road ministry keen on increasing this benchmark further in FY 2018-19 by targeting a mammoth 45 kms of roads construction daily. Though ambitious, this is achievable with the NHAI making its highest-ever roads project allocation of 7,400 kms worth C 1,220 Billion.
In the railways segment, the growing passenger traffic and rising instances of rail accidents have created an urgent need for improving safety, modernising the existing infrastructure and line electrification. The segment is likely to see strong investments in the coming decade.
OutlookThe coming years are going to be exciting. As the industry unfolds opportunities, it will be important to be ready for it. As mentioned before, our first step towards this will be raising funds through which we intend to bring down debt levels and make capital
investments towards improving our competencies.
While roads EPC and HAM projects will remain our prime business area, we will leverage our EPC credentials to explore opportunities in other infrastructure segments. Our target will be sectors that are in demand such as railways, water infrastructure and optical-fibre laying. We believe, this diversification is necessary to de-risk business from dependency on one sector as well as to widen revenue base. We will look forward to enhancing our technology and operational efficiency.
Change in mindset will be an important agenda. I say this because we have now reached a juncture where we are independently prequalified to bid for large projects, and our strong financial health and operational capabilities facilitate us in handling multiple such projects at the same time. Large projects provide the advantage of economies of scale and hence better margins, which can be further notched up with the use of better technology and project management skills. So, from here onwards we will strive to have more value driving projects than bid for multiple smaller ones.
I thank all our stakeholders for their continued support over the years. This Company today stands on the strong foundation of multiple years of hard work of our people. Together, we will make sure we continue to evolve and create more value, while contributing to the growth of the nation.
Warm regards,
Vinod Kumar Agarwal Managing Director

10
Board of Directors
Mr. Vinod Kumar Agarwal Managing Director
He is one of the promoters of the Company. Having an extensive experience in road construction industry spanning over two decades, he has been instrumental in the Company’s growth. He overlooks the strategy and policy formulation along with the important processes of bidding, tendering and planning, and liaises with various departments of the Government. He is the Vice-President of the National Highways Builders Federation and the recipient of the Hindustan Times Excellence Award 2016 for ‘demonstrating excellence and deploying exponential strategies in their field by creating exceptional value for society’. He has been a Director on our Board since inception.
Mr. Ajendra Agarwal Executive Director
He is one of the promoters of the Company. He has over two decades experience in the road construction industry. Responsible for overseeing the overall functioning, especially the operational and technical aspects, he heads the in-house design team and is actively involved in value engineering using the latest specifications and methodologies. He is also the head of budgeting, planning and monitoring process. He is Civil Engineering graduate and has been a Director on our Board since 2006.
Mr. Desh Raj Dogra Non-Executive Independent Director
He has over 37 years of experience in the financial sector, primarily in the areas of banking and credit rating. He has been associated with Dena Bank for 15 years and retired as the Managing Director of CARE. He holds a Bachelor’ and Master’s degree in Science, a Master’s degree in Business Administration and is a certified associate of the Indian Institute of Bankers.
Mr. Chander Khamesra Non-Executive Independent Director
He has 21 years of experience in the field of manufacturing and selling of jewellery. He holds a Bachelor’s degree in commerce and a Master’s degree in business administration (executive) from the Mohanlal Sukhadia University, Udaipur. He presently is on the board of directors of Mayura Jewels (India) Private Limited and Golden Drugs Private Limited.
Mrs. Maya Swaminathan Sinha Non-Executive Independent Director
She holds a Bachelor’s and a Master’s degree in arts, specialising in economics, from University of Delhi. She has held the position of Deputy Chairperson, Jawaharlal Nehru Port Trust. She has been on the board of Clear Maze Consulting Private Limited for over three years.
Annual Report 2017-18
G R Infraprojects Limited
11
COR
PO
RATE O
VER
VIEW
Statu
tor
y rep
or
tSFin
an
cial S
tatemen
tS
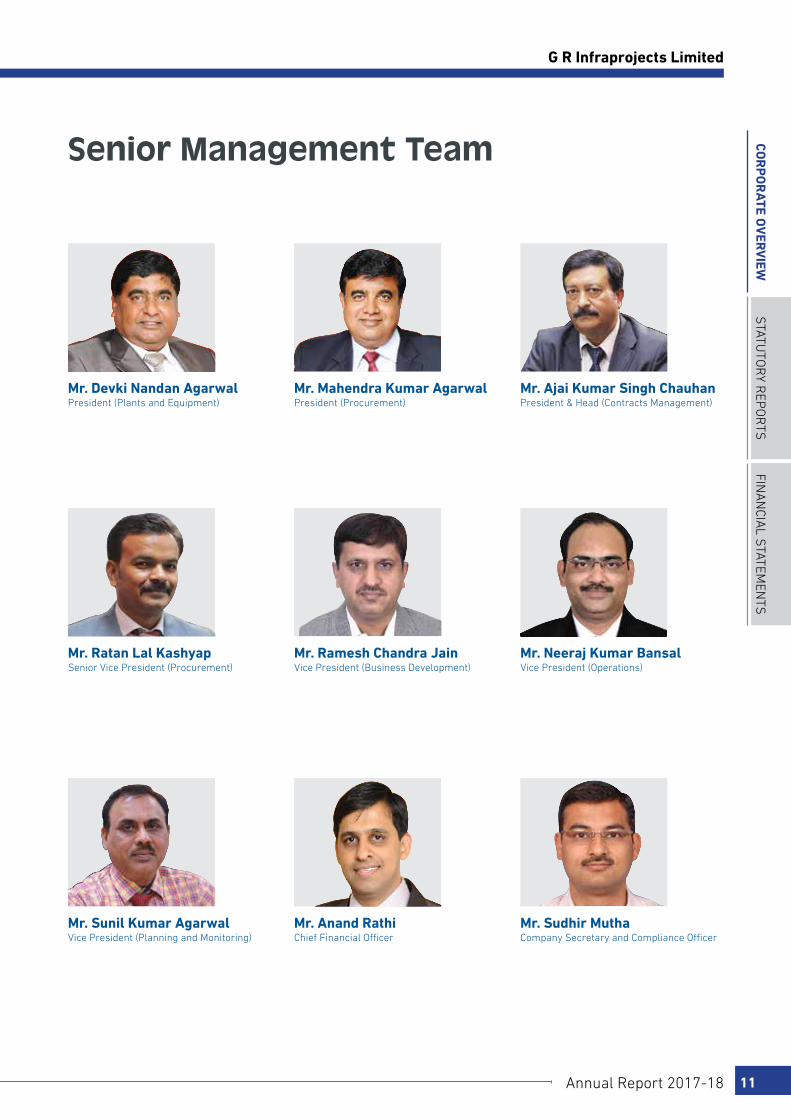
Senior Management Team
Mr. Ratan Lal Kashyap Senior Vice President (Procurement)
Mr. Sunil Kumar Agarwal Vice President (Planning and Monitoring)
Mr. Ramesh Chandra Jain Vice President (Business Development)
Mr. Anand Rathi Chief Financial Officer
Mr. Neeraj Kumar Bansal Vice President (Operations)
Mr. Sudhir Mutha Company Secretary and Compliance Officer
Mr. Ajai Kumar Singh Chauhan President & Head (Contracts Management)
Mr. Devki Nandan Agarwal President (Plants and Equipment)
Mr. Mahendra Kumar Agarwal President (Procurement)
12
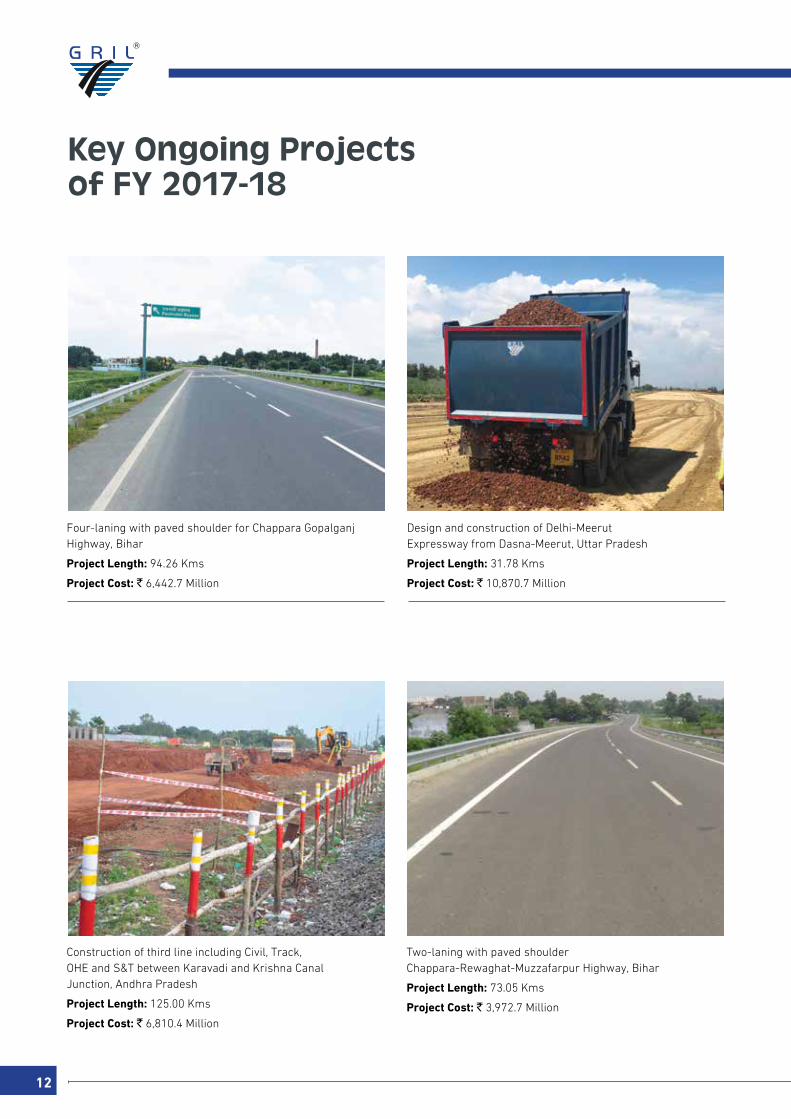
Key Ongoing projects of FY 2017-18
Four-laning with paved shoulder for Chappara Gopalganj Highway, Bihar
Project Length: 94.26 Kms
Project Cost: ` 6,442.7 Million
Design and construction of Delhi-MeerutExpressway from Dasna-Meerut, Uttar Pradesh
Project Length: 31.78 Kms
Project Cost: ` 10,870.7 Million
Construction of third line including Civil, Track, OHE and S&T between Karavadi and Krishna Canal Junction, Andhra Pradesh
Project Length: 125.00 Kms
Project Cost: ` 6,810.4 Million
Two-laning with paved shoulder Chappara-Rewaghat-Muzzafarpur Highway, Bihar
Project Length: 73.05 Kms
Project Cost: ` 3,972.7 Million

Annual Report 2017-18
G R Infraprojects Limited
13
COR
PO
RATE O
VER
VIEW
Statu
tor
y rep
or
tSFin
an
cial S
tatemen
tS
Four-laning of Parwanoo-Solan Highway, Himachal Pradesh
Project Length: 39.14 Kms
Project Cost: ` 7,487.7 Million
Development and maintenance work of Nagaur-Mukundgarh Highway, Rajasthan
Project Length: 393.71 Kms
Project Cost: ` 9,142.7 Million
Four-laning with paved shoulder of section of NH-8E of Porbandar-Dwarka Highway, Gujarat
Project Length: 117.75 Kms
Project Cost: ` 16,000.0 Million
Six-laning of section of NH-2 of Handia-Varanasi Highway, Uttar Pradesh
Project Length: 72.40 Kms
Project Cost: ` 24,470.0 Million

EPC expertiseOur wide EPC expertise spans constructing state and national highways, bridges, culverts, flyovers, airport runways and rail over-bridges across multiple geographies and involving varying degrees of complexity.
Credit ratings Experienced people Our promoters and leadership team comprise qualified and experienced professionals.
Strong relationships Our ability to handle challenging projects across diverse terrain with focus on quality and timely execution makes us a player of choice.
Execution excellence With our trained and skilled manpower, ability to efficiently deploy equipment and resources, and in-house integrated model, we have unmatched project management and execution expertise.
Integrated model We have competencies to deliver projects right from conceptualisation to completion including manufacture of bitumen, thermoplastic road-marking paint and road signage, metal crash barriers allowing us to maintain quality and timely execution.
14
Built on a Solid Foundation
94+ Road Construction & EPC Projects completed since 2006
CARE A1+ Short-term
21 of 23 projects executed in the last five years were delivered on/before scheduled time
20+ years average industry experience of the promoters and senior management.
3,500+ as on 31 March 2018Equipment base comprising construction equipment and fleet of transportation vehicles
CARE AA- Long-term
CRISIL AA- Long-term
CRISIL A1+ Short-term

Ability to take-up large contract value projects
High pre-qualification criteria to independently bid
Shillong Bypass Project
~10 months ahead of schedule
Annual Report 2017-18
G R Infraprojects Limited
15
COR
PO
RATE O
VER
VIEW
Statu
tor
y rep
or
tSFin
an
cial S
tatemen
tS
` 24,470 Mn single-largest project baggedfrom NHAI under Hybrid Annuity Model
` 9,646.10 Mn as of February 28, 2016 - MorTH By MoRTH (for EPC)
` 17,127.6 Mn as of December 31, 2016 - BOT By NHAI (for BOT and annuity projects)
` 17,527.6 Mn as of December 31, 2016 By NHAI (Hybrid Annuity model projects).
Our growing competencies
Jodhpur-Pokaran Project
~67 days ahead of schedule
Bahraich-Rupaidiha Project
~28 days ahead of schedule
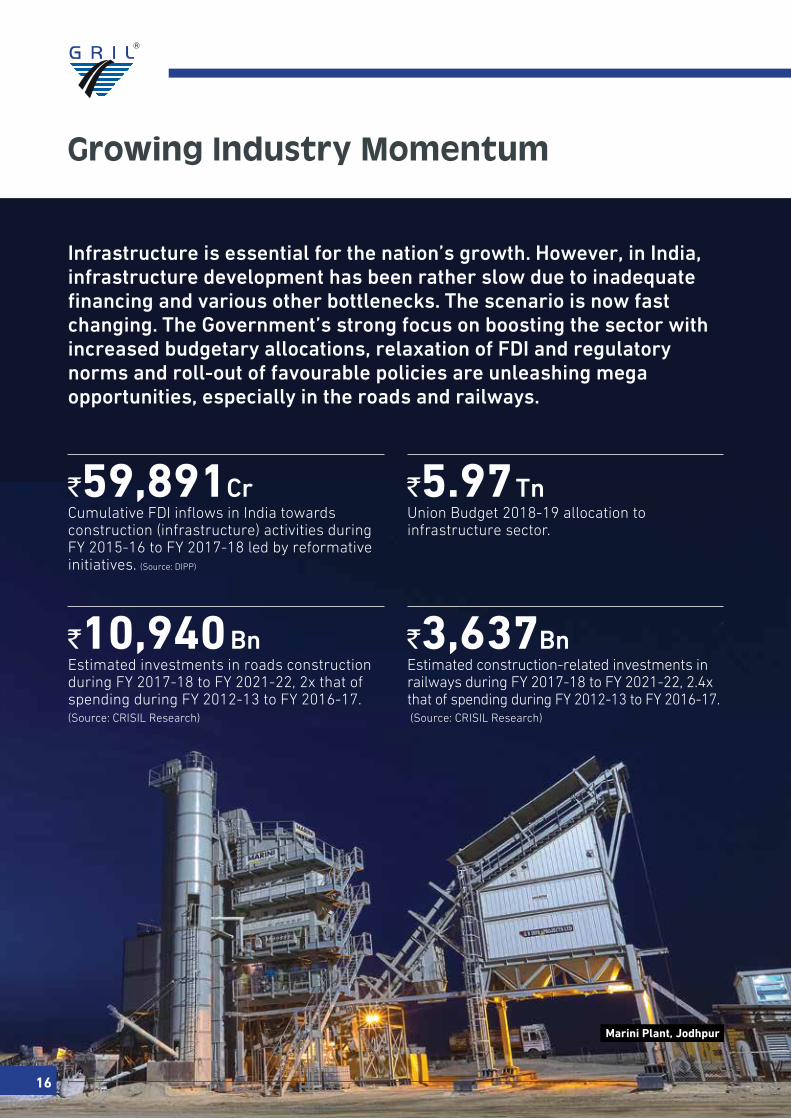
`59,891CrCumulative FDI inflows in India towards construction (infrastructure) activities during FY 2015-16 to FY 2017-18 led by reformative initiatives. (Source: DIPP)
`10,940bnEstimated investments in roads construction during FY 2017-18 to FY 2021-22, 2x that of spending during FY 2012-13 to FY 2016-17. (Source: CRISIL Research)
`5.97tn Union Budget 2018-19 allocation to infrastructure sector.
`3,637bn Estimated construction-related investments in railways during FY 2017-18 to FY 2021-22, 2.4x that of spending during FY 2012-13 to FY 2016-17. (Source: CRISIL Research)
Infrastructure is essential for the nation’s growth. however, in India, infrastructure development has been rather slow due to inadequate financing and various other bottlenecks. the scenario is now fast changing. the Government’s strong focus on boosting the sector with increased budgetary allocations, relaxation of fdI and regulatory norms and roll-out of favourable policies are unleashing mega opportunities, especially in the roads and railways.
16
Growing Industry Momentum
Marini Plant, Jodhpur
Annual Report 2017-18
G R Infraprojects Limited
17
COR
PO
RATE O
VER
VIEW
Statu
tor
y rep
or
tSFin
an
cial S
tatemen
tS
Growth drivers for the railways sector
Growth drivers for the road sector
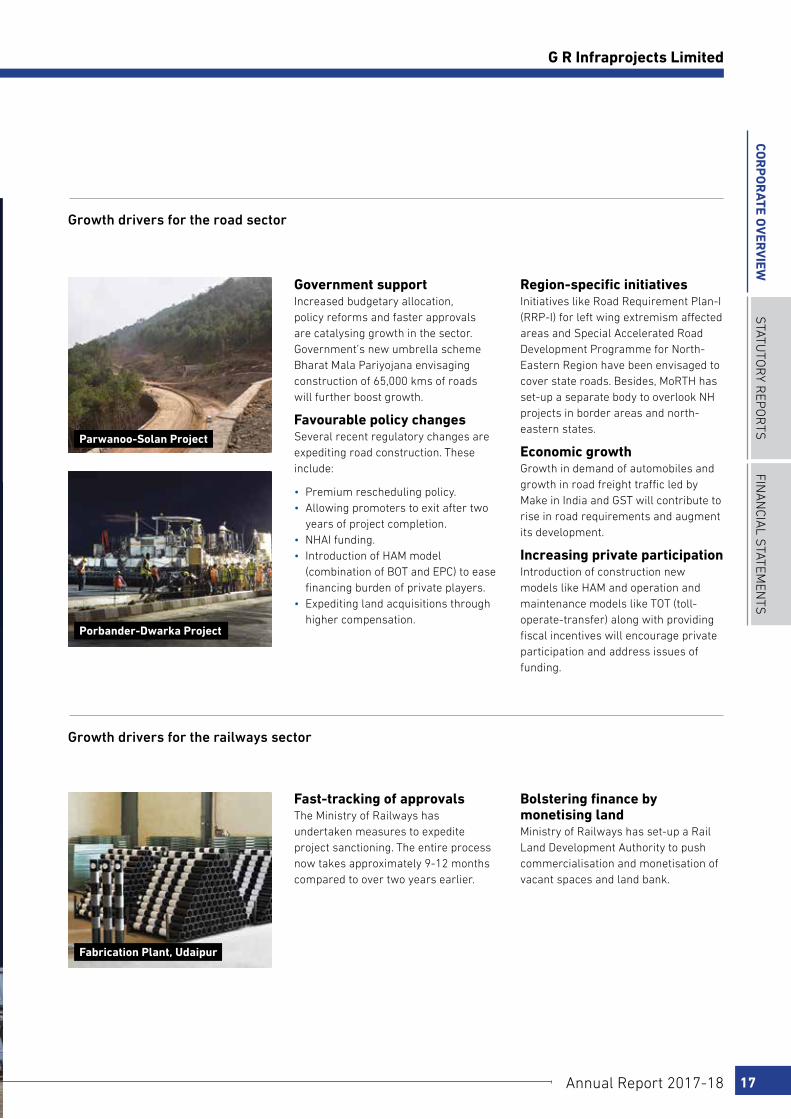
Government support Increased budgetary allocation, policy reforms and faster approvals are catalysing growth in the sector. Government’s new umbrella scheme Bharat Mala Pariyojana envisaging construction of 65,000 kms of roads will further boost growth.
Favourable policy changes Several recent regulatory changes are expediting road construction. These include:
• Premium rescheduling policy.• Allowing promoters to exit after two
years of project completion.• NHAI funding.• Introduction of HAM model
(combination of BOT and EPC) to ease financing burden of private players.
• Expediting land acquisitions through higher compensation.
Region-specific initiatives Initiatives like Road Requirement Plan-I (RRP-I) for left wing extremism affected areas and Special Accelerated Road Development Programme for North-Eastern Region have been envisaged to cover state roads. Besides, MoRTH has set-up a separate body to overlook NH projects in border areas and north-eastern states.
Economic growth Growth in demand of automobiles and growth in road freight traffic led by Make in India and GST will contribute to rise in road requirements and augment its development.
Increasing private participation Introduction of construction new models like HAM and operation and maintenance models like TOT (toll-operate-transfer) along with providing fiscal incentives will encourage private participation and address issues of funding.
Fast-tracking of approvals The Ministry of Railways has undertaken measures to expedite project sanctioning. The entire process now takes approximately 9-12 months compared to over two years earlier.
Bolstering finance by monetising landMinistry of Railways has set-up a Rail Land Development Authority to push commercialisation and monetisation of vacant spaces and land bank.
Parwanoo-Solan Project
Porbander-Dwarka Project
Fabrication Plant, Udaipur
18
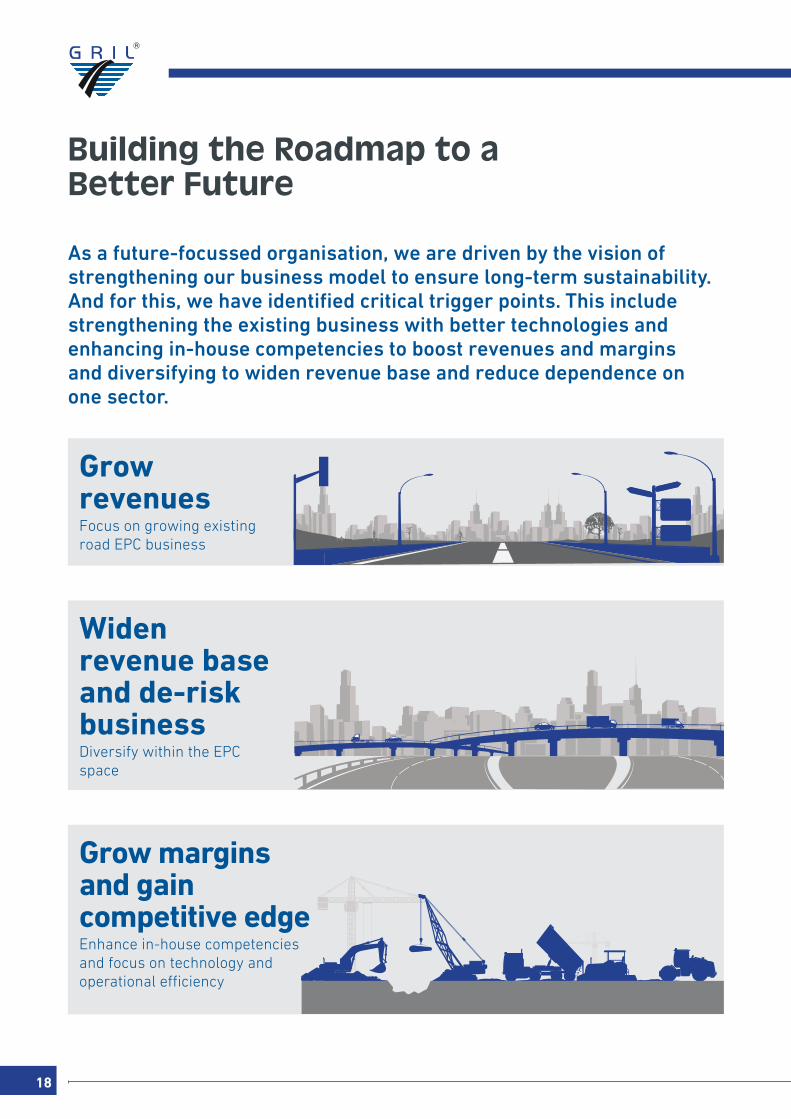
Building the Roadmap to a Better Future
As a future-focussed organisation, we are driven by the vision of strengthening our business model to ensure long-term sustainability. And for this, we have identified critical trigger points. this include strengthening the existing business with better technologies and enhancing in-house competencies to boost revenues and margins and diversifying to widen revenue base and reduce dependence on one sector.
Grow revenuesFocus on growing existing road EPC business
Widen revenue base and de-risk businessDiversify within the EPC space
Grow margins and gain competitive edge Enhance in-house competencies and focus on technology and operational efficiency
Annual Report 2017-18
G R Infraprojects Limited
19
COR
PO
RATE O
VER
VIEW
Statu
tor
y rep
or
tSFin
an
cial S
tatemen
tS
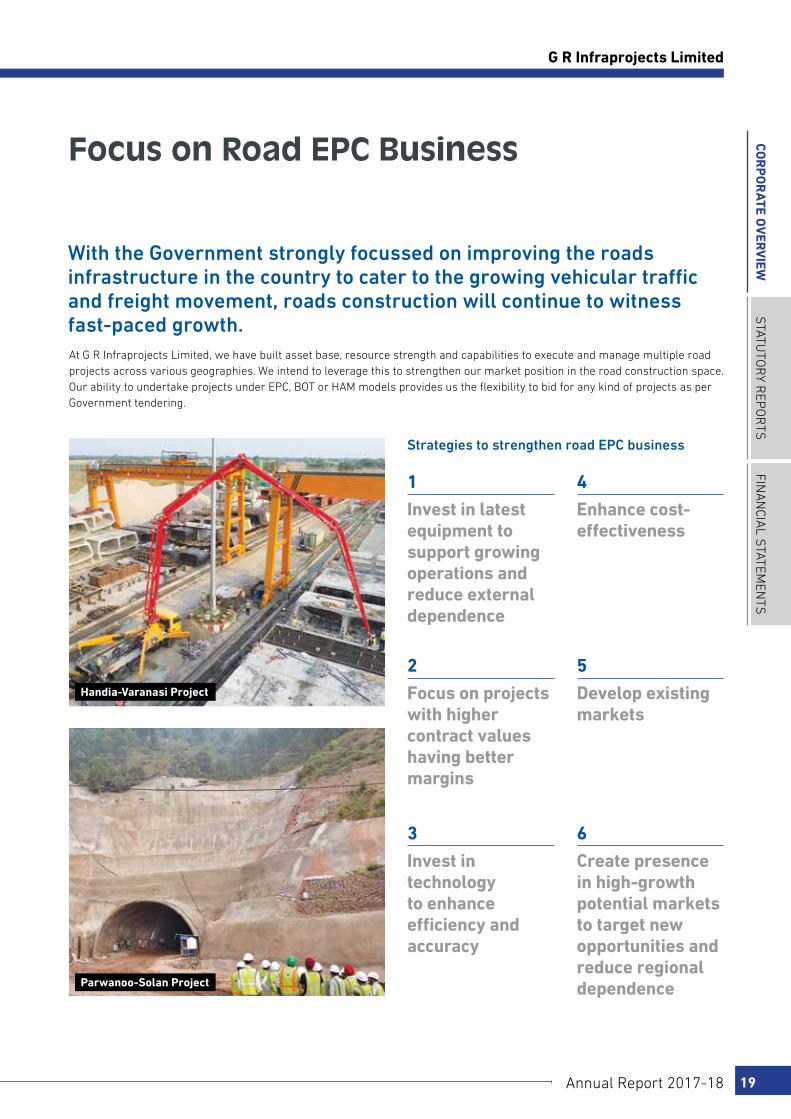
Focus on Road Epc Business
with the Government strongly focussed on improving the roads infrastructure in the country to cater to the growing vehicular traffic and freight movement, roads construction will continue to witness fast-paced growth. At G R Infraprojects Limited, we have built asset base, resource strength and capabilities to execute and manage multiple road projects across various geographies. We intend to leverage this to strengthen our market position in the road construction space. Our ability to undertake projects under EPC, BOT or HAM models provides us the flexibility to bid for any kind of projects as per Government tendering.
strategies to strengthen road epC business
Invest in latest equipment to support growing operations and reduce external dependence
Enhance cost-effectiveness
Focus on projects with higher contract values having better margins
Develop existing markets
Invest in technology to enhance efficiency and accuracy
Create presence in high-growth potential markets to target new opportunities and reduce regional dependence
1 4
2 5
3 6
Handia-Varanasi Project
Parwanoo-Solan Project
20
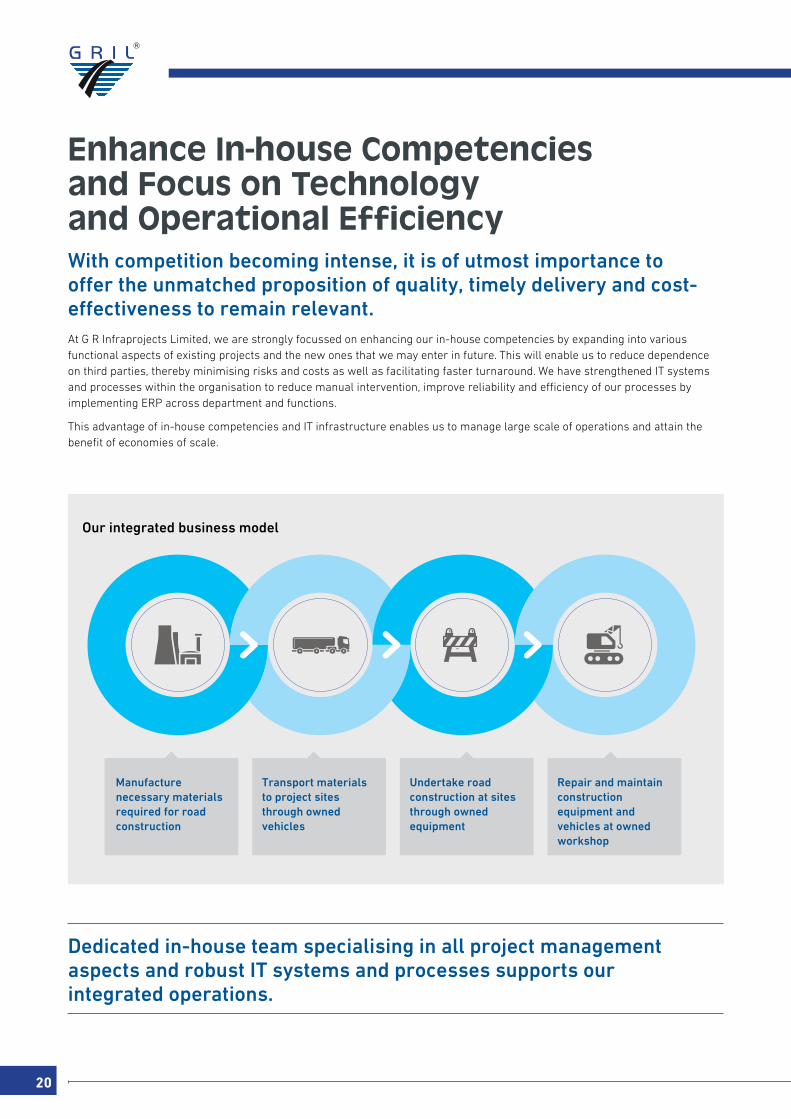
Enhance In-house competencies and Focus on Technology and Operational Efficiency with competition becoming intense, it is of utmost importance to offer the unmatched proposition of quality, timely delivery and cost-effectiveness to remain relevant. At G R Infraprojects Limited, we are strongly focussed on enhancing our in-house competencies by expanding into various functional aspects of existing projects and the new ones that we may enter in future. This will enable us to reduce dependence on third parties, thereby minimising risks and costs as well as facilitating faster turnaround. We have strengthened IT systems and processes within the organisation to reduce manual intervention, improve reliability and efficiency of our processes by implementing ERP across department and functions.
This advantage of in-house competencies and IT infrastructure enables us to manage large scale of operations and attain the benefit of economies of scale.
Our integrated business model
dedicated in-house team specialising in all project management aspects and robust It systems and processes supports our integrated operations.
Manufacture necessary materials required for road construction
transport materials to project sites through owned vehicles
undertake road construction at sites through owned equipment
Repair and maintain construction equipment and vehicles at owned workshop

Annual Report 2017-18
G R Infraprojects Limited
21
COR
PO
RATE O
VER
VIEW
Statu
tor
y rep
or
tSFin
an
cial S
tatemen
tS
strategies to enhance in-house competencies
strategies to enhance operational efficiency
Focus on developing design and engineering capabilities as per requirements of future projects
Train staff in basic and advanced engineering and construction technology and skills
Focus on setting-up in-house facilities for railway and water infrastructure
Build people competency by providing opportunity to work on diverse and complex projects
Focus on strengthening IT systems to enhance efficiency, improve reliability and optimise costs
1 1
2 2
3
Handia-Varanasi Project
Crash Barrier Plant, Ahmedabad
Corporate Office, Gurugram
22
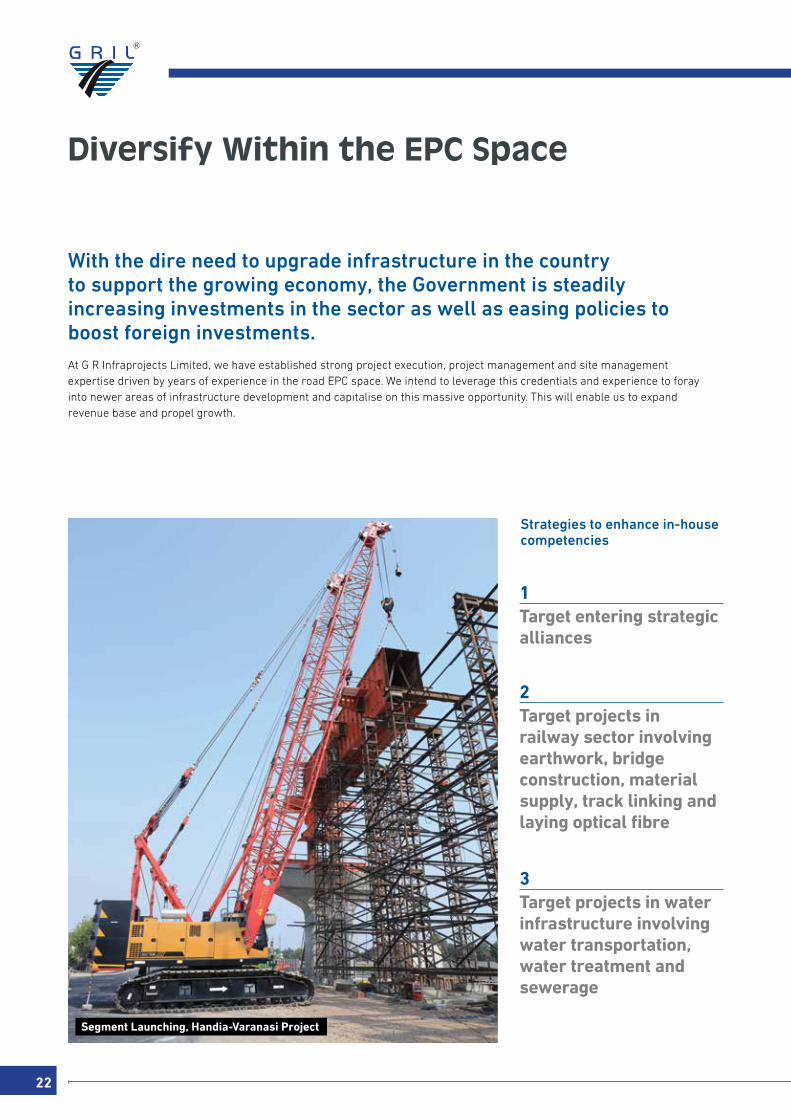
Diversify Within the Epc Space
with the dire need to upgrade infrastructure in the country to support the growing economy, the Government is steadily increasing investments in the sector as well as easing policies to boost foreign investments.At G R Infraprojects Limited, we have established strong project execution, project management and site management expertise driven by years of experience in the road EPC space. We intend to leverage this credentials and experience to foray into newer areas of infrastructure development and capitalise on this massive opportunity. This will enable us to expand revenue base and propel growth.
strategies to enhance in-house competencies
Target entering strategic alliances
Target projects in railway sector involving earthwork, bridge construction, material supply, track linking and laying optical fibre
Target projects in water infrastructure involving water transportation, water treatment and sewerage
1
2
3
Segment Launching, Handia-Varanasi Project
Annual Report 2017-18
G R Infraprojects Limited
23
COR
PO
RATE O
VER
VIEW
Statu
tor
y rep
or
tSFin
an
cial S
tatemen
tS
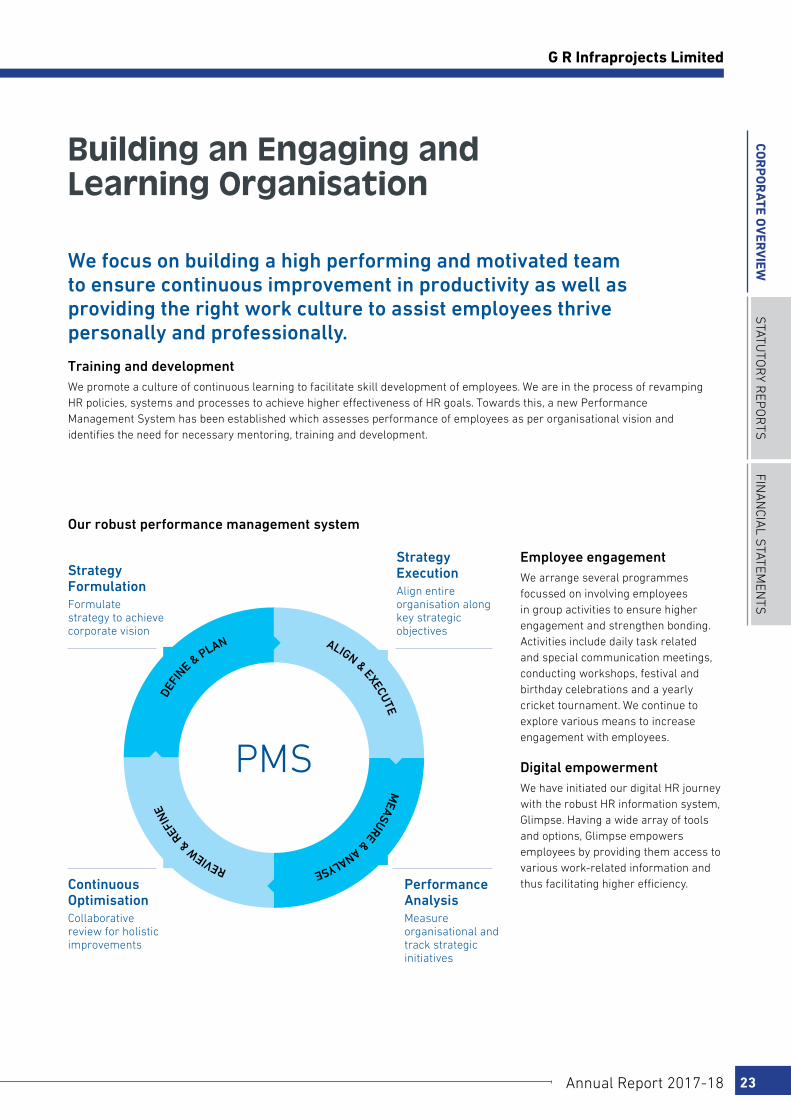
Building an Engaging and Learning Organisation
we focus on building a high performing and motivated team to ensure continuous improvement in productivity as well as providing the right work culture to assist employees thrive personally and professionally.
training and developmentWe promote a culture of continuous learning to facilitate skill development of employees. We are in the process of revamping HR policies, systems and processes to achieve higher effectiveness of HR goals. Towards this, a new Performance Management System has been established which assesses performance of employees as per organisational vision and identifies the need for necessary mentoring, training and development.
Our robust performance management system
employee engagement We arrange several programmes focussed on involving employees in group activities to ensure higher engagement and strengthen bonding. Activities include daily task related and special communication meetings, conducting workshops, festival and birthday celebrations and a yearly cricket tournament. We continue to explore various means to increase engagement with employees.
digital empowerment We have initiated our digital HR journey with the robust HR information system, Glimpse. Having a wide array of tools and options, Glimpse empowers employees by providing them access to various work-related information and thus facilitating higher efficiency.
strategy formulationFormulate strategy to achieve corporate vision
Continuous OptimisationCollaborative review for holistic improvements
strategy executionAlign entire organisation along key strategic objectives
performance AnalysisMeasure organisational and track strategic initiatives
defI
ne & pLAn ALIGn & exeCute
MeAsuRe & AnALyse
RevIew & R
efIn
e
PMS
24
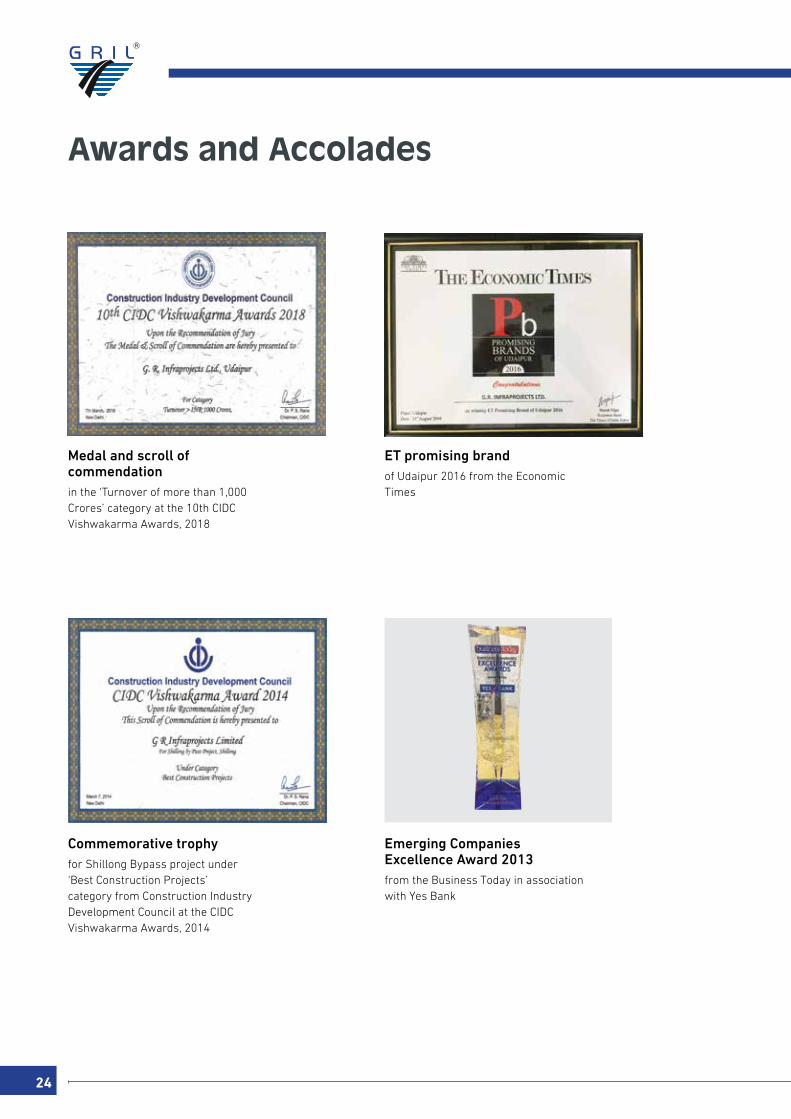
Awards and Accolades
Medal and scroll of commendation in the ‘Turnover of more than 1,000 Crores’ category at the 10th CIDC Vishwakarma Awards, 2018
et promising brand of Udaipur 2016 from the Economic Times
emerging Companies excellence Award 2013 from the Business Today in association with Yes Bank
Commemorative trophy for Shillong Bypass project under ‘Best Construction Projects’ category from Construction Industry Development Council at the CIDC Vishwakarma Awards, 2014
Annual Report 2017-18
G R Infraprojects Limited
25
COR
PO
RATE O
VER
VIEW
STATU
TOR
Y REP
OR
TSFIN
AN
CIAL S
TATEMEN
TS
Corporate Information
Board of Directors Mr. Vinod Kumar Agarwal Managing Director
Mr. Ajendra Agarwal Executive Director
Mr. Desh Raj Dogra Non-Executive Independent Director
Mrs. Maya Swaminathan Sinha Non-Executive Independent Director
Mr. Chander Khamesra Non-Executive Independent Director
Company Secretary and Compliance OfficerMr. Sudhir Mutha
Chief Financial OfficerMr. Anand Rathi
AuditorsB S R & Associates LLPChartered AccountantsFirm Registration No: 116231 W/W-1 00024
Head OfficeGR House, Hiran Magri, Sector 11, UdaipurRajasthan - 313 002, IndiaEmail: [email protected]: +91-294 248 7370Fax: +91-294 248 7749 (Telefax)Website: www.grinfra.com
Registered OfficeRevenue Block No. 223, Old Survey No. 384/1, 384/2 Paiki and 384/3, Khata No. 464, Kochariya, Ahmedabad - 382 220, Gujarat, India
Corporate OfficeG R Infraprojects Limited2nd Floor, Novus Tower, Plot No. 18, Sector 18Gurugram, Haryana -122 015Email: General Enquiry : [email protected] Careers: [email protected]: +91 124 643 5000
26
To The Members ofG R Infraprojects Limited
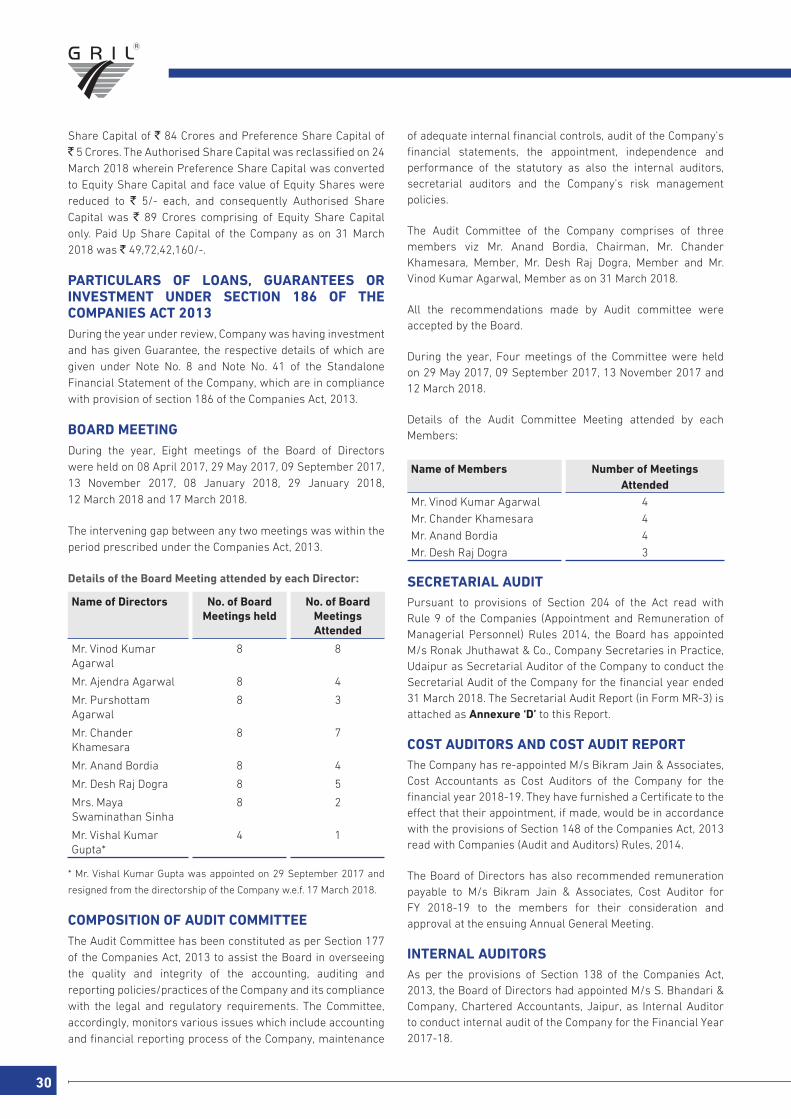
Your Directors have pleasure in presenting the Twenty Second Annual Report on the business and operations of your Company alongwith Audited Financial Statements for the year ended 31 March 2018.
FINANCIAL RESULTSThe financial results of the Company for the year ended 31 March 2018 are as under:
(` in lakhs)
Particulars Standalone ConsolidatedFY 2018 FY 2017 FY 2018 FY 2017
Total Revenue 315,991.76 320,501.59 322,206.17 330,237.03
Earnings before Interest, Tax & Depreciation and Amortisation (EBITDA)
62,628.81 56,389.45 65,003.36 63,569.08
Less: Depreciation & Amortisation 8,063.39 6,362.19 8,312.73 6,875.07
Earnings before Interest & Tax (EBIT) 54,565.42 50,027.26 56,690.63 56,694.01
Less: Interest & Financial Expenses 6,297.32 5,332.63 6,595.67 12,583.56
Profit before exceptional items & Tax 48,268.10 44,694.63 50,094.96 44,110.45
Exceptional item - 13,568.35 - 13,568.35
Profit before Tax (PBT) 48,268.10 58,262.98 50,094.96 57,678.80
Less : Tax Expenses 8,346.94 (44.60) 9,499.26 (1,104.86)
Profit after Tax (PAT) 39,921.16 58,307.58 40,595.70 58,783.66
Directors’ Report

COR
PO
RATE O
VERVIEW
STATU
TOR
Y REP
OR
TSFIN
AN
CIAL S
TATEMEN
TS
Annual Report 2017-18 27
G R Infraprojects Limited
PERFORMANCE REVIEWThe total revenue of the Company on standalone basis was ` 3,15,991.76 lakhs as compared to ` 3,20,501.59 lakhs for previous year i.e. lower by 1.41% as compared to the previous year. The Earnings before Interest, Tax, Depreciation and Amortisation (EBITDA) for the current year is reported at ` 62,628.81 lakhs which was ` 56,389.45 lakhs for FY 2016-17 with an increase of 10.71%. The Profit before exceptional items & Tax is reported at ` 48,268.10 lakhs in FY 2017-18 as against ` 44,649.63 lakhs in FY 2016-17 with increase of 8.10%.
The total revenue of the Company on consolidated basis for current year was ` 3,22,206.17 lakhs as against ` 330,237.03 lakhs in FY 2016-17. The Profit before exceptional items & Tax is reported at ` 50,094.96 lakhs in FY 2017-18 as against ` 44,110.45 lakhs in FY 2016-17 with an increase of 13.56%.
FUTURE OUTLOOK Infrastructure industry in India has seen a phenomenal growth spreading across various segments like Road, Railways, Airports, development of smart cities etc. Roads are the blood vessels of any country and is the most important sector contributing to overall progress of the Nation. Indian government is diligently encouraging development of road sector which promises bright future of your Company. Your Company is duly reciprocating to Government’s initiatives by completing its projects within delegated time frame. Each of
the Company’s resource is fully dedicated and devoted towards its responsibilities assuring uninterrupted growth in future.
DIVIDENDLooking at the current and future fund requirements for the ongoing and upcoming projects of the Company, the directors think it prudent not to recommend dividend for the financial year ended 31 March 2018 (previous year: Nil).
CONSOLIDATED FINANCIAL STATEMENTSIn accordance with IndAS-110 on Consolidated Financial Statements read with IndAS-28 on Accounting for Investments in Associates and IndAS-111 on Financial Reporting of Interest in Joint Agreement and also as per Section 129 of the Companies Act, 2013, the audited Consolidated Financial Statements are furnished in the Annual Report.
NON CONVERTIBLE DEBENTURES (NCDs)During the year under review, the Company has issued 7.85% Secured Senior Unrated Unlisted Redeemable Non Convertible Debentures of ` 150 crores comprising of 1500 Debentures of face value of ` 10 Lakh each on private placement basis on 29 January 2018.
Further, the Company has redeemed 11.40% Non-Convertible Redeemable Debentures of ` 25 crores comprising of 250 Debentures on 19 May 2017 and ` 25 crores comprising of 250 Debentures on 20 November 2017 on the respective due dates.
Outstanding position of Non Convertible Debentures as on 31 March 2018:
(` in lakhs)
NCDs Outstanding as on 31 March 2018 Debenture Trustee11.40% Debentures 7,500 /-
IDBI Trusteeship Services Ltd.10.50% Debentures 15,000/-
7.85% Debentures 15,000/- Beacon Trusteeship Ltd.
TRANSFER TO RESERVE
The Company has transferred ` 2,500 lakhs (Net) in Debenture
Redemption Reserve for the financial year ended 31 March
2018.
SUBSIDIARY COMPANIES
During the year, Varanasi Sangam Expressway Private
Limited, Porbandar Dwarka Expressway Private Limited and
GR Gundugolanu Devarapalli Highway Private Limited were
incorporated as wholly owned subsidiaries of the Company.
Details of the Subsidiaries Companies as on 31 March 2018
are as under:
a. GR Gundugolanu Devarapalli Highway Private Limited (‘GDHPL’)
GDHPL was formed on 28 March 2018 as a special purpose vehicle (SPV), to develop, establish, construct, operate and maintain the project relating to Four Laning of Gundugolanu-Devarapalli-Kovvuru section of NH-16 from Km 15.320 (Existing Km 15.700) to Km 85.204 (existing Km 81.400) (Design Length=69.884 Km) in the State of Andhra Pradesh under Bharatmala Pariyojana on Hybrid Annuity mode.
b. Porbandar Dwarka Expressway Private Limited (‘PDEPL’)
PDEPL was formed on 9 June 2017 as a special purpose vehicle (SPV), to develop, establish, construct, operate

28
and maintain the project relating to Four laning with paved shoulder of Porbandar - Dwarka section of NH-8E (Ext.) from km 356.766 (Design Chainage km 379.100) to km 473.000 (Design Chainage km 496.848) in the State of Gujarat through Public Private Partnership (PPP) on Hybrid (Annuity) mode.
Profit after tax of PDEPL was ` 111.03 lakhs in FY 2017-18.
c. Varanasi Sangam Expressway Private Limited (‘VSEPL’)
VSEPL was formed on 17 April 2017 as a special purpose vehicle (SPV), to develop, establish, construct, operate and maintain the project relating to Six- laning of Handia to Varanasi section of NH-2 from km 713.146 to km 785.544 in the state of Uttar Pradesh under NHDP phase–V on Hybrid Annuity Mode.
Profit after tax of VSEPL was ` 464.34 lakhs in FY 2017-18.
d. Nagaur Mukundgarh Highways Private Limited (‘NMHPL’)
NMHPL started its operations during financial year 2017-2018 and its project is going ahead of its schedule. For the year under review, Profit after tax of NMHPL was ̀ 982.71 lakhs in FY 2017-18 as against nil in FY 2016-17.
e. GR Phagwara Expressway Limited (‘GPEL’)
GPEL started its operations during financial year 2017-2018. Profit after tax of GPEL was reported ` 342.91 lakhs in FY 2017-18 as against the Loss of ` 0.31 lakhs in FY 2016-17.
f. Reengus Sikar Expressway Limited (‘RSEL’)
RSEL was incorporated as wholly owned subsidiary Company. It is regularly receiving Annuity from Authority. During the FY 2017-18, it received Annuity of ` 3754.44 lakhs in FY 2017-18 from the National Highway Authority of India (NHAI).
Profit after tax of RSEL was reported ` 329.22 lakhs in FY 2017-18 as against the profit of ` 358.17 lakhs in FY 2016-17.
g. GR Building and Construction Nigeria Limited (Foreign Subsidiary) - (‘GRBCNL’)
GRBCNL was awarded project for Construction of Agaie-Katcha-Baro Road (Rigid Pavement) in Niger State at a contract price of Nigerian Naira (NGN) 1756.33.
GRBCNL was reported Loss of NGN 6305.23 lakhs in FY 2017-18.
h. G R Infrastructure Limited (Foreign Subsidiary) - (‘GRIL, Nigeria’)
GRIL, Nigeria was set up as a subsidiary of the Company.
A statement pursuant to Section 129(3) of the Companies Act, 2013 (“the Act”) is attached with the financial statements of the Company.
SIGNIFICANT & MATERIAL ORDER PASSED BY THE REGULATORSDuring the year no significant and material orders passed by the regulators or courts or tribunals impacting the going concern status and Company’s operations in future.
MATERIAL CHANGES AND COMMITMENTSThere are no other material changes and commitments, occurred from 1 April 2018 to upto the date of this report, which may materially affect the financial position of the Company.
SHIFTING OF REGISTERED OFFICE OF THE COMPANYDuring the year, your Company shifted its registered office from the State of Rajasthan to State of Gujarat at Flat No. A/74, Shaligram-3, Prahlad Nagar Road, Vejalpur, Ahmedabad-Gujarat 380015, for which approval of Regional Director, North Western Region, Ahmedabad was received vide it order dated 8 July 2017. Your Company further shifted its registered office to Revenue Block No. 233, Old Survey No. 384/1, 384/2 Paiki and 384/3, Khata No. 464, Kochariya, Ahmedabad, Gujarat-382220 on 29 September 2017.
AUDITORS & AUDITORS REPORTM/s B S R & Associates LLP, Chartered Accountants were appointed as statutory auditors of the Company to hold office till the conclusion of the Annual General Meeting to be held in the calendar year 2019 (subject to ratification of their appointment in every Annual General Meeting of the Company). The requirement to place the matter relating to appointment of Auditors for ratification by members at every Annual General Meeting is done away with vide Notification dated May 7, 2018 issued by the Ministry of Corporate Affairs, New Delhi. Accordingly, no resolution is proposed for ratification of appointment of Auditors in ensuing Annual General Meeting.
The Notes on Financial Statements referred to in the Auditors’ Report are self-explanatory and do not call for any further comments. Management of the Company has detected misappropriation of fund by two erstwhile employees of the Company involving amounts of ` 111 lakhs and ` 7.90 lakhs respectively, in separate instances, and for which the Management has taken action at appropriate forum.
DIRECTORS AND KEY MANAGERIAL PERSONNELDuring the year under review, Mr. Vishal Kumar Gupta was appointed as a Nominee Director on the Board of the Company on 29 September 2017, however he placed his resignation from the directorship of the Company w.e.f. 17 March 2018.
Further, Mr. Ajendra Agarwal, Director of the Company is liable to retire by rotation at the ensuing Annual General Meeting and, being eligible, offers himself for re-appointment.
There was no change in the Key Managerial Personnel during the year.

COR
PO
RATE O
VERVIEW
STATU
TOR
Y REP
OR
TSFIN
AN
CIAL S
TATEMEN
TS
Annual Report 2017-18 29
G R Infraprojects Limited
DIRECTORS’ RESPONSIBILITY STATEMENTPursuant to Section 134(5) of the Companies Act, 2013, Directors hereby confirms that:
(i) in preparation of Annual Accounts for the year 2017-18, the applicable accounting standards have been followed and there are no material departures;
(ii) They have selected such Accounting policies and applied them consistently and made judgments and estimates that are reasonable and prudent so as to give true and fair view of the state of affairs of the Company at the end of financial year and of the Profit of the Company for the financial year2017-18;
(iii) They have taken proper and sufficient care to the best of their knowledge and ability for the maintenance of adequate accounting records in accordance with the provisions of the Act for safeguarding the assets of the Company and for preventing and detecting fraud and other irregularities;
(iv) They have prepared annual accounts on a going concern basis;
(v) The Directors had laid down proper internal financial controls to be followed by the Company and such Internal Financial Controls are adequate and operating effectively.
(vi) The Directors have devised proper systems to ensure compliance with the provisions of all applicable laws and that such systems are adequate and operating effectively.
CONSERVATION OF ENERGY, TECHNOLOGY ABSORPTION, FOREIGN EXCHANGE EARNINGS AND OUTGOThe provisions of section 134(3)(m) of the Act regarding conservation of Energy and Technology Absorption are not applicable to the Company. Further during the year under review Foreign exchange earnings (in equivalent `) was ` 194.12 lakhs (Previous year Nil) and foreign exchange outgo was ` 5,273.87 lakhs (Previous year ` 1089.19 lakhs).
CORPORATE SOCIAL RESPONSIBILITY The disclosures required to be given under Section 135 of the Companies Act, 2013 read with Rule 8(1) of the Companies (Corporate Social Responsibility Policy) Rules, 2014 are given in Annexure ‘A’ to this Report.
DEPOSITSDuring the year, your Company has not accepted any deposit as per the provisions of the Companies Act, 2013 and any rules made thereunder.
CONTRACTS OR ARRANGEMENTS WITH RELATED PARTIESAll contracts or arrangements with related parties, entered into or modified during the financial year were in ordinary
course of business and at arm’s length. However Company has not entered in to any material contract or arrangement with its related party hence, Form No. AOC-2 in terms of Section 134 of the Act read with Rule 8 of the Companies (Accounts) Rules, 2014 is not required to be reported.
PARTICULAR OF EMPLOYEESThe particular of employees drawing remuneration in excess of limits prescribed underSection 197(12) of the Companies Act 2013 read with Rules 5(2) and 5(3) of the Companies (Appointment and Remuneration of Managerial Personnel) Rules, 2014 is provided in Annexure ‘B’ to this report.
Further, Disclosures pertaining to remuneration and other details as required under Rule 5(1) of the Companies (Appointment and Remuneration of Managerial Personnel) Rules, 2014 is attached as Annexure ‘C’ to this report.
VIGIL MECHANISMThe Company has adopted a Vigil Mechanism Policy to provide a mechanism for Directors and employees to report genuine concerns about any unethical, actual or suspected fraud or violation of the Company’s Code of Conduct. The provisions of this policy are in line with the provisions of Section 177(9) of the Act.
DECLARATION FROM INDEPENDENT DIRECTORSThe Independent Directors have submitted their disclosures to the Board that they fulfill all the requirements as stipulated in Section 149(6) of the Act so as to qualify themselves to be appointed as Independent Directors of the Company.
COMPANY’S POLICY RELATING TO DIRECTORS APPOINTMENT, PAYMENT OF REMUNERATION AND DISCHARGE OF THEIR DUTIESThe provisions of Section 178(1) of the Act relating to constitution of Nomination& Remuneration Committee is applicable to the Company, hence Company has devised policy relating to appointment of Directors, payment of Managerial remuneration, Directors qualification, positive attributes, Independence of Directors and other related matters as provided under Section 178(3) of the Companies Act, 2013.
Nomination and Remuneration Policy issued by Nomination and Remuneration Committee is placed on our website at the link: http://grinfra.com/wp-content/uploads/2018/07/NOMINATION-AND-REMUNERATION-POLICY.pdf
CAPITAL STRUCTURE OF THE COMPANYDuring the year under review, pursuant to a scheme of amalgamation (“Scheme”) under sections 230 to 232 and other relevant provisions of the Companies Act, 2013, M/s. G R Infratech Private Limited “GRIPL”, was amalgamated with G R Infraprojects Limited “GRIL” and pursuant to the order of Hon’ble National Company Law Tribunal Authorised Share Capital of the Company was increased to ̀ 89 Crores comprising of Equity
30
Share Capital of ` 84 Crores and Preference Share Capital of ` 5 Crores. The Authorised Share Capital was reclassified on 24 March 2018 wherein Preference Share Capital was converted to Equity Share Capital and face value of Equity Shares were reduced to ` 5/- each, and consequently Authorised Share Capital was ` 89 Crores comprising of Equity Share Capital only. Paid Up Share Capital of the Company as on 31 March 2018 was ` 49,72,42,160/-.
PARTICULARS OF LOANS, GUARANTEES OR INVESTMENT UNDER SECTION 186 OF THE COMPANIES ACT 2013During the year under review, Company was having investment and has given Guarantee, the respective details of which are given under Note No. 8 and Note No. 41 of the Standalone Financial Statement of the Company, which are in compliance with provision of section 186 of the Companies Act, 2013.
BOARD MEETING During the year, Eight meetings of the Board of Directors were held on 08 April 2017, 29 May 2017, 09 September 2017, 13 November 2017, 08 January 2018, 29 January 2018, 12 March 2018 and 17 March 2018.
The intervening gap between any two meetings was within the period prescribed under the Companies Act, 2013.
Details of the Board Meeting attended by each Director:
Name of Directors No. of Board Meetings held
No. of Board Meetings Attended
Mr. Vinod Kumar Agarwal
8 8
Mr. Ajendra Agarwal 8 4
Mr. Purshottam Agarwal
8 3
Mr. Chander Khamesara
8 7
Mr. Anand Bordia 8 4
Mr. Desh Raj Dogra 8 5
Mrs. Maya Swaminathan Sinha
8 2
Mr. Vishal Kumar Gupta*
4 1
* Mr. Vishal Kumar Gupta was appointed on 29 September 2017 and
resigned from the directorship of the Company w.e.f. 17 March 2018.
COMPOSITION OF AUDIT COMMITTEEThe Audit Committee has been constituted as per Section 177 of the Companies Act, 2013 to assist the Board in overseeing the quality and integrity of the accounting, auditing and reporting policies/practices of the Company and its compliance with the legal and regulatory requirements. The Committee, accordingly, monitors various issues which include accounting and financial reporting process of the Company, maintenance
of adequate internal financial controls, audit of the Company’s financial statements, the appointment, independence and performance of the statutory as also the internal auditors, secretarial auditors and the Company’s risk management policies.
The Audit Committee of the Company comprises of three members viz Mr. Anand Bordia, Chairman, Mr. Chander Khamesara, Member, Mr. Desh Raj Dogra, Member and Mr. Vinod Kumar Agarwal, Member as on 31 March 2018.
All the recommendations made by Audit committee were accepted by the Board.
During the year, Four meetings of the Committee were held on 29 May 2017, 09 September 2017, 13 November 2017 and 12 March 2018.
Details of the Audit Committee Meeting attended by each Members:
Name of Members Number of Meetings Attended
Mr. Vinod Kumar Agarwal 4
Mr. Chander Khamesara 4
Mr. Anand Bordia 4
Mr. Desh Raj Dogra 3
SECRETARIAL AUDITPursuant to provisions of Section 204 of the Act read with Rule 9 of the Companies (Appointment and Remuneration of Managerial Personnel) Rules 2014, the Board has appointed M/s Ronak Jhuthawat & Co., Company Secretaries in Practice, Udaipur as Secretarial Auditor of the Company to conduct the Secretarial Audit of the Company for the financial year ended 31 March 2018. The Secretarial Audit Report (in Form MR-3) is attached as Annexure ‘D’ to this Report.
COST AUDITORS AND COST AUDIT REPORTThe Company has re-appointed M/s Bikram Jain & Associates, Cost Accountants as Cost Auditors of the Company for the financial year 2018-19. They have furnished a Certificate to the effect that their appointment, if made, would be in accordance with the provisions of Section 148 of the Companies Act, 2013 read with Companies (Audit and Auditors) Rules, 2014.
The Board of Directors has also recommended remuneration payable to M/s Bikram Jain & Associates, Cost Auditor for FY 2018-19 to the members for their consideration and approval at the ensuing Annual General Meeting.
INTERNAL AUDITORSAs per the provisions of Section 138 of the Companies Act, 2013, the Board of Directors had appointed M/s S. Bhandari & Company, Chartered Accountants, Jaipur, as Internal Auditor to conduct internal audit of the Company for the Financial Year 2017-18.
COR
PO
RATE O
VERVIEW
STATU
TOR
Y REP
OR
TSFIN
AN
CIAL S
TATEMEN
TS
Annual Report 2017-18 31
G R Infraprojects Limited
INTERNAL FINANCIAL CONTROLSThe Company has adequate internal financial controls with reference to the financial statements. During the year, such controls were tested and no reportable material weaknesses in the design or operations were observed.
DISCLOSURE UNDER THE SEXUAL HARASSMENT OF WOMEN AT WORKPLACE (PREVENTION, PROHIBITION AND REDRESSAL) ACT, 2013The Company has in place an Anti Sexual Harassment Policy in line with the requirements of the Sexual Harassment of Women at the Workplace (Prevention, Prohibition & Redressal) Act, 2013. An ‘Internal Complaints Committee’ (‘ICC’) has been set up to redress complaints received regarding sexual harassment. All employees (permanent, contractual, temporary, trainees) are covered under this policy.
No complaint of sexual harassment has been received during the year 2017-18.
EXTRACT OF ANNUAL RETURN Extract of Annual Return of the Company is annexed herewith as Annexure ‘E’ to this report.
RISK MANAGEMENT POLICYThe Company has developed and implemented a risk management policy which identifies major risks which may threaten the existence of the Company. The same has also been adopted by your Board and is also subject to its review from time to time. Risk mitigation process and measures have been also formulated and clearly spelled out in the said policy.
SECRETARIAL STANDARDThe Directors have devised proper systems to ensure compliance with the provisions of all applicable Secretarial Standards and that such systems are adequate and operating effectively.
HUMAN RESOURCE MANAGEMENTHR Management at GRIL goes beyond the set boundaries of compensation, performance reviews and development. We look at the employees’ entire work life cycle, to insure timely interventions that help build a long-lasting and fruitful career. The Company continued with its drive to institutionalise and upgrade its HR processes to help build a more robust workforce capable of managing dynamic and growing business needs. In particular, it focused on improving its processes related to Integrated Development, Performance Management, Succession Planning and Recruitment.
The initiatives of your Company are aligned with its overall mission and strategy. Embracing new technology and progressive employee centric policies and practices have enabled your Company to strike a balance between business needs and individual aspirations. In recognition of the same, your Company significantly invests in professional development and providing career development opportunities for its employees. A robust training and development framework, which has a blend of classroom, on-line and on the job training, is aligned to the business needs and career path of individuals and provides talent with opportunities to help them excel in their work and be well equipped for future roles. Majority of the senior leaders have grown within the organisation. The leadership competency framework enables your Company to identify potential leaders, and ensures that your Company has ready talent pool to take up next level leadership roles.
APPRECIATIONThe Directors would like to express their grateful appreciation for the patronage, assistance and co-operation received from customers, banks, suppliers, stakeholders, Central & State Governments, other local statutory authorities and others associated with the Company.
The directors also wish to place on record their deep sense of appreciation for the excellent contribution made by employees at all levels, during the year under review.
For and on Behalf of Board,
Vinod Kumar Agarwal Ajendra AgarwalDate: 9 July 2018 Managing Director DirectorPlace: New Delhi DIN: 00182893 DIN: 01147897
32
ANNEXURE ‘A’
CORPORATE SOCIAL RESPONSIBILITY
The Company has constituted Corporate Social Responsibility Committee pursuant to provisions of section 135 of the Companies Act, 2013 read with Companies (Corporate Social Responsibility Policy) Rules, 2014.Annual Report on Corporate Social Responsibility for Financial Year 2017-18 are provided herein below:
1. A brief outline of the company’s CSR policy. G R Infraprojects Limited as a responsible corporate entity undertakes appropriate CSR measures having positive economic, social and environmental impact to transform lives and to help build more capable and vibrant communities by integrating its business values and strengths. In its continuous efforts to positively impact the society and to target the inclusive growth of all the stakeholders, the Company has formulated a guiding policy concentrating mainly on promoting education, environment sustainability, economic empowerment, rural development, health care and sanitation.Our policy on Corporate Social Responsibility is placed on our website at the link:http://grinfra.com/wp-content/uploads/2018/07/CORPORATE-SOCIAL-RESPONSIBILITY-POLICY.pd
2. The Composition of the CSR Committee CSR Committee comprises:Mr. Chander Khamesra - ChairmanMr. Vinod Kumar Agarwal - MemberMr. Ajendra Agarwal - Member
3. Average net profit of the company for last three financial years.
` 21,592.40 lakhs
4. Prescribed CSR Expenditure (two percent of the amount as in item 3 above).
` 431.85 lakhs
5. Details of CSR spent during the financial year 2017-18.
(a) Total amount to be spent for the Financial Year 2017-18.
` 431.85 lakhs
(b) Amount un-spent, if any. ` 362.74 lakhs6. In case the Company has failed to spend the
two per cent of the average net profit of the last three financial years or any part thereof, the company shall provide the reasons for not spending the amount in its Board’s Report :
The Company considers social responsibility as an integral part of its business activities and endeavors to utilise allocable CSR budget for the benefit of society. Your Company tried its best to identify genuine avenues for CSR activities, yet it could not identify any project till year end. However your Company is hopeful to expense unutilised expenses in succeeding year.
Manner in which the amount spent during the financial year is detailed below:
(1) (2) (3) (4) (5) (6) (7) (8)
S. No.
CSR project or activity identified
Sector in which The Project is Covered
Projects or Programs 1) Local area or other 2) Specify the state & District where projects or programmes was under take
Amount outlay (budget) project or programmes wise. (` in lakhs)
Amount spent on the projects or programmes Sub- heads : 1) Direct on projects or programmes 2) Overheads: (` in lakhs)
Cumulative Expenditure upto the reporting period. (` in lakhs)
Amount spent Direct or through implementing Agency.
1. Maintenance of Children ward of MB Hospital.
Health Care
Udaipur, Rajasthan. 13.00 12.53 12.53 Direct
2. Construction and Maintenance of Hospital.
Health Care
Sahawa, Churu, Rajasthan.
57.00 56.58 69.11 Direct
Total 70.00 69.11
Responsibility Statement
We hereby affirm that the CSR Policy, as approved by the Board has been implemented and the CSR committee monitors the implementation of the CSR activities in compliance with our CSR objectives and policy of the Company.
For and on Behalf of Board,
Vinod Kumar Agarwal Ajendra AgarwalDate: July 9, 2018 Managing Director DirectorPlace: New Delhi DIN: 00182893 DIN: 01147897

COR
PO
RATE O
VERVIEW
STATU
TOR
Y REP
OR
TSFIN
AN
CIAL S
TATEMEN
TS
Annual Report 2017-18 33
G R Infraprojects Limited
ANNEXURE ‘B’
Information Pursuant to Section 197 of the Companies Act, 2013 read with Companies (Appointment & Remuneration of Managerial Personnel) Rules, 2014 and Forming Part of the Directors’ Report for the year ended 31st March, 2018
Information as per Rule 5(2) and 5(3) of Chapter XIII, Companies (Appointment and Remuneration of Managerial Personnel) Rules, 2014
S. No.
Name Age in Years
Designation Date of commencement of
employment
Years of Experience
Remuneration % of Equity Shares held in the Company
1. Mr. Vinod Kumar Agarwal 58 Managing Director 22.12.1995 Over 21 year ` 8.60 Crore 4.97%
2. Mr. Ajendra Agarwal 54 Whole Time Director 01.04.2006 Over 21 year ` 8.60 Crore 4.31%
3. Mr. Purshottam Agarwal 45 Whole Time Director 26.12.2000 Over 16 year ` 8.60 Crore 4.22%
B. Employed for the part of the year ended 31st March, 2018 & were in receipt of remuneration aggregating not less than ` 8,50,000/- per month
NIL
Notes:-
1. Remuneration includes Salary, Allowances, Ex-gratia, Co’s Contribution to Provident & Superannuation Funds and value of other perquisites
on the basis of Income Tax Act, 1961.
2. Mr. Vinod Kumar Agarwal, Mr. Ajendra Agarwal and Mr. Purshottam Agarwal are brothers.
34
ANNEXURE ‘C’
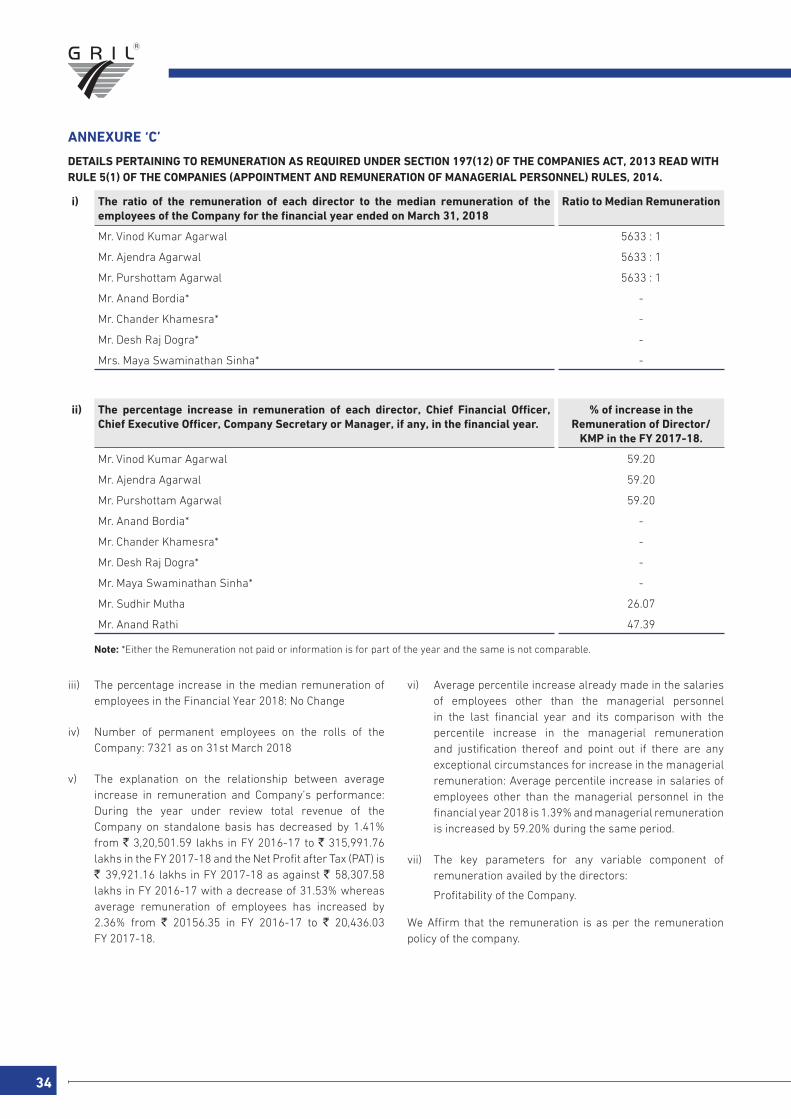
DETAILS PERTAINING TO REMUNERATION AS REQUIRED UNDER SECTION 197(12) OF THE COMPANIES ACT, 2013 READ WITH RULE 5(1) OF THE COMPANIES (APPOINTMENT AND REMUNERATION OF MANAGERIAL PERSONNEL) RULES, 2014.
i) The ratio of the remuneration of each director to the median remuneration of the employees of the Company for the financial year ended on March 31, 2018
Ratio to Median Remuneration
Mr. Vinod Kumar Agarwal 5633 : 1
Mr. Ajendra Agarwal 5633 : 1
Mr. Purshottam Agarwal 5633 : 1
Mr. Anand Bordia* -
Mr. Chander Khamesra* -
Mr. Desh Raj Dogra* -
Mrs. Maya Swaminathan Sinha* -
ii) The percentage increase in remuneration of each director, Chief Financial Officer, Chief Executive Officer, Company Secretary or Manager, if any, in the financial year.
% of increase in the Remuneration of Director/
KMP in the FY 2017-18.
Mr. Vinod Kumar Agarwal 59.20
Mr. Ajendra Agarwal 59.20
Mr. Purshottam Agarwal 59.20
Mr. Anand Bordia* -
Mr. Chander Khamesra* -
Mr. Desh Raj Dogra* -
Mr. Maya Swaminathan Sinha* -
Mr. Sudhir Mutha 26.07
Mr. Anand Rathi 47.39
Note: *Either the Remuneration not paid or information is for part of the year and the same is not comparable.
iii) The percentage increase in the median remuneration of employees in the Financial Year 2018: No Change
iv) Number of permanent employees on the rolls of the Company: 7321 as on 31st March 2018
v) The explanation on the relationship between average increase in remuneration and Company’s performance: During the year under review total revenue of the Company on standalone basis has decreased by 1.41% from ` 3,20,501.59 lakhs in FY 2016-17 to ` 315,991.76 lakhs in the FY 2017-18 and the Net Profit after Tax (PAT) is ` 39,921.16 lakhs in FY 2017-18 as against ` 58,307.58 lakhs in FY 2016-17 with a decrease of 31.53% whereas average remuneration of employees has increased by 2.36% from ` 20156.35 in FY 2016-17 to ` 20,436.03 FY 2017-18.
vi) Average percentile increase already made in the salaries of employees other than the managerial personnel in the last financial year and its comparison with the percentile increase in the managerial remuneration and justification thereof and point out if there are any exceptional circumstances for increase in the managerial remuneration: Average percentile increase in salaries of employees other than the managerial personnel in the financial year 2018 is 1.39% and managerial remuneration is increased by 59.20% during the same period.
vii) The key parameters for any variable component of remuneration availed by the directors:
Profitability of the Company.
We Affirm that the remuneration is as per the remuneration policy of the company.
COR
PO
RATE O
VERVIEW
STATU
TOR
Y REP
OR
TSFIN
AN
CIAL S
TATEMEN
TS
Annual Report 2017-18 35
G R Infraprojects Limited
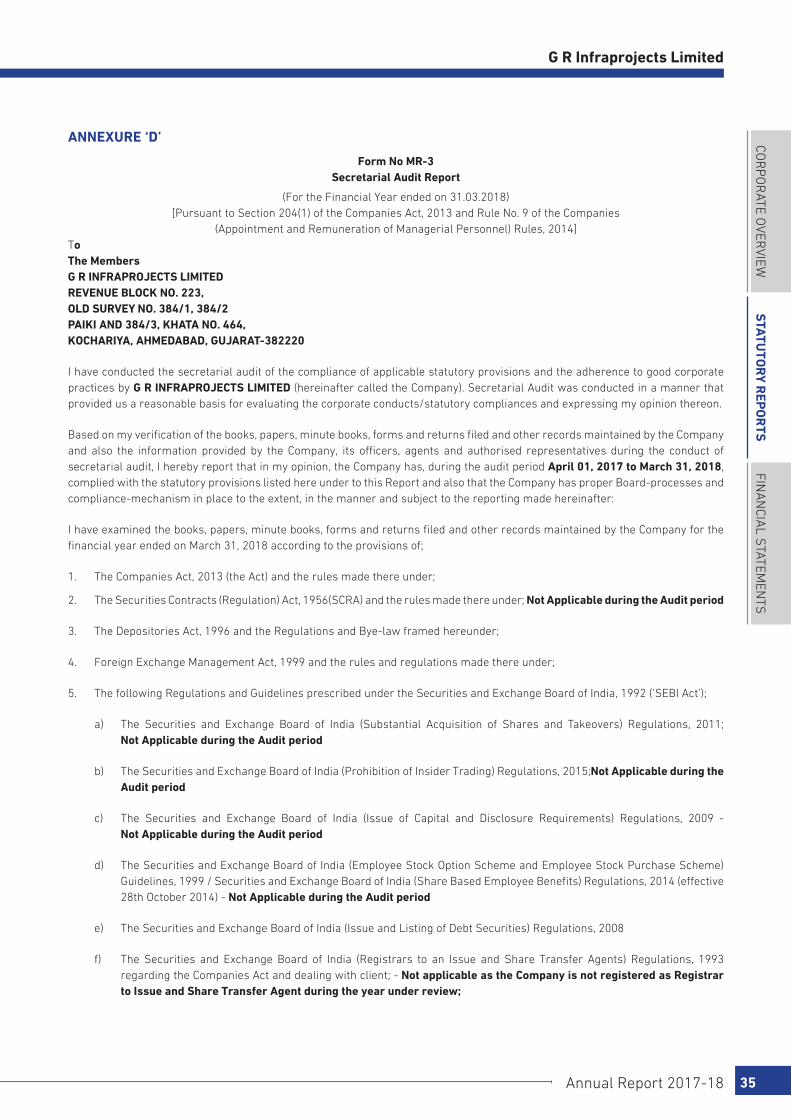
ANNEXURE ‘D’
Form No MR-3Secretarial Audit Report
(For the Financial Year ended on 31.03.2018)[Pursuant to Section 204(1) of the Companies Act, 2013 and Rule No. 9 of the Companies
(Appointment and Remuneration of Managerial Personnel) Rules, 2014]To The Members G R INFRAPROJECTS LIMITEDREVENUE BLOCK NO. 223, OLD SURVEY NO. 384/1, 384/2 PAIKI AND 384/3, KHATA NO. 464, KOCHARIYA, AHMEDABAD, GUJARAT-382220
I have conducted the secretarial audit of the compliance of applicable statutory provisions and the adherence to good corporate practices by G R INFRAPROJECTS LIMITED (hereinafter called the Company). Secretarial Audit was conducted in a manner that provided us a reasonable basis for evaluating the corporate conducts/statutory compliances and expressing my opinion thereon.
Based on my verification of the books, papers, minute books, forms and returns filed and other records maintained by the Company and also the information provided by the Company, its officers, agents and authorised representatives during the conduct of secretarial audit, I hereby report that in my opinion, the Company has, during the audit period April 01, 2017 to March 31, 2018, complied with the statutory provisions listed here under to this Report and also that the Company has proper Board-processes and compliance-mechanism in place to the extent, in the manner and subject to the reporting made hereinafter:
I have examined the books, papers, minute books, forms and returns filed and other records maintained by the Company for the financial year ended on March 31, 2018 according to the provisions of;
1. The Companies Act, 2013 (the Act) and the rules made there under;
2. The Securities Contracts (Regulation) Act, 1956(SCRA) and the rules made there under; Not Applicable during the Audit period
3. The Depositories Act, 1996 and the Regulations and Bye-law framed hereunder;
4. Foreign Exchange Management Act, 1999 and the rules and regulations made there under;
5. The following Regulations and Guidelines prescribed under the Securities and Exchange Board of India, 1992 (‘SEBI Act’);
a) The Securities and Exchange Board of India (Substantial Acquisition of Shares and Takeovers) Regulations, 2011; Not Applicable during the Audit period
b) The Securities and Exchange Board of India (Prohibition of Insider Trading) Regulations, 2015;Not Applicable during the Audit period
c) The Securities and Exchange Board of India (Issue of Capital and Disclosure Requirements) Regulations, 2009 - Not Applicable during the Audit period
d) The Securities and Exchange Board of India (Employee Stock Option Scheme and Employee Stock Purchase Scheme) Guidelines, 1999 / Securities and Exchange Board of India (Share Based Employee Benefits) Regulations, 2014 (effective 28th October 2014) - Not Applicable during the Audit period
e) The Securities and Exchange Board of India (Issue and Listing of Debt Securities) Regulations, 2008
f) The Securities and Exchange Board of India (Registrars to an Issue and Share Transfer Agents) Regulations, 1993 regarding the Companies Act and dealing with client; - Not applicable as the Company is not registered as Registrar to Issue and Share Transfer Agent during the year under review;

36
g) The Securities and Exchange Board of India (Delisting of Equity Shares) Regulations, 2009 – Not applicable as the Company has not delisted / propose to delist its equity shares from any Stock Exchange during the year under review; and
h) The Securities and Exchange Board of India (Buyback of Securities) Regulations, 1998 – Not applicable as the Company has not bought back or propose to buy-back any of its securities during the year under review.
6. The Company is into business of developing, constructing roads, highways, docks, bridges, canals, dams, reservoirs, wells, turnkey projects or any other infrastructural or architectural work. Accordingly, the following Major Industry specific Acts and Rules are applicable to the Company, in the view of the Management:
1. Contract Labour (Regulation and Abolition) Act, 1970.
2. All welfare act related to Employees
3. All pollution control acts, regulations and rules applicable.
4. Industrial Disputes Act, 1947
I have also examined compliance with the applicable clauses of the following:
(i) Secretarial Standards with respect to Meetings of Board of Directors (SS-1) and General Meetings (SS-2) issued by The Institute of Company Secretaries of India.
(ii) The Listing Agreement entered into by the Company with NSE Limited. During the period under review the Company has complied the provision of Listing Agreement.
We further report that
The Board of Directors of the Company is duly constituted with proper balance of Executive Directors, Non-Executive Directors and Independent Directors. The changes in the composition of the Board of Directors that took place during the period under review were carried out in compliance with the provisions of the Act.
Adequate notice is given to all Directors to schedule the Board Meetings, agenda and detailed notes on agenda were sent at least seven days in advance, and a system exists for seeking and obtaining further information and clarification on the agenda items before the meeting and for meaningful participation at the meeting.
All decision at Board Meetings and Committee Meetings are carried unanimously as recorded in the minutes of the Meetings of the Board of Directors or Committee of the Board, as the case may be.
I further report that there are adequate systems and processes commensurate with its size and operations of the Company to monitor and ensure compliance with all applicable laws, rules, regulations and guidelines.
I further report that during the review period, Company has taken following major action having a bearing on the Company’s affairs in pursuance of the above referred laws, rule, regulations, guidelines, standards, etc. have taken place.
• CompanyhasalteredclauseIII (A)(1)of itsMemorandumofAssociationpursuanttoShareholders’ResolutiondatedMay 15, 2017.
• PursuanttoShareholders’ResolutiondatedMay15,2017andsubsequentconfirmationfromRegionalDirectorofMCAonAugust 10, 2017, registered office of the Company was shifted from the State of Rajasthan to the State of Gujarat
• Companyhasissued,1500,7.85%Secured,Senior,Redeemable,Unrated,UnlistedNon–ConvertibleDebentureswithafacevalue of INR 10,00,000 each, aggregating to INR 1,50,00,00,000 on private placement basis.
• Company has redeemed 250 Non - Convertible Redeemable Debentures on May 19, 2017 and 250 Non - ConvertibleRedeemable Debentures on November 20, 2017 and in compliance with the specified procedures and within the stipulated time.
COR
PO
RATE O
VERVIEW
STATU
TOR
Y REP
OR
TSFIN
AN
CIAL S
TATEMEN
TS
Annual Report 2017-18 37
G R Infraprojects Limited
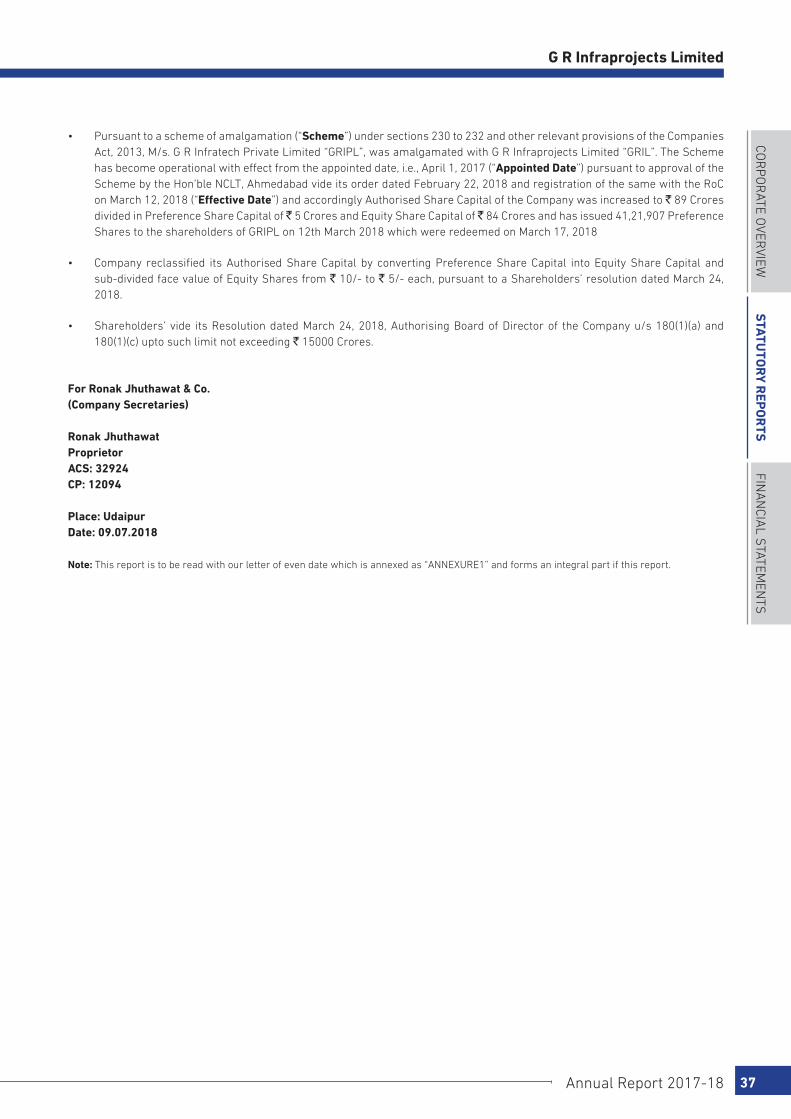
• Pursuanttoaschemeofamalgamation(“Scheme”) under sections 230 to 232 and other relevant provisions of the Companies Act, 2013, M/s. G R Infratech Private Limited “GRIPL”, was amalgamated with G R Infraprojects Limited “GRIL”. The Scheme has become operational with effect from the appointed date, i.e., April 1, 2017 (“Appointed Date”) pursuant to approval of the Scheme by the Hon’ble NCLT, Ahmedabad vide its order dated February 22, 2018 and registration of the same with the RoC on March 12, 2018 (“Effective Date”) and accordingly Authorised Share Capital of the Company was increased to ` 89 Crores divided in Preference Share Capital of ̀ 5 Crores and Equity Share Capital of ̀ 84 Crores and has issued 41,21,907 Preference Shares to the shareholders of GRIPL on 12th March 2018 which were redeemed on March 17, 2018
• Company reclassified itsAuthorisedShareCapital by convertingPreferenceShareCapital intoEquityShareCapital and sub-divided face value of Equity Shares from ` 10/- to ` 5/- each, pursuant to a Shareholders’ resolution dated March 24, 2018.
• Shareholders’vide itsResolutiondatedMarch24,2018,AuthorisingBoardofDirectorof theCompanyu/s180(1)(a)and180(1)(c) upto such limit not exceeding ` 15000 Crores.
For Ronak Jhuthawat & Co.(Company Secretaries)
Ronak JhuthawatProprietorACS: 32924CP: 12094
Place: UdaipurDate: 09.07.2018
Note: This report is to be read with our letter of even date which is annexed as “ANNEXURE1” and forms an integral part if this report.

38
ANNEXURE ‘1’
To The Members G R INFRAPROJECTS LIMITEDREVENUE BLOCK NO. 223, OLD SURVEY NO. 384/1, 384/2 PAIKI AND 384/3, KHATA NO. 464, KOCHARIYA, AHMEDABAD, GUJARAT-382220
My report of even date is to be read along with this letter.
A. Maintenance of Secretarial records is the responsibility of the management of the Company. My responsibility is to express an opinion on these secretarial records based on my audit.
B. I have followed the audit practices and processes as were appropriate to obtain reasonable assurance about the correctness of the contents of the Secretarial records. The verification was done on the test basis to ensure that correct facts are reflected in Secretarial records. Ibelieve that the processes and practices, I followed provide a reasonable basis for my opinion.
C. I have not verified the correctness and appropriateness of financial records and books of accounts of the Company.
D. Where ever required, I have obtained the Management representation about compliance of laws, rules and regulations and happenings of events etc.
E. The compliance of provisions of Corporate and other applicable laws, rules, regulations, standards is the responsibility of the management. My examination was limited to the verification of procedures on test basis.
F. The Secretarial Audit Report is neither an assurance as to the future viability of the Company nor of efficacy or effectiveness with which the management has conducted the affairs of the Company.
For Ronak Jhuthawat & Co.(Company Secretaries)
Ronak JhuthawatProprietorACS: 32924CP: 12094
Place: UdaipurDate: 09.07.2018

COR
PO
RATE O
VERVIEW
STATU
TOR
Y REP
OR
TSFIN
AN
CIAL S
TATEMEN
TS
Annual Report 2017-18 39
G R Infraprojects Limited
ANNEXURE ‘E’
FORM NO. MGT 9
EXTRACT OF ANNUAL RETURN
as on financial year ended on 31.03.2018Pursuant to Section 92 (3) of the Companies Act, 2013 and rule 12(1) of the Company (Management & Administration) Rules, 2014.
I REGISTRATION & OTHER DETAILS:
i CIN U45201GJ1995PLC098652
ii Registration Date 22.12.1995
iii Name of the Company G R INFRAPROJECTS LIMITED
iv Category/Sub-category of the Company Limited Company/ Company having Share Capital
v Address of the Registered office & contact details Revenue Block No. 223, Old Survey No. 384/1, 384/2 Paiki and 384/3, Khata No. 464, Kochariya, Ahmedabad, Gujarat-382220
vi Whether listed company Yes (Debt Listed)
vii Name, Address & contact details of the Registrar & Transfer Agent, if any.
Karvy Computershare Pvt Ltd Karvy Selenium Tower B, Plot 31-32, Gachibowli, Financial District, Nanakramguda, Hyderabad – 500 032 Contact No. 040 23312454
II PRINCIPAL BUSINESS ACTIVITIES OF THE COMPANY All the business activities contributing 10% or more of the total turnover of the company shall be stated
SL No
Name & Description of main products/services NIC Code of the Product /service
% to total turnover of the company
1 Construction of roads and railways 421 96.68%
III PARTICULARS OF HOLDING, SUBSIDIARY & ASSOCIATE COMPANIES
Sl No
Name & Address of the Company CIN/GLN Holding/ Subsidiary/ Associate
% OF SHARES
HELD
APPLICABLE SECTION
1 Reengus Sikar Expressway Limited 1097, Sector A, Pocket A, Vasant Kunj, New Delhi 110070, India
U45400DL2011PLC217481 Subsidiary 99.98% Section 2(87)
2 G R Building & Construction Nigeria Ltd 2, Abdullai Ibrahim Close, Asokoro Abuja FCT, Nigeria
N.A. Subsidiary 99.38% Section 2(87)
3 G R Infrastructure Limited, Nigeria 2 Abdullahi Ibrahim Close, Asokoro Abuja FCT, Nigeria
N.A. Subsidiary 92.00% Section 2(87)
4 GR Phagwara Expressway Limited GR House, Hiran Magri, Sector-11, Udaipur, Rajasthan 313002, India
U45400RJ2016PLC056040 Subsidiary 100.00% Section 2(87)
5 Nagaur Mukundgarh Highways Private Limited 1st Floor, Plot No. 11, B-1, LSC, Vasant Kunj, New Delhi -110070, India
U45309DL2017PTC312406 Subsidiary 100.00% Section 2(87)
6 Varanasi Sangam Expressway Private Limited GR House, Hiran Magri, Sector-11, Udaipur, Rajasthan 313002, India
U45500RJ2017PTC057753 Subsidiary 100.00% Section 2(87)
7 Porbandar Dwarka Expressway Private Limited GR House, Hiran Magri, Sector-11, Udaipur, Rajasthan 313002, India
U45200RJ2017PTC058283 Subsidiary 100.00% Section 2(87)

40
IV SHAREHOLDING PATTERN (Equity Share capital Break up as % to total Equity) (i) Category wise share holding
Category of Shareholders No. of Shares held at the beginning of the year
No. of Shares held at the end of the year % change during
the yearDemat Physical Total % of
Total Shares
Demat Physical Total % of Total
Shares
A. Promoters & Promoters Group
(1) Indiana) Individual/HUF 6,004,000 - 6,004,000 12.07 49,008,000 - 49,008,000 49.28 37.21
b) Central Govt.or State Govt.
c) Bodies Corporates 36,557,916 - 36,557,916 73.52 36,115,832 - 36,115,832 36.32 -37.21
d) Bank/FI
e) Any other
SUB TOTAL:(A) (1) 42,561,916 - 42,561,916 85.60 85,123,832 - 85,123,832 85.60 0.00(2) Foreigna) NRI- Individuals
b) Other Individuals
c) Bodies Corp.
d) Banks/FI
e) Any other…
SUB TOTAL (A) (2) - - - - - - - - -Total Shareholding of Promoter (A)= (A)(1)+(A)(2)
42,561,916 - 42,561,916 85.60 85,123,832 - 85,123,832 85.60 0.00
B. PUBLIC SHAREHOLDING(1) Institutionsa) Mutual Funds
b) Banks/FI
C) Central govt
d) State Govt.
e) Venture Capital Fund 1,624,654 - 1,624,654 3.27 3,249,308 - 3,249,308 3.27
f) Insurance Companies
g) FIIS
h) Foreign Venture Capital Funds
i) Others (specify)
SUB TOTAL (B)(1): 1,624,654 - 1,624,654 3.27 3,249,308 - 3,249,308 3.27 -(2) Non Institutionsa) Bodies corporates
i) Indian 746,000 - 746,000 1.50 1,492,000 - 1,492,000 1.50
ii) Overseas 3,298,540 - 3,298,540 6.63 6,597,080 - 6,597,080 6.63
b) Individuals
i) Individual shareholders holding nominal share capital upto ` 1 lakhs
ii) Individuals shareholders holding nominal share capital in excess of ` 1 lakhs
250,000 - 250,000 0.50 500,000 - 500,000 0.50
c) Others (Trust) 1,243,106 - 1,243,106 2.50 2,486,212 - 2,486,212 2.50
Foreign Nationals
Trust
Overseas Corporate Bodies
SUB TOTAL (B)(2): 5,537,646 0 5,537,646 11.14 11,075,292 - 11,075,292 11.14Total Public Shareholding (B)= (B)(1)+(B)(2)
7,162,300 - 7,162,300 14.40 14,324,600 - 14,324,600 14.40 -
C. Shares held by Custodian for GDRs & ADRs
- - - - - - - - -
Grand Total (A+B+C) 49,724,216 - 49,724,216 100.00 99,448,432 - 99,448,432 100.00 -

COR
PO
RATE O
VERVIEW
STATU
TOR
Y REP
OR
TSFIN
AN
CIAL S
TATEMEN
TS
Annual Report 2017-18 41
G R Infraprojects Limited
(ii) SHARE HOLDING OF PROMOTERS
Sl No.
Shareholders Name Shareholding at the beginning of the year i.e. 01st April, 2017
Shareholding at the end of the year i.e. 31st March, 2018
% change in share holding during
the year
No. of shares
% of total shares
of the company
% of shares pledged
encumbered to total shares
No. of shares
% of total shares
of the company
% of shares pledged
encumbered to total shares
1 Vinod Kumar Agarwal 1074414 2.16 - 4941512 4.97 0.88 2.81
2 Ajendra Agarwal 862398 1.73 - 4290448 4.31 - 2.58
3 Purshottam Agarwal 861894 1.73 - 4192048 4.22 - 2.48
4 G R Infratech Pvt Ltd. 18500000 37.21 - - - - -37.21
5 Lokesh Builders Pvt Ltd. 15957916 32.09 - 31915832 32.09 1.33 0.00
Total 37256622 74.93 - 45339840 45.59 2.21 -29.34
*G R Infratech Pvt. Ltd. was amalgameted with G R Infraprojects Ltd.
(iii) CHANGE IN PROMOTERS’ SHAREHOLDING (SPECIFY IF THERE IS NO CHANGE)
Sl No.
Name of Promoters / Promoters Group
Share holding at the begning of the year
increase / decrease
during the year
Date wise increase / decrease
Reason for increase / decrease
Cumulative Share holding during the year
No. Shares
% of Total Shares
of the Company
No. Shares
% of Total Shares
of the Company
1 Vinod Kumar Agarwal
1074414 2.16 1665000 3/12/2018 Allotment pursuant to amalgamation of G R Infratech Private Limited with G R Infraprojects Limited
2739414
-268658 3/23/2018 Transfer to Shakuntala Devi Gupta
2470756
Each equity share of Company with a face value of ` 10 each was sub-divided into two Equity Shares with a face value of ` 5 each, pursuant to a Shareholders’ resolution dated March 24, 2018.
4941512 4.972 Ajendra Agarwal 862398 1.73 1480000 3/12/2018 Allotment pursuant to
amalgamation of G R Infratech Private Limited with G R Infraprojects Limited
2342398
-10752 3/27/2018 Transfer to Shakuntala Devi Gupta
2331646
-186422 3/27/2018 Transfer to Harish Agarwal 2145224
Each equity share of Company with a face value of ` 10 each was sub-divided into two Equity Shares with a face value of ` 5 each, pursuant to a Shareholders’ resolution dated March 24, 2018.
4290448 4.313 Purshottam
Agarwal861894 1.73 100598 10/25/2017 Transmission from Gumani
Ram Agarwal 962492
1665000 3/12/2018 Allotment pursuant to amalgamation of G R Infratech Private Limited with G R Infraprojects Limited
2627492
-531468 3/23/2018 Transfer to Shakuntala Devi Gupta
2096024
Each equity share of Company with a face value of ` 10 each was sub-divided into two Equity Shares with a face value of ` 5 each, pursuant to a Shareholders’ resolution dated March 24, 2018.
4192048 4.224 G R Infratech
Pvt Ltd.18500000 37.21 -18500000 3/12/2018 Cancellation of Shares
pursuant to amalgamation of G R Infratech Private Limited with G R Infraprojects Limited
0
0 0.005 Lokesh Builders
Pvt Ltd.15957916 32.09 - - - 15957916
Each equity share of Company with a face value of ` 10 each was sub-divided into two Equity Shares with a face value of ` 5 each, pursuant to a Shareholders’ resolution dated March 24, 2018.
31915832 32.09Total 37256622 74.93 45339840 45.59
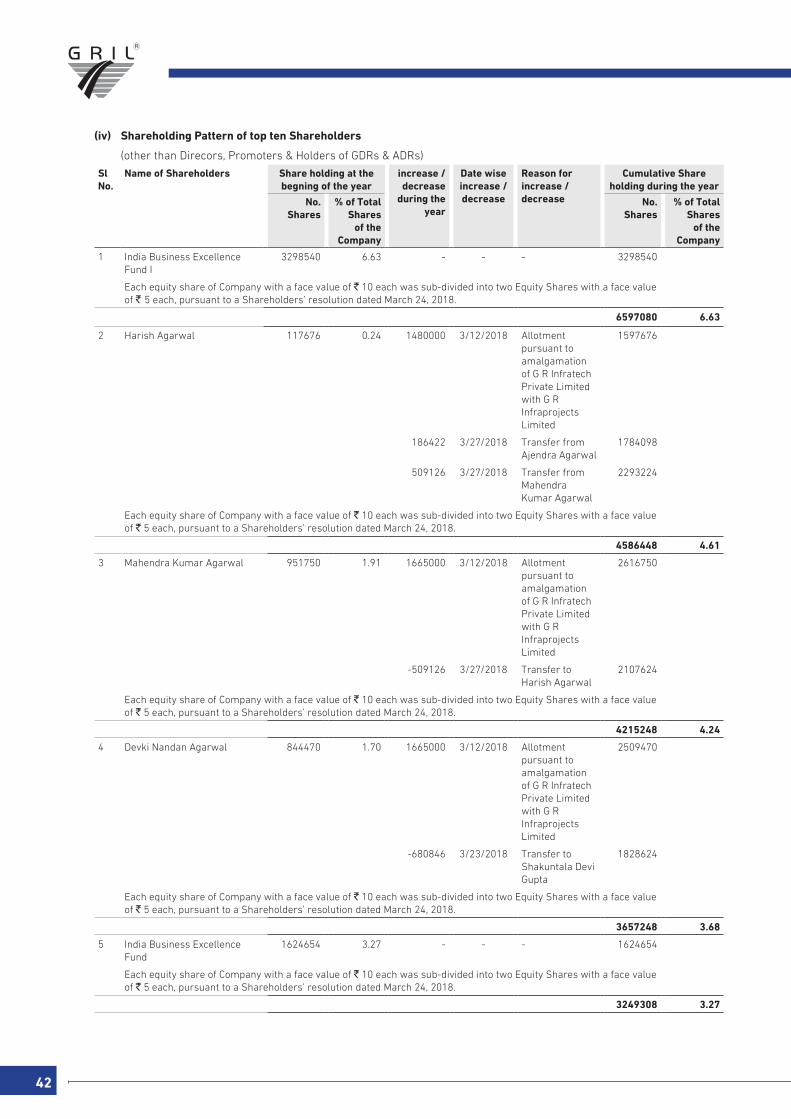
42
(iv) Shareholding Pattern of top ten Shareholders
(other than Direcors, Promoters & Holders of GDRs & ADRs)
Sl No.
Name of Shareholders Share holding at the begning of the year
increase / decrease
during the year
Date wise increase / decrease
Reason for increase / decrease
Cumulative Share holding during the year
No. Shares
% of Total Shares
of the Company
No. Shares
% of Total Shares
of the Company
1 India Business Excellence Fund I
3298540 6.63 - - - 3298540
Each equity share of Company with a face value of ` 10 each was sub-divided into two Equity Shares with a face value of ` 5 each, pursuant to a Shareholders’ resolution dated March 24, 2018.
6597080 6.63
2 Harish Agarwal 117676 0.24 1480000 3/12/2018 Allotment pursuant to amalgamation of G R Infratech Private Limited with G R Infraprojects Limited
1597676
186422 3/27/2018 Transfer from Ajendra Agarwal
1784098
509126 3/27/2018 Transfer from Mahendra Kumar Agarwal
2293224
Each equity share of Company with a face value of ` 10 each was sub-divided into two Equity Shares with a face value of ` 5 each, pursuant to a Shareholders’ resolution dated March 24, 2018.
4586448 4.61
3 Mahendra Kumar Agarwal 951750 1.91 1665000 3/12/2018 Allotment pursuant to amalgamation of G R Infratech Private Limited with G R Infraprojects Limited
2616750
-509126 3/27/2018 Transfer to Harish Agarwal
2107624
Each equity share of Company with a face value of ` 10 each was sub-divided into two Equity Shares with a face value of ` 5 each, pursuant to a Shareholders’ resolution dated March 24, 2018.
4215248 4.24
4 Devki Nandan Agarwal 844470 1.70 1665000 3/12/2018 Allotment pursuant to amalgamation of G R Infratech Private Limited with G R Infraprojects Limited
2509470
-680846 3/23/2018 Transfer to Shakuntala Devi Gupta
1828624
Each equity share of Company with a face value of ` 10 each was sub-divided into two Equity Shares with a face value of ` 5 each, pursuant to a Shareholders’ resolution dated March 24, 2018.
3657248 3.68
5 India Business Excellence Fund
1624654 3.27 - - - 1624654
Each equity share of Company with a face value of ` 10 each was sub-divided into two Equity Shares with a face value of ` 5 each, pursuant to a Shareholders’ resolution dated March 24, 2018.
3249308 3.27
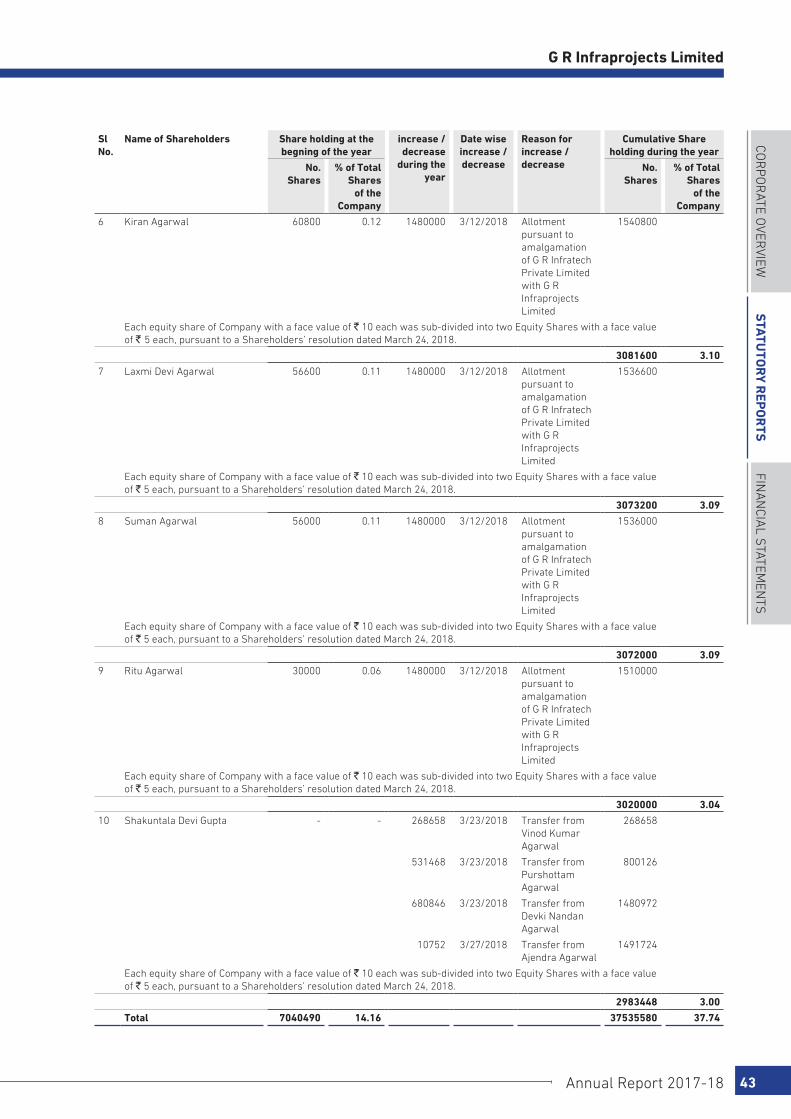
COR
PO
RATE O
VERVIEW
STATU
TOR
Y REP
OR
TSFIN
AN
CIAL S
TATEMEN
TS
Annual Report 2017-18 43
G R Infraprojects Limited
Sl No.
Name of Shareholders Share holding at the begning of the year
increase / decrease
during the year
Date wise increase / decrease
Reason for increase / decrease
Cumulative Share holding during the year
No. Shares
% of Total Shares
of the Company
No. Shares
% of Total Shares
of the Company
6 Kiran Agarwal 60800 0.12 1480000 3/12/2018 Allotment pursuant to amalgamation of G R Infratech Private Limited with G R Infraprojects Limited
1540800
Each equity share of Company with a face value of ` 10 each was sub-divided into two Equity Shares with a face value of ` 5 each, pursuant to a Shareholders’ resolution dated March 24, 2018.
3081600 3.10
7 Laxmi Devi Agarwal 56600 0.11 1480000 3/12/2018 Allotment pursuant to amalgamation of G R Infratech Private Limited with G R Infraprojects Limited
1536600
Each equity share of Company with a face value of ` 10 each was sub-divided into two Equity Shares with a face value of ` 5 each, pursuant to a Shareholders’ resolution dated March 24, 2018.
3073200 3.09
8 Suman Agarwal 56000 0.11 1480000 3/12/2018 Allotment pursuant to amalgamation of G R Infratech Private Limited with G R Infraprojects Limited
1536000
Each equity share of Company with a face value of ` 10 each was sub-divided into two Equity Shares with a face value of ` 5 each, pursuant to a Shareholders’ resolution dated March 24, 2018.
3072000 3.09
9 Ritu Agarwal 30000 0.06 1480000 3/12/2018 Allotment pursuant to amalgamation of G R Infratech Private Limited with G R Infraprojects Limited
1510000
Each equity share of Company with a face value of ` 10 each was sub-divided into two Equity Shares with a face value of ` 5 each, pursuant to a Shareholders’ resolution dated March 24, 2018.
3020000 3.04
10 Shakuntala Devi Gupta - - 268658 3/23/2018 Transfer from Vinod Kumar Agarwal
268658
531468 3/23/2018 Transfer from Purshottam Agarwal
800126
680846 3/23/2018 Transfer from Devki Nandan Agarwal
1480972
10752 3/27/2018 Transfer from Ajendra Agarwal
1491724
Each equity share of Company with a face value of ` 10 each was sub-divided into two Equity Shares with a face value of ` 5 each, pursuant to a Shareholders’ resolution dated March 24, 2018.
2983448 3.00
Total 7040490 14.16 37535580 37.74
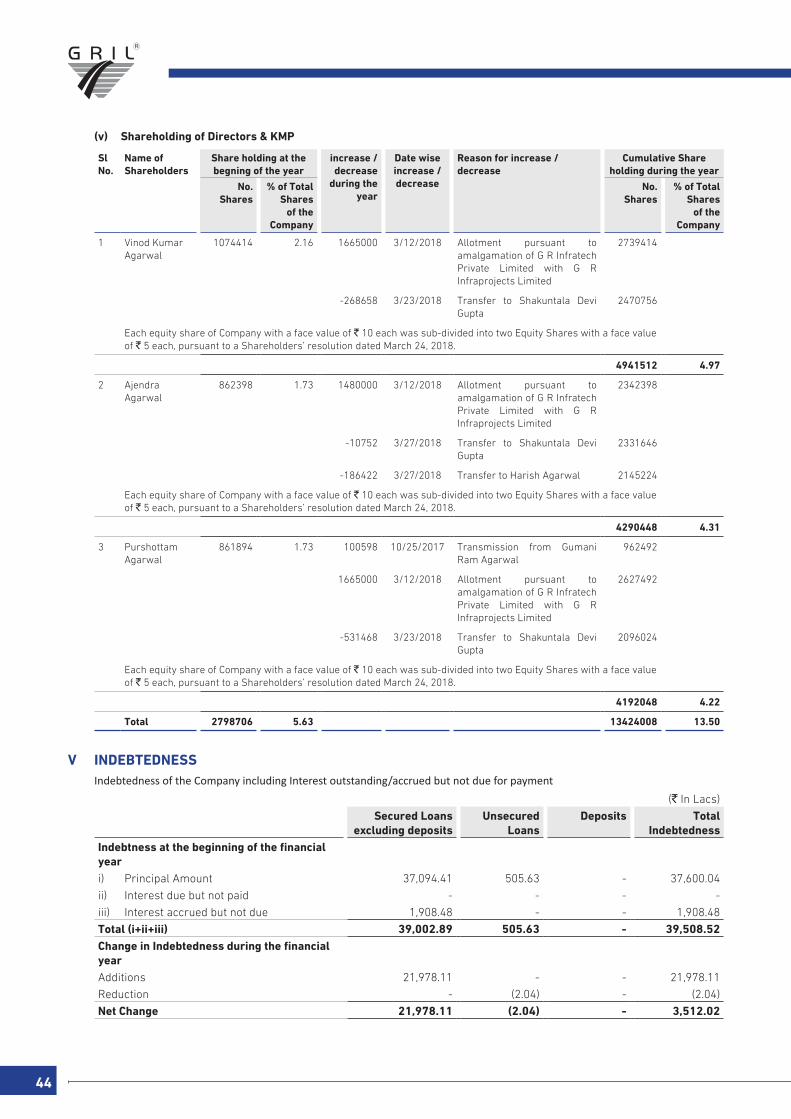
44
(v) Shareholding of Directors & KMP
Sl No.
Name of Shareholders
Share holding at the begning of the year
increase / decrease
during the year
Date wise increase / decrease
Reason for increase / decrease
Cumulative Share holding during the year
No. Shares
% of Total Shares
of the Company
No. Shares
% of Total Shares
of the Company
1 Vinod Kumar Agarwal
1074414 2.16 1665000 3/12/2018 Allotment pursuant to amalgamation of G R Infratech Private Limited with G R Infraprojects Limited
2739414
-268658 3/23/2018 Transfer to Shakuntala Devi Gupta
2470756
Each equity share of Company with a face value of ` 10 each was sub-divided into two Equity Shares with a face value of ` 5 each, pursuant to a Shareholders’ resolution dated March 24, 2018.
4941512 4.97
2 Ajendra Agarwal
862398 1.73 1480000 3/12/2018 Allotment pursuant to amalgamation of G R Infratech Private Limited with G R Infraprojects Limited
2342398
-10752 3/27/2018 Transfer to Shakuntala Devi Gupta
2331646
-186422 3/27/2018 Transfer to Harish Agarwal 2145224
Each equity share of Company with a face value of ` 10 each was sub-divided into two Equity Shares with a face value of ` 5 each, pursuant to a Shareholders’ resolution dated March 24, 2018.
4290448 4.31
3 Purshottam Agarwal
861894 1.73 100598 10/25/2017 Transmission from Gumani Ram Agarwal
962492
1665000 3/12/2018 Allotment pursuant to amalgamation of G R Infratech Private Limited with G R Infraprojects Limited
2627492
-531468 3/23/2018 Transfer to Shakuntala Devi Gupta
2096024
Each equity share of Company with a face value of ` 10 each was sub-divided into two Equity Shares with a face value of ` 5 each, pursuant to a Shareholders’ resolution dated March 24, 2018.
4192048 4.22
Total 2798706 5.63 13424008 13.50
V INDEBTEDNESS Indebtedness of the Company including Interest outstanding/accrued but not due for payment
(` In Lacs)
Secured Loans excluding deposits
Unsecured Loans
Deposits Total Indebtedness
Indebtness at the beginning of the financial yeari) Principal Amount 37,094.41 505.63 - 37,600.04
ii) Interest due but not paid - - - -
iii) Interest accrued but not due 1,908.48 - - 1,908.48
Total (i+ii+iii) 39,002.89 505.63 - 39,508.52Change in Indebtedness during the financial yearAdditions 21,978.11 - - 21,978.11
Reduction - (2.04) - (2.04)
Net Change 21,978.11 (2.04) - 3,512.02
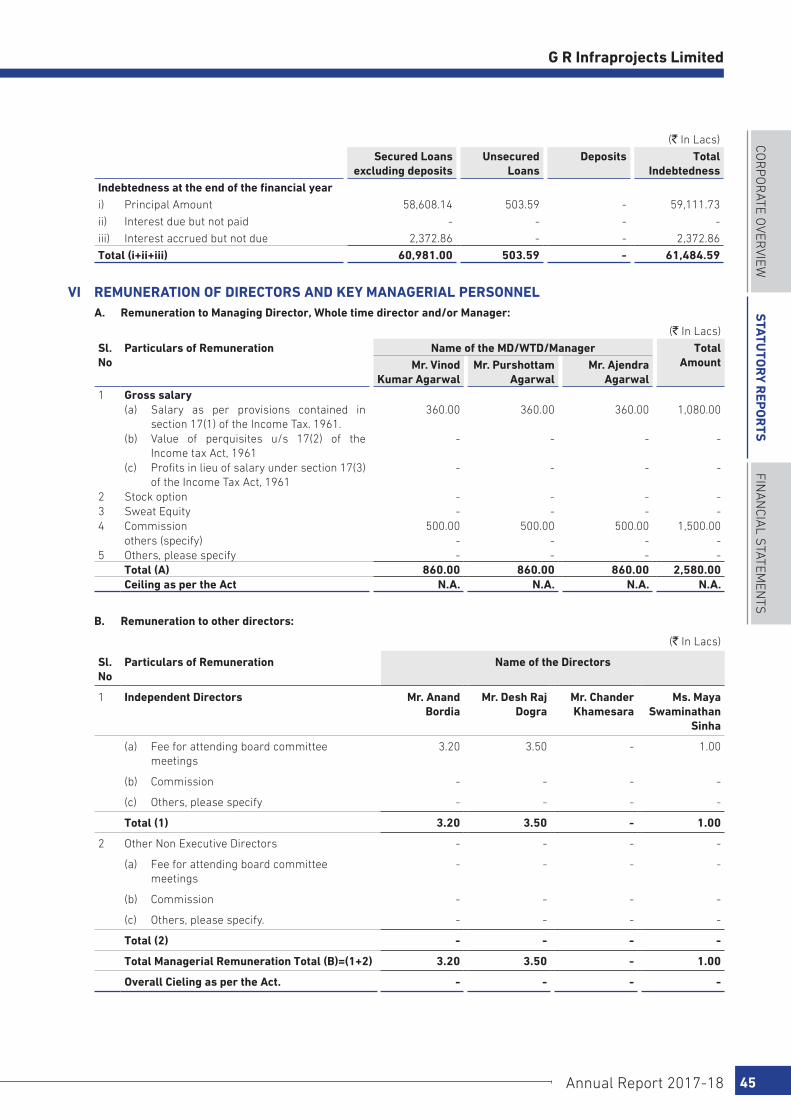
COR
PO
RATE O
VERVIEW
STATU
TOR
Y REP
OR
TSFIN
AN
CIAL S
TATEMEN
TS
Annual Report 2017-18 45
G R Infraprojects Limited
(` In Lacs)
Secured Loans excluding deposits
Unsecured Loans
Deposits Total Indebtedness
Indebtedness at the end of the financial yeari) Principal Amount 58,608.14 503.59 - 59,111.73
ii) Interest due but not paid - - - -
iii) Interest accrued but not due 2,372.86 - - 2,372.86
Total (i+ii+iii) 60,981.00 503.59 - 61,484.59
VI REMUNERATION OF DIRECTORS AND KEY MANAGERIAL PERSONNEL A. Remuneration to Managing Director, Whole time director and/or Manager:
(` In Lacs)
Sl. No
Particulars of Remuneration Name of the MD/WTD/Manager Total AmountMr. Vinod
Kumar AgarwalMr. Purshottam
AgarwalMr. Ajendra
Agarwal1 Gross salary
(a) Salary as per provisions contained in section 17(1) of the Income Tax. 1961.
360.00 360.00 360.00 1,080.00
(b) Value of perquisites u/s 17(2) of the Income tax Act, 1961
- - - -
(c) Profits in lieu of salary under section 17(3) of the Income Tax Act, 1961
- - - -
2 Stock option - - - -3 Sweat Equity - - - -4 Commission 500.00 500.00 500.00 1,500.00
others (specify) - - - -5 Others, please specify - - - -
Total (A) 860.00 860.00 860.00 2,580.00Ceiling as per the Act N.A. N.A. N.A. N.A.
B. Remuneration to other directors:
(` In Lacs)
Sl. No
Particulars of Remuneration Name of the Directors
1 Independent Directors Mr. Anand Bordia
Mr. Desh Raj Dogra
Mr. Chander Khamesara
Ms. Maya Swaminathan
Sinha
(a) Fee for attending board committee meetings
3.20 3.50 - 1.00
(b) Commission - - - -
(c) Others, please specify - - - -
Total (1) 3.20 3.50 - 1.00
2 Other Non Executive Directors - - - -
(a) Fee for attending board committee meetings
- - - -
(b) Commission - - - -
(c) Others, please specify. - - - -
Total (2) - - - -
Total Managerial Remuneration Total (B)=(1+2) 3.20 3.50 - 1.00
Overall Cieling as per the Act. - - - -

46
C. REMUNERATION TO KEY MANAGERIAL PERSONNEL OTHER THAN MD/MANAGER/WTD
(` In Lacs)
Sl. No
Particulars of Remuneration Key Managerial Personnel
1 Gross Salary CFO (Mr. Anand Rathi)
Company Secretary (Mr. Sudhir Mutha)
Total
(a) Salary as per provisions contained in section 17(1) of the Income Tax Act, 1961.
36.00 13.28 49.28
(b) Value of perquisites u/s 17(2) of the Income Tax Act, 1961
- - -
(c) Profits in lieu of salary under section 17(3) of the Income Tax Act, 1961
- - -
2 Stock Option - - -
3 Sweat Equity - - -
4 Commission - - -
as % of profit - - -
others, specify - - -
5 Others, please specify - - -
Total 36.00 13.28 49.28
VII PENALTIES/PUNISHMENT/COMPOUNDING OF OFFENCES
Type Section of the Companies Act
Brief Description
Details of Penalty/Punishment/Compounding fees imposed
Authority (RD/NCLT/Court)
Appeal made if any (give details)
A. COMPANY
Penalty
Punishment NIL
Compounding
B. DIRECTORS
Penalty
Punishment NIL
Compounding
C. OTHER OFFICERS IN DEFAULT
Penalty
Punishment NIL
Compounding

COR
PO
RATE O
VERVIEW
STATu
TOR
y REP
OR
TSFin
an
cial S
tatemen
tS
Annual Report 2017-18 47
G R Infraprojects Limited
To the Members of G R Infraprojects Limited
Report on the Standalone Ind AS Financial StatementsWe have audited the accompanying standalone Ind AS financial statements of G R Infraprojects Limited (‘the Company’), which comprise the Balance Sheet as at 31 March 2018, the Statement of Profit and Loss and Other Comprehensive Income, the Statement of Changes in Equity and the Cash Flow Statement for the year then ended and a summary of the significant accounting policies and other explanatory information (herein after referred to as “standalone Ind AS financial statements”).
Management’s Responsibility for the Standalone Ind AS Financial StatementsThe Company’s Board of Directors is responsible for the matters stated in Section 134(5) of the Companies Act, 2013 (“the Act”) with respect to the preparation of these standalone Ind AS financial statements that give a true and fair view of the financial position, financial performance including other comprehensive income, changes in equity and cash flows of the Company in accordance with the accounting principles generally accepted in India, including the Indian Accounting Standards (Ind AS) prescribed under Section 133 of the Act.
This responsibility also includes maintenance of adequate accounting records in accordance with the provisions of the Act for safeguarding the assets of the Company and for preventing and detecting frauds and other irregularities; selection and application of appropriate accounting policies; making judgments and estimates that are reasonable and prudent; and design, implementation and maintenance of adequate internal financial controls, that were operating effectively for ensuring the accuracy and completeness of the accounting records, relevant to the preparation and presentation of the standalone Ind AS financial statements that give a true and fair view and are free from material misstatement, whether due to fraud or error.
In preparing the financial statements, management is responsible for assessing the Company’s ability to continue as a going concern, disclosing, as applicable, matters related to going concern and using the going concern basis of accounting unless management either intends to liquidate the Company or to cease operations, or has no realistic alternative but to do so.
Auditors’ ResponsibilityOur responsibility is to express an opinion on these standalone Ind AS financial statements based on our audit.
In conducting our audit, we have taken into account the provisions of the Act, the accounting and auditing standards
Independent Auditors’ Report
and matters which are required to be included in the audit report under the provisions of the Act and the Rules made thereunder.
We conducted our audit of the standalone Ind AS financial statements in accordance with the Standards on Auditing specified under Section 143(10) of the Act. Those Standards require that we comply with ethical requirements and plan and perform the audit to obtain reasonable assurance about whether the standalone Ind AS financial statements are free from material misstatement.
An audit involves performing procedures to obtain audit evidence about the amounts and the disclosures in the standalone Ind AS financial statements. The procedures selected depend on the auditors’ judgment, including the assessment of the risks of material misstatement of the standalone Ind AS financial statements, whether due to fraud or error. In making those risk assessments, the auditor considers internal financial control relevant to the Company’s preparation of the standalone Ind AS financial statements that give a true and fair view in order to design audit procedures that are appropriate in the circumstances. An audit also includes evaluating the appropriateness of the accounting policies used and the reasonableness of the accounting estimates made by the Company’s Directors, as well as evaluating the overall presentation of the standalone Ind AS financial statements.
We are also responsible to conclude on the appropriateness of management’s use of the going concern basis of accounting and, based on the audit evidence obtained, whether a material uncertainty exists related to events or conditions that may cast significant doubt on the entity’s ability to continue as a going concern. If we conclude that a material uncertainty exists, we are required to draw attention in the auditor’s report to the related disclosures in the financial statements or, if such disclosures are inadequate, to modify the opinion. Our conclusions are based on the audit evidence obtained up to the date of the auditor’s report. However, future events or conditions may cause an entity to cease to continue as a going concern.
We believe that the audit evidence we have obtained is sufficient and appropriate to provide a basis for our audit opinion on the standalone Ind AS financial statements.
OpinionIn our opinion and to the best of our information and according to the explanations given to us, and based on the consideration of reports of the other auditors on separate financial statements of joint operations referred to in the Other matter paragraph below, the aforesaid standalone Ind AS financial statements
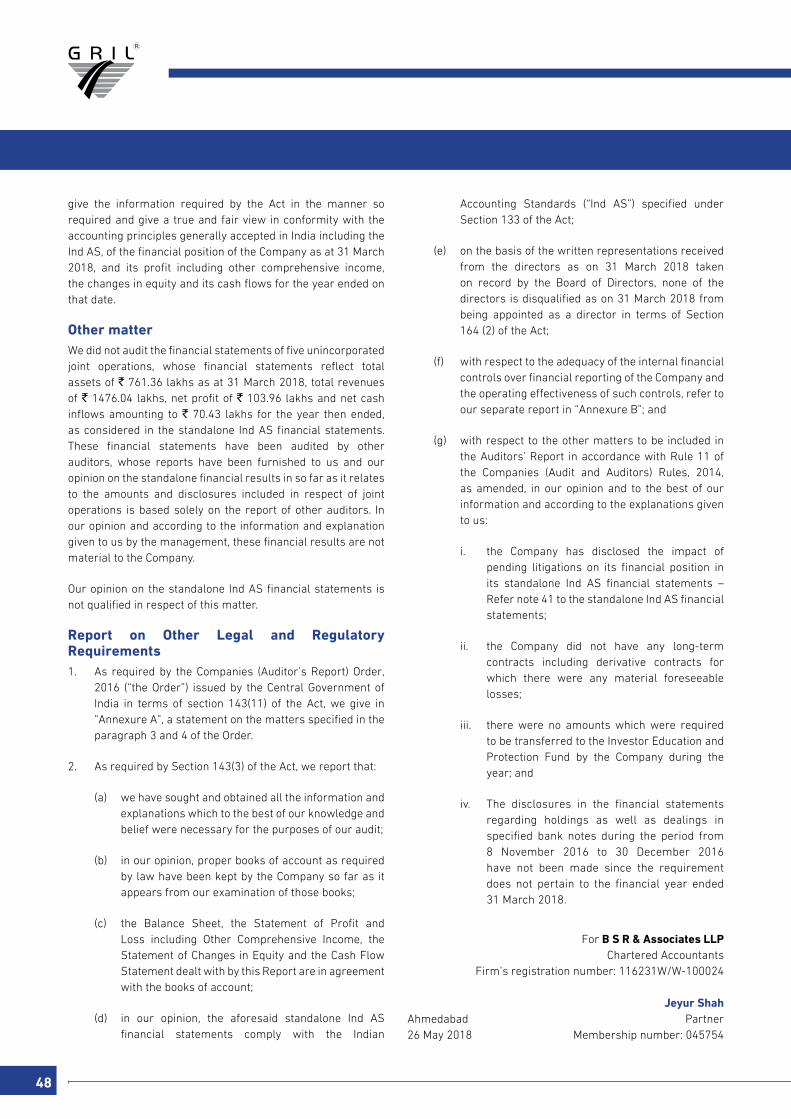
48
give the information required by the Act in the manner so required and give a true and fair view in conformity with the accounting principles generally accepted in India including the Ind AS, of the financial position of the Company as at 31 March 2018, and its profit including other comprehensive income, the changes in equity and its cash flows for the year ended on that date.
Other matterWe did not audit the financial statements of five unincorporated joint operations, whose financial statements reflect total assets of ` 761.36 lakhs as at 31 March 2018, total revenues of ` 1476.04 lakhs, net profit of ` 103.96 lakhs and net cash inflows amounting to ` 70.43 lakhs for the year then ended, as considered in the standalone Ind AS financial statements. These financial statements have been audited by other auditors, whose reports have been furnished to us and our opinion on the standalone financial results in so far as it relates to the amounts and disclosures included in respect of joint operations is based solely on the report of other auditors. In our opinion and according to the information and explanation given to us by the management, these financial results are not material to the Company.
Our opinion on the standalone Ind AS financial statements is not qualified in respect of this matter.
Report on Other Legal and Regulatory Requirements1. As required by the Companies (Auditor’s Report) Order,
2016 (“the Order”) issued by the Central Government of India in terms of section 143(11) of the Act, we give in “Annexure A”, a statement on the matters specified in the paragraph 3 and 4 of the Order.
2. As required by Section 143(3) of the Act, we report that:
(a) we have sought and obtained all the information and explanations which to the best of our knowledge and belief were necessary for the purposes of our audit;
(b) in our opinion, proper books of account as required by law have been kept by the Company so far as it appears from our examination of those books;
(c) the Balance Sheet, the Statement of Profit and Loss including Other Comprehensive Income, the Statement of Changes in Equity and the Cash Flow Statement dealt with by this Report are in agreement with the books of account;
(d) in our opinion, the aforesaid standalone Ind AS financial statements comply with the Indian
Accounting Standards (“Ind AS”) specified under Section 133 of the Act;
(e) on the basis of the written representations received from the directors as on 31 March 2018 taken on record by the Board of Directors, none of the directors is disqualified as on 31 March 2018 from being appointed as a director in terms of Section 164 (2) of the Act;
(f) with respect to the adequacy of the internal financial controls over financial reporting of the Company and the operating effectiveness of such controls, refer to our separate report in “Annexure B”; and
(g) with respect to the other matters to be included in the Auditors’ Report in accordance with Rule 11 of the Companies (Audit and Auditors) Rules, 2014, as amended, in our opinion and to the best of our information and according to the explanations given to us:
i. the Company has disclosed the impact of pending litigations on its financial position in its standalone Ind AS financial statements – Refer note 41 to the standalone Ind AS financial statements;
ii. the Company did not have any long-term contracts including derivative contracts for which there were any material foreseeable losses;
iii. there were no amounts which were required to be transferred to the Investor Education and Protection Fund by the Company during the year; and
iv. The disclosures in the financial statements regarding holdings as well as dealings in specified bank notes during the period from 8 November 2016 to 30 December 2016 have not been made since the requirement does not pertain to the financial year ended 31 March 2018.
For B S R & Associates LLP Chartered Accountants Firm’s registration number: 116231W/W-100024
Jeyur ShahAhmedabad Partner26 May 2018 Membership number: 045754
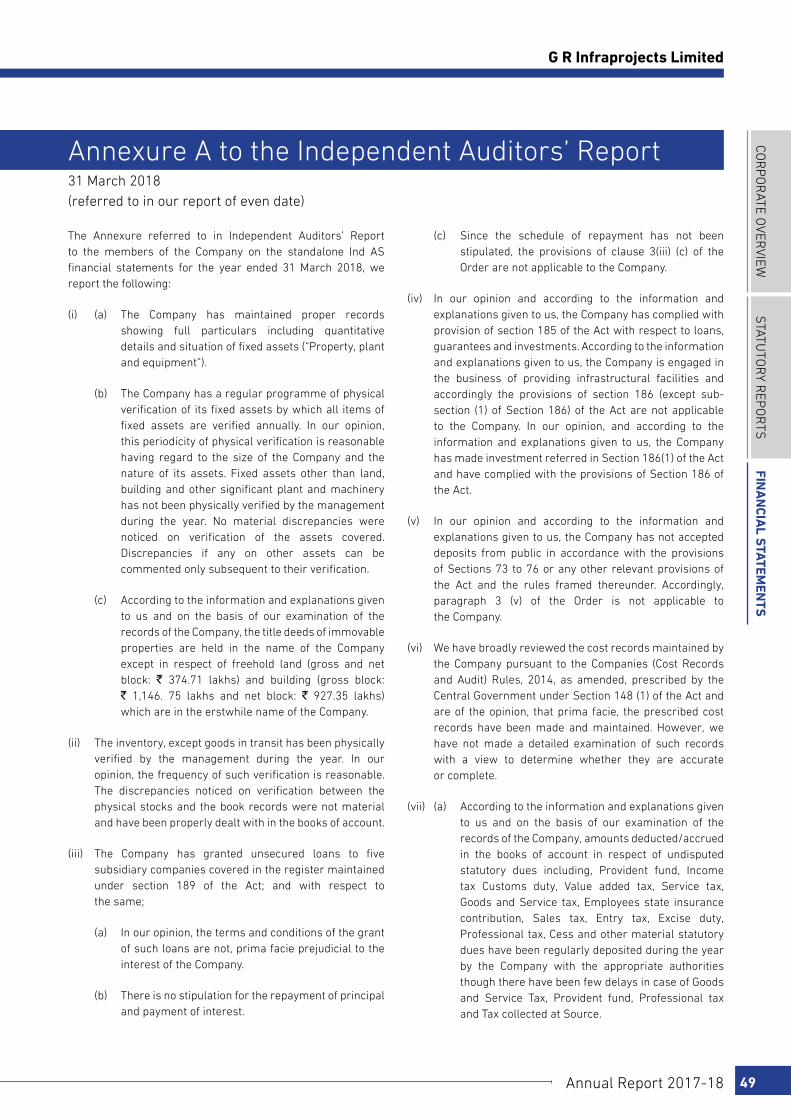
COR
PO
RATE O
VERVIEW
STATu
TOR
y REP
OR
TSFin
an
cial S
tatemen
tS
Annual Report 2017-18 49
G R Infraprojects Limited
Annexure A to the Independent Auditors’ Report 31 March 2018(referred to in our report of even date)
The Annexure referred to in Independent Auditors’ Report to the members of the Company on the standalone Ind AS financial statements for the year ended 31 March 2018, we report the following:
(i) (a) The Company has maintained proper records showing full particulars including quantitative details and situation of fixed assets (“Property, plant and equipment”).
(b) The Company has a regular programme of physical verification of its fixed assets by which all items of fixed assets are verified annually. In our opinion, this periodicity of physical verification is reasonable having regard to the size of the Company and the nature of its assets. Fixed assets other than land, building and other significant plant and machinery has not been physically verified by the management during the year. No material discrepancies were noticed on verification of the assets covered. Discrepancies if any on other assets can be commented only subsequent to their verification.
(c) According to the information and explanations given to us and on the basis of our examination of the records of the Company, the title deeds of immovable properties are held in the name of the Company except in respect of freehold land (gross and net block: ` 374.71 lakhs) and building (gross block: ` 1,146. 75 lakhs and net block: ` 927.35 lakhs) which are in the erstwhile name of the Company.
(ii) The inventory, except goods in transit has been physically verified by the management during the year. In our opinion, the frequency of such verification is reasonable. The discrepancies noticed on verification between the physical stocks and the book records were not material and have been properly dealt with in the books of account.
(iii) The Company has granted unsecured loans to five subsidiary companies covered in the register maintained under section 189 of the Act; and with respect to the same;
(a) In our opinion, the terms and conditions of the grant of such loans are not, prima facie prejudicial to the interest of the Company.
(b) There is no stipulation for the repayment of principal and payment of interest.
(c) Since the schedule of repayment has not been stipulated, the provisions of clause 3(iii) (c) of the Order are not applicable to the Company.
(iv) In our opinion and according to the information and explanations given to us, the Company has complied with provision of section 185 of the Act with respect to loans, guarantees and investments. According to the information and explanations given to us, the Company is engaged in the business of providing infrastructural facilities and accordingly the provisions of section 186 (except sub-section (1) of Section 186) of the Act are not applicable to the Company. In our opinion, and according to the information and explanations given to us, the Company has made investment referred in Section 186(1) of the Act and have complied with the provisions of Section 186 of the Act.
(v) In our opinion and according to the information and explanations given to us, the Company has not accepted deposits from public in accordance with the provisions of Sections 73 to 76 or any other relevant provisions of the Act and the rules framed thereunder. Accordingly, paragraph 3 (v) of the Order is not applicable to the Company.
(vi) We have broadly reviewed the cost records maintained by the Company pursuant to the Companies (Cost Records and Audit) Rules, 2014, as amended, prescribed by the Central Government under Section 148 (1) of the Act and are of the opinion, that prima facie, the prescribed cost records have been made and maintained. However, we have not made a detailed examination of such records with a view to determine whether they are accurate or complete.
(vii) (a) According to the information and explanations given to us and on the basis of our examination of the records of the Company, amounts deducted/accrued in the books of account in respect of undisputed statutory dues including, Provident fund, Income tax Customs duty, Value added tax, Service tax, Goods and Service tax, Employees state insurance contribution, Sales tax, Entry tax, Excise duty, Professional tax, Cess and other material statutory dues have been regularly deposited during the year by the Company with the appropriate authorities though there have been few delays in case of Goods and Service Tax, Provident fund, Professional tax and Tax collected at Source.

50
According to the information and explanations given to us, no undisputed amounts payable in respect of Provident Fund, Professional tax, Employee state insurance contribution, Service tax, Goods and service tax, Customs duty, Excise duty, Income tax, Sales tax, Entry tax, Value added tax, Cess and other material statutory dues were in arrears as at 3l March 2018 for a period of more than six months from the date they became payable.
(b) According to the information and explanations given to us, there are no dues of Income-tax, Sales-tax, Service tax, Goods and service tax, Customs duty, Excise duty and Value added tax which have not been deposited with the appropriate authorities on account of any dispute except the following:
Name of the statute
Nature of dues Amountdemanded
(INR in lakhs)
Amount under dispute not deposited (INR in lakhs)
Period to which the
amount relates
Forum where dispute is pending
Income Tax Penalty under Income-tax Act, 1961
0.20 0.20 2010-11 CIT-Appeal
Income Tax Penalty under Income-tax Act, 1961
0.55 0.55 2011-12 CIT-Appeal
Income Tax Penalty under Income-tax Act, 1961
0.65 0.65 2012-13 CIT-Appeal
Sales Tax Penalty U/s 51(7)(b) of the Punjab VAT Act, 2005
7.34 7.34 2016-17 Joint Excise and Taxtion Commissioner
(Appeal) Bhatinda.
Service Tax Service tax on security services, works contract services, goods transport services and hiring of motor vehicle under reverse charge.
4.31 4.31 January 2013 to
July 2016
Department of Central Excise
Sales Tax Dispute on Incorrect filing of form 38 under UP VAT Act during inter branch transfer of machine
2.80 2.80 2014-15 Additional Commissioner,
Commercial Tax Department, Noida
Sales Tax Dispute regarding taxable value of goods
13.51 13.51 2015-16 Joint Commissioner (Appeal), Commercial
Taxes, Patna
Sales Tax Dispute regarding rate of tax applicable for goods transferred
15.70 15.70 2014-15 Directorate of Commercial Taxes
Government of West Bengal
Sales Tax Demand on account of disallowance of tax credit on non-receipt of WCT deduction certificates from customers
234.18 234.18 2015-16 Commercial Tax Department,
Rajasthan
(viii) In our opinion and according to the information and explanations given to us, the Company has not defaulted in repayment of dues to its bankers or to its financial institutions or debenture holders. The Company does not have any loans or borrowings from Government.
(ix) In our opinion and according to the information and explanations given to us, the money raised through private placement of debentures and the term loans taken by the Company have been applied for the purpose for which they are raised.
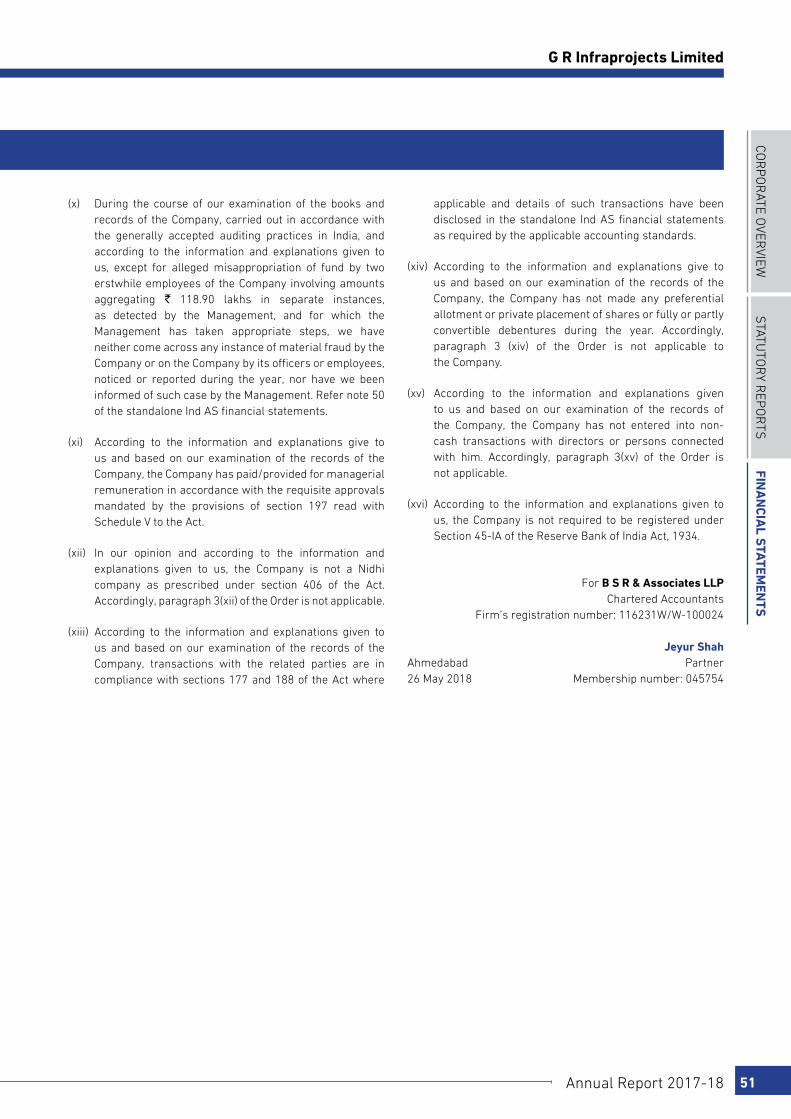
COR
PO
RATE O
VERVIEW
STATu
TOR
y REP
OR
TSFin
an
cial S
tatemen
tS
Annual Report 2017-18 51
G R Infraprojects Limited
(x) During the course of our examination of the books and records of the Company, carried out in accordance with the generally accepted auditing practices in India, and according to the information and explanations given to us, except for alleged misappropriation of fund by two erstwhile employees of the Company involving amounts aggregating ` 118.90 lakhs in separate instances, as detected by the Management, and for which the Management has taken appropriate steps, we have neither come across any instance of material fraud by the Company or on the Company by its officers or employees, noticed or reported during the year, nor have we been informed of such case by the Management. Refer note 50 of the standalone Ind AS financial statements.
(xi) According to the information and explanations give to us and based on our examination of the records of the Company, the Company has paid/provided for managerial remuneration in accordance with the requisite approvals mandated by the provisions of section 197 read with Schedule V to the Act.
(xii) In our opinion and according to the information and explanations given to us, the Company is not a Nidhi company as prescribed under section 406 of the Act. Accordingly, paragraph 3(xii) of the Order is not applicable.
(xiii) According to the information and explanations given to us and based on our examination of the records of the Company, transactions with the related parties are in compliance with sections 177 and 188 of the Act where
applicable and details of such transactions have been disclosed in the standalone Ind AS financial statements as required by the applicable accounting standards.
(xiv) According to the information and explanations give to us and based on our examination of the records of the Company, the Company has not made any preferential allotment or private placement of shares or fully or partly convertible debentures during the year. Accordingly, paragraph 3 (xiv) of the Order is not applicable to the Company.
(xv) According to the information and explanations given to us and based on our examination of the records of the Company, the Company has not entered into non-cash transactions with directors or persons connected with him. Accordingly, paragraph 3(xv) of the Order is not applicable.
(xvi) According to the information and explanations given to us, the Company is not required to be registered under Section 45-IA of the Reserve Bank of India Act, 1934.
For B S R & Associates LLP Chartered Accountants Firm’s registration number: 116231W/W-100024
Jeyur ShahAhmedabad Partner26 May 2018 Membership number: 045754

52
Report on the Internal Financial Controls under Clause (i) of Sub-section 3 of Section 143 of the Companies Act, 2013 (“the Act”)We have audited the internal financial controls over financial
reporting of G R Infraprojects Limited (“the Company”) as of 31
March 2018 in conjunction with our audit of the standalone Ind
AS financial statements of the Company for the year ended on
that date.
Management’s Responsibility for Internal Financial ControlsThe Company’s management is responsible for establishing
and maintaining internal financial controls based on the
internal control over financial reporting criteria established
by the Company considering the essential components of
internal control stated in the Guidance Note on Audit of
Internal Financial Controls over Financial Reporting issued
by the Institute of Chartered Accountants of India (‘ICAI’).
These responsibilities include the design, implementation and
maintenance of adequate internal financial controls that were
operating effectively for ensuring the orderly and efficient
conduct of its business, including adherence to company’s
policies, the safeguarding of its assets, the prevention and
detection of frauds and errors, the accuracy and completeness
of the accounting records, and the timely preparation of
reliable financial information, as required under the Companies
Act, 2013.
Auditors’ ResponsibilityOur responsibility is to express an opinion on the Company’s
internal financial controls over financial reporting based on
our audit. We conducted our audit in accordance with the
Guidance Note on Audit of Internal Financial Controls over
Financial Reporting (the “Guidance Note”) and the Standards
on Auditing, issued by ICAI and deemed to be prescribed
under section 143(10) of the Companies Act, 2013, to the
extent applicable to an audit of internal financial controls, both
applicable to an audit of Internal Financial Controls and, both
issued by the Institute of Chartered Accountants of India. Those
Standards and the Guidance Note require that we comply
with ethical requirements and plan and perform the audit to
obtain reasonable assurance about whether adequate internal
financial controls over financial reporting was established
and maintained and if such controls operated effectively in all
material respects.
Annexure B to the Independent Auditors’ Report 31 March 2018
Our audit involves performing procedures to obtain audit
evidence about the adequacy of the internal financial
controls system over financial reporting and their operating
effectiveness. Our audit of internal financial controls over
financial reporting included obtaining an understanding of
internal financial controls over financial reporting, assessing
the risk that a material weakness exists, and testing and
evaluating the design and operating effectiveness of internal
control based on the assessed risk. The procedures selected
depend on the auditors’ judgment, including the assessment
of the risks of material misstatement of the standalone Ind AS
financial statements, whether due to fraud or error.
We believe that the audit evidence we have obtained is
sufficient and appropriate to provide a basis for our audit
opinion on the Company’s internal financial controls system
over financial reporting.
Meaning of Internal Financial Controls over Financial ReportingA company’s internal financial control over financial reporting
is a process designed to provide reasonable assurance
regarding the reliability of financial reporting and the
preparation of financial statements for external purposes in
accordance with generally accepted accounting principles. A
company’s internal financial control over financial reporting
includes those policies and procedures that (1) pertain to the
maintenance of records that, in reasonable detail, accurately
and fairly reflect the transactions and dispositions of the
assets of the company; (2) provide reasonable assurance that
transactions are recorded as necessary to permit preparation
of financial statements in accordance with generally accepted
accounting principles, and that receipts and expenditures
of the company are being made only in accordance with
authorisations of management and directors of the company;
and (3) provide reasonable assurance regarding prevention or
timely detection of unauthorised acquisition, use, or disposition
of the company’s assets that could have a material effect on
the financial statements.
Inherent Limitations of Internal Financial Controls over Financial ReportingBecause of the inherent limitations of internal financial
controls over financial reporting, including the possibility
of collusion or improper management override of controls,
material misstatements due to error or fraud may occur and
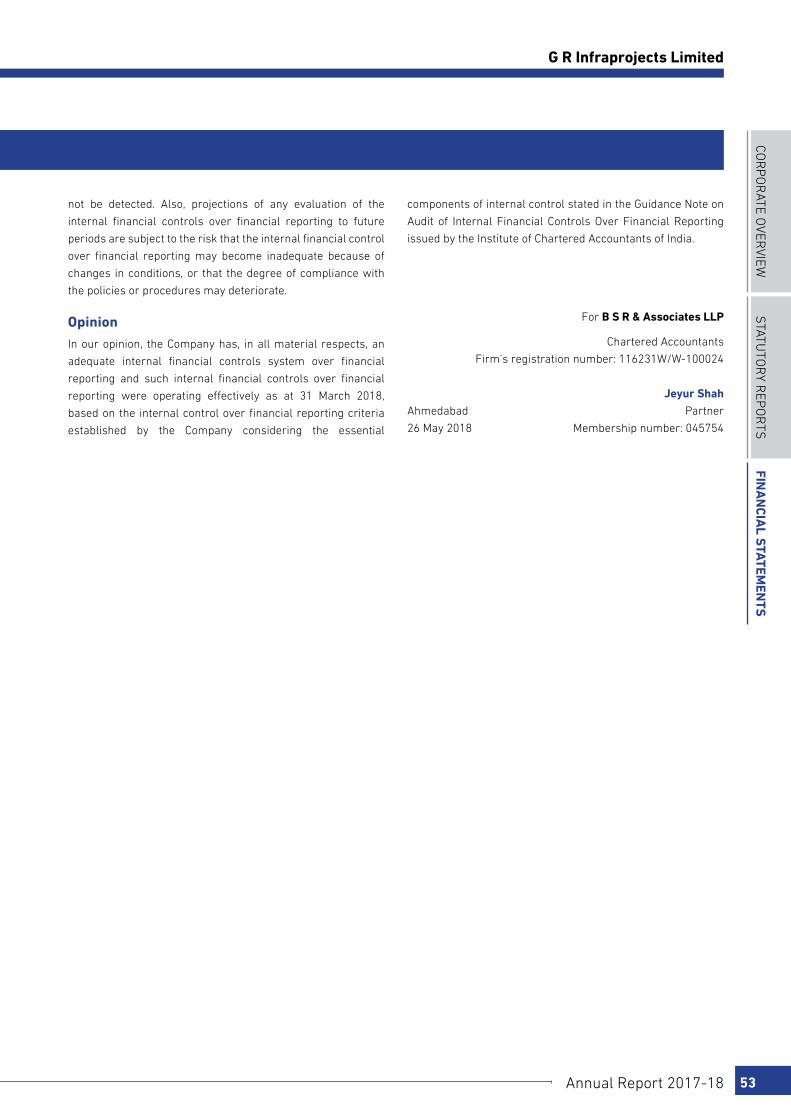
COR
PO
RATE O
VERVIEW
STATu
TOR
y REP
OR
TSFin
an
cial S
tatemen
tS
Annual Report 2017-18 53
G R Infraprojects Limited
not be detected. Also, projections of any evaluation of the
internal financial controls over financial reporting to future
periods are subject to the risk that the internal financial control
over financial reporting may become inadequate because of
changes in conditions, or that the degree of compliance with
the policies or procedures may deteriorate.
OpinionIn our opinion, the Company has, in all material respects, an
adequate internal financial controls system over financial
reporting and such internal financial controls over financial
reporting were operating effectively as at 31 March 2018,
based on the internal control over financial reporting criteria
established by the Company considering the essential
components of internal control stated in the Guidance Note on
Audit of Internal Financial Controls Over Financial Reporting
issued by the Institute of Chartered Accountants of India.
For B S R & Associates LLP
Chartered Accountants
Firm’s registration number: 116231W/W-100024
Jeyur ShahAhmedabad Partner
26 May 2018 Membership number: 045754

54
(Currency: Indian ` in lakhs)Particulars Note 31 March 2018 31 March 2017 AssetsNon-current assets(a) Property, plant and equipment 5 61,269.73 38,083.56 (b) Capital work-in-progress 6 4,750.53 1,675.98 (c) Other intangible assets 7 241.02 253.95 (d) Financial assets
(i) Investments 8 17,897.60 6,704.16 (ii) Trade receivables 14 505.18 495.53 (iii) Loans 9 17,242.07 - (iv) Other financial assets 10 1,836.00 1,035.41
(e) Deferred tax assets (net) 36 12,758.47 10,429.19 (f) Current tax assets (net) 11 3,889.53 3,254.27 (g) Other non-current assets 12 9,820.44 1,433.31
130,210.57 63,365.36 Current assets(a) Inventories 13 30,103.72 22,096.15 (b) Financial assets
(i) Investments 8 5,051.06 13,473.29 (ii) Trade receivables 14 65,052.72 52,615.94 (iii) Cash and cash equivalents 15 6,500.03 41,498.44 (iv) Bank balances other than (iii) above 16 17,174.36 12,415.23 (v) Loans 9 6,575.65 5,352.47 (vi) Other financial assets 10 17,596.78 5,256.63
(c) Other current assets 12 16,222.88 18,756.04 164,277.20 171,464.19
Total assets 294,487.77 234,829.55 Equity and liabilitiesEquity(a) Equity share capital 17 4,848.12 4,848.12 (b) Other equity 18 149,107.47 109,026.75
153,955.59 113,874.87 LiabilitiesNon-current liabilities(a) Financial Liabilities
(i) Borrowings 19 29,234.72 25,698.67 29,234.72 25,698.67
Current liabilities(a) Financial liabilities
(i) Borrowings 20 15,876.71 2,457.24 (ii) Trade payables 21 32,509.30 22,562.94 (iii) Other financial liabilities 22 30,612.53 18,879.23
(b) Provisions 23 268.65 171.48 (c) Other current liabilities 24 31,395.96 49,441.02 (d) Current tax liabilities (net) 25 634.31 1,744.10
111,297.46 95,256.01 140,532.18 120,954.68
Total equity and liabilities 294,487.77 234,829.55
The notes referred above are an integral part of these standalone financial statements.As per our report of even date attached
as at 31 March 2018
For B S R & Associates LLP For and on behalf of the Board of Directors ofChartered Accountants G R Infraprojects LimitedFirm’s Registration No: 116231W/W-100024 CIN U45201GJ1995PLC098652
Jeyur Shah Vinod Kumar Agarwal Ajendra AgarwalPartner Managing Director DirectorMembership No: 045754 DIN: 00182893 DIN: 01147897
Anand Rathi Sudhir MuthaChief Financial Officer Company Secretary
Ahmedabad ICAI Memb. No. 078615 ICSI Memb. No. ACS1885726 May 2018 Udaipur, 26 May 2018
Standalone Balance Sheet
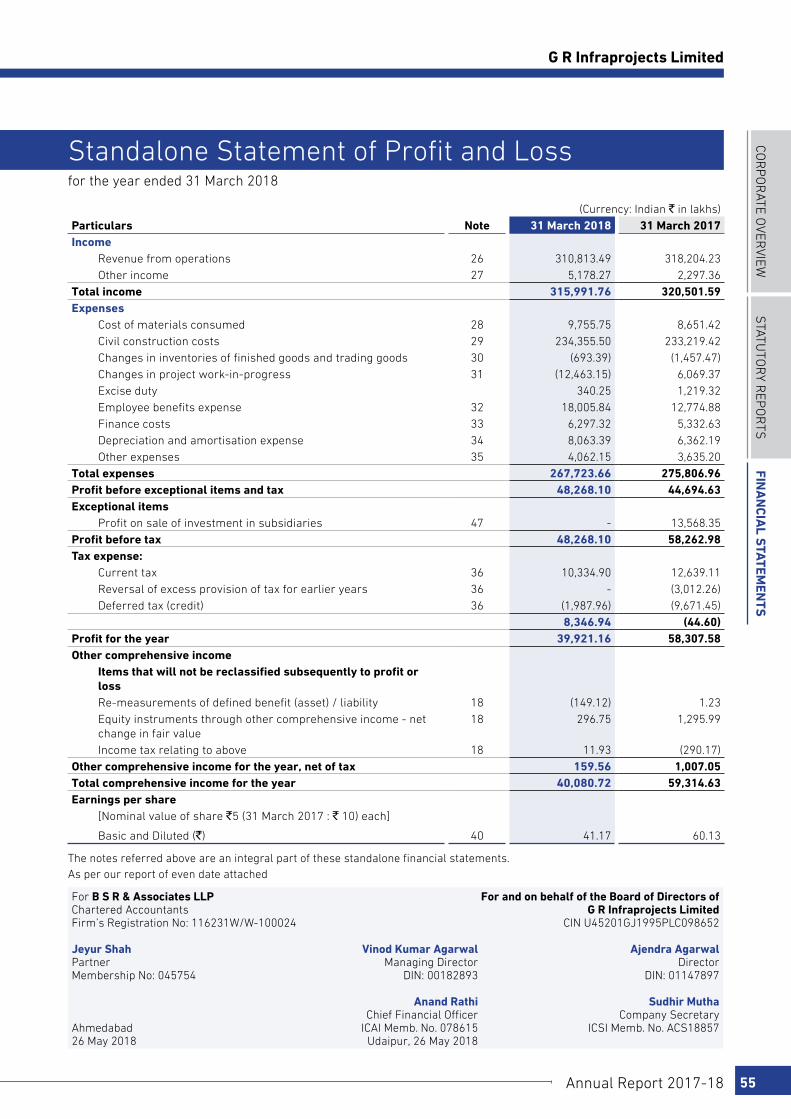
COR
PO
RATE O
VERVIEW
STATu
TOR
y REP
OR
TSFin
an
cial S
tatemen
tS
Annual Report 2017-18 55
G R Infraprojects Limited
(Currency: Indian ` in lakhs)Particulars Note 31 March 2018 31 March 2017 Income
Revenue from operations 26 310,813.49 318,204.23Other income 27 5,178.27 2,297.36
Total income 315,991.76 320,501.59Expenses
Cost of materials consumed 28 9,755.75 8,651.42Civil construction costs 29 234,355.50 233,219.42Changes in inventories of finished goods and trading goods 30 (693.39) (1,457.47)Changes in project work-in-progress 31 (12,463.15) 6,069.37Excise duty 340.25 1,219.32Employee benefits expense 32 18,005.84 12,774.88Finance costs 33 6,297.32 5,332.63Depreciation and amortisation expense 34 8,063.39 6,362.19Other expenses 35 4,062.15 3,635.20
Total expenses 267,723.66 275,806.96Profit before exceptional items and tax 48,268.10 44,694.63Exceptional items
Profit on sale of investment in subsidiaries 47 - 13,568.35Profit before tax 48,268.10 58,262.98Tax expense:
Current tax 36 10,334.90 12,639.11Reversal of excess provision of tax for earlier years 36 - (3,012.26)Deferred tax (credit) 36 (1,987.96) (9,671.45)
8,346.94 (44.60)Profit for the year 39,921.16 58,307.58Other comprehensive income
Items that will not be reclassified subsequently to profit or lossRe-measurements of defined benefit (asset) / liability 18 (149.12) 1.23Equity instruments through other comprehensive income - net change in fair value
18 296.75 1,295.99
Income tax relating to above 18 11.93 (290.17)Other comprehensive income for the year, net of tax 159.56 1,007.05Total comprehensive income for the year 40,080.72 59,314.63Earnings per share
[Nominal value of share `5 (31 March 2017 : ` 10) each]
Basic and Diluted (`) 40 41.17 60.13
The notes referred above are an integral part of these standalone financial statements.As per our report of even date attached
for the year ended 31 March 2018
For B S R & Associates LLP For and on behalf of the Board of Directors ofChartered Accountants G R Infraprojects LimitedFirm’s Registration No: 116231W/W-100024 CIN U45201GJ1995PLC098652
Jeyur Shah Vinod Kumar Agarwal Ajendra AgarwalPartner Managing Director DirectorMembership No: 045754 DIN: 00182893 DIN: 01147897
Anand Rathi Sudhir MuthaChief Financial Officer Company Secretary
Ahmedabad ICAI Memb. No. 078615 ICSI Memb. No. ACS1885726 May 2018 Udaipur, 26 May 2018
Standalone Statement of Profit and Loss

56
Standalone Statement of Changes in Equityfor the year ended 31 March 2018
Equity share capital
(Currency: Indian ` in lakhs)Particulars Note Number of shares Amount Balance as at 1 April 2016 24,240,555 2,424.06 Changes in equity share capital during the year 17 24,240,555 2,424.06 Balance as at 31 March 2017 48,481,110 4,848.12 Changes in equity share capital during the year 17 48,481,110 - Balance as at 31 March 2018 96,962,220 4,848.12
(Currency: Indian ` in lakhs)Other equity Reserves and surplus Equity
instruments through OCI
TotalSecurities premium
Debenture redemption
reserve
Capital redemption
reserve
Retained earnings
Balance as at 1 April 2016 8,079.94 3,750.00 - 40,286.77 19.48 52,136.19
Total comprehensive income for the year ended 31 March 2017
Profit for the year - - - 58,307.58 - 58,307.58Items of other comprehensive income for the year, net of taxes
Re-measurements of defined benefit plans 0.80 0.80Fair valuation of equity investment through OCI - - - - 1,006.25 1,006.25
Total comprehensive income for the year - - - 58,308.38 1,006.25 59,314.63Transactions with owners, recorded directly in equity
Issue of equity shares as bonus shares (2,424.07) - - - - (2,424.07)Transfer to debenture redemption reserve 3,750.00 - (3,750.00) -Transfer from debenture redemption reserve - (625.00) - 625.00 - -
Total transactions with owners (2,424.07) 3,125.00 - (3,125.00) - (2,424.07)Balance as at 31 March 2017 5,655.87 6,875.00 - 95,470.15 1,025.73 109,026.75Balance as at 1 April 2017 5,655.87 6,875.00 - 95,470.15 1,025.73 109,026.75Total comprehensive income for the year ended 31 March 2018
Profit for the year - - - 39,921.16 - 39,921.16Items of other comprehensive income for the year, net of taxes
Re-measurements of defined benefit plans - - - (97.51) (97.51)Fair valuation of equity investment through OCI 257.07 257.07
Total comprehensive income for the year - - - 39,823.65 257.07 40,080.72Transactions with owners, recorded directly in equity
Transfer of realised gain on sale of investments from OCI to retained earnings (refer note 47)
- - - 1,213.27 (1,213.27) -
Transfer to capital redemption reserve on redemption of preference shares (refer note 17, 18 and 49)
- - 412.19 (412.19) - -
Transfer to debenture redemption reserve - 3,750.00 - (3,750.00) - -Transfer from debenture redemption reserve - (1,250.00) - 1,250.00 - -
Total transactions with owners - 2,500.00 412.19 (1,698.92) (1,213.27) -Balance as at 31 March 2018 5,655.87 9,375.00 412.19 133,594.88 69.53 149,107.47
The notes referred above are an integral part of these standalone financial statements. As per our report of even date attached
For B S R & Associates LLP For and on behalf of the Board of Directors ofChartered Accountants G R Infraprojects LimitedFirm’s Registration No: 116231W/W-100024 CIN U45201GJ1995PLC098652
Jeyur Shah Vinod Kumar Agarwal Ajendra AgarwalPartner Managing Director DirectorMembership No: 045754 DIN: 00182893 DIN: 01147897
Anand Rathi Sudhir MuthaChief Financial Officer Company Secretary
Ahmedabad ICAI Memb. No. 078615 ICSI Memb. No. ACS1885726 May 2018 Udaipur, 26 May 2018

COR
PO
RATE O
VERVIEW
STATu
TOR
y REP
OR
TSFin
an
cial S
tatemen
tS
Annual Report 2017-18 57
G R Infraprojects Limited
(Currency: Indian ` in lakhs)
Particulars 31 March 2018 31 March 2017 Cash flows from operating activities Profit before tax 48,268.10 58,262.98Adjustments for:
Depreciation and amortisation expense 8,063.39 6,362.19 Provision for doubtful debts 164.17 600.00 Liabilities no longer payables written back (125.73) - Bad debts written off 1,339.92 - Interest income (2,494.17) (1,301.46) Gain on sale of liquid investments (969.42) (161.45) Gain arising on financial assets measured at FVTPL (net) (439.34) (343.77) Unrealised foreign exchange loss / (gain) (net) 100.59 (73.01) Profit on sale of items of property, plant and equipment (net) (360.05) (138.83) Finance costs 6,297.32 5,332.63 Profit on sale of investment in subsidiaries - (13,568.35)
59,844.78 54,970.93Working capital adjustments :
(Increase) / decrease in financial and non-financial assets (17,634.78) 1,747.17 (Increase) in inventories (8,007.57) (14,467.71) (Increase) in trade receivables (13,950.52) (16,796.48) (Increase) in loans (497.84) (2,295.14) Increase in trade payables 10,009.07 459.83 (Decrease) / increase in provisions, financial and non-financial liabilities (17,765.07) 25,557.87
Cash generated from operating activities 11,998.07 49,176.47Income tax paid (net) (12,409.33) (11,502.49)Net cash (used in) / generated from operating activities (A) (411.26) 37,673.98Cash flows from investing activities
Interest received 1,289.12 1,226.22 Proceeds from sale of liquid investments 137,623.07 72,387.22 Payments for purchase of liquid investments (141,125.00) (72,225.78) Payments for purchase of items of property, plant and equipment and other intangible assets
(29,054.64) (12,851.26)
Proceeds from sale of items of property, plant and equipment and other intangible assets
887.50 623.01
Loans given (net) (17,720.47) 152.88 Investment in subsidiaries (11,056.60) (232.92) Proceeds from sale of non-current investments - 29,953.59 Proceeds from sale of current investments 1,548.71 - Payments for purchase of term deposits (net) (5,565.03) (6,710.90)
Net cash (used in) / generated from investing activities (B) (63,173.34) 12,322.06Cash flows from financing activities
Interest paid (5,003.12) (4,582.55) Proceeds / (repayment) of current borrowings (net) 13,419.47 (2,428.91) Proceeds from issue of debentures 15,090.48 15,124.98 Proceeds from non-current borrowings other than debentures 3,520.00 - Repayment of debentures (5,132.40) (2,663.90) Repayment of non-current borrowings other than debentures (4,840.17) (7,270.23) Redemption of non-convertible preference shares (412.19) -
Net cash generated from / (used in) financing activities (C) 16,642.07 (1,820.61)Net (decrease) / increase in cash and cash equivalents (A+B+C) (46,942.53) 48,175.43Cash and cash equivalents at 1 April 53,673.38 5,497.95Cash and cash equivalents at 31 March 6,730.85 53,673.38
for the year ended 31 March 2018
Standalone Cash Flow Statement
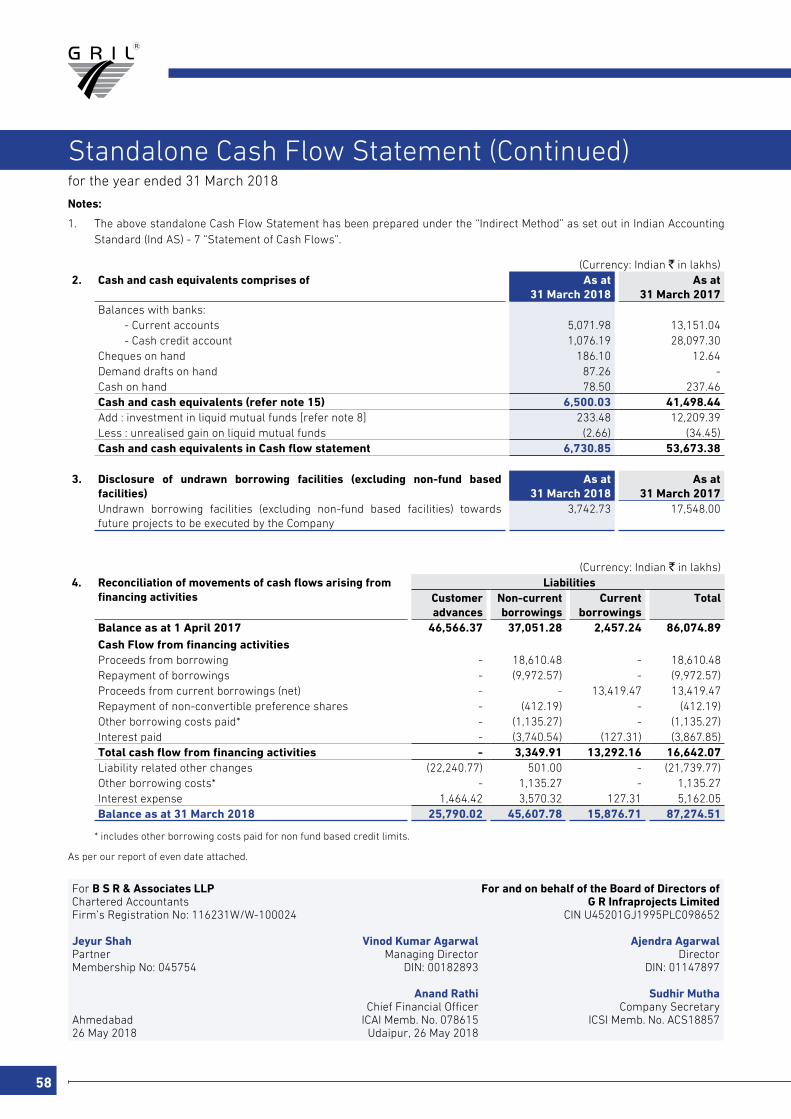
58
Standalone Cash Flow Statement (Continued)for the year ended 31 March 2018
Notes:
1. The above standalone Cash Flow Statement has been prepared under the “Indirect Method” as set out in Indian Accounting Standard (Ind AS) - 7 “Statement of Cash Flows”.
(Currency: Indian ` in lakhs)2. Cash and cash equivalents comprises of As at
31 March 2018 As at
31 March 2017 Balances with banks:
- Current accounts 5,071.98 13,151.04- Cash credit account 1,076.19 28,097.30
Cheques on hand 186.10 12.64Demand drafts on hand 87.26 -Cash on hand 78.50 237.46Cash and cash equivalents (refer note 15) 6,500.03 41,498.44Add : investment in liquid mutual funds [refer note 8] 233.48 12,209.39Less : unrealised gain on liquid mutual funds (2.66) (34.45)Cash and cash equivalents in Cash flow statement 6,730.85 53,673.38
3. Disclosure of undrawn borrowing facilities (excluding non-fund based facilities)
As at 31 March 2018
As at 31 March 2017
Undrawn borrowing facilities (excluding non-fund based facilities) towards future projects to be executed by the Company
3,742.73 17,548.00
(Currency: Indian ` in lakhs)4. Reconciliation of movements of cash flows arising from
financing activities Liabilities
Customer advances
Non-current borrowings
Current borrowings
Total
Balance as at 1 April 2017 46,566.37 37,051.28 2,457.24 86,074.89Cash Flow from financing activitiesProceeds from borrowing - 18,610.48 - 18,610.48Repayment of borrowings - (9,972.57) - (9,972.57)Proceeds from current borrowings (net) - - 13,419.47 13,419.47Repayment of non-convertible preference shares - (412.19) - (412.19)Other borrowing costs paid* - (1,135.27) - (1,135.27)Interest paid - (3,740.54) (127.31) (3,867.85)Total cash flow from financing activities - 3,349.91 13,292.16 16,642.07Liability related other changes (22,240.77) 501.00 - (21,739.77)Other borrowing costs* - 1,135.27 - 1,135.27Interest expense 1,464.42 3,570.32 127.31 5,162.05Balance as at 31 March 2018 25,790.02 45,607.78 15,876.71 87,274.51
* includes other borrowing costs paid for non fund based credit limits.
As per our report of even date attached.
For B S R & Associates LLP For and on behalf of the Board of Directors ofChartered Accountants G R Infraprojects LimitedFirm’s Registration No: 116231W/W-100024 CIN U45201GJ1995PLC098652
Jeyur Shah Vinod Kumar Agarwal Ajendra AgarwalPartner Managing Director DirectorMembership No: 045754 DIN: 00182893 DIN: 01147897
Anand Rathi Sudhir MuthaChief Financial Officer Company Secretary
Ahmedabad ICAI Memb. No. 078615 ICSI Memb. No. ACS1885726 May 2018 Udaipur, 26 May 2018
COR
PO
RATE O
VERVIEW
STATu
TOR
y REP
OR
TSFin
an
cial S
tatemen
tS
Annual Report 2017-18 59
G R Infraprojects Limited
for the year ended 31 March 2018
Notes to the Standalone Financial Statements
1. Reporting entity G R Infraprojects Limited, (‘the Company’) is a company
domiciled in India, with its registered office situated at Revenue block no. 223, Old survey No. 384/1, 384/2, Paiki and 384/3, Khata No. 464, Kochariya, Ahmedabad, Gujarat - 382220. The Company has been incorporated under the provisions of the Indian Companies Act. The Company is a closely held Public Limited Company having its debentures listed on National Stock Exchange. The Company is engaged in road construction and infrastructure sector since 1996, with operations spread across various states in India. The Company has also set up Emulsion Manufacturing Plants in Udaipur, Rajasthan and in Guwahati, Assam.
2. Basis of preparation a. Statement of compliance
These standalone financial statements have been prepared in accordance with Indian Accounting Standards (Ind AS) as per the Companies (Indian Accounting Standards) Rules, 2015 notified under Section 133 of Companies Act, 2013, (the ‘Act’) and other relevant provisions of the Act.
The standalone financial statements were authorised for issue by the Company’s Board of Directors on 26 May 2018.
Details of the Company’s accounting policies are included in Note 3.
b. Functional and presentation currency
These standalone financial statements are presented in Indian Rupees (`), which is also the Company’s functional currency. All amounts have been rounded-off to the nearest lakhs, unless otherwise indicated.
c. Basis of measurement
The standalone financial statements have been prepared on the historical cost basis except for the following items:
Items Measurement basisInvestment in mutual fund
Fair Value Through Profit or Loss (“FVTPL”)
Net defined benefit (asset)/ liability
Fair value of plan assets less present value of defined benefit obligations
Items Measurement basisInvestment in certain equity shares of entities other than subsidiary companies
Fair Value Through Other Comprehensive Income (“FVOCI”)
Investment in Non - cumulative redeemable preference shares of subsidiary companies
FVTPL
d. Use of estimates and judgments
In preparing these standalone financial statements, management has made judgments, estimates and assumptions that affect the application of accounting policies and the reported amounts of assets, liabilities, income and expenses. Actual results may differ from these estimates.
Estimates and underlying assumptions are reviewed on an ongoing basis. Revisions to accounting estimates are recognised prospectively.
Assumptions and estimation uncertainties
Information about assumptions and estimation uncertainties that have a significant risk of resulting in a material adjustment within the next financial year are included in the following notes:
Note 5 and 7
Estimates of useful lives and residual value of Property, plant and equipment and other intangible assets
Note 8 Fair valuation of investments and determining fair value less cost of sell of the disposal group on the basis of significant unobservable inputs
Note 14 Provision for doubtful debts
Note 26 Estimates of contract cost for percentage of completion
Note 36 Current / Deferred tax expense and recognition of MAT Credit and evaluation of recoverability of deferred tax assets
Note 37 Measurement of employee defined benefit obligations; key actuarial assumptions
e. Measurement of fair values
Some of the Company’s accounting policies and disclosures require the measurement of fair values, for both financial and non-financial assets and liabilities.
The Company has an established control framework with respect to the measurement of fair values. This

60
for the year ended 31 March 2018
Notes to the Standalone Financial Statements
includes a financial reporting team that has overall responsibility for overseeing all significant fair value measurements, including Level 3 fair values, and reports directly to the Chief Financial Officer.
The financial reporting team regularly reviews significant unobservable inputs and valuation adjustments. If third party information, such as pricing services, is used to measure fair values, then the financial reporting team assesses the evidence obtained from the third parties to support the conclusion that these valuations meet the requirements of Ind AS, including the level in the fair value hierarchy in which the valuations should be classified.
Fair values are categorised into different levels in a fair value hierarchy based on the inputs used in the valuation techniques as follows.
Level 1: quoted prices (unadjusted) in active markets for identical assets or liabilities.
Level 2: inputs other than quoted prices included in Level 1 that are observable for the asset or liability, either directly (i.e. as prices) or indirectly (i.e. derived from prices).
Level 3: inputs for the asset or liability that are not based on observable market data (unobservable inputs).
When measuring the fair value of an asset or a liability, the Company uses observable market data as far as possible. If the inputs used to measure the fair value of an asset or a liability fall into different levels of the fair value hierarchy, then the fair value measurement is categorised in its entirety in the same level of the fair value hierarchy as the lowest level input that is significant to the entire measurement.
The Company recognises transfers between levels of the fair value hierarchy at the end of the reporting period during which the change has occurred.
Further information about the assumptions made in measuring fair values is included in the following notes:
Note 8 Investments
Note 37 Employee benefits
Note 43 Financial instruments
3. Significant accounting polices a. Foreign currency transaction
Transactions in foreign currencies are translated into the respective functional currencies of the Company at the exchange rates at the date of the transaction or at an average rate if the average rate approximates the actual rate at the date of the transaction.
Monetary assets and liabilities denominated in foreign currencies are translated into the functional currency at the exchange rate at the reporting date. Non-monetary assets and liabilities that are measured at fair value in a foreign currency are translated into the functional currency at the exchange rate when the fair value was determined. Non-monetary assets and liabilities that are measured based on historical cost in a foreign currency are translated at the exchange rate at the date of the transaction. Exchange differences are recognised in profit or loss:
b. Financial instruments
i Recognition and initial measurement
Trade receivables and debt securities issued are initially recognised when they are originated. All other financial assets and financial liabilities are initially recognised when the Company becomes a party to the contractual provisions of the instrument.
A financial asset or financial liability is initially measured at fair value plus, for an item not at fair value through profit and loss (FVTPL), transaction costs that are directly attributable to its acquisition or issue.
ii Classification and subsequent measurement
Financial assets
On initial recognition, a financial asset is classified as measured at
- amortised cost;
- FVOCI – debt investment;
- FVOCI – equity investment; or
- FVTPL
Financial assets are not reclassified subsequent to their initial recognition, except if and in the period the Company changes its business model for managing financial assets.
COR
PO
RATE O
VERVIEW
STATu
TOR
y REP
OR
TSFin
an
cial S
tatemen
tS
Annual Report 2017-18 61
G R Infraprojects Limited
for the year ended 31 March 2018
Notes to the Standalone Financial Statements
A financial asset is measured at amortised cost if it meets both of the following conditions and is not designated as at FVTPL:
- the asset is held within a business model whose objective is to hold assets to collect contractual cash flows; and
- the contractual terms of the financial asset give rise on specified dates to cash flows that are solely payments of principal and interest on the principal amount outstanding.
A debt investment is measured at FVOCI if it meets both of the following conditions and is not designated as at FVTPL:
- the asset is held within a business model whose objective is achieved by both collecting contractual cash flows and selling financial assets; and
- the contractual terms of the financial asset give rise on specified dates to cash flows that are solely payments of principal and interest on the principal amount outstanding.
At present, the Company does not have investments in any debt securities classified as FVOCI.
On initial recognition of an equity investment that is not held for trading, the Company may irrevocably elect to present subsequent changes in the investment’s fair value in OCI (designated as FVOCI – equity investment). This election is made on an investment-by-investment basis.
All financial assets not classified as measured at amortised cost or FVOCI as described above are measured at FVTPL. This includes all derivative financial assets. On initial recognition, the Company may irrevocably designate a financial asset that otherwise meets the requirements to be measured at amortised cost or at FVOCI as at FVTPL if doing so eliminates or significantly reduces an accounting mismatch that would otherwise arise.
Financial assets: Business model assessment
The Company makes an assessment of the objective of the business model in which
a financial asset is held at a portfolio level because this best reflects the way the business is managed and information is provided to management. The information considered includes:
- the stated policies and objectives for the portfolio and the operation of those policies in practice. These include whether management’s strategy focuses on earning contractual interest income, maintaining a particular interest rate profile, matching the duration of the financial assets to the duration of any related liabilities or expected cash outflows or realising cash flows through the sale of the assets;
- how the performance of the portfolio is evaluated and reported to the Company’s management;
- the risks that affect the performance of the business model (and the financial assets held within that business model) and how those risks are managed;
- how managers of the business are compensated – e.g. whether compensation is based on the fair value of the assets managed or the contractual cash flows collected; and
- the frequency, volume and timing of sales of financial assets in prior periods, the reasons for such sales and expectations about future sales activity.
Transfers of financial assets to third parties in transactions that do not qualify for derecognition are not considered sales for this purpose, consistent with the Company’s continuing recognition of the assets.
Assessment whether contractual cash flows are solely payments of principal and interest.
For the purposes of this assessment, ‘principal’ is defined as the fair value of the financial asset on initial recognition. ‘Interest’ is defined as consideration for the time value of money and for the credit risk associated with the principal amount outstanding during a particular period of time and for other basic lending risks and costs (e.g. liquidity risk and administrative costs),as well as a profit margin.

62
for the year ended 31 March 2018
Notes to the Standalone Financial Statements
In assessing whether the contractual cash flows are solely payments of principal and interest, the Company considers the contractual terms of the instrument. This includes assessing whether the financial asset contains a contractual term that could change the timing or amount of contractual cash flows such that it would not meet this condition. In making this assessment, the Company considers:
- contingent events that would change the amount or timing of cash flows;
- terms that may adjust the contractual coupon rate, including variable interest rate features;
- prepayment and extension features; and
- terms that limit the Company’s claim to cash flows from specified assets (e.g. non-recourse features).
A prepayment feature is consistent with the solely payments of principal and interest criterion if the prepayment amount substantially represents unpaid amounts of principal and interest on the principal amount outstanding, which may include reasonable additional compensation for early termination of the contract. Additionally, for a financial asset acquired at a significant discount or premium to its contractual paramount, a feature that permits or requires prepayment at an amount that substantially represents the contractual par amount plus accrued (but unpaid) contractual interest (which may also include reasonable additional compensation for early termination) is treated as consistent with this criterion if the fair value of the prepayment feature is insignificant at initial recognition.
Financial assets: Subsequent measurement and gains and losses
Financial assets at FVTPL These assets are subsequently measured at fair value. Net gains and losses, including any interest or dividend income, are recognised in profit or loss.
Financial assets at amortised cost
These assets are subsequently measured at amortised cost using the effective interest method. The amortised cost is reduced by impairment losses. Interest income, foreign exchange gains and losses and impairment are recognised in profit or loss. Any gain or loss on derecognition is recognised in profit or loss.
Equity investments at FVOCI These assets are subsequently measured at fair value. Dividends are recognised as income in profit or loss unless the dividend clearly represents a recovery of part of the cost of the investment. Other net gains and losses are recognised in OCI and are not reclassified to profit or loss.
Financial liabilities: Classification, subsequent measurement and gains and losses
Financial liabilities are classified as measured at amortised cost or FVTPL. A financial liability is classified as at FVTPL if it is classified as held-for-trading, or it is a derivative or it is designated as such on initial recognition. Financial liabilities at FVTPL are measured at fair value and net gains and losses, including any interest expense, are recognised in profit or loss. Other financial liabilities are subsequently measured at amortised cost using the effective interest method. Interest expense and foreign exchange gains and losses are recognised in profit or loss. Any gain or loss on derecognition is also recognised in profit or loss.
iii. Derecognition
Financial assets
The Company derecognises a financial asset when the contractual rights to the cash flows from the financial asset expire, or it transfers the rights to receive the contractual cash flows in a transaction in which substantially all of the risks and rewards of ownership of the financial asset are transferred or in which the Company neither transfers nor retains substantially all of the risks and rewards of ownership and does not retain control of the financial asset.
If the Company enters into transactions whereby it transfers assets recognised on its balance sheet, but retains either all or
COR
PO
RATE O
VERVIEW
STATu
TOR
y REP
OR
TSFin
an
cial S
tatemen
tS
Annual Report 2017-18 63
G R Infraprojects Limited
for the year ended 31 March 2018
Notes to the Standalone Financial Statements
substantially all of the risks and rewards of the transferred assets, the transferred assets are not derecognised.
Financial liabilities
The Company derecognises a financial liability when its contractual obligations are discharged or cancelled, or expire.
The Company also derecognises a financial liability when its terms are modified and the cash flows under the modified terms are substantially different. In this case, a new financial liability based on the modified terms is recognised at fair value. The difference between the carrying amount of the financial liability extinguished and the new financial liability with modified terms is recognised in profit or loss.
iv. Offsetting
Financial assets and financial liabilities are offset and the net amount presented in the balance sheet when, and only when, the Company currently has a legally enforceable right to set off the amounts and it intends either to settle them on a net basis or to realise the asset and settle the liability simultaneously.
c. Operating cycle
All assets and liabilities have been classified as current or non-current as per the Company’s normal operating cycle and other criteria set out in the Schedule III of the Companies Act, 2013. Operating cycle for project related assets and liabilities is the time from start of the project to their realization in cash or cash equivalents.
d. Property, plant and equipment
i. Recognition and measurement
Items of property, plant and equipment are measured at cost, which includes capitalised borrowing costs, less accumulated depreciation and accumulated impairment losses, if any.
Cost of an item of property, plant and equipment comprises its purchase price, including import duties and non-refundable purchase taxes, after deducting trade discounts and rebates, any directly attributable cost of bringing the item to its working condition for its intended use and estimated costs of dismantling and
removing the item and restoring the site on which it is located.
The cost of a self-constructed item of property, plant and equipment comprises the cost of materials and direct labour, any other costs directly attributable to bringing the item to working condition for its intended use, and estimated costs of dismantling and removing the item and restoring the site on which it is located.
If significant parts of an item of property, plant and equipment have different useful lives, then they are accounted for as separate items (major components) of property, plant and equipment.
Any gain or loss on disposal of an item of property, plant and equipment is recognised in profit or loss.
ii Subsequent expenditure
Subsequent expenditure is capitalised only if it is probable that the future economic benefits associated with the expenditure will flow to the Company.
iii Depreciation
Depreciation on Property, plant and equipment other than plant and machinery is provided on written down value method based on the useful lives as prescribed under Schedule II of the Act.
Depreciation on plant and machinery is provided on written down value method over the estimated useful life based on technical evaluation done by the management, except in case of few plant and machinery where the Company is following straight line method as prescribed under Schedule II of the Act.
The estimated useful lives of items of property, plant and equipment are as follows:
Asset Management estimate of useful life
Factory buildings 30 years
Buildings other than factory buildings
60 years
Plant and equipment 3-15 years
Vehicles 8-10 years
Fixtures and fittings 10 years
64
for the year ended 31 March 2018
Notes to the Standalone Financial Statements
Depreciation method, useful lives and residual values are reviewed at each financial year-end and adjusted if appropriate. Based on technical evaluation and consequent advice, the management believes that its estimates of useful lives as given above best represent the period over which management expects to use these assets.
Depreciation on additions (disposals) is provided on a pro-rata basis i.e. from (upto) the date on which asset is ready for use (disposed off).
iv Derecognition
The carrying amount of an item of property, plant and equipment is derecognized on disposal or when no future economic benefits are expected from its use or disposal. The consequential gain or loss is measured as the difference between the net disposal proceeds and the carrying amount of the item and is recognized in the Statement of Profit and Loss.
e. Capital work in progress
Cost of assets not ready for intended use, as on balance sheet date is shown as capital work in progress. Advances given towards acquisition of property, plant and equipment outstanding at each balance sheet date are disclosed as other non-current assets.
f. Intangible assets
i. Recognition and measurement
Intangible assets including those acquired by the Company are initially measured at cost. Such intangible assets are subsequently measured at cost less accumulated amortisation and any accumulated impairment losses.
ii. Subsequent expenditure
Subsequent expenditure is capitalised only when it increases the future economic benefits embodied in the specific asset to which it relates. All other expenditure is recognised in profit or loss as incurred.
iii. Amortisation
Amortisation is calculated to write off the cost of intangible assets less their estimated residual values over their estimated useful lives using the straight-line method, and is
included in depreciation and amortisation in Statement of Profit and Loss.
The estimated useful lives are as follows :
- Software 3 years
- Intangible asset under 22 years service concession arrangement
Amortisation method, useful lives and residual values are reviewed at the end of each financial year and adjusted if appropriate.
iv. Derecognition
The carrying amount of an intangible asset is derecognised on disposal or when no future economic benefits are expected from its use or disposal. The gain or loss arising from the Derecognition of an intangible asset is measured as the difference between the net disposal proceeds and the carrying amount of the intangible asset and is recognised in the Statement of Profit and Loss when the asset is derecognised.
v. Service concession
The Power Purchase Agreement (PPA) with Ajmer Vidyut Nigam Limited for windmills set up by the Company are accounted as per the guidance for service concession arrangements provided in Appendix A to Ind AS 11 ‘Construction contracts’. Revenue from the construction phase is recognised using percentage of completion method. A corresponding financial asset is recognised to the extent of right to receive a fixed amount with the balance being accounted as an intangible asset. The intangible asset so recognised is amortised over the estimated useful life.
g. Inventories
Inventories are measured at the lower of cost and net realisable value. However, materials and other items held for use in civil construction work and / or production of inventories are not written down below cost if the finished products in which they will be incorporated are expected to be sold at or above cost. The cost of inventories is based on the first-in first-out (“FIFO”) formula, and includes expenditure incurred in acquiring the inventories, production or conversion costs and other costs incurred in bringing them to their present location and condition.
COR
PO
RATE O
VERVIEW
STATu
TOR
y REP
OR
TSFin
an
cial S
tatemen
tS
Annual Report 2017-18 65
G R Infraprojects Limited
for the year ended 31 March 2018
Notes to the Standalone Financial Statements
In the case of manufactured inventories and work-in-progress, cost includes direct materials, labour, a proportion of manufacturing overheads based on normal operating capacity and excise duty. Cost is determined on FIFO basis. Trading goods are valued at lower of cost and net realizable value. Cost is determined on FIFO basis.
Land and building held as stock in trade is valued at cost or net realizable value whichever is lower. Net realizable value is the estimated selling price in the ordinary course of business, less estimated costs of completion and estimated costs necessary to make the sale.
h. Project work in progress
Project work in progress represents uncertified inventory valued at contract rate pending final certification.
i. Impairment
i Impairment of financial instruments
The Company recognises loss allowances for expected credit losses on:
- financial assets measured at amortised cost; and
- financial assets measured at FVOCI- debt investments.
At each reporting date, the Company assesses whether financial assets carried at amortised cost are credit-impaired. A financial asset is ‘credit-impaired’ when one or more events that have a detrimental impact on the estimated future cash flows of the financial asset have occurred.
Evidence that a financial asset is credit-impaired includes the following observable data:
- significant financial difficulty of the borrower or issuer;
- a breach of contract such as a default or being past due for 90 days or more;
- the restructuring of a loan or advance by the Company on terms that the Company would not consider otherwise;
- it is probable that the borrower will enter bankruptcy or other financial reorganisation; or
- the disappearance of an active market for a security because of financial difficulties.
The Company measures loss allowances at an amount equal to lifetime expected credit losses, except for bank balances for which credit risk (i.e. the risk of default occurring over the expected life of the financial instrument) has not increased significantly since initial recognition, which are measured as 12 month expected credit losses.
Loss allowances for trade receivables are always measured at an amount equal to lifetime expected credit losses. Lifetime expected credit losses are the expected credit losses that result from all possible default events over the expected life of a financial instrument. Twelve months expected credit losses are the portion of expected credit losses that result from default events that are possible within 12 months after the reporting date (or a shorter period if the expected life of the instrument is less than 12 months).
In all cases, the maximum period considered when estimating expected credit losses is the maximum contractual period over which the Company is exposed to credit risk. When determining whether the credit risk of a financial asset has increased significantly since initial recognition and when estimating expected credit losses, the Company considers reasonable and supportable information that is relevant and available without undue cost or effort. This includes both quantitative and qualitative information and analysis, based on the Company’s historical experience and informed credit assessment and including forward-looking information.
Measurement of expected credit losses
Expected credit losses are a probability-weighted estimate of credit losses. Credit losses are measured as the present value of all cash shortfalls (i.e. the difference between the cash flows due to the Company in accordance with the contract and the cash flows that the Company expects to receive).
Presentation of allowance for expected credit losses in the balance sheet.
Loss allowances for financial assets measured at amortised cost are deducted from the gross carrying amount of the assets.
66
for the year ended 31 March 2018
Notes to the Standalone Financial Statements
ii Impairment of non-financial assets
Non-financial assets of the Company, other than inventories and deferred tax assets, are reviewed at each reporting date to determine whether there is any indication of impairment. If any such indication exists, then the asset’s recoverable amount is estimated.
For impairment testing, assets that do not generate independent cash inflows are grouped together into cash-generating units (CGUs). Each CGU represents the smallest group of assets that generates cash inflows that are largely independent of the cash inflows of other assets or CGUs.
The recoverable amount of a CGU (or an individual asset) is the higher of its value in use and its fair value less costs to sell. Value in use is based on the estimated future cash flows, discounted to their present value using a pre-tax discount rate that reflects current market assessments of the time value of money and the risks specific to the CGU (or the asset).
The Company’s corporate assets (e.g., central office building for providing support to various CGUs) do not generate independent cash inflows. To determine impairment of a corporate asset, recoverable amount is determined for the CGUs to which the corporate asset belongs.
An impairment loss is recognised if the carrying amount of an asset or CGU exceeds its estimated recoverable amount. Impairment losses are recognised in the statement of profit and loss. Impairment loss recognised in respect of a CGU is allocated first to reduce the carrying amount of any goodwill allocated to the CGU, and then to reduce the carrying amounts of the other assets of the CGU (or group of CGUs) on a pro rata basis.
In respect of other assets for which impairment loss has been recognised in prior periods, the Company reviews at each reporting date whether there is any indication that the loss has decreased or no longer exists. An impairment loss is reversed if there has been a change in the estimates used to determine the recoverable amount. Such a reversal is made only to the extent that the asset’s carrying amount does not exceed the carrying amount
that would have been determined, net of depreciation or amortisation, if no impairment loss had been recognised.
j. Employee benefits
i Short-term employee benefits
Short-term employee benefit obligations are measured on an undiscounted basis and are expensed as the related service is provided. A liability is recognised for the amount expected to be paid, if the Company has a present legal or constructive obligation to pay this amount as a result of past service provided by the employee, and the amount of obligation can be estimated reliably.
ii Defined contribution plans
A defined contribution plan is a post-employment benefit plan under which an entity pays fixed contributions into a separate entity and will have no legal or constructive obligation to pay further amounts. The Company makes specified monthly contributions towards Government administered provident fund scheme. Obligations for contributions to defined contribution plans are recognised as an employee benefit expense in profit or loss in the periods during which the related services are rendered by employees.
Prepaid contributions are recognised as an asset to the extent that a cash refund or a reduction in future payments is available.
iii Defined benefit plans
A defined benefit plan is a post-employment benefit plan other than a defined contribution plan. The Company’s net obligation in respect of defined benefit plans is calculated separately for each plan by estimating the amount of future benefit that employees have earned in the current and prior periods, discounting that amount and deducting the fair value of any plan assets.
The calculation of defined benefit obligation is performed annually by a qualified actuary using the projected unit credit method. When the calculation results in a potential asset for the Company, the recognised asset is limited to the present value of economic benefits available in the form of any future refunds from the plan

COR
PO
RATE O
VERVIEW
STATu
TOR
y REP
OR
TSFin
an
cial S
tatemen
tS
Annual Report 2017-18 67
G R Infraprojects Limited
for the year ended 31 March 2018
Notes to the Standalone Financial Statements
or reductions in future contributions to the plan (‘the asset ceiling’). In order to calculate the present value of economic benefits, consideration is given to any minimum funding requirements.
Remeasurements of the net defined benefit liability, which comprise actuarial gains and losses, the return on plan assets (excluding interest) and the effect of the asset ceiling (if any, excluding interest), are recognised in OCI. The Company determines the net interest expense (income) on the net defined benefit liability (asset) for the period by applying the discount rate used to measure the defined benefit obligation at the beginning of the annual period to the then-net defined benefit liability (asset), taking into account any changes in the net defined benefit liability (asset) during the period as a result of contributions and benefit payments. Net interest expense and other expenses related to defined benefit plans are recognised in profit or loss.
When the benefits of a plan are changed or when a plan is curtailed, the resulting change in benefit that relates to past service (‘past service cost’ or ‘past service gain’) or the gain or loss on curtailment is recognised immediately in profit or loss. The Company recognises gains and losses on the settlement of a defined benefit plan when the settlement occurs.
iv Other long-term employee benefits
The Company’s net obligation in respect of long-term employee benefits other than post-employment benefits is the amount of future benefit that employees have earned in return for their service in the current and prior periods; that benefit is discounted to determine its present value, and the fair value of any related assets is deducted. The obligation is measured on the basis of an annual independent actuarial valuation using the projected unit credit method. Remeasurements gains or losses are recognised in profit or loss in the period in which they arise.
k. Provisions and contingencies (other than for employee benefits)
A provision is recognised if, as a result of a past event, the Company has a present legal or constructive
obligation that can be estimated reliably, and it is probable that an outflow of economic benefits will be required to settle the obligation. Provisions are determined by discounting the expected future cash flows (representing the best estimate of the expenditure required to settle the present obligation at the balance sheet date) at a pre-tax rate that reflects current market assessments of the time value of money and the risks specific to the liability.
The unwinding of the discount is recognised as finance cost. Expected future operating losses are not provided for.
Contingencies
Disclosure for a contingent liability is made when there is a possible obligation or a present obligation that may, but probably will not require an outflow of resources embodying economic benefits or the amount of such obligation cannot be measured reliably. When there is a possible obligation or a present obligation in respect of which likelihood of outflow of resources embodying economic benefits is remote, no provision or disclosure is made.
l. Revenue
i Sale of products
Revenue from the sale of products in the course of ordinary activities is measured at the fair value of the consideration received or receivable, net of returns, trade discounts and volume rebates. This inter alia involves discounting of the consideration due to the present value if payment extends beyond normal credit terms. Revenue is recognised when the significant risks and rewards of ownership have been transferred to the buyer, recovery of the consideration is probable, the associated costs and possible return of goods can be estimated reliably, there is no continuing effective control over, or managerial involvement with, the goods, and the amount of revenue can be measured reliably.
The timing of transfers of risks and rewards varies depending on the individual terms of sale.
ii Construction contracts
Contract revenue is recognised as revenue in the statement of profit and loss in the accounting periods in which the work is
68
for the year ended 31 March 2018
Notes to the Standalone Financial Statements
performed. Contract costs are recognised as an expense in the statement of profit and loss in the accounting periods in which the work to which they relate is performed. In the case of contracts with defined milestones and assigned price for each milestone, the Company recognises revenue on transfer of significant risks and rewards which coincides with achievement of milestone and its acceptance by its customer.
Contract revenue includes the initial amount agreed in the contract plus any variations in contract work and claims payments, to the extent that it is probable that they will result in revenue and can be measured reliably. The Company recognises bonus/ incentive revenue on early completion of the project based on the confirmation received from the customers.
If the outcome of a construction contract can be estimated reliably, contract revenue is recognised in profit or loss in proportion to the stage of completion of the contract. The stage of completion is assessed by reference to surveys of work performed. Otherwise, contract revenue is recognised only to the extent of contract costs incurred that are likely to be recoverable.
Contract costs are recognised as expenses as incurred unless they create an asset related to future contract activity. An expected loss on a contract is recognised immediately in profit or loss.
iii Accounting for real estate transactions
The Company is following the “Percentage of Completion Method” of accounting. As per this method, revenue from sale of properties is recognised in Statement of Profit and Loss in proportion to the actual cost incurred as against the total estimated cost of the project under execution with the Company on transfer of significant risk and rewards to the buyer.
In accordance with “Guidance Note on Accounting for Real Estate Transactions” (for entities to whom Ind AS is applicable) issued by the Institute of Chartered Accountants of India in May 2016, construction revenue on such projects, measured at fair value (i.e. adjusted for discount, incentives and time value of
money adjustments etc.), has been recognised by applying percentage of completion method provided following thresholds have been met:
a) all critical approvals necessary for commencement of project have been obtained;
b) when the stage of completion of the project reaches a reasonable level of development. A reasonable level of development is not achieved if the expenditure incurred on project construction and development cost is not less than 25% of the total estimated project construction and development costs. Such cost would exclude land costs but include borrowing costs;
c) at least 25% of the saleable project area is secured by contracts/agreements with buyers; and
d) at least 10% of the contracts consideration as per agreement of the sale or any other enforceable documents are realised at the reporting date in respect of each of the contracts and it is reasonable to expect that parties to such contracts will comply with the payment terms.
iv Job work income
Job work income is recognized when the services are rendered and there are no uncertainties involved to its ultimate realization.
m. Leases
i Assets held under lease
Leases of property, plant and equipment that transfer substantially all the risks and rewards of ownership are classified as finance leases. All the other leases are classified as operating leases. For finance lease, the leased assets are measured initially at an amount equal to the lower of their fair value and the present value of the minimum lease payments. Subsequent to initial recognition, the assets are accounted for in accordance with the accounting policy applicable to similar owned assets.
Assets held under operating leases are neither recognised in (in case the Company is lessee) nor derecognized (in case the Company is lessor) from the Company’s Balance Sheet.

COR
PO
RATE O
VERVIEW
STATu
TOR
y REP
OR
TSFin
an
cial S
tatemen
tS
Annual Report 2017-18 69
G R Infraprojects Limited
for the year ended 31 March 2018
Notes to the Standalone Financial Statements
ii Lease payments
Payments made under operating leases are generally recognised in profit or loss on a straight-line basis over the term of the lease unless such payments are structured to increase in line with expected general inflation to compensate for the lessor’s expected inflationary cost increases. Lease incentives received are recognised as an integral part of the total lease expense over the term of the lease.
iii Assets given on lease
In respect of assets provided on finance leases, amounts due from lessees are recorded as receivables at the amount of the Company’s net investment in the leases. Finance lease income is allocated to accounting periods so as to reflect a constant periodic rate of return on the Company’s net investment outstanding in respect of the leases. In respect of assets given on operating lease, lease rentals are accounted on accrual basis in accordance with the respective lease agreements.
n. Recognition of dividend income, interest income or expense
Dividend income is recognised in profit or loss on the date on which the Company’s right to receive payment is established.
Interest income or expense is recognised using the effective interest method.
The ‘effective interest rate’ is the rate that exactly discounts estimated future cash payments or receipts through the expected life of the financial instrument to:
- the gross carrying amount of the financial asset; or
- the amortised cost of the financial liability.
o. Income tax
Income tax comprises of current and deferred tax. It is recognised in the statement of profit and loss except to the extent that it relates to an item recognised directly in equity or in OCI.
i Current tax
Current tax comprises of the expected tax payable or receivable on the taxable income
or loss for the year and any adjustment to the tax payable or receivable in respect of previous years. The amount of current tax reflects the best estimate of the tax amount expected to be paid or received after considering the uncertainty, if any, related to income taxes. It is measured using tax rates (and tax laws) enacted or substantively enacted by the reporting date.
The Company, being a company providing infrastructure development / maintenance and operations services is eligible to claim deduction under Section 80 IA of the Income Tax Act, 1961 with respect to 100 % of the profits and gains derived from this business for the any ten consecutive assessment years out of fifteen years beginning from the year in which the undertaking or the enterprise develops and begins to operate any infrastructure facility. Accordingly, the Company has opted for Tax Holiday Period from financial year 2014-15 and onwards.
Current tax assets and current tax liabilities are offset only if there is a legally enforceable right to set off the recognised amounts, and it is intended to realise the asset and settle the liability on a net basis or simultaneously.
ii Deferred tax
Deferred tax is recognised in respect of temporary differences between the carrying amounts of assets and liabilities for financial reporting purposes and the corresponding amounts used for taxation purposes. Deferred tax is also recognised in respect of carried forward tax losses and tax credits.
Minimum Alternate Tax (MAT) eligible for set-off in subsequent years (as per tax laws), is recognised as an asset by way of credit to the Restated Standalone Summary Statement of Profit and Loss only if there is convincing evidence that sufficient taxable profit will be available against which the unused tax losses or unused tax credits can be utilised by the Company. At each Balance Sheet date, the carrying amount of deferred tax in relation to MAT Credit Entitlement receivable is reviewed to reassure realization.
Deferred tax assets are recognised to the extent that it is probable that future taxable

70
for the year ended 31 March 2018
Notes to the Standalone Financial Statements
profits will be available against which they can be used. The existence of unused tax losses is strong evidence that future taxable profit may not be available. Therefore, in case of a history of recent losses, the Company recognises a deferred tax asset only to the extent that it has sufficient taxable temporary differences or there is convincing other evidence that sufficient taxable profit will be available against which such deferred tax asset can be realised. Deferred tax assets –unrecognised or recognised, are reviewed at each reporting date and are recognised/ reduced to the extent that it is probable/ no longer probable respectively that the related tax benefit will be realised.
Deferred tax is measured at the tax rates that are expected to apply to the period when the asset is realised or the liability is settled, based on the laws that have been enacted or substantively enacted by the reporting date.
The measurement of deferred tax reflects the tax consequences that would follow from the manner in which the Company expects, at the reporting date, to recover or settle the carrying amount of its assets and liabilities.
Deferred tax assets and liabilities are offset if there is a legally enforceable right to offset current tax liabilities and assets, and they relate to income taxes levied by the same tax authority on the same taxable entity, or on different tax entities, but they intend to settle current tax liabilities and assets on a net basis or their tax assets and liabilities will be realised simultaneously.
Any tax credit available is recognised as deferred tax to the extent that it is probable that future taxable profit will be available against which the unused tax credit can be utilized. The said asset is created by way of credit to the statement of Profit and loss and shown under the head of deferred tax.
ii Presentation of current and deferred tax:
Current and deferred tax are recognized as income or an expense in the Statement of Profit and Loss, except when they relate to items that are recognized in Other Comprehensive
Income, in which case, the current and deferred tax income/expense are recognized in Other Comprehensive Income.
The Company offsets current tax assets and current tax liabilities, where it has a legally enforceable right to set off the recognized amounts and where it intends either to settle on a net basis, or to realize the asset and settle the liability simultaneously. In case of deferred tax assets and deferred tax liabilities, the same are offset if the Company has a legally enforceable right to set off corresponding current tax assets against current tax liabilities and the deferred tax assets and deferred tax liabilities relate to income taxes levied by the same tax authority on the Company.
p. Borrowing cost
Borrowing costs are interest and other incurred in connection with the borrowing of funds. Borrowing costs directly attributable to acquisition or construction of an asset which necessarily take a substantial period of time to get ready for their intended use are capitalised as part of the cost of that asset. Other borrowing costs are recognised as an expense in the statement of profit and loss in the period in which they are incurred.
q. Earnings per share
Basic earnings per share is computed by dividing the net profit for the period attributable to the equity shareholders of the Company by the weighted average number of equity shares outstanding during the period. The weighted average number of equity shares outstanding during the period and for all periods presented is adjusted for events, such as bonus shares, other than the conversion of potential equity shares that have changed the number of equity shares outstanding, without a corresponding change in resources.
For the purpose of calculating diluted earnings per share, the net profit for the period attributable to equity shareholders and the weighted average number of shares outstanding during the period is adjusted for the effects of all dilutive potential equity shares.
In a capitalisation or bonus issue or a share split, ordinary shares are issued to existing shareholders for no additional consideration. The number of
COR
PO
RATE O
VERVIEW
STATu
TOR
y REP
OR
TSFin
an
cial S
tatemen
tS
Annual Report 2017-18 71
G R Infraprojects Limited
for the year ended 31 March 2018
Notes to the Standalone Financial Statements
ordinary shares outstanding before the event is adjusted for the proportionate change in the number of ordinary shares outstanding as if the event had occurred at the beginning of the earliest period presented.
r. Operating segments
Operating segments are reported in a manner consistent with the internal reporting provided to the Chief Operating Decision Maker (CODM) of the Company. The CODM is responsible for allocating resources and assessing performance of the operating segments of the Company.
s. Cash and cash equivalents
Cash and Cash equivalents for the purpose of Cash Flow Statement comprise cash and cheques in hand, bank balances, demand deposits with banks where the original maturity is three months or less and other short term highly liquid investments.
t. Investments in subsidiary companies
The Company has elected to recognise its investments in subsidiary companies at cost in accordance with the option available in Ind AS 27, Separate Standalone financial statements.
u. Joint arrangements
Under Ind AS 111 Joint arrangements, investments in joint arrangements are classified as either joint operations or joint ventures. The classification depends on the contractual rights and obligations of each investor, rather than the legal structure of the joint arrangement. The Company has joint operations.
Joint operations
The Company recognises its direct right to the assets, liabilities, revenues and expenses of joint operations and its share of any jointly held or incurred assets, liabilities, revenues and expenses. These have been incorporated in the standalone financial statements under the appropriate headings. The details of joint operations are set out in note 42.
4. Recent accounting pronouncements Standards issued but not yet effective
On 28 March 2018, Ministry of Corporate Affairs (MCA) has notified new standards and amendments to existing
standards. These amendments are effective for annual periods beginning after 1 April 2018.
Ind AS 115 Revenue from contract with customers
Ind AS 115 establishes a comprehensive framework for determining whether, how much and when revenue is recognized. It replaces existing revenue recognition guidance, including Ind AS 18 Revenue and Ins AS 11 Construction Contracts. The core principle of the new standard that an entity should recognize revenue to depict the transfer of promised goods or services to customers in an amount that reflects the consideration to which the entity expects to be entitled in exchange for those goods or services. Further, the new standard requires enhanced disclosures about the nature, amount, timing and uncertainty of revenue and cash flows arising from the entity’s contracts with customers.
This Standard permits two possible methods of transition i.e. retrospective approach and modified retrospective method.
The Company is in the process of evaluating and identifying the key impacts along with transition options to be considered while transiting to Ind AS 115.
Amendments to existing Ind AS
The following amended standards are not expected to have a significant impact on the Company’s standalone financial statements. This assessment is based on currently available information and may be subject to changes arising from further reasonable and supportable information being made available to the Company when it will adopt the respective standards.
• IndAS40-InvestmentProperty
The amendment lays down the principle regarding the transfer of asset to, or from, investment property.
• Ind AS 21 - The Effects of Changes in ForeignExchange Rates
The amendment lays down principles to determine the date of transaction when a company recognizes a non-monetary prepayment asset or deferred income liability.
• IndAS12–IncomeTaxes
The amendments explains that determining temporary differences and estimating probable future taxable profit against which deductible temporary differences are assessed for utilization are two separate steps.
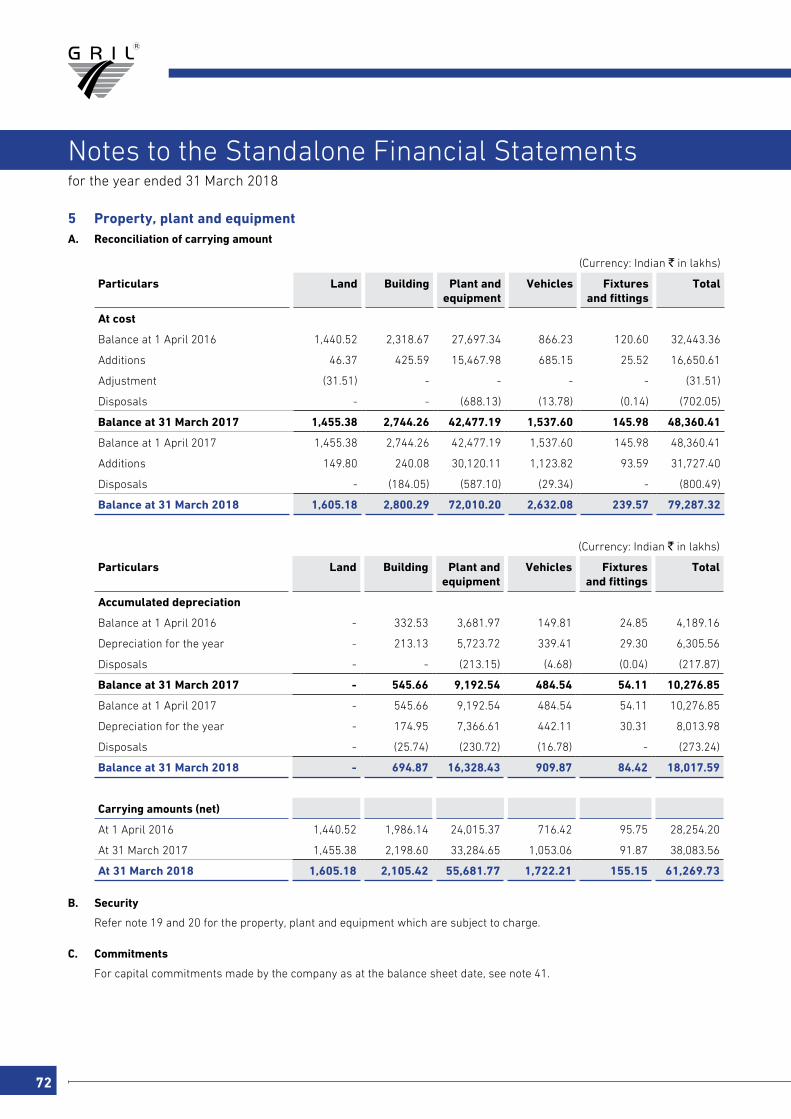
72
for the year ended 31 March 2018
Notes to the Standalone Financial Statements
5 Property, plant and equipmentA. Reconciliation of carrying amount
(Currency: Indian ` in lakhs)
Particulars Land Building Plant andequipment
Vehicles Fixturesand fittings
Total
At cost
Balance at 1 April 2016 1,440.52 2,318.67 27,697.34 866.23 120.60 32,443.36
Additions 46.37 425.59 15,467.98 685.15 25.52 16,650.61
Adjustment (31.51) - - - - (31.51)
Disposals - - (688.13) (13.78) (0.14) (702.05)
Balance at 31 March 2017 1,455.38 2,744.26 42,477.19 1,537.60 145.98 48,360.41
Balance at 1 April 2017 1,455.38 2,744.26 42,477.19 1,537.60 145.98 48,360.41
Additions 149.80 240.08 30,120.11 1,123.82 93.59 31,727.40
Disposals - (184.05) (587.10) (29.34) - (800.49)
Balance at 31 March 2018 1,605.18 2,800.29 72,010.20 2,632.08 239.57 79,287.32
(Currency: Indian ` in lakhs)
Particulars Land Building Plant andequipment
Vehicles Fixturesand fittings
Total
Accumulated depreciation
Balance at 1 April 2016 - 332.53 3,681.97 149.81 24.85 4,189.16
Depreciation for the year - 213.13 5,723.72 339.41 29.30 6,305.56
Disposals - - (213.15) (4.68) (0.04) (217.87)
Balance at 31 March 2017 - 545.66 9,192.54 484.54 54.11 10,276.85
Balance at 1 April 2017 - 545.66 9,192.54 484.54 54.11 10,276.85
Depreciation for the year - 174.95 7,366.61 442.11 30.31 8,013.98
Disposals - (25.74) (230.72) (16.78) - (273.24)
Balance at 31 March 2018 - 694.87 16,328.43 909.87 84.42 18,017.59
Carrying amounts (net)
At 1 April 2016 1,440.52 1,986.14 24,015.37 716.42 95.75 28,254.20
At 31 March 2017 1,455.38 2,198.60 33,284.65 1,053.06 91.87 38,083.56
At 31 March 2018 1,605.18 2,105.42 55,681.77 1,722.21 155.15 61,269.73
B. Security
Refer note 19 and 20 for the property, plant and equipment which are subject to charge.
C. Commitments
For capital commitments made by the company as at the balance sheet date, see note 41.
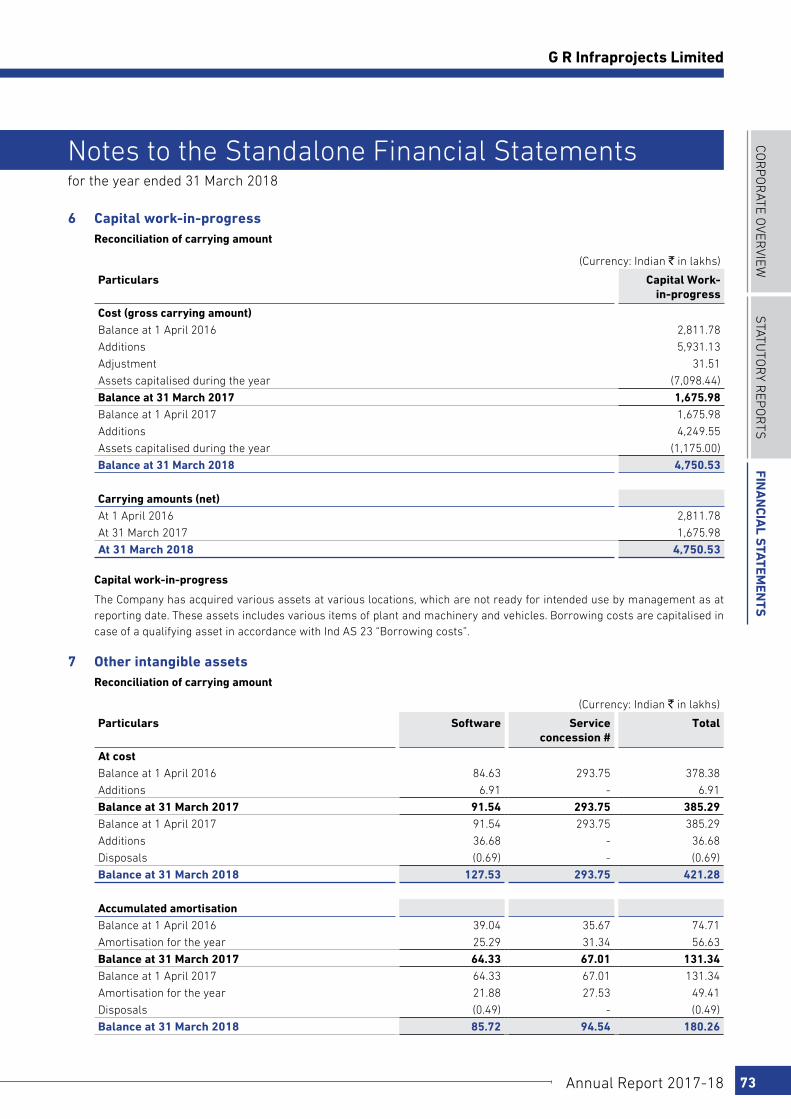
COR
PO
RATE O
VERVIEW
STATu
TOR
y REP
OR
TSFin
an
cial S
tatemen
tS
Annual Report 2017-18 73
G R Infraprojects Limited
for the year ended 31 March 2018
Notes to the Standalone Financial Statements
6 Capital work-in-progress Reconciliation of carrying amount
(Currency: Indian ` in lakhs)
Particulars Capital Work- in-progress
Cost (gross carrying amount)Balance at 1 April 2016 2,811.78
Additions 5,931.13
Adjustment 31.51
Assets capitalised during the year (7,098.44)
Balance at 31 March 2017 1,675.98Balance at 1 April 2017 1,675.98
Additions 4,249.55
Assets capitalised during the year (1,175.00)
Balance at 31 March 2018 4,750.53
Carrying amounts (net)At 1 April 2016 2,811.78
At 31 March 2017 1,675.98
At 31 March 2018 4,750.53
Capital work-in-progress
The Company has acquired various assets at various locations, which are not ready for intended use by management as at reporting date. These assets includes various items of plant and machinery and vehicles. Borrowing costs are capitalised in case of a qualifying asset in accordance with Ind AS 23 “Borrowing costs”.
7 Other intangible assets Reconciliation of carrying amount
(Currency: Indian ` in lakhs)
Particulars Software Service concession #
Total
At costBalance at 1 April 2016 84.63 293.75 378.38
Additions 6.91 - 6.91
Balance at 31 March 2017 91.54 293.75 385.29 Balance at 1 April 2017 91.54 293.75 385.29
Additions 36.68 - 36.68
Disposals (0.69) - (0.69)
Balance at 31 March 2018 127.53 293.75 421.28
Accumulated amortisationBalance at 1 April 2016 39.04 35.67 74.71
Amortisation for the year 25.29 31.34 56.63
Balance at 31 March 2017 64.33 67.01 131.34 Balance at 1 April 2017 64.33 67.01 131.34
Amortisation for the year 21.88 27.53 49.41
Disposals (0.49) - (0.49)
Balance at 31 March 2018 85.72 94.54 180.26
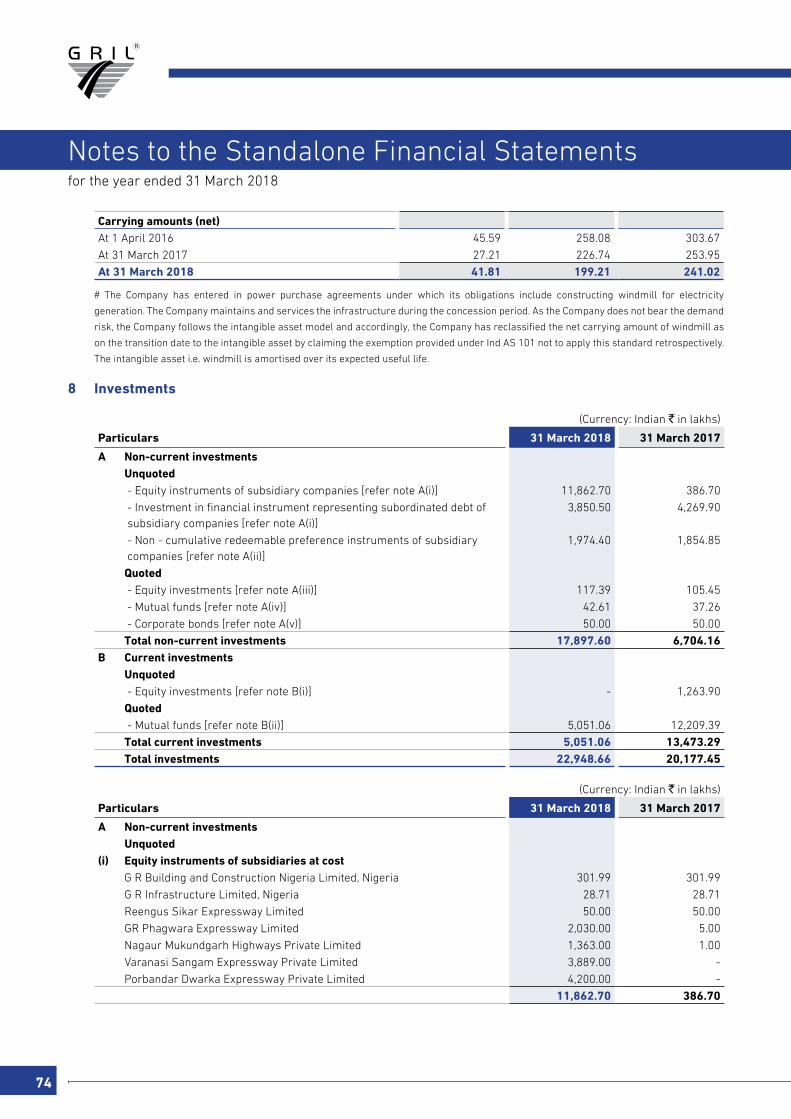
74
for the year ended 31 March 2018
Notes to the Standalone Financial Statements
Carrying amounts (net)At 1 April 2016 45.59 258.08 303.67
At 31 March 2017 27.21 226.74 253.95
At 31 March 2018 41.81 199.21 241.02
# The Company has entered in power purchase agreements under which its obligations include constructing windmill for electricity
generation. The Company maintains and services the infrastructure during the concession period. As the Company does not bear the demand
risk, the Company follows the intangible asset model and accordingly, the Company has reclassified the net carrying amount of windmill as
on the transition date to the intangible asset by claiming the exemption provided under Ind AS 101 not to apply this standard retrospectively.
The intangible asset i.e. windmill is amortised over its expected useful life.
8 Investments
(Currency: Indian ` in lakhs)
Particulars 31 March 2018 31 March 2017
A Non-current investmentsUnquoted - Equity instruments of subsidiary companies [refer note A(i)] 11,862.70 386.70
- Investment in financial instrument representing subordinated debt of subsidiary companies [refer note A(i)]
3,850.50 4,269.90
- Non - cumulative redeemable preference instruments of subsidiary companies [refer note A(ii)]
1,974.40 1,854.85
Quoted - Equity investments [refer note A(iii)] 117.39 105.45
- Mutual funds [refer note A(iv)] 42.61 37.26
- Corporate bonds [refer note A(v)] 50.00 50.00
Total non-current investments 17,897.60 6,704.16B Current investments
Unquoted - Equity investments [refer note B(i)] - 1,263.90
Quoted - Mutual funds [refer note B(ii)] 5,051.06 12,209.39
Total current investments 5,051.06 13,473.29Total investments 22,948.66 20,177.45
(Currency: Indian ` in lakhs)
Particulars 31 March 2018 31 March 2017
A Non-current investmentsUnquoted
(i) Equity instruments of subsidiaries at costG R Building and Construction Nigeria Limited, Nigeria 301.99 301.99
G R Infrastructure Limited, Nigeria 28.71 28.71
Reengus Sikar Expressway Limited 50.00 50.00
GR Phagwara Expressway Limited 2,030.00 5.00
Nagaur Mukundgarh Highways Private Limited 1,363.00 1.00
Varanasi Sangam Expressway Private Limited 3,889.00 -
Porbandar Dwarka Expressway Private Limited 4,200.00 -
11,862.70 386.70
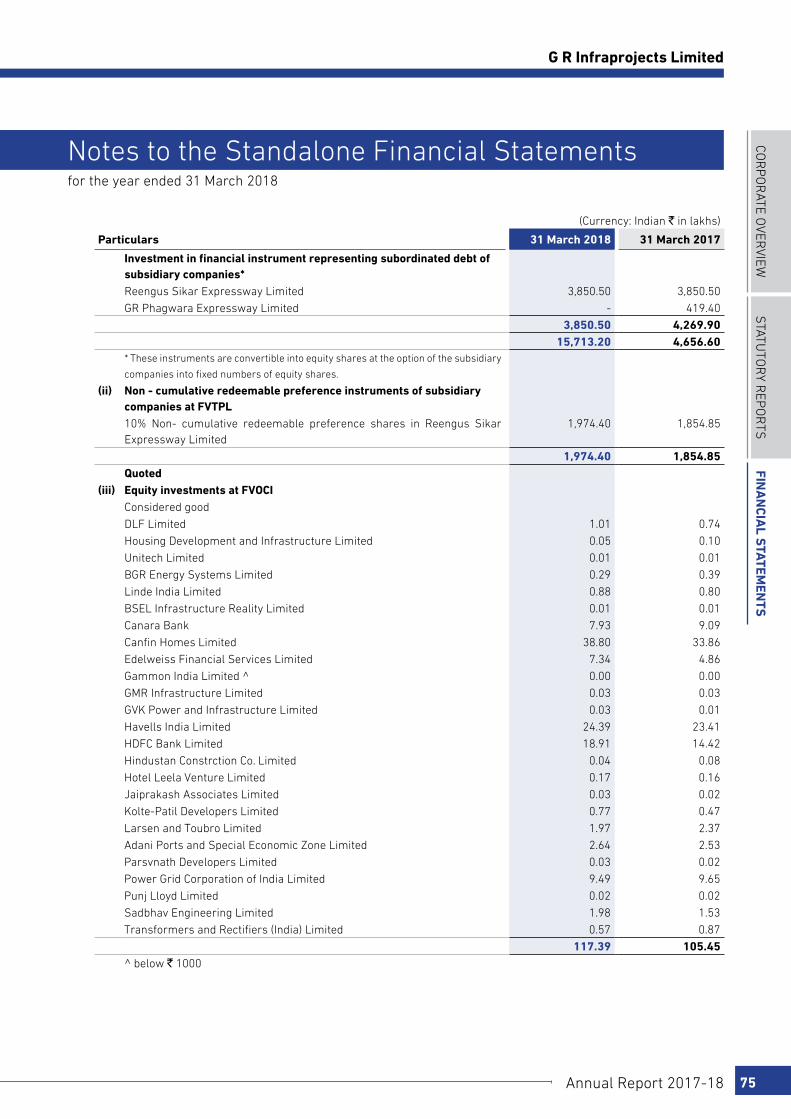
COR
PO
RATE O
VERVIEW
STATu
TOR
y REP
OR
TSFin
an
cial S
tatemen
tS
Annual Report 2017-18 75
G R Infraprojects Limited
for the year ended 31 March 2018
Notes to the Standalone Financial Statements
(Currency: Indian ` in lakhs)
Particulars 31 March 2018 31 March 2017
Investment in financial instrument representing subordinated debt of subsidiary companies*Reengus Sikar Expressway Limited 3,850.50 3,850.50
GR Phagwara Expressway Limited - 419.40
3,850.50 4,269.90 15,713.20 4,656.60
* These instruments are convertible into equity shares at the option of the subsidiary
companies into fixed numbers of equity shares.
(ii) Non - cumulative redeemable preference instruments of subsidiary companies at FVTPL10% Non- cumulative redeemable preference shares in Reengus Sikar Expressway Limited
1,974.40 1,854.85
1,974.40 1,854.85 Quoted
(iii) Equity investments at FVOCIConsidered good
DLF Limited 1.01 0.74
Housing Development and Infrastructure Limited 0.05 0.10
Unitech Limited 0.01 0.01
BGR Energy Systems Limited 0.29 0.39
Linde India Limited 0.88 0.80
BSEL Infrastructure Reality Limited 0.01 0.01
Canara Bank 7.93 9.09
Canfin Homes Limited 38.80 33.86
Edelweiss Financial Services Limited 7.34 4.86
Gammon India Limited ^ 0.00 0.00
GMR Infrastructure Limited 0.03 0.03
GVK Power and Infrastructure Limited 0.03 0.01
Havells India Limited 24.39 23.41
HDFC Bank Limited 18.91 14.42
Hindustan Constrction Co. Limited 0.04 0.08
Hotel Leela Venture Limited 0.17 0.16
Jaiprakash Associates Limited 0.03 0.02
Kolte-Patil Developers Limited 0.77 0.47
Larsen and Toubro Limited 1.97 2.37
Adani Ports and Special Economic Zone Limited 2.64 2.53
Parsvnath Developers Limited 0.03 0.02
Power Grid Corporation of India Limited 9.49 9.65
Punj Lloyd Limited 0.02 0.02
Sadbhav Engineering Limited 1.98 1.53
Transformers and Rectifiers (India) Limited 0.57 0.87117.39 105.45
^ below ` 1000
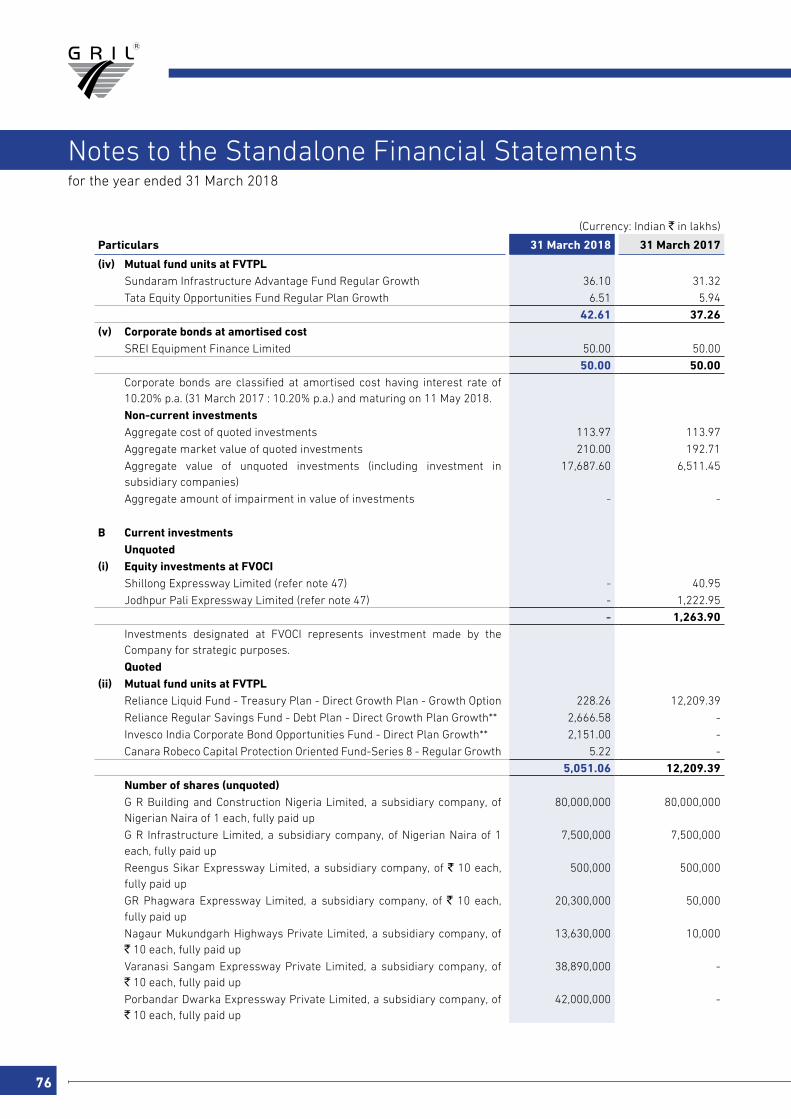
76
for the year ended 31 March 2018
Notes to the Standalone Financial Statements
(Currency: Indian ` in lakhs)
Particulars 31 March 2018 31 March 2017
(iv) Mutual fund units at FVTPLSundaram Infrastructure Advantage Fund Regular Growth 36.10 31.32
Tata Equity Opportunities Fund Regular Plan Growth 6.51 5.94
42.61 37.26(v) Corporate bonds at amortised cost
SREI Equipment Finance Limited 50.00 50.00
50.00 50.00Corporate bonds are classified at amortised cost having interest rate of 10.20% p.a. (31 March 2017 : 10.20% p.a.) and maturing on 11 May 2018.
Non-current investmentsAggregate cost of quoted investments 113.97 113.97
Aggregate market value of quoted investments 210.00 192.71
Aggregate value of unquoted investments (including investment in subsidiary companies)
17,687.60 6,511.45
Aggregate amount of impairment in value of investments - -
B Current investmentsUnquoted
(i) Equity investments at FVOCIShillong Expressway Limited (refer note 47) - 40.95
Jodhpur Pali Expressway Limited (refer note 47) - 1,222.95
- 1,263.90Investments designated at FVOCI represents investment made by the Company for strategic purposes.
Quoted(ii) Mutual fund units at FVTPL
Reliance Liquid Fund - Treasury Plan - Direct Growth Plan - Growth Option 228.26 12,209.39
Reliance Regular Savings Fund - Debt Plan - Direct Growth Plan Growth** 2,666.58 -
Invesco India Corporate Bond Opportunities Fund - Direct Plan Growth** 2,151.00 -
Canara Robeco Capital Protection Oriented Fund-Series 8 - Regular Growth 5.22 -
5,051.06 12,209.39Number of shares (unquoted)G R Building and Construction Nigeria Limited, a subsidiary company, of Nigerian Naira of 1 each, fully paid up
80,000,000 80,000,000
G R Infrastructure Limited, a subsidiary company, of Nigerian Naira of 1 each, fully paid up
7,500,000 7,500,000
Reengus Sikar Expressway Limited, a subsidiary company, of ` 10 each, fully paid up
500,000 500,000
GR Phagwara Expressway Limited, a subsidiary company, of ` 10 each, fully paid up
20,300,000 50,000
Nagaur Mukundgarh Highways Private Limited, a subsidiary company, of ` 10 each, fully paid up
13,630,000 10,000
Varanasi Sangam Expressway Private Limited, a subsidiary company, of ` 10 each, fully paid up
38,890,000 -
Porbandar Dwarka Expressway Private Limited, a subsidiary company, of ` 10 each, fully paid up
42,000,000 -
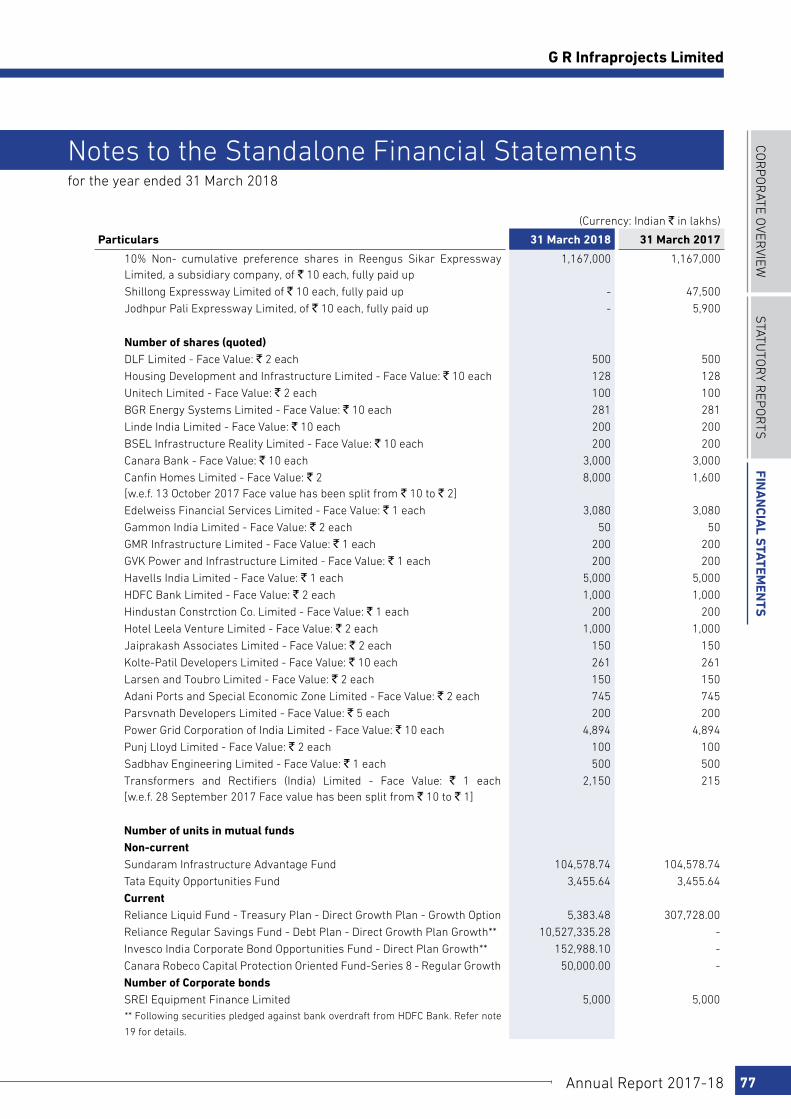
COR
PO
RATE O
VERVIEW
STATu
TOR
y REP
OR
TSFin
an
cial S
tatemen
tS
Annual Report 2017-18 77
G R Infraprojects Limited
for the year ended 31 March 2018
Notes to the Standalone Financial Statements
(Currency: Indian ` in lakhs)
Particulars 31 March 2018 31 March 2017
10% Non- cumulative preference shares in Reengus Sikar Expressway Limited, a subsidiary company, of ` 10 each, fully paid up
1,167,000 1,167,000
Shillong Expressway Limited of ` 10 each, fully paid up - 47,500
Jodhpur Pali Expressway Limited, of ` 10 each, fully paid up - 5,900
Number of shares (quoted)DLF Limited - Face Value: ` 2 each 500 500
Housing Development and Infrastructure Limited - Face Value: ` 10 each 128 128
Unitech Limited - Face Value: ` 2 each 100 100
BGR Energy Systems Limited - Face Value: ` 10 each 281 281
Linde India Limited - Face Value: ` 10 each 200 200
BSEL Infrastructure Reality Limited - Face Value: ` 10 each 200 200
Canara Bank - Face Value: ` 10 each 3,000 3,000
Canfin Homes Limited - Face Value: ` 2 [w.e.f. 13 October 2017 Face value has been split from ` 10 to ` 2]
8,000 1,600
Edelweiss Financial Services Limited - Face Value: ` 1 each 3,080 3,080
Gammon India Limited - Face Value: ` 2 each 50 50
GMR Infrastructure Limited - Face Value: ` 1 each 200 200
GVK Power and Infrastructure Limited - Face Value: ` 1 each 200 200
Havells India Limited - Face Value: ` 1 each 5,000 5,000
HDFC Bank Limited - Face Value: ` 2 each 1,000 1,000
Hindustan Constrction Co. Limited - Face Value: ` 1 each 200 200
Hotel Leela Venture Limited - Face Value: ` 2 each 1,000 1,000
Jaiprakash Associates Limited - Face Value: ` 2 each 150 150
Kolte-Patil Developers Limited - Face Value: ` 10 each 261 261
Larsen and Toubro Limited - Face Value: ` 2 each 150 150
Adani Ports and Special Economic Zone Limited - Face Value: ` 2 each 745 745
Parsvnath Developers Limited - Face Value: ` 5 each 200 200
Power Grid Corporation of India Limited - Face Value: ` 10 each 4,894 4,894
Punj Lloyd Limited - Face Value: ` 2 each 100 100
Sadbhav Engineering Limited - Face Value: ` 1 each 500 500
Transformers and Rectifiers (India) Limited - Face Value: ` 1 each [w.e.f. 28 September 2017 Face value has been split from ` 10 to ` 1]
2,150 215
Number of units in mutual fundsNon-currentSundaram Infrastructure Advantage Fund 104,578.74 104,578.74
Tata Equity Opportunities Fund 3,455.64 3,455.64
CurrentReliance Liquid Fund - Treasury Plan - Direct Growth Plan - Growth Option 5,383.48 307,728.00
Reliance Regular Savings Fund - Debt Plan - Direct Growth Plan Growth** 10,527,335.28 -
Invesco India Corporate Bond Opportunities Fund - Direct Plan Growth** 152,988.10 -
Canara Robeco Capital Protection Oriented Fund-Series 8 - Regular Growth 50,000.00 -
Number of Corporate bondsSREI Equipment Finance Limited 5,000 5,000** Following securities pledged against bank overdraft from HDFC Bank. Refer note
19 for details.
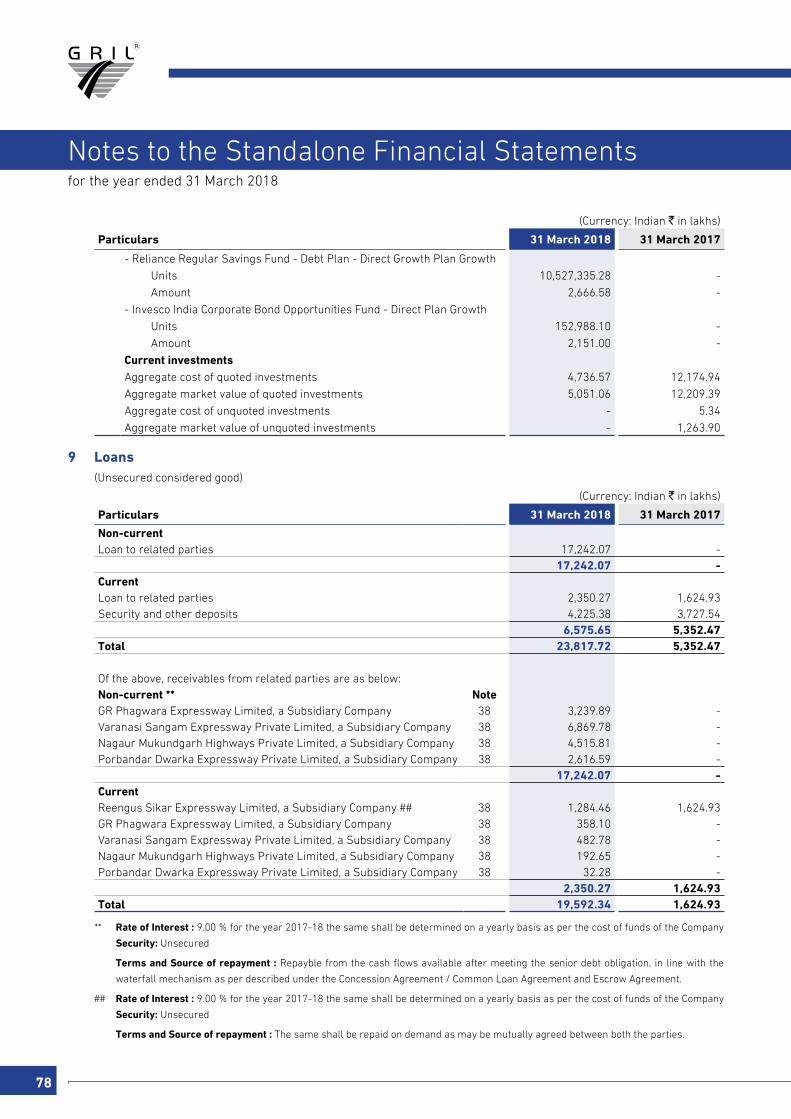
78
for the year ended 31 March 2018
Notes to the Standalone Financial Statements
(Currency: Indian ` in lakhs)
Particulars 31 March 2018 31 March 2017
- Reliance Regular Savings Fund - Debt Plan - Direct Growth Plan Growth
Units 10,527,335.28 -
Amount 2,666.58 -
- Invesco India Corporate Bond Opportunities Fund - Direct Plan Growth
Units 152,988.10 -
Amount 2,151.00 -
Current investmentsAggregate cost of quoted investments 4,736.57 12,174.94
Aggregate market value of quoted investments 5,051.06 12,209.39
Aggregate cost of unquoted investments - 5.34
Aggregate market value of unquoted investments - 1,263.90
9 Loans (Unsecured considered good)
(Currency: Indian ` in lakhs)
Particulars 31 March 2018 31 March 2017
Non-currentLoan to related parties 17,242.07 -
17,242.07 -CurrentLoan to related parties 2,350.27 1,624.93Security and other deposits 4,225.38 3,727.54
6,575.65 5,352.47Total 23,817.72 5,352.47
Of the above, receivables from related parties are as below:Non-current ** NoteGR Phagwara Expressway Limited, a Subsidiary Company 38 3,239.89 -Varanasi Sangam Expressway Private Limited, a Subsidiary Company 38 6,869.78 -Nagaur Mukundgarh Highways Private Limited, a Subsidiary Company 38 4,515.81 -Porbandar Dwarka Expressway Private Limited, a Subsidiary Company 38 2,616.59 -
17,242.07 -CurrentReengus Sikar Expressway Limited, a Subsidiary Company ## 38 1,284.46 1,624.93GR Phagwara Expressway Limited, a Subsidiary Company 38 358.10 -Varanasi Sangam Expressway Private Limited, a Subsidiary Company 38 482.78 -Nagaur Mukundgarh Highways Private Limited, a Subsidiary Company 38 192.65 -Porbandar Dwarka Expressway Private Limited, a Subsidiary Company 38 32.28 -
2,350.27 1,624.93 Total 19,592.34 1,624.93
** Rate of Interest : 9.00 % for the year 2017-18 the same shall be determined on a yearly basis as per the cost of funds of the Company
Security: Unsecured
Terms and Source of repayment : Repayble from the cash flows available after meeting the senior debt obligation, in line with the
waterfall mechanism as per described under the Concession Agreement / Common Loan Agreement and Escrow Agreement.
## Rate of Interest : 9.00 % for the year 2017-18 the same shall be determined on a yearly basis as per the cost of funds of the Company
Security: Unsecured
Terms and Source of repayment : The same shall be repaid on demand as may be mutually agreed between both the parties.
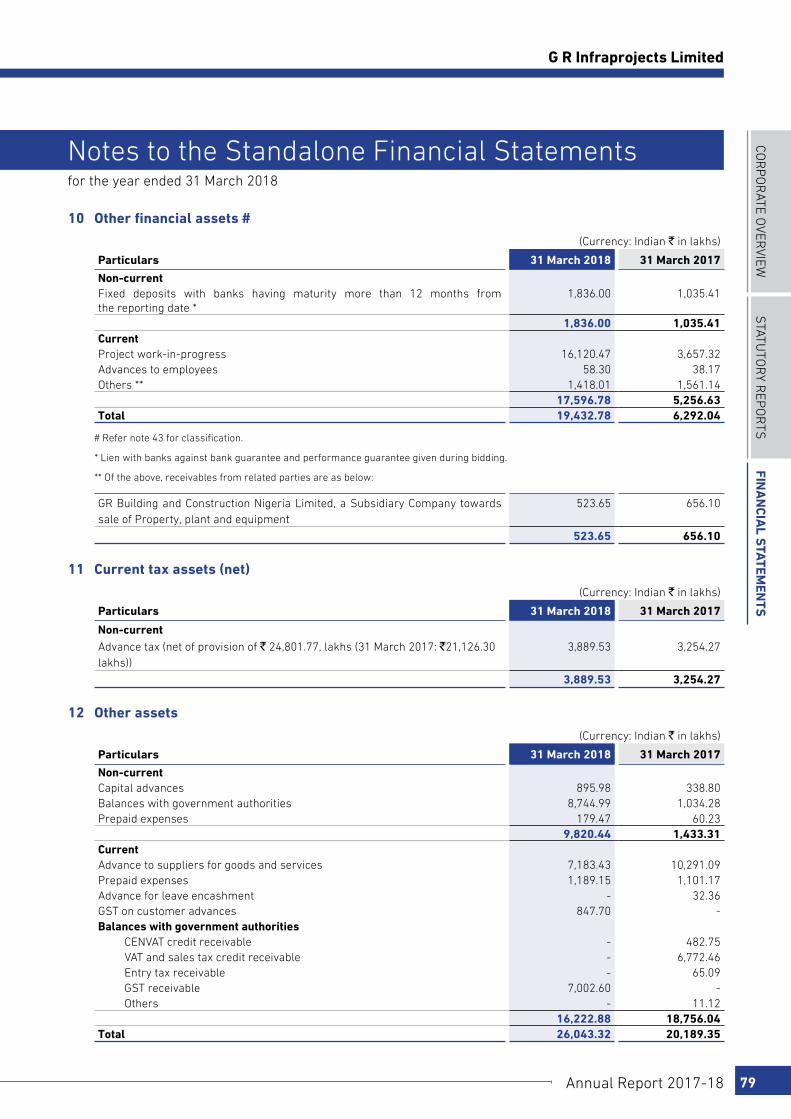
COR
PO
RATE O
VERVIEW
STATu
TOR
y REP
OR
TSFin
an
cial S
tatemen
tS
Annual Report 2017-18 79
G R Infraprojects Limited
for the year ended 31 March 2018
Notes to the Standalone Financial Statements
10 Other financial assets #
(Currency: Indian ` in lakhs)
Particulars 31 March 2018 31 March 2017
Non-currentFixed deposits with banks having maturity more than 12 months from the reporting date *
1,836.00 1,035.41
1,836.00 1,035.41 CurrentProject work-in-progress 16,120.47 3,657.32 Advances to employees 58.30 38.17 Others ** 1,418.01 1,561.14
17,596.78 5,256.63 Total 19,432.78 6,292.04
# Refer note 43 for classification.
* Lien with banks against bank guarantee and performance guarantee given during bidding.
** Of the above, receivables from related parties are as below:
GR Building and Construction Nigeria Limited, a Subsidiary Company towards sale of Property, plant and equipment
523.65 656.10
523.65 656.10
11 Current tax assets (net)
(Currency: Indian ` in lakhs)
Particulars 31 March 2018 31 March 2017
Non-currentAdvance tax (net of provision of ` 24,801.77, lakhs (31 March 2017: `21,126.30 lakhs))
3,889.53 3,254.27
3,889.53 3,254.27
12 Other assets
(Currency: Indian ` in lakhs)
Particulars 31 March 2018 31 March 2017
Non-currentCapital advances 895.98 338.80Balances with government authorities 8,744.99 1,034.28Prepaid expenses 179.47 60.23
9,820.44 1,433.31CurrentAdvance to suppliers for goods and services 7,183.43 10,291.09Prepaid expenses 1,189.15 1,101.17Advance for leave encashment - 32.36GST on customer advances 847.70 -Balances with government authorities
CENVAT credit receivable - 482.75VAT and sales tax credit receivable - 6,772.46Entry tax receivable - 65.09GST receivable 7,002.60 -Others - 11.12
16,222.88 18,756.04Total 26,043.32 20,189.35
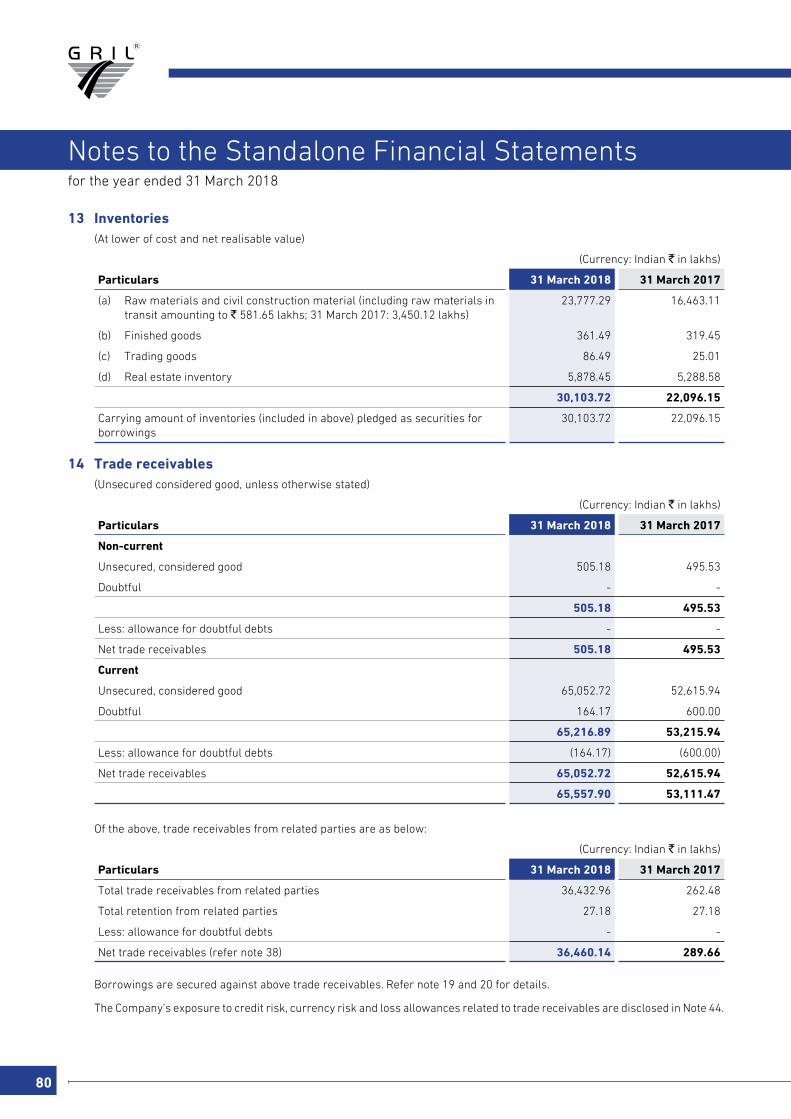
80
for the year ended 31 March 2018
Notes to the Standalone Financial Statements
13 Inventories (At lower of cost and net realisable value)
(Currency: Indian ` in lakhs)
Particulars 31 March 2018 31 March 2017
(a) Raw materials and civil construction material (including raw materials in transit amounting to ` 581.65 lakhs; 31 March 2017: 3,450.12 lakhs)
23,777.29 16,463.11
(b) Finished goods 361.49 319.45
(c) Trading goods 86.49 25.01
(d) Real estate inventory 5,878.45 5,288.58
30,103.72 22,096.15
Carrying amount of inventories (included in above) pledged as securities for borrowings
30,103.72 22,096.15
14 Trade receivables (Unsecured considered good, unless otherwise stated)
(Currency: Indian ` in lakhs)
Particulars 31 March 2018 31 March 2017
Non-current
Unsecured, considered good 505.18 495.53
Doubtful - -
505.18 495.53
Less: allowance for doubtful debts - -
Net trade receivables 505.18 495.53
Current
Unsecured, considered good 65,052.72 52,615.94
Doubtful 164.17 600.00
65,216.89 53,215.94
Less: allowance for doubtful debts (164.17) (600.00)
Net trade receivables 65,052.72 52,615.94
65,557.90 53,111.47
Of the above, trade receivables from related parties are as below:
(Currency: Indian ` in lakhs)
Particulars 31 March 2018 31 March 2017
Total trade receivables from related parties 36,432.96 262.48
Total retention from related parties 27.18 27.18
Less: allowance for doubtful debts - -
Net trade receivables (refer note 38) 36,460.14 289.66
Borrowings are secured against above trade receivables. Refer note 19 and 20 for details.
The Company’s exposure to credit risk, currency risk and loss allowances related to trade receivables are disclosed in Note 44.
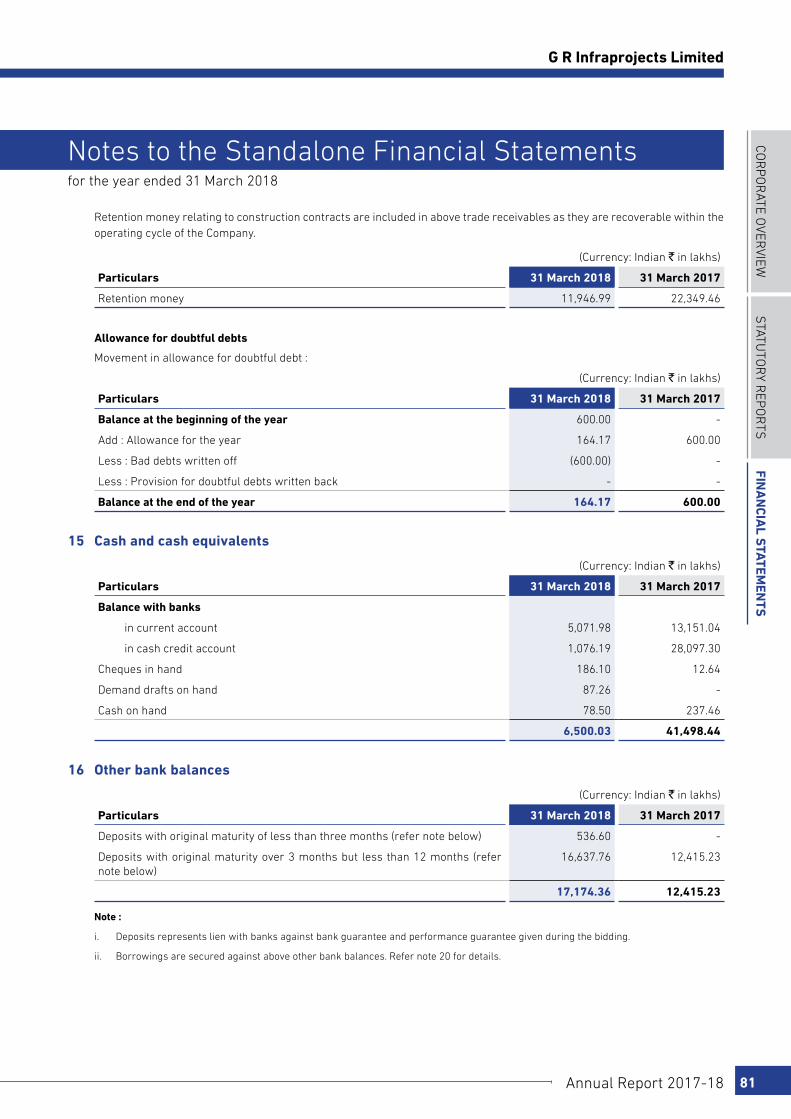
COR
PO
RATE O
VERVIEW
STATu
TOR
y REP
OR
TSFin
an
cial S
tatemen
tS
Annual Report 2017-18 81
G R Infraprojects Limited
for the year ended 31 March 2018
Notes to the Standalone Financial Statements
Retention money relating to construction contracts are included in above trade receivables as they are recoverable within the operating cycle of the Company.
(Currency: Indian ` in lakhs)
Particulars 31 March 2018 31 March 2017
Retention money 11,946.99 22,349.46
Allowance for doubtful debts
Movement in allowance for doubtful debt :
(Currency: Indian ` in lakhs)
Particulars 31 March 2018 31 March 2017
Balance at the beginning of the year 600.00 -
Add : Allowance for the year 164.17 600.00
Less : Bad debts written off (600.00) -
Less : Provision for doubtful debts written back - -
Balance at the end of the year 164.17 600.00
15 Cash and cash equivalents
(Currency: Indian ` in lakhs)
Particulars 31 March 2018 31 March 2017
Balance with banks
in current account 5,071.98 13,151.04
in cash credit account 1,076.19 28,097.30
Cheques in hand 186.10 12.64
Demand drafts on hand 87.26 -
Cash on hand 78.50 237.46
6,500.03 41,498.44
16 Other bank balances
(Currency: Indian ` in lakhs)
Particulars 31 March 2018 31 March 2017
Deposits with original maturity of less than three months (refer note below) 536.60 -
Deposits with original maturity over 3 months but less than 12 months (refer note below)
16,637.76 12,415.23
17,174.36 12,415.23
Note :
i. Deposits represents lien with banks against bank guarantee and performance guarantee given during the bidding.
ii. Borrowings are secured against above other bank balances. Refer note 20 for details.

82
for the year ended 31 March 2018
Notes to the Standalone Financial Statements
17 Share capital
(Currency: Indian ` in lakhs)
Particulars 31 March 2018 31 March 2017
Authorised: Equity share capital
178,000,000 (31 March 2017: 75,000,000) equity shares of ` 5 (31 March 2017 : ` 10) each
8,900.00 7,500.00
Issued subscribed and paid up
96,962,220 (31 March 2017: 48,481,110) equity shares of ` 5 (31 March 2017 : ` 10) each
4,848.12 4,848.12
4,848.12 4,848.12
All issued shares are fully paid up.
Reconciliation of share outstanding at the beginning and at the end of the year.
(Currency: Indian ` in lakhs)
Particulars 31 March 2018 31 March 2017
Numbers Amount Numbers Amount
At the commencement of the year 48,481,110 4,848.12 24,240,555 2,424.06
Bonus shares issued during the year - - 24,240,555 2,424.06
Increase in number of shares on account of face value split
48,481,110 - - -
At the end of the year 96,962,220 4,848.12 48,481,110 4,848.12
Authorised share capital of the Company was increased from ` 7,500 lakhs divided into 75,000,000 equity shares of ` 10 each to ` 8,900 lakhs divided into 84,000,000 Equity Shares of ` 10 and 5,000,000 Non-Cumulative Redeemable Preference Share of `10 each by virtue of final order from Hon’ble National Company Law Tribunal (“the Scheme”), Ahmedabad dated 22 February 2018 approving amalgamation between GR Infratech Private Limited (“Transferor Company”) and G R Infraprojects Limited (“Transferee Company”).
The Company has issued 4,121,907 9.50% Non-Convertible Preference Shares of face value ` 10 each on 12 March 2018 representing the carrying value of net assets of the Transferor Company as at the Appointed date. These 9.50% Non-Convertible Preference Shares have been redeemed on 17 March 2018 and consequently Capital redemption reserve has been created in accordance with sub-section (2) of section 55 of the Companies Act, 2013 out of profits of the Company available for dividend distribution. (refer note 18 and 49)
The shareholders of the Company have, at the Extraordinary General Meeting (EGM) held on 24 March 2018, accorded their consent to the following:
1 Authorised share capital of the Company comprising of ` 8,900 lakhs divided into 84,000,000 Equity Shares of ` 10 each and 5,000,000 Non-cumulative Redeemable Preference Shares of ` 10 be reclassified into 89,000,000 equity shares of ` 10 each aggregating to ` 8900 lakhs.
2 Sub division of the authorised and issued share capital of the Company by decreasing the face value of the equity share from ` 10 each to ` 5 each. The record date for the sub division was 30 March 2018. Accordingly, the issued, subscribed and paid up share capital of ` 4,848.12 lakhs comprise of 96,962,220 equity shares of ` 5 each.
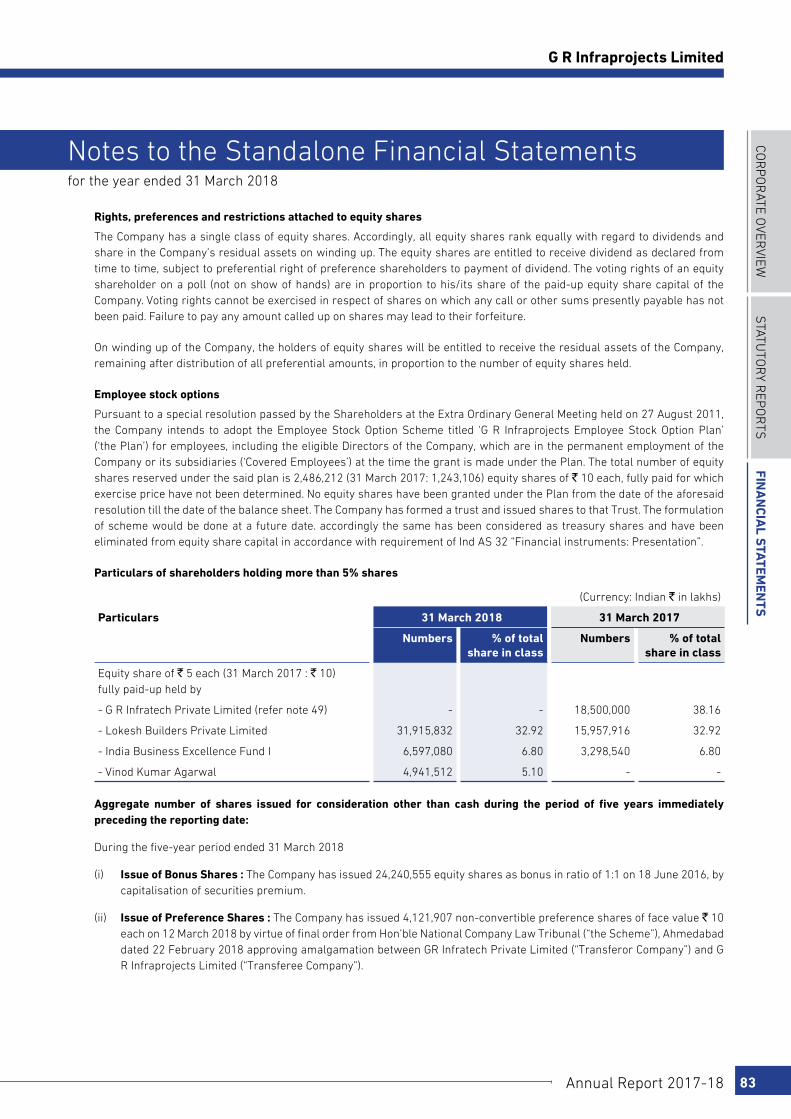
COR
PO
RATE O
VERVIEW
STATu
TOR
y REP
OR
TSFin
an
cial S
tatemen
tS
Annual Report 2017-18 83
G R Infraprojects Limited
for the year ended 31 March 2018
Notes to the Standalone Financial Statements
Rights, preferences and restrictions attached to equity shares
The Company has a single class of equity shares. Accordingly, all equity shares rank equally with regard to dividends and share in the Company’s residual assets on winding up. The equity shares are entitled to receive dividend as declared from time to time, subject to preferential right of preference shareholders to payment of dividend. The voting rights of an equity shareholder on a poll (not on show of hands) are in proportion to his/its share of the paid-up equity share capital of the Company. Voting rights cannot be exercised in respect of shares on which any call or other sums presently payable has not been paid. Failure to pay any amount called up on shares may lead to their forfeiture.
On winding up of the Company, the holders of equity shares will be entitled to receive the residual assets of the Company, remaining after distribution of all preferential amounts, in proportion to the number of equity shares held.
Employee stock options
Pursuant to a special resolution passed by the Shareholders at the Extra Ordinary General Meeting held on 27 August 2011, the Company intends to adopt the Employee Stock Option Scheme titled ‘G R Infraprojects Employee Stock Option Plan’ (‘the Plan’) for employees, including the eligible Directors of the Company, which are in the permanent employment of the Company or its subsidiaries (‘Covered Employees’) at the time the grant is made under the Plan. The total number of equity shares reserved under the said plan is 2,486,212 (31 March 2017: 1,243,106) equity shares of ` 10 each, fully paid for which exercise price have not been determined. No equity shares have been granted under the Plan from the date of the aforesaid resolution till the date of the balance sheet. The Company has formed a trust and issued shares to that Trust. The formulation of scheme would be done at a future date. accordingly the same has been considered as treasury shares and have been eliminated from equity share capital in accordance with requirement of Ind AS 32 “Financial instruments: Presentation”.
Particulars of shareholders holding more than 5% shares
(Currency: Indian ` in lakhs)
Particulars 31 March 2018 31 March 2017
Numbers % of total share in class
Numbers % of total share in class
Equity share of ` 5 each (31 March 2017 : ` 10) fully paid-up held by
- G R Infratech Private Limited (refer note 49) - - 18,500,000 38.16
- Lokesh Builders Private Limited 31,915,832 32.92 15,957,916 32.92
- India Business Excellence Fund I 6,597,080 6.80 3,298,540 6.80
- Vinod Kumar Agarwal 4,941,512 5.10 - -
Aggregate number of shares issued for consideration other than cash during the period of five years immediately preceding the reporting date:
During the five-year period ended 31 March 2018
(i) Issue of Bonus Shares : The Company has issued 24,240,555 equity shares as bonus in ratio of 1:1 on 18 June 2016, by capitalisation of securities premium.
(ii) Issue of Preference Shares : The Company has issued 4,121,907 non-convertible preference shares of face value ` 10 each on 12 March 2018 by virtue of final order from Hon’ble National Company Law Tribunal (“the Scheme”), Ahmedabad dated 22 February 2018 approving amalgamation between GR Infratech Private Limited (“Transferor Company”) and G R Infraprojects Limited (“Transferee Company”).
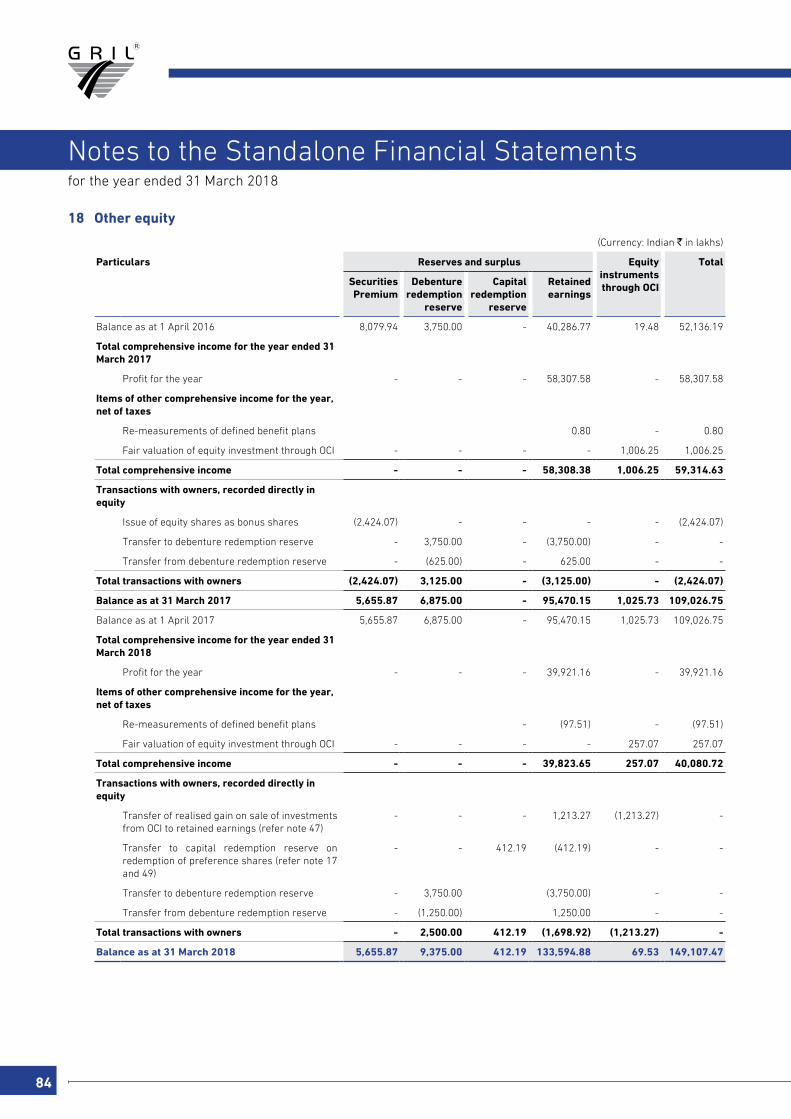
84
for the year ended 31 March 2018
Notes to the Standalone Financial Statements
18 Other equity
(Currency: Indian ` in lakhs)
Particulars Reserves and surplus Equity instruments through OCI
Total
Securities Premium
Debenture redemption
reserve
Capital redemption
reserve
Retained earnings
Balance as at 1 April 2016 8,079.94 3,750.00 - 40,286.77 19.48 52,136.19
Total comprehensive income for the year ended 31 March 2017
Profit for the year - - - 58,307.58 - 58,307.58
Items of other comprehensive income for the year, net of taxes
Re-measurements of defined benefit plans 0.80 - 0.80
Fair valuation of equity investment through OCI - - - - 1,006.25 1,006.25
Total comprehensive income - - - 58,308.38 1,006.25 59,314.63
Transactions with owners, recorded directly in equity
Issue of equity shares as bonus shares (2,424.07) - - - - (2,424.07)
Transfer to debenture redemption reserve - 3,750.00 - (3,750.00) - -
Transfer from debenture redemption reserve - (625.00) - 625.00 - -
Total transactions with owners (2,424.07) 3,125.00 - (3,125.00) - (2,424.07)
Balance as at 31 March 2017 5,655.87 6,875.00 - 95,470.15 1,025.73 109,026.75
Balance as at 1 April 2017 5,655.87 6,875.00 - 95,470.15 1,025.73 109,026.75
Total comprehensive income for the year ended 31 March 2018
Profit for the year - - - 39,921.16 - 39,921.16
Items of other comprehensive income for the year, net of taxes
Re-measurements of defined benefit plans - (97.51) - (97.51)
Fair valuation of equity investment through OCI - - - - 257.07 257.07
Total comprehensive income - - - 39,823.65 257.07 40,080.72
Transactions with owners, recorded directly in equity
Transfer of realised gain on sale of investments from OCI to retained earnings (refer note 47)
- - - 1,213.27 (1,213.27) -
Transfer to capital redemption reserve on redemption of preference shares (refer note 17 and 49)
- - 412.19 (412.19) - -
Transfer to debenture redemption reserve - 3,750.00 (3,750.00) - -
Transfer from debenture redemption reserve - (1,250.00) 1,250.00 - -
Total transactions with owners - 2,500.00 412.19 (1,698.92) (1,213.27) -
Balance as at 31 March 2018 5,655.87 9,375.00 412.19 133,594.88 69.53 149,107.47

COR
PO
RATE O
VERVIEW
STATu
TOR
y REP
OR
TSFin
an
cial S
tatemen
tS
Annual Report 2017-18 85
G R Infraprojects Limited
for the year ended 31 March 2018
Notes to the Standalone Financial Statements
Analysis of Accumulated OCI
(Currency: Indian ` in lakhs)
Particulars Remeasurement of Defined
Benefit Liability *
Equity instruments through OCI
Total
Balance as at 1 April 2016 (67.63) 19.48 (48.15)
Re-measurements of defined benefit plans 1.23 - 1.23
Fair valuation of equity investment through OCI - 1,295.99 1,295.99
Income tax effect (0.43) (289.74) (290.17)
Balance as at 31 March 2017 (66.83) 1,025.73 958.90
Re-measurements of defined benefit plans (149.12) - (149.12)
Fair valuation of equity investment through OCI - 296.75 296.75
Transfer of realised gain on sale of investments from OCI to retained earnings (refer note 47)
- (1,213.27) (1,213.27)
Income tax effect 51.61 (39.68) 11.93
Balance as at 31 March 2018 (164.34) 69.53 (94.81)
* transferred to retained earnings
Securities premium
Securities premium is used to record the premium received on issue of shares. It is utilised in accordance with the provisions of the Companies Act, 2013. The Company has issued bonus shares during the year ended 31 March 2017. The Company has utilised the balance of securities premium to issue bonus shares in accordance with the provisions of the Companies Act 2013.
Debenture redemption reserve (‘DRR’)
The reserve is created for redemption of non-convertible debentures in accordance with the sub-section (4) of section 71 of the Companies Act, 2013 out of profits of the Company available for dividend distribution. The same will be redeemed in line with repayment of terms agreed with lenders. Accordingly, DRR would be utilised for the redemption of debentures.
Capital redemption reserve (‘CRR’)
The reserve has been created on redemption of 9.50% Non-cumulative redeemable preference shares in accordance with the sub-section (2) of section 55 of the Companies Act, 2013 out of profits of the Company available for dividend distribution. (refer note 17).
Equity instruments through OCI
This represents the cumulative gains or losses arising on investments in equity instruments designated at fair value through other comprehensive income. This is based on optional exemption under Ind AS 101 under an irrevocable option. [These will not be reclassified to profit or loss subsequently. However an entity may transfer the cumulative realised gain or loss within equity for example from a non-distributable reserve to a distributable reserve.]
Remeasurements of defined benefit liability / (asset) through OCI
Remeasurements of defined benefit liability / (asset) comprises actuarial gains and losses and return on plan assets (excluding interest income). [These will not be reclassified to profit or loss subsequently.]
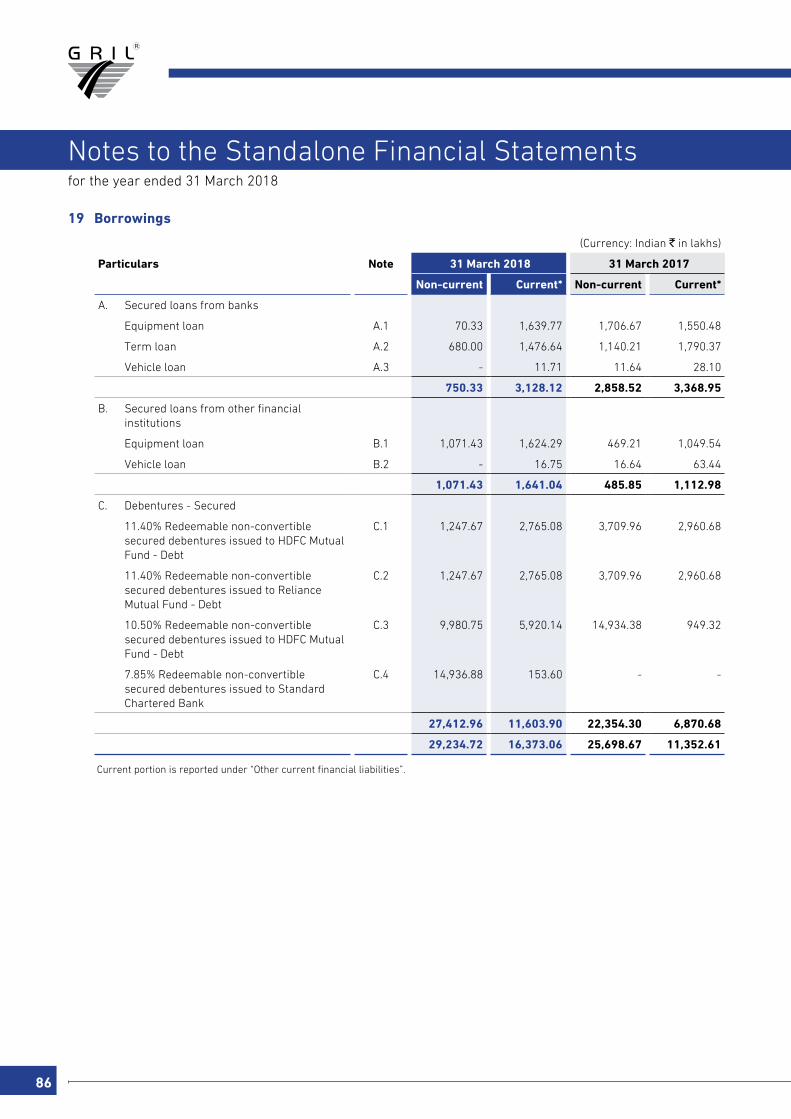
86
for the year ended 31 March 2018
Notes to the Standalone Financial Statements
19 Borrowings
(Currency: Indian ` in lakhs)
Particulars Note 31 March 2018 31 March 2017
Non-current Current* Non-current Current*
A. Secured loans from banks
Equipment loan A.1 70.33 1,639.77 1,706.67 1,550.48
Term loan A.2 680.00 1,476.64 1,140.21 1,790.37
Vehicle loan A.3 - 11.71 11.64 28.10
750.33 3,128.12 2,858.52 3,368.95
B. Secured loans from other financial institutions
Equipment loan B.1 1,071.43 1,624.29 469.21 1,049.54
Vehicle loan B.2 - 16.75 16.64 63.44
1,071.43 1,641.04 485.85 1,112.98
C. Debentures - Secured
11.40% Redeemable non-convertible secured debentures issued to HDFC Mutual Fund - Debt
C.1 1,247.67 2,765.08 3,709.96 2,960.68
11.40% Redeemable non-convertible secured debentures issued to Reliance Mutual Fund - Debt
C.2 1,247.67 2,765.08 3,709.96 2,960.68
10.50% Redeemable non-convertible secured debentures issued to HDFC Mutual Fund - Debt
C.3 9,980.75 5,920.14 14,934.38 949.32
7.85% Redeemable non-convertible secured debentures issued to Standard Chartered Bank
C.4 14,936.88 153.60 - -
27,412.96 11,603.90 22,354.30 6,870.68
29,234.72 16,373.06 25,698.67 11,352.61
Current portion is reported under “Other current financial liabilities”.
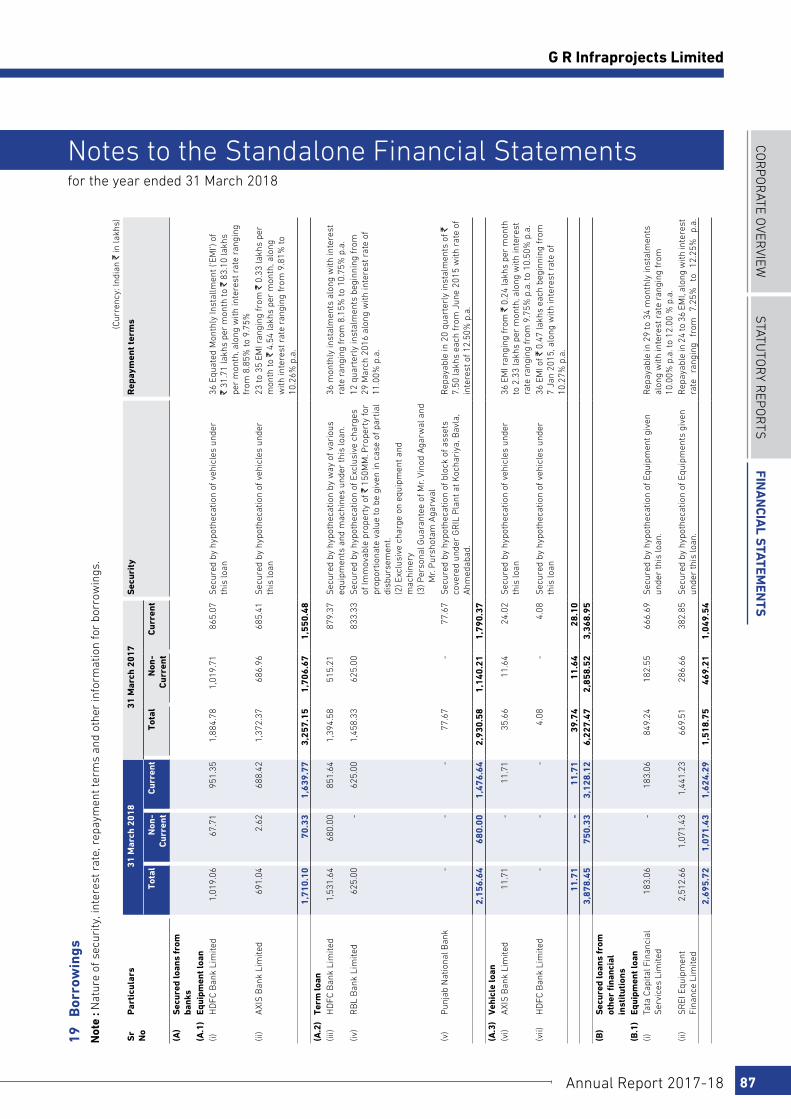
COR
PO
RATE O
VERVIEW
STATu
TOR
y REP
OR
TSFin
an
cial S
tatemen
tS
Annual Report 2017-18 87
G R Infraprojects Limited
for the year ended 31 March 2018
Notes to the Standalone Financial Statements
19
Bor
row
ings
N
ote
: Nat
ure
of s
ecur
ity, i
nter
est r
ate,
rep
aym
ent t
erm
s an
d ot
her
info
rmat
ion
for
borr
owin
gs.
(Cur
renc
y: In
dian
` in
lakh
s)
Sr
No
Par
ticu
lars
31
Mar
ch 2
018
31
Mar
ch 2
017
Sec
urit
yR
epay
men
t te
rms
Tota
lN
on-
Cur
rent
C
urre
ntTo
tal
Non
-C
urre
ntC
urre
nt
(A)
Sec
ured
loan
s fr
om
bank
s(A
.1)
Equi
pmen
t loa
n(i)
HD
FC B
ank
Lim
ited
1,01
9.06
67.7
195
1.35
1,88
4.78
1,01
9.71
865.
07S
ecur
ed b
y hy
poth
ecat
ion
of v
ehic
les
unde
r th
is lo
an36
Equ
ated
Mon
thly
Inst
allm
ent (
'EM
I') o
f `
31.7
1 la
khs
per
mon
th to
` 8
3.10
lakh
s pe
r m
onth
, alo
ng w
ith in
tere
st r
ate
rang
ing
from
8.8
5% to
9.7
5%(ii
)A
XIS
Ban
k Li
mite
d69
1.04
2.62
688.
421,
372.
3768
6.96
685.
41S
ecur
ed b
y hy
poth
ecat
ion
of v
ehic
les
unde
r th
is lo
an23
to 3
5 EM
I ran
ging
from
` 0
.33
lakh
s pe
r m
onth
to `
4.5
4 la
khs
per
mon
th, a
long
w
ith in
tere
st r
ate
rang
ing
from
9.8
1% to
10
.26%
p.a
.1,
710.
1070
.33
1,63
9.77
3,25
7.15
1,70
6.67
1,55
0.48
(A.2
) Te
rm lo
an(ii
i)H
DFC
Ban
k Li
mite
d1,
531.
6468
0.00
851.
641,
394.
5851
5.21
879.
37S
ecur
ed b
y hy
poth
ecat
ion
by w
ay o
f var
ious
eq
uipm
ents
and
mac
hine
s un
der
this
loan
.36
mon
thly
inst
alm
ents
alo
ng w
ith in
tere
st
rate
ran
ging
from
8.1
5% to
10.
75%
p.a
.(iv
)R
BL
Ban
k Li
mite
d62
5.00
-62
5.00
1,45
8.33
625.
0083
3.33
Sec
ured
by
hypo
thec
atio
n of
Exc
lusi
ve c
harg
es
of Im
mov
able
pro
pert
y of
` 1
50M
M. P
rope
rty
for
prop
ortio
nate
val
ue to
be
give
n in
cas
e of
par
tial
disb
urse
men
t. (2
) Exc
lusi
ve c
harg
e on
equ
ipm
ent a
nd
mac
hine
ry
(3) P
erso
nal G
uara
ntee
of M
r. Vi
nod
Aga
rwal
and
M
r. P
ursh
otam
Aga
rwal
12 q
uart
erly
inst
alm
ents
beg
inni
ng fr
om
29 M
arch
201
6 al
ong
with
inte
rest
rat
e of
11
.00%
p.a
.
(v)
Pun
jab
Nat
iona
l Ban
k-
--
77.6
7-
77.6
7S
ecur
ed b
y hy
poth
ecat
ion
of b
lock
of a
sset
s co
vere
d un
der
GR
IL P
lant
at K
ocha
riya
, Bav
la,
Ahm
edab
ad.
Rep
ayab
le in
20
quar
terl
y in
stal
men
ts o
f `
7.50
lakh
s ea
ch fr
om J
une
2015
with
rat
e of
in
tere
st o
f 12.
50%
p.a
.2,
156.
6468
0.00
1,47
6.64
2,93
0.58
1,14
0.21
1,79
0.37
(A.3
) V
ehic
le lo
an(v
i)A
XIS
Ban
k Li
mite
d11
.71
-11
.71
35.6
611
.64
24.0
2S
ecur
ed b
y hy
poth
ecat
ion
of v
ehic
les
unde
r th
is lo
an36
EM
I ran
ging
from
` 0
.24
lakh
s pe
r m
onth
to
2.3
3 la
khs
per
mon
th, a
long
with
inte
rest
ra
te r
angi
ng fr
om 9
.75%
p.a
. to
10.5
0% p
.a.
(vii)
HD
FC B
ank
Lim
ited
--
-4.
08-
4.08
Sec
ured
by
hypo
thec
atio
n of
veh
icle
s un
der
this
loan
36 E
MI o
f ` 0
.47
lakh
s ea
ch b
egin
ning
from
7
Jan
2015
, alo
ng w
ith in
tere
st r
ate
of
10.2
7% p
.a.
11.7
1-
11.7
139
.74
11.6
428
.10
3,87
8.45
750.
333,
128.
126,
227.
472,
858.
523,
368.
95(B
)S
ecur
ed lo
ans
from
ot
her
fina
ncia
l in
stit
utio
ns(B
.1)
Equi
pmen
t loa
n(i)
Tata
Cap
ital F
inan
cial
S
ervi
ces
Lim
ited
183.
06-
183.
0684
9.24
182.
5566
6.69
Sec
ured
by
hypo
thec
atio
n of
Equ
ipm
ent g
iven
un
der
this
loan
.R
epay
able
in 2
9 to
34
mon
thly
inst
alm
ents
al
ong
with
inte
rest
rat
e ra
ngin
g fr
om
10.0
0% p
.a. t
o 12
.00
% p
.a.
(ii)
SR
EI E
quip
men
t Fi
nanc
e Li
mite
d2,
512.
661,
071.
431,
441.
2366
9.51
286.
6638
2.85
Sec
ured
by
hypo
thec
atio
n of
Equ
ipm
ents
giv
en
unde
r th
is lo
an.
Rep
ayab
le in
24
to 3
6 EM
I, al
ong
with
inte
rest
ra
te
rang
ing
from
7.
25%
to
12
.25%
p.
a.2,
695.
721,
071.
431,
624.
291,
518.
7546
9.21
1,04
9.54
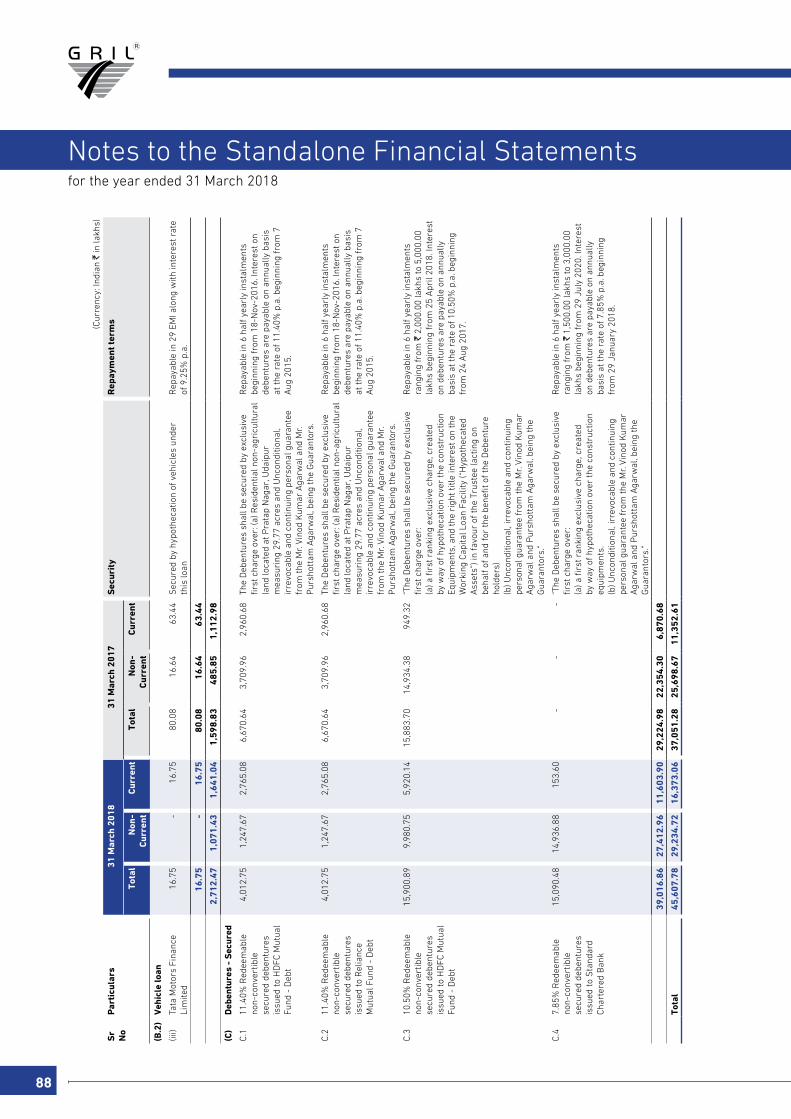
88
for the year ended 31 March 2018
Notes to the Standalone Financial Statements
(Cur
renc
y: In
dian
` in
lakh
s)
Sr
No
Par
ticu
lars
31
Mar
ch 2
018
31
Mar
ch 2
017
Sec
urit
yR
epay
men
t te
rms
Tota
lN
on-
Cur
rent
C
urre
ntTo
tal
Non
-C
urre
ntC
urre
nt
(B.2
)V
ehic
le lo
an
(iii)
Tata
Mot
ors
Fina
nce
Lim
ited
16.7
5-
16.7
580
.08
16.6
463
.44
Sec
ured
by
hypo
thec
atio
n of
veh
icle
s un
der
this
loan
Rep
ayab
le in
29
EMI a
long
with
inte
rest
rat
e of
9.2
5% p
.a.
16.7
5-
16.7
580
.08
16.6
463
.44
2,71
2.47
1,07
1.43
1,64
1.04
1,59
8.83
485.
851,
112.
98
(C)
Deb
entu
res
- S
ecur
ed
C.1
11.4
0% R
edee
mab
le
non-
conv
ertib
le
secu
red
debe
ntur
es
issu
ed to
HD
FC M
utua
l Fu
nd -
Deb
t
4,0
12.7
5 1
,247
.67
2,7
65.0
8 6
,670
.64
3,7
09.9
6 2
,960
.68
The
Deb
entu
res
shal
l be
secu
red
by e
xclu
sive
fir
st c
harg
e ov
er: (
a) R
esid
entia
l non
-agr
icul
tura
l la
nd lo
cate
d at
Pra
tap
Nag
ar, U
daip
ur
mea
suri
ng 2
9.77
acr
es a
nd U
ncon
ditio
nal,
irre
voca
ble
and
cont
inui
ng p
erso
nal g
uara
ntee
fr
om th
e M
r. Vi
nod
Kum
ar A
garw
al a
nd M
r. P
ursh
otta
m A
garw
al, b
eing
the
Gua
rant
ors.
Rep
ayab
le in
6 h
alf y
earl
y in
stal
men
ts
begi
nnin
g fr
om 1
8-N
ov-2
016.
Inte
rest
on
debe
ntur
es a
re p
ayab
le o
n an
nual
ly b
asis
at
the
rate
of 1
1.40
% p
.a. b
egin
ning
from
7
Aug
201
5.
C.2
11.4
0% R
edee
mab
le
non-
conv
ertib
le
secu
red
debe
ntur
es
issu
ed to
Rel
ianc
e M
utua
l Fun
d -
Deb
t
4,0
12.7
5 1
,247
.67
2,7
65.0
8 6
,670
.64
3,7
09.9
6 2
,960
.68
The
Deb
entu
res
shal
l be
secu
red
by e
xclu
sive
fir
st c
harg
e ov
er: (
a) R
esid
entia
l non
-agr
icul
tura
l la
nd lo
cate
d at
Pra
tap
Nag
ar, U
daip
ur
mea
suri
ng 2
9.77
acr
es a
nd U
ncon
ditio
nal,
irre
voca
ble
and
cont
inui
ng p
erso
nal g
uara
ntee
fr
om th
e M
r. Vi
nod
Kum
ar A
garw
al a
nd M
r. P
ursh
otta
m A
garw
al, b
eing
the
Gua
rant
ors.
Rep
ayab
le in
6 h
alf y
earl
y in
stal
men
ts
begi
nnin
g fr
om 1
8-N
ov-2
016.
Inte
rest
on
debe
ntur
es a
re p
ayab
le o
n an
nual
ly b
asis
at
the
rate
of 1
1.40
% p
.a. b
egin
ning
from
7
Aug
201
5.
C.3
10.5
0% R
edee
mab
le
non-
conv
ertib
le
secu
red
debe
ntur
es
issu
ed to
HD
FC M
utua
l Fu
nd -
Deb
t
15,
900.
89
9,9
80.7
5 5
,920
.14
15,
883.
70
14,
934.
38
949
.32
"The
Deb
entu
res
shal
l be
secu
red
by e
xclu
sive
fir
st c
harg
e ov
er:
(a) a
firs
t ran
king
exc
lusi
ve c
harg
e, c
reat
ed
by w
ay o
f hyp
othe
catio
n ov
er th
e co
nstr
uctio
n Eq
uipm
ents
, and
the
righ
t titl
e in
tere
st o
n th
e W
orki
ng C
apita
l Loa
n Fa
cilit
y (“
Hyp
othe
cate
d A
sset
s”) i
n fa
vour
of t
he T
rust
ee (a
ctin
g on
be
half
of a
nd fo
r th
e be
nefit
of t
he D
eben
ture
ho
lder
s)
(b) U
ncon
ditio
nal,
irre
voca
ble
and
cont
inui
ng
pers
onal
gua
rant
ee fr
om th
e M
r. Vi
nod
Kum
ar
Aga
rwal
and
Pur
shot
tam
Aga
rwal
, bei
ng th
e G
uara
ntor
s."
Rep
ayab
le in
6 h
alf y
earl
y in
stal
men
ts
rang
ing
from
` 2
,000
.00
lakh
s to
5,0
00.0
0 la
khs
begi
nnin
g fr
om 2
5 A
pril
2018
. Int
eres
t on
deb
entu
res
are
paya
ble
on a
nnua
lly
basi
s at
the
rate
of 1
0.50
% p
.a. b
egin
ning
fr
om 2
4 A
ug 2
017.
C.4
7.85
% R
edee
mab
le
non-
conv
ertib
le
secu
red
debe
ntur
es
issu
ed to
Sta
ndar
d Ch
arte
red
Ban
k
15,
090.
48
14,
936.
88
153
.60
-
-
-
"The
Deb
entu
res
shal
l be
secu
red
by e
xclu
sive
fir
st c
harg
e ov
er:
(a) a
firs
t ran
king
exc
lusi
ve c
harg
e, c
reat
ed
by w
ay o
f hyp
othe
catio
n ov
er th
e co
nstr
uctio
n eq
uipm
ents
. (b
) Unc
ondi
tiona
l, ir
revo
cabl
e an
d co
ntin
uing
pe
rson
al g
uara
ntee
from
the
Mr.
Vino
d K
umar
A
garw
al a
nd P
ursh
otta
m A
garw
al, b
eing
the
Gua
rant
ors.
"
Rep
ayab
le in
6 h
alf y
earl
y in
stal
men
ts
rang
ing
from
` 1
,500
.00
lakh
s to
3,0
00.0
0 la
khs
begi
nnin
g fr
om 2
9 Ju
ly 2
020.
Inte
rest
on
deb
entu
res
are
paya
ble
on a
nnua
lly
basi
s at
the
rate
of 7
.85%
p.a
. beg
inni
ng
from
29
Janu
ary
2018
.
39,
016.
86
27,
412.
96
11,
603.
90
29,
224.
98
22,
354.
30
6,8
70.6
8
Tota
l 4
5,60
7.78
2
9,23
4.72
1
6,37
3.06
3
7,05
1.28
2
5,69
8.67
1
1,35
2.61

COR
PO
RATE O
VERVIEW
STATu
TOR
y REP
OR
TSFin
an
cial S
tatemen
tS
Annual Report 2017-18 89
G R Infraprojects Limited
for the year ended 31 March 2018
Notes to the Standalone Financial Statements
20
Cur
rent
fina
ncia
l lia
bili
ties
- B
orro
win
gs
(Cur
renc
y: In
dian
` in
lakh
s)
Par
ticu
lars
Not
e 3
1 M
arch
201
8 3
1 M
arch
201
7 S
ecur
ed :
Cash
cre
dit -
sec
ured
A 1
0,36
0.65
9
51.6
1
Wor
king
cap
ital d
eman
d lo
anB
1,0
00.0
0 1
,000
.00
Ban
k O
verd
raft
C 4
,012
.47
-
Uns
ecur
ed:
from
oth
ers
D 5
03.5
9 5
05.6
3
15,
876.
71
2,4
57.2
4
Not
e : N
atur
e of
sec
urity
, int
eres
t rat
e, r
epay
men
t ter
ms
and
othe
r in
form
atio
n fo
r bo
rrow
ings
(Cur
renc
y: In
dian
` in
lakh
s)
Sr
No
Par
ticu
lars
31
Mar
ch 2
018
31
Mar
ch 2
017
Sec
urit
yR
epay
men
t te
rms
(A)
Cash
Cre
dit (
Sec
ured
)
(i)Ca
sh c
redi
t fro
m H
DFC
B
ank
5,2
84.3
4 -
S
ecur
ed b
y hy
poth
ecat
ion
of c
urre
nt a
sset
s in
clud
ing
inve
ntor
ies
of r
aw m
ater
ials
, SIP
, go
ods
in tr
ansi
t, st
ores
/ s
pare
s /
cons
umab
les,
trad
e re
ceiv
able
s, e
tc. e
xclu
ding
ass
ets
unde
r re
al e
stat
e in
vent
ory
both
pre
sent
and
futu
re. T
hese
are
furt
her
seco
ndly
sec
ured
by
col
late
ral s
ecur
ity in
form
of i
mm
ovab
le p
rope
rtie
s to
the
exte
nt o
f 10%
of t
otal
w
orki
ng c
apita
l lim
its a
nd a
ny s
hort
fall
in c
olla
tera
l sec
urity
will
be
met
by
fixed
dep
osit
Rep
ayab
le o
n de
man
d w
ith in
tere
st r
ate
rang
ing
from
9.0
0% -
13.
30%
p.a
.
(ii)
Cash
cre
dit f
rom
Sta
te
bank
of I
ndia
7.5
5 0
.77
Sec
ured
by
hypo
thec
atio
n of
cur
rent
ass
ets
incl
udin
g in
vent
orie
s of
raw
mat
eria
ls,
SIP
, goo
ds in
tran
sit,
stor
es /
spa
res
/ co
nsum
able
s, tr
ade
rece
ivab
les,
etc
. exc
ludi
ng
asse
ts u
nder
rea
l est
ate
inve
ntor
y bo
th p
rese
nt a
nd fu
ture
. The
se a
re fu
rthe
r se
cure
d by
co
llate
ral s
ecur
ity in
form
of i
mm
ovab
le p
rope
rtie
s to
the
exte
nt o
f 10%
of t
otal
wor
king
ca
pita
l lim
its a
nd a
ny s
hort
fall
in c
olla
tera
l sec
urity
will
be
met
by
fixed
dep
osit
Rep
ayab
le o
n de
man
d w
ith in
tere
st r
ate
rang
ing
from
10.
00%
- 1
2.00
% p
.a.
(iii)
Cash
cre
dit f
rom
Sta
te
Ban
k of
Bik
aner
& J
aipu
r -
1
9.35
S
ecur
ed b
y hy
poth
ecat
ion
of c
urre
nt a
sset
s in
clud
ing
inve
ntor
ies
of r
aw m
ater
ials
, S
IP, g
oods
in tr
ansi
t, st
ores
/ s
pare
s /
cons
umab
les,
trad
e re
ceiv
able
s, e
tc. e
xclu
ding
as
sets
und
er r
eal e
stat
e in
vent
ory
both
pre
sent
and
futu
re. T
hese
are
furt
her
secu
red
by
colla
tera
l sec
urity
in fo
rm o
f im
mov
able
pro
pert
ies
to th
e ex
tent
of 1
0% o
f tot
al w
orki
ng
capi
tal l
imits
and
any
sho
rtfa
ll in
col
late
ral s
ecur
ity w
ill b
e m
et b
y fix
ed d
epos
it
Rep
ayab
le o
n de
man
d w
ith in
tere
st r
ate
rang
ing
from
10.
00%
- 1
2.00
% p
.a.
(iv)
Cash
cre
dit f
rom
Ban
k of
Indi
a -
4
81.3
6 S
ecur
ed b
y hy
poth
ecat
ion
of c
urre
nt a
sset
s in
clud
ing
inve
ntor
ies
of r
aw m
ater
ials
, S
IP, g
oods
in tr
ansi
t, st
ores
/ s
pare
s /
cons
umab
les,
trad
e re
ceiv
able
s, e
tc. e
xclu
ding
as
sets
und
er r
eal e
stat
e in
vent
ory
both
pre
sent
and
futu
re. T
hese
are
furt
her
secu
red
by
colla
tera
l sec
urity
in fo
rm o
f im
mov
able
pro
pert
ies
to th
e ex
tent
of 1
0% o
f tot
al w
orki
ng
capi
tal l
imits
and
any
sho
rtfa
ll in
col
late
ral s
ecur
ity w
ill b
e m
et b
y fix
ed d
epos
it
Rep
ayab
le o
n de
man
d w
ith in
tere
st r
ate
of
9.00
% to
10.
75%
p.a
.
(v)
Cash
cre
dit
from
Can
ara
Ban
k 2
5.08
4
50.1
3 S
ecur
ed b
y hy
poth
ecat
ion
of c
urre
nt a
sset
s in
clud
ing
inve
ntor
ies
of r
aw m
ater
ials
, S
IP, g
oods
in tr
ansi
t, st
ores
/ s
pare
s /
cons
umab
les,
trad
e re
ceiv
able
s, e
tc. e
xclu
ding
as
sets
und
er r
eal e
stat
e in
vent
ory
both
pre
sent
and
futu
re. T
hese
are
furt
her
secu
red
by
colla
tera
l sec
urity
in fo
rm o
f im
mov
able
pro
pert
ies
to th
e ex
tent
of 1
0% o
f tot
al w
orki
ng
capi
tal l
imits
and
any
sho
rtfa
ll in
col
late
ral s
ecur
ity w
ill b
e m
et b
y fix
ed d
epos
it
Rep
ayab
le o
n de
man
d w
ith in
tere
st r
ate
of
10.6
5% p
.a. (
MCL
R +
1.3
0%)
(vi)
Cash
cre
dit f
rom
Pun
jab
natio
nal B
ank
2,5
08.6
9 -
S
ecur
ed b
y hy
poth
ecat
ion
of c
urre
nt a
sset
s in
clud
ing
inve
ntor
ies
of r
aw m
ater
ials
, SIP
, go
ods
in tr
ansi
t, st
ores
/ s
pare
s /
cons
umab
les,
trad
e re
ceiv
able
s, e
tc. e
xclu
ding
ass
ets
unde
r re
al e
stat
e in
vent
ory
both
pre
sent
and
futu
re. T
hese
are
furt
her
seco
ndly
sec
ured
by
col
late
ral s
ecur
ity in
form
of i
mm
ovab
le p
rope
rtie
s to
the
exte
nt o
f 10%
of t
otal
w
orki
ng c
apita
l lim
its a
nd a
ny s
hort
fall
in c
olla
tera
l sec
urity
will
be
met
by
fixed
dep
osit
Rep
ayab
le o
n de
man
d w
ith in
tere
st r
ate
rang
ing
from
9.0
0% -
10.
00%
p.a
.
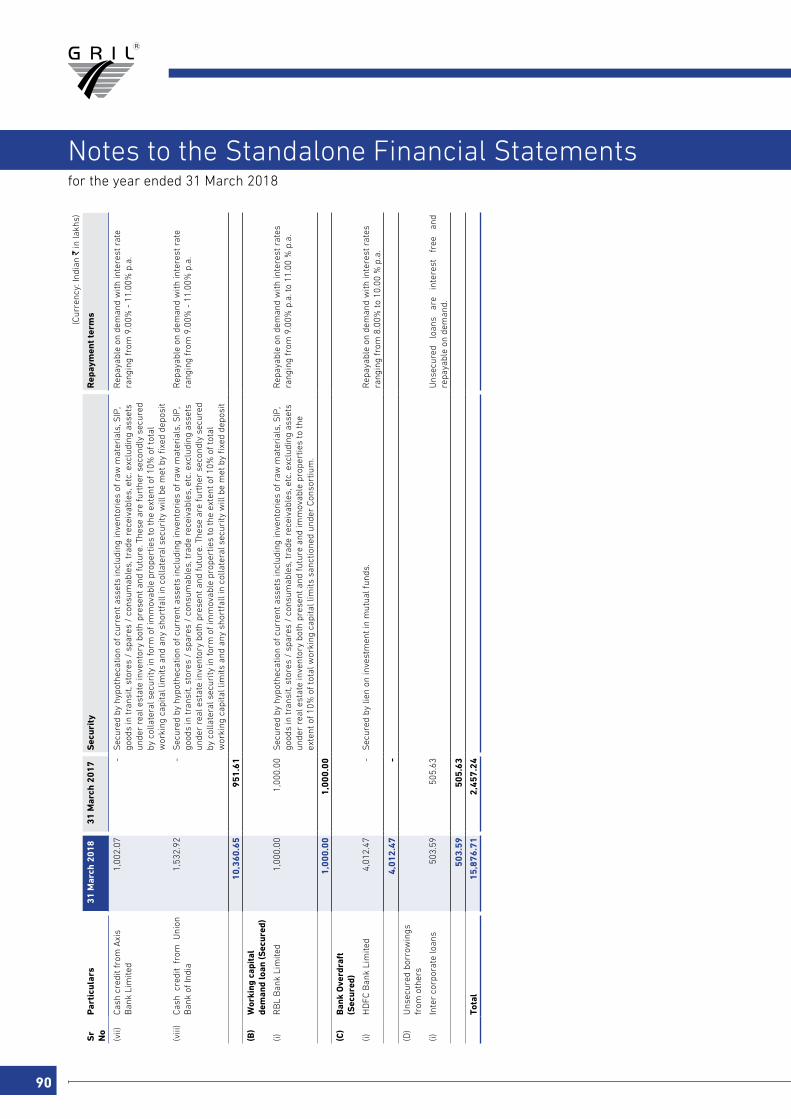
90
for the year ended 31 March 2018
Notes to the Standalone Financial Statements
(Cur
renc
y: In
dian
` in
lakh
s)
Sr
No
Par
ticu
lars
31
Mar
ch 2
018
31
Mar
ch 2
017
Sec
urit
yR
epay
men
t te
rms
(vii)
Cash
cre
dit f
rom
Axi
s B
ank
Lim
ited
1,0
02.0
7 -
S
ecur
ed b
y hy
poth
ecat
ion
of c
urre
nt a
sset
s in
clud
ing
inve
ntor
ies
of r
aw m
ater
ials
, SIP
, go
ods
in tr
ansi
t, st
ores
/ s
pare
s /
cons
umab
les,
trad
e re
ceiv
able
s, e
tc. e
xclu
ding
ass
ets
unde
r re
al e
stat
e in
vent
ory
both
pre
sent
and
futu
re. T
hese
are
furt
her
seco
ndly
sec
ured
by
col
late
ral s
ecur
ity in
form
of i
mm
ovab
le p
rope
rtie
s to
the
exte
nt o
f 10%
of t
otal
w
orki
ng c
apita
l lim
its a
nd a
ny s
hort
fall
in c
olla
tera
l sec
urity
will
be
met
by
fixed
dep
osit
Rep
ayab
le o
n de
man
d w
ith in
tere
st r
ate
rang
ing
from
9.0
0% -
11.
00%
p.a
.
(viii
)Ca
sh c
redi
t fr
om U
nion
B
ank
of In
dia
1,5
32.9
2 -
S
ecur
ed b
y hy
poth
ecat
ion
of c
urre
nt a
sset
s in
clud
ing
inve
ntor
ies
of r
aw m
ater
ials
, SIP
, go
ods
in tr
ansi
t, st
ores
/ s
pare
s /
cons
umab
les,
trad
e re
ceiv
able
s, e
tc. e
xclu
ding
ass
ets
unde
r re
al e
stat
e in
vent
ory
both
pre
sent
and
futu
re. T
hese
are
furt
her
seco
ndly
sec
ured
by
col
late
ral s
ecur
ity in
form
of i
mm
ovab
le p
rope
rtie
s to
the
exte
nt o
f 10%
of t
otal
w
orki
ng c
apita
l lim
its a
nd a
ny s
hort
fall
in c
olla
tera
l sec
urity
will
be
met
by
fixed
dep
osit
Rep
ayab
le o
n de
man
d w
ith in
tere
st r
ate
rang
ing
from
9.0
0% -
11.
00%
p.a
.
10,
360.
65
951
.61
(B)
Wor
king
cap
ital
de
man
d lo
an (S
ecur
ed)
(i)R
BL
Ban
k Li
mite
d 1
,000
.00
1,0
00.0
0 S
ecur
ed b
y hy
poth
ecat
ion
of c
urre
nt a
sset
s in
clud
ing
inve
ntor
ies
of r
aw m
ater
ials
, SIP
, go
ods
in tr
ansi
t, st
ores
/ s
pare
s /
cons
umab
les,
trad
e re
ceiv
able
s, e
tc. e
xclu
ding
ass
ets
unde
r re
al e
stat
e in
vent
ory
both
pre
sent
and
futu
re a
nd im
mov
able
pro
pert
ies
to th
e ex
tent
of 1
0% o
f tot
al w
orki
ng c
apita
l lim
its s
anct
ione
d un
der
Cons
ortiu
m.
Rep
ayab
le o
n de
man
d w
ith in
tere
st r
ates
ra
ngin
g fr
om 9
.00%
p.a
. to
11.0
0 %
p.a
.
1,0
00.0
0 1
,000
.00
(C)
Ban
k O
verd
raft
(S
ecur
ed)
(i)H
DFC
Ban
k Li
mite
d 4
,012
.47
-
Sec
ured
by
lien
on in
vest
men
t in
mut
ual f
unds
.R
epay
able
on
dem
and
with
inte
rest
rat
es
rang
ing
from
8.0
0% to
10.
00 %
p.a
.
4,0
12.4
7 -
(D)
Uns
ecur
ed b
orro
win
gs
from
oth
ers
(i)In
ter
corp
orat
e lo
ans
503
.59
505
.63
Uns
ecur
ed
loan
s ar
e in
tere
st
free
an
d re
paya
ble
on d
eman
d.
503
.59
505
.63
Tota
l 1
5,87
6.71
2
,457
.24
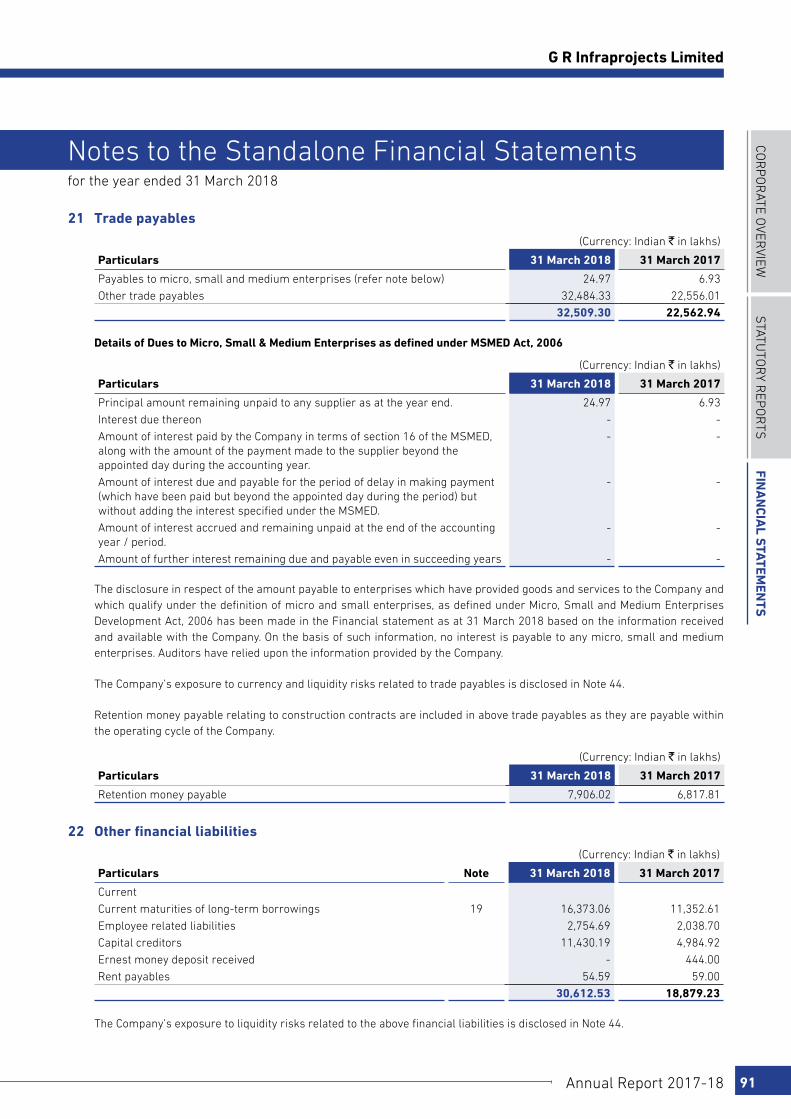
COR
PO
RATE O
VERVIEW
STATu
TOR
y REP
OR
TSFin
an
cial S
tatemen
tS
Annual Report 2017-18 91
G R Infraprojects Limited
for the year ended 31 March 2018
Notes to the Standalone Financial Statements
21 Trade payables
(Currency: Indian ` in lakhs)
Particulars 31 March 2018 31 March 2017
Payables to micro, small and medium enterprises (refer note below) 24.97 6.93
Other trade payables 32,484.33 22,556.01
32,509.30 22,562.94
Details of Dues to Micro, Small & Medium Enterprises as defined under MSMED Act, 2006
(Currency: Indian ` in lakhs)
Particulars 31 March 2018 31 March 2017
Principal amount remaining unpaid to any supplier as at the year end. 24.97 6.93
Interest due thereon - -
Amount of interest paid by the Company in terms of section 16 of the MSMED, along with the amount of the payment made to the supplier beyond the appointed day during the accounting year.
- -
Amount of interest due and payable for the period of delay in making payment (which have been paid but beyond the appointed day during the period) but without adding the interest specified under the MSMED.
- -
Amount of interest accrued and remaining unpaid at the end of the accounting year / period.
- -
Amount of further interest remaining due and payable even in succeeding years - -
The disclosure in respect of the amount payable to enterprises which have provided goods and services to the Company and which qualify under the definition of micro and small enterprises, as defined under Micro, Small and Medium Enterprises Development Act, 2006 has been made in the Financial statement as at 31 March 2018 based on the information received and available with the Company. On the basis of such information, no interest is payable to any micro, small and medium enterprises. Auditors have relied upon the information provided by the Company.
The Company’s exposure to currency and liquidity risks related to trade payables is disclosed in Note 44.
Retention money payable relating to construction contracts are included in above trade payables as they are payable within the operating cycle of the Company.
(Currency: Indian ` in lakhs)
Particulars 31 March 2018 31 March 2017
Retention money payable 7,906.02 6,817.81
22 Other financial liabilities
(Currency: Indian ` in lakhs)
Particulars Note 31 March 2018 31 March 2017
Current
Current maturities of long-term borrowings 19 16,373.06 11,352.61
Employee related liabilities 2,754.69 2,038.70
Capital creditors 11,430.19 4,984.92
Ernest money deposit received - 444.00
Rent payables 54.59 59.00
30,612.53 18,879.23
The Company’s exposure to liquidity risks related to the above financial liabilities is disclosed in Note 44.
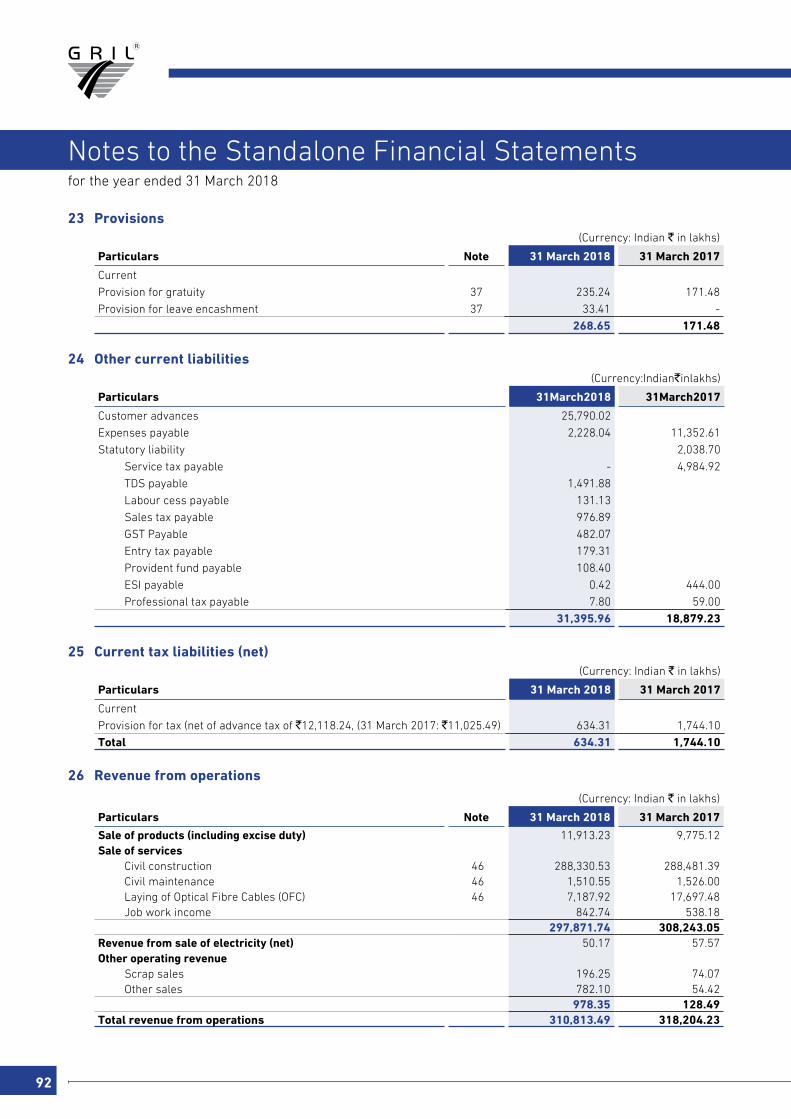
92
for the year ended 31 March 2018
Notes to the Standalone Financial Statements
23 Provisions(Currency: Indian ` in lakhs)
Particulars Note 31 March 2018 31 March 2017
Current
Provision for gratuity 37 235.24 171.48
Provision for leave encashment 37 33.41 -
268.65 171.48
24 Other current liabilities(Currency:Indian`inlakhs)
Particulars 31March2018 31March2017
Customer advances 25,790.02
Expenses payable 2,228.04 11,352.61
Statutory liability 2,038.70
Service tax payable - 4,984.92
TDS payable 1,491.88
Labour cess payable 131.13
Sales tax payable 976.89
GST Payable 482.07
Entry tax payable 179.31
Provident fund payable 108.40
ESI payable 0.42 444.00
Professional tax payable 7.80 59.00
31,395.96 18,879.23
25 Current tax liabilities (net)(Currency: Indian ` in lakhs)
Particulars 31 March 2018 31 March 2017
Current
Provision for tax (net of advance tax of `12,118.24, (31 March 2017: `11,025.49) 634.31 1,744.10
Total 634.31 1,744.10
26 Revenue from operations
(Currency: Indian ` in lakhs)
Particulars Note 31 March 2018 31 March 2017
Sale of products (including excise duty) 11,913.23 9,775.12Sale of services
Civil construction 46 288,330.53 288,481.39Civil maintenance 46 1,510.55 1,526.00Laying of Optical Fibre Cables (OFC) 46 7,187.92 17,697.48Job work income 842.74 538.18
297,871.74 308,243.05Revenue from sale of electricity (net) 50.17 57.57Other operating revenue
Scrap sales 196.25 74.07Other sales 782.10 54.42
978.35 128.49Total revenue from operations 310,813.49 318,204.23
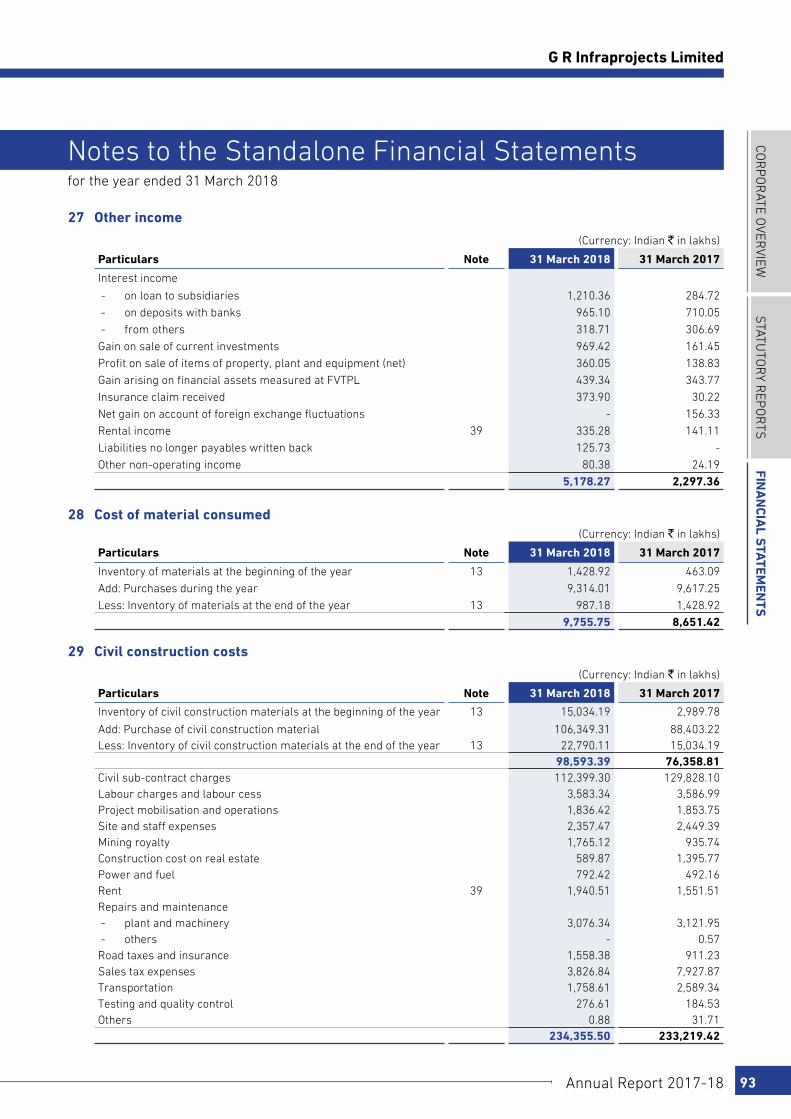
COR
PO
RATE O
VERVIEW
STATu
TOR
y REP
OR
TSFin
an
cial S
tatemen
tS
Annual Report 2017-18 93
G R Infraprojects Limited
for the year ended 31 March 2018
Notes to the Standalone Financial Statements
27 Other income
(Currency: Indian ` in lakhs)
Particulars Note 31 March 2018 31 March 2017
Interest income
- on loan to subsidiaries 1,210.36 284.72
- on deposits with banks 965.10 710.05
- from others 318.71 306.69
Gain on sale of current investments 969.42 161.45
Profit on sale of items of property, plant and equipment (net) 360.05 138.83
Gain arising on financial assets measured at FVTPL 439.34 343.77
Insurance claim received 373.90 30.22
Net gain on account of foreign exchange fluctuations - 156.33
Rental income 39 335.28 141.11
Liabilities no longer payables written back 125.73 -
Other non-operating income 80.38 24.19
5,178.27 2,297.36
28 Cost of material consumed(Currency: Indian ` in lakhs)
Particulars Note 31 March 2018 31 March 2017
Inventory of materials at the beginning of the year 13 1,428.92 463.09
Add: Purchases during the year 9,314.01 9,617.25
Less: Inventory of materials at the end of the year 13 987.18 1,428.92
9,755.75 8,651.42
29 Civil construction costs
(Currency: Indian ` in lakhs)
Particulars Note 31 March 2018 31 March 2017
Inventory of civil construction materials at the beginning of the year 13 15,034.19 2,989.78
Add: Purchase of civil construction material 106,349.31 88,403.22Less: Inventory of civil construction materials at the end of the year 13 22,790.11 15,034.19
98,593.39 76,358.81Civil sub-contract charges 112,399.30 129,828.10Labour charges and labour cess 3,583.34 3,586.99Project mobilisation and operations 1,836.42 1,853.75Site and staff expenses 2,357.47 2,449.39Mining royalty 1,765.12 935.74Construction cost on real estate 589.87 1,395.77Power and fuel 792.42 492.16Rent 39 1,940.51 1,551.51Repairs and maintenance - plant and machinery 3,076.34 3,121.95 - others - 0.57Road taxes and insurance 1,558.38 911.23Sales tax expenses 3,826.84 7,927.87Transportation 1,758.61 2,589.34Testing and quality control 276.61 184.53Others 0.88 31.71
234,355.50 233,219.42
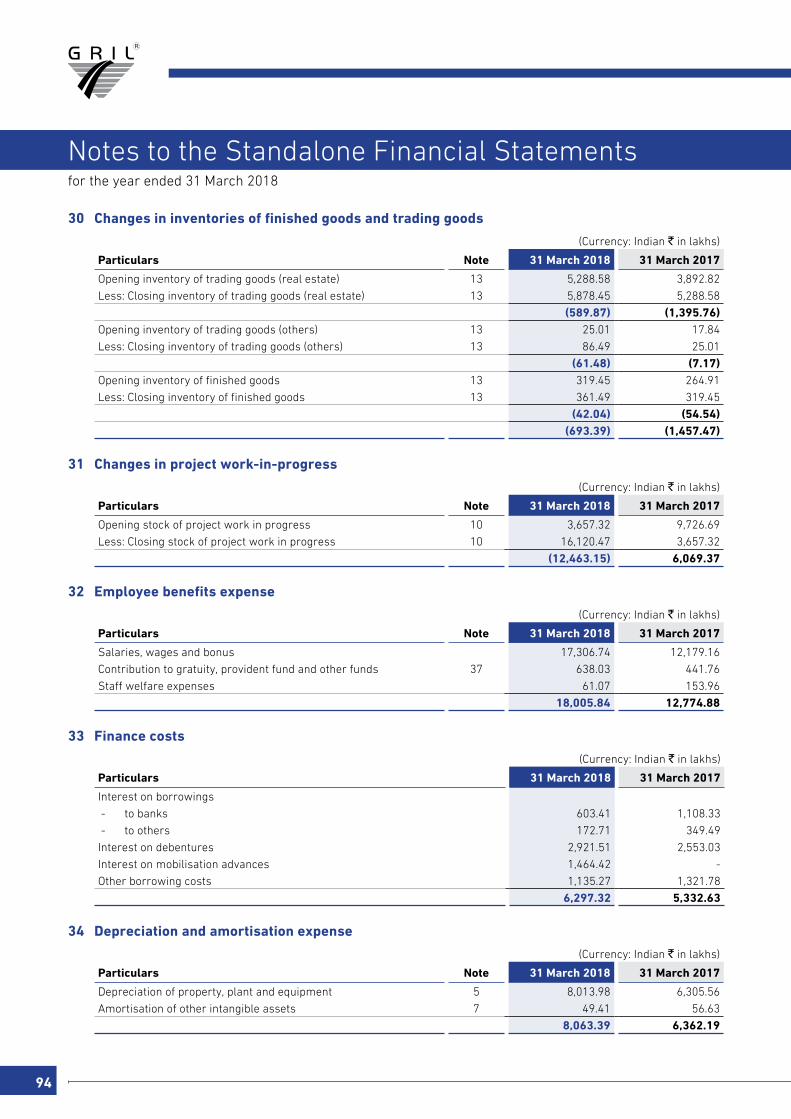
94
for the year ended 31 March 2018
Notes to the Standalone Financial Statements
30 Changes in inventories of finished goods and trading goods
(Currency: Indian ` in lakhs)
Particulars Note 31 March 2018 31 March 2017
Opening inventory of trading goods (real estate) 13 5,288.58 3,892.82
Less: Closing inventory of trading goods (real estate) 13 5,878.45 5,288.58
(589.87) (1,395.76)Opening inventory of trading goods (others) 13 25.01 17.84
Less: Closing inventory of trading goods (others) 13 86.49 25.01
(61.48) (7.17)Opening inventory of finished goods 13 319.45 264.91
Less: Closing inventory of finished goods 13 361.49 319.45
(42.04) (54.54) (693.39) (1,457.47)
31 Changes in project work-in-progress
(Currency: Indian ` in lakhs)
Particulars Note 31 March 2018 31 March 2017
Opening stock of project work in progress 10 3,657.32 9,726.69
Less: Closing stock of project work in progress 10 16,120.47 3,657.32
(12,463.15) 6,069.37
32 Employee benefits expense
(Currency: Indian ` in lakhs)
Particulars Note 31 March 2018 31 March 2017
Salaries, wages and bonus 17,306.74 12,179.16
Contribution to gratuity, provident fund and other funds 37 638.03 441.76
Staff welfare expenses 61.07 153.96
18,005.84 12,774.88
33 Finance costs
(Currency: Indian ` in lakhs)
Particulars 31 March 2018 31 March 2017
Interest on borrowings
- to banks 603.41 1,108.33
- to others 172.71 349.49
Interest on debentures 2,921.51 2,553.03
Interest on mobilisation advances 1,464.42 -
Other borrowing costs 1,135.27 1,321.78
6,297.32 5,332.63
34 Depreciation and amortisation expense
(Currency: Indian ` in lakhs)
Particulars Note 31 March 2018 31 March 2017
Depreciation of property, plant and equipment 5 8,013.98 6,305.56
Amortisation of other intangible assets 7 49.41 56.63
8,063.39 6,362.19

COR
PO
RATE O
VERVIEW
STATu
TOR
y REP
OR
TSFin
an
cial S
tatemen
tS
Annual Report 2017-18 95
G R Infraprojects Limited
for the year ended 31 March 2018
Notes to the Standalone Financial Statements
35 Other expenses
(Currency: Indian ` in lakhs)
Particulars Note 31 March 2018 31 March 2017
Rent 39 472.72 305.01
Repairs and maintenance - others 412.43 376.82
Payment to auditors (refer note (i) below) 39.75 30.67
Legal and professional charges 762.35 705.11
Travelling and conveyance 546.20 344.34
CSR expenses (refer note (ii) below) 69.11 237.42
Printing and stationery 130.25 101.20
Provision for doubtful debts 14 164.17 600.00
Bad-debts written off 739.92 -
Bank charges 20.28 31.56
Net loss on account of foreign exchange fluctuations 86.53 -
Miscellaneous expenses 618.44 903.07
4,062.15 3,635.20
(i) Payment to auditors
(Currency: Indian ` in lakhs)
Particulars 31 March 2018 31 March 2017
Payment to auditors (exclusive of goods and service tax / service tax)
- as auditor
- Statutory audit 34.00 28.00
- Other services 4.00 1.00
- Reimbursement of expenses 1.75 1.67
39.75 30.67
(ii) Details of corporate social responsibility expenditure
(Currency: Indian ` in lakhs)
Particulars 31 March 2018 31 March 2017
A. Gross amount required to be spent by the Company 431.85 174.30
B. Amount spent during the year (in cash)
(i) Construction / acquisition of any asset - -
(ii) On purposes other than (i) above 69.11 237.42
C. Related party transactions in relation to corporate social responsibility
- -
D. Provision movement during the year:
Opening provision - -
Addition during the year - -
Utilised during the year - -
Closing provision - -
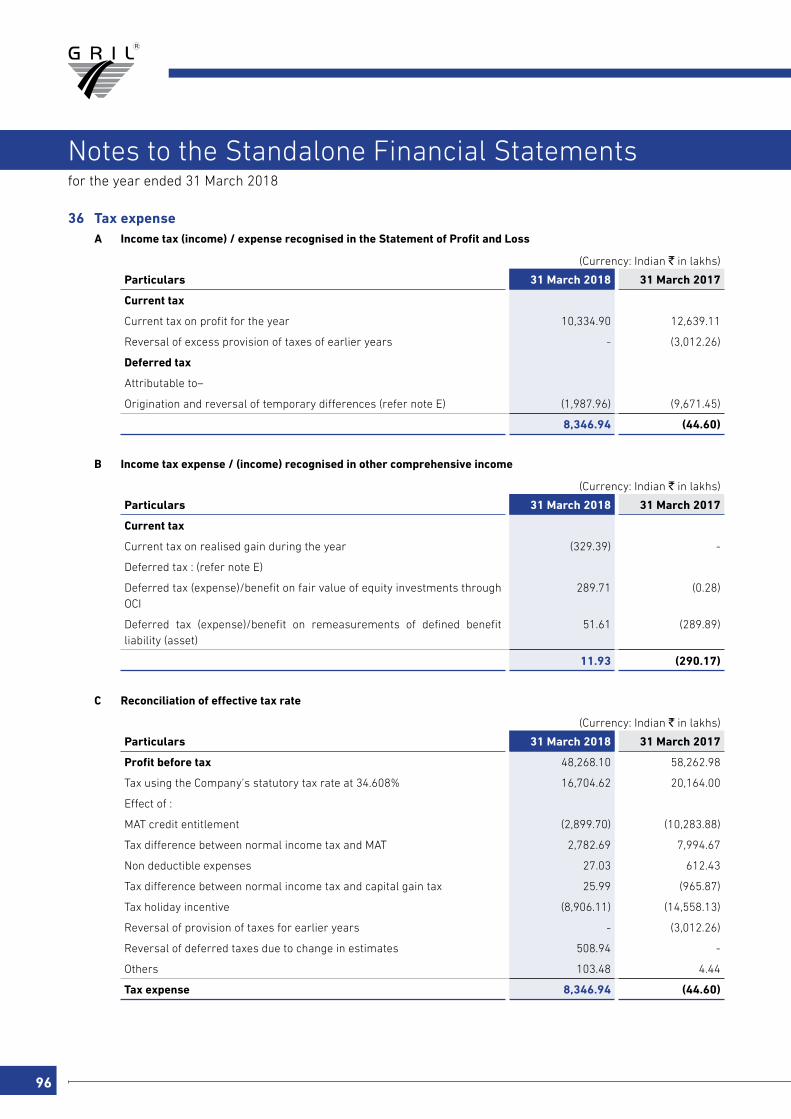
96
for the year ended 31 March 2018
Notes to the Standalone Financial Statements
36 Tax expense A Income tax (income) / expense recognised in the Statement of Profit and Loss
(Currency: Indian ` in lakhs)
Particulars 31 March 2018 31 March 2017
Current tax
Current tax on profit for the year 10,334.90 12,639.11
Reversal of excess provision of taxes of earlier years - (3,012.26)
Deferred tax
Attributable to–
Origination and reversal of temporary differences (refer note E) (1,987.96) (9,671.45)
8,346.94 (44.60)
B Income tax expense / (income) recognised in other comprehensive income
(Currency: Indian ` in lakhs)
Particulars 31 March 2018 31 March 2017
Current tax
Current tax on realised gain during the year (329.39) -
Deferred tax : (refer note E)
Deferred tax (expense)/benefit on fair value of equity investments through OCI
289.71 (0.28)
Deferred tax (expense)/benefit on remeasurements of defined benefit liability (asset)
51.61 (289.89)
11.93 (290.17)
C Reconciliation of effective tax rate
(Currency: Indian ` in lakhs)
Particulars 31 March 2018 31 March 2017
Profit before tax 48,268.10 58,262.98
Tax using the Company’s statutory tax rate at 34.608% 16,704.62 20,164.00
Effect of :
MAT credit entitlement (2,899.70) (10,283.88)
Tax difference between normal income tax and MAT 2,782.69 7,994.67
Non deductible expenses 27.03 612.43
Tax difference between normal income tax and capital gain tax 25.99 (965.87)
Tax holiday incentive (8,906.11) (14,558.13)
Reversal of provision of taxes for earlier years - (3,012.26)
Reversal of deferred taxes due to change in estimates 508.94 -
Others 103.48 4.44
Tax expense 8,346.94 (44.60)
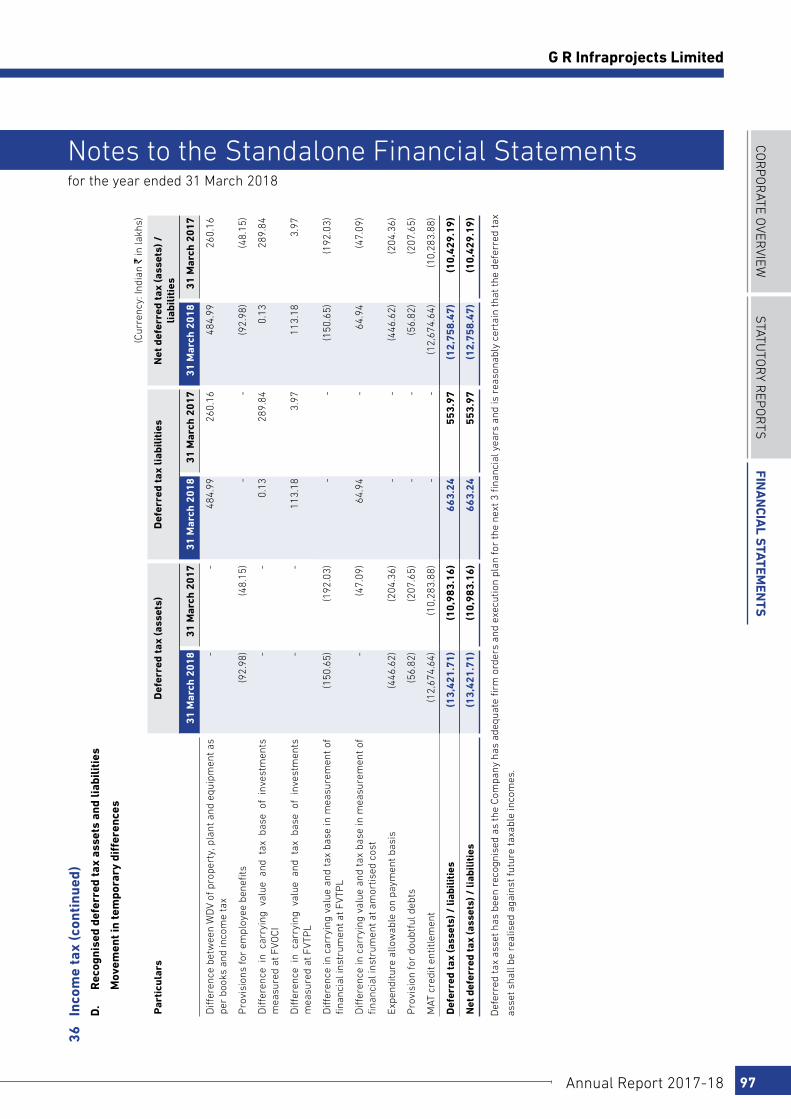
COR
PO
RATE O
VERVIEW
STATu
TOR
y REP
OR
TSFin
an
cial S
tatemen
tS
Annual Report 2017-18 97
G R Infraprojects Limited
for the year ended 31 March 2018
Notes to the Standalone Financial Statements
36
Inco
me
tax
(con
tinu
ed)
D
. R
ecog
nise
d de
ferr
ed ta
x as
sets
and
liab
iliti
es
Mov
emen
t in
tem
pora
ry d
iffer
ence
s
(Cur
renc
y: In
dian
` in
lakh
s)
Par
ticu
lars
Def
erre
d ta
x (a
sset
s)D
efer
red
tax
liab
ilit
ies
Net
def
erre
d ta
x (a
sset
s) /
li
abil
itie
s
31 M
arch
201
8 3
1 M
arch
201
731
Mar
ch 2
018
31
Mar
ch 2
017
31 M
arch
201
831
Mar
ch 2
017
Diff
eren
ce b
etw
een
WD
V of
pro
pert
y, p
lant
and
equ
ipm
ent a
s pe
r bo
oks
and
inco
me
tax
--
484.
9926
0.16
484.
9926
0.16
Pro
visi
ons
for
empl
oyee
ben
efits
(92.
98)
(48.
15)
--
(92.
98)
(48.
15)
Diff
eren
ce i
n ca
rryi
ng v
alue
and
tax
bas
e of
inv
estm
ents
m
easu
red
at F
VOCI
--
0.13
289.
840.
1328
9.84
Diff
eren
ce i
n ca
rryi
ng v
alue
and
tax
bas
e of
inv
estm
ents
m
easu
red
at F
VTP
L-
-11
3.18
3.97
113.
183.
97
Diff
eren
ce in
car
ryin
g va
lue
and
tax
base
in m
easu
rem
ent
of
finan
cial
inst
rum
ent a
t FVT
PL
(150
.65)
(192
.03)
--
(150
.65)
(192
.03)
Diff
eren
ce in
car
ryin
g va
lue
and
tax
base
in m
easu
rem
ent
of
finan
cial
inst
rum
ent a
t am
ortis
ed c
ost
-(4
7.09
)64
.94
-64
.94
(47.
09)
Expe
nditu
re a
llow
able
on
paym
ent b
asis
(446
.62)
(204
.36)
--
(446
.62)
(204
.36)
Pro
visi
on fo
r do
ubtf
ul d
ebts
(56.
82)
(207
.65)
--
(56.
82)
(207
.65)
MAT
cre
dit e
ntitl
emen
t(1
2,67
4.64
)(1
0,28
3.88
)-
-(1
2,67
4.64
)(1
0,28
3.88
)
Def
erre
d ta
x (a
sset
s) /
liab
iliti
es(1
3,42
1.71
)(1
0,98
3.16
)66
3.24
553.
97(1
2,75
8.47
)(1
0,42
9.19
)
Net
def
erre
d ta
x (a
sset
s) /
liab
iliti
es(1
3,42
1.71
)(1
0,98
3.16
)66
3.24
553.
97(1
2,75
8.47
)(1
0,42
9.19
)
D
efer
red
tax
asse
t has
bee
n re
cogn
ised
as
the
Com
pany
has
ade
quat
e fir
m o
rder
s an
d ex
ecut
ion
plan
for
the
next
3 fi
nanc
ial y
ears
and
is r
easo
nabl
y ce
rtai
n th
at th
e de
ferr
ed ta
x
asse
t sha
ll be
rea
lised
aga
inst
futu
re ta
xabl
e in
com
es.

98
for the year ended 31 March 2018
Notes to the Standalone Financial Statements
E.
R
ecog
nise
d de
ferr
ed ta
x (a
sset
s) a
nd li
abili
ties
Mov
emen
t in
tem
pora
ry d
iffer
ence
s
(Cur
renc
y: In
dian
` in
lakh
s)
Par
ticu
lars
Bal
ance
as
at
1 A
pril
201
6
Rec
ogni
sed
in p
rofi
t or
lo
ss d
urin
g 20
16-1
7
Rec
ogni
sed
in O
CI
duri
ng 2
016- 17
Bal
ance
as
at
31 M
arch
20
17
Rec
ogni
sed
in p
rofi
t or
lo
ss d
urin
g 20
17-1
8
Rec
ogni
sed
in O
CI
duri
ng
2017
-18
Bal
ance
as
at
31 M
arch
20
18
Diff
eren
ce b
etw
een
WD
V of
pro
pert
y, p
lant
and
equ
ipm
ent a
s pe
r bo
oks
and
inco
me
tax
342.
73(8
2.57
)-
260.
1622
4.83
-48
4.99
Pro
visi
ons
for
empl
oyee
ben
efits
(21.
71)
(26.
86)
0.42
(48.
15)
6.78
(51.
61)
(92.
98)
Diff
eren
ce i
n ca
rryi
ng v
alue
and
tax
bas
e of
inv
estm
ents
m
easu
red
at F
VOCI
0.09
-28
9.75
289.
84-
(289
.71)
0.13
Diff
eren
ce i
n ca
rryi
ng v
alue
and
tax
bas
e of
inv
estm
ents
m
easu
red
at F
VTP
L-
3.97
-3.
9710
9.21
-11
3.18
Diff
eren
ce in
car
ryin
g va
lue
and
tax
base
in m
easu
rem
ent
of
finan
cial
inst
rum
ent a
t FVT
PL
(1,1
03.5
4)91
1.51
-(1
92.0
3)41
.38
-(1
50.6
5)
Diff
eren
ce in
car
ryin
g va
lue
and
tax
base
in m
easu
rem
ent
of
finan
cial
inst
rum
ent a
t am
ortis
ed c
ost
(5.2
1)(4
1.88
)-
(47.
09)
112.
03-
64.9
4
Expe
nditu
re a
llow
able
on
paym
ent b
asis
(260
.27)
55.9
1-
(204
.36)
(242
.26)
-(4
46.6
2)
Pro
visi
on fo
r do
ubtf
ul d
ebts
-(2
07.6
5)-
(207
.65)
150.
83-
(56.
82)
MAT
cre
dit e
ntitl
emen
t-
(10,
283.
88)
-(1
0,28
3.88
)(2
,390
.76)
-(1
2,67
4.64
)
(1,0
47.9
1)(9
,671
.45)
290.
17(1
0,42
9.19
)(1
,987
.96)
(341
.32)
(12,
758.
47)
F.
M
AT c
redi
t
The
deta
ils o
f MAT
cre
dit a
vaila
ble
and
reco
gnis
ed a
long
with
thei
r ex
piry
det
ails
are
as
belo
w:
(Cur
renc
y: In
dian
` in
lakh
s)
Par
ticu
lars
31 M
arch
201
8 3
1 M
arch
201
7
MA
T cr
edit
ava
ilab
leE
xpir
y as
sess
men
t ye
arM
AT
cred
it a
vail
able
Exp
iry
asse
ssm
ent
year
AY 2
016-
171,
453.
7720
31-3
21,
453.
7720
31-3
2
AY 2
017-
188,
321.
1720
32-3
38,
830.
1120
32-3
3
AY 2
018-
192,
899.
7020
33-3
4
Tota
l12
,674
.64
10,2
83.8
8
MAT
cre
dit r
ecog
nise
d12
,674
.64
10,2
83.8
8
M
AT c
redi
t has
bee
n re
cogn
ised
as
ther
e is
a r
easo
nabl
e ce
rtai
nty
that
MAT
cre
dit w
ill b
e ut
ilise
d ag
ains
t fut
ure
taxa
ble
profi
t.

COR
PO
RATE O
VERVIEW
STATu
TOR
y REP
OR
TSFin
an
cial S
tatemen
tS
Annual Report 2017-18 99
G R Infraprojects Limited
for the year ended 31 March 2018
Notes to the Standalone Financial Statements
37 Employee benefits A. Defined benefits
Gratuity
The Company operates a defined benefit plan (the gratuity plan) covering eligible employees, which provides a lump sum payment to vested employees at retirement, death, incapacitation or termination of employment, of an amount based on the respective employees salary and tenure of employment.
The following tables set out the funded status of the gratuity plans and the amounts recognised in the Company’s standalone financial statements as at 31 March 2018 and 31 March 2017 :
(Currency: Indian ` in lakhs)
Particulars 31 March 2018 31 March 2017
Change in benefit obligations
Benefit obligations at the beginning 389.49 322.16
Service cost 73.73 58.79
Interest expense 28.13 25.09
Actuarial loss due to change in financial assumptions 34.19 29.05
Actuarial loss due to change in demographic assumptions 42.76 13.19
Actuarial loss due to experience adjustments 79.18 (48.28)
Benefits paid (19.93) (10.51)
Benefit obligations at the end 627.55 389.49
Change in plan assets
Fair value of plan assets at the beginning 218.01 216.48
Interest income 15.74 16.86
Contributions by the employer 171.48 -
Return on plan assets excluding amounts included in interest income 7.01 (4.82)
Benefits paid (19.93) (10.51)
Fair value of plan assets at the end 392.31 218.01
Reconciliation of fair value of assets and obligationFair value of plan assets as at the end of the year 392.31 218.01
Present value of obligation as at the end of the year 627.55 389.49
Amount recognised in the Balance Sheet (235.24) (171.48)Non-current (235.24) (171.48)
Current - -
Expense recognised in profit or lossCurrent service cost 73.73 58.79
Interest cost 12.39 8.23
86.12 67.02
Remeasurements recognised in other comprehensive incomeDue to change in financial assumptions 34.19 29.04
Due to change in demographic assumptions 42.76 13.19
Due to experience adjustments 79.18 (48.28)
Return on plan assets excluding amounts included in interest income (7.01) 4.82
149.12 (1.23)
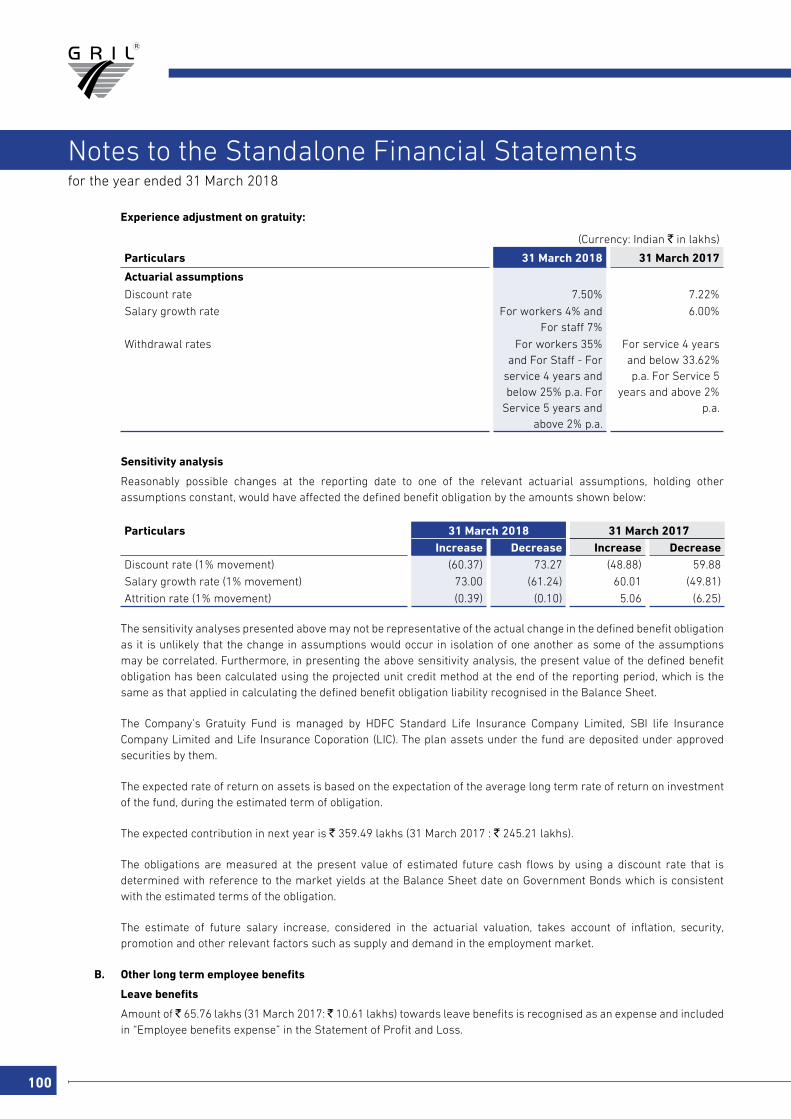
100
for the year ended 31 March 2018
Notes to the Standalone Financial Statements
Experience adjustment on gratuity:
(Currency: Indian ` in lakhs)
Particulars 31 March 2018 31 March 2017
Actuarial assumptions
Discount rate 7.50% 7.22%
Salary growth rate For workers 4% and For staff 7%
6.00%
Withdrawal rates For workers 35% and For Staff - For
service 4 years and below 25% p.a. For
Service 5 years and above 2% p.a.
For service 4 years and below 33.62% p.a. For Service 5
years and above 2% p.a.
Sensitivity analysis
Reasonably possible changes at the reporting date to one of the relevant actuarial assumptions, holding other assumptions constant, would have affected the defined benefit obligation by the amounts shown below:
Particulars 31 March 2018 31 March 2017Increase Decrease Increase Decrease
Discount rate (1% movement) (60.37) 73.27 (48.88) 59.88
Salary growth rate (1% movement) 73.00 (61.24) 60.01 (49.81)
Attrition rate (1% movement) (0.39) (0.10) 5.06 (6.25)
The sensitivity analyses presented above may not be representative of the actual change in the defined benefit obligation as it is unlikely that the change in assumptions would occur in isolation of one another as some of the assumptions may be correlated. Furthermore, in presenting the above sensitivity analysis, the present value of the defined benefit obligation has been calculated using the projected unit credit method at the end of the reporting period, which is the same as that applied in calculating the defined benefit obligation liability recognised in the Balance Sheet.
The Company’s Gratuity Fund is managed by HDFC Standard Life Insurance Company Limited, SBI life Insurance Company Limited and Life Insurance Coporation (LIC). The plan assets under the fund are deposited under approved securities by them.
The expected rate of return on assets is based on the expectation of the average long term rate of return on investment of the fund, during the estimated term of obligation.
The expected contribution in next year is ` 359.49 lakhs (31 March 2017 : ` 245.21 lakhs).
The obligations are measured at the present value of estimated future cash flows by using a discount rate that is determined with reference to the market yields at the Balance Sheet date on Government Bonds which is consistent with the estimated terms of the obligation.
The estimate of future salary increase, considered in the actuarial valuation, takes account of inflation, security, promotion and other relevant factors such as supply and demand in the employment market.
B. Other long term employee benefits
Leave benefits
Amount of ̀ 65.76 lakhs (31 March 2017: ̀ 10.61 lakhs) towards leave benefits is recognised as an expense and included in “Employee benefits expense” in the Statement of Profit and Loss.
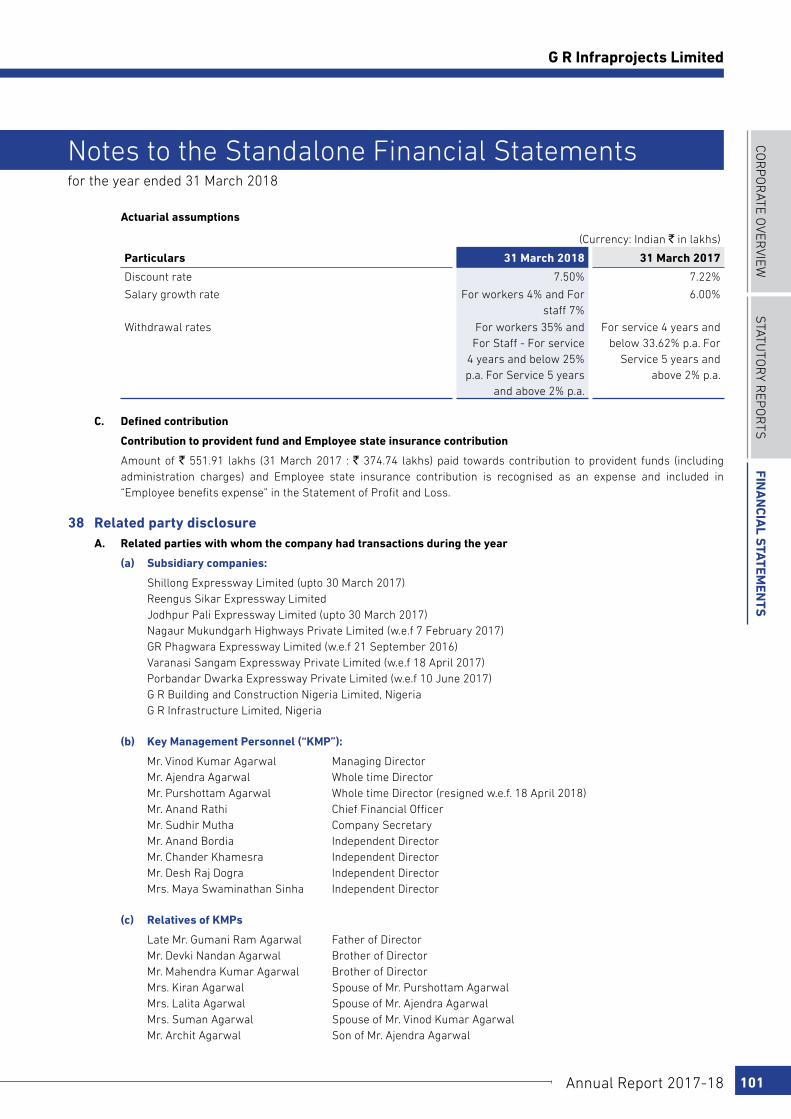
COR
PO
RATE O
VERVIEW
STATu
TOR
y REP
OR
TSFin
an
cial S
tatemen
tS
Annual Report 2017-18 101
G R Infraprojects Limited
for the year ended 31 March 2018
Notes to the Standalone Financial Statements
Actuarial assumptions
(Currency: Indian ` in lakhs)
Particulars 31 March 2018 31 March 2017
Discount rate 7.50% 7.22%
Salary growth rate For workers 4% and For staff 7%
6.00%
Withdrawal rates For workers 35% and For Staff - For service
4 years and below 25% p.a. For Service 5 years
and above 2% p.a.
For service 4 years and below 33.62% p.a. For
Service 5 years and above 2% p.a.
C. Defined contribution
Contribution to provident fund and Employee state insurance contribution
Amount of ` 551.91 lakhs (31 March 2017 : ` 374.74 lakhs) paid towards contribution to provident funds (including administration charges) and Employee state insurance contribution is recognised as an expense and included in “Employee benefits expense” in the Statement of Profit and Loss.
38 Related party disclosure A. Related parties with whom the company had transactions during the year
(a) Subsidiary companies:
Shillong Expressway Limited (upto 30 March 2017) Reengus Sikar Expressway Limited Jodhpur Pali Expressway Limited (upto 30 March 2017) Nagaur Mukundgarh Highways Private Limited (w.e.f 7 February 2017) GR Phagwara Expressway Limited (w.e.f 21 September 2016) Varanasi Sangam Expressway Private Limited (w.e.f 18 April 2017) Porbandar Dwarka Expressway Private Limited (w.e.f 10 June 2017) G R Building and Construction Nigeria Limited, Nigeria G R Infrastructure Limited, Nigeria
(b) Key Management Personnel (“KMP”):
Mr. Vinod Kumar Agarwal Managing Director Mr. Ajendra Agarwal Whole time Director Mr. Purshottam Agarwal Whole time Director (resigned w.e.f. 18 April 2018) Mr. Anand Rathi Chief Financial Officer Mr. Sudhir Mutha Company Secretary Mr. Anand Bordia Independent Director Mr. Chander Khamesra Independent Director Mr. Desh Raj Dogra Independent Director Mrs. Maya Swaminathan Sinha Independent Director
(c) Relatives of KMPs
Late Mr. Gumani Ram Agarwal Father of Director Mr. Devki Nandan Agarwal Brother of Director Mr. Mahendra Kumar Agarwal Brother of Director Mrs. Kiran Agarwal Spouse of Mr. Purshottam Agarwal Mrs. Lalita Agarwal Spouse of Mr. Ajendra Agarwal Mrs. Suman Agarwal Spouse of Mr. Vinod Kumar Agarwal Mr. Archit Agarwal Son of Mr. Ajendra Agarwal

102
for the year ended 31 March 2018
Notes to the Standalone Financial Statements
(d) Enterprises over which KMP and Relatives of such personnel exercise significant influence
Grace Buildhome Private Limited Rahul Infrastructure Private Limited Udaipur Buildestate Private Limited
(e) Enterprise having significant influence over company
GR Infratech Private Limited (up to 1 April 2017, the appointed date for merger of GR Infratech Private Limited with the Company. Refer note 49)
Lokesh Builders Private Limited
B. Transactions with key management personnel, relatives of KMP and their closing balances:
The terms and conditions of the transactions with key management personnel and their related parties were no more favourable than those available, or those which might reasonably be expected to be available, in respect of similar transactions with non-key management personnel related entities on an arm’s length basis.
The aggregate value of the Company’s transactions and outstanding balances relating to key management personnel and entities over which they have control or significant influence is as follows:
(Currency: Indian ` in lakhs)
Nature of transaction Transaction value
31 March 2018 31 March 2017
Rent
Key Management PersonnelMr. Vinod Kumar Agarwal - 0.84
Mr. Purshottam Agarwal 2.88 2.88
Mr. Ajendra Agarwal - 1.20
Relatives of Key Management PersonnelMrs. Kiran Agarwal 4.80 4.80
Mrs. Lalita Agarwal 5.76 5.76
Mrs. Suman Agarwal 3.60 3.60
Remuneration
Key Management PersonnelMr. Vinod Kumar Agarwal 860.00 540.20
Mr. Purshottam Agarwal 860.00 540.20
Mr. Ajendra Agarwal 860.00 540.20
Mr. Anand Rathi 36.00 24.42
Mr. Sudhir Mutha 13.28 10.54
Relatives of Key Management PersonnelLate Mr. Gumani Ram Agarwal 1.80 3.60
Mr. Devki Nandan Agarwal 96.00 29.60
Mr. Archit Agarwal 24.00 6.00
Mr. Mahendra Kumar Agarwal 96.00 34.40
Sitting fee
Key Management PersonnelMr. Anand Bordia 3.20 1.50
Mr. Desh Raj Dogra 3.50 1.00
Mrs. Maya Swaminathan Sinha 1.00 1.00
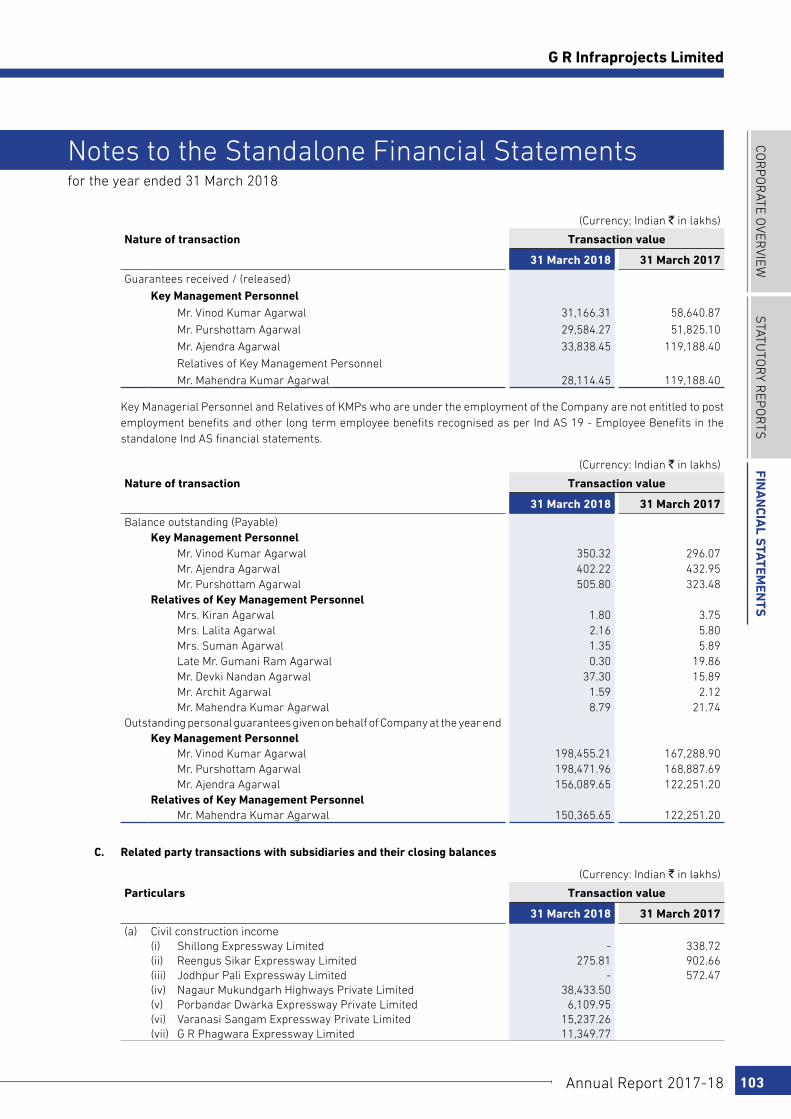
COR
PO
RATE O
VERVIEW
STATu
TOR
y REP
OR
TSFin
an
cial S
tatemen
tS
Annual Report 2017-18 103
G R Infraprojects Limited
for the year ended 31 March 2018
Notes to the Standalone Financial Statements
(Currency: Indian ` in lakhs)
Nature of transaction Transaction value
31 March 2018 31 March 2017
Guarantees received / (released)
Key Management PersonnelMr. Vinod Kumar Agarwal 31,166.31 58,640.87
Mr. Purshottam Agarwal 29,584.27 51,825.10
Mr. Ajendra Agarwal 33,838.45 119,188.40
Relatives of Key Management Personnel
Mr. Mahendra Kumar Agarwal 28,114.45 119,188.40
Key Managerial Personnel and Relatives of KMPs who are under the employment of the Company are not entitled to post employment benefits and other long term employee benefits recognised as per Ind AS 19 - Employee Benefits in the standalone Ind AS financial statements.
(Currency: Indian ` in lakhs)
Nature of transaction Transaction value
31 March 2018 31 March 2017
Balance outstanding (Payable)Key Management Personnel
Mr. Vinod Kumar Agarwal 350.32 296.07Mr. Ajendra Agarwal 402.22 432.95Mr. Purshottam Agarwal 505.80 323.48
Relatives of Key Management PersonnelMrs. Kiran Agarwal 1.80 3.75Mrs. Lalita Agarwal 2.16 5.80Mrs. Suman Agarwal 1.35 5.89Late Mr. Gumani Ram Agarwal 0.30 19.86Mr. Devki Nandan Agarwal 37.30 15.89Mr. Archit Agarwal 1.59 2.12Mr. Mahendra Kumar Agarwal 8.79 21.74
Outstanding personal guarantees given on behalf of Company at the year endKey Management Personnel
Mr. Vinod Kumar Agarwal 198,455.21 167,288.90Mr. Purshottam Agarwal 198,471.96 168,887.69Mr. Ajendra Agarwal 156,089.65 122,251.20
Relatives of Key Management PersonnelMr. Mahendra Kumar Agarwal 150,365.65 122,251.20
C. Related party transactions with subsidiaries and their closing balances
(Currency: Indian ` in lakhs)
Particulars Transaction value
31 March 2018 31 March 2017
(a) Civil construction income(i) Shillong Expressway Limited - 338.72(ii) Reengus Sikar Expressway Limited 275.81 902.66(iii) Jodhpur Pali Expressway Limited - 572.47(iv) Nagaur Mukundgarh Highways Private Limited 38,433.50(v) Porbandar Dwarka Expressway Private Limited 6,109.95(vi) Varanasi Sangam Expressway Private Limited 15,237.26(vii) G R Phagwara Expressway Limited 11,349.77

104
for the year ended 31 March 2018
Notes to the Standalone Financial Statements
(Currency: Indian ` in lakhs)
Particulars Transaction value
31 March 2018 31 March 2017
(b) Investment in equity shares during the year(i) Porbandar Dwarka Expressway Private Limited 4,200.00 -(ii) Nagaur Mukundgarh Highways Private Limited 1,362.00 1.00(iii) GR Phagwara Expressway Limited 2,025.00 5.00(iv) Varanasi Sangam Expressway Private Limited 3,889.00
(c) Redemption of preference shares(i) Shillong Expressway Limited - 2,350.00
(d) Loans / advances given(i) Reengus Sikar Expressway Limited 63.66 792.14(ii) Shillong Expressway Limited - 8.59(iii) Jodhpur Pali Expressway Limited - 808.19(iv) Porbandar Dwarka Expressway Private Limited 2,689.38(v) Nagaur Mukundgarh Highways Private Limited 4,980.41(vi) GR Phagwara Expressway Limited 5,432.72(vii) Varanasi Sangam Expressway Private Limited 7,807.01
(e) Investment in financial instrument representing subordinated debt(i) GR Phagwara Expressway Limited (419.40) 419.40
(f) Loans / advances received back(i) Reengus Sikar Expressway Limited 534.23 515.01(ii) Shillong Expressway Limited - 8.59(iii) Jodhpur Pali Expressway Limited - 1,522.60(iv) Porbandar Dwarka Expressway Private Limited 0.38 -(v) Nagaur Mukundgarh Highways Private Limited 238.05 -(vi) GR Phagwara Expressway Limited 1,750.54 -(vii) Varanasi Sangam Expressway Private Limited 253.93 -
(g) Interest income on loans / advances(i) Reengus Sikar Expressway Limited 144.55 150.09(ii) Jodhpur Pali Expressway Limited - 134.63(iii) Porbandar Dwarka Expressway Private Limited 32.28 -(iv) Nagaur Mukundgarh Highways Private Limited 192.65 -(v) GR Phagwara Expressway Limited 358.10 -(vi) Varanasi Sangam Expressway Private Limited 482.78 -
(h) Retention received back (net)(i) Reengus Sikar Expressway Limited - 50.03
(i) Customer advances received(i) Porbandar Dwarka Expressway Private Limited 6,325.51 -(ii) Nagaur Mukundgarh Highways Private Limited 3,634.40 -(iii) GR Phagwara Expressway Limited 5,102.04 -(iv) Varanasi Sangam Expressway Private Limited 10,368.00 -
(j) Customer advances repaid(ii) Nagaur Mukundgarh Highways Private Limited 1,817.20 -
(k) Interest expense on customer advances received(i) Porbandar Dwarka Expressway Private Limited 76.88 -(ii) Nagaur Mukundgarh Highways Private Limited 230.31 -(iii) GR Phagwara Expressway Limited 451.64 -(iv) Varanasi Sangam Expressway Private Limited 705.59 -
(l) Sale of property, plant and equipmentG R Building and Construction Nigeria Limited 59.65 -
(m) Guarantees (released) / given on behalf of subsidiary(i) Jodhpur Pali Expressway Limited (2,506.95) (45.57)(ii) Nagaur Mukundgarh Highways Private Limited 13,841.95 -
During the year, the Company has given guarantee on behalf of Porbandar Dwarka Expressway Private Limited amounting to ` 8,000.00 lakhs which has been released during the year.
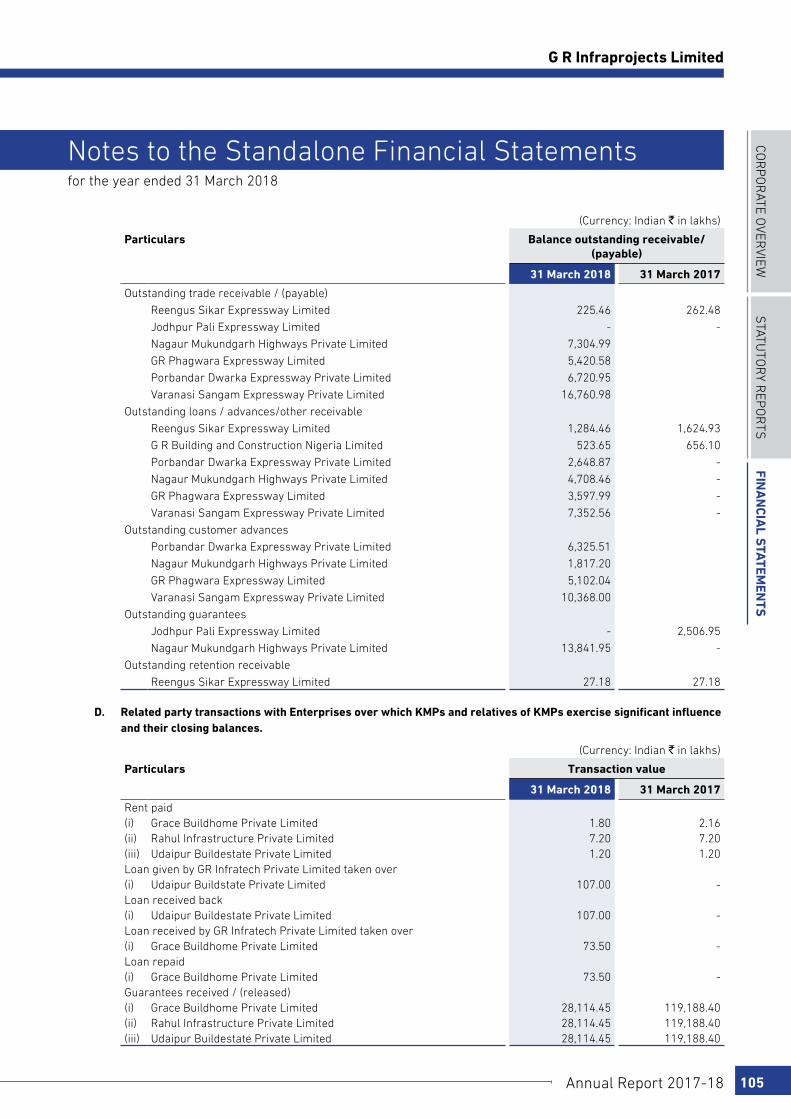
COR
PO
RATE O
VERVIEW
STATu
TOR
y REP
OR
TSFin
an
cial S
tatemen
tS
Annual Report 2017-18 105
G R Infraprojects Limited
for the year ended 31 March 2018
Notes to the Standalone Financial Statements
(Currency: Indian ` in lakhs)
Particulars Balance outstanding receivable/(payable)
31 March 2018 31 March 2017
Outstanding trade receivable / (payable)
Reengus Sikar Expressway Limited 225.46 262.48
Jodhpur Pali Expressway Limited - -
Nagaur Mukundgarh Highways Private Limited 7,304.99
GR Phagwara Expressway Limited 5,420.58
Porbandar Dwarka Expressway Private Limited 6,720.95
Varanasi Sangam Expressway Private Limited 16,760.98
Outstanding loans / advances/other receivable
Reengus Sikar Expressway Limited 1,284.46 1,624.93
G R Building and Construction Nigeria Limited 523.65 656.10
Porbandar Dwarka Expressway Private Limited 2,648.87 -
Nagaur Mukundgarh Highways Private Limited 4,708.46 -
GR Phagwara Expressway Limited 3,597.99 -
Varanasi Sangam Expressway Private Limited 7,352.56 -
Outstanding customer advances
Porbandar Dwarka Expressway Private Limited 6,325.51
Nagaur Mukundgarh Highways Private Limited 1,817.20
GR Phagwara Expressway Limited 5,102.04
Varanasi Sangam Expressway Private Limited 10,368.00
Outstanding guarantees
Jodhpur Pali Expressway Limited - 2,506.95
Nagaur Mukundgarh Highways Private Limited 13,841.95 -
Outstanding retention receivable
Reengus Sikar Expressway Limited 27.18 27.18
D. Related party transactions with Enterprises over which KMPs and relatives of KMPs exercise significant influence and their closing balances.
(Currency: Indian ` in lakhs)
Particulars Transaction value
31 March 2018 31 March 2017
Rent paid(i) Grace Buildhome Private Limited 1.80 2.16(ii) Rahul Infrastructure Private Limited 7.20 7.20(iii) Udaipur Buildestate Private Limited 1.20 1.20Loan given by GR Infratech Private Limited taken over(i) Udaipur Buildstate Private Limited 107.00 -Loan received back(i) Udaipur Buildestate Private Limited 107.00 -Loan received by GR Infratech Private Limited taken over(i) Grace Buildhome Private Limited 73.50 -Loan repaid(i) Grace Buildhome Private Limited 73.50 -Guarantees received / (released)(i) Grace Buildhome Private Limited 28,114.45 119,188.40(ii) Rahul Infrastructure Private Limited 28,114.45 119,188.40(iii) Udaipur Buildestate Private Limited 28,114.45 119,188.40
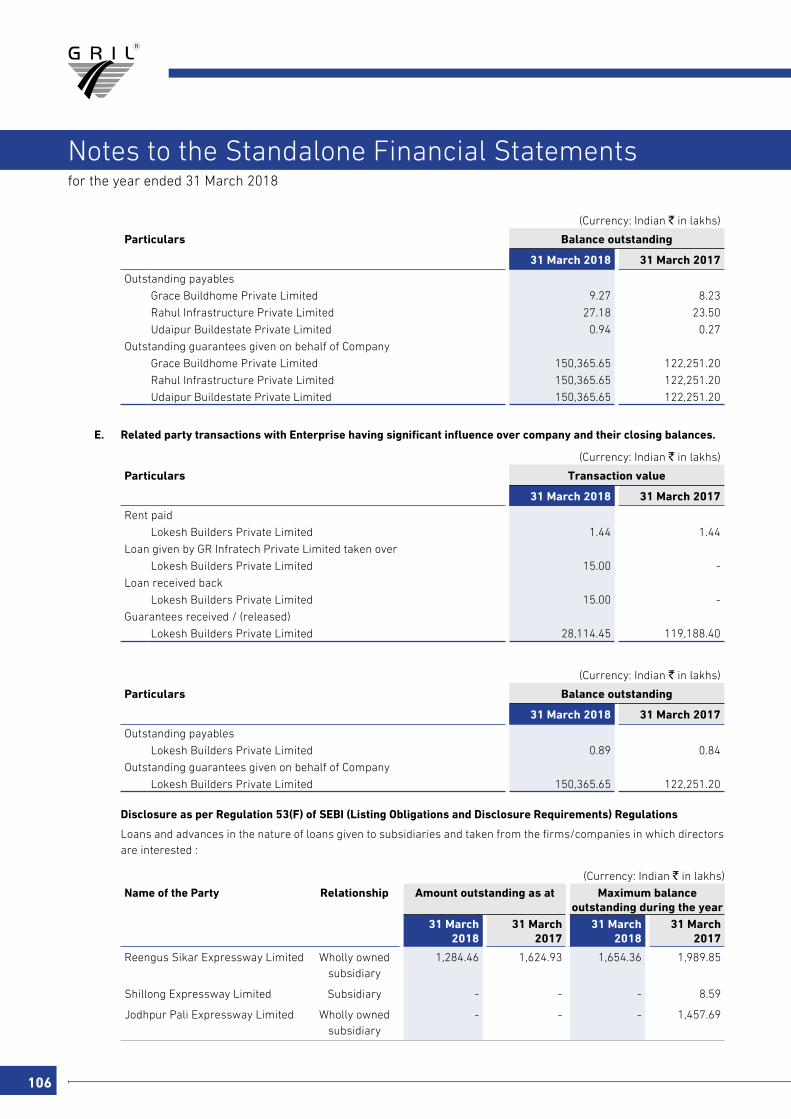
106
for the year ended 31 March 2018
Notes to the Standalone Financial Statements
(Currency: Indian ` in lakhs)
Particulars Balance outstanding
31 March 2018 31 March 2017
Outstanding payables
Grace Buildhome Private Limited 9.27 8.23
Rahul Infrastructure Private Limited 27.18 23.50
Udaipur Buildestate Private Limited 0.94 0.27
Outstanding guarantees given on behalf of Company
Grace Buildhome Private Limited 150,365.65 122,251.20
Rahul Infrastructure Private Limited 150,365.65 122,251.20
Udaipur Buildestate Private Limited 150,365.65 122,251.20
E. Related party transactions with Enterprise having significant influence over company and their closing balances.
(Currency: Indian ` in lakhs)
Particulars Transaction value
31 March 2018 31 March 2017
Rent paid
Lokesh Builders Private Limited 1.44 1.44
Loan given by GR Infratech Private Limited taken over
Lokesh Builders Private Limited 15.00 -
Loan received back
Lokesh Builders Private Limited 15.00 -
Guarantees received / (released)
Lokesh Builders Private Limited 28,114.45 119,188.40
(Currency: Indian ` in lakhs)
Particulars Balance outstanding
31 March 2018 31 March 2017
Outstanding payables
Lokesh Builders Private Limited 0.89 0.84
Outstanding guarantees given on behalf of Company
Lokesh Builders Private Limited 150,365.65 122,251.20
Disclosure as per Regulation 53(F) of SEBI (Listing Obligations and Disclosure Requirements) Regulations
Loans and advances in the nature of loans given to subsidiaries and taken from the firms/companies in which directors are interested :
(Currency: Indian ` in lakhs)
Name of the Party Relationship Amount outstanding as at Maximum balance outstanding during the year
31 March 2018
31 March 2017
31 March 2018
31 March 2017
Reengus Sikar Expressway Limited Wholly owned subsidiary
1,284.46 1,624.93 1,654.36 1,989.85
Shillong Expressway Limited Subsidiary - - - 8.59
Jodhpur Pali Expressway Limited Wholly owned subsidiary
- - - 1,457.69
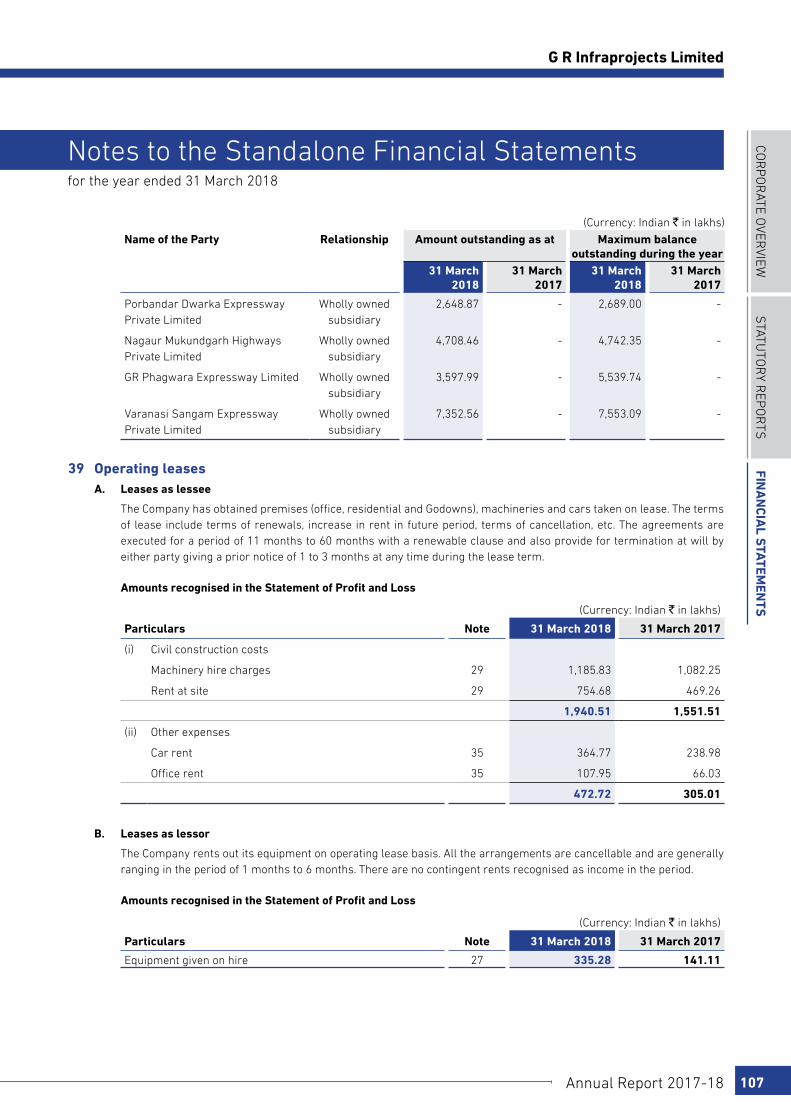
COR
PO
RATE O
VERVIEW
STATu
TOR
y REP
OR
TSFin
an
cial S
tatemen
tS
Annual Report 2017-18 107
G R Infraprojects Limited
for the year ended 31 March 2018
Notes to the Standalone Financial Statements
(Currency: Indian ` in lakhs)
Name of the Party Relationship Amount outstanding as at Maximum balance outstanding during the year
31 March 2018
31 March 2017
31 March 2018
31 March 2017
Porbandar Dwarka Expressway Private Limited
Wholly owned subsidiary
2,648.87 - 2,689.00 -
Nagaur Mukundgarh Highways Private Limited
Wholly owned subsidiary
4,708.46 - 4,742.35 -
GR Phagwara Expressway Limited Wholly owned subsidiary
3,597.99 - 5,539.74 -
Varanasi Sangam Expressway Private Limited
Wholly owned subsidiary
7,352.56 - 7,553.09 -
39 Operating leases A. Leases as lessee
The Company has obtained premises (office, residential and Godowns), machineries and cars taken on lease. The terms of lease include terms of renewals, increase in rent in future period, terms of cancellation, etc. The agreements are executed for a period of 11 months to 60 months with a renewable clause and also provide for termination at will by either party giving a prior notice of 1 to 3 months at any time during the lease term.
Amounts recognised in the Statement of Profit and Loss
(Currency: Indian ` in lakhs)
Particulars Note 31 March 2018 31 March 2017
(i) Civil construction costs
Machinery hire charges 29 1,185.83 1,082.25
Rent at site 29 754.68 469.26
1,940.51 1,551.51
(ii) Other expenses
Car rent 35 364.77 238.98
Office rent 35 107.95 66.03
472.72 305.01
B. Leases as lessor
The Company rents out its equipment on operating lease basis. All the arrangements are cancellable and are generally ranging in the period of 1 months to 6 months. There are no contingent rents recognised as income in the period.
Amounts recognised in the Statement of Profit and Loss
(Currency: Indian ` in lakhs)
Particulars Note 31 March 2018 31 March 2017
Equipment given on hire 27 335.28 141.11
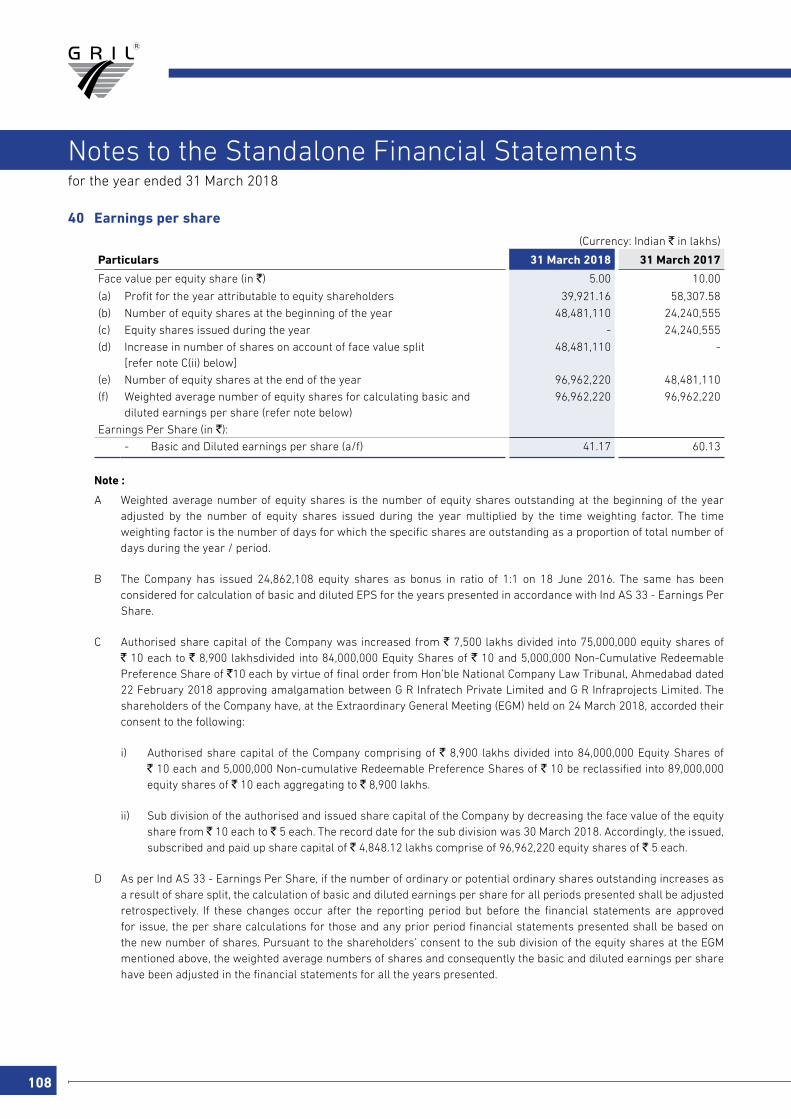
108
for the year ended 31 March 2018
Notes to the Standalone Financial Statements
40 Earnings per share
(Currency: Indian ` in lakhs)
Particulars 31 March 2018 31 March 2017
Face value per equity share (in `) 5.00 10.00
(a) Profit for the year attributable to equity shareholders 39,921.16 58,307.58
(b) Number of equity shares at the beginning of the year 48,481,110 24,240,555
(c) Equity shares issued during the year - 24,240,555
(d) Increase in number of shares on account of face value split [refer note C(ii) below]
48,481,110 -
(e) Number of equity shares at the end of the year 96,962,220 48,481,110
(f) Weighted average number of equity shares for calculating basic and diluted earnings per share (refer note below)
96,962,220 96,962,220
Earnings Per Share (in `):
- Basic and Diluted earnings per share (a/f) 41.17 60.13
Note :
A Weighted average number of equity shares is the number of equity shares outstanding at the beginning of the year adjusted by the number of equity shares issued during the year multiplied by the time weighting factor. The time weighting factor is the number of days for which the specific shares are outstanding as a proportion of total number of days during the year / period.
B The Company has issued 24,862,108 equity shares as bonus in ratio of 1:1 on 18 June 2016. The same has been considered for calculation of basic and diluted EPS for the years presented in accordance with Ind AS 33 - Earnings Per Share.
C Authorised share capital of the Company was increased from ` 7,500 lakhs divided into 75,000,000 equity shares of ` 10 each to ` 8,900 lakhsdivided into 84,000,000 Equity Shares of ` 10 and 5,000,000 Non-Cumulative Redeemable Preference Share of `10 each by virtue of final order from Hon’ble National Company Law Tribunal, Ahmedabad dated 22 February 2018 approving amalgamation between G R Infratech Private Limited and G R Infraprojects Limited. The shareholders of the Company have, at the Extraordinary General Meeting (EGM) held on 24 March 2018, accorded their consent to the following:
i) Authorised share capital of the Company comprising of ` 8,900 lakhs divided into 84,000,000 Equity Shares of ` 10 each and 5,000,000 Non-cumulative Redeemable Preference Shares of ` 10 be reclassified into 89,000,000 equity shares of ` 10 each aggregating to ` 8,900 lakhs.
ii) Sub division of the authorised and issued share capital of the Company by decreasing the face value of the equity share from ` 10 each to ` 5 each. The record date for the sub division was 30 March 2018. Accordingly, the issued, subscribed and paid up share capital of ` 4,848.12 lakhs comprise of 96,962,220 equity shares of ` 5 each.
D As per Ind AS 33 - Earnings Per Share, if the number of ordinary or potential ordinary shares outstanding increases as a result of share split, the calculation of basic and diluted earnings per share for all periods presented shall be adjusted retrospectively. If these changes occur after the reporting period but before the financial statements are approved for issue, the per share calculations for those and any prior period financial statements presented shall be based on the new number of shares. Pursuant to the shareholders’ consent to the sub division of the equity shares at the EGM mentioned above, the weighted average numbers of shares and consequently the basic and diluted earnings per share have been adjusted in the financial statements for all the years presented.
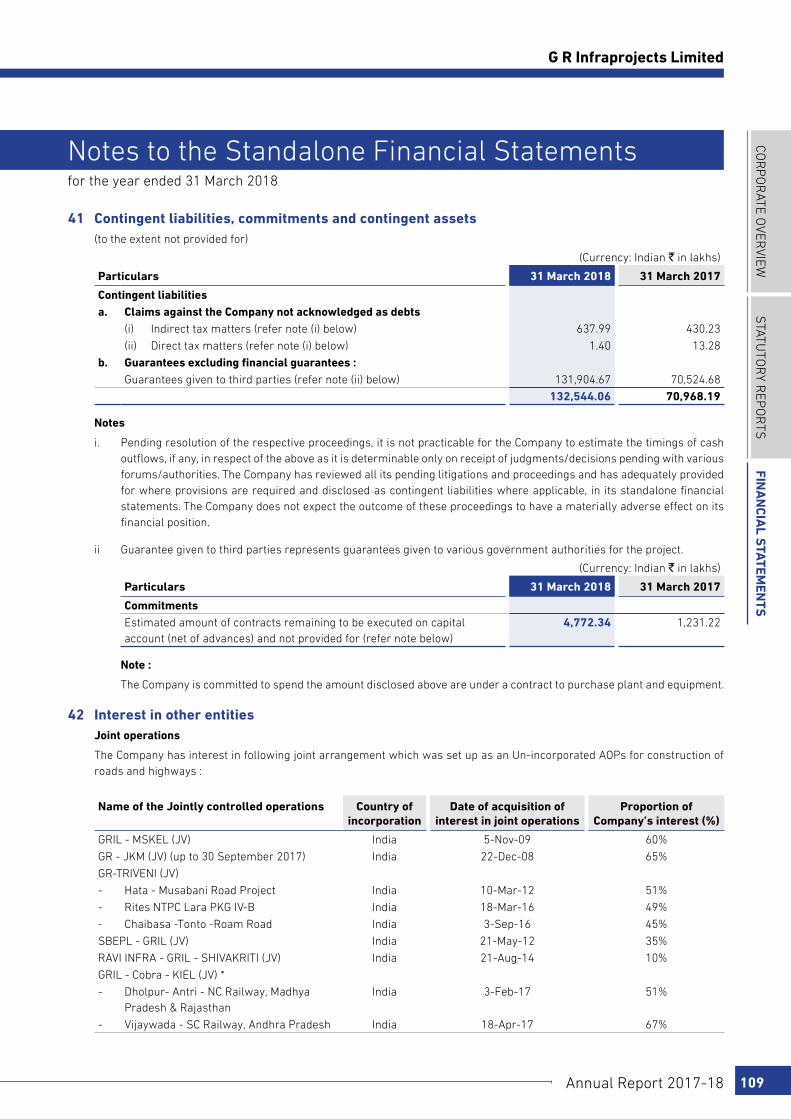
COR
PO
RATE O
VERVIEW
STATu
TOR
y REP
OR
TSFin
an
cial S
tatemen
tS
Annual Report 2017-18 109
G R Infraprojects Limited
for the year ended 31 March 2018
Notes to the Standalone Financial Statements
41 Contingent liabilities, commitments and contingent assets (to the extent not provided for)
(Currency: Indian ` in lakhs)
Particulars 31 March 2018 31 March 2017
Contingent liabilitiesa. Claims against the Company not acknowledged as debts
(i) Indirect tax matters (refer note (i) below) 637.99 430.23
(ii) Direct tax matters (refer note (i) below) 1.40 13.28
b. Guarantees excluding financial guarantees :Guarantees given to third parties (refer note (ii) below) 131,904.67 70,524.68
132,544.06 70,968.19
Notes
i. Pending resolution of the respective proceedings, it is not practicable for the Company to estimate the timings of cash outflows, if any, in respect of the above as it is determinable only on receipt of judgments/decisions pending with various forums/authorities. The Company has reviewed all its pending litigations and proceedings and has adequately provided for where provisions are required and disclosed as contingent liabilities where applicable, in its standalone financial statements. The Company does not expect the outcome of these proceedings to have a materially adverse effect on its financial position.
ii Guarantee given to third parties represents guarantees given to various government authorities for the project.
(Currency: Indian ` in lakhs)
Particulars 31 March 2018 31 March 2017
CommitmentsEstimated amount of contracts remaining to be executed on capital account (net of advances) and not provided for (refer note below)
4,772.34 1,231.22
Note :
The Company is committed to spend the amount disclosed above are under a contract to purchase plant and equipment.
42 Interest in other entities Joint operations
The Company has interest in following joint arrangement which was set up as an Un-incorporated AOPs for construction of roads and highways :
Name of the Jointly controlled operations Country of incorporation
Date of acquisition of interest in joint operations
Proportion of Company’s interest (%)
GRIL - MSKEL (JV) India 5-Nov-09 60%
GR - JKM (JV) (up to 30 September 2017) India 22-Dec-08 65%
GR-TRIVENI (JV)
- Hata - Musabani Road Project India 10-Mar-12 51%
- Rites NTPC Lara PKG IV-B India 18-Mar-16 49%
- Chaibasa -Tonto -Roam Road India 3-Sep-16 45%
SBEPL - GRIL (JV) India 21-May-12 35%
RAVI INFRA - GRIL - SHIVAKRITI (JV) India 21-Aug-14 10%
GRIL - Cobra - KIEL (JV) *
- Dholpur- Antri - NC Railway, Madhya Pradesh & Rajasthan
India 3-Feb-17 51%
- Vijaywada - SC Railway, Andhra Pradesh India 18-Apr-17 67%
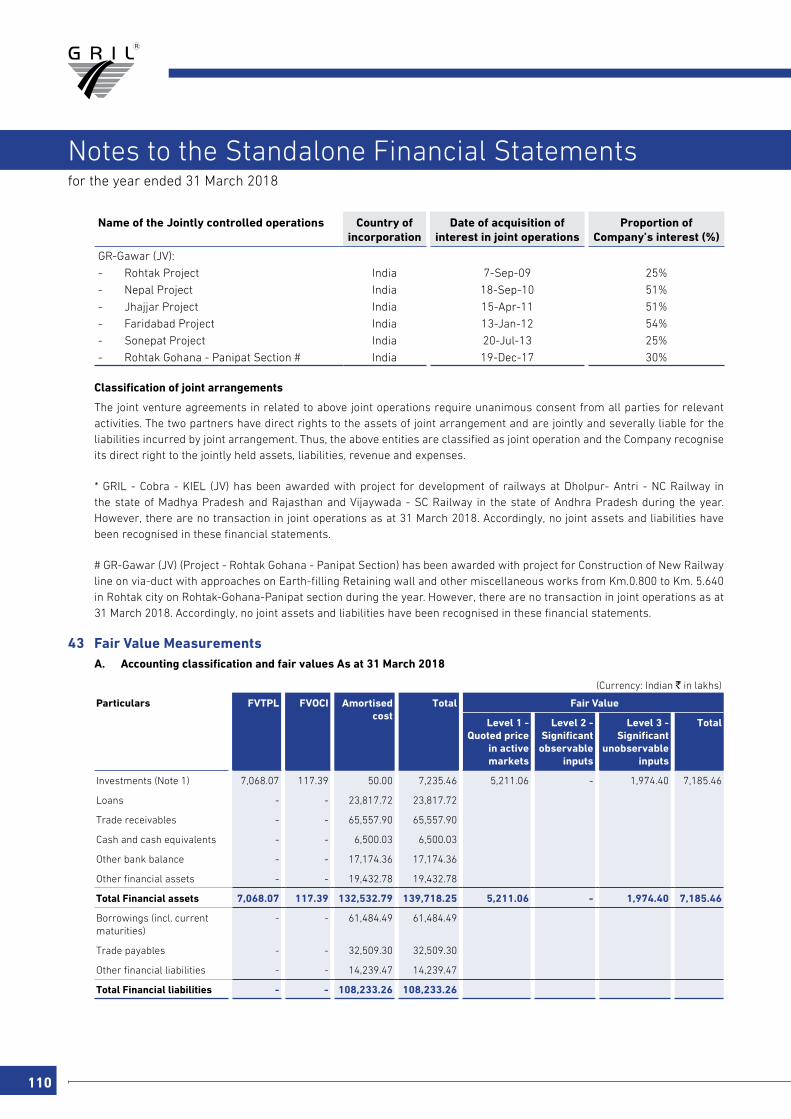
110
for the year ended 31 March 2018
Notes to the Standalone Financial Statements
Name of the Jointly controlled operations Country of incorporation
Date of acquisition of interest in joint operations
Proportion of Company’s interest (%)
GR-Gawar (JV):
- Rohtak Project India 7-Sep-09 25%
- Nepal Project India 18-Sep-10 51%
- Jhajjar Project India 15-Apr-11 51%
- Faridabad Project India 13-Jan-12 54%
- Sonepat Project India 20-Jul-13 25%
- Rohtak Gohana - Panipat Section # India 19-Dec-17 30%
Classification of joint arrangements
The joint venture agreements in related to above joint operations require unanimous consent from all parties for relevant activities. The two partners have direct rights to the assets of joint arrangement and are jointly and severally liable for the liabilities incurred by joint arrangement. Thus, the above entities are classified as joint operation and the Company recognise its direct right to the jointly held assets, liabilities, revenue and expenses.
* GRIL - Cobra - KIEL (JV) has been awarded with project for development of railways at Dholpur- Antri - NC Railway in the state of Madhya Pradesh and Rajasthan and Vijaywada - SC Railway in the state of Andhra Pradesh during the year. However, there are no transaction in joint operations as at 31 March 2018. Accordingly, no joint assets and liabilities have been recognised in these financial statements.
# GR-Gawar (JV) (Project - Rohtak Gohana - Panipat Section) has been awarded with project for Construction of New Railway line on via-duct with approaches on Earth-filling Retaining wall and other miscellaneous works from Km.0.800 to Km. 5.640 in Rohtak city on Rohtak-Gohana-Panipat section during the year. However, there are no transaction in joint operations as at 31 March 2018. Accordingly, no joint assets and liabilities have been recognised in these financial statements.
43 Fair Value Measurements A. Accounting classification and fair values As at 31 March 2018
(Currency: Indian ` in lakhs)
Particulars FVTPL FVOCI Amortised cost
Total Fair Value
Level 1 - Quoted price
in active markets
Level 2 - Significant
observable inputs
Level 3 - Significant
unobservable inputs
Total
Investments (Note 1) 7,068.07 117.39 50.00 7,235.46 5,211.06 - 1,974.40 7,185.46
Loans - - 23,817.72 23,817.72
Trade receivables - - 65,557.90 65,557.90
Cash and cash equivalents - - 6,500.03 6,500.03
Other bank balance - - 17,174.36 17,174.36
Other financial assets - - 19,432.78 19,432.78
Total Financial assets 7,068.07 117.39 132,532.79 139,718.25 5,211.06 - 1,974.40 7,185.46
Borrowings (incl. current maturities)
- - 61,484.49 61,484.49
Trade payables - - 32,509.30 32,509.30
Other financial liabilities - - 14,239.47 14,239.47
Total Financial liabilities - - 108,233.26 108,233.26
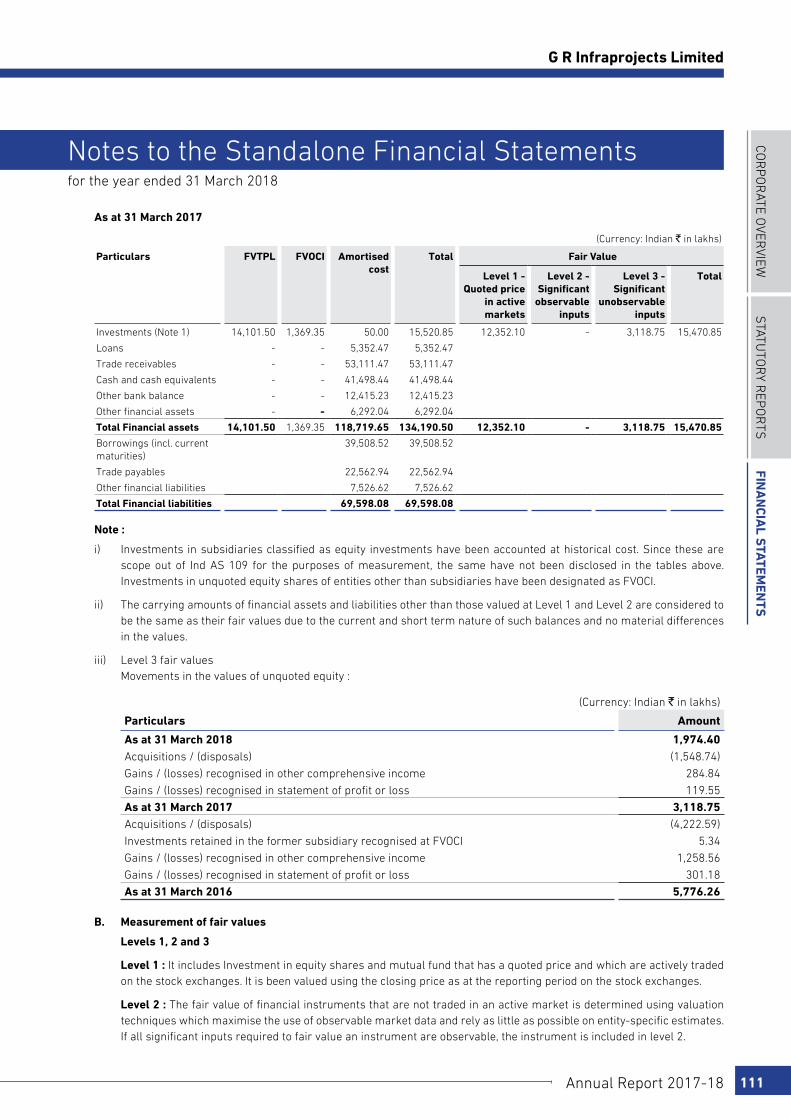
COR
PO
RATE O
VERVIEW
STATu
TOR
y REP
OR
TSFin
an
cial S
tatemen
tS
Annual Report 2017-18 111
G R Infraprojects Limited
for the year ended 31 March 2018
Notes to the Standalone Financial Statements
As at 31 March 2017
(Currency: Indian ` in lakhs)
Particulars FVTPL FVOCI Amortised cost
Total Fair Value
Level 1 - Quoted price
in active markets
Level 2 - Significant
observable inputs
Level 3 - Significant
unobservable inputs
Total
Investments (Note 1) 14,101.50 1,369.35 50.00 15,520.85 12,352.10 - 3,118.75 15,470.85
Loans - - 5,352.47 5,352.47
Trade receivables - - 53,111.47 53,111.47
Cash and cash equivalents - - 41,498.44 41,498.44
Other bank balance - - 12,415.23 12,415.23
Other financial assets - - 6,292.04 6,292.04
Total Financial assets 14,101.50 1,369.35 118,719.65 134,190.50 12,352.10 - 3,118.75 15,470.85
Borrowings (incl. current maturities)
39,508.52 39,508.52
Trade payables 22,562.94 22,562.94
Other financial liabilities 7,526.62 7,526.62
Total Financial liabilities 69,598.08 69,598.08
Note :
i) Investments in subsidiaries classified as equity investments have been accounted at historical cost. Since these are scope out of Ind AS 109 for the purposes of measurement, the same have not been disclosed in the tables above. Investments in unquoted equity shares of entities other than subsidiaries have been designated as FVOCI.
ii) The carrying amounts of financial assets and liabilities other than those valued at Level 1 and Level 2 are considered to be the same as their fair values due to the current and short term nature of such balances and no material differences in the values.
iii) Level 3 fair values Movements in the values of unquoted equity :
(Currency: Indian ` in lakhs)
Particulars Amount
As at 31 March 2018 1,974.40 Acquisitions / (disposals) (1,548.74)
Gains / (losses) recognised in other comprehensive income 284.84
Gains / (losses) recognised in statement of profit or loss 119.55
As at 31 March 2017 3,118.75 Acquisitions / (disposals) (4,222.59)
Investments retained in the former subsidiary recognised at FVOCI 5.34
Gains / (losses) recognised in other comprehensive income 1,258.56
Gains / (losses) recognised in statement of profit or loss 301.18
As at 31 March 2016 5,776.26
B. Measurement of fair values
Levels 1, 2 and 3
Level 1 : It includes Investment in equity shares and mutual fund that has a quoted price and which are actively traded on the stock exchanges. It is been valued using the closing price as at the reporting period on the stock exchanges.
Level 2 : The fair value of financial instruments that are not traded in an active market is determined using valuation techniques which maximise the use of observable market data and rely as little as possible on entity-specific estimates. If all significant inputs required to fair value an instrument are observable, the instrument is included in level 2.

112
for the year ended 31 March 2018
Notes to the Standalone Financial Statements
Level 3 : These instruments are valued based on significant unobservable inputs whereby future cash flows are discounted using appropriate discount rate.
When measuring the fair value of an asset or a liability, the Company uses observable market data as far as possible. If the inputs used to measure the fair value of an asset or a liability fall into different levels of the fair value hierarchy, then the fair value measurement is categorised in its entirety in the same level of the fair value hierarchy as the lowest level input that is significant to the entire measurement.
C. Fair value through Other comprehensive income - in unquoted equity shares:
As at 31 March 2016, investments in equity shares of Jodhpur Pali Expressway Limited and Shillong Expressway Limited were accounted at historical cost based on optional exemption provided under Ind AS 101 for investment in equity shares of subsidiary companies. (refer note 47)
On account of disposal of controlling stake in the above subsidiary companies on 30 March 2017, the investments in equity shares of these entities has been designated as FVOCI. The fair value as at 31 March 2017 was computed based on the per share price of the sale of controlling stake and per share price agreed with buyer as sales consideration. During the year, the company has sold off the balance shares which were classified as current investments designated at fair value through other comprehensive income. The cumulative gain on disposal amounts to ` 1,543.39 lakhs.
44 Financial instruments risk management objectives and policies The Company’s financial liabilities comprise mainly of borrowings, trade and other payables. The Company’s financial assets
comprise mainly of investments, cash and cash equivalents, other balances with banks, loans, trade receivables and other receivables.
Credit risk is the risk that a counterparty will not meet its obligations under a financial instrument or customer contract, leading to a financial loss. The Company is exposed to credit risk primarily trade receivables and other financial assets including deposits with banks. The Company’s exposure and credit ratings of its counterparties are continuously monitored and the aggregate value of transactions is reasonably spread amongst the counterparties.
(i) Credit risk
Credit risk is the risk that a counterparty will not meet its obligations under a financial instrument or customer contract, leading to a financial loss. The Company is exposed to credit risk primarily trade receivables and other financial assets including deposits with banks. The Company’s exposure and credit ratings of its counterparties are continuously monitored and the aggregate value of transactions is reasonably spread amongst the counterparties.
The carrying amount of following financial assets represents the maximum credit exposure:
Other financial assets
This comprises mainly of deposits with banks, investments in mutual funds and other intercompany receivables. Credit risk arising from these financial assets is limited and there is no collateral held against these because the counterparties are group companies, banks and recognised financial institutions. Banks, mutual funds and recognised financial institutions have high credit ratings assigned by credit rating agencies.
Trade and other receivables
The Company’s exposure to credit risk is influenced mainly by the individual characteristics of each customer. However, management also considers the factors that may influence the credit risk of its customer base.
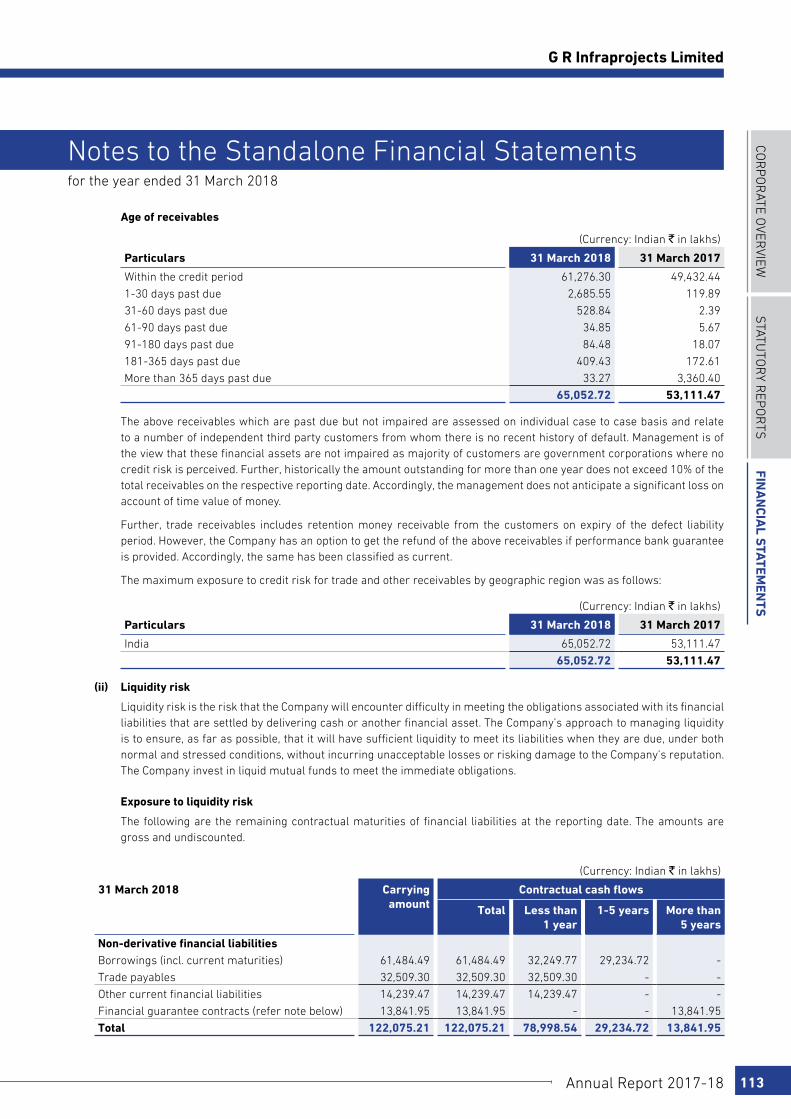
COR
PO
RATE O
VERVIEW
STATu
TOR
y REP
OR
TSFin
an
cial S
tatemen
tS
Annual Report 2017-18 113
G R Infraprojects Limited
for the year ended 31 March 2018
Notes to the Standalone Financial Statements
Age of receivables
(Currency: Indian ` in lakhs)
Particulars 31 March 2018 31 March 2017
Within the credit period 61,276.30 49,432.44
1-30 days past due 2,685.55 119.89
31-60 days past due 528.84 2.39
61-90 days past due 34.85 5.67
91-180 days past due 84.48 18.07
181-365 days past due 409.43 172.61
More than 365 days past due 33.27 3,360.40
65,052.72 53,111.47
The above receivables which are past due but not impaired are assessed on individual case to case basis and relate to a number of independent third party customers from whom there is no recent history of default. Management is of the view that these financial assets are not impaired as majority of customers are government corporations where no credit risk is perceived. Further, historically the amount outstanding for more than one year does not exceed 10% of the total receivables on the respective reporting date. Accordingly, the management does not anticipate a significant loss on account of time value of money.
Further, trade receivables includes retention money receivable from the customers on expiry of the defect liability period. However, the Company has an option to get the refund of the above receivables if performance bank guarantee is provided. Accordingly, the same has been classified as current.
The maximum exposure to credit risk for trade and other receivables by geographic region was as follows:
(Currency: Indian ` in lakhs)
Particulars 31 March 2018 31 March 2017
India 65,052.72 53,111.47
65,052.72 53,111.47
(ii) Liquidity risk
Liquidity risk is the risk that the Company will encounter difficulty in meeting the obligations associated with its financial liabilities that are settled by delivering cash or another financial asset. The Company’s approach to managing liquidity is to ensure, as far as possible, that it will have sufficient liquidity to meet its liabilities when they are due, under both normal and stressed conditions, without incurring unacceptable losses or risking damage to the Company’s reputation. The Company invest in liquid mutual funds to meet the immediate obligations.
Exposure to liquidity risk
The following are the remaining contractual maturities of financial liabilities at the reporting date. The amounts are gross and undiscounted.
(Currency: Indian ` in lakhs)
31 March 2018 Carrying amount
Contractual cash flows
Total Less than 1 year
1-5 years More than 5 years
Non-derivative financial liabilitiesBorrowings (incl. current maturities) 61,484.49 61,484.49 32,249.77 29,234.72 -
Trade payables 32,509.30 32,509.30 32,509.30 - -
Other current financial liabilities 14,239.47 14,239.47 14,239.47 - -
Financial guarantee contracts (refer note below) 13,841.95 13,841.95 - - 13,841.95
Total 122,075.21 122,075.21 78,998.54 29,234.72 13,841.95

114
for the year ended 31 March 2018
Notes to the Standalone Financial Statements
(Currency: Indian ` in lakhs)
31 March 2017 Carrying amount
Contractual cash flows
Total Less than 1 year
1-5 years More than 5 years
Non-derivative financial liabilitiesBorrowings (incl. current maturities) 39,508.52 39,508.52 13,809.85 25,698.67 -
Trade payables 22,562.94 22,562.94 22,562.94 - -
Other current financial liabilities 7,526.62 7,526.62 7,526.62 - -
Financial guarantee contracts (refer note below) 2,506.95 2,506.95 2,506.95 - -
Total 72,105.03 72,105.03 46,406.36 25,698.67 -
Note :
Guarantees issued by the Company on behalf of Subsidiaries are with respect to limits availed by the respective entity. These amounts will be payable on default by the concerned entity. As of the reporting date, none of the subsidiary has defaulted and hence, the Company does not have any present obligation to third parties in relation to such guarantees.
(iii) Market risk
Market risk is the risk that changes in market prices – such as foreign exchange rates, interest rates and equity prices – will affect the Company’s income or the value of its holdings of financial instruments. Market risk is attributable to all market risk sensitive financial instruments including foreign currency receivables and payables. The Company is exposed to market risk primarily related to foreign exchange rate risks. Thus, our exposure to market risk is a function of revenue generating and operating activities in foreign currency. The objective of market risk management is to avoid excessive exposure in foreign currency revenues and costs.
a) Currency risk
The functional currency of the Company is Indian Rupees (“`”). Transactions denominated in foreign currency comprises primarily of import of raw material and plant and machineries which are not material. Accordingly, the Company is not significantly exposed to foreign currency risk.
Unhedged foreign currency exposure
(Currency: Indian ` in lakhs)
Particulars Currency 31 March 2018 31 March 2017Amount in
foreign currencyAmount in ` Amount in
foreign currencyAmount in `
Financial assetsOther financial assets USD 8.04 523.65 10.12 656.10
Total (A) 8.04 523.65 10.12 656.10Financial liabilitiesPayables USD 8.51 554.60 0.05 3.55
EURO 34.75 2,789.45 11.25 779.04
Total (B) 43.26 3,344.05 11.30 782.59Net exposure to foreign currency (A-B)
(2,820.40) (126.48)
b) Price risk
i) Exposure
The Company’s exposure to price risk in the investment in mutual funds and equity shares arises from investments held by the Company and classified in the balance sheet as fair value through profit or loss including OCI. (refer note 8). Management monitors the prices closely to mitigate its impact on profit and cash flows.
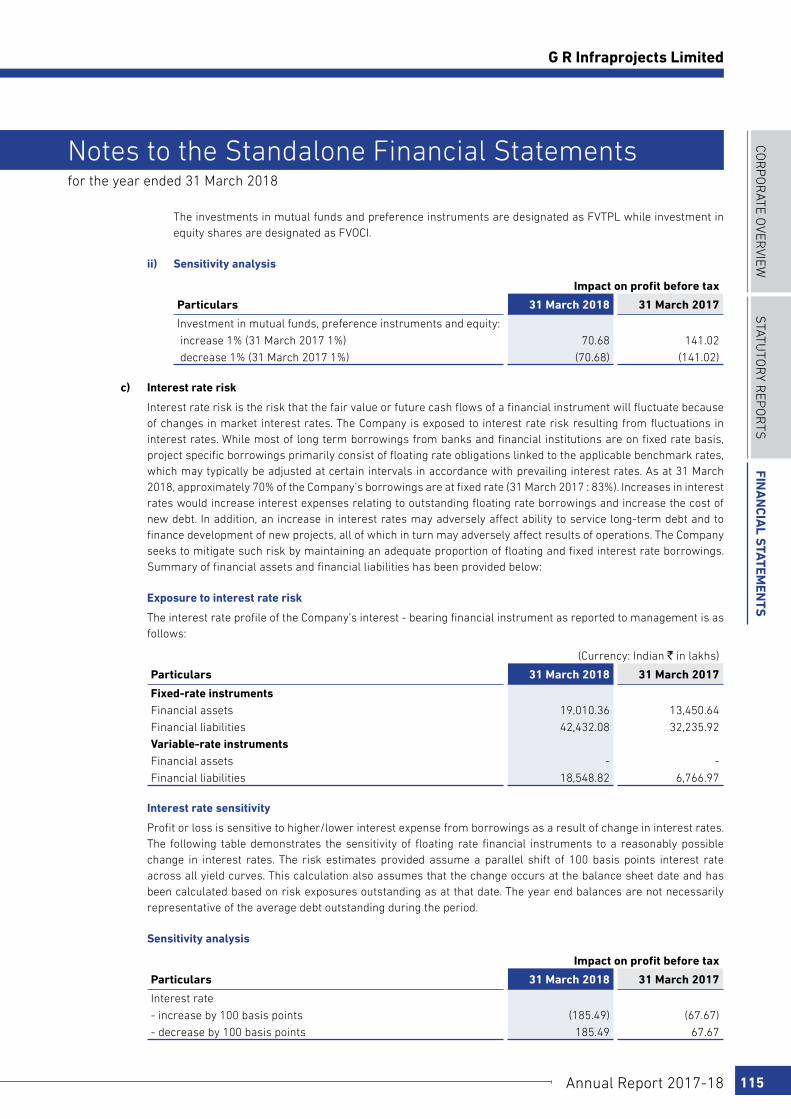
COR
PO
RATE O
VERVIEW
STATu
TOR
y REP
OR
TSFin
an
cial S
tatemen
tS
Annual Report 2017-18 115
G R Infraprojects Limited
for the year ended 31 March 2018
Notes to the Standalone Financial Statements
The investments in mutual funds and preference instruments are designated as FVTPL while investment in equity shares are designated as FVOCI.
ii) Sensitivity analysis
Impact on profit before tax
Particulars 31 March 2018 31 March 2017
Investment in mutual funds, preference instruments and equity:
increase 1% (31 March 2017 1%) 70.68 141.02
decrease 1% (31 March 2017 1%) (70.68) (141.02)
c) Interest rate risk
Interest rate risk is the risk that the fair value or future cash flows of a financial instrument will fluctuate because of changes in market interest rates. The Company is exposed to interest rate risk resulting from fluctuations in interest rates. While most of long term borrowings from banks and financial institutions are on fixed rate basis, project specific borrowings primarily consist of floating rate obligations linked to the applicable benchmark rates, which may typically be adjusted at certain intervals in accordance with prevailing interest rates. As at 31 March 2018, approximately 70% of the Company’s borrowings are at fixed rate (31 March 2017 : 83%). Increases in interest rates would increase interest expenses relating to outstanding floating rate borrowings and increase the cost of new debt. In addition, an increase in interest rates may adversely affect ability to service long-term debt and to finance development of new projects, all of which in turn may adversely affect results of operations. The Company seeks to mitigate such risk by maintaining an adequate proportion of floating and fixed interest rate borrowings. Summary of financial assets and financial liabilities has been provided below:
Exposure to interest rate risk
The interest rate profile of the Company’s interest - bearing financial instrument as reported to management is as follows:
(Currency: Indian ` in lakhs)
Particulars 31 March 2018 31 March 2017
Fixed-rate instrumentsFinancial assets 19,010.36 13,450.64
Financial liabilities 42,432.08 32,235.92
Variable-rate instrumentsFinancial assets - -
Financial liabilities 18,548.82 6,766.97
Interest rate sensitivity
Profit or loss is sensitive to higher/lower interest expense from borrowings as a result of change in interest rates. The following table demonstrates the sensitivity of floating rate financial instruments to a reasonably possible change in interest rates. The risk estimates provided assume a parallel shift of 100 basis points interest rate across all yield curves. This calculation also assumes that the change occurs at the balance sheet date and has been calculated based on risk exposures outstanding as at that date. The year end balances are not necessarily representative of the average debt outstanding during the period.
Sensitivity analysis
Impact on profit before tax
Particulars 31 March 2018 31 March 2017
Interest rate
- increase by 100 basis points (185.49) (67.67)
- decrease by 100 basis points 185.49 67.67

116
for the year ended 31 March 2018
Notes to the Standalone Financial Statements
45 Capital management For the purpose of the Company’s capital management, capital includes paid-up equity capital and all other equity reserves
attributable to the equity holders of the Company. The primary objective of the Company’s capital management is to ensure that it maintains a strong capital base so as to maintain investor, creditor and market confidence and to sustain future development of the business. Management monitors the return on capital, to equity share holders.
The Company manages its capital structure and makes adjustments to it in the light of changes in economic conditions and the requirements of the financial covenants. To maintain or adjust the capital structure, the Company may adjust the dividend payment to shareholders, return capital to shareholders or issue new shares. The Company monitors capital using Debt-Equity ratio, which is net debt divided by total equity. The Company’s policy is to keep the net debt to equity ratio below 3. The Company includes within net debt, interest bearing loans and borrowings, less cash and short-term deposits.
(Currency: Indian ` in lakhs)
Particulars 31 March 2018 31 March 2017
Total borrowings 61,484.49 39,508.52
Less: cash and cash equivalents 6,500.03 41,498.44
Adjusted net debt 54,984.46 (1,989.92)Equity share capital 4,848.12 4,848.12
Other equity 149,107.47 109,026.75
Total equity 153,955.59 113,874.87Adjusted net debt to equity ratio 0.36 (0.02)
No changes were made in the objectives, policies or processes for managing capital during the years ended 31 March 2018 and 31 March 2017.
46 Disclosures pursuant to Indian Accounting standard (Ind AS) 11 “Construction Contracts”
(Currency: Indian ` in lakhs)
Particulars 31 March 2018 31 March 2017
For ongoing and completed projects during the year
Contract revenue recognised for the year 297,029.00 307,704.87
For ongoing and completed projects during the year
Gross amount due from customers for contract work 63,886.04 53,033.36
Gross amount due to customers for contract work (Customer advances) 25,673.81 46,550.74
For ongoing projects at the year end
Aggregate amount of contract costs incurred and recognised profits (less recognised losses) up-to the Balance sheet date
340,506.02 381,638.36
Gross amount due from customers for contract work 60,020.92 51,383.41
Gross amount due to customers for contract work (Customer advances) 25,424.10 44,057.65
Retention amounts due from customers (included in Gross amount due from customers above)
8,910.73 21,434.67
47 Exceptional Items - Sale of investment in subsidiaries
(Currency: Indian ` in lakhs)
Particulars 31 March 2018 31 March 2017
Profit on sale of investment in subsidiaries - 13,568.35
On 30 March 2017, the Company has disposed off investment in two subsidiary companies i.e. Jodhpur Pali Expressway Limited (“JPEL”) and Shillong Expressway Limited (“SEL”), except 12% and 10% (approx.) equity shares respectively, which the management is in the process of disposing off. A consideration of ̀ 29,953.59 lakhs has been received from buyer i.e. India
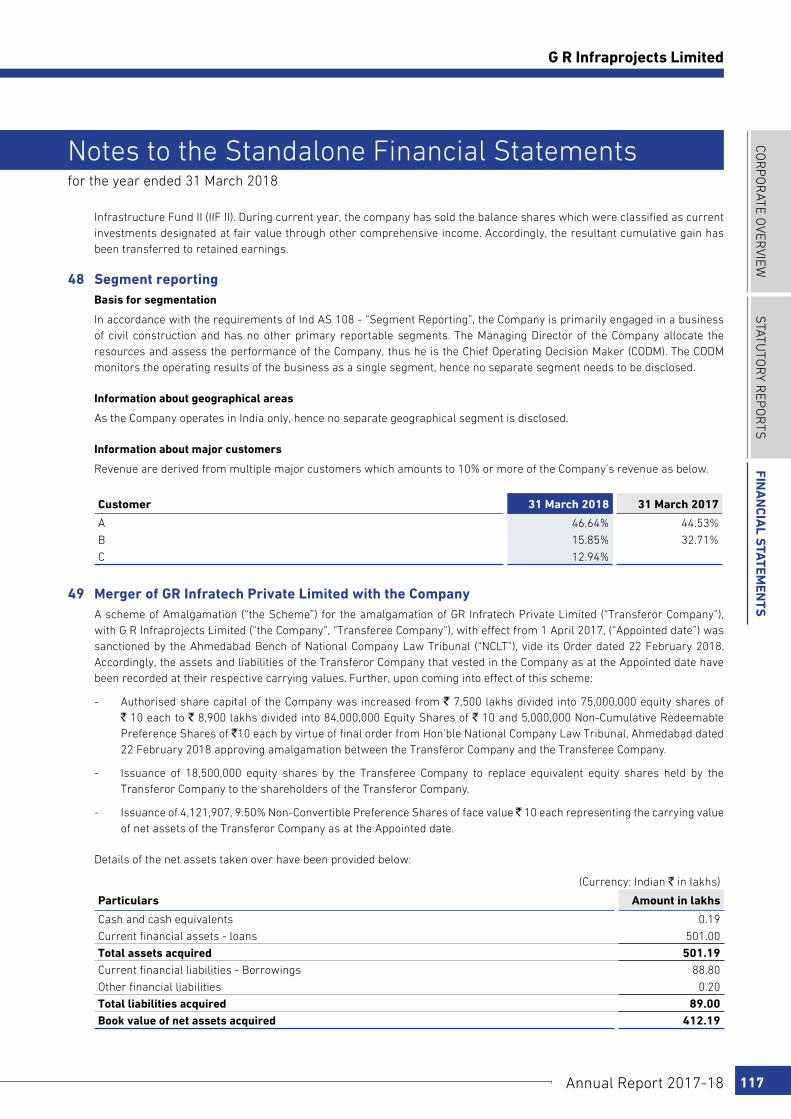
COR
PO
RATE O
VERVIEW
STATu
TOR
y REP
OR
TSFin
an
cial S
tatemen
tS
Annual Report 2017-18 117
G R Infraprojects Limited
for the year ended 31 March 2018
Notes to the Standalone Financial Statements
Infrastructure Fund II (IIF II). During current year, the company has sold the balance shares which were classified as current investments designated at fair value through other comprehensive income. Accordingly, the resultant cumulative gain has been transferred to retained earnings.
48 Segment reporting Basis for segmentation
In accordance with the requirements of Ind AS 108 - “Segment Reporting”, the Company is primarily engaged in a business of civil construction and has no other primary reportable segments. The Managing Director of the Company allocate the resources and assess the performance of the Company, thus he is the Chief Operating Decision Maker (CODM). The CODM monitors the operating results of the business as a single segment, hence no separate segment needs to be disclosed.
Information about geographical areas
As the Company operates in India only, hence no separate geographical segment is disclosed.
Information about major customers
Revenue are derived from multiple major customers which amounts to 10% or more of the Company’s revenue as below.
Customer 31 March 2018 31 March 2017
A 46.64% 44.53%
B 15.85% 32.71%
C 12.94%
49 Merger of GR Infratech Private Limited with the Company A scheme of Amalgamation (“the Scheme”) for the amalgamation of GR Infratech Private Limited (“Transferor Company”),
with G R Infraprojects Limited (“the Company”, “Transferee Company”), with effect from 1 April 2017, (“Appointed date”) was sanctioned by the Ahmedabad Bench of National Company Law Tribunal (“NCLT”), vide its Order dated 22 February 2018. Accordingly, the assets and liabilities of the Transferor Company that vested in the Company as at the Appointed date have been recorded at their respective carrying values. Further, upon coming into effect of this scheme:
- Authorised share capital of the Company was increased from ` 7,500 lakhs divided into 75,000,000 equity shares of ` 10 each to ` 8,900 lakhs divided into 84,000,000 Equity Shares of ` 10 and 5,000,000 Non-Cumulative Redeemable Preference Shares of `10 each by virtue of final order from Hon’ble National Company Law Tribunal, Ahmedabad dated 22 February 2018 approving amalgamation between the Transferor Company and the Transferee Company.
- Issuance of 18,500,000 equity shares by the Transferee Company to replace equivalent equity shares held by the Transferor Company to the shareholders of the Transferor Company.
- Issuance of 4,121,907, 9.50% Non-Convertible Preference Shares of face value ̀ 10 each representing the carrying value of net assets of the Transferor Company as at the Appointed date.
Details of the net assets taken over have been provided below:
(Currency: Indian ` in lakhs)
Particulars Amount in lakhs
Cash and cash equivalents 0.19
Current financial assets - loans 501.00
Total assets acquired 501.19 Current financial liabilities - Borrowings 88.80
Other financial liabilities 0.20
Total liabilities acquired 89.00 Book value of net assets acquired 412.19
118
for the year ended 31 March 2018
Notes to the Standalone Financial Statements
50 Civil proceedings against the Company The Company has on ongoing dispute with a former employee alleging that the former employee had fraudulently benefitted
one of the sub-contractors of the Company – M/s B R Construction (‘BRC’), in connivance with the proprietor of BRC. The Company has alleged that the former employee committed fraud and misappropriation of funds of ` 111.00 lakhs from the Company’s bank account in 2015-2016. The matter is subject to detailed internal investigation and is currently pending. BRC had filed a petition before the National Company Law Tribunal, Ahmedabad Bench (NCLT Bench) to initiate a corporate insolvency proceeding in respect of the Company claiming that an amount aggregating ` 522.70 lakhs has not been paid by the Company to BRC. The NCLT Bench had, vide its order dated January 24, 2018 (the Order), dismissed the Petition, in light of the pre-existing dispute between the BRC and the Company. Pursuant to the Order, BRC has filed appeal against the Order before the National Company Law Appellate Tribunal, New Delhi stating that, inter alia, the Order is quashed and set aside; and that corporate insolvency resolution proceedings be initiated against the Company. The matter is currently pending.
As per our report of even date attached
For B S R & Associates LLP For and on behalf of the Board of Directors ofChartered Accountants G R Infraprojects LimitedFirm’s Registration No: 116231W/W-100024 CIN U45201GJ1995PLC098652
Jeyur Shah Vinod Kumar Agarwal Ajendra AgarwalPartner Managing Director Director
Membership No: 045754 DIN: 00182893 DIN: 01147897
Anand Rathi Sudhir MuthaChief Financial Officer Company Secretary
Ahmedabad ICAI Memb. No. 078615 ICSI Memb. No. ACS18857
26 May 2018 Udaipur, 26 May 2018

COR
PO
RATE O
VERVIEW
STATu
TOR
y REP
OR
TSFin
an
cial S
tatemen
tS
Annual Report 2017-18 119
G R Infraprojects Limited
To the Members of G R Infraprojects Limited
Report on the Consolidated Ind AS Financial StatementsWe have audited the accompanying consolidated Ind AS financial statements of G R Infraprojects Limited (“the Holding Company”) and its subsidiaries (collectively referred to as “the Group”), and its joint operations which comprise the Consolidated Balance Sheet as at 31 March 2018, the Consolidated Statement of Profit and Loss (including other comprehensive income), the Consolidated Statement of Changes in Equity and the Consolidated Cash Flow Statement for the year then ended and a summary of the significant accounting policies and other explanatory information (hereinafter referred to as “the consolidated financial statements”).
Management’s Responsibility for the Consolidated Ind AS Financial StatementsThe Holding Company’s Board of Directors is responsible for the preparation of these consolidated financial statements in terms of the requirements of the Companies Act, 2013 (hereinafter referred to as “the Act”) that give a true and fair view of the consolidated state of affairs, consolidated profit and other comprehensive income, consolidated changes in equity and consolidated cash flows of the Group including its joint operations in accordance with the accounting principles generally accepted in India, including the Indian Accounting Standards (Ind AS) prescribed under Section 133 of the Act read. The respective Board of Directors of the companies included in the Group and its joint operations are responsible for maintenance of adequate accounting records in accordance with the provisions of the Act for safeguarding the assets of the Group and its joint operations and for preventing and detecting frauds and other irregularities; selection and application of appropriate accounting policies; making judgments and estimates that are reasonable and prudent; and the design, implementation and maintenance of adequate internal financial controls, that were operating effectively for ensuring the accuracy and completeness of the accounting records, relevant to the preparation and presentation of the consolidated financial statements that give a true and fair view and are free from material misstatement, whether due to fraud or error, which have been used for the purpose of preparation of the consolidated financial statements by the Directors of the Holding Company, as aforesaid.
In preparing the consolidated financial statements, the respective Board of Directors of the companies included in the Group and of its joint operations are responsible for assessing the ability of the Group and of its joint operations to continue as a going concern, disclosing, as applicable, matters related to going concern and using the going concern basis of accounting
Independent Auditors’ Report
unless management either intends to liquidate the Group or to cease operations, or has no realistic alternative but to do so.
Auditors’ ResponsibilityOur responsibility is to express an opinion on these consolidated financial statements based on our audit. While conducting the audit, we have taken into account the provisions of the Act, the accounting and auditing standards and matters which are required to be included in the audit report under the provisions of the Act and the Rules made thereunder.
We conducted our audit in accordance with the Standards on Auditing specified under section 143(10) of the Act. Those standards require that we comply with ethical requirements and plan and perform the audit to obtain reasonable assurance about whether the consolidated financial statements are free from material misstatement.
An audit involves performing procedures to obtain audit evidence about the amounts and the disclosures in the consolidated financial statements. The procedures selected depend on the auditor’s judgment, including the assessment of the risks of material misstatement of the consolidated financial statements, whether due to fraud or error. In making those risk assessments, the auditor considers internal financial control relevant to the Holding Company’s preparation of the consolidated financial statements that give a true and fair view in order to design audit procedures that are appropriate in the circumstances. An audit also includes evaluating the appropriateness of the accounting policies used and the reasonableness of the accounting estimates made by the Holding Company’s Board of Directors, as well as evaluating the overall presentation of the consolidated financial statements.
We are also responsible to conclude on the appropriateness of management’s use of the going concern basis of accounting and, based on the audit evidence obtained, whether a material uncertainty exists related to events or conditions that may cast significant doubt on the ability of Group and of its joint operations to continue as a going concern. If we conclude that a material uncertainty exists, we are required to draw attention in the auditor’s report to the related disclosures in the consolidated financial statements or, if such disclosures are inadequate, to modify our opinion. Our conclusions are based on the audit evidence obtained up to the date of our auditor’s report. However, future events or conditions may cause Group and its joint operations to cease to continue as a going concern.
We believe that the audit evidence obtained by us and the audit evidence obtained by the other auditors in terms of their reports referred to in sub-paragraph (a) of the Other Matters paragraph below, is sufficient and appropriate to provide a basis for our audit opinion on the consolidated financial statements.
120
OpinionIn our opinion and to the best of our information and according to the explanations given to us and based on the consideration of reports of the other auditors on separate financial statements/financial information of the subsidiaries referred to below in the Other Matters paragraph, the aforesaid consolidated financial statements give the information required by the Act in the manner so required and give a true and fair view in conformity with the accounting principles generally accepted in India including the Ind AS, of the consolidated state of affairs of the Group and its joint operations as at 31 March 2018 and their consolidated profit and other comprehensive income, consolidated changes in equity and consolidated cash flows for the year then ended.
Other matter(a) We have not audited the financial statements of seven
subsidiaries, included in the consolidated financial statements, whose financial statements reflect total assets of ` 115,119.38 lakhs as at 31 March 2018, total revenues of ` 81,063.94 lakhs and net cash outflows amounting to ` 735.26 lakhs for the year ended on that date, as considered in the consolidated financial statements. These financial statements have been audited by other auditors whose reports have been furnished to us by the Management.
Our opinion on the consolidated financial statements, in so far as it relates to the amounts and disclosures included in respect of these subsidiaries, and our report in terms of sub-section (3) of Section 143 of the Act, in so far as it relates to the aforesaid subsidiaries is based solely on the reports of the other auditors.
Of the seven subsidiaries listed above, the financial statements of subsidiaries which are located outside India have been prepared under the generally accepted accounting principles (‘GAAPs’) applicable in their respective countries. The Holding Company’s management has converted these financial statements from accounting principles generally accepted in their respective countries to Ind AS prescribed under Section 133 of the Companies Act, 2013. These conversion adjustments made by the Holding Company’s management have been audited by other auditors whose reports have been furnished to us by the Management.
(b) We have not audited the financial statements of five unincorporated joint operations, whose financial statements reflect total assets of ` 761.36 lakhs as at 31 March 2018, total revenues of ` 1,476.04 lakhs, net profit of ` 103.96 lakhs and net cash inflows amounting
to ` 70.43 lakhs for the year then ended, as considered in the consolidated financial statements. These financial statements have been audited by other auditors whose reports have been furnished to us by the Management.
Our opinion on the consolidated financial statements, in so far as it relates to the amounts and disclosures included in respect of these joint operations is based solely on the reports of the other auditors.
Our opinion on the consolidated financial statements above, and our report on Other Legal and Regulatory Requirements below, is not modified in respect of the above matters with respect to our reliance on the work done and the reports of the other auditors.
Report on Other Legal and Regulatory RequirementsAs required by Section 143(3) of the Act, based on our audit and on the consideration of the report of other auditors on separate financial statements of subsidiary companies incorporated in India and unincorporated joint operations, referred in the Other Matter paragraph, we report, to the extent applicable, that:
(a) we have sought and obtained all the information and explanations which to the best of our knowledge and belief were necessary for the purposes of our audit of the aforesaid consolidated financial statements.
(b) in our opinion, proper books of account as required by law relating to preparation of the aforesaid consolidated financial statements have been kept so far as it appears from our examination of those books and the report of the other auditors.
(c) the Consolidated Balance Sheet, the Consolidated Statement of Profit and Loss (including other comprehensive income), the Consolidated Statement of Changes in Equity and the Consolidated Cash Flow Statement dealt with by this Report are in agreement with the relevant books of account maintained for the purpose of preparation of the consolidated financial statements.
(d) in our opinion, the aforesaid consolidated financial statements comply with the Ind AS prescribed under Section 133 of the Act, read with relevant rules issued thereunder.
(e) on the basis of the written representations received from the directors of the Holding Company as on 31 March 2018 taken on record by the Board of Directors of the Holding Company and the reports of the statutory auditors of its subsidiary companies incorporated in India, none of the
COR
PO
RATE O
VERVIEW
STATu
TOR
y REP
OR
TSFin
an
cial S
tatemen
tS
Annual Report 2017-18 121
G R Infraprojects Limited
Directors of the Group companies incorporated in India is disqualified as on 31 March 2018 from being appointed as a Director of that company in terms of Section 164(2) of the Act.
(f) with respect to the adequacy of the internal financial controls over financial reporting of the Holding Company and its subsidiary companies incorporated in India and the operating effectiveness of such controls, refer to our separate report in “Annexure A”; and
(g) with respect to the other matters to be included in the Auditor’s Report in accordance with Rule 11 of the Companies (Audit and Auditors) Rules, 2014, in our opinion and to the best of our information and according to the explanations given to us:
i. the consolidated financial statements disclose the impact of pending litigations on the consolidated financial position of the Group - Refer Note 42 to the consolidated financial statements;
ii. the Group did not have any long-term contracts including derivative contracts for which there were any material foreseeable losses;
iii. there were no amounts which were required to be transferred to the Investor Education and Protection Fund by the Company during the year; and
iv. The disclosures in the consolidated financial statements regarding holdings as well as dealings in specified bank notes during the period from 8 November 2016 to 30 December 2016 have not been made since the requirement does not pertain to the financial year ended 31 March 2018.
For B S R & Associates LLP Chartered Accountants Firm’s registration number: 116231W/W-100024
Jeyur ShahAhmedabad Partner9 July 2018 Membership number: 045754
122
Report on the Internal Financial Controls under Clause (i) of Sub-section 3 of Section 143 of the Companies Act, 2013 (“the Act”)In conjunction with our audit of the consolidated financial statements of the Company as of and for the year ended 31 March 2018, we have audited the internal financial controls over financial reporting of G R Infraprojects Limited (“the Holding Company”) and its subsidiary companies which are companies incorporated in India, as of that date.
Management’s Responsibility for Internal Financial ControlsThe Respective Board of Directors of the Holding Company and its subsidiary companies, which are companies incorporated in India, are responsible for establishing and maintaining internal financial controls based on the internal control over financial reporting criteria established by the Holding Company and its subsidiary companies incorporated in India considering the essential components of internal control stated in the Guidance Note on Audit of Internal Financial Controls over Financial Reporting issued by the Institute of Chartered Accountants of India (“ICAI’). These responsibilities include the design, implementation and maintenance of adequate internal financial controls that were operating effectively for ensuring the orderly and efficient conduct of its business, including adherence to respective Company’s policies, the safeguarding of its assets, the prevention and detection of frauds and errors, the accuracy and completeness of the accounting records, and the timely preparation of reliable financial information, as required under the Companies Act, 2013 (“the Act”).
Auditors’ ResponsibilityOur responsibility is to express an opinion on the Company’s internal financial controls over financial reporting based on our audit. We conducted our audit in accordance with the Guidance Note on Audit of Internal Financial Controls over Financial Reporting (the “Guidance Note”) issued by ICAI and the Standards on Auditing, issued by ICAI and deemed to be prescribed under section 143(10) of the Act, to the extent applicable to an audit of internal financial controls, both issued by the Institute of Chartered Accountants of India. Those Standards and the Guidance Note require that we comply with ethical requirements and plan and perform the audit to obtain reasonable assurance about whether adequate internal financial controls over financial reporting was established and maintained and if such controls operated effectively in all material respects.
Our audit involves performing procedures to obtain audit evidence about the adequacy of the internal financial
Annexure A to the Independent Auditors’ Report (referred to in paragraph (f) under ‘Report on Other Legal and Regulatory Requirements’ section of our report of even date)
controls system over financial reporting and their operating effectiveness. Our audit of internal financial controls over financial reporting included obtaining an understanding of internal financial controls over financial reporting, assessing the risk that a material weakness exists, and testing and evaluating the design and operating effectiveness of internal control based on the assessed risk. The procedures selected depend on the auditor’s judgment, including the assessment of the risks of material misstatement of the Ind AS financial statements, whether due to fraud or error.
We believe that the audit evidence we have obtained is sufficient and appropriate to provide a basis for our audit opinion on the Holding Company’s and its subsidiary companies incorporated in India, internal financial controls system over financial reporting.
Meaning of Internal Financial Controls over Financial ReportingA company’s internal financial control over financial reporting is a process designed to provide reasonable assurance regarding the reliability of financial reporting and the preparation of financial statements for external purposes in accordance with generally accepted accounting principles. A company’s internal financial control over financial reporting includes those policies and procedures that (1) pertain to the maintenance of records that, in reasonable detail, accurately and fairly reflect the transactions and dispositions of the assets of the company; (2) provide reasonable assurance that transactions are recorded as necessary to permit preparation of financial statements in accordance with generally accepted accounting principles, and that receipts and expenditures of the company are being made only in accordance with authorisations of management and directors of the company; and (3) provide reasonable assurance regarding prevention or timely detection of unauthorised acquisition, use, or disposition of the company’s assets that could have a material effect on the financial statements.
Inherent Limitations of Internal Financial Controls Over Financial ReportingBecause of the inherent limitations of internal financial controls over financial reporting, including the possibility of collusion or improper management override of controls, material misstatements due to error or fraud may occur and not be detected. Also, projections of any evaluation of the internal financial controls over financial reporting to future periods are subject to the risk that the internal financial control over financial reporting may become inadequate because of changes in conditions, or that the degree of compliance with the policies or procedures may deteriorate.
COR
PO
RATE O
VERVIEW
STATu
TOR
y REP
OR
TSFin
an
cial S
tatemen
tS
Annual Report 2017-18 123
G R Infraprojects Limited
OpinionIn our opinion, the Holding Company and its subsidiary companies, which are companies incorporated in India, have, in all material respects, an adequate internal financial controls system over financial reporting and such internal financial controls over financial reporting were operating effectively as at 31 March 2018, based on the internal control over financial reporting criteria established by the Company considering the essential components of internal control stated in the Guidance Note issued by the ICAI.
Other mattersOur aforesaid report under Section 143(3)(i) of the Act on the adequacy and operating effectiveness of the internal financial controls over financial reporting in so far as it relates to five
subsidiary companies, which are companies incorporated in India, is based on the corresponding reports of the auditors of such companies incorporated in India.
For B S R & Associates LLP Chartered Accountants Firm’s registration number: 116231W/W-100024
Jeyur ShahAhmedabad Partner9 July 2018 Membership number: 045754
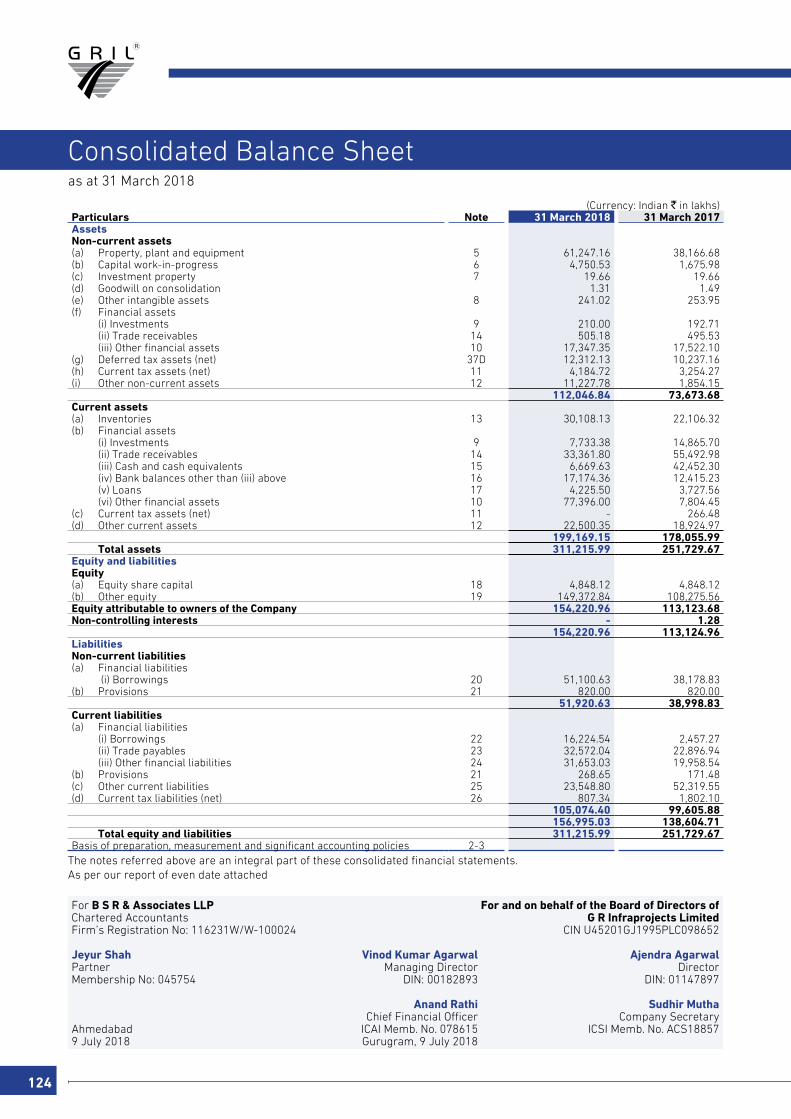
124
(Currency: Indian ` in lakhs)Particulars Note 31 March 2018 31 March 2017 AssetsNon-current assets(a) Property, plant and equipment 5 61,247.16 38,166.68(b) Capital work-in-progress 6 4,750.53 1,675.98(c) Investment property 7 19.66 19.66(d) Goodwill on consolidation 1.31 1.49(e) Other intangible assets 8 241.02 253.95(f) Financial assets
(i) Investments 9 210.00 192.71(ii) Trade receivables 14 505.18 495.53(iii) Other financial assets 10 17,347.35 17,522.10
(g) Deferred tax assets (net) 37D 12,312.13 10,237.16(h) Current tax assets (net) 11 4,184.72 3,254.27(i) Other non-current assets 12 11,227.78 1,854.15
112,046.84 73,673.68Current assets(a) Inventories 13 30,108.13 22,106.32(b) Financial assets
(i) Investments 9 7,733.38 14,865.70(ii) Trade receivables 14 33,361.80 55,492.98(iii) Cash and cash equivalents 15 6,669.63 42,452.30(iv) Bank balances other than (iii) above 16 17,174.36 12,415.23(v) Loans 17 4,225.50 3,727.56(vi) Other financial assets 10 77,396.00 7,804.45
(c) Current tax assets (net) 11 - 266.48(d) Other current assets 12 22,500.35 18,924.97
199,169.15 178,055.99Total assets 311,215.99 251,729.67
Equity and liabilitiesEquity(a) Equity share capital 18 4,848.12 4,848.12(b) Other equity 19 149,372.84 108,275.56Equity attributable to owners of the Company 154,220.96 113,123.68Non-controlling interests - 1.28
154,220.96 113,124.96LiabilitiesNon-current liabilities(a) Financial liabilities
(i) Borrowings 20 51,100.63 38,178.83(b) Provisions 21 820.00 820.00
51,920.63 38,998.83Current liabilities(a) Financial liabilities
(i) Borrowings 22 16,224.54 2,457.27(ii) Trade payables 23 32,572.04 22,896.94(iii) Other financial liabilities 24 31,653.03 19,958.54
(b) Provisions 21 268.65 171.48(c) Other current liabilities 25 23,548.80 52,319.55(d) Current tax liabilities (net) 26 807.34 1,802.10
105,074.40 99,605.88156,995.03 138,604.71
Total equity and liabilities 311,215.99 251,729.67Basis of preparation, measurement and significant accounting policies 2-3
The notes referred above are an integral part of these consolidated financial statements.As per our report of even date attached
as at 31 March 2018
For B S R & Associates LLP For and on behalf of the Board of Directors ofChartered Accountants G R Infraprojects LimitedFirm’s Registration No: 116231W/W-100024 CIN U45201GJ1995PLC098652
Jeyur Shah Vinod Kumar Agarwal Ajendra AgarwalPartner Managing Director DirectorMembership No: 045754 DIN: 00182893 DIN: 01147897
Anand Rathi Sudhir MuthaChief Financial Officer Company Secretary
Ahmedabad ICAI Memb. No. 078615 ICSI Memb. No. ACS188579 July 2018 Gurugram, 9 July 2018
Consolidated Balance Sheet
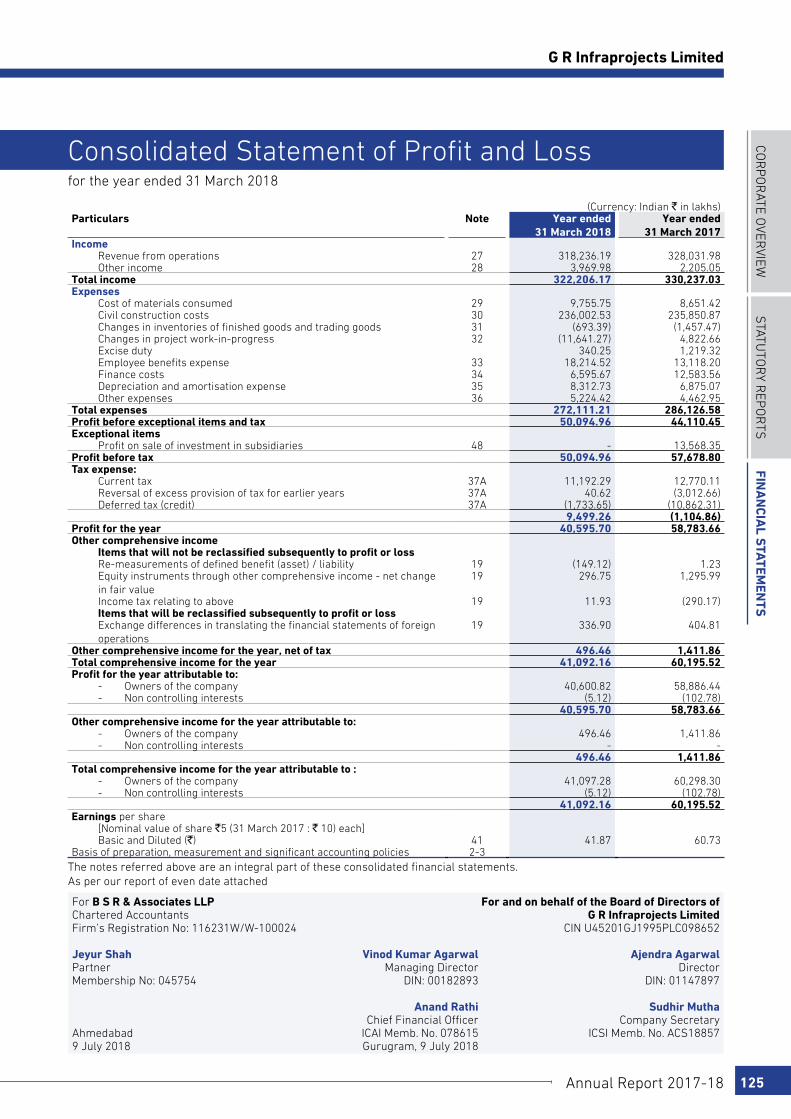
COR
PO
RATE O
VERVIEW
STATu
TOR
y REP
OR
TSFin
an
cial S
tatemen
tS
Annual Report 2017-18 125
G R Infraprojects Limited
(Currency: Indian ` in lakhs)Particulars Note Year ended
31 March 2018 Year ended
31 March 2017 Income
Revenue from operations 27 318,236.19 328,031.98Other income 28 3,969.98 2,205.05
Total income 322,206.17 330,237.03Expenses
Cost of materials consumed 29 9,755.75 8,651.42Civil construction costs 30 236,002.53 235,850.87Changes in inventories of finished goods and trading goods 31 (693.39) (1,457.47)Changes in project work-in-progress 32 (11,641.27) 4,822.66Excise duty 340.25 1,219.32Employee benefits expense 33 18,214.52 13,118.20Finance costs 34 6,595.67 12,583.56Depreciation and amortisation expense 35 8,312.73 6,875.07Other expenses 36 5,224.42 4,462.95
Total expenses 272,111.21 286,126.58Profit before exceptional items and tax 50,094.96 44,110.45Exceptional items
Profit on sale of investment in subsidiaries 48 - 13,568.35Profit before tax 50,094.96 57,678.80Tax expense:
Current tax 37A 11,192.29 12,770.11Reversal of excess provision of tax for earlier years 37A 40.62 (3,012.66)Deferred tax (credit) 37A (1,733.65) (10,862.31)
9,499.26 (1,104.86)Profit for the year 40,595.70 58,783.66Other comprehensive income
Items that will not be reclassified subsequently to profit or lossRe-measurements of defined benefit (asset) / liability 19 (149.12) 1.23Equity instruments through other comprehensive income - net change in fair value
19 296.75 1,295.99
Income tax relating to above 19 11.93 (290.17)Items that will be reclassified subsequently to profit or lossExchange differences in translating the financial statements of foreign operations
19 336.90 404.81
Other comprehensive income for the year, net of tax 496.46 1,411.86Total comprehensive income for the year 41,092.16 60,195.52Profit for the year attributable to:
- Owners of the company 40,600.82 58,886.44- Non controlling interests (5.12) (102.78)
40,595.70 58,783.66Other comprehensive income for the year attributable to:
- Owners of the company 496.46 1,411.86- Non controlling interests - -
496.46 1,411.86Total comprehensive income for the year attributable to :
- Owners of the company 41,097.28 60,298.30- Non controlling interests (5.12) (102.78)
41,092.16 60,195.52Earnings per share
[Nominal value of share `5 (31 March 2017 : ` 10) each]Basic and Diluted (`) 41 41.87 60.73
Basis of preparation, measurement and significant accounting policies 2-3The notes referred above are an integral part of these consolidated financial statements.As per our report of even date attached
for the year ended 31 March 2018
Consolidated Statement of Profit and Loss
For B S R & Associates LLP For and on behalf of the Board of Directors ofChartered Accountants G R Infraprojects LimitedFirm’s Registration No: 116231W/W-100024 CIN U45201GJ1995PLC098652
Jeyur Shah Vinod Kumar Agarwal Ajendra AgarwalPartner Managing Director DirectorMembership No: 045754 DIN: 00182893 DIN: 01147897
Anand Rathi Sudhir MuthaChief Financial Officer Company Secretary
Ahmedabad ICAI Memb. No. 078615 ICSI Memb. No. ACS188579 July 2018 Gurugram, 9 July 2018
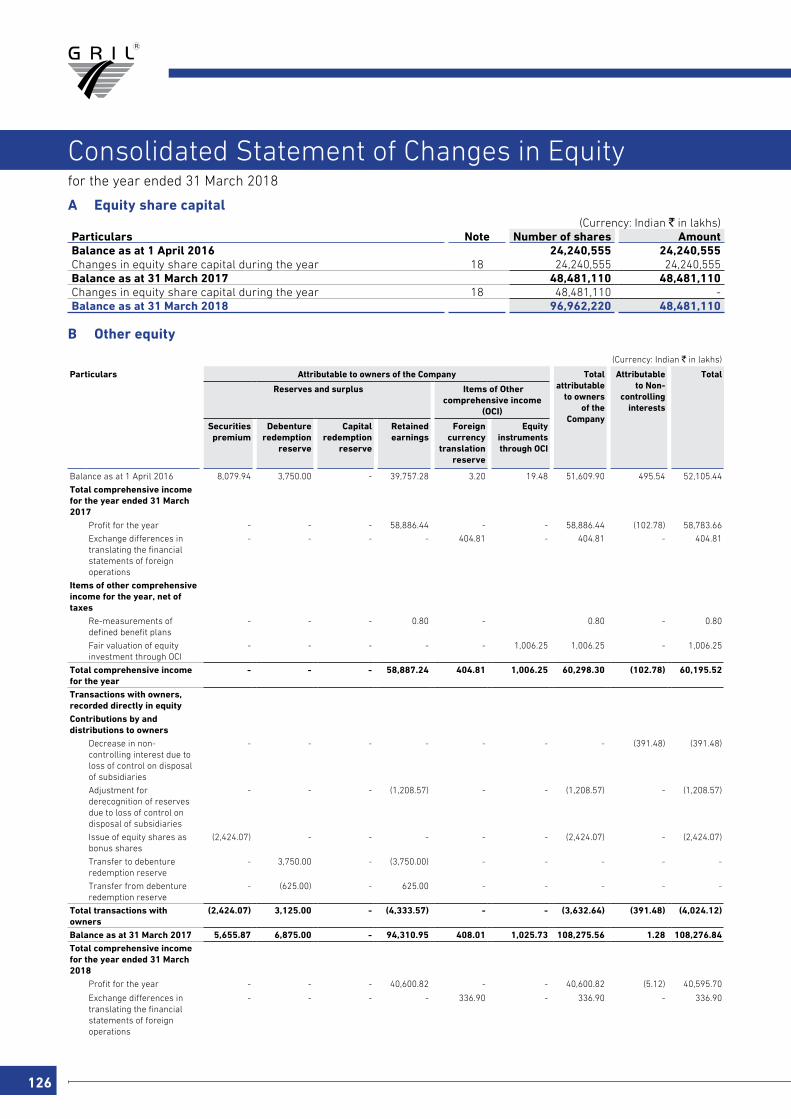
126
Consolidated Statement of Changes in Equityfor the year ended 31 March 2018
A Equity share capital(Currency: Indian ` in lakhs)
Particulars Note Number of shares Amount Balance as at 1 April 2016 24,240,555 24,240,555 Changes in equity share capital during the year 18 24,240,555 24,240,555 Balance as at 31 March 2017 48,481,110 48,481,110 Changes in equity share capital during the year 18 48,481,110 -Balance as at 31 March 2018 96,962,220 48,481,110
B Other equity
(Currency: Indian ` in lakhs)
Particulars Attributable to owners of the Company Total attributable
to owners of the
Company
Attributable to Non-
controlling interests
Total
Reserves and surplus Items of Other comprehensive income
(OCI)
Securities premium
Debenture redemption
reserve
Capital redemption
reserve
Retained earnings
Foreign currency
translation reserve
Equity instruments through OCI
Balance as at 1 April 2016 8,079.94 3,750.00 - 39,757.28 3.20 19.48 51,609.90 495.54 52,105.44
Total comprehensive income for the year ended 31 March 2017
Profit for the year - - - 58,886.44 - - 58,886.44 (102.78) 58,783.66
Exchange differences in translating the financial statements of foreign operations
- - - - 404.81 - 404.81 - 404.81
Items of other comprehensive income for the year, net of taxes
Re-measurements of defined benefit plans
- - - 0.80 - 0.80 - 0.80
Fair valuation of equity investment through OCI
- - - - - 1,006.25 1,006.25 - 1,006.25
Total comprehensive income for the year
- - - 58,887.24 404.81 1,006.25 60,298.30 (102.78) 60,195.52
Transactions with owners, recorded directly in equityContributions by and distributions to owners
Decrease in non-controlling interest due to loss of control on disposal of subsidiaries
- - - - - - - (391.48) (391.48)
Adjustment for derecognition of reserves due to loss of control on disposal of subsidiaries
- - - (1,208.57) - - (1,208.57) - (1,208.57)
Issue of equity shares as bonus shares
(2,424.07) - - - - - (2,424.07) - (2,424.07)
Transfer to debenture redemption reserve
- 3,750.00 - (3,750.00) - - - - -
Transfer from debenture redemption reserve
- (625.00) - 625.00 - - - - -
Total transactions with owners
(2,424.07) 3,125.00 - (4,333.57) - - (3,632.64) (391.48) (4,024.12)
Balance as at 31 March 2017 5,655.87 6,875.00 - 94,310.95 408.01 1,025.73 108,275.56 1.28 108,276.84Total comprehensive income for the year ended 31 March 2018
Profit for the year - - - 40,600.82 - - 40,600.82 (5.12) 40,595.70
Exchange differences in translating the financial statements of foreign operations
- - - - 336.90 - 336.90 - 336.90
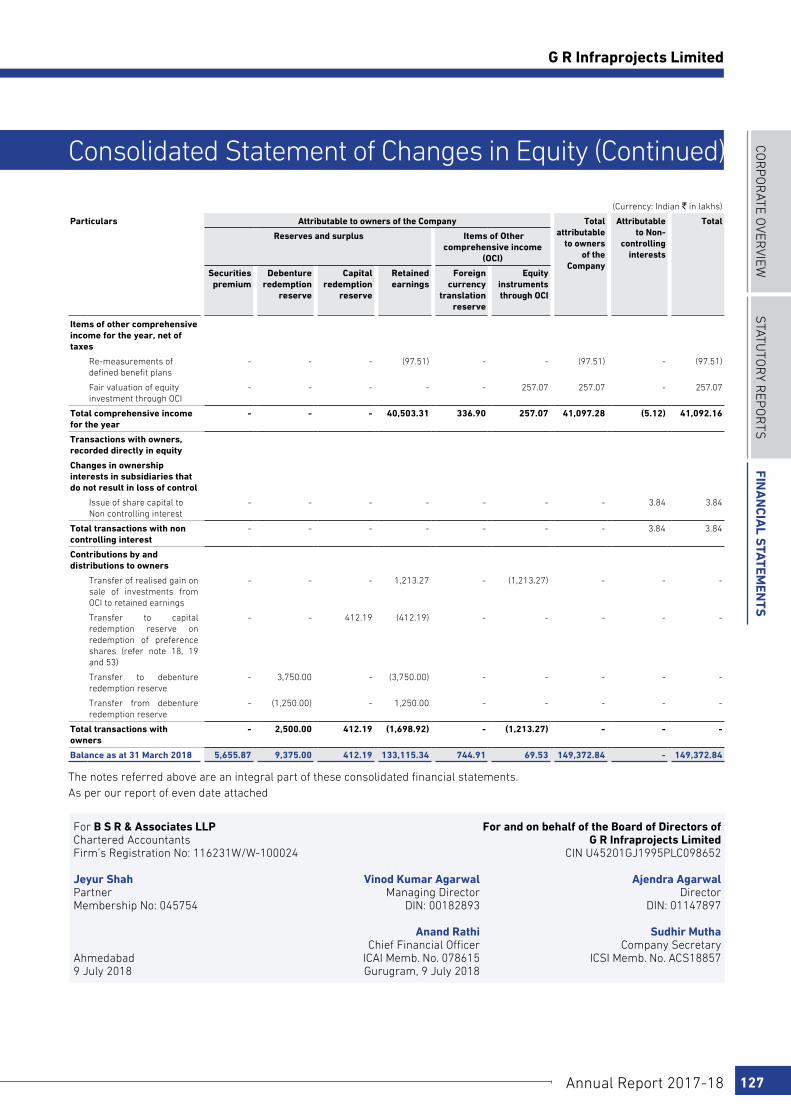
COR
PO
RATE O
VERVIEW
STATu
TOR
y REP
OR
TSFin
an
cial S
tatemen
tS
Annual Report 2017-18 127
G R Infraprojects Limited
Consolidated Statement of Changes in Equity (Continued)
(Currency: Indian ` in lakhs)
Particulars Attributable to owners of the Company Total attributable
to owners of the
Company
Attributable to Non-
controlling interests
Total
Reserves and surplus Items of Other comprehensive income
(OCI)
Securities premium
Debenture redemption
reserve
Capital redemption
reserve
Retained earnings
Foreign currency
translation reserve
Equity instruments through OCI
Items of other comprehensive income for the year, net of taxes
Re-measurements of defined benefit plans
- - - (97.51) - - (97.51) - (97.51)
Fair valuation of equity investment through OCI
- - - - - 257.07 257.07 - 257.07
Total comprehensive income for the year
- - - 40,503.31 336.90 257.07 41,097.28 (5.12) 41,092.16
Transactions with owners, recorded directly in equity
Changes in ownership interests in subsidiaries that do not result in loss of control
Issue of share capital to Non controlling interest
- - - - - - - 3.84 3.84
Total transactions with non controlling interest
- - - - - - - 3.84 3.84
Contributions by and distributions to owners
Transfer of realised gain on sale of investments from OCI to retained earnings
- - - 1,213.27 - (1,213.27) - - -
Transfer to capital redemption reserve on redemption of preference shares (refer note 18, 19 and 53)
- - 412.19 (412.19) - - - - -
Transfer to debenture redemption reserve
- 3,750.00 - (3,750.00) - - - - -
Transfer from debenture redemption reserve
- (1,250.00) - 1,250.00 - - - - -
Total transactions with owners
- 2,500.00 412.19 (1,698.92) - (1,213.27) - - -
Balance as at 31 March 2018 5,655.87 9,375.00 412.19 133,115.34 744.91 69.53 149,372.84 - 149,372.84
The notes referred above are an integral part of these consolidated financial statements.As per our report of even date attached
For B S R & Associates LLP For and on behalf of the Board of Directors ofChartered Accountants G R Infraprojects LimitedFirm’s Registration No: 116231W/W-100024 CIN U45201GJ1995PLC098652
Jeyur Shah Vinod Kumar Agarwal Ajendra AgarwalPartner Managing Director DirectorMembership No: 045754 DIN: 00182893 DIN: 01147897
Anand Rathi Sudhir MuthaChief Financial Officer Company Secretary
Ahmedabad ICAI Memb. No. 078615 ICSI Memb. No. ACS188579 July 2018 Gurugram, 9 July 2018
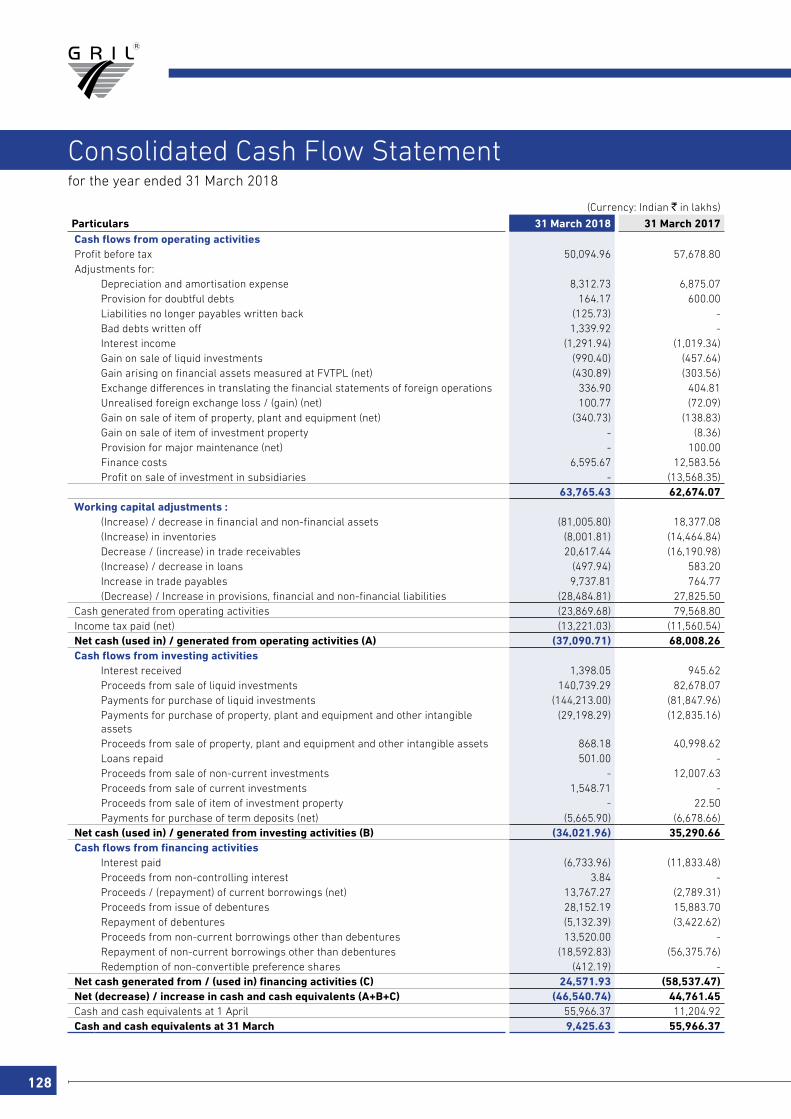
128
(Currency: Indian ` in lakhs)
Particulars 31 March 2018 31 March 2017 Cash flows from operating activities Profit before tax 50,094.96 57,678.80 Adjustments for:
Depreciation and amortisation expense 8,312.73 6,875.07 Provision for doubtful debts 164.17 600.00 Liabilities no longer payables written back (125.73) - Bad debts written off 1,339.92 - Interest income (1,291.94) (1,019.34) Gain on sale of liquid investments (990.40) (457.64) Gain arising on financial assets measured at FVTPL (net) (430.89) (303.56) Exchange differences in translating the financial statements of foreign operations 336.90 404.81 Unrealised foreign exchange loss / (gain) (net) 100.77 (72.09) Gain on sale of item of property, plant and equipment (net) (340.73) (138.83) Gain on sale of item of investment property - (8.36) Provision for major maintenance (net) - 100.00 Finance costs 6,595.67 12,583.56 Profit on sale of investment in subsidiaries - (13,568.35)
63,765.43 62,674.07 Working capital adjustments :
(Increase) / decrease in financial and non-financial assets (81,005.80) 18,377.08 (Increase) in inventories (8,001.81) (14,464.84) Decrease / (increase) in trade receivables 20,617.44 (16,190.98) (Increase) / decrease in loans (497.94) 583.20 Increase in trade payables 9,737.81 764.77 (Decrease) / Increase in provisions, financial and non-financial liabilities (28,484.81) 27,825.50
Cash generated from operating activities (23,869.68) 79,568.80 Income tax paid (net) (13,221.03) (11,560.54) Net cash (used in) / generated from operating activities (A) (37,090.71) 68,008.26 Cash flows from investing activities
Interest received 1,398.05 945.62 Proceeds from sale of liquid investments 140,739.29 82,678.07 Payments for purchase of liquid investments (144,213.00) (81,847.96) Payments for purchase of property, plant and equipment and other intangible assets
(29,198.29) (12,835.16)
Proceeds from sale of property, plant and equipment and other intangible assets 868.18 40,998.62 Loans repaid 501.00 - Proceeds from sale of non-current investments - 12,007.63 Proceeds from sale of current investments 1,548.71 - Proceeds from sale of item of investment property - 22.50 Payments for purchase of term deposits (net) (5,665.90) (6,678.66)
Net cash (used in) / generated from investing activities (B) (34,021.96) 35,290.66 Cash flows from financing activities
Interest paid (6,733.96) (11,833.48) Proceeds from non-controlling interest 3.84 - Proceeds / (repayment) of current borrowings (net) 13,767.27 (2,789.31) Proceeds from issue of debentures 28,152.19 15,883.70 Repayment of debentures (5,132.39) (3,422.62) Proceeds from non-current borrowings other than debentures 13,520.00 - Repayment of non-current borrowings other than debentures (18,592.83) (56,375.76) Redemption of non-convertible preference shares (412.19) -
Net cash generated from / (used in) financing activities (C) 24,571.93 (58,537.47) Net (decrease) / increase in cash and cash equivalents (A+B+C) (46,540.74) 44,761.45 Cash and cash equivalents at 1 April 55,966.37 11,204.92 Cash and cash equivalents at 31 March 9,425.63 55,966.37
for the year ended 31 March 2018
Consolidated Cash Flow Statement
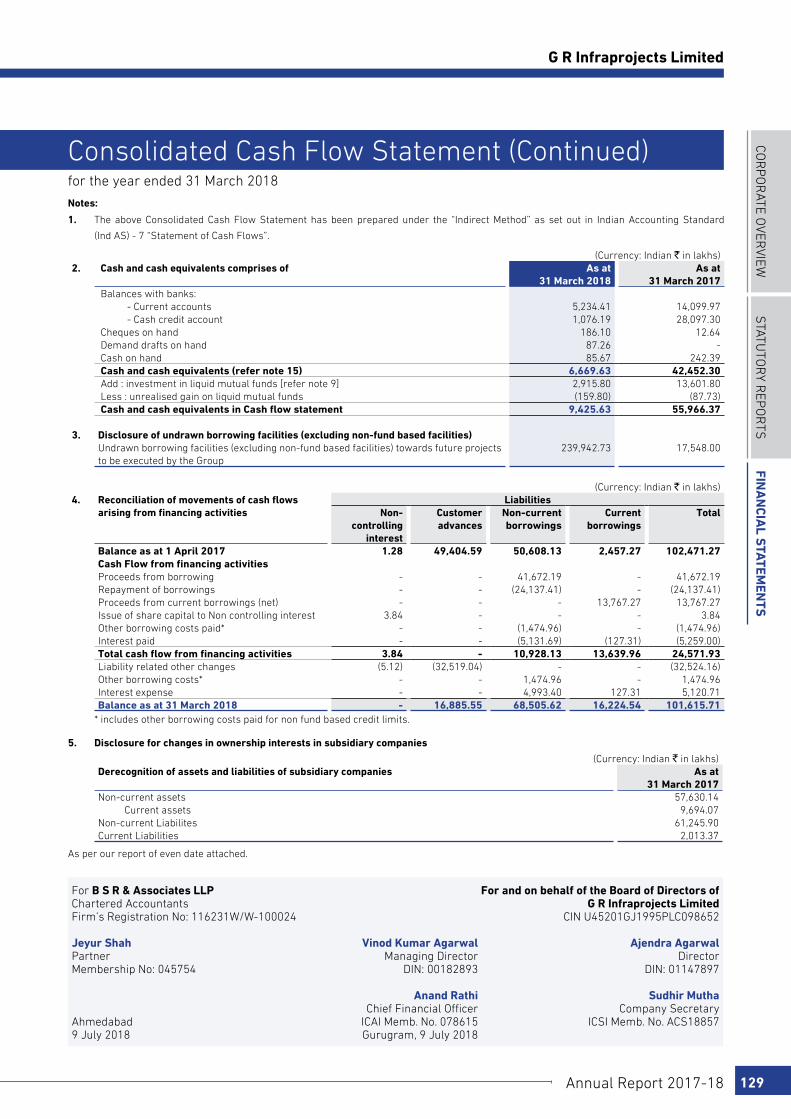
COR
PO
RATE O
VERVIEW
STATu
TOR
y REP
OR
TSFin
an
cial S
tatemen
tS
Annual Report 2017-18 129
G R Infraprojects Limited
Consolidated Cash Flow Statement (Continued)for the year ended 31 March 2018
Notes:
1. The above Consolidated Cash Flow Statement has been prepared under the “Indirect Method” as set out in Indian Accounting Standard
(Ind AS) - 7 “Statement of Cash Flows”.
(Currency: Indian ` in lakhs)2. Cash and cash equivalents comprises of As at
31 March 2018 As at
31 March 2017 Balances with banks:
- Current accounts 5,234.41 14,099.97 - Cash credit account 1,076.19 28,097.30
Cheques on hand 186.10 12.64 Demand drafts on hand 87.26 - Cash on hand 85.67 242.39 Cash and cash equivalents (refer note 15) 6,669.63 42,452.30 Add : investment in liquid mutual funds [refer note 9] 2,915.80 13,601.80 Less : unrealised gain on liquid mutual funds (159.80) (87.73) Cash and cash equivalents in Cash flow statement 9,425.63 55,966.37
3. Disclosure of undrawn borrowing facilities (excluding non-fund based facilities) Undrawn borrowing facilities (excluding non-fund based facilities) towards future projects to be executed by the Group
239,942.73 17,548.00
(Currency: Indian ` in lakhs)4. Reconciliation of movements of cash flows
arising from financing activitiesLiabilities
Non-controlling
interest
Customer advances
Non-current borrowings
Current borrowings
Total
Balance as at 1 April 2017 1.28 49,404.59 50,608.13 2,457.27 102,471.27Cash Flow from financing activitiesProceeds from borrowing - - 41,672.19 - 41,672.19Repayment of borrowings - - (24,137.41) - (24,137.41)Proceeds from current borrowings (net) - - - 13,767.27 13,767.27Issue of share capital to Non controlling interest 3.84 - - - 3.84Other borrowing costs paid* - - (1,474.96) - (1,474.96)Interest paid - - (5,131.69) (127.31) (5,259.00)Total cash flow from financing activities 3.84 - 10,928.13 13,639.96 24,571.93Liability related other changes (5.12) (32,519.04) - - (32,524.16)Other borrowing costs* - - 1,474.96 - 1,474.96Interest expense - - 4,993.40 127.31 5,120.71Balance as at 31 March 2018 - 16,885.55 68,505.62 16,224.54 101,615.71
* includes other borrowing costs paid for non fund based credit limits.
5. Disclosure for changes in ownership interests in subsidiary companies
(Currency: Indian ` in lakhs)Derecognition of assets and liabilities of subsidiary companies As at
31 March 2017 Non-current assets 57,630.14
Current assets 9,694.07 Non-current Liabilites 61,245.90 Current Liabilities 2,013.37
As per our report of even date attached.
For B S R & Associates LLP For and on behalf of the Board of Directors ofChartered Accountants G R Infraprojects LimitedFirm’s Registration No: 116231W/W-100024 CIN U45201GJ1995PLC098652
Jeyur Shah Vinod Kumar Agarwal Ajendra AgarwalPartner Managing Director DirectorMembership No: 045754 DIN: 00182893 DIN: 01147897
Anand Rathi Sudhir MuthaChief Financial Officer Company Secretary
Ahmedabad ICAI Memb. No. 078615 ICSI Memb. No. ACS188579 July 2018 Gurugram, 9 July 2018

130
for the year ended 31 March 2018
Notes to the Consolidated Financial Statements
1. Corporate Information The Consolidated Financial Statements comprise of
financial statements of G R Infraprojects Limited (‘the Company’ or ‘the Holding Company’), its subsidiaries and joint operations (collectively, “the Group”) for the year ended 31 March 2018. The Company has its registered office situated at Revenue block no. 223, Old survey No. 384/1, 384/2, Paiki and 384/3, Khata No. 464, Kochariya, Ahmedabad, Gujarat - 382220. The Company has been incorporated under the provisions of the Indian Companies Act. The Company is a closely held Public Limited Company having its debentures listed on National Stock Exchange. The Company is engaged in road construction and the infrastructure sector since 1996, with operations spread across various states in India. The Company has also set up Emulsion Manufacturing Plants in Udaipur, Rajasthan and in Guwahati, Assam. The subsidiaries and joint operations of the holding company also construct, maintain, operate and transfer the infrastructure facilities like roads on Build-Operate-Transfer (BOT) basis.
2. Basis of preparation a. Statement of compliance
These consolidated financial statements have been prepared in accordance with Indian Accounting Standards (Ind AS) as per the Companies (Indian Accounting Standards) Rules, 2015 notified under Section 133 of Companies Act, 2013, (the ‘Act’) and other relevant provisions of the Act.
The consolidated financial statements were authorised for issue by the Company’s Board of Directors on 9 July 2018.
Details of the Group’s accounting policies are included in Note 3.
b. Functional and presentation currency
The functional currency of the Company and its Indian Subsidiaries is Indian Rupees (`), whereas the functional currency of foreign subsidiaries is Nigeria Naira (NGN). The presentation currency of the group is Indian Rupees (`). All amounts have been rounded to the nearest lakhs, unless otherwise indicated.
c. Basis of measurement
The Consolidated financial statements have been prepared on the historical cost basis except for the following items:
Items Measurement basisInvestment in mutual fund
Fair Value Through Profit or Loss (“FVTPL”)
Net defined benefit (asset)/ liability
Fair value of plan assets less present value of defined benefit obligations
Investment in certain equity shares of entities other than subsidiary companies
Fair Value Through Other Comprehensive Income (“FVOCI”)
d. Use of estimates and judgments
In preparing these consolidated financial statements, management has made judgments, estimates and assumptions that affect the application of accounting policies and the reported amounts of assets, liabilities, income and expenses. Actual results may differ from these estimates.
Estimates and underlying assumptions are reviewed on an ongoing basis. Revisions to accounting estimates are recognised prospectively.
Assumptions and estimation uncertainties
Information about assumptions and estimation uncertainties that have a significant risk of resulting in a material adjustment within the next financial year are included in the following notes:
Note 5 and 8
Estimates of useful lives and residual value of Property, plant and equipment and other intangible assets
Note 9 Fair valuation of investments and determining fair value less cost of sell of the disposal group on the basis of significant unobservable inputs
Note 10 and 27
Estimate of cost for BOT projects for percentage of completion, right for annuity receivable and finance income
Note 14 Provision for doubtful debts
Note 21 Recognition and measurement of provisions and contingencies
Note 27 Estimates of contract cost for percentage of completion
Note 37 Current / Deferred tax expense and recognition of MAT Credit and evaluation of recoverability of deferred tax assets
Note 38 Measurement of employee defined benefit obligations; key actuarial assumptions
COR
PO
RATE O
VERVIEW
STATu
TOR
y REP
OR
TSFin
an
cial S
tatemen
tS
Annual Report 2017-18 131
G R Infraprojects Limited
for the year ended 31 March 2018
Notes to the Consolidated Financial Statements
e. Measurement of fair values
Some of the Group’s accounting policies and disclosures require the measurement of fair values, for both financial and non-financial assets and liabilities.
The Group has an established control framework with respect to the measurement of fair values. This includes a financial reporting team that has overall responsibility for overseeing all significant fair value measurements, including Level 3 fair values, and reports directly to the Chief Financial Officer.
The financial reporting team regularly reviews significant unobservable inputs and valuation adjustments. If third party information, such as pricing services, is used to measure fair values, then the financial reporting team assesses the evidence obtained from the third parties to support the conclusion that these valuations meet the requirements of Ind AS, including the level in the fair value hierarchy in which the valuations should be classified.
Fair values are categorised into different levels in a fair value hierarchy based on the inputs used in the valuation techniques as follows.
Level 1: quoted prices (unadjusted) in active markets for identical assets or liabilities.
Level 2: inputs other than quoted prices included in Level 1 that are observable for the asset or liability, either directly (i.e. as prices) or indirectly (i.e. derived from prices).
Level 3: inputs for the asset or liability that are not based on observable market data (unobservable inputs).
When measuring the fair value of an asset or a liability, the Group uses observable market data as far as possible. If the inputs used to measure the fair value of an asset or a liability fall into different levels of the fair value hierarchy, then the fair value measurement is categorised in its entirety in the same level of the fair value hierarchy as the lowest level input that is significant to the entire measurement.
The Group recognises transfers between levels of the fair value hierarchy at the end of the reporting period during which the change has occurred.
Further information about the assumptions made in measuring fair values is included in the following notes:
Note 9 Investments
Note 38 Employee benefits
Note 44 Financial instruments
3. Significant accounting polices a. Basis of consolidation
The consolidated financial statements comprise the financial statements of the Holding Company, joint operations and its subsidiary companies (including special purpose entities) where Control exists when the Holding Company is exposed to, or has rights, to variable returns from its involvement with the entity, and has the ability to affect those returns through power over the entity. In assessing control, potential voting rights are considered only if the rights are substantive. The financial statements of subsidiary companies are included in these consolidated financial statements from the date that control commences until the date that control ceases.
Upon loss of control, the Group derecognises the assets and liabilities of the subsidiary companies, any non-controlling interests and the other components of equity related to the subsidiary. Any surplus or deficit arising on the loss of control is recognised in the Consolidated Statement of Profit and Loss. If the Company retains any interest in the previous subsidiary, then such interest is measured at fair value at the date that control is lost. Subsequently, it is accounted for as an equity accounted investee depending on the level of influence retained.
Consolidated financial statements are prepared using uniform accounting policies for like transactions and other events in similar circumstances. The financial statements of each of the subsidiaries used for the purpose of consolidation are drawn up to same reporting date as that of the Holding Company, i.e., year ended on 31 March 2018 except for GR Building & Construction Nigeria Limited and GR Infrastructure Limited whose accounts are drawn for the year ended 31 December 2017, where there are no significant transactions or other events that have occurred between 1 January 2018 and 31 March 2018.
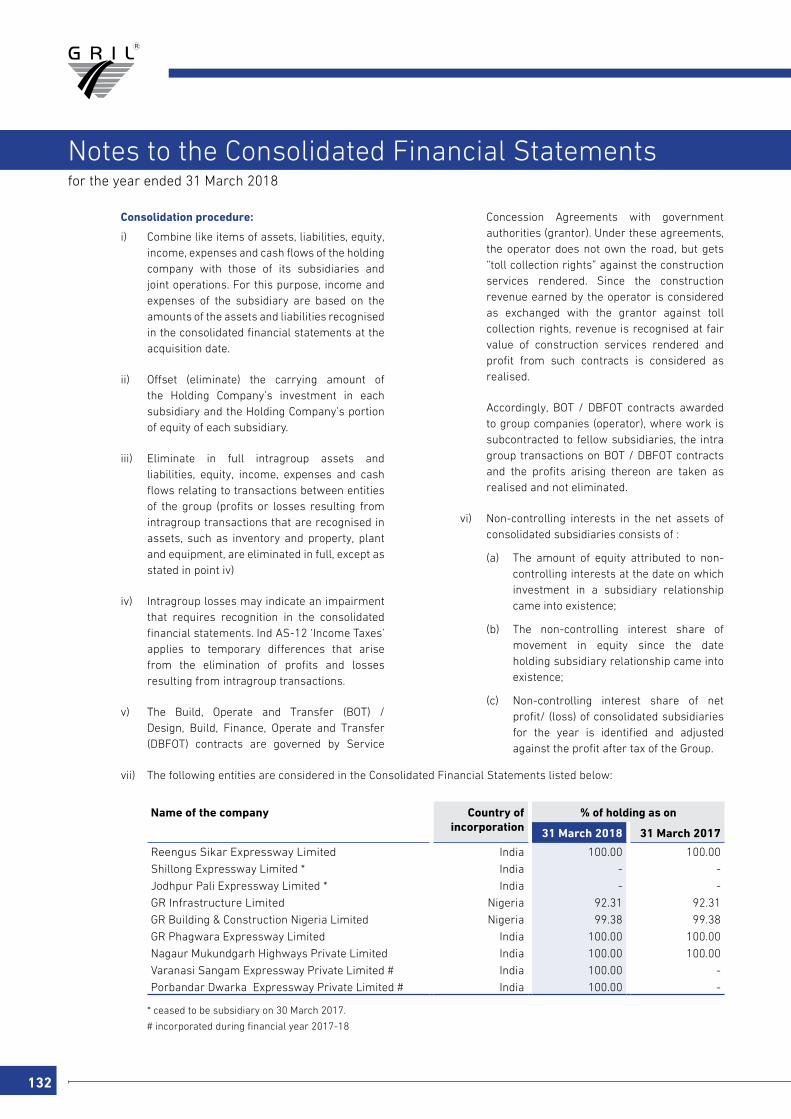
132
for the year ended 31 March 2018
Notes to the Consolidated Financial Statements
Consolidation procedure:
i) Combine like items of assets, liabilities, equity, income, expenses and cash flows of the holding company with those of its subsidiaries and joint operations. For this purpose, income and expenses of the subsidiary are based on the amounts of the assets and liabilities recognised in the consolidated financial statements at the acquisition date.
ii) Offset (eliminate) the carrying amount of the Holding Company’s investment in each subsidiary and the Holding Company’s portion of equity of each subsidiary.
iii) Eliminate in full intragroup assets and liabilities, equity, income, expenses and cash flows relating to transactions between entities of the group (profits or losses resulting from intragroup transactions that are recognised in assets, such as inventory and property, plant and equipment, are eliminated in full, except as stated in point iv)
iv) Intragroup losses may indicate an impairment that requires recognition in the consolidated financial statements. Ind AS-12 ‘Income Taxes’ applies to temporary differences that arise from the elimination of profits and losses resulting from intragroup transactions.
v) The Build, Operate and Transfer (BOT) / Design, Build, Finance, Operate and Transfer (DBFOT) contracts are governed by Service
Concession Agreements with government authorities (grantor). Under these agreements, the operator does not own the road, but gets “toll collection rights” against the construction services rendered. Since the construction revenue earned by the operator is considered as exchanged with the grantor against toll collection rights, revenue is recognised at fair value of construction services rendered and profit from such contracts is considered as realised.
Accordingly, BOT / DBFOT contracts awarded to group companies (operator), where work is subcontracted to fellow subsidiaries, the intra group transactions on BOT / DBFOT contracts and the profits arising thereon are taken as realised and not eliminated.
vi) Non-controlling interests in the net assets of consolidated subsidiaries consists of :
(a) The amount of equity attributed to non-controlling interests at the date on which investment in a subsidiary relationship came into existence;
(b) The non-controlling interest share of movement in equity since the date holding subsidiary relationship came into existence;
(c) Non-controlling interest share of net profit/ (loss) of consolidated subsidiaries for the year is identified and adjusted against the profit after tax of the Group.
vii) The following entities are considered in the Consolidated Financial Statements listed below:
Name of the company Country of incorporation
% of holding as on
31 March 2018 31 March 2017
Reengus Sikar Expressway Limited India 100.00 100.00
Shillong Expressway Limited * India - -
Jodhpur Pali Expressway Limited * India - -
GR Infrastructure Limited Nigeria 92.31 92.31
GR Building & Construction Nigeria Limited Nigeria 99.38 99.38
GR Phagwara Expressway Limited India 100.00 100.00
Nagaur Mukundgarh Highways Private Limited India 100.00 100.00
Varanasi Sangam Expressway Private Limited # India 100.00 -
Porbandar Dwarka Expressway Private Limited # India 100.00 -
* ceased to be subsidiary on 30 March 2017.
# incorporated during financial year 2017-18
COR
PO
RATE O
VERVIEW
STATu
TOR
y REP
OR
TSFin
an
cial S
tatemen
tS
Annual Report 2017-18 133
G R Infraprojects Limited
for the year ended 31 March 2018
Notes to the Consolidated Financial Statements
b. Business combinations and goodwill
The excess of cost to the group of its investments in subsidiary companies over its share of the equity of the subsidiary companies at the dates on which the investments in the subsidiary companies are made, is recognised as ‘Goodwill’ being an asset in the Consolidated Financial Statements. This Goodwill is tested for impairment at the close of each financial year. Alternatively, where the share of equity in the subsidiary companies as on the date of investment is in excess of cost of investment of the group, it is recognised as ‘Capital Reserve’ and shown under the head ‘Other equity’, in the consolidated financial statements.
c. Foreign currency transactions and translations
Transactions in foreign currencies are translated into the respective functional currencies of the Company at the exchange rates at the date of the transaction or at an average rate if the average rate approximates the actual rate at the date of the transaction.
Monetary assets and liabilities denominated in foreign currencies are translated into the functional currency at the exchange rate at the reporting date. Non-monetary assets and liabilities that are measured at fair value in a foreign currency are translated into the functional currency at the exchange rate when the fair value was determined. Non-monetary assets and liabilities that are measured based on historical cost in a foreign currency are translated at the exchange rate at the date of the transaction. Exchange differences are recognised in Consolidated Statement of Profit or Loss.
In case of foreign operations whose functional currency is different from the Holding Company’s functional currency, the assets and liabilities of such foreign operations, including goodwill and fair value adjustments arising upon acquisition, are translated to the reporting currency at exchange rates at the reporting date. The income and expenses of such foreign operations are translated to the reporting currency at the average exchange rates prevailing during the year. Resulting foreign currency differences are recognised in other comprehensive income/ (loss) and presented within equity as part of Foreign Currency Translation Reserve (“FCTR”). When a foreign operation is disposed of, in part or in full, the relevant amount in the FCTR is reclassified
to the Consolidated Statement of Profit and Loss as a part of gain or loss on disposal.
d. Financial instruments
i Recognition and initial measurement
Trade receivables and debt securities issued are initially recognised when they are originated. All other financial assets and financial liabilities are initially recognised by each entity in the Group when it becomes a party to the contractual provisions of the instrument.
A financial asset or financial liability is initially measured at fair value plus, for an item not at FVTPL, transaction costs that are directly attributable to its acquisition or issue.
ii Classification and subsequent measurement
Financial assets
On initial recognition, a financial asset is classified as measured at
- amortised cost;
- FVOCI – debt investment;
- FVOCI – equity investment; or
- FVTPL
Financial assets are not reclassified subsequent to their initial recognition, except if and in the period the Group changes its business model for managing financial assets.
A financial asset is measured at amortised cost if it meets both of the following conditions and is not designated as at FVTPL:
- the asset is held within a business model whose objective is to hold assets to collect contractual cash flows; and
- the contractual terms of the financial asset give rise on specified dates to cash flows that are solely payments of principal and interest on the principal amount outstanding.
A financial asset is measured at FVOCI if it meets both of the following conditions and is not designated as at FVTPL:
- the asset is held within a business model whose objective is achieved by both

134
for the year ended 31 March 2018
Notes to the Consolidated Financial Statements
collecting contractual cash flows and selling financial assets; and
- the contractual terms of the financial asset give rise on specified dates to cash flows that are solely payments of principal and interest on the principal amount outstanding.
At present, the Group does not have investments in any debt securities classified as FVOCI.
On initial recognition of an equity investment that is not held for trading, the Group may irrevocably elect to present subsequent changes in the investment’s fair value in OCI (designated as FVOCI – equity investment). This election is made on an investment-by-investment basis.
All financial assets not classified as measured at amortised cost or FVOCI as described above are measured at FVTPL. This includes all derivative financial assets. On initial recognition, the Group may irrevocably designate a financial asset that otherwise meets the requirements to be measured at amortised cost or at FVOCI or at FVTPL if doing so eliminates or significantly reduces an accounting mismatch that would otherwise arise.
Financial assets: Business model assessment
The Group makes an assessment of the objective of the business model in which a financial asset is held at a portfolio level because this best reflects the way the business is managed and information is provided to management. The information considered includes:
- the stated policies and objectives for the portfolio and the operation of those policies in practice. These include whether management’s strategy focuses on earning contractual interest income, maintaining a particular interest rate profile, matching the duration of the financial assets to the duration of any related liabilities or expected cash outflows or realising cash flows through the sale of the assets;
- how the performance of the portfolio is evaluated and reported to the each entity’s management in the Group;;
- the risks that affect the performance of the business model (and the financial assets held within that business model) and how those risks are managed;
- how managers of the business are compensated – e.g. whether compensation is based on the fair value of the assets managed or the contractual cash flows collected; and
- the frequency, volume and timing of sales of financial assets in prior periods, the reasons for such sales and expectations about future sales activity.
Transfers of financial assets to third parties in transactions that do not qualify for derecognition are not considered sales for this purpose, consistent with the Group’s continuing recognition of the assets.
Financial assets that are held for trading or are managed and whose performance is evaluated on a fair value basis are measured at FVTPL.
Financial assets: Assessment whether contractual cash flows are solely payments of principal and interest.
For the purposes of this assessment, ‘principal’ is defined as the fair value of the financial asset on initial recognition. ‘Interest’ is defined as consideration for the time value of money and for the credit risk associated with the principal amount outstanding during a particular period of time and for other basic lending risks and costs (e.g. liquidity risk and administrative costs),as well as a profit margin.
In assessing whether the contractual cash flows are solely payments of principal and interest, the each entity in the Group considers the contractual terms of the instrument. This includes assessing whether the financial asset contains a contractual term that could change the timing or amount of contractual cash flows such that it would not meet this condition. In making this assessment, the Group considers:
COR
PO
RATE O
VERVIEW
STATu
TOR
y REP
OR
TSFin
an
cial S
tatemen
tS
Annual Report 2017-18 135
G R Infraprojects Limited
for the year ended 31 March 2018
Notes to the Consolidated Financial Statements
- contingent events that would change the amount or timing of cash flows;
- terms that may adjust the contractual coupon rate, including variable interest rate features;
- prepayment and extension features; and
- terms that limit the Group’s claim to cash flows from specified assets (e.g. non-recourse features).
A prepayment feature is consistent with the solely payments of principal and interest criterion if the prepayment amount
substantially represents unpaid amounts of principal and interest on the principal amount outstanding, which may include reasonable additional compensation for early termination of the contract. Additionally, for a financial asset acquired at a significant discount or premium to its contractual paramount, a feature that permits or requires prepayment at an amount that substantially represents the contractual par amount plus accrued (but unpaid) contractual interest (which may also include reasonable additional compensation for early termination) is treated as consistent with this criterion if the fair value of the prepayment feature is insignificant at initial recognition.
Financial assets: Subsequent measurement and gains and losses
Financial assets at FVTPL These assets are subsequently measured at fair value. Net gains and losses, including any interest or dividend income, are recognised in profit or loss.
Financial assets at amortised cost
These assets are subsequently measured at amortised cost using the effective interest method. The amortised cost is reduced by impairment losses. Interest income, foreign exchange gains and losses and impairment are recognised in profit or loss. Any gain or loss on derecognition is recognised in profit or loss.
Equity investments at FVOCI These assets are subsequently measured at fair value. Dividends are recognised as income in profit or loss unless the dividend clearly represents a recovery of part of the cost of the investment. Other net gains and losses are recognised in OCI and are not reclassified to profit or loss.
Financial liabilities: Classification, subsequent measurement and gains and losses
Financial liabilities are classified as measured at amortised cost or FVTPL. A financial liability is classified as at FVTPL if it is classified as held-for-trading, or it is a derivative or it is designated as such on initial recognition. Financial liabilities at FVTPL are measured at fair value and net gains and losses, including any interest expense, are recognised in statement of profit and loss. Other financial liabilities are subsequently measured at amortised cost using the effective interest method. Interest expense and foreign exchange gains and losses are recognised in consolideared statement of profit and loss. Any gain or loss on derecognition is also recognised in consolidated statement of profit and loss.
iii. Derecognition
Financial assets
The Group derecognises a financial asset when the contractual rights to the cash flows from
the financial asset expire, or it transfers the rights to receive the contractual cash flows in a transaction in which substantially all of the risks and rewards of ownership of the financial asset are transferred or in which the Group neither transfers nor retains substantially all of the risks and rewards of ownership and does not retain control of the financial asset.
If the Group enters into transactions whereby it transfers assets recognised on its balance sheet, but retains either all or substantially all of the risks and rewards of the transferred assets, the transferred assets are not derecognised.
Financial liabilities
The Group derecognises a financial liability when its contractual obligations are discharged or cancelled, or expire.
The Group also derecognises a financial liability when its terms are modified and the cash flows
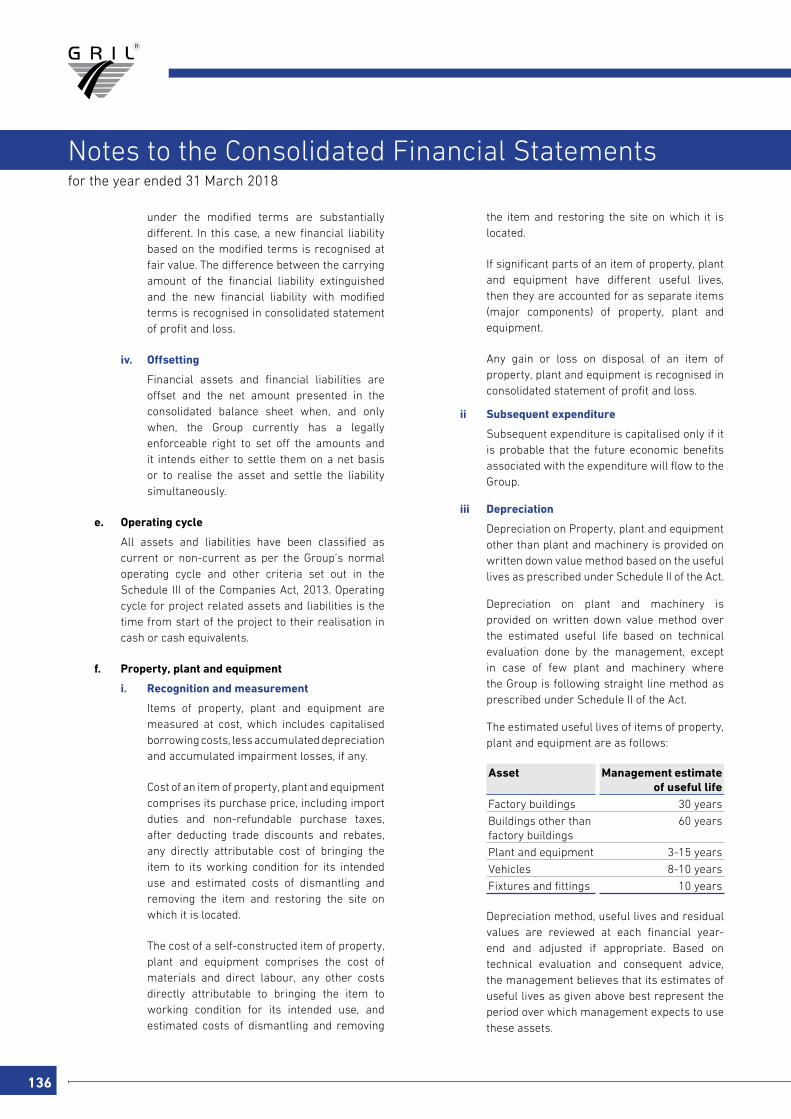
136
for the year ended 31 March 2018
Notes to the Consolidated Financial Statements
under the modified terms are substantially different. In this case, a new financial liability based on the modified terms is recognised at fair value. The difference between the carrying amount of the financial liability extinguished and the new financial liability with modified terms is recognised in consolidated statement of profit and loss.
iv. Offsetting
Financial assets and financial liabilities are offset and the net amount presented in the consolidated balance sheet when, and only when, the Group currently has a legally enforceable right to set off the amounts and it intends either to settle them on a net basis or to realise the asset and settle the liability simultaneously.
e. Operating cycle
All assets and liabilities have been classified as current or non-current as per the Group’s normal operating cycle and other criteria set out in the Schedule III of the Companies Act, 2013. Operating cycle for project related assets and liabilities is the time from start of the project to their realisation in cash or cash equivalents.
f. Property, plant and equipment
i. Recognition and measurement
Items of property, plant and equipment are measured at cost, which includes capitalised borrowing costs, less accumulated depreciation and accumulated impairment losses, if any.
Cost of an item of property, plant and equipment comprises its purchase price, including import duties and non-refundable purchase taxes, after deducting trade discounts and rebates, any directly attributable cost of bringing the item to its working condition for its intended use and estimated costs of dismantling and removing the item and restoring the site on which it is located.
The cost of a self-constructed item of property, plant and equipment comprises the cost of materials and direct labour, any other costs directly attributable to bringing the item to working condition for its intended use, and estimated costs of dismantling and removing
the item and restoring the site on which it is located.
If significant parts of an item of property, plant and equipment have different useful lives, then they are accounted for as separate items (major components) of property, plant and equipment.
Any gain or loss on disposal of an item of property, plant and equipment is recognised in consolidated statement of profit and loss.
ii Subsequent expenditure
Subsequent expenditure is capitalised only if it is probable that the future economic benefits associated with the expenditure will flow to the Group.
iii Depreciation
Depreciation on Property, plant and equipment other than plant and machinery is provided on written down value method based on the useful lives as prescribed under Schedule II of the Act.
Depreciation on plant and machinery is provided on written down value method over the estimated useful life based on technical evaluation done by the management, except in case of few plant and machinery where the Group is following straight line method as prescribed under Schedule II of the Act.
The estimated useful lives of items of property, plant and equipment are as follows:
Asset Management estimate of useful life
Factory buildings 30 years
Buildings other than factory buildings
60 years
Plant and equipment 3-15 years
Vehicles 8-10 years
Fixtures and fittings 10 years
Depreciation method, useful lives and residual values are reviewed at each financial year-end and adjusted if appropriate. Based on technical evaluation and consequent advice, the management believes that its estimates of useful lives as given above best represent the period over which management expects to use these assets.
COR
PO
RATE O
VERVIEW
STATu
TOR
y REP
OR
TSFin
an
cial S
tatemen
tS
Annual Report 2017-18 137
G R Infraprojects Limited
for the year ended 31 March 2018
Notes to the Consolidated Financial Statements
Depreciation on additions (disposals) is provided on a pro-rata basis i.e. from (up to) the date on which asset is ready for use (disposed off).
iv Derecognition
The carrying amount of an item of property, plant and equipment is derecognised on disposal or when no future economic benefits are expected from its use or disposal. The consequential gain or loss is measured as the difference between the net disposal proceeds and the carrying amount of the item and is recognised in the consolidated statement of profit and loss.
g. Capital work in progress
Cost of assets not ready for intended use, as on balance sheet date is shown as capital work in progress. Advances given towards acquisition of property, plant and equipment outstanding at each balance sheet date are disclosed as other non-current assets.
h. Intangible assets
i. Recognition and measurement
Intangible assets including those acquired by the Group are initially measured at cost. Such intangible assets are subsequently measured at cost less accumulated amortisation and accumulated impairment losses, if any.
Concession intangibles represents commercial rights to collect fee in relation to toll roads which has been accounted based on the value of project activity towards construction, reconstruction, strengthening, widening, rehabilitation of the toll roads on Build, Operate and Transfer basis. It includes all direct material, labour and sub- contracting costs, inward freight, duties, taxes, if any, and any directly attributable expenditure on making the commercial right ready for its intended use
ii. Subsequent expenditure
Subsequent expenditure is capitalised only when it increases the future economic benefits embodied in the specific asset to which it relates. All other expenditure is recognised in consolidated statement of profit and loss as incurred.
iii. Amortisation
Amortisation of intangible assets other than toll collection rights is calculated to amortise the cost of intangible assets less their estimated residual values over their estimated useful lives using the straight-line method, and is included in depreciation and amortisation in Consolidated Statement of Profit and Loss.
The estimated useful lives are as follows :
- Software : 3 years
- Intangible asset under service concession arrangement
- Wind power : 22 years
- Toll collection rights : Revenue under BOT projects a mortisation existing on transition date based
Amortisation method, useful lives and residual values are reviewed at the end of each financial year and adjusted if appropriate.
iv. Derecognition
The carrying amount of an intangible asset is derecognised on disposal or when no future economic benefits are expected from its use or disposal. The gain or loss arising from the derecognition of an intangible asset is measured as the difference between the net disposal proceeds and the carrying amount of the intangible asset and is recognised in the consolidated statement of profit and loss when the asset is derecognised.
v. Service concession
(a) Wind Power
The Power Purchase Agreement (PPA) with Ajmer Vidyut Nigam Limited are accounted as per the guidance for service concession arrangements provided in Appendix A to Ind AS 11 ‘Construction contracts’. Revenue from the construction phase is recognised using percentage of completion method. A corresponding financial asset is recognised to the extent of right to receive a fixed amount with the balance being accounted as an intangible asset.

138
for the year ended 31 March 2018
Notes to the Consolidated Financial Statements
(b) Service concession under BOT projects with toll collection rights
Concession Agreement entered into between Government of Rajasthan, Public Works Development (on behalf of Ministry of Road Transport & Highways, Government of India) (‘the Grantor”) and Jodhpur Pali Expressway Limited (“JPEL”, a subsidiary company)(‘the operator’), conferred the right to JPEL to implement the project and recover the project cost, through the toll receipts. The same are accounted as per the guidance for service concession arrangements provided in Appendix A to Ind AS 11 ‘Construction contracts’. Revenue from the construction phase is recognised using percentage of completion method. A corresponding intangible asset is recognised to the extent the operator receives right from Grantor to charge the users of the public service.
(c) Service concession under BOT projects with annuity receivables
Concession Agreement entered into, between concession grantor (‘the Grantor’) and certain subsidiary companies (‘the Operator’), are accounted as per the guidance for service concession arrangements provided in Appendix A to Ind AS 11 ‘Construction contracts’. Revenue from the construction phase is recognised using percentage of completion method. A corresponding financial asset is recognised to the extent that the Operator has an unconditional contractual right to receive cash or another financial asset from the Grantor.
vi. Intangible assets under development
Expenditure related to and incurred during implementation of project are included under “Intangible Assets under Development”. The same will be transferred to the respective intangible assets on completion of project.
i. Investment Property
i. Recognition and Measurement
Land or building held to earn rentals or for capital appreciation or both rather than for use in the production or supply of goods or services or for administrative purposes; or sale in the ordinary course of business is recognised as Investment Property. Land held for a currently
undetermined future use is also recognised as Investment Property.
An investment property is measured initially at its cost. The cost of an investment property comprises its purchase price and any directly attributable expenditure. After initial recognition, the Group carries the investment property at the cost less accumulated depreciation and accumulated impairment, if any.
ii. Gain or Loss on Disposal
Any gain or loss on disposal of an Investment Property is recognised in the Consolidated Statement of Profit and Loss.
j. Inventories
Inventories are measured at the lower of cost and net realisable value. However, materials and other items held for use in civil construction work and / or production of inventories are not written down below cost if the finished products in which they will be incorporated are expected to be sold at or above cost. The cost of inventories is based on the first-in first-out (“FIFO”) formula, and includes expenditure incurred in acquiring the inventories, production or conversion costs and other costs incurred in bringing them to their present location and condition.
In the case of manufactured inventories and work-in-progress, cost includes direct materials, labour, a proportion of manufacturing overheads based on normal operating capacity and excise duty. Cost is determined on FIFO basis. Trading goods are valued at lower of cost and net realizable value.
k. Project work in progress
Project work in progress represents uncertified inventory valued at contract rate pending final certification.
l. Impairment
i Impairment of financial instruments
The Group recognises loss allowances for expected credit losses on:
- financial assets measured at amortised cost; and
- financial assets measured at FVOCI- debt investments.
COR
PO
RATE O
VERVIEW
STATu
TOR
y REP
OR
TSFin
an
cial S
tatemen
tS
Annual Report 2017-18 139
G R Infraprojects Limited
for the year ended 31 March 2018
Notes to the Consolidated Financial Statements
At each reporting date, the Group assesses whether financial assets carried at amortised cost are credit-impaired. A financial asset is ‘credit-impaired’ when one or more events that have a detrimental impact on the estimated future cash flows of the financial asset have occurred.
Evidence that a financial asset is credit-impaired includes the following observable data:
- significant financial difficulty of the borrower or issuer;
- a breach of contract such as a default or being past due for 90 days or more;
- the restructuring of a loan or advance by the each entity in the Group on terms that such entity would not consider otherwise;
- it is probable that the borrower will enter bankruptcy or other financial reorganisation; or
- the disappearance of an active market for a security because of financial difficulties.
The Group measures loss allowances at an amount equal to lifetime expected credit losses, except for bank balances for which credit risk (i.e. the risk of default occurring over the expected life of the financial instrument) has not increased significantly since initial recognition, which are measured as 12 month expected credit losses.
Loss allowances for trade receivables are always measured at an amount equal to lifetime expected credit losses. Lifetime expected credit losses are the expected credit losses that result from all possible default events over the expected life of a financial instrument. Twelve months expected credit losses are the portion of expected credit losses that result from default events that are possible within 12 months after the reporting date (or a shorter period if the expected life of the instrument is less than 12 months).
In all cases, the maximum period considered when estimating expected credit losses is the maximum contractual period over which
the Group is exposed to credit risk. When determining whether the credit risk of a financial asset has increased significantly since initial recognition and when estimating expected credit losses, the Group considers reasonable and supportable information that is relevant and available without undue cost or effort. This includes both quantitative and qualitative information and analysis, based on the Group’s historical experience and informed credit assessment and including forward-looking information.
Measurement of expected credit losses
Expected credit losses are a probability-weighted estimate of credit losses. Credit losses are measured as the present value of all cash shortfalls (i.e. the difference between the cash flows due to the Group in accordance with the contract and the cash flows that the Group expects to receive).
Presentation of allowance for expected credit losses in the balance sheet.
Loss allowances for financial assets measured at amortised cost are deducted from the gross carrying amount of the assets.
ii Impairment of non-financial assets
The Group’s non-financial assets, other than inventories and deferred tax assets, are reviewed at each reporting date to determine whether there is any indication of impairment. If any such indication exists, then the asset’s recoverable amount is estimated.
For impairment testing, assets that do not generate independent cash inflows are grouped together into cash-generating units (CGUs). Each CGU represents the smallest group of assets that generates cash inflows that are largely independent of the cash inflows of other assets or CGUs.
The recoverable amount of a CGU (or an individual asset) is the higher of its value in use and its fair value less costs to sell. Value in use is based on the estimated future cash flows, discounted to their present value using a pre-tax discount rate that reflects current market assessments of the time value of money and the risks specific to the CGU (or the asset).
140
for the year ended 31 March 2018
Notes to the Consolidated Financial Statements
The Group’s corporate assets (e.g., central office building for providing support to various CGUs) do not generate independent cash inflows. To determine impairment of a corporate asset, recoverable amount is determined for the CGUs to which the corporate asset belongs.
An impairment loss is recognised if the carrying amount of an asset or CGU exceeds its estimated recoverable amount. Impairment losses are recognised in the statement of profit and loss. Impairment loss recognised in respect of a CGU is allocated first to reduce the carrying amount of any goodwill allocated to the CGU, and then to reduce the carrying amounts of the other assets of the CGU (or group of CGUs) on a pro rata basis.
In respect of other assets for which impairment loss has been recognised in prior periods, the Group reviews at each reporting date whether there is any indication that the loss has decreased or no longer exists. An impairment loss is reversed if there has been a change in the estimates used to determine the recoverable amount. Such a reversal is made only to the extent that the asset’s carrying amount does not exceed the carrying amount that would have been determined, net of depreciation or amortisation, if no impairment loss had been recognised.
m. Employee benefits
i Short-term employee benefits
Short-term employee benefit obligations are measured on an undiscounted basis and are expensed as the related service is provided. A liability is recognised for the amount expected to be paid, if the Group has a present legal or constructive obligation to pay this amount as a result of past service provided by the employee, and the amount of obligation can be estimated reliably.
ii Defined contribution plans
A defined contribution plan is a post-employment benefit plan under which an entity pays fixed contributions into a separate entity and will have no legal or constructive obligation to pay further amounts. The Group makes specified monthly contributions towards Government administered provident
fund scheme. Obligations for contributions to defined contribution plans are recognised as an employee benefit expense in consolidated statement of profit and loss in the periods during which the related services are rendered by employees.
Prepaid contributions are recognised as an asset to the extent that a cash refund or a reduction in future payments is available.
iii Defined benefit plans
A defined benefit plan is a post-employment benefit plan other than a defined contribution plan. The Group’s net obligation in respect of defined benefit plans is calculated separately for each plan by estimating the amount of future benefit that employees have earned in the current and prior periods, discounting that amount and deducting the fair value of any plan assets.
The calculation of defined benefit obligation is performed annually by a qualified actuary using the projected unit credit method. When the calculation results in a potential asset for the Group, the recognised asset is limited to the present value of economic benefits available in the form of any future refunds from the plan or reductions in future contributions to the plan (‘the asset ceiling’). In order to calculate the present value of economic benefits, consideration is given to any minimum funding requirements.
Remeasurements of the net defined benefit liability, which comprise actuarial gains and losses, the return on plan assets (excluding interest) and the effect of the asset ceiling (if any, excluding interest), are recognised in OCI. The Group determines the net interest expense (income) on the net defined benefit liability (asset) for the period by applying the discount rate used to measure the defined benefit obligation at the beginning of the annual period to the then-net defined benefit liability (asset), taking into account any changes in the net defined benefit liability (asset) during the period as a result of contributions and benefit payments. Net interest expense and other expenses related to defined benefit plans are recognised in consolidated statement of profit and loss.

COR
PO
RATE O
VERVIEW
STATu
TOR
y REP
OR
TSFin
an
cial S
tatemen
tS
Annual Report 2017-18 141
G R Infraprojects Limited
for the year ended 31 March 2018
Notes to the Consolidated Financial Statements
When the benefits of a plan are changed or when a plan is curtailed, the resulting change in benefit that relates to past service (‘past service cost’ or ‘past service gain’) or the gain or loss on curtailment is recognised immediately in profit or loss. The Group recognises gains and losses on the settlement of a defined benefit plan when the settlement occurs.
iv Other long-term employee benefits
The Group’s net obligation in respect of long-term employee benefits other than post-employment benefits is the amount of future benefit that employees have earned in return for their service in the current and prior periods; that benefit is discounted to determine its present value, and the fair value of any related assets is deducted. The obligation is measured on the basis of an annual independent actuarial valuation using the projected unit credit method. Remeasurements gains or losses are recognised in consolidated statement of profit and loss in the period in which they arise.
n. Provisions and contingencies (other than for employee benefits)
AA provision is recognised if, as a result of a past event, the Group has a present legal or constructive obligation that can be estimated reliably, and it is probable that an outflow of economic benefits will be required to settle the obligation. Provisions are determined by discounting the expected future cash flows (representing the best estimate of the expenditure required to settle the present obligation at the balance sheet date) at a pre-tax rate that reflects current market assessments of the time value of money and the risks specific to the liability.
The unwinding of the discount is recognised as finance cost. Expected future operating losses are not provided for.
Contingencies
Disclosure for a contingent liability is made when there is a possible obligation or a present obligation that may, but probably will not require an outflow of resources embodying economic benefits or the amount of such obligation cannot be measured reliably. When there is a possible obligation or a present obligation in respect of which likelihood of outflow of resources embodying economic benefits is remote, no provision or disclosure is made.
Provision for major maintenance
As per the Concession Agreement, the Group is obligated to carry out resurfacing of the roads under concession. The Group estimates the likely provision required towards resurfacing and accrues the cost on a straight line basis over the period at the end of which resurfacing would be required, in the consolidated statement of profit and loss in accordance with Ind AS 37 “Provisions, Contingent Liabilities and Contingent Assets.”
o. Revenue
i Sale of goods
Revenue from the sale of goods in the course of ordinary activities includes excise duty and is measured at the fair value of the consideration received or receivable, net of returns, trade discounts, volume rebates and taxes or duties collected on behalf of government. This inter alia involves discounting of the consideration due to the present value if payment extends beyond normal credit terms. Revenue is recognised when the significant risks and rewards of ownership have been transferred to the buyer, recovery of the consideration is probable, the associated costs and possible return of goods can be estimated reliably, there is no continuing effective control over, or managerial involvement with, the goods, and the amount of revenue can be measured reliably.
The timing of transfers of risks and rewards varies depending on the individual terms of sale.
ii Construction contracts
Contract revenue is recognised as revenue in the statement of profit and loss in the accounting periods in which the work is performed. Contract costs are recognised as an expense in the statement of profit and loss in the accounting periods in which the work to which they relate is performed. In the case of contracts with defined milestones and assigned price for each milestone, the Group recognises revenue on transfer of significant risks and rewards which coincides with achievement of milestone and its acceptance by its customer.
142
for the year ended 31 March 2018
Notes to the Consolidated Financial Statements
Contract revenue includes the initial amount agreed in the contract plus any variations in contract work and claims payments, to the extent that it is probable that they will result in revenue and can be measured reliably. The Group recognises bonus/ incentive revenue on early completion of the project based on the confirmation received from the customers.
If the outcome of a construction contract can be estimated reliably, contract revenue is recognised in consolidated statement of profit and loss in proportion to the stage of completion of the contract. The stage of completion is assessed by reference to surveys of work performed. Otherwise, contract revenue is recognised only to the extent of contract costs incurred that are likely to be recoverable.
Contract costs are recognised as expenses as incurred unless they create an asset related to future contract activity. An expected loss on a contract is recognised immediately in consolidated statement of profit and loss.
Revenue related to construction or upgrade services provided under a service concession arrangement is recognised based on the stage of completion of the work performed, consistent with the Group’s accounting policy on recognising revenue on construction contacts.
iii Income from service concession arrangements
The income from Toll Contracts on BOT basis is recognised on actual collection of toll revenue.
Build-Operate-Transfer (BOT) contracts on annuity basis under service concession arrangement contain three streams of revenue- Construction revenue, Financing income and Operations and maintenance (O&M) income. The construction stream of BOT revenues are accounted for in the construction phase of BOT, O&M income is recognised in the operating phase of the BOT, while finance income is recognised over a concession period based on the imputed interest method.
iv Accounting for real estate transactions
The Group is following the “Percentage of Completion Method” of accounting. As per this method, revenue from sale of properties is recognised in statement of profit and loss
in proportion to the actual cost incurred as against the total estimated cost of the project under execution with the Group on transfer of significant risk and rewards to the buyer.
In accordance with “Guidance Note on Accounting for Real Estate Transactions” (for entities to whom Ind AS is applicable) issued by the Institute of Chartered Accountants of India in May 2016, construction revenue on such projects, measured at fair value (i.e. adjusted for discount, incentives and time value of money adjustments etc.), has been recognised by applying percentage of completion method provided following thresholds have been met:
a) all critical approvals necessary for commencement of project have been obtained;
b) when the stage of completion of the project reaches a reasonable level of development. A reasonable level of development is not achieved if the expenditure incurred on project construction and development cost is not less than 25% of the total estimated project construction and development costs. Such cost would exclude land costs but include borrowing costs;
c) at least 25% of the saleable project area is secured by contracts/agreements with buyers; and
d) at least 10% of the contracts consideration as per agreement of the sale or any other enforceable documents are realised at the reporting date in respect of each of the contracts and it is reasonable to expect that parties to such contracts will comply with the payment terms.
v Job work
Job work income is recognised when the services are rendered and there are no uncertainties involved to its ultimate realization.
p. Leases
i Assets held under lease
Leases of property, plant and equipment that transfer substantially all the risks and rewards of ownership are classified as finance leases. All the other leases are classified as operating
COR
PO
RATE O
VERVIEW
STATu
TOR
y REP
OR
TSFin
an
cial S
tatemen
tS
Annual Report 2017-18 143
G R Infraprojects Limited
for the year ended 31 March 2018
Notes to the Consolidated Financial Statements
leases. For finance leases, the leased assets are measured initially at an amount equal to the lower of their fair value and the present value of the minimum lease payments. Subsequent to initial recognition, the assets are accounted for in accordance with the accounting policy applicable to similar owned assets.
Assets held under operating leases are neither recognised in (in case the Group is lessee) nor derecognised (in case the Group is lessor) from the Group’s Balance Sheet.
ii Lease payments
Payments made under operating leases are generally recognised in consolidated statement of profit and loss on a straight-line basis over the term of the lease unless such payments are structured to increase in line with expected general inflation to compensate for the lessor’s expected inflationary cost increases. Lease incentives received are recognised as an integral part of the total lease expense over the term of the lease.
iii Assets given on lease
In respect of assets provided on finance leases, amounts due from lessees are recorded as receivables at the amount of the Group’s net investment in the leases. Finance lease income is allocated to accounting periods so as to reflect a constant periodic rate of return on the Group’s net investment outstanding in respect of the leases. In respect of assets given on operating lease, lease rentals are accounted on accrual basis in accordance with the respective lease agreements
q. Recognition of dividend income, interest income or expense
Dividend income is recognised in consolidated statement of profit and loss on the date on which the Group’s right to receive payment is established.
Interest income or expense is recognised using the effective interest method.
The ‘effective interest rate’ is the rate that exactly discounts estimated future cash payments or receipts through the expected life of the financial instrument to:
- the gross carrying amount of the financial asset; or
- the amortised cost of the financial liability.
r. Income tax
Income tax comprises of current and deferred tax. It is recognised in the consolidated statement of profit and loss except to the extent that it relates to an item recognised directly in equity or in OCI.
i Current tax
Current tax comprises of the expected tax payable or receivable on the taxable income or loss for the year and any adjustment to the tax payable or receivable in respect of previous years. The amount of current tax reflects the best estimate of the tax amount expected to be paid or received after considering the uncertainty, if any, related to income taxes. It is measured using tax rates (and tax laws) enacted or substantively enacted by the reporting date in the country where each company of Group operates and generates taxable income..
The Holding Company, being a Company providing infrastructure development / maintenance and operations services is eligible to claim deduction under Section 80 IA of the Income Tax Act, 1961 with respect to 100 % of the profits and gains derived from this business for the any ten consecutive assessment years out of fifteen years beginning from the year in which the undertaking or the enterprise develops and begins to operate any infrastructure facility. Accordingly, the Holding Company has opted for Tax Holiday Period from financial year 2014-15 and onwards.
Current tax assets and current tax liabilities are offset only if there is a legally enforceable right to set off the recognised amounts, and it is intended to realise the asset and settle the liability on a net basis or simultaneously.
ii Deferred tax
Deferred tax is recognised in respect of temporary differences between the carrying amounts of assets and liabilities for financial reporting purposes and the corresponding amounts used for taxation purposes. Deferred tax is also recognised in respect of carried forward tax losses and tax credits.
Minimum Alternate Tax (MAT) eligible for set-off in subsequent years (as per tax laws), is recognised as an asset by way of credit to the Consolidated Statement of Profit and Loss only
144
for the year ended 31 March 2018
Notes to the Consolidated Financial Statements
if there is convincing evidence that sufficient taxable profit will be available against which the unused tax losses or unused tax credits can be utilised by the Group. At each Balance Sheet date, the carrying amount of deferred tax in relation to MAT Credit Entitlement receivable is reviewed to reassure realization.
Deferred tax assets are recognised to the extent that it is probable that future taxable profits will be available against which they can be used. The existence of unused tax losses is strong evidence that future taxable profit may not be available. Therefore, in case of a history of recent losses, deferred tax asset is recognised only to the extent that it has sufficient taxable temporary differences or there is convincing other evidence that sufficient taxable profit will be available against which such deferred tax asset can be realised. Deferred tax assets –unrecognised or recognised, are reviewed at each reporting date and are recognised/ reduced to the extent that it is probable/ no longer probable respectively that the related tax benefit will be realised.
Deferred tax is measured at the tax rates that are expected to apply to the period when the asset is realised or the liability is settled, based on the laws that have been enacted or substantively enacted by the reporting date.
The measurement of deferred tax reflects the tax consequences that would follow from the manner in which the Group expects, at the reporting date, to recover or settle the carrying amount of its assets and liabilities.
Deferred tax assets and liabilities are offset if there is a legally enforceable right to offset current tax liabilities and assets, and they relate to income taxes levied by the same tax authority on the same taxable entity, or on different tax entities, but they intend to settle current tax liabilities and assets on a net basis or their tax assets and liabilities will be realised simultaneously.
Any tax credit available is recognised as deferred tax to the extent that it is probable that future taxable profit will be available against which the unused tax credit can be utilised. The said asset is created by way of credit to the
consolidated statement of profit and loss and shown under the head of deferred tax.
iii Presentation of current and deferred tax:
Current and deferred tax are recognised as income or an expense in the Statement of Profit and Loss, except when they relate to items that are recognised in Other Comprehensive Income, in which case, the current and deferred tax income/expense are recognised in Other Comprehensive Income.
The Group offsets current tax assets and current tax liabilities, where it has a legally enforceable right to set off the recognised amounts and where it intends either to settle on a net basis, or to realize the asset and settle the liability simultaneously. In case of deferred tax assets and deferred tax liabilities, the same are offset if the Group has a legally enforceable right to set off corresponding current tax assets against current tax liabilities and the deferred tax assets and deferred tax liabilities relate to income taxes levied by the same tax authority on the Group.
s. Borrowing cost
Borrowing costs are interest and other incurred in connection with the borrowing of funds. Borrowing costs directly attributable to acquisition or construction of an asset which necessarily take a substantial period of time to get ready for their intended use are capitalised as part of the cost of that asset. Other borrowing costs are recognised as an expense in the period in which they are incurred.
t. Earnings per share
Basic earnings per share is computed by dividing the net profit for the period attributable to the equity shareholders of the Group by the weighted average number of equity shares outstanding during the period. The weighted average number of equity shares outstanding during the period and for all periods presented is adjusted for events, such as bonus shares, other than the conversion of potential equity shares that have changed the number of equity shares outstanding, without a corresponding change in resources.
For the purpose of calculating diluted earnings per share, the net profit for the period attributable to equity shareholders and the weighted average
COR
PO
RATE O
VERVIEW
STATu
TOR
y REP
OR
TSFin
an
cial S
tatemen
tS
Annual Report 2017-18 145
G R Infraprojects Limited
for the year ended 31 March 2018
Notes to the Consolidated Financial Statements
number of shares outstanding during the period is adjusted for the effects of all dilutive potential equity shares.
In a capitalisation or bonus issue or a share split, ordinary shares are issued to existing shareholders for no additional consideration. The number of ordinary shares outstanding before the event is adjusted for the proportionate change in the number of ordinary shares outstanding as if the event had occurred at the beginning of the earliest period presented.
u. Operating segments
Operating segments are reported in a manner consistent with the internal reporting provided to the Chief Operating Decision Maker (CODM) of the each entity in the Group. The CODM is responsible for allocating resources and assessing performance of the operating segments of the Group.
v. Cash and cash equivalents
Cash and Cash equivalents for the purpose of Consolidated Cash Flow Statement comprise cash and cheques in hand, bank balances, demand deposits with banks where the original maturity is three months or less and other short term highly liquid investments.
w. Joint arrangements
Under Ind AS 111 Joint arrangements, investments in joint arrangements are classified as either joint operations or joint ventures. The classification depends on the contractual rights and obligations of each investor, rather than the legal structure of the joint arrangement. The Group has joint operations.
Joint operations
The Group recognises its direct right to the assets, liabilities, revenues and expenses of joint operations and its share of any jointly held or incurred assets, liabilities, revenues and expenses. These have been incorporated in the standalone financial statements under the appropriate headings. The details of joint operations are set out in note 42.
4. Recent accounting pronouncements Standards issued but not yet effective
On 28 March 2018, Ministry of Corporate Affairs (MCA) has notified new standards and amendments to existing
standards. These amendments are effective for annual periods beginning after 1 April 2018.
Ind AS 115 Revenue from contract with customers
Ind AS 115 establishes a comprehensive framework for determining whether, how much and when revenue is recognized. It replaces existing revenue recognition guidance, including Ind AS 18 Revenue and Ins AS 11 Construction Contracts. The core principle of the new standard that an entity should recognize revenue to depict the transfer of promised goods or services to customers in an amount that reflects the consideration to which the entity expects to be entitled in exchange for those goods or services. Further, the new standard requires enhanced disclosures about the nature, amount, timing and uncertainty of revenue and cash flows arising from the entity’s contracts with customers.
This Standard permits two possible methods of transition i.e. retrospective approach and modified retrospective method.
The Group is in the process of evaluating and identifying the key impacts along with transition options to be considered while transiting to Ind AS 115.
Amendments to existing Ind AS
The following amended standards are not expected to have a significant impact on the Group’s consolidated financial statements. This assessment is based on currently available information and may be subject to changes arising from further reasonable and supportable information being made available to the Group when it will adopt the respective standards.
• IndAS40-InvestmentProperty
The amendment lays down the principle regarding the transfer of asset to, or from, investment property.
• Ind AS 21 - The Effects of Changes in ForeignExchange Rates
The amendment lays down principles to determine the date of transaction when a Group recognizes a non-monetary prepayment asset or deferred income liability.
• IndAS12–IncomeTaxes
The amendments explains that determining temporary differences and estimating probable future taxable profit against which deductible temporary differences are assessed for utilization are two separate steps.
146
for the year ended 31 March 2018
Notes to the Consolidated Financial Statements
5 Property, plant and equipmentA. Reconciliation of carrying amount
(Currency: Indian ` in lakhs)
Particulars Land Building Plant andequipment
Vehicles Fixturesand fittings
Total
At Cost *
Balance at 1 April 2016 1,440.52 2,318.67 28,080.48 974.44 133.10 32,947.21
Additions 46.37 425.59 15,556.46 770.19 25.79 16,824.40
Adjustment (31.51) - - - - (31.51)
Disposals - - (693.04) (13.78) (0.56) (707.38)
Translation exchange differences - - (235.79) (41.55) (4.64) (281.98)
Balance at 31 March 2017 1,455.38 2,744.26 42,708.11 1,689.30 153.69 48,750.74
Balance at 1 April 2017 1,455.38 2,744.26 42,708.11 1,689.30 153.69 48,750.74
Additions 149.80 240.08 30,199.40 1,209.88 94.38 31,893.54
Disposals - (184.05) (587.10) (29.34) - (800.49)
Translation exchange differences - - (54.06) (17.57) (0.89) (72.52)
Balance at 31 March 2018 1,605.18 2,800.29 72,266.35 2,852.27 247.18 79,771.27
(Currency: Indian ` in lakhs)
Particulars Land Building Plant andequipment
Vehicles Fixturesand fittings
Total
Accumulated depreciation
Balance at 1 April 2016 - 332.53 3,886.40 181.01 30.01 4,429.95
Depreciation for the year - 213.13 5,858.11 362.35 32.44 6,466.03
Disposals - - (215.03) (4.68) (0.12) (219.83)
Translation exchange differences - - (78.14) (11.98) (1.97) (92.09)
Balance at 31 March 2017 - 545.66 9,451.34 526.70 60.36 10,584.06
Balance at 1 April 2017 - 545.66 9,451.34 526.70 60.36 10,584.06
Depreciation for the year - 174.95 7,571.72 485.06 31.59 8,263.32
Disposals - (25.74) (230.72) (16.78) - (273.24)
Translation exchange differences - - (41.86) (7.37) (0.80) (50.03)
Balance at 31 March 2018 - 694.87 16,750.48 987.61 91.15 18,524.11
Carrying amounts (net)
At 1 April 2016 1,440.52 1,986.14 24,194.08 793.43 103.09 28,517.26
At 31 March 2017 1,455.38 2,198.60 33,256.77 1,162.60 93.33 38,166.68
At 31 March 2018 1,605.18 2,105.42 55,515.87 1,864.66 156.03 61,247.16
B. Security
Refer note 20 and 22 for the property, plant and equipment which are subject to charge.
C. Commitments
For capital commitments made by the Group as at the balance sheet date, see note 42.

COR
PO
RATE O
VERVIEW
STATu
TOR
y REP
OR
TSFin
an
cial S
tatemen
tS
Annual Report 2017-18 147
G R Infraprojects Limited
for the year ended 31 March 2018
Notes to the Consolidated Financial Statements
6 Capital work-in-progress Reconciliation of carrying amount
(Currency: Indian ` in lakhs)
Particulars Capital Work- in-progress
Cost (gross carrying amount)Balance at 1 April 2016 2,811.78
Additions 5,931.13
Adjustment 31.51
Assets capitalised during the year (7,098.44)
Balance at 31 March 2017 1,675.98Balance at 1 April 2017 1,675.98
Additions 4,249.55
Assets capitalised during the year (1,175.00)
Balance at 31 March 2018 4,750.53
Carrying amounts (net)At 1 April 2016 2,811.78
At 31 March 2017 1,675.98
At 31 March 2018 4,750.53
Capital work-in-progress
The Group has acquired various assets at various locations, which are not ready for intended use by management as at reporting date. These assets includes various items of plant and machinery and vehicles. Borrowing costs are capitalised in case of a qualifying asset in accordance with Ind AS 23 “Borrowing costs”.
7 Investment Property
(Currency: Indian ` in lakhs)
Particulars Freehold Land Buildings Total
At CostBalance at 1 April 2016 40.85 14.14 54.99Additions - - -Disposals (14.14) (14.14)Derecognition on account of loss of control on disposal of subsidiary
(21.19) - (21.19)
Balance at 31 March 2017 19.66 - 19.66Balance at 1 April 2017 19.66 - 19.66Additions - - -Disposals - - -Balance at 31 March 2018 19.66 - 19.66
Accumulated depreciationBalance at 1 April 2016 - - -Depreciation for the year - - -Disposals - - -Balance at 31 March 2017 - - -Balance at 1 April 2017 - - -Depreciation for the year - - -Disposals - - -Balance at 31 March 2018 - - -
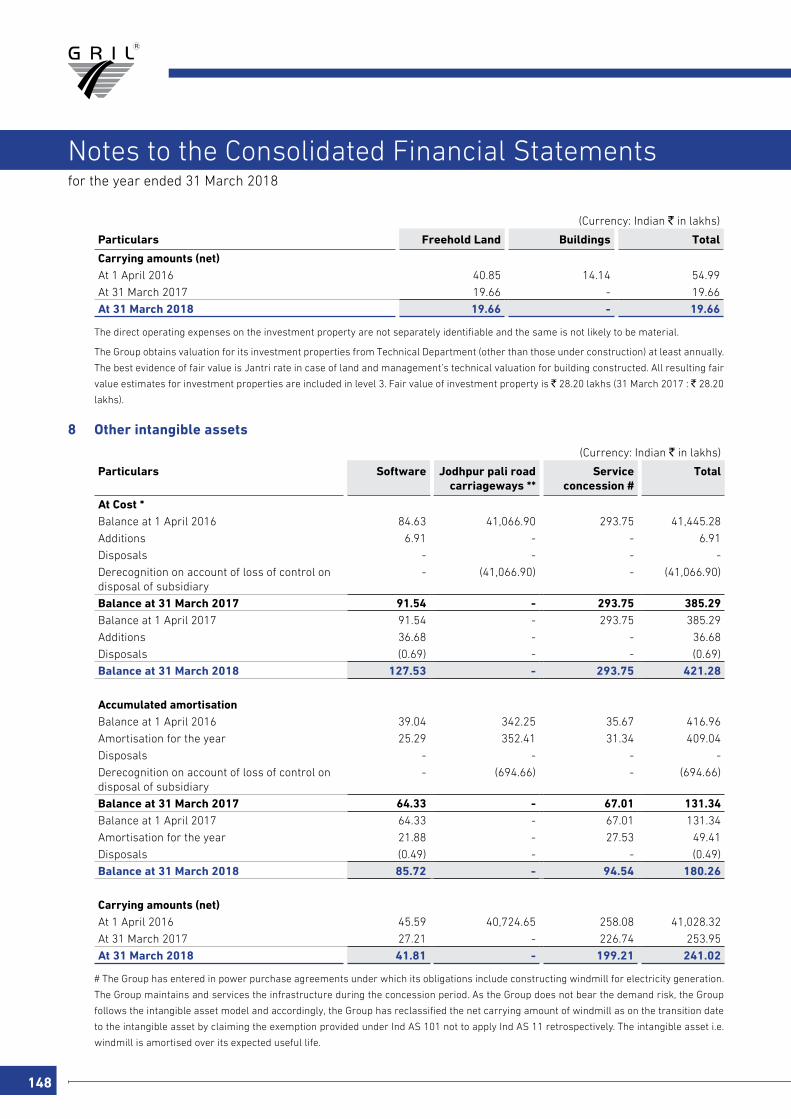
148
for the year ended 31 March 2018
Notes to the Consolidated Financial Statements
(Currency: Indian ` in lakhs)
Particulars Freehold Land Buildings Total
Carrying amounts (net)At 1 April 2016 40.85 14.14 54.99
At 31 March 2017 19.66 - 19.66
At 31 March 2018 19.66 - 19.66
The direct operating expenses on the investment property are not separately identifiable and the same is not likely to be material.
The Group obtains valuation for its investment properties from Technical Department (other than those under construction) at least annually.
The best evidence of fair value is Jantri rate in case of land and management’s technical valuation for building constructed. All resulting fair
value estimates for investment properties are included in level 3. Fair value of investment property is ` 28.20 lakhs (31 March 2017 : ` 28.20
lakhs).
8 Other intangible assets
(Currency: Indian ` in lakhs)
Particulars Software Jodhpur pali road carriageways **
Service concession #
Total
At Cost *Balance at 1 April 2016 84.63 41,066.90 293.75 41,445.28
Additions 6.91 - - 6.91
Disposals - - - -
Derecognition on account of loss of control on disposal of subsidiary
- (41,066.90) - (41,066.90)
Balance at 31 March 2017 91.54 - 293.75 385.29Balance at 1 April 2017 91.54 - 293.75 385.29
Additions 36.68 - - 36.68
Disposals (0.69) - - (0.69)
Balance at 31 March 2018 127.53 - 293.75 421.28
Accumulated amortisationBalance at 1 April 2016 39.04 342.25 35.67 416.96
Amortisation for the year 25.29 352.41 31.34 409.04
Disposals - - - -
Derecognition on account of loss of control on disposal of subsidiary
- (694.66) - (694.66)
Balance at 31 March 2017 64.33 - 67.01 131.34Balance at 1 April 2017 64.33 - 67.01 131.34
Amortisation for the year 21.88 - 27.53 49.41
Disposals (0.49) - - (0.49)
Balance at 31 March 2018 85.72 - 94.54 180.26
Carrying amounts (net)At 1 April 2016 45.59 40,724.65 258.08 41,028.32
At 31 March 2017 27.21 - 226.74 253.95
At 31 March 2018 41.81 - 199.21 241.02
# The Group has entered in power purchase agreements under which its obligations include constructing windmill for electricity generation.
The Group maintains and services the infrastructure during the concession period. As the Group does not bear the demand risk, the Group
follows the intangible asset model and accordingly, the Group has reclassified the net carrying amount of windmill as on the transition date
to the intangible asset by claiming the exemption provided under Ind AS 101 not to apply Ind AS 11 retrospectively. The intangible asset i.e.
windmill is amortised over its expected useful life.

COR
PO
RATE O
VERVIEW
STATu
TOR
y REP
OR
TSFin
an
cial S
tatemen
tS
Annual Report 2017-18 149
G R Infraprojects Limited
for the year ended 31 March 2018
Notes to the Consolidated Financial Statements
** The Toll colection rights pertain to service concession agreement entered into for construction and development of road by Jodhpur Pali
Expressway Limited (‘JPEL’), an earstwhile subsidiary of the Holding Company On 30 March 2017, the Holding company has disposed off
investment in its subsidiary company, JPEL, except 12% (approx.) equity shares which will be disposed off on receipt of final completion
certificate for underlying projects in the subsidiary company. During the current year, the Holding Company has sold these balance shares.
9 Investments
(Currency: Indian ` in lakhs)
Particulars 31 March 2018 31 March 2017
A Non-current investmentsQuoted - Equity investments [refer note A(i)] 117.39 105.45
- Mutual funds [refer note A(ii)] 42.61 37.26
- Corporate bonds [refer note A(iii)] 50.00 50.00
Total non-current investments 210.00 192.71B Current investments
Unquoted - Equity investments [refer note B(i)] - 1,263.90
Quoted - Mutual funds [refer note B(ii)] 7,733.38 13,601.80
Total current investments 7,733.38 14,865.70Total investments 7,943.38 15,058.41
(Currency: Indian ` in lakhs)
Particulars 31 March 2018 31 March 2017
A Non-current investmentsQuoted
(i) Equity investments at FVOCIConsidered goodDLF Limited 1.01 0.74
Housing Development and Infrastructure Limited 0.05 0.10
Unitech Limited 0.01 0.01
BGR Energy Systems Limited 0.29 0.39
Linde India Limited 0.88 0.80
BSEL Infrastructure Reality Limited 0.01 0.01
Canara Bank 7.93 9.09
Canfin Homes Limited 38.80 33.86
Edelweiss Financial Services Limited 7.34 4.86
Gammon India Limited ^ 0.00 0.00
GMR Infrastructure Limited 0.03 0.03
GVK Power and Infrastructure Limited 0.03 0.01
Havells India Limited 24.39 23.41
HDFC Bank Limited 18.91 14.42
Hindustan Constrction Co. Limited 0.04 0.08
Hotel Leela Venture Limited 0.17 0.16
Jaiprakash Associates Limited 0.03 0.02
Kolte-Patil Developers Limited 0.77 0.47
Larsen and Toubro Limited 1.97 2.37
Adani Ports and Special Economic Zone Limited 2.64 2.53
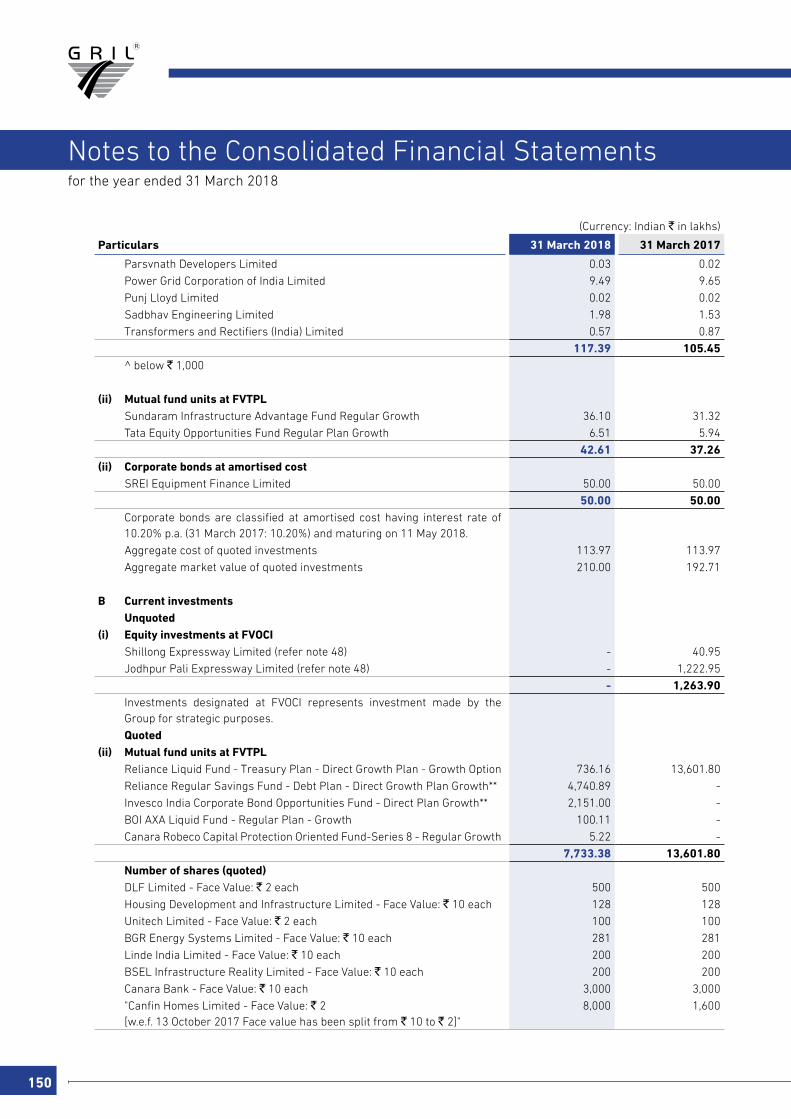
150
for the year ended 31 March 2018
Notes to the Consolidated Financial Statements
(Currency: Indian ` in lakhs)
Particulars 31 March 2018 31 March 2017
Parsvnath Developers Limited 0.03 0.02
Power Grid Corporation of India Limited 9.49 9.65
Punj Lloyd Limited 0.02 0.02
Sadbhav Engineering Limited 1.98 1.53
Transformers and Rectifiers (India) Limited 0.57 0.87
117.39 105.45^ below ` 1,000
(ii) Mutual fund units at FVTPLSundaram Infrastructure Advantage Fund Regular Growth 36.10 31.32
Tata Equity Opportunities Fund Regular Plan Growth 6.51 5.94
42.61 37.26(ii) Corporate bonds at amortised cost
SREI Equipment Finance Limited 50.00 50.00
50.00 50.00Corporate bonds are classified at amortised cost having interest rate of 10.20% p.a. (31 March 2017: 10.20%) and maturing on 11 May 2018.
Aggregate cost of quoted investments 113.97 113.97
Aggregate market value of quoted investments 210.00 192.71
B Current investmentsUnquoted
(i) Equity investments at FVOCIShillong Expressway Limited (refer note 48) - 40.95
Jodhpur Pali Expressway Limited (refer note 48) - 1,222.95
- 1,263.90Investments designated at FVOCI represents investment made by the Group for strategic purposes.
Quoted(ii) Mutual fund units at FVTPL
Reliance Liquid Fund - Treasury Plan - Direct Growth Plan - Growth Option 736.16 13,601.80
Reliance Regular Savings Fund - Debt Plan - Direct Growth Plan Growth** 4,740.89 -
Invesco India Corporate Bond Opportunities Fund - Direct Plan Growth** 2,151.00 -
BOI AXA Liquid Fund - Regular Plan - Growth 100.11 -
Canara Robeco Capital Protection Oriented Fund-Series 8 - Regular Growth 5.22 -
7,733.38 13,601.80Number of shares (quoted)DLF Limited - Face Value: ` 2 each 500 500
Housing Development and Infrastructure Limited - Face Value: ` 10 each 128 128
Unitech Limited - Face Value: ` 2 each 100 100
BGR Energy Systems Limited - Face Value: ` 10 each 281 281
Linde India Limited - Face Value: ` 10 each 200 200
BSEL Infrastructure Reality Limited - Face Value: ` 10 each 200 200
Canara Bank - Face Value: ` 10 each 3,000 3,000
"Canfin Homes Limited - Face Value: ` 2 [w.e.f. 13 October 2017 Face value has been split from ` 10 to ` 2]"
8,000 1,600
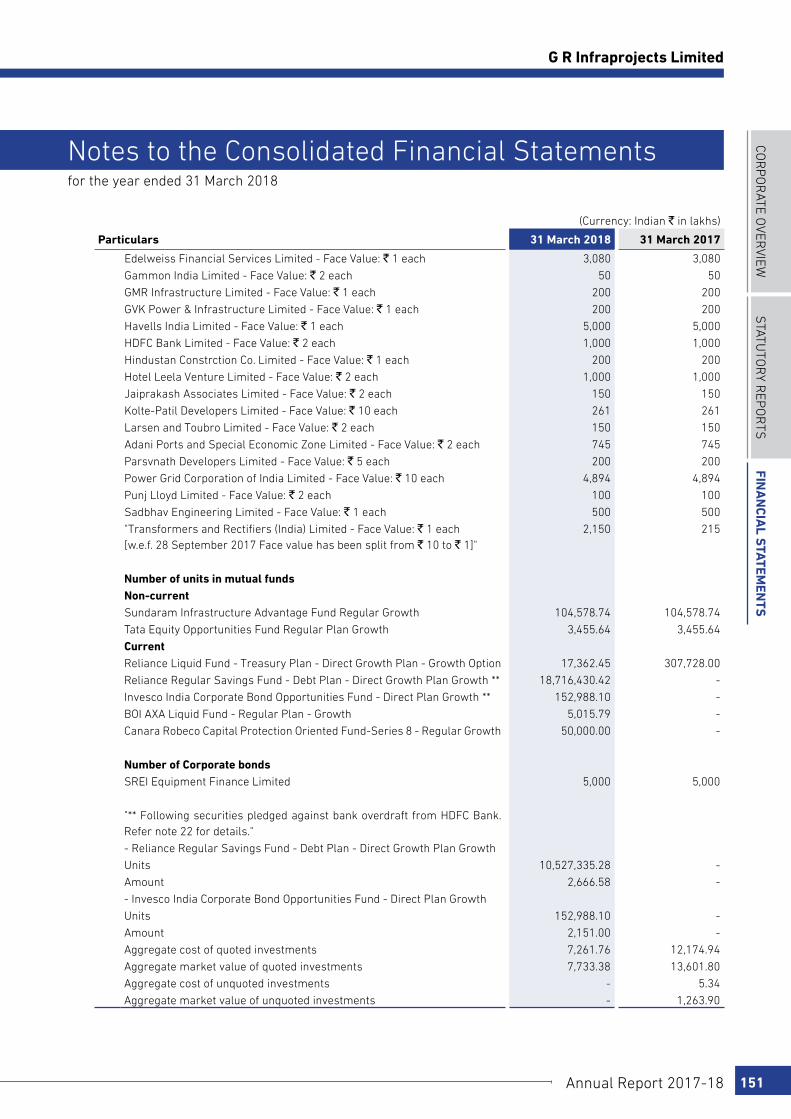
COR
PO
RATE O
VERVIEW
STATu
TOR
y REP
OR
TSFin
an
cial S
tatemen
tS
Annual Report 2017-18 151
G R Infraprojects Limited
for the year ended 31 March 2018
Notes to the Consolidated Financial Statements
(Currency: Indian ` in lakhs)
Particulars 31 March 2018 31 March 2017
Edelweiss Financial Services Limited - Face Value: ` 1 each 3,080 3,080
Gammon India Limited - Face Value: ` 2 each 50 50
GMR Infrastructure Limited - Face Value: ` 1 each 200 200
GVK Power & Infrastructure Limited - Face Value: ` 1 each 200 200
Havells India Limited - Face Value: ` 1 each 5,000 5,000
HDFC Bank Limited - Face Value: ` 2 each 1,000 1,000
Hindustan Constrction Co. Limited - Face Value: ` 1 each 200 200
Hotel Leela Venture Limited - Face Value: ` 2 each 1,000 1,000
Jaiprakash Associates Limited - Face Value: ` 2 each 150 150
Kolte-Patil Developers Limited - Face Value: ` 10 each 261 261
Larsen and Toubro Limited - Face Value: ` 2 each 150 150
Adani Ports and Special Economic Zone Limited - Face Value: ` 2 each 745 745
Parsvnath Developers Limited - Face Value: ` 5 each 200 200
Power Grid Corporation of India Limited - Face Value: ` 10 each 4,894 4,894
Punj Lloyd Limited - Face Value: ` 2 each 100 100
Sadbhav Engineering Limited - Face Value: ` 1 each 500 500
"Transformers and Rectifiers (India) Limited - Face Value: ` 1 each [w.e.f. 28 September 2017 Face value has been split from ` 10 to ` 1]"
2,150 215
Number of units in mutual fundsNon-currentSundaram Infrastructure Advantage Fund Regular Growth 104,578.74 104,578.74
Tata Equity Opportunities Fund Regular Plan Growth 3,455.64 3,455.64
CurrentReliance Liquid Fund - Treasury Plan - Direct Growth Plan - Growth Option 17,362.45 307,728.00
Reliance Regular Savings Fund - Debt Plan - Direct Growth Plan Growth ** 18,716,430.42 -
Invesco India Corporate Bond Opportunities Fund - Direct Plan Growth ** 152,988.10 -
BOI AXA Liquid Fund - Regular Plan - Growth 5,015.79 -
Canara Robeco Capital Protection Oriented Fund-Series 8 - Regular Growth 50,000.00 -
Number of Corporate bondsSREI Equipment Finance Limited 5,000 5,000
"** Following securities pledged against bank overdraft from HDFC Bank. Refer note 22 for details."
- Reliance Regular Savings Fund - Debt Plan - Direct Growth Plan Growth
Units 10,527,335.28 -
Amount 2,666.58 -
- Invesco India Corporate Bond Opportunities Fund - Direct Plan Growth
Units 152,988.10 -
Amount 2,151.00 -
Aggregate cost of quoted investments 7,261.76 12,174.94
Aggregate market value of quoted investments 7,733.38 13,601.80
Aggregate cost of unquoted investments - 5.34
Aggregate market value of unquoted investments - 1,263.90
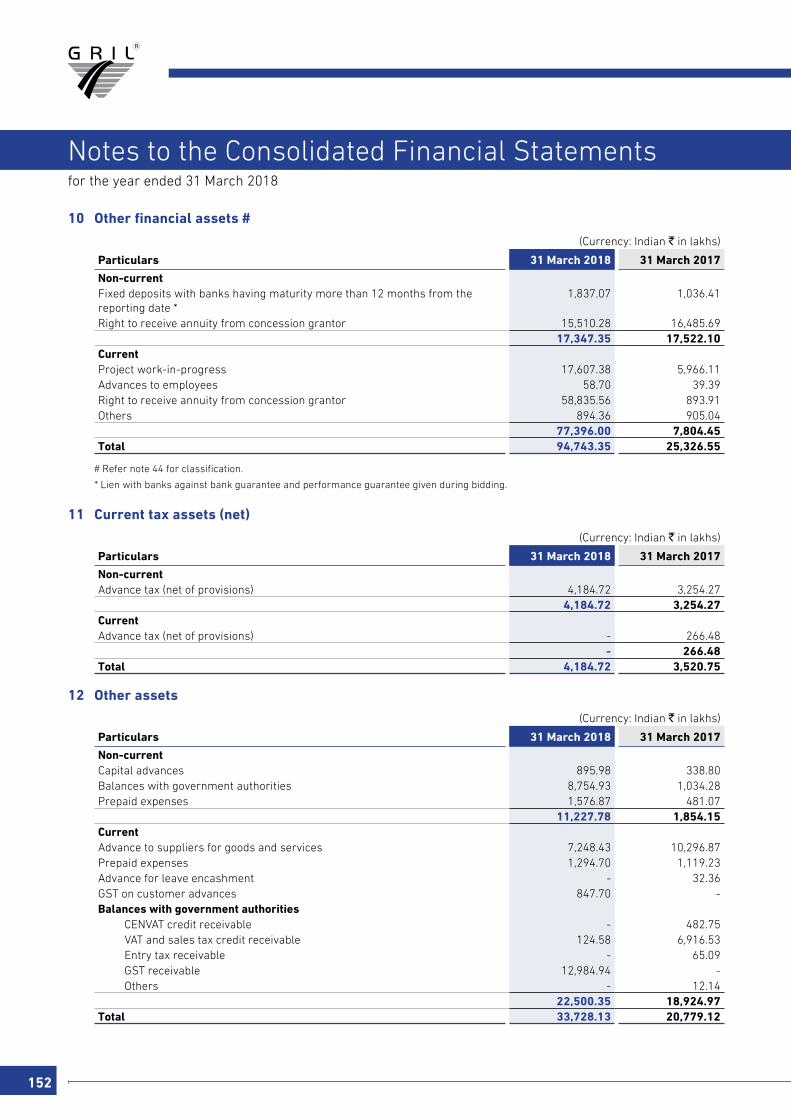
152
for the year ended 31 March 2018
Notes to the Consolidated Financial Statements
10 Other financial assets #
(Currency: Indian ` in lakhs)
Particulars 31 March 2018 31 March 2017
Non-currentFixed deposits with banks having maturity more than 12 months from the reporting date *
1,837.07 1,036.41
Right to receive annuity from concession grantor 15,510.28 16,485.6917,347.35 17,522.10
CurrentProject work-in-progress 17,607.38 5,966.11Advances to employees 58.70 39.39Right to receive annuity from concession grantor 58,835.56 893.91Others 894.36 905.04
77,396.00 7,804.45Total 94,743.35 25,326.55
# Refer note 44 for classification.
* Lien with banks against bank guarantee and performance guarantee given during bidding.
11 Current tax assets (net)
(Currency: Indian ` in lakhs)
Particulars 31 March 2018 31 March 2017
Non-currentAdvance tax (net of provisions) 4,184.72 3,254.27
4,184.72 3,254.27 CurrentAdvance tax (net of provisions) - 266.48
- 266.48 Total 4,184.72 3,520.75
12 Other assets
(Currency: Indian ` in lakhs)
Particulars 31 March 2018 31 March 2017
Non-currentCapital advances 895.98 338.80Balances with government authorities 8,754.93 1,034.28Prepaid expenses 1,576.87 481.07
11,227.78 1,854.15CurrentAdvance to suppliers for goods and services 7,248.43 10,296.87Prepaid expenses 1,294.70 1,119.23Advance for leave encashment - 32.36GST on customer advances 847.70 -Balances with government authorities
CENVAT credit receivable - 482.75VAT and sales tax credit receivable 124.58 6,916.53Entry tax receivable - 65.09GST receivable 12,984.94 -Others - 12.14
22,500.35 18,924.97Total 33,728.13 20,779.12
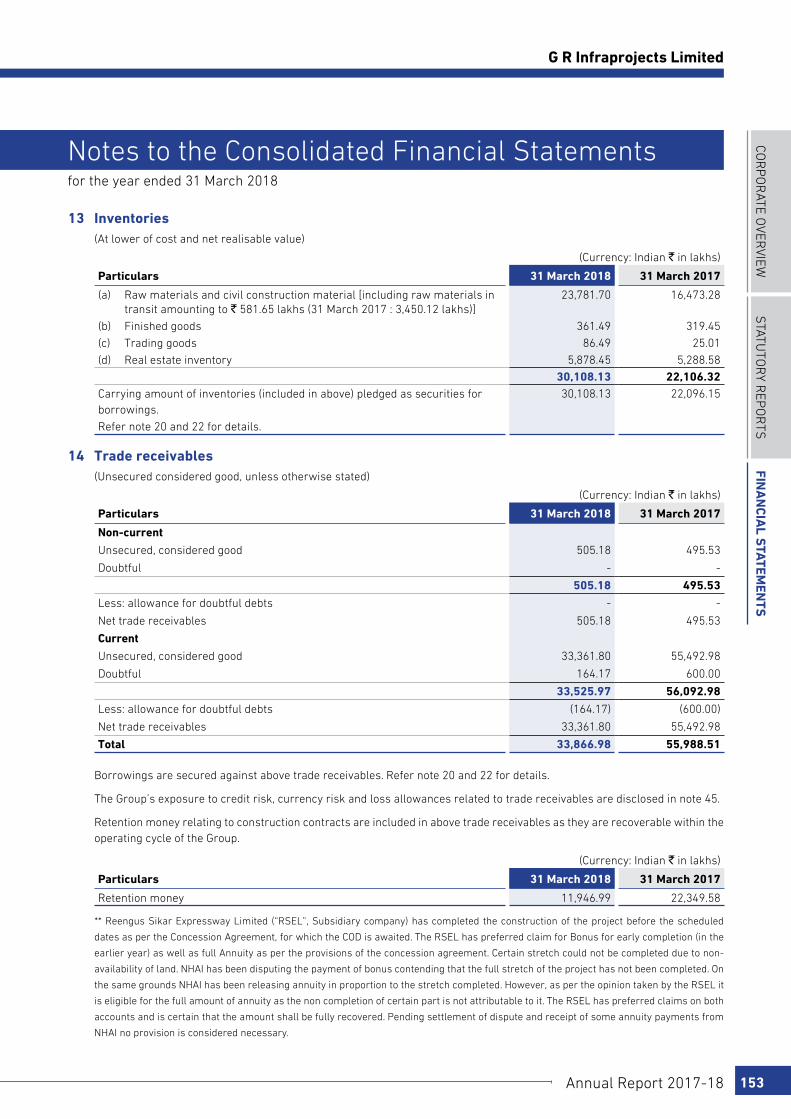
COR
PO
RATE O
VERVIEW
STATu
TOR
y REP
OR
TSFin
an
cial S
tatemen
tS
Annual Report 2017-18 153
G R Infraprojects Limited
for the year ended 31 March 2018
Notes to the Consolidated Financial Statements
13 Inventories (At lower of cost and net realisable value)
(Currency: Indian ` in lakhs)
Particulars 31 March 2018 31 March 2017
(a) Raw materials and civil construction material [including raw materials in transit amounting to ` 581.65 lakhs (31 March 2017 : 3,450.12 lakhs)]
23,781.70 16,473.28
(b) Finished goods 361.49 319.45
(c) Trading goods 86.49 25.01
(d) Real estate inventory 5,878.45 5,288.58
30,108.13 22,106.32 Carrying amount of inventories (included in above) pledged as securities for borrowings.
30,108.13 22,096.15
Refer note 20 and 22 for details.
14 Trade receivables (Unsecured considered good, unless otherwise stated)
(Currency: Indian ` in lakhs)
Particulars 31 March 2018 31 March 2017
Non-current
Unsecured, considered good 505.18 495.53
Doubtful - -
505.18 495.53
Less: allowance for doubtful debts - -
Net trade receivables 505.18 495.53
Current
Unsecured, considered good 33,361.80 55,492.98
Doubtful 164.17 600.00
33,525.97 56,092.98
Less: allowance for doubtful debts (164.17) (600.00)
Net trade receivables 33,361.80 55,492.98
Total 33,866.98 55,988.51
Borrowings are secured against above trade receivables. Refer note 20 and 22 for details.
The Group’s exposure to credit risk, currency risk and loss allowances related to trade receivables are disclosed in note 45.
Retention money relating to construction contracts are included in above trade receivables as they are recoverable within the operating cycle of the Group.
(Currency: Indian ` in lakhs)
Particulars 31 March 2018 31 March 2017
Retention money 11,946.99 22,349.58
** Reengus Sikar Expressway Limited (“RSEL”, Subsidiary company) has completed the construction of the project before the scheduled
dates as per the Concession Agreement, for which the COD is awaited. The RSEL has preferred claim for Bonus for early completion (in the
earlier year) as well as full Annuity as per the provisions of the concession agreement. Certain stretch could not be completed due to non-
availability of land. NHAI has been disputing the payment of bonus contending that the full stretch of the project has not been completed. On
the same grounds NHAI has been releasing annuity in proportion to the stretch completed. However, as per the opinion taken by the RSEL it
is eligible for the full amount of annuity as the non completion of certain part is not attributable to it. The RSEL has preferred claims on both
accounts and is certain that the amount shall be fully recovered. Pending settlement of dispute and receipt of some annuity payments from
NHAI no provision is considered necessary.
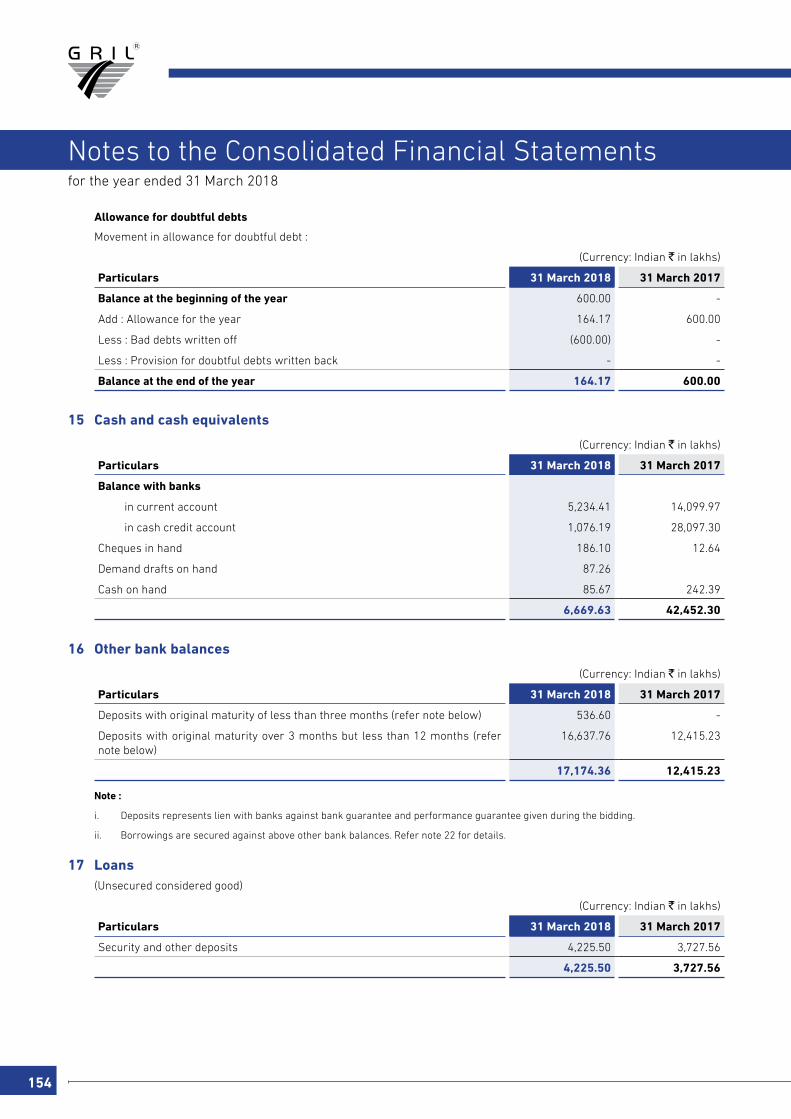
154
for the year ended 31 March 2018
Notes to the Consolidated Financial Statements
Allowance for doubtful debts
Movement in allowance for doubtful debt :
(Currency: Indian ` in lakhs)
Particulars 31 March 2018 31 March 2017
Balance at the beginning of the year 600.00 -
Add : Allowance for the year 164.17 600.00
Less : Bad debts written off (600.00) -
Less : Provision for doubtful debts written back - -
Balance at the end of the year 164.17 600.00
15 Cash and cash equivalents
(Currency: Indian ` in lakhs)
Particulars 31 March 2018 31 March 2017
Balance with banks
in current account 5,234.41 14,099.97
in cash credit account 1,076.19 28,097.30
Cheques in hand 186.10 12.64
Demand drafts on hand 87.26
Cash on hand 85.67 242.39
6,669.63 42,452.30
16 Other bank balances
(Currency: Indian ` in lakhs)
Particulars 31 March 2018 31 March 2017
Deposits with original maturity of less than three months (refer note below) 536.60 -
Deposits with original maturity over 3 months but less than 12 months (refer note below)
16,637.76 12,415.23
17,174.36 12,415.23
Note :
i. Deposits represents lien with banks against bank guarantee and performance guarantee given during the bidding.
ii. Borrowings are secured against above other bank balances. Refer note 22 for details.
17 Loans (Unsecured considered good)
(Currency: Indian ` in lakhs)
Particulars 31 March 2018 31 March 2017
Security and other deposits 4,225.50 3,727.56
4,225.50 3,727.56
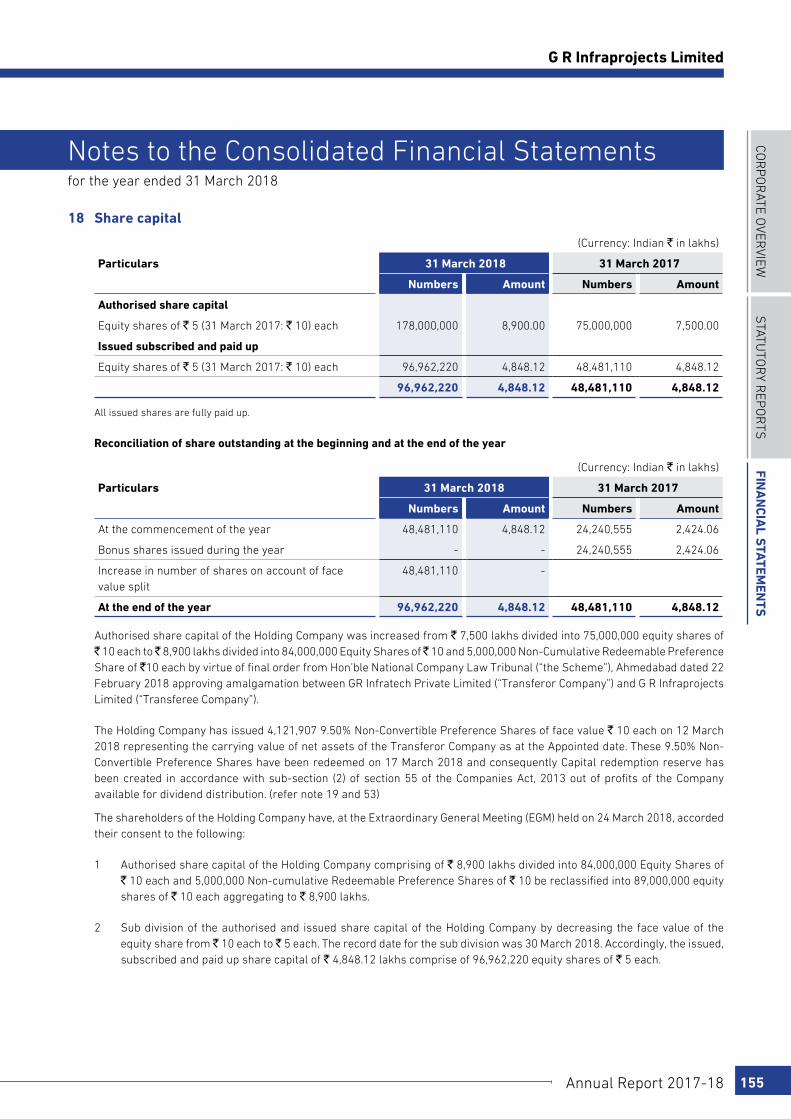
COR
PO
RATE O
VERVIEW
STATu
TOR
y REP
OR
TSFin
an
cial S
tatemen
tS
Annual Report 2017-18 155
G R Infraprojects Limited
for the year ended 31 March 2018
Notes to the Consolidated Financial Statements
18 Share capital
(Currency: Indian ` in lakhs)
Particulars 31 March 2018 31 March 2017
Numbers Amount Numbers Amount
Authorised share capital
Equity shares of ` 5 (31 March 2017: ` 10) each 178,000,000 8,900.00 75,000,000 7,500.00
Issued subscribed and paid up
Equity shares of ` 5 (31 March 2017: ` 10) each 96,962,220 4,848.12 48,481,110 4,848.12
96,962,220 4,848.12 48,481,110 4,848.12
All issued shares are fully paid up.
Reconciliation of share outstanding at the beginning and at the end of the year
(Currency: Indian ` in lakhs)
Particulars 31 March 2018 31 March 2017
Numbers Amount Numbers Amount
At the commencement of the year 48,481,110 4,848.12 24,240,555 2,424.06
Bonus shares issued during the year - - 24,240,555 2,424.06
Increase in number of shares on account of face value split
48,481,110 -
At the end of the year 96,962,220 4,848.12 48,481,110 4,848.12
Authorised share capital of the Holding Company was increased from ` 7,500 lakhs divided into 75,000,000 equity shares of ` 10 each to ̀ 8,900 lakhs divided into 84,000,000 Equity Shares of ̀ 10 and 5,000,000 Non-Cumulative Redeemable Preference Share of `10 each by virtue of final order from Hon’ble National Company Law Tribunal (“the Scheme”), Ahmedabad dated 22 February 2018 approving amalgamation between GR Infratech Private Limited (“Transferor Company”) and G R Infraprojects Limited (“Transferee Company”).
The Holding Company has issued 4,121,907 9.50% Non-Convertible Preference Shares of face value ` 10 each on 12 March 2018 representing the carrying value of net assets of the Transferor Company as at the Appointed date. These 9.50% Non-Convertible Preference Shares have been redeemed on 17 March 2018 and consequently Capital redemption reserve has been created in accordance with sub-section (2) of section 55 of the Companies Act, 2013 out of profits of the Company available for dividend distribution. (refer note 19 and 53)
The shareholders of the Holding Company have, at the Extraordinary General Meeting (EGM) held on 24 March 2018, accorded their consent to the following:
1 Authorised share capital of the Holding Company comprising of ` 8,900 lakhs divided into 84,000,000 Equity Shares of ` 10 each and 5,000,000 Non-cumulative Redeemable Preference Shares of ` 10 be reclassified into 89,000,000 equity shares of ` 10 each aggregating to ` 8,900 lakhs.
2 Sub division of the authorised and issued share capital of the Holding Company by decreasing the face value of the equity share from ̀ 10 each to ̀ 5 each. The record date for the sub division was 30 March 2018. Accordingly, the issued, subscribed and paid up share capital of ` 4,848.12 lakhs comprise of 96,962,220 equity shares of ` 5 each.
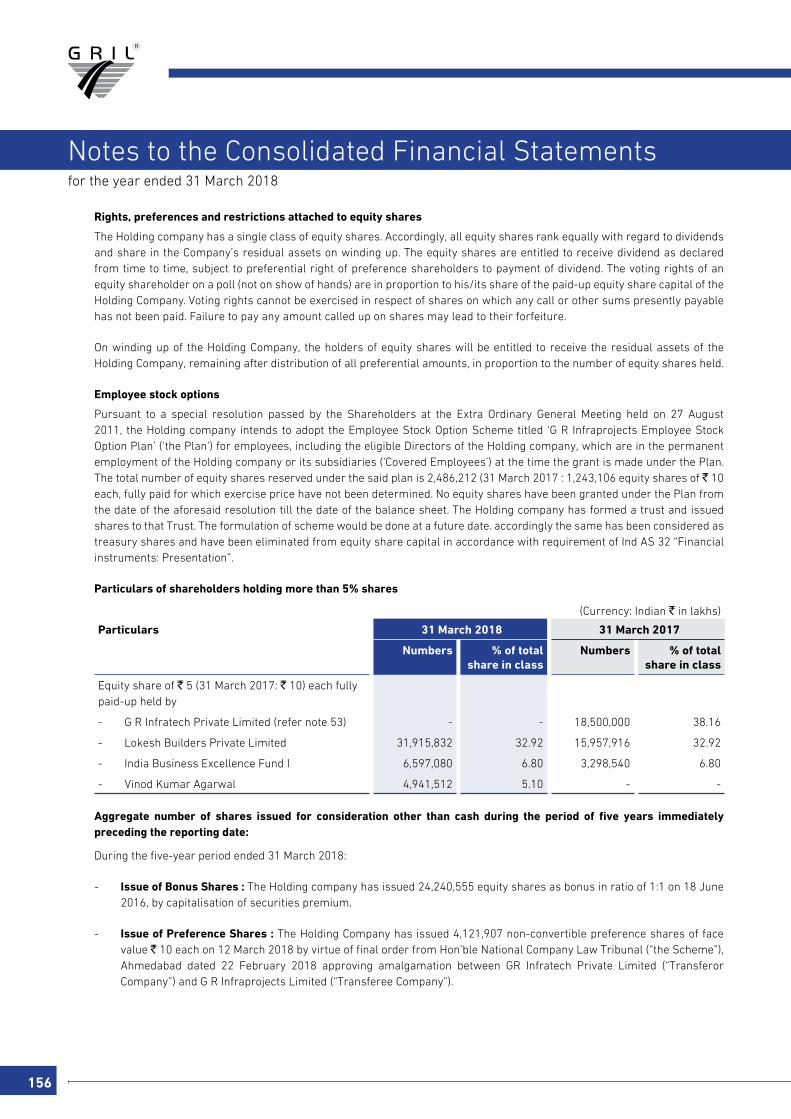
156
for the year ended 31 March 2018
Notes to the Consolidated Financial Statements
Rights, preferences and restrictions attached to equity shares
The Holding company has a single class of equity shares. Accordingly, all equity shares rank equally with regard to dividends and share in the Company’s residual assets on winding up. The equity shares are entitled to receive dividend as declared from time to time, subject to preferential right of preference shareholders to payment of dividend. The voting rights of an equity shareholder on a poll (not on show of hands) are in proportion to his/its share of the paid-up equity share capital of the Holding Company. Voting rights cannot be exercised in respect of shares on which any call or other sums presently payable has not been paid. Failure to pay any amount called up on shares may lead to their forfeiture.
On winding up of the Holding Company, the holders of equity shares will be entitled to receive the residual assets of the Holding Company, remaining after distribution of all preferential amounts, in proportion to the number of equity shares held.
Employee stock options
Pursuant to a special resolution passed by the Shareholders at the Extra Ordinary General Meeting held on 27 August 2011, the Holding company intends to adopt the Employee Stock Option Scheme titled ‘G R Infraprojects Employee Stock Option Plan’ (‘the Plan’) for employees, including the eligible Directors of the Holding company, which are in the permanent employment of the Holding company or its subsidiaries (‘Covered Employees’) at the time the grant is made under the Plan. The total number of equity shares reserved under the said plan is 2,486,212 (31 March 2017 : 1,243,106 equity shares of ` 10 each, fully paid for which exercise price have not been determined. No equity shares have been granted under the Plan from the date of the aforesaid resolution till the date of the balance sheet. The Holding company has formed a trust and issued shares to that Trust. The formulation of scheme would be done at a future date. accordingly the same has been considered as treasury shares and have been eliminated from equity share capital in accordance with requirement of Ind AS 32 “Financial instruments: Presentation”.
Particulars of shareholders holding more than 5% shares
(Currency: Indian ` in lakhs)
Particulars 31 March 2018 31 March 2017
Numbers % of total share in class
Numbers % of total share in class
Equity share of ` 5 (31 March 2017: ` 10) each fully paid-up held by
- G R Infratech Private Limited (refer note 53) - - 18,500,000 38.16
- Lokesh Builders Private Limited 31,915,832 32.92 15,957,916 32.92
- India Business Excellence Fund I 6,597,080 6.80 3,298,540 6.80
- Vinod Kumar Agarwal 4,941,512 5.10 - -
Aggregate number of shares issued for consideration other than cash during the period of five years immediately preceding the reporting date:
During the five-year period ended 31 March 2018:
- Issue of Bonus Shares : The Holding company has issued 24,240,555 equity shares as bonus in ratio of 1:1 on 18 June 2016, by capitalisation of securities premium.
- Issue of Preference Shares : The Holding Company has issued 4,121,907 non-convertible preference shares of face value ` 10 each on 12 March 2018 by virtue of final order from Hon’ble National Company Law Tribunal (“the Scheme”), Ahmedabad dated 22 February 2018 approving amalgamation between GR Infratech Private Limited (“Transferor Company”) and G R Infraprojects Limited (“Transferee Company”).
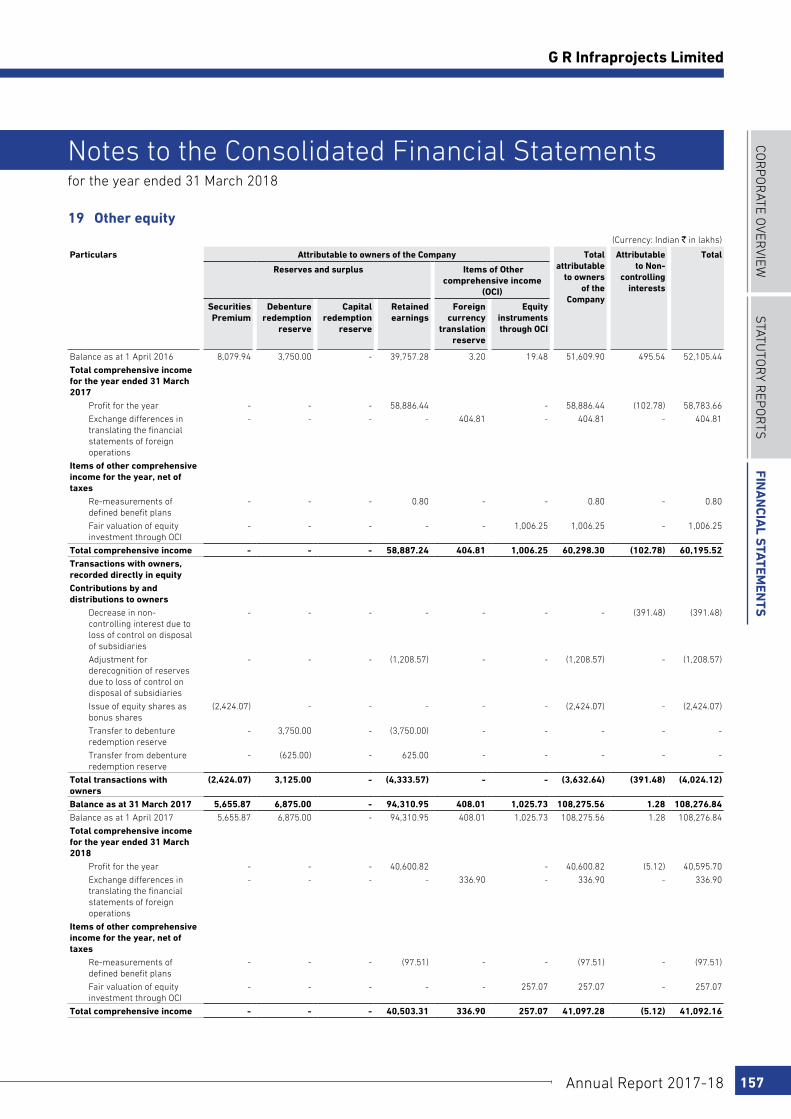
COR
PO
RATE O
VERVIEW
STATu
TOR
y REP
OR
TSFin
an
cial S
tatemen
tS
Annual Report 2017-18 157
G R Infraprojects Limited
for the year ended 31 March 2018
Notes to the Consolidated Financial Statements
19 Other equity(Currency: Indian ` in lakhs)
Particulars Attributable to owners of the Company Total attributable
to owners of the
Company
Attributable to Non-
controlling interests
Total
Reserves and surplus Items of Other comprehensive income
(OCI)
Securities Premium
Debenture redemption
reserve
Capital redemption
reserve
Retained earnings
Foreign currency
translation reserve
Equity instruments through OCI
Balance as at 1 April 2016 8,079.94 3,750.00 - 39,757.28 3.20 19.48 51,609.90 495.54 52,105.44
Total comprehensive income for the year ended 31 March 2017
Profit for the year - - - 58,886.44 - 58,886.44 (102.78) 58,783.66
Exchange differences in translating the financial statements of foreign operations
- - - - 404.81 - 404.81 - 404.81
Items of other comprehensive income for the year, net of taxes
Re-measurements of defined benefit plans
- - - 0.80 - - 0.80 - 0.80
Fair valuation of equity investment through OCI
- - - - - 1,006.25 1,006.25 - 1,006.25
Total comprehensive income - - - 58,887.24 404.81 1,006.25 60,298.30 (102.78) 60,195.52Transactions with owners, recorded directly in equityContributions by and distributions to owners
Decrease in non-controlling interest due to loss of control on disposal of subsidiaries
- - - - - - - (391.48) (391.48)
Adjustment for derecognition of reserves due to loss of control on disposal of subsidiaries
- - - (1,208.57) - - (1,208.57) - (1,208.57)
Issue of equity shares as bonus shares
(2,424.07) - - - - - (2,424.07) - (2,424.07)
Transfer to debenture redemption reserve
- 3,750.00 - (3,750.00) - - - - -
Transfer from debenture redemption reserve
- (625.00) - 625.00 - - - - -
Total transactions with owners
(2,424.07) 3,125.00 - (4,333.57) - - (3,632.64) (391.48) (4,024.12)
Balance as at 31 March 2017 5,655.87 6,875.00 - 94,310.95 408.01 1,025.73 108,275.56 1.28 108,276.84Balance as at 1 April 2017 5,655.87 6,875.00 - 94,310.95 408.01 1,025.73 108,275.56 1.28 108,276.84
Total comprehensive income for the year ended 31 March 2018
Profit for the year - - - 40,600.82 - 40,600.82 (5.12) 40,595.70
Exchange differences in translating the financial statements of foreign operations
- - - - 336.90 - 336.90 - 336.90
Items of other comprehensive income for the year, net of taxes
Re-measurements of defined benefit plans
- - - (97.51) - - (97.51) - (97.51)
Fair valuation of equity investment through OCI
- - - - - 257.07 257.07 - 257.07
Total comprehensive income - - - 40,503.31 336.90 257.07 41,097.28 (5.12) 41,092.16
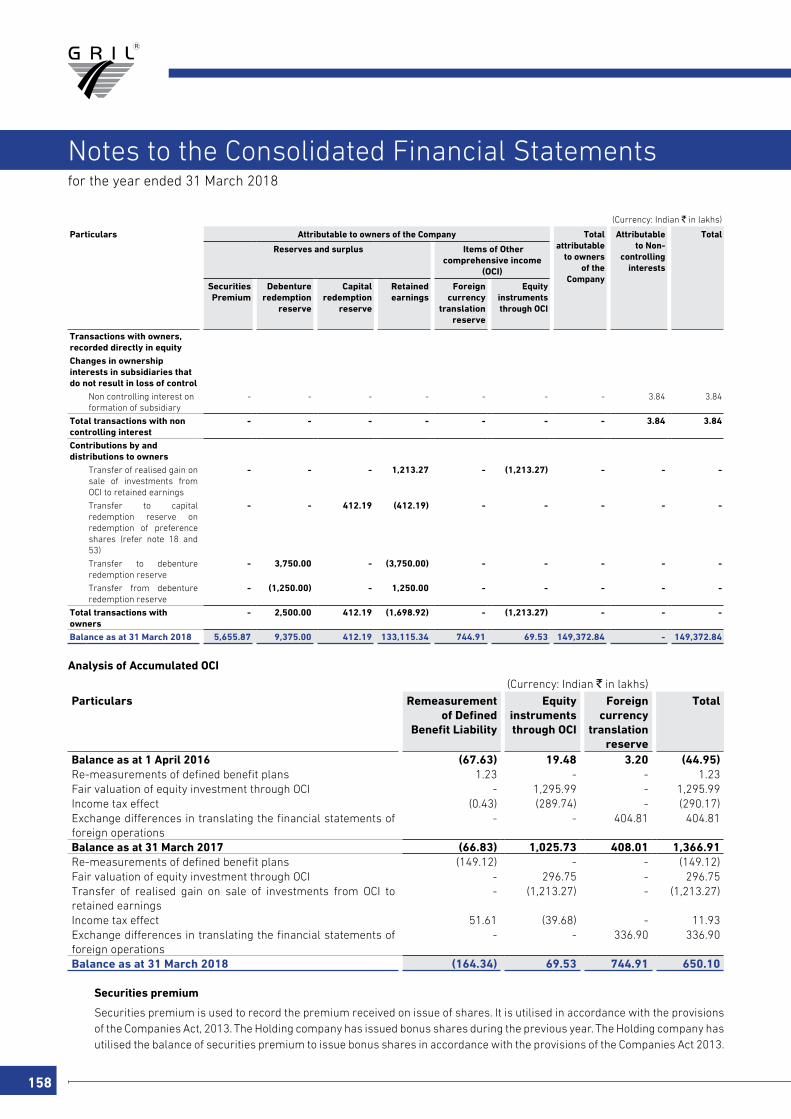
158
for the year ended 31 March 2018
Notes to the Consolidated Financial Statements
(Currency: Indian ` in lakhs)
Particulars Attributable to owners of the Company Total attributable
to owners of the
Company
Attributable to Non-
controlling interests
Total
Reserves and surplus Items of Other comprehensive income
(OCI)
Securities Premium
Debenture redemption
reserve
Capital redemption
reserve
Retained earnings
Foreign currency
translation reserve
Equity instruments through OCI
Transactions with owners, recorded directly in equityChanges in ownership interests in subsidiaries that do not result in loss of control
Non controlling interest on formation of subsidiary
- - - - - - - 3.84 3.84
Total transactions with non controlling interest
- - - - - - - 3.84 3.84
Contributions by and distributions to owners
Transfer of realised gain on sale of investments from OCI to retained earnings
- - - 1,213.27 - (1,213.27) - - -
Transfer to capital redemption reserve on redemption of preference shares (refer note 18 and 53)
- - 412.19 (412.19) - - - - -
Transfer to debenture redemption reserve
- 3,750.00 - (3,750.00) - - - - -
Transfer from debenture redemption reserve
- (1,250.00) - 1,250.00 - - - - -
Total transactions with owners
- 2,500.00 412.19 (1,698.92) - (1,213.27) - - -
Balance as at 31 March 2018 5,655.87 9,375.00 412.19 133,115.34 744.91 69.53 149,372.84 - 149,372.84
Analysis of Accumulated OCI
(Currency: Indian ` in lakhs)
Particulars Remeasurement of Defined
Benefit Liability
Equity instruments through OCI
Foreign currency
translation reserve
Total
Balance as at 1 April 2016 (67.63) 19.48 3.20 (44.95)Re-measurements of defined benefit plans 1.23 - - 1.23Fair valuation of equity investment through OCI - 1,295.99 - 1,295.99Income tax effect (0.43) (289.74) - (290.17)Exchange differences in translating the financial statements of foreign operations
- - 404.81 404.81
Balance as at 31 March 2017 (66.83) 1,025.73 408.01 1,366.91Re-measurements of defined benefit plans (149.12) - - (149.12)Fair valuation of equity investment through OCI - 296.75 - 296.75Transfer of realised gain on sale of investments from OCI to retained earnings
- (1,213.27) - (1,213.27)
Income tax effect 51.61 (39.68) - 11.93Exchange differences in translating the financial statements of foreign operations
- - 336.90 336.90
Balance as at 31 March 2018 (164.34) 69.53 744.91 650.10
Securities premium
Securities premium is used to record the premium received on issue of shares. It is utilised in accordance with the provisions of the Companies Act, 2013. The Holding company has issued bonus shares during the previous year. The Holding company has utilised the balance of securities premium to issue bonus shares in accordance with the provisions of the Companies Act 2013.
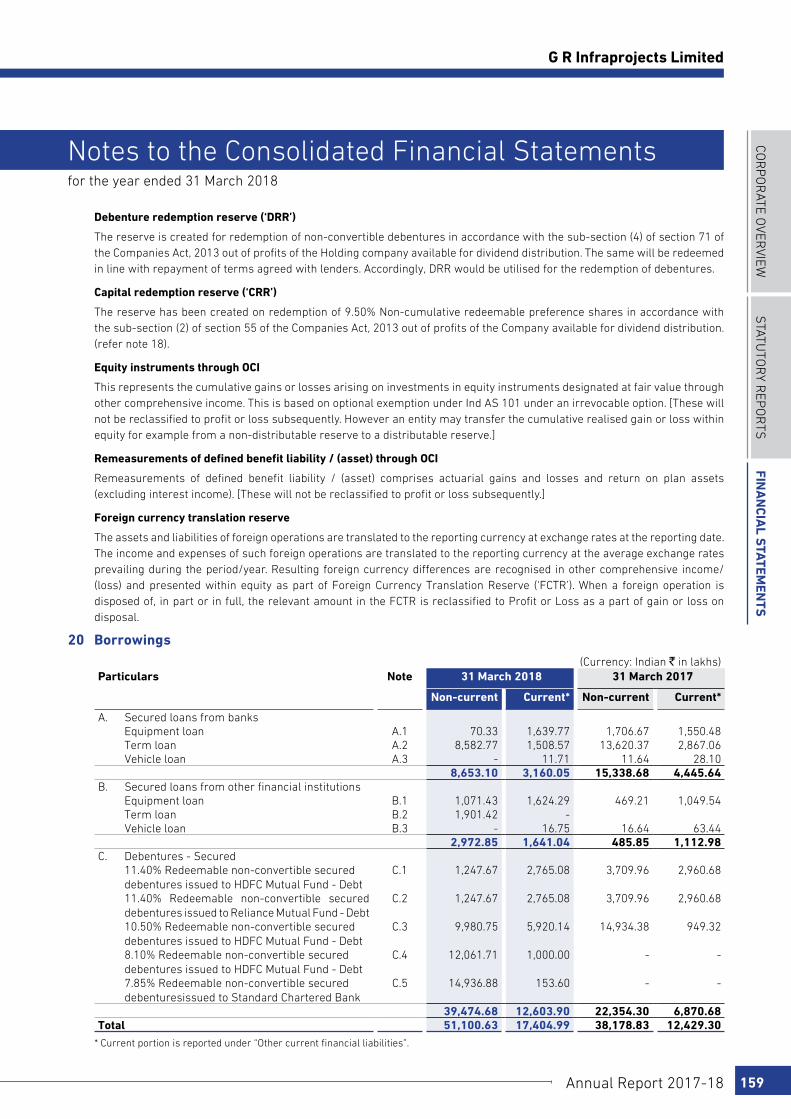
COR
PO
RATE O
VERVIEW
STATu
TOR
y REP
OR
TSFin
an
cial S
tatemen
tS
Annual Report 2017-18 159
G R Infraprojects Limited
for the year ended 31 March 2018
Notes to the Consolidated Financial Statements
Debenture redemption reserve (‘DRR’)
The reserve is created for redemption of non-convertible debentures in accordance with the sub-section (4) of section 71 of the Companies Act, 2013 out of profits of the Holding company available for dividend distribution. The same will be redeemed in line with repayment of terms agreed with lenders. Accordingly, DRR would be utilised for the redemption of debentures.
Capital redemption reserve (‘CRR’)
The reserve has been created on redemption of 9.50% Non-cumulative redeemable preference shares in accordance with the sub-section (2) of section 55 of the Companies Act, 2013 out of profits of the Company available for dividend distribution. (refer note 18).
Equity instruments through OCI
This represents the cumulative gains or losses arising on investments in equity instruments designated at fair value through other comprehensive income. This is based on optional exemption under Ind AS 101 under an irrevocable option. [These will not be reclassified to profit or loss subsequently. However an entity may transfer the cumulative realised gain or loss within equity for example from a non-distributable reserve to a distributable reserve.]
Remeasurements of defined benefit liability / (asset) through OCI
Remeasurements of defined benefit liability / (asset) comprises actuarial gains and losses and return on plan assets (excluding interest income). [These will not be reclassified to profit or loss subsequently.]
Foreign currency translation reserve
The assets and liabilities of foreign operations are translated to the reporting currency at exchange rates at the reporting date. The income and expenses of such foreign operations are translated to the reporting currency at the average exchange rates prevailing during the period/year. Resulting foreign currency differences are recognised in other comprehensive income/ (loss) and presented within equity as part of Foreign Currency Translation Reserve (‘FCTR’). When a foreign operation is disposed of, in part or in full, the relevant amount in the FCTR is reclassified to Profit or Loss as a part of gain or loss on disposal.
20 Borrowings(Currency: Indian ` in lakhs)
Particulars Note 31 March 2018 31 March 2017
Non-current Current* Non-current Current*
A. Secured loans from banks Equipment loan A.1 70.33 1,639.77 1,706.67 1,550.48 Term loan A.2 8,582.77 1,508.57 13,620.37 2,867.06 Vehicle loan A.3 - 11.71 11.64 28.10
8,653.10 3,160.05 15,338.68 4,445.64B. Secured loans from other financial institutions Equipment loan B.1 1,071.43 1,624.29 469.21 1,049.54 Term loan B.2 1,901.42 - Vehicle loan B.3 - 16.75 16.64 63.44
2,972.85 1,641.04 485.85 1,112.98C. Debentures - Secured 11.40% Redeemable non-convertible secured
debentures issued to HDFC Mutual Fund - DebtC.1 1,247.67 2,765.08 3,709.96 2,960.68
11.40% Redeemable non-convertible secured debentures issued to Reliance Mutual Fund - Debt
C.2 1,247.67 2,765.08 3,709.96 2,960.68
10.50% Redeemable non-convertible secured debentures issued to HDFC Mutual Fund - Debt
C.3 9,980.75 5,920.14 14,934.38 949.32
8.10% Redeemable non-convertible secured debentures issued to HDFC Mutual Fund - Debt
C.4 12,061.71 1,000.00 - -
7.85% Redeemable non-convertible secured debenturesissued to Standard Chartered Bank
C.5 14,936.88 153.60 - -
39,474.68 12,603.90 22,354.30 6,870.68Total 51,100.63 17,404.99 38,178.83 12,429.30
* Current portion is reported under “Other current financial liabilities”.

160
for the year ended 31 March 2018
Notes to the Consolidated Financial Statements
20
Bor
row
ings
(con
tinu
ed)
Not
e : N
atur
e of
sec
urity
, int
eres
t rat
e, r
epay
men
t ter
ms
and
othe
r in
form
atio
n fo
r bo
rrow
ings
.
(Cur
renc
y: In
dian
` in
lakh
s)
Sr
No
Par
ticu
lars
31
Mar
ch 2
018
31
Mar
ch 2
017
Sec
urit
yR
epay
men
t te
rms
Tota
lN
on-
Cur
rent
C
urre
ntTo
tal
Non
-C
urre
ntC
urre
nt
(A)
Sec
ured
loan
s fr
om
bank
s(A
.1)
Equi
pmen
t loa
n(i)
HD
FC B
ank
Lim
ited
1,0
19.0
6 6
7.71
9
51.3
5 1
,884
.78
1,0
19.7
1 8
65.0
7 S
ecur
ed b
y hy
poth
ecat
ion
of v
ehic
les
unde
r th
is lo
an36
Equ
ated
Mon
thly
Inst
allm
ent (
'EM
I') o
f `
31.7
1 la
khs
per
mon
th to
` 8
3.10
lakh
s pe
r m
onth
, alo
ng w
ith in
tere
st r
ate
rang
ing
from
8.8
5% to
9.7
5%(ii
)A
XIS
Ban
k Li
mite
d 6
91.0
4 2
.62
688
.42
1,3
72.3
7 6
86.9
6 6
85.4
1 S
ecur
ed b
y hy
poth
ecat
ion
of v
ehic
les
unde
r th
is lo
an23
to 3
5 EM
I ran
ging
from
` 0
.33
lakh
s pe
r m
onth
to `
4.5
4 la
khs
per
mon
th, a
long
w
ith in
tere
st r
ate
rang
ing
from
9.8
1% to
10
.26%
p.a
. 1
,710
.10
70.
33
1,6
39.7
7 3
,257
.15
1,7
06.6
7 1
,550
.48
(A.2
) Te
rm lo
an(ii
i)H
DFC
Ban
k Li
mite
d 1
,531
.64
680
.00
851
.64
14,
951.
43
12,
995.
37
1,9
56.0
6 S
ecur
ed b
y hy
poth
ecat
ion
by w
ay o
f var
ious
eq
uipm
ents
and
mac
hine
s un
der
this
loan
.36
mon
thly
inst
alm
ents
alo
ng w
ith in
tere
st
rate
ran
ging
from
8.1
5% to
10.
75%
p.a
.(iv
)H
DFC
Ban
k Li
mite
d 1
,916
.23
1,9
00.6
6 1
5.57
-
-
-
Fi
rst c
harg
es b
y w
ay o
f hyp
othe
catio
n of
all
the
fixed
ass
ets
/Mov
able
ass
ets
proj
ects
boo
k de
bts,
oper
atin
g ca
sh fl
ow, r
ecei
vabl
e, r
even
ue
wha
teve
r na
ture
, unc
alle
d ca
pita
l, P
roje
cts
bank
ac
coun
t & A
ssig
nmen
t of a
ll th
e Co
mpa
ny's
ri
ght,
insu
ranc
e po
licie
s an
d in
tere
st u
nder
al
l the
agr
eem
ent r
elat
ed to
the
proj
ects
and
gu
aran
tee
or p
erfo
rman
ce b
ond
prov
ided
by
any
part
y fo
r an
y co
ntra
ct r
elat
ed to
the
proj
ects
in
favo
r of
the
borr
ower
, ple
dge
of 5
1% s
hare
of
equi
ty s
hare
of N
agau
r M
ukun
dgar
h H
ighw
ays
Pri
vate
Lim
ited.
Rep
aym
ent 1
8 ha
lf-y
earl
y in
stal
lmen
t co
mm
ence
pos
t com
plet
ion
of m
orat
oriu
m
peri
od r
angi
ng fr
om 2
% to
8%
of l
oan
take
n,
alon
g w
ith m
onth
ly in
tere
st r
ate
of M
CLR
pl
us 1
30 B
PS
till
cons
truc
tion
peri
od a
nd
MCL
R p
lus
105
BP
S p
ost c
ompl
etio
n of
co
nstr
uctio
n pe
riod
.
(v)
Pun
jab
Nat
iona
l Ban
k 1
,882
.02
1,8
65.6
6 1
6.36
-
-
-
Fi
rst c
harg
es b
y w
ay o
f hyp
othe
catio
n of
all
the
fixed
ass
ets
/Mov
able
ass
ets
proj
ects
boo
k de
bts,
oper
atin
g ca
sh fl
ow, r
ecei
vabl
e, r
even
ue
wha
teve
r na
ture
, unc
alle
d ca
pita
l, P
roje
cts
bank
ac
coun
t & A
ssig
nmen
t of a
ll th
e Co
mpa
ny's
ri
ght,
insu
ranc
e po
licie
s an
d in
tere
st u
nder
al
l the
agr
eem
ent r
elat
ed to
the
proj
ects
and
gu
aran
tee
or p
erfo
rman
ce b
ond
prov
ided
by
any
part
y fo
r an
y co
ntra
ct r
elat
ed to
the
proj
ects
in
favo
r of
the
borr
ower
, ple
dge
of 5
1% s
hare
of
equi
ty s
hare
of N
agau
r M
ukun
dgar
h H
ighw
ays
Pri
vate
Lim
ited.
Rep
aym
ent 1
8 ha
lf-y
earl
y in
stal
lmen
t co
mm
ence
pos
t com
plet
ion
of m
orat
oriu
m
peri
od r
angi
ng fr
om 2
% to
8%
of l
oan
take
n,
alon
g w
ith m
onth
ly in
tere
st r
ate
of M
CLR
pl
us 1
30 B
PS
till
cons
truc
tion
peri
od a
nd
MCL
R p
lus
105
BP
S p
ost c
ompl
etio
n of
co
nstr
uctio
n pe
riod
.
(vi)
Uni
on B
ank
of In
dia
4,1
36.4
5 4
,136
.45
-
Firs
t cha
rges
by
way
of h
ypot
heca
tion
of a
ll th
e fix
ed a
sset
s /M
ovab
le a
sset
s pr
ojec
ts b
ook
debt
s,op
erat
ing
cash
flow
, rec
eiva
ble,
rev
enue
w
hate
ver
natu
re, u
ncal
led
capi
tal,
Pro
ject
s ba
nk
acco
unt &
Ass
ignm
ent o
f all
the
Com
pany
's
righ
t, in
sura
nce
polic
ies
and
inte
rest
und
er
all t
he a
gree
men
t rel
ated
to th
e pr
ojec
ts a
nd
guar
ante
e or
per
form
ance
bon
d pr
ovid
ed b
y an
y pa
rty
for
any
cont
ract
rel
ated
to th
e pr
ojec
ts in
fa
vor
of th
e bo
rrow
er, p
ledg
e of
51%
sha
re o
f eq
uity
sha
re o
f Nag
aur
Muk
undg
arh
Hig
hway
s P
riva
te L
imite
d.
Rep
aym
ent 1
8 ha
lf-y
earl
y in
stal
lmen
t co
mm
ence
pos
t com
plet
ion
of m
orat
oriu
m
peri
od r
angi
ng fr
om 2
% to
8%
of l
oan
take
n,
alon
g w
ith m
onth
ly in
tere
st r
ate
of M
CLR
pl
us 1
30 B
PS
till
cons
truc
tion
peri
od a
nd
MCL
R p
lus
105
BP
S p
ost c
ompl
etio
n of
co
nstr
uctio
n pe
riod
.
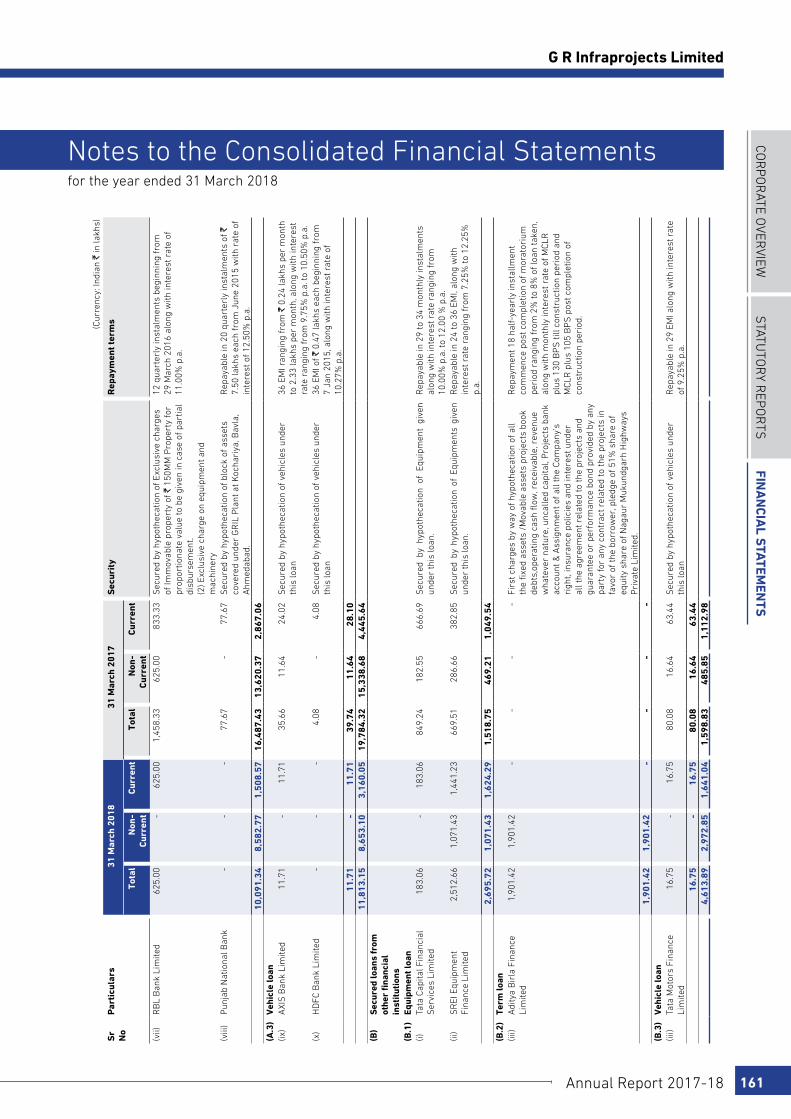
COR
PO
RATE O
VERVIEW
STATu
TOR
y REP
OR
TSFin
an
cial S
tatemen
tS
Annual Report 2017-18 161
G R Infraprojects Limited
for the year ended 31 March 2018
Notes to the Consolidated Financial Statements
(Cur
renc
y: In
dian
` in
lakh
s)
Sr
No
Par
ticu
lars
31
Mar
ch 2
018
31
Mar
ch 2
017
Sec
urit
yR
epay
men
t te
rms
Tota
lN
on-
Cur
rent
C
urre
ntTo
tal
Non
-C
urre
ntC
urre
nt
(vii)
RB
L B
ank
Lim
ited
625
.00
-
625
.00
1,4
58.3
3 6
25.0
0 8
33.3
3 S
ecur
ed b
y hy
poth
ecat
ion
of E
xclu
sive
cha
rges
of
Imm
ovab
le p
rope
rty
of `
150
MM
Pro
pert
y fo
r pr
opor
tiona
te v
alue
to b
e gi
ven
in c
ase
of p
artia
l di
sbur
sem
ent.
(2) E
xclu
sive
cha
rge
on e
quip
men
t and
m
achi
nery
12 q
uart
erly
inst
alm
ents
beg
inni
ng fr
om
29 M
arch
201
6 al
ong
with
inte
rest
rat
e of
11
.00%
p.a
.
(viii
)P
unja
b N
atio
nal B
ank
-
-
-
77.
67
-
77.
67
Sec
ured
by
hypo
thec
atio
n of
blo
ck o
f ass
ets
cove
red
unde
r G
RIL
Pla
nt a
t Koc
hari
ya, B
avla
, A
hmed
abad
.
Rep
ayab
le in
20
quar
terl
y in
stal
men
ts o
f `
7.50
lakh
s ea
ch fr
om J
une
2015
with
rat
e of
in
tere
st o
f 12.
50%
p.a
. 1
0,09
1.34
8
,582
.77
1,5
08.5
7 1
6,48
7.43
1
3,62
0.37
2
,867
.06
(A.3
) V
ehic
le lo
an(ix
)A
XIS
Ban
k Li
mite
d 1
1.71
-
1
1.71
3
5.66
1
1.64
2
4.02
S
ecur
ed b
y hy
poth
ecat
ion
of v
ehic
les
unde
r th
is lo
an36
EM
I ran
ging
from
` 0
.24
lakh
s pe
r m
onth
to
2.3
3 la
khs
per
mon
th, a
long
with
inte
rest
ra
te r
angi
ng fr
om 9
.75%
p.a
. to
10.5
0% p
.a.
(x)
HD
FC B
ank
Lim
ited
-
-
-
4.0
8 -
4
.08
Sec
ured
by
hypo
thec
atio
n of
veh
icle
s un
der
this
loan
36 E
MI o
f ` 0
.47
lakh
s ea
ch b
egin
ning
from
7
Jan
2015
, alo
ng w
ith in
tere
st r
ate
of
10.2
7% p
.a.
11.
71
-
11.
71
39.
74
11.
64
28.
10
11,
813.
15
8,6
53.1
0 3
,160
.05
19,
784.
32
15,
338.
68
4,4
45.6
4 (B
)S
ecur
ed lo
ans
from
ot
her
fina
ncia
l in
stit
utio
ns(B
.1)
Equi
pmen
t loa
n(i)
Tata
Cap
ital F
inan
cial
S
ervi
ces
Lim
ited
183
.06
-
183
.06
849
.24
182
.55
666
.69
Sec
ured
by
hypo
thec
atio
n of
Equ
ipm
ent
give
n un
der
this
loan
.R
epay
able
in 2
9 to
34
mon
thly
inst
alm
ents
al
ong
with
inte
rest
rat
e ra
ngin
g fr
om
10.0
0% p
.a. t
o 12
.00
% p
.a.
(ii)
SR
EI E
quip
men
t Fi
nanc
e Li
mite
d 2
,512
.66
1,0
71.4
3 1
,441
.23
669
.51
286
.66
382
.85
Sec
ured
by
hypo
thec
atio
n of
Equ
ipm
ents
giv
en
unde
r th
is lo
an.
Rep
ayab
le in
24
to 3
6 EM
I, al
ong
with
in
tere
st r
ate
rang
ing
from
7.2
5% to
12.
25%
p.
a. 2
,695
.72
1,0
71.4
3 1
,624
.29
1,5
18.7
5 4
69.2
1 1
,049
.54
(B.2
)Te
rm lo
an(ii
i)A
dity
a B
irla
Fin
ance
Li
mite
d 1
,901
.42
1,9
01.4
2 -
-
-
-
Fi
rst c
harg
es b
y w
ay o
f hyp
othe
catio
n of
all
the
fixed
ass
ets
/Mov
able
ass
ets
proj
ects
boo
k de
bts,
oper
atin
g ca
sh fl
ow, r
ecei
vabl
e, r
even
ue
wha
teve
r na
ture
, unc
alle
d ca
pita
l, P
roje
cts
bank
ac
coun
t & A
ssig
nmen
t of a
ll th
e Co
mpa
ny's
ri
ght,
insu
ranc
e po
licie
s an
d in
tere
st u
nder
al
l the
agr
eem
ent r
elat
ed to
the
proj
ects
and
gu
aran
tee
or p
erfo
rman
ce b
ond
prov
ided
by
any
part
y fo
r an
y co
ntra
ct r
elat
ed to
the
proj
ects
in
favo
r of
the
borr
ower
, ple
dge
of 5
1% s
hare
of
equi
ty s
hare
of N
agau
r M
ukun
dgar
h H
ighw
ays
Pri
vate
Lim
ited.
Rep
aym
ent 1
8 ha
lf-y
earl
y in
stal
lmen
t co
mm
ence
pos
t com
plet
ion
of m
orat
oriu
m
peri
od r
angi
ng fr
om 2
% to
8%
of l
oan
take
n,
alon
g w
ith m
onth
ly in
tere
st r
ate
of M
CLR
pl
us 1
30 B
PS
till
cons
truc
tion
peri
od a
nd
MCL
R p
lus
105
BP
S p
ost c
ompl
etio
n of
co
nstr
uctio
n pe
riod
.
1,9
01.4
2 1
,901
.42
-
-
-
-
(B.3
)V
ehic
le lo
an(ii
i)Ta
ta M
otor
s Fi
nanc
e Li
mite
d 1
6.75
-
1
6.75
8
0.08
1
6.64
6
3.44
S
ecur
ed b
y hy
poth
ecat
ion
of v
ehic
les
unde
r th
is lo
anR
epay
able
in 2
9 EM
I alo
ng w
ith in
tere
st r
ate
of 9
.25%
p.a
. 1
6.75
-
1
6.75
8
0.08
1
6.64
6
3.44
4
,613
.89
2,9
72.8
5 1
,641
.04
1,5
98.8
3 4
85.8
5 1
,112
.98
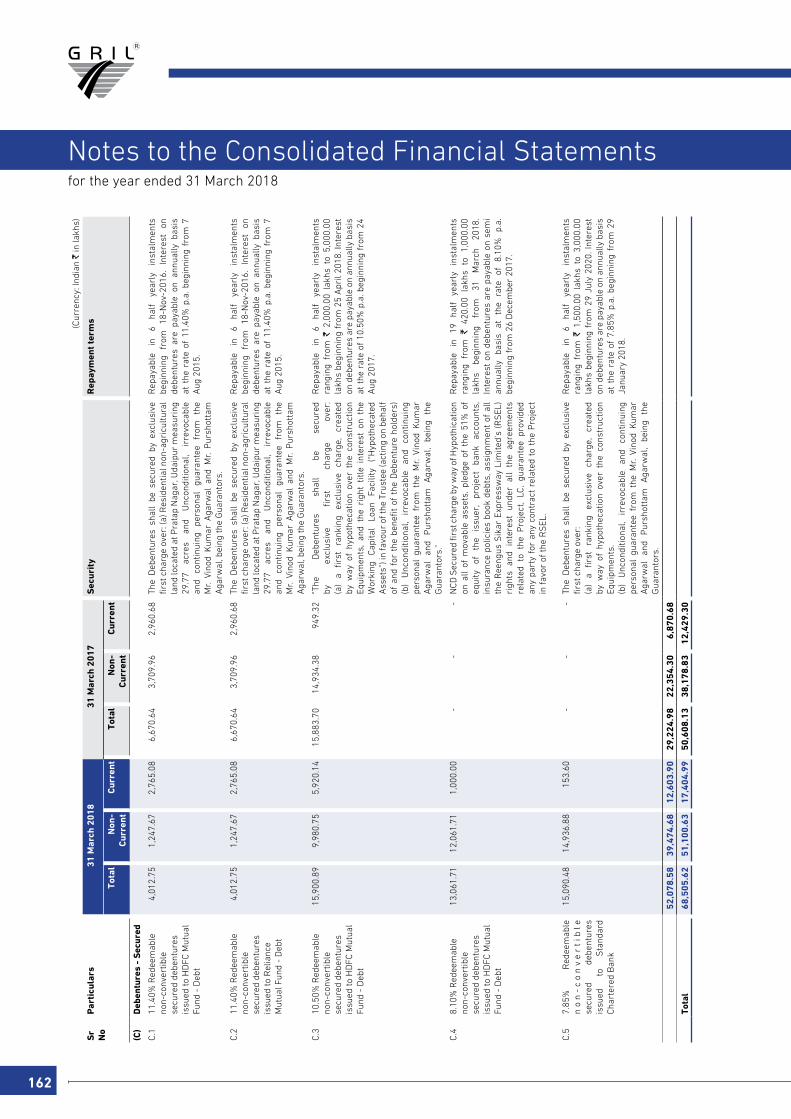
162
for the year ended 31 March 2018
Notes to the Consolidated Financial Statements
(Cur
renc
y: In
dian
` in
lakh
s)
Sr
No
Par
ticu
lars
31
Mar
ch 2
018
31
Mar
ch 2
017
Sec
urit
yR
epay
men
t te
rms
Tota
lN
on-
Cur
rent
C
urre
ntTo
tal
Non
-C
urre
ntC
urre
nt
(C)
Deb
entu
res
- S
ecur
ed
C.1
11.4
0% R
edee
mab
le
non-
conv
ertib
le
secu
red
debe
ntur
es
issu
ed to
HD
FC M
utua
l Fu
nd -
Deb
t
4,0
12.7
5 1
,247
.67
2,7
65.0
8 6
,670
.64
3,7
09.9
6 2
,960
.68
The
Deb
entu
res
shal
l be
sec
ured
by
excl
usiv
e fir
st c
harg
e ov
er: (
a) R
esid
entia
l non
-agr
icul
tura
l la
nd lo
cate
d at
Pra
tap
Nag
ar, U
daip
ur m
easu
ring
29
.77
acre
s an
d U
ncon
ditio
nal,
irre
voca
ble
and
cont
inui
ng
pers
onal
gu
aran
tee
from
th
e M
r. Vi
nod
Kum
ar A
garw
al a
nd M
r. P
ursh
otta
m
Aga
rwal
, bei
ng th
e G
uara
ntor
s.
Rep
ayab
le
in
6 ha
lf
year
ly
inst
alm
ents
be
ginn
ing
from
18
-Nov
-201
6.
Inte
rest
on
de
bent
ures
are
pay
able
on
annu
ally
bas
is
at t
he r
ate
of 1
1.40
% p
.a. b
egin
ning
fro
m 7
A
ug 2
015.
C.2
11.4
0% R
edee
mab
le
non-
conv
ertib
le
secu
red
debe
ntur
es
issu
ed to
Rel
ianc
e M
utua
l Fun
d -
Deb
t
4,0
12.7
5 1
,247
.67
2,7
65.0
8 6
,670
.64
3,7
09.9
6 2
,960
.68
The
Deb
entu
res
shal
l be
sec
ured
by
excl
usiv
e fir
st c
harg
e ov
er: (
a) R
esid
entia
l non
-agr
icul
tura
l la
nd lo
cate
d at
Pra
tap
Nag
ar, U
daip
ur m
easu
ring
29
.77
acre
s an
d U
ncon
ditio
nal,
irre
voca
ble
and
cont
inui
ng
pers
onal
gu
aran
tee
from
th
e M
r. Vi
nod
Kum
ar A
garw
al a
nd M
r. P
ursh
otta
m
Aga
rwal
, bei
ng th
e G
uara
ntor
s.
Rep
ayab
le
in
6 ha
lf
year
ly
inst
alm
ents
be
ginn
ing
from
18
-Nov
-201
6.
Inte
rest
on
de
bent
ures
are
pay
able
on
annu
ally
bas
is
at t
he r
ate
of 1
1.40
% p
.a. b
egin
ning
fro
m 7
A
ug 2
015.
C.3
10.5
0% R
edee
mab
le
non-
conv
ertib
le
secu
red
debe
ntur
es
issu
ed to
HD
FC M
utua
l Fu
nd -
Deb
t
15,
900.
89
9,9
80.7
5 5
,920
.14
15,
883.
70
14,
934.
38
949
.32
"The
D
eben
ture
s sh
all
be
secu
red
by
excl
usiv
e fir
st
char
ge
over
: (a
) a
first
ra
nkin
g ex
clus
ive
char
ge,
crea
ted
by w
ay o
f hy
poth
ecat
ion
over
the
con
stru
ctio
n Eq
uipm
ents
, an
d th
e ri
ght
title
int
eres
t on
the
W
orki
ng
Capi
tal
Loan
Fa
cilit
y (“
Hyp
othe
cate
d A
sset
s”) i
n fa
vour
of t
he T
rust
ee (a
ctin
g on
beh
alf
of a
nd f
or t
he b
enefi
t of
the
Deb
entu
re h
olde
rs)
(b)
Unc
ondi
tiona
l, ir
revo
cabl
e an
d co
ntin
uing
pe
rson
al g
uara
ntee
fro
m t
he M
r. Vi
nod
Kum
ar
Aga
rwal
an
d P
ursh
otta
m
Aga
rwal
, be
ing
the
Gua
rant
ors.
"
Rep
ayab
le
in
6 ha
lf
year
ly
inst
alm
ents
ra
ngin
g fr
om `
2,0
00.0
0 la
khs
to 5
,000
.00
lakh
s be
ginn
ing
from
25
Apr
il 20
18. I
nter
est
on d
eben
ture
s ar
e pa
yabl
e on
ann
ually
bas
is
at t
he r
ate
of 1
0.50
% p
.a. b
egin
ning
fro
m 2
4 A
ug 2
017.
C.4
8.10
% R
edee
mab
le
non-
conv
ertib
le
secu
red
debe
ntur
es
issu
ed to
HD
FC M
utua
l Fu
nd -
Deb
t
13,
061.
71
12,
061.
71
1,0
00.0
0 -
-
-
N
CD S
ecur
ed fi
rst c
harg
e by
way
of H
ypot
hica
tion
on a
ll of
mov
able
ass
ets,
ple
dge
of t
he 5
1% o
f eq
uity
of
th
e is
suer
, pr
ojec
t ba
nk
acco
unts
, in
sura
nce
polic
ies
book
deb
ts, a
ssig
nmen
t of
all
the
Ree
ngus
Sik
ar E
xpre
ssw
ay L
imite
d's
(RS
EL)
righ
ts a
nd i
nter
est
unde
r al
l th
e ag
reem
ents
re
late
d to
the
Pro
ject
, LC
, gu
aran
tee
prov
ided
an
y pa
rty
for
any
cont
ract
rel
ated
to
the
Pro
ject
in
favo
r of
the
RS
EL.
Rep
ayab
le
in
19
half
ye
arly
in
stal
men
ts
rang
ing
from
`
420.
00
lakh
s to
1,
000.
00
lakh
s be
ginn
ing
from
31
M
arch
20
18.
Inte
rest
on
debe
ntur
es a
re p
ayab
le o
n se
mi
annu
ally
ba
sis
at
the
rate
of
8.
10%
p.
a.
begi
nnin
g fr
om 2
6 D
ecem
ber
2017
.
C.5
7.85
%
Red
eem
able
n
on
-c
on
ve
rti
ble
se
cure
d de
bent
ures
is
sued
to
S
tand
ard
Char
tere
d B
ank
15,
090.
48
14,
936.
88
153
.60
-
-
-
The
Deb
entu
res
shal
l be
sec
ured
by
excl
usiv
e fir
st c
harg
e ov
er:
(a)
a fir
st
rank
ing
excl
usiv
e ch
arge
, cr
eate
d by
way
of
hypo
thec
atio
n ov
er t
he c
onst
ruct
ion
Equi
pmen
ts.
(b)
Unc
ondi
tiona
l, ir
revo
cabl
e an
d co
ntin
uing
pe
rson
al g
uara
ntee
fro
m t
he M
r. Vi
nod
Kum
ar
Aga
rwal
an
d P
ursh
otta
m
Aga
rwal
, be
ing
the
Gua
rant
ors.
Rep
ayab
le
in
6 ha
lf
year
ly
inst
alm
ents
ra
ngin
g fr
om `
1,5
00.0
0 la
khs
to 3
,000
.00
lakh
s be
ginn
ing
from
29
July
202
0. I
nter
est
on d
eben
ture
s ar
e pa
yabl
e on
ann
ually
bas
is
at t
he r
ate
of 7
.85%
p.a
. beg
inni
ng f
rom
29
Janu
ary
2018
.
52,
078.
58
39,
474.
68
12,
603.
90
29,
224.
98
22,
354.
30
6,8
70.6
8
Tota
l 6
8,50
5.62
5
1,10
0.63
1
7,40
4.99
5
0,60
8.13
3
8,17
8.83
1
2,42
9.30
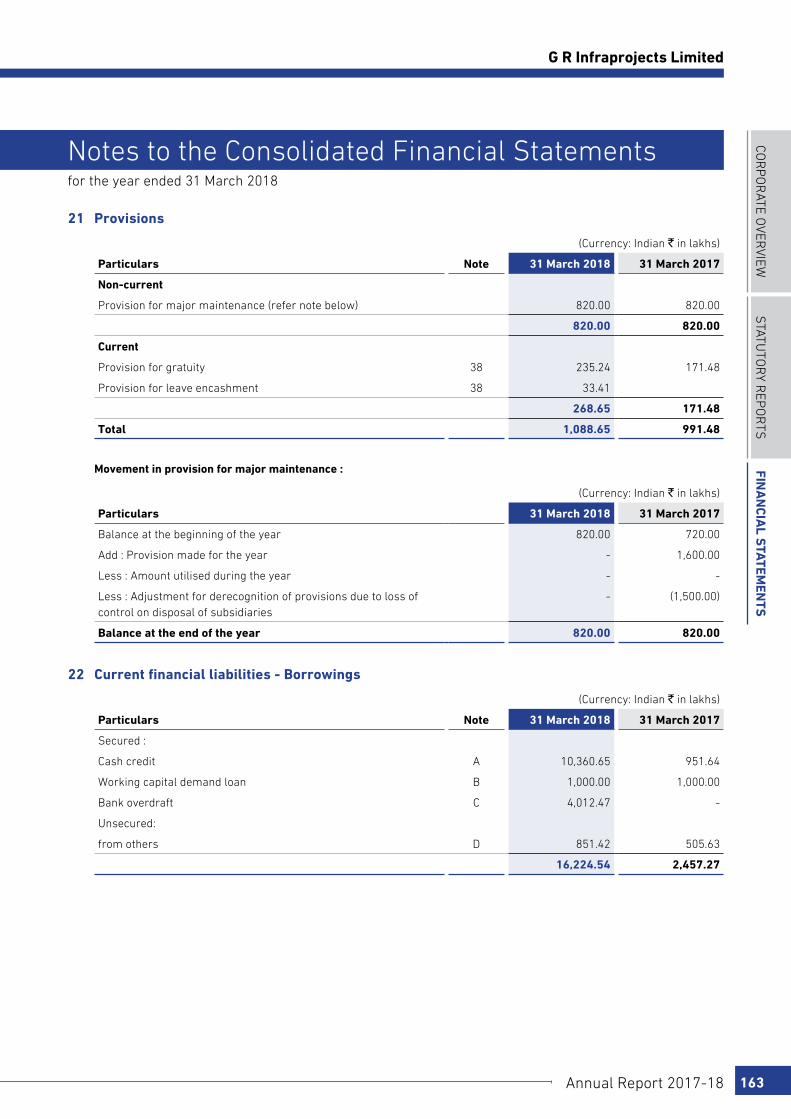
COR
PO
RATE O
VERVIEW
STATu
TOR
y REP
OR
TSFin
an
cial S
tatemen
tS
Annual Report 2017-18 163
G R Infraprojects Limited
for the year ended 31 March 2018
Notes to the Consolidated Financial Statements
21 Provisions
(Currency: Indian ` in lakhs)
Particulars Note 31 March 2018 31 March 2017
Non-current
Provision for major maintenance (refer note below) 820.00 820.00
820.00 820.00
Current
Provision for gratuity 38 235.24 171.48
Provision for leave encashment 38 33.41
268.65 171.48
Total 1,088.65 991.48
Movement in provision for major maintenance :
(Currency: Indian ` in lakhs)
Particulars 31 March 2018 31 March 2017
Balance at the beginning of the year 820.00 720.00
Add : Provision made for the year - 1,600.00
Less : Amount utilised during the year - -
Less : Adjustment for derecognition of provisions due to loss of control on disposal of subsidiaries
- (1,500.00)
Balance at the end of the year 820.00 820.00
22 Current financial liabilities - Borrowings
(Currency: Indian ` in lakhs)
Particulars Note 31 March 2018 31 March 2017
Secured :
Cash credit A 10,360.65 951.64
Working capital demand loan B 1,000.00 1,000.00
Bank overdraft C 4,012.47 -
Unsecured:
from others D 851.42 505.63
16,224.54 2,457.27
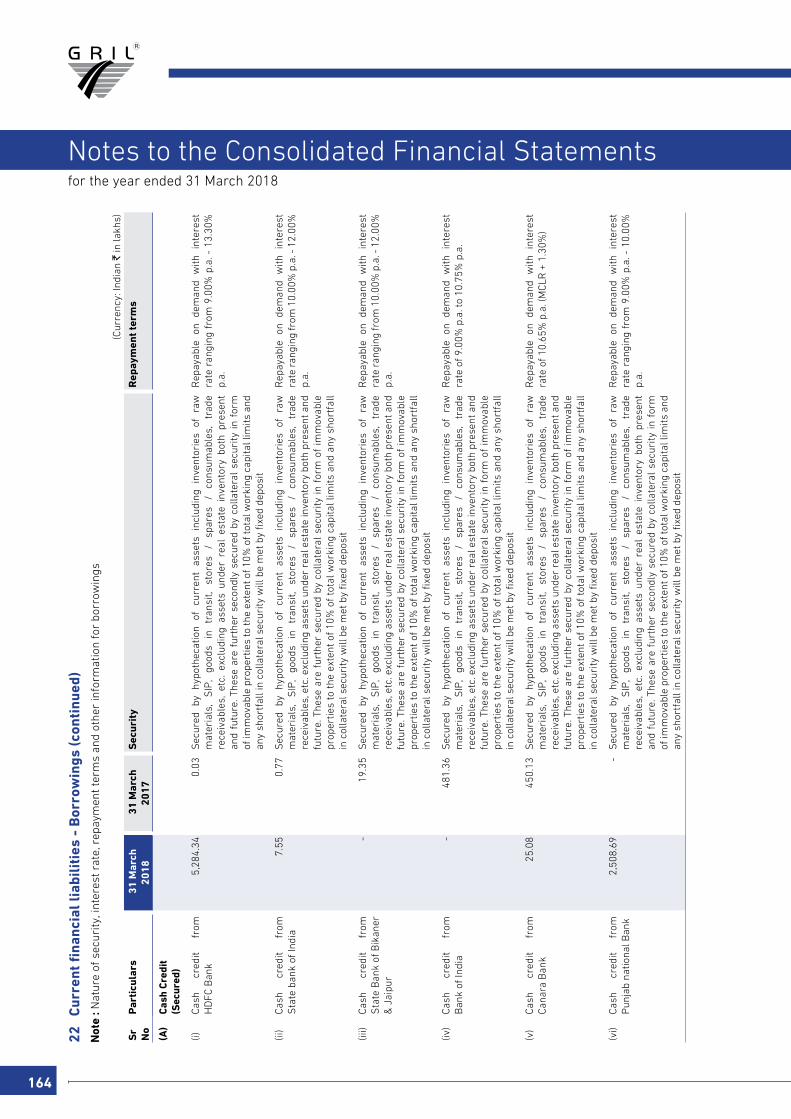
164
for the year ended 31 March 2018
Notes to the Consolidated Financial Statements
22
Cur
rent
fina
ncia
l lia
bili
ties
- B
orro
win
gs (c
onti
nued
) N
ote
: Nat
ure
of s
ecur
ity, i
nter
est r
ate,
rep
aym
ent t
erm
s an
d ot
her
info
rmat
ion
for
borr
owin
gs
(Cur
renc
y: In
dian
` in
lakh
s)
Sr
No
Par
ticu
lars
31
Mar
ch
2018
31
Mar
ch
2017
Sec
urit
yR
epay
men
t te
rms
(A)
Cash
Cre
dit
(Sec
ured
)
(i)Ca
sh
cred
it fr
om
HD
FC B
ank
5,2
84.3
4 0
.03
Sec
ured
by
hypo
thec
atio
n of
cur
rent
ass
ets
incl
udin
g in
vent
orie
s of
raw
m
ater
ials
, S
IP,
good
s in
tr
ansi
t, st
ores
/
spar
es
/ co
nsum
able
s,
trad
e re
ceiv
able
s, e
tc.
excl
udin
g as
sets
und
er r
eal
esta
te i
nven
tory
bot
h pr
esen
t an
d fu
ture
. The
se a
re f
urth
er s
econ
dly
secu
red
by c
olla
tera
l se
curi
ty i
n fo
rm
of im
mov
able
pro
pert
ies
to th
e ex
tent
of 1
0% o
f tot
al w
orki
ng c
apita
l lim
its a
nd
any
shor
tfal
l in
colla
tera
l sec
urity
will
be
met
by
fixed
dep
osit
Rep
ayab
le o
n de
man
d w
ith i
nter
est
rate
ran
ging
fro
m 9
.00%
p.a
. - 1
3.30
%
p.a.
(ii)
Cash
cr
edit
from
S
tate
ban
k of
Indi
a 7
.55
0.7
7 S
ecur
ed b
y hy
poth
ecat
ion
of c
urre
nt a
sset
s in
clud
ing
inve
ntor
ies
of r
aw
mat
eria
ls,
SIP
, go
ods
in
tran
sit,
stor
es
/ sp
ares
/
cons
umab
les,
tr
ade
rece
ivab
les,
etc
. exc
ludi
ng a
sset
s un
der
real
est
ate
inve
ntor
y bo
th p
rese
nt a
nd
futu
re. T
hese
are
fur
ther
sec
ured
by
colla
tera
l se
curi
ty in
for
m o
f im
mov
able
pr
oper
ties
to t
he e
xten
t of
10%
of
tota
l wor
king
cap
ital l
imits
and
any
sho
rtfa
ll in
col
late
ral s
ecur
ity w
ill b
e m
et b
y fix
ed d
epos
it
Rep
ayab
le o
n de
man
d w
ith i
nter
est
rate
ran
ging
from
10.
00%
p.a
. - 1
2.00
%
p.a.
(iii)
Cash
cr
edit
from
S
tate
Ban
k of
Bik
aner
&
Jai
pur
-
19.
35
Sec
ured
by
hypo
thec
atio
n of
cur
rent
ass
ets
incl
udin
g in
vent
orie
s of
raw
m
ater
ials
, S
IP,
good
s in
tr
ansi
t, st
ores
/
spar
es
/ co
nsum
able
s,
trad
e re
ceiv
able
s, e
tc. e
xclu
ding
ass
ets
unde
r re
al e
stat
e in
vent
ory
both
pre
sent
and
fu
ture
. The
se a
re f
urth
er s
ecur
ed b
y co
llate
ral
secu
rity
in f
orm
of
imm
ovab
le
prop
ertie
s to
the
ext
ent
of 1
0% o
f to
tal w
orki
ng c
apita
l lim
its a
nd a
ny s
hort
fall
in c
olla
tera
l sec
urity
will
be
met
by
fixed
dep
osit
Rep
ayab
le o
n de
man
d w
ith i
nter
est
rate
ran
ging
from
10.
00%
p.a
. - 1
2.00
%
p.a.
(iv)
Cash
cr
edit
from
B
ank
of In
dia
-
481
.36
Sec
ured
by
hypo
thec
atio
n of
cur
rent
ass
ets
incl
udin
g in
vent
orie
s of
raw
m
ater
ials
, S
IP,
good
s in
tr
ansi
t, st
ores
/
spar
es
/ co
nsum
able
s,
trad
e re
ceiv
able
s, e
tc. e
xclu
ding
ass
ets
unde
r re
al e
stat
e in
vent
ory
both
pre
sent
and
fu
ture
. The
se a
re f
urth
er s
ecur
ed b
y co
llate
ral
secu
rity
in f
orm
of
imm
ovab
le
prop
ertie
s to
the
ext
ent
of 1
0% o
f to
tal w
orki
ng c
apita
l lim
its a
nd a
ny s
hort
fall
in c
olla
tera
l sec
urity
will
be
met
by
fixed
dep
osit
Rep
ayab
le o
n de
man
d w
ith i
nter
est
rate
of 9
.00%
p.a
. to
10.7
5% p
.a.
(v)
Cash
cr
edit
from
Ca
nara
Ban
k 2
5.08
4
50.1
3 S
ecur
ed b
y hy
poth
ecat
ion
of c
urre
nt a
sset
s in
clud
ing
inve
ntor
ies
of r
aw
mat
eria
ls,
SIP
, go
ods
in
tran
sit,
stor
es
/ sp
ares
/
cons
umab
les,
tr
ade
rece
ivab
les,
etc
. exc
ludi
ng a
sset
s un
der
real
est
ate
inve
ntor
y bo
th p
rese
nt a
nd
futu
re. T
hese
are
fur
ther
sec
ured
by
colla
tera
l se
curi
ty in
for
m o
f im
mov
able
pr
oper
ties
to t
he e
xten
t of
10%
of
tota
l wor
king
cap
ital l
imits
and
any
sho
rtfa
ll in
col
late
ral s
ecur
ity w
ill b
e m
et b
y fix
ed d
epos
it
Rep
ayab
le o
n de
man
d w
ith i
nter
est
rate
of 1
0.65
% p
.a. (
MCL
R +
1.3
0%)
(vi)
Cash
cr
edit
from
P
unja
b na
tiona
l Ban
k 2
,508
.69
-
Sec
ured
by
hypo
thec
atio
n of
cur
rent
ass
ets
incl
udin
g in
vent
orie
s of
raw
m
ater
ials
, S
IP,
good
s in
tr
ansi
t, st
ores
/
spar
es
/ co
nsum
able
s,
trad
e re
ceiv
able
s, e
tc.
excl
udin
g as
sets
und
er r
eal
esta
te i
nven
tory
bot
h pr
esen
t an
d fu
ture
. The
se a
re f
urth
er s
econ
dly
secu
red
by c
olla
tera
l se
curi
ty i
n fo
rm
of im
mov
able
pro
pert
ies
to th
e ex
tent
of 1
0% o
f tot
al w
orki
ng c
apita
l lim
its a
nd
any
shor
tfal
l in
colla
tera
l sec
urity
will
be
met
by
fixed
dep
osit
Rep
ayab
le o
n de
man
d w
ith i
nter
est
rate
ran
ging
fro
m 9
.00%
p.a
. - 1
0.00
%
p.a.
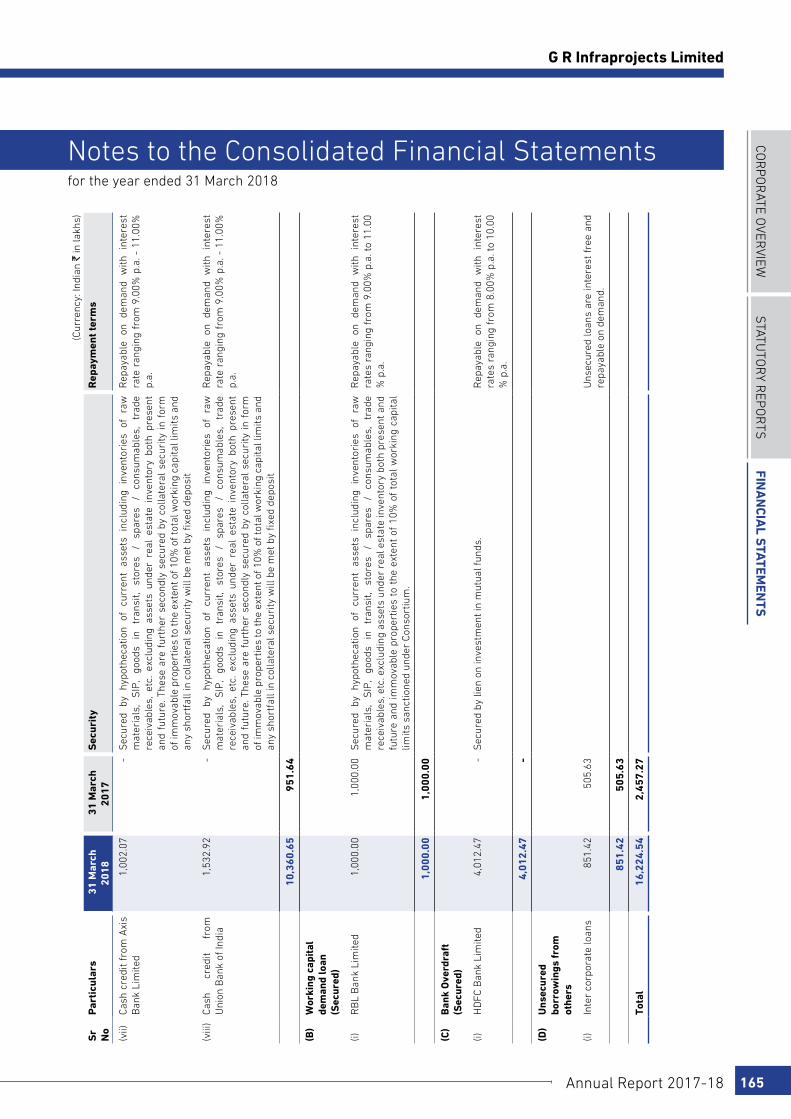
COR
PO
RATE O
VERVIEW
STATu
TOR
y REP
OR
TSFin
an
cial S
tatemen
tS
Annual Report 2017-18 165
G R Infraprojects Limited
for the year ended 31 March 2018
Notes to the Consolidated Financial Statements
(Cur
renc
y: In
dian
` in
lakh
s)
Sr
No
Par
ticu
lars
31
Mar
ch
2018
31
Mar
ch
2017
Sec
urit
yR
epay
men
t te
rms
(vii)
Cash
cre
dit
from
Axi
s B
ank
Lim
ited
1,0
02.0
7 -
S
ecur
ed b
y hy
poth
ecat
ion
of c
urre
nt a
sset
s in
clud
ing
inve
ntor
ies
of r
aw
mat
eria
ls,
SIP
, go
ods
in
tran
sit,
stor
es
/ sp
ares
/
cons
umab
les,
tr
ade
rece
ivab
les,
etc
. ex
clud
ing
asse
ts u
nder
rea
l es
tate
inv
ento
ry b
oth
pres
ent
and
futu
re. T
hese
are
fur
ther
sec
ondl
y se
cure
d by
col
late
ral
secu
rity
in
form
of
imm
ovab
le p
rope
rtie
s to
the
exte
nt o
f 10%
of t
otal
wor
king
cap
ital l
imits
and
an
y sh
ortf
all i
n co
llate
ral s
ecur
ity w
ill b
e m
et b
y fix
ed d
epos
it
Rep
ayab
le o
n de
man
d w
ith i
nter
est
rate
ran
ging
fro
m 9
.00%
p.a
. - 1
1.00
%
p.a.
(viii
)Ca
sh
cred
it fr
om
Uni
on B
ank
of In
dia
1,5
32.9
2 -
S
ecur
ed b
y hy
poth
ecat
ion
of c
urre
nt a
sset
s in
clud
ing
inve
ntor
ies
of r
aw
mat
eria
ls,
SIP
, go
ods
in
tran
sit,
stor
es
/ sp
ares
/
cons
umab
les,
tr
ade
rece
ivab
les,
etc
. ex
clud
ing
asse
ts u
nder
rea
l es
tate
inv
ento
ry b
oth
pres
ent
and
futu
re. T
hese
are
fur
ther
sec
ondl
y se
cure
d by
col
late
ral
secu
rity
in
form
of
imm
ovab
le p
rope
rtie
s to
the
exte
nt o
f 10%
of t
otal
wor
king
cap
ital l
imits
and
an
y sh
ortf
all i
n co
llate
ral s
ecur
ity w
ill b
e m
et b
y fix
ed d
epos
it
Rep
ayab
le o
n de
man
d w
ith i
nter
est
rate
ran
ging
fro
m 9
.00%
p.a
. - 1
1.00
%
p.a.
10,
360.
65
951
.64
(B)
Wor
king
cap
ital
de
man
d lo
an
(Sec
ured
)
(i)R
BL
Ban
k Li
mite
d 1
,000
.00
1,0
00.0
0 S
ecur
ed b
y hy
poth
ecat
ion
of c
urre
nt a
sset
s in
clud
ing
inve
ntor
ies
of r
aw
mat
eria
ls,
SIP
, go
ods
in
tran
sit,
stor
es
/ sp
ares
/
cons
umab
les,
tr
ade
rece
ivab
les,
etc
. exc
ludi
ng a
sset
s un
der
real
est
ate
inve
ntor
y bo
th p
rese
nt a
nd
futu
re a
nd im
mov
able
pro
pert
ies
to t
he e
xten
t of
10%
of
tota
l wor
king
cap
ital
limits
san
ctio
ned
unde
r Co
nsor
tium
.
Rep
ayab
le o
n de
man
d w
ith i
nter
est
rate
s ra
ngin
g fr
om 9
.00%
p.a
. to
11.0
0 %
p.a
.
1,0
00.0
0 1
,000
.00
(C)
Ban
k O
verd
raft
(S
ecur
ed)
(i)H
DFC
Ban
k Li
mite
d 4
,012
.47
-
Sec
ured
by
lien
on in
vest
men
t in
mut
ual f
unds
.R
epay
able
on
dem
and
with
int
eres
t ra
tes
rang
ing
from
8.0
0% p
.a. t
o 10
.00
% p
.a.
4,0
12.4
7 -
(D)
Uns
ecur
ed
borr
owin
gs fr
om
othe
rs
(i)In
ter
corp
orat
e lo
ans
851
.42
505
.63
Uns
ecur
ed lo
ans
are
inte
rest
fre
e an
d re
paya
ble
on d
eman
d.
851
.42
505
.63
Tota
l 1
6,22
4.54
2
,457
.27

166
for the year ended 31 March 2018
Notes to the Consolidated Financial Statements
23 Trade payables
(Currency: Indian ` in lakhs)
Particulars 31 March 2018 31 March 2017
Payables to micro, small and medium enterprises (refer note below) 24.97 6.93
Other trade payables 32,547.07 22,890.01
32,572.04 22,896.94
Details of Dues to Micro, Small & Medium Enterprises as defined under MSMED Act, 2006
(Currency: Indian ` in lakhs)
Particulars 31 March 2018 31 March 2017
Principal amount remaining unpaid to any supplier as at the year end. 24.97 6.93
Interest due thereon - -
Amount of interest paid by the Group in terms of section 16 of the MSMED, along with the amount of the payment made to the supplier beyond the appointed day during the accounting year.
- -
Amount of interest due and payable for the period of delay in making payment (which have been paid but beyond the appointed day during the period) but without adding the interest specified under the MSMED.
- -
Amount of interest accrued and remaining unpaid at the end of the accounting year / period.
- -
Amount of further interest remaining due and payable even in succeeding years - -
The disclosure in respect of the amount payable to enterprises which have provided goods and services to the Group and which qualify under the definition of micro and small enterprises, as defined under Micro, Small and Medium Enterprises Development Act, 2006 has been made in the Financial statement as at 31 March 2018 based on the information received and available with the management. On the basis of such information, no interest is payable to any micro, small and medium enterprises. Auditors have relied upon the information provided by the management.
The Group’s exposure to currency and liquidity risks related to trade payables is disclosed in Note 45.
Retention money payable relating to construction contracts are included in above trade payables as they are payable within the operating cycle of the Group.
(Currency: Indian ` in lakhs)
Particulars 31 March 2018 31 March 2017
Retention money payable 7,906.02 6,817.81
24 Other financial liabilities
(Currency: Indian ` in lakhs)
Particulars Note 31 March 2018 31 March 2017
CurrentCurrent maturities of long-term borrowings 20 17,404.99 12,429.30
Employee related liabilities 2,763.26 2,041.32
Capital creditors 11,430.19 4,984.92
Ernest money deposit received - 444.00
Rent payables 54.59 59.00
31,653.03 19,958.54
The Group’s exposure to liquidity risks related to the above financial liabilities is disclosed in Note 43.
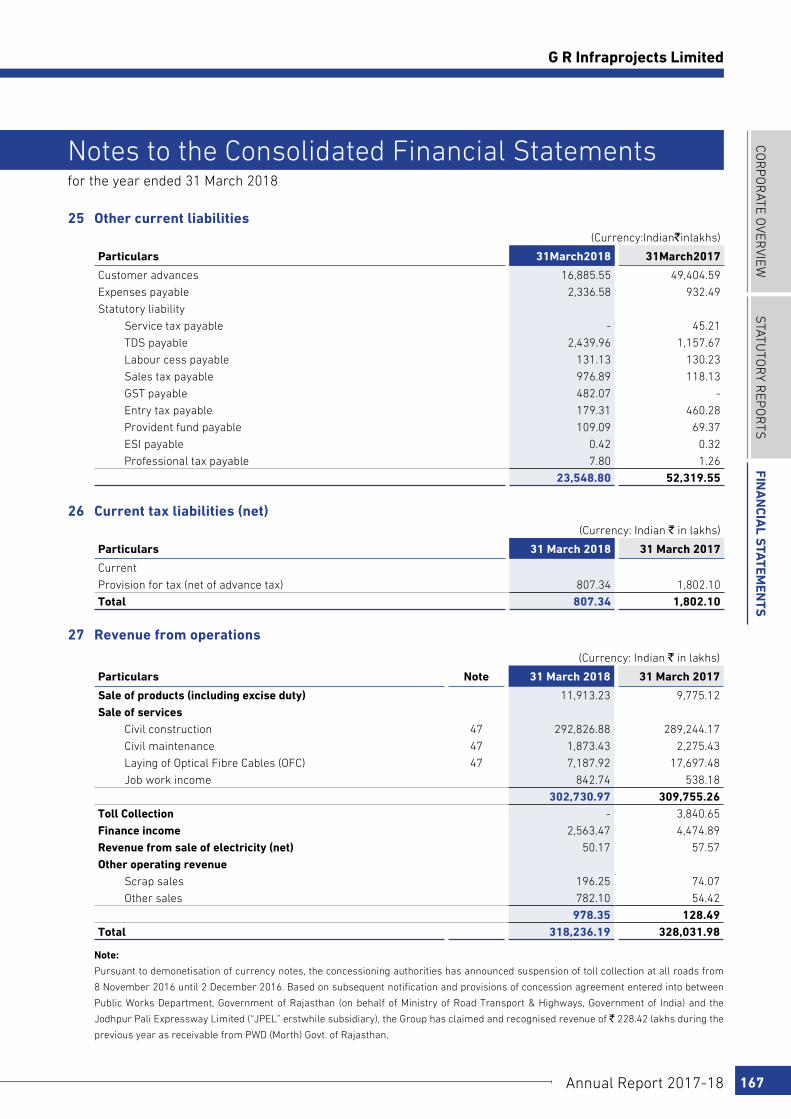
COR
PO
RATE O
VERVIEW
STATu
TOR
y REP
OR
TSFin
an
cial S
tatemen
tS
Annual Report 2017-18 167
G R Infraprojects Limited
for the year ended 31 March 2018
Notes to the Consolidated Financial Statements
25 Other current liabilities(Currency:Indian`inlakhs)
Particulars 31March2018 31March2017
Customer advances 16,885.55 49,404.59
Expenses payable 2,336.58 932.49
Statutory liability
Service tax payable - 45.21
TDS payable 2,439.96 1,157.67
Labour cess payable 131.13 130.23
Sales tax payable 976.89 118.13
GST payable 482.07 -
Entry tax payable 179.31 460.28
Provident fund payable 109.09 69.37
ESI payable 0.42 0.32
Professional tax payable 7.80 1.26
23,548.80 52,319.55
26 Current tax liabilities (net)(Currency: Indian ` in lakhs)
Particulars 31 March 2018 31 March 2017
Current
Provision for tax (net of advance tax) 807.34 1,802.10
Total 807.34 1,802.10
27 Revenue from operations
(Currency: Indian ` in lakhs)
Particulars Note 31 March 2018 31 March 2017
Sale of products (including excise duty) 11,913.23 9,775.12
Sale of servicesCivil construction 47 292,826.88 289,244.17
Civil maintenance 47 1,873.43 2,275.43
Laying of Optical Fibre Cables (OFC) 47 7,187.92 17,697.48
Job work income 842.74 538.18
302,730.97 309,755.26Toll Collection - 3,840.65
Finance income 2,563.47 4,474.89
Revenue from sale of electricity (net) 50.17 57.57
Other operating revenueScrap sales 196.25 74.07
Other sales 782.10 54.42
978.35 128.49Total 318,236.19 328,031.98
Note:
Pursuant to demonetisation of currency notes, the concessioning authorities has announced suspension of toll collection at all roads from
8 November 2016 until 2 December 2016. Based on subsequent notification and provisions of concession agreement entered into between
Public Works Department, Government of Rajasthan (on behalf of Ministry of Road Transport & Highways, Government of India) and the
Jodhpur Pali Expressway Limited (“JPEL” erstwhile subsidiary), the Group has claimed and recognised revenue of ` 228.42 lakhs during the
previous year as receivable from PWD (Morth) Govt. of Rajasthan.
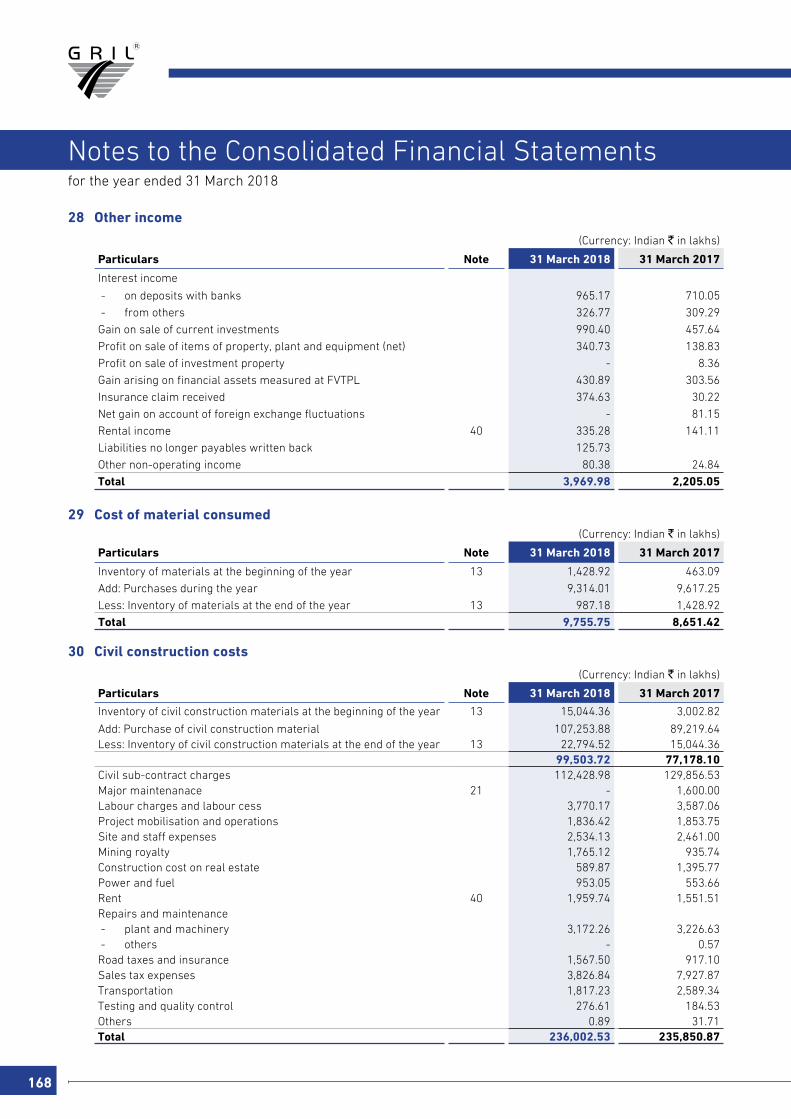
168
for the year ended 31 March 2018
Notes to the Consolidated Financial Statements
28 Other income
(Currency: Indian ` in lakhs)
Particulars Note 31 March 2018 31 March 2017
Interest income
- on deposits with banks 965.17 710.05
- from others 326.77 309.29
Gain on sale of current investments 990.40 457.64
Profit on sale of items of property, plant and equipment (net) 340.73 138.83
Profit on sale of investment property - 8.36
Gain arising on financial assets measured at FVTPL 430.89 303.56
Insurance claim received 374.63 30.22
Net gain on account of foreign exchange fluctuations - 81.15
Rental income 40 335.28 141.11
Liabilities no longer payables written back 125.73
Other non-operating income 80.38 24.84
Total 3,969.98 2,205.05
29 Cost of material consumed(Currency: Indian ` in lakhs)
Particulars Note 31 March 2018 31 March 2017
Inventory of materials at the beginning of the year 13 1,428.92 463.09
Add: Purchases during the year 9,314.01 9,617.25
Less: Inventory of materials at the end of the year 13 987.18 1,428.92
Total 9,755.75 8,651.42
30 Civil construction costs
(Currency: Indian ` in lakhs)
Particulars Note 31 March 2018 31 March 2017
Inventory of civil construction materials at the beginning of the year 13 15,044.36 3,002.82
Add: Purchase of civil construction material 107,253.88 89,219.64Less: Inventory of civil construction materials at the end of the year 13 22,794.52 15,044.36
99,503.72 77,178.10Civil sub-contract charges 112,428.98 129,856.53Major maintenanace 21 - 1,600.00Labour charges and labour cess 3,770.17 3,587.06Project mobilisation and operations 1,836.42 1,853.75Site and staff expenses 2,534.13 2,461.00Mining royalty 1,765.12 935.74Construction cost on real estate 589.87 1,395.77Power and fuel 953.05 553.66Rent 40 1,959.74 1,551.51Repairs and maintenance - plant and machinery 3,172.26 3,226.63 - others - 0.57Road taxes and insurance 1,567.50 917.10Sales tax expenses 3,826.84 7,927.87Transportation 1,817.23 2,589.34Testing and quality control 276.61 184.53Others 0.89 31.71Total 236,002.53 235,850.87

COR
PO
RATE O
VERVIEW
STATu
TOR
y REP
OR
TSFin
an
cial S
tatemen
tS
Annual Report 2017-18 169
G R Infraprojects Limited
for the year ended 31 March 2018
Notes to the Consolidated Financial Statements
31 Changes in inventories of finished goods and trading goods
(Currency: Indian ` in lakhs)
Particulars Note 31 March 2018 31 March 2017
Opening inventory of trading goods (real estate) 13 5,288.58 3,892.82
Less: Closing inventory of trading goods (real estate) 13 5,878.45 5,288.58
(589.87) (1,395.76)Opening inventory of trading goods (others) 13 25.01 17.84
Less: Closing inventory of trading goods (others) 13 86.49 25.01
(61.48) (7.17)Opening inventory of finished goods 13 319.45 264.91
Less: Closing inventory of finished goods 13 361.49 319.45
(42.04) (54.54)Total (693.39) (1,457.47)
32 Changes in project work-in-progress
(Currency: Indian ` in lakhs)
Particulars Note 31 March 2018 31 March 2017
Opening stock of project work in progress 10 5,966.11 10,788.77
Less: Closing stock of project work in progress 10 17,607.38 5,966.11
Total (11,641.27) 4,822.66
33 Employee benefits expense
(Currency: Indian ` in lakhs)
Particulars Note 31 March 2018 31 March 2017
Salaries, wages and bonus 17,506.77 12,476.91
Contribution to gratuity, provident fund and other funds 38 641.66 449.13
Staff welfare expenses 66.09 192.16
Total 18,214.52 13,118.20
34 Finance costs
(Currency: Indian ` in lakhs)
Particulars 31 March 2018 31 March 2017
Interest on borrowings
- to banks 1,548.20 7,242.17
- to others 367.37 354.33
Interest on debentures 3,205.14 2,553.03
Other borrowing costs 1,474.96 2,434.03
Total 6,595.67 12,583.56
35 Depreciation and amortisation expense
(Currency: Indian ` in lakhs)
Particulars Note 31 March 2018 31 March 2017
Depreciation of property, plant and equipment 5 8,263.32 6,466.03
Amortisation of other intangible assets 8 49.41 409.04
Total 8,312.73 6,875.07
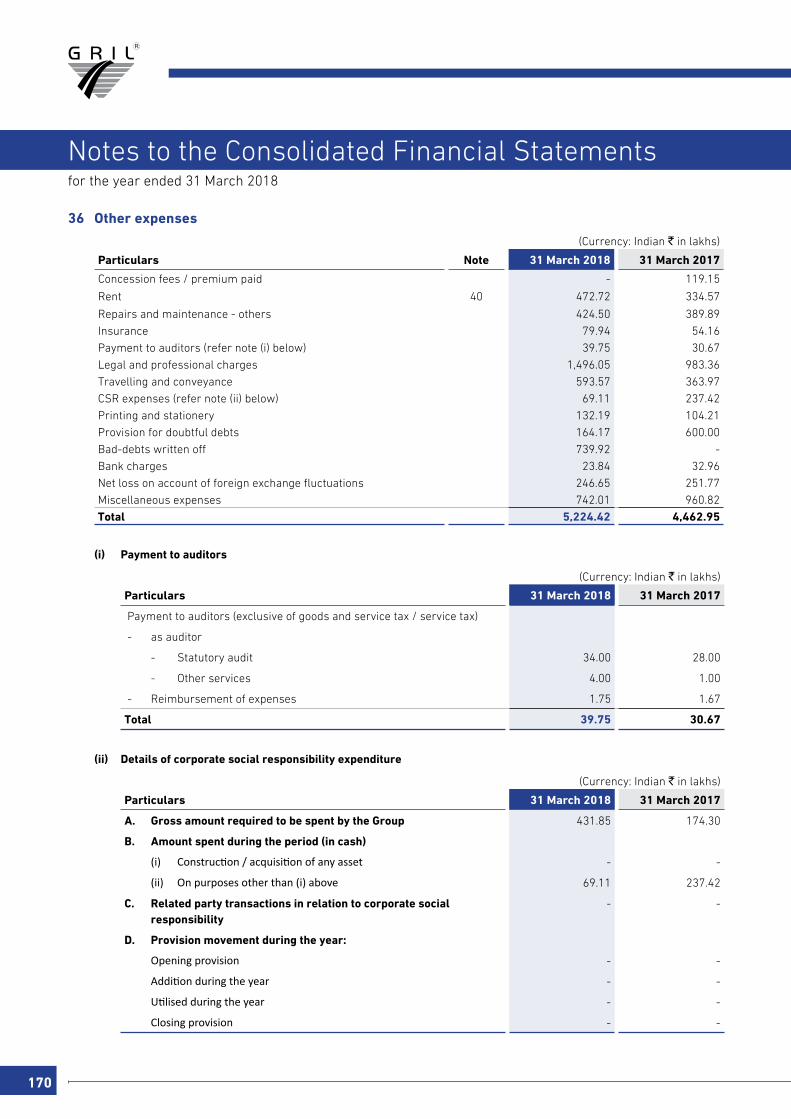
170
for the year ended 31 March 2018
Notes to the Consolidated Financial Statements
36 Other expenses
(Currency: Indian ` in lakhs)
Particulars Note 31 March 2018 31 March 2017
Concession fees / premium paid - 119.15
Rent 40 472.72 334.57
Repairs and maintenance - others 424.50 389.89
Insurance 79.94 54.16
Payment to auditors (refer note (i) below) 39.75 30.67
Legal and professional charges 1,496.05 983.36
Travelling and conveyance 593.57 363.97
CSR expenses (refer note (ii) below) 69.11 237.42
Printing and stationery 132.19 104.21
Provision for doubtful debts 164.17 600.00
Bad-debts written off 739.92 -
Bank charges 23.84 32.96
Net loss on account of foreign exchange fluctuations 246.65 251.77
Miscellaneous expenses 742.01 960.82
Total 5,224.42 4,462.95
(i) Payment to auditors
(Currency: Indian ` in lakhs)
Particulars 31 March 2018 31 March 2017
Payment to auditors (exclusive of goods and service tax / service tax)
- as auditor
- Statutory audit 34.00 28.00
- Other services 4.00 1.00
- Reimbursement of expenses 1.75 1.67
Total 39.75 30.67
(ii) Details of corporate social responsibility expenditure
(Currency: Indian ` in lakhs)
Particulars 31 March 2018 31 March 2017
A. Gross amount required to be spent by the Group 431.85 174.30
B. Amount spent during the period (in cash)
(i) Construction/acquisitionofanyasset - -
(ii) Onpurposesotherthan(i)above 69.11 237.42
C. Related party transactions in relation to corporate social responsibility
- -
D. Provision movement during the year:
Openingprovision - -
Additionduringtheyear - -
Utilisedduringtheyear - -
Closingprovision - -
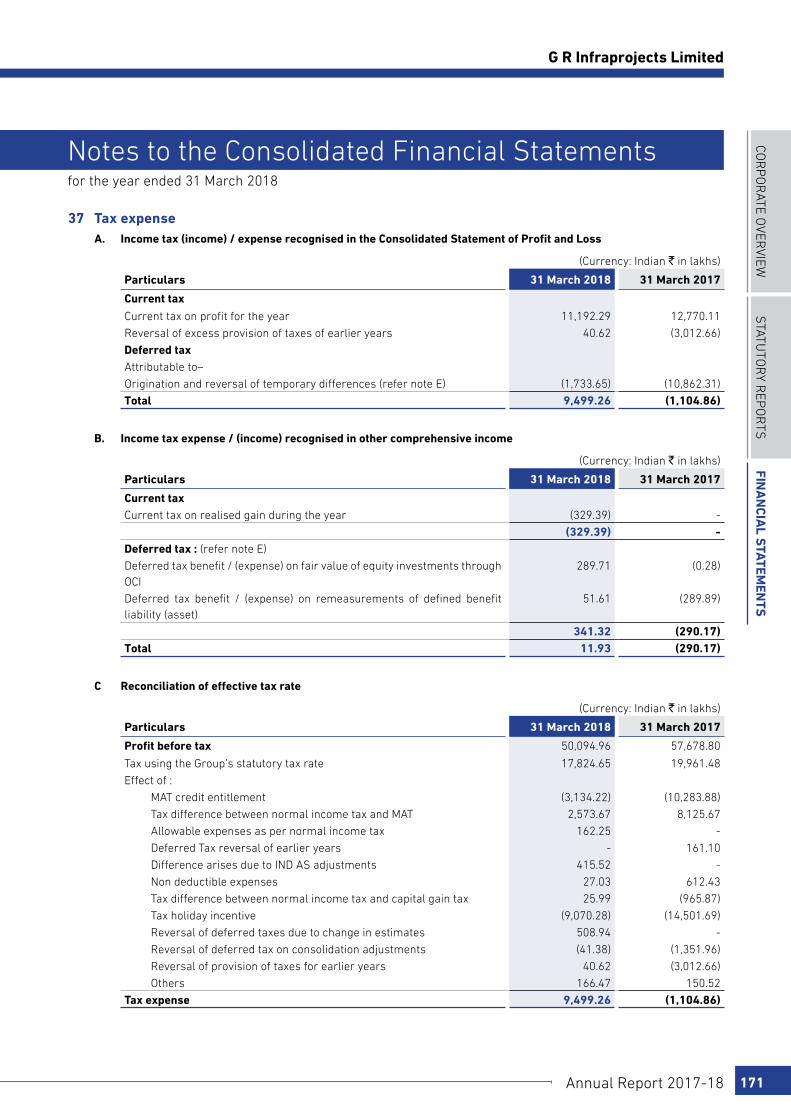
COR
PO
RATE O
VERVIEW
STATu
TOR
y REP
OR
TSFin
an
cial S
tatemen
tS
Annual Report 2017-18 171
G R Infraprojects Limited
for the year ended 31 March 2018
Notes to the Consolidated Financial Statements
37 Tax expense A. Income tax (income) / expense recognised in the Consolidated Statement of Profit and Loss
(Currency: Indian ` in lakhs)
Particulars 31 March 2018 31 March 2017
Current tax
Current tax on profit for the year 11,192.29 12,770.11
Reversal of excess provision of taxes of earlier years 40.62 (3,012.66)
Deferred taxAttributable to–
Origination and reversal of temporary differences (refer note E) (1,733.65) (10,862.31)
Total 9,499.26 (1,104.86)
B. Income tax expense / (income) recognised in other comprehensive income
(Currency: Indian ` in lakhs)
Particulars 31 March 2018 31 March 2017
Current taxCurrent tax on realised gain during the year (329.39) -
(329.39) -Deferred tax : (refer note E)
Deferred tax benefit / (expense) on fair value of equity investments through OCI
289.71 (0.28)
Deferred tax benefit / (expense) on remeasurements of defined benefit liability (asset)
51.61 (289.89)
341.32 (290.17)Total 11.93 (290.17)
C Reconciliation of effective tax rate
(Currency: Indian ` in lakhs)
Particulars 31 March 2018 31 March 2017
Profit before tax 50,094.96 57,678.80
Tax using the Group’s statutory tax rate 17,824.65 19,961.48
Effect of :
MAT credit entitlement (3,134.22) (10,283.88)
Tax difference between normal income tax and MAT 2,573.67 8,125.67
Allowable expenses as per normal income tax 162.25 -
Deferred Tax reversal of earlier years - 161.10
Difference arises due to IND AS adjustments 415.52 -
Non deductible expenses 27.03 612.43
Tax difference between normal income tax and capital gain tax 25.99 (965.87)
Tax holiday incentive (9,070.28) (14,501.69)
Reversal of deferred taxes due to change in estimates 508.94 -
Reversal of deferred tax on consolidation adjustments (41.38) (1,351.96)
Reversal of provision of taxes for earlier years 40.62 (3,012.66)
Others 166.47 150.52
Tax expense 9,499.26 (1,104.86)

172
for the year ended 31 March 2018
Notes to the Consolidated Financial Statements
37
Inco
me
tax
(con
tinu
ed)
D
. R
ecog
nise
d de
ferr
ed ta
x as
sets
and
liab
iliti
es
M
ovem
ent i
n te
mpo
rary
diff
eren
ces
(Cur
renc
y: In
dian
` in
lakh
s)
Par
ticu
lars
Def
erre
d ta
x (a
sset
s)D
efer
red
tax
liab
ilit
ies
Net
def
erre
d ta
x (a
sset
s) /
li
abil
itie
s
31 M
arch
201
8 3
1 M
arch
201
731
Mar
ch 2
018
31
Mar
ch 2
017
31 M
arch
201
831
Mar
ch 2
017
Diff
eren
ce b
etw
een
WD
V of
pro
pert
y, p
lant
and
equ
ipm
ent a
s pe
r bo
oks
and
inco
me
tax
--
484.
9926
0.16
484.
9926
0.16
Diff
eren
ce b
etw
een
WD
V of
oth
er in
tang
ible
ass
ets
--
--
--
Pro
visi
ons
for
empl
oyee
ben
efits
(92.
98)
(48.
15)
--
(92.
98)
(48.
15)
Diff
eren
ce i
n ca
rryi
ng v
alue
and
tax
bas
e of
inv
estm
ents
m
easu
red
at F
VOCI
--
0.13
289.
840.
1328
9.84
Diff
eren
ce i
n ca
rryi
ng v
alue
and
tax
bas
e of
inv
estm
ents
m
easu
red
at F
VTP
L-
-11
3.18
3.97
113.
183.
97
Diff
eren
ce in
car
ryin
g va
lue
and
tax
base
in m
easu
rem
ent
of
finan
cial
inst
rum
ent a
t am
ortis
ed c
ost
-(4
7.09
)59
5.15
-59
5.15
(47.
09)
Expe
nditu
re a
llow
able
on
paym
ent b
asis
(446
.62)
(204
.36)
--
(446
.62)
(204
.36)
Pro
visi
on fo
r do
ubtf
ul d
ebts
(56.
82)
(207
.65)
--
(56.
82)
(207
.65)
MAT
cre
dit e
ntitl
emen
t(1
2,90
9.16
)(1
0,28
3.88
)-
-(1
2,90
9.16
)(1
0,28
3.88
)
Def
erre
d ta
x (a
sset
s) /
liab
iliti
es(1
3,50
5.58
)(1
0,79
1.13
)1,
193.
4555
3.97
(12,
312.
13)
(10,
237.
16)
Net
def
erre
d ta
x (a
sset
s) /
liab
iliti
es(1
3,50
5.58
)(1
0,79
1.13
)1,
193.
4555
3.97
(12,
312.
13)
(10,
237.
16)
D
efer
red
tax
asse
t ha
s be
en r
ecog
nise
d as
the
Gro
up h
as a
dequ
ate
firm
ord
ers
and
exec
utio
n pl
an f
or t
he n
ext
3 fin
anci
al y
ears
and
is r
easo
nabl
y ce
rtai
n th
at t
he d
efer
red
tax
asse
t sha
ll be
rea
lised
aga
inst
futu
re ta
xabl
e in
com
es.
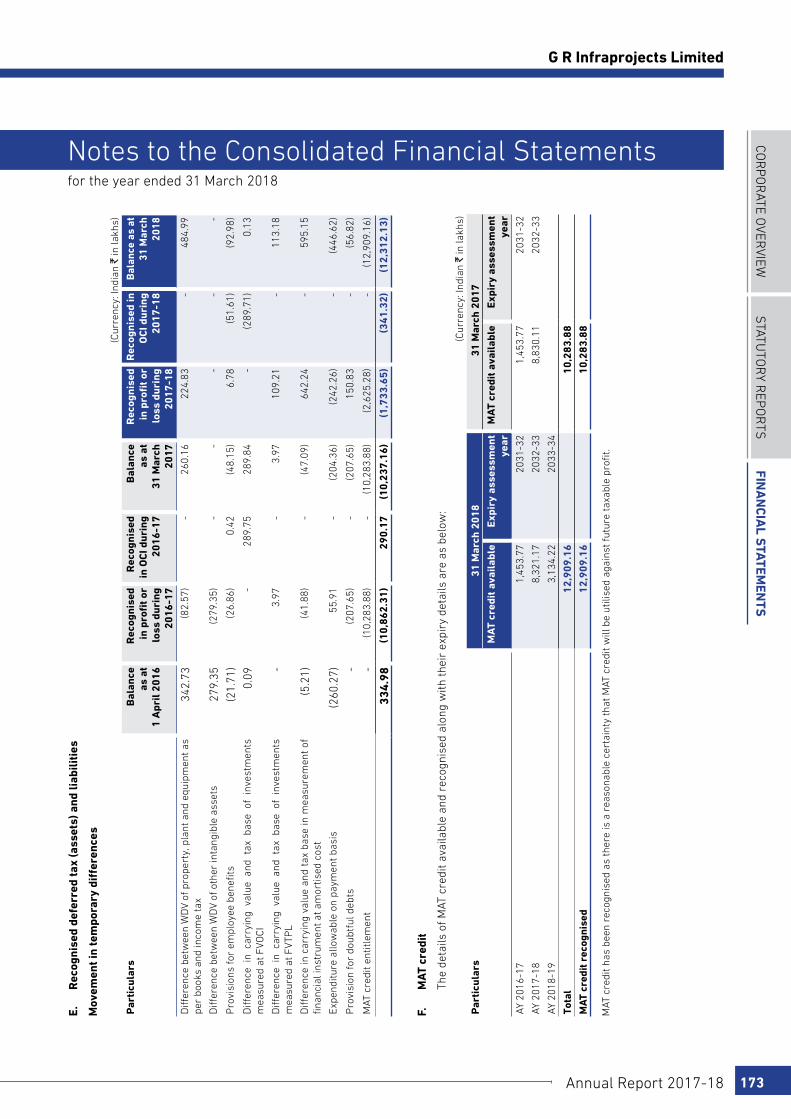
COR
PO
RATE O
VERVIEW
STATu
TOR
y REP
OR
TSFin
an
cial S
tatemen
tS
Annual Report 2017-18 173
G R Infraprojects Limited
for the year ended 31 March 2018
Notes to the Consolidated Financial Statements
E.
R
ecog
nise
d de
ferr
ed ta
x (a
sset
s) a
nd li
abili
ties
M
ovem
ent i
n te
mpo
rary
diff
eren
ces
(Cur
renc
y: In
dian
` in
lakh
s)
Par
ticu
lars
Bal
ance
as
at
1 A
pril
201
6
Rec
ogni
sed
in p
rofi
t or
lo
ss d
urin
g 20
16-1
7
Rec
ogni
sed
in O
CI d
urin
g 20
16-1
7
Bal
ance
as
at
31 M
arch
20
17
Rec
ogni
sed
in p
rofi
t or
lo
ss d
urin
g 20
17-1
8
Rec
ogni
sed
in
OC
I dur
ing
2017
-18
Bal
ance
as
at
31 M
arch
20
18
Diff
eren
ce b
etw
een
WD
V of
pro
pert
y, p
lant
and
equ
ipm
ent a
s pe
r bo
oks
and
inco
me
tax
342.
73(8
2.57
)-
260.
1622
4.83
-48
4.99
Diff
eren
ce b
etw
een
WD
V of
oth
er in
tang
ible
ass
ets
279.
35(2
79.3
5)-
--
--
Pro
visi
ons
for
empl
oyee
ben
efits
(21.
71)
(26.
86)
0.42
(48.
15)
6.78
(51.
61)
(92.
98)
Diff
eren
ce i
n ca
rryi
ng v
alue
and
tax
bas
e of
inv
estm
ents
m
easu
red
at F
VOCI
0.09
-28
9.75
289.
84-
(289
.71)
0.13
Diff
eren
ce i
n ca
rryi
ng v
alue
and
tax
bas
e of
inv
estm
ents
m
easu
red
at F
VTP
L-
3.97
-3.
9710
9.21
-11
3.18
Diff
eren
ce in
car
ryin
g va
lue
and
tax
base
in m
easu
rem
ent
of
finan
cial
inst
rum
ent a
t am
ortis
ed c
ost
(5.2
1)(4
1.88
)-
(47.
09)
642.
24-
595.
15
Expe
nditu
re a
llow
able
on
paym
ent b
asis
(260
.27)
55.9
1-
(204
.36)
(242
.26)
-(4
46.6
2)
Pro
visi
on fo
r do
ubtf
ul d
ebts
-(2
07.6
5)-
(207
.65)
150.
83-
(56.
82)
MAT
cre
dit e
ntitl
emen
t-
(10,
283.
88)
-(1
0,28
3.88
)(2
,625
.28)
-(1
2,90
9.16
)
334.
98(1
0,86
2.31
)29
0.17
(10,
237.
16)
(1,7
33.6
5)(3
41.3
2)(1
2,31
2.13
)
F.
M
AT c
redi
t
The
deta
ils o
f MAT
cre
dit a
vaila
ble
and
reco
gnis
ed a
long
with
thei
r ex
piry
det
ails
are
as
belo
w:
(Cur
renc
y: In
dian
` in
lakh
s)
Par
ticu
lars
31 M
arch
201
8 3
1 M
arch
201
7
MA
T cr
edit
ava
ilab
leE
xpir
y as
sess
men
t ye
arM
AT
cred
it a
vail
able
Exp
iry
asse
ssm
ent
year
AY 2
016-
17 1
,453
.77
2031
-32
1,4
53.7
7 20
31-3
2
AY 2
017-
18 8
,321
.17
2032
-33
8,8
30.1
1 20
32-3
3
AY 2
018-
19 3
,134
.22
2033
-34
Tota
l 1
2,90
9.16
1
0,28
3.88
MAT
cre
dit r
ecog
nise
d 1
2,90
9.16
1
0,28
3.88
M
AT c
redi
t has
bee
n re
cogn
ised
as
ther
e is
a r
easo
nabl
e ce
rtai
nty
that
MAT
cre
dit w
ill b
e ut
ilise
d ag
ains
t fut
ure
taxa
ble
profi
t.
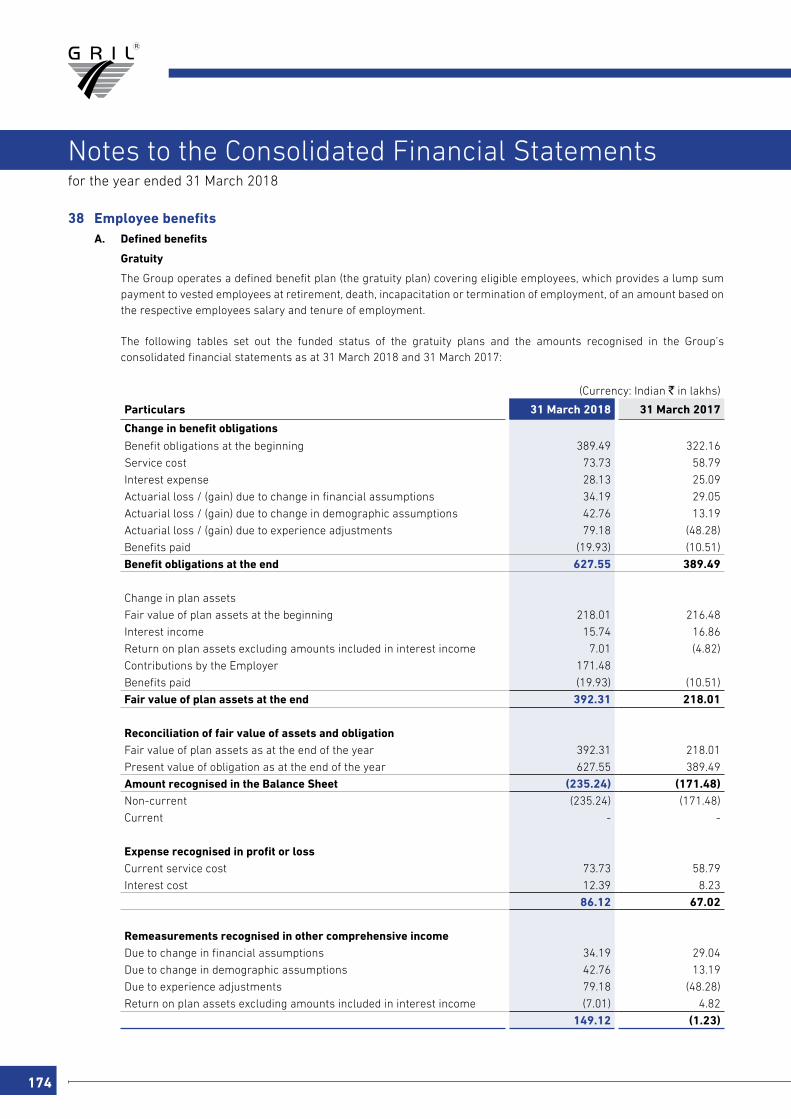
174
for the year ended 31 March 2018
Notes to the Consolidated Financial Statements
38 Employee benefits A. Defined benefits
Gratuity
The Group operates a defined benefit plan (the gratuity plan) covering eligible employees, which provides a lump sum payment to vested employees at retirement, death, incapacitation or termination of employment, of an amount based on the respective employees salary and tenure of employment.
The following tables set out the funded status of the gratuity plans and the amounts recognised in the Group’s consolidated financial statements as at 31 March 2018 and 31 March 2017:
(Currency: Indian ` in lakhs)
Particulars 31 March 2018 31 March 2017
Change in benefit obligations
Benefit obligations at the beginning 389.49 322.16
Service cost 73.73 58.79
Interest expense 28.13 25.09
Actuarial loss / (gain) due to change in financial assumptions 34.19 29.05
Actuarial loss / (gain) due to change in demographic assumptions 42.76 13.19
Actuarial loss / (gain) due to experience adjustments 79.18 (48.28)
Benefits paid (19.93) (10.51)
Benefit obligations at the end 627.55 389.49
Change in plan assets
Fair value of plan assets at the beginning 218.01 216.48
Interest income 15.74 16.86
Return on plan assets excluding amounts included in interest income 7.01 (4.82)
Contributions by the Employer 171.48
Benefits paid (19.93) (10.51)
Fair value of plan assets at the end 392.31 218.01
Reconciliation of fair value of assets and obligationFair value of plan assets as at the end of the year 392.31 218.01
Present value of obligation as at the end of the year 627.55 389.49
Amount recognised in the Balance Sheet (235.24) (171.48)Non-current (235.24) (171.48)
Current - -
Expense recognised in profit or lossCurrent service cost 73.73 58.79
Interest cost 12.39 8.23
86.12 67.02
Remeasurements recognised in other comprehensive incomeDue to change in financial assumptions 34.19 29.04
Due to change in demographic assumptions 42.76 13.19
Due to experience adjustments 79.18 (48.28)
Return on plan assets excluding amounts included in interest income (7.01) 4.82
149.12 (1.23)

COR
PO
RATE O
VERVIEW
STATu
TOR
y REP
OR
TSFin
an
cial S
tatemen
tS
Annual Report 2017-18 175
G R Infraprojects Limited
for the year ended 31 March 2018
Notes to the Consolidated Financial Statements
Experience adjustment on gratuity:
Particulars 31 March 2018 31 March 2017
Actuarial assumptions
Discount rate 7.50% 7.22%
Salary growth rate For workers 4% and For staff 7%
6.00%
Withdrawal rates For workers 35% and For Staff - For
service 4 years and below 25% p.a. For
Service 5 years and above 2% p.a.
For service 4 years and below 33.62% p.a. For Service 5
years and above 2% p.a.
Sensitivity analysis
Reasonably possible changes at the reporting date to one of the relevant actuarial assumptions, holding other assumptions constant, would have affected the defined benefit obligation by the amounts shown below:
Particulars 31 March 2018 31 March 2017Increase Decrease Increase Decrease
Discount rate (1% movement) (60.37) 73.27 (48.88) 59.88
Salary growth rate (1% movement) 73.00 (61.24) 60.01 (49.81)
Attrition rate (1% movement) (0.39) (0.10) 5.06 (6.25)
The sensitivity analyses presented above may not be representative of the actual change in the defined benefit obligation as it is unlikely that the change in assumptions would occur in isolation of one another as some of the assumptions may be correlated. Furthermore, in presenting the above sensitivity analysis, the present value of the defined benefit obligation has been calculated using the projected unit credit method at the end of the reporting period, which is the same as that applied in calculating the defined benefit obligation liability recognised in the consolidated balance sheet.
The Holding Company’s Gratuity Fund is managed by HDFC Standard Life Insurance Company Limited, SBI life Insurance Company Limited and Life Insurance Coporation (LIC). The plan assets under the fund are deposited under approved securities by them.
The expected rate of return on assets is based on the expectation of the average long term rate of return on investment of the fund, during the estimated term of obligation.
The expected contribution in next year is ` 359.49 lakhs (31 March 2017 : ` 245.21 lakhs).
The obligations are measured at the present value of estimated future cash flows by using a discount rate that is determined with reference to the market yields at the consolidated balance sheet date on Government Bonds which is consistent with the estimated terms of the obligation.
The estimate of future salary increase, considered in the actuarial valuation, takes account of inflation, security, promotion and other relevant factors such as supply and demand in the employment market.
B. Other long term employee benefits
Leave benefits
Amount of ̀ 65.76 lakhs (31 March 2017: ̀ 10.61 lakhs) towards leave benefits is recognised as an expense and included in “Employee benefits expense” in the Consolidated Statement of Profit and Loss.
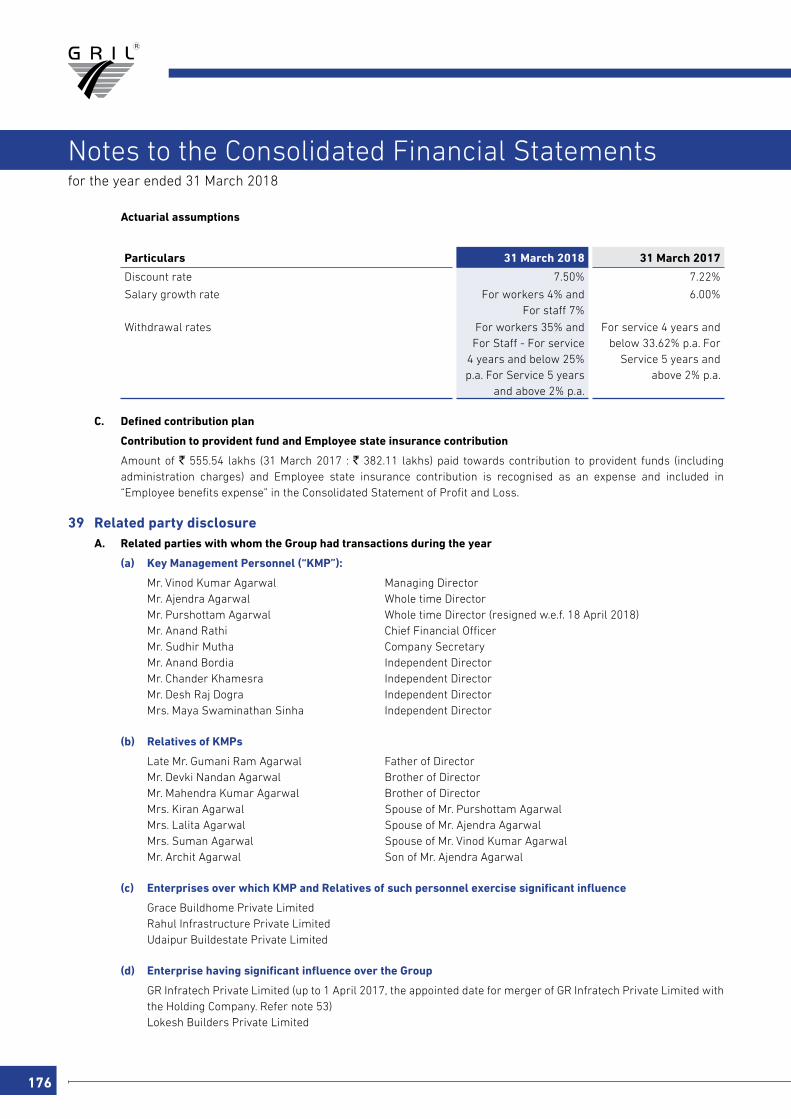
176
for the year ended 31 March 2018
Notes to the Consolidated Financial Statements
Actuarial assumptions
Particulars 31 March 2018 31 March 2017
Discount rate 7.50% 7.22%
Salary growth rate For workers 4% and For staff 7%
6.00%
Withdrawal rates For workers 35% and For Staff - For service
4 years and below 25% p.a. For Service 5 years
and above 2% p.a.
For service 4 years and below 33.62% p.a. For
Service 5 years and above 2% p.a.
C. Defined contribution plan
Contribution to provident fund and Employee state insurance contribution
Amount of ` 555.54 lakhs (31 March 2017 : ` 382.11 lakhs) paid towards contribution to provident funds (including administration charges) and Employee state insurance contribution is recognised as an expense and included in “Employee benefits expense” in the Consolidated Statement of Profit and Loss.
39 Related party disclosure A. Related parties with whom the Group had transactions during the year
(a) Key Management Personnel (“KMP”):
Mr. Vinod Kumar Agarwal Managing Director Mr. Ajendra Agarwal Whole time Director Mr. Purshottam Agarwal Whole time Director (resigned w.e.f. 18 April 2018) Mr. Anand Rathi Chief Financial Officer Mr. Sudhir Mutha Company Secretary Mr. Anand Bordia Independent Director Mr. Chander Khamesra Independent Director Mr. Desh Raj Dogra Independent Director Mrs. Maya Swaminathan Sinha Independent Director
(b) Relatives of KMPs
Late Mr. Gumani Ram Agarwal Father of Director Mr. Devki Nandan Agarwal Brother of Director Mr. Mahendra Kumar Agarwal Brother of Director Mrs. Kiran Agarwal Spouse of Mr. Purshottam Agarwal Mrs. Lalita Agarwal Spouse of Mr. Ajendra Agarwal Mrs. Suman Agarwal Spouse of Mr. Vinod Kumar Agarwal Mr. Archit Agarwal Son of Mr. Ajendra Agarwal
(c) Enterprises over which KMP and Relatives of such personnel exercise significant influence
Grace Buildhome Private Limited Rahul Infrastructure Private Limited Udaipur Buildestate Private Limited
(d) Enterprise having significant influence over the Group
GR Infratech Private Limited (up to 1 April 2017, the appointed date for merger of GR Infratech Private Limited with the Holding Company. Refer note 53)
Lokesh Builders Private Limited
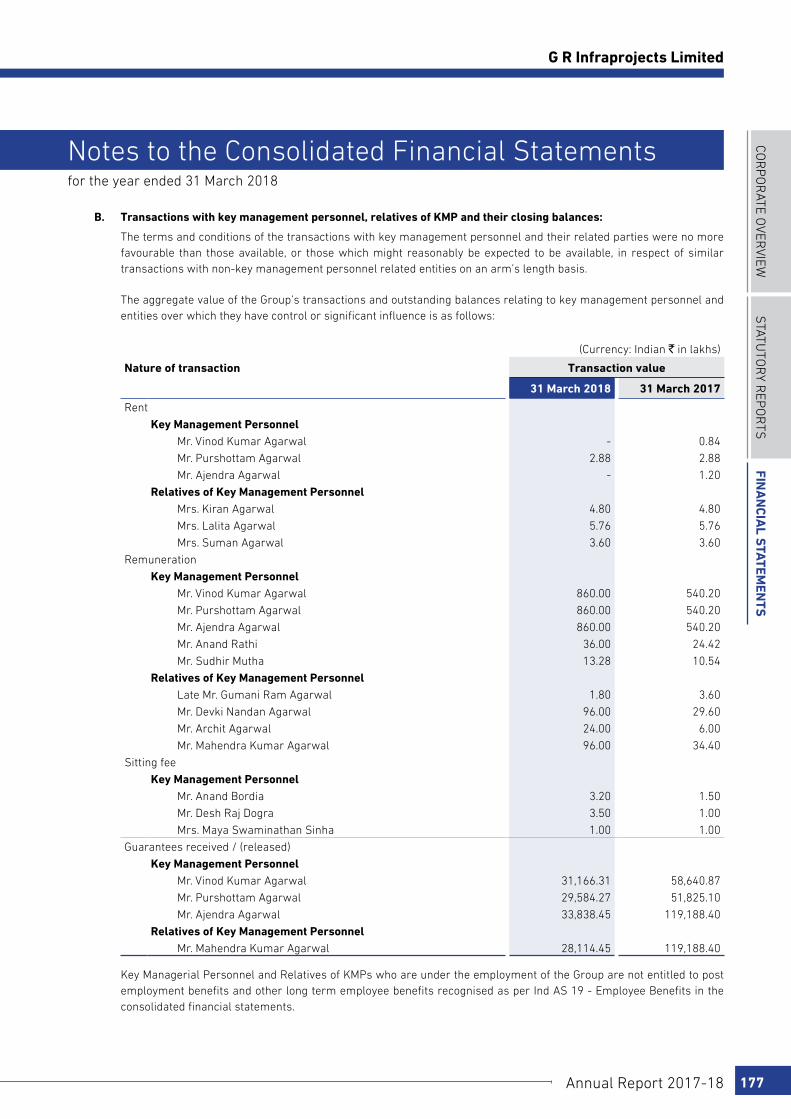
COR
PO
RATE O
VERVIEW
STATu
TOR
y REP
OR
TSFin
an
cial S
tatemen
tS
Annual Report 2017-18 177
G R Infraprojects Limited
for the year ended 31 March 2018
Notes to the Consolidated Financial Statements
B. Transactions with key management personnel, relatives of KMP and their closing balances:
The terms and conditions of the transactions with key management personnel and their related parties were no more favourable than those available, or those which might reasonably be expected to be available, in respect of similar transactions with non-key management personnel related entities on an arm’s length basis.
The aggregate value of the Group’s transactions and outstanding balances relating to key management personnel and entities over which they have control or significant influence is as follows:
(Currency: Indian ` in lakhs)
Nature of transaction Transaction value
31 March 2018 31 March 2017
Rent
Key Management PersonnelMr. Vinod Kumar Agarwal - 0.84
Mr. Purshottam Agarwal 2.88 2.88
Mr. Ajendra Agarwal - 1.20
Relatives of Key Management PersonnelMrs. Kiran Agarwal 4.80 4.80
Mrs. Lalita Agarwal 5.76 5.76
Mrs. Suman Agarwal 3.60 3.60
Remuneration
Key Management PersonnelMr. Vinod Kumar Agarwal 860.00 540.20
Mr. Purshottam Agarwal 860.00 540.20
Mr. Ajendra Agarwal 860.00 540.20
Mr. Anand Rathi 36.00 24.42
Mr. Sudhir Mutha 13.28 10.54
Relatives of Key Management PersonnelLate Mr. Gumani Ram Agarwal 1.80 3.60
Mr. Devki Nandan Agarwal 96.00 29.60
Mr. Archit Agarwal 24.00 6.00
Mr. Mahendra Kumar Agarwal 96.00 34.40
Sitting fee
Key Management PersonnelMr. Anand Bordia 3.20 1.50
Mr. Desh Raj Dogra 3.50 1.00
Mrs. Maya Swaminathan Sinha 1.00 1.00
Guarantees received / (released)
Key Management PersonnelMr. Vinod Kumar Agarwal 31,166.31 58,640.87
Mr. Purshottam Agarwal 29,584.27 51,825.10
Mr. Ajendra Agarwal 33,838.45 119,188.40
Relatives of Key Management PersonnelMr. Mahendra Kumar Agarwal 28,114.45 119,188.40
Key Managerial Personnel and Relatives of KMPs who are under the employment of the Group are not entitled to post employment benefits and other long term employee benefits recognised as per Ind AS 19 - Employee Benefits in the consolidated financial statements.
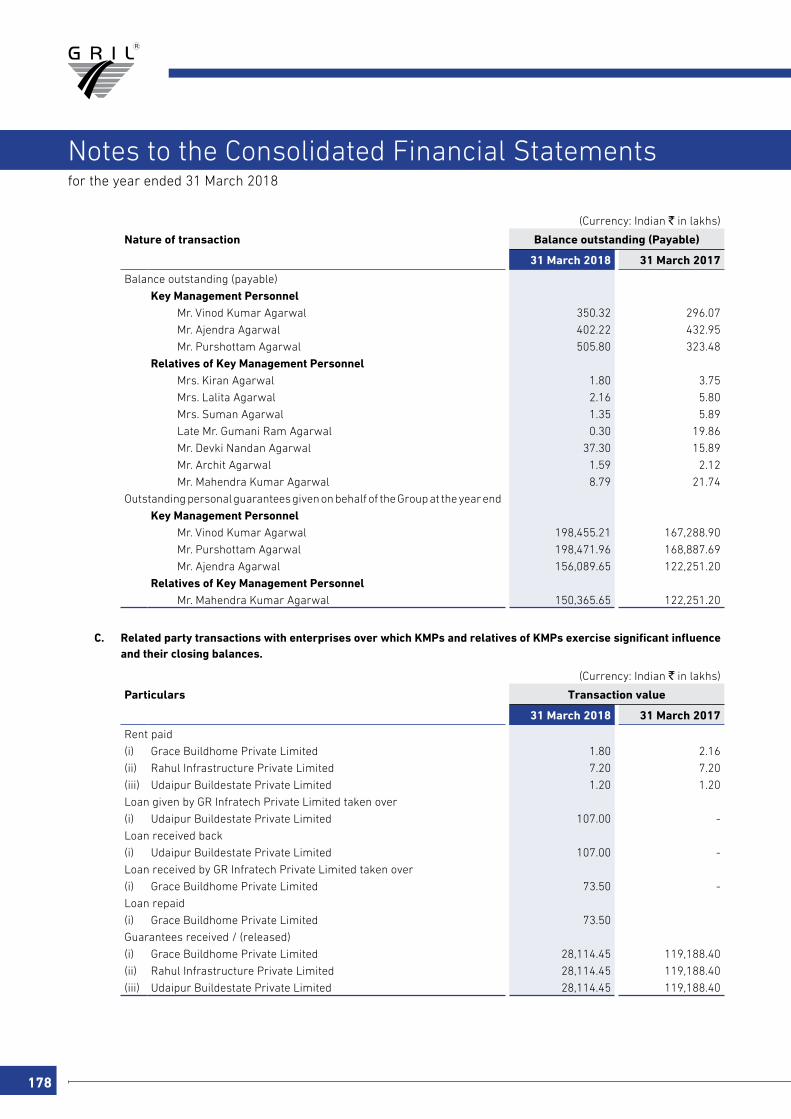
178
for the year ended 31 March 2018
Notes to the Consolidated Financial Statements
(Currency: Indian ` in lakhs)
Nature of transaction Balance outstanding (Payable)
31 March 2018 31 March 2017
Balance outstanding (payable)
Key Management PersonnelMr. Vinod Kumar Agarwal 350.32 296.07
Mr. Ajendra Agarwal 402.22 432.95
Mr. Purshottam Agarwal 505.80 323.48
Relatives of Key Management PersonnelMrs. Kiran Agarwal 1.80 3.75
Mrs. Lalita Agarwal 2.16 5.80
Mrs. Suman Agarwal 1.35 5.89
Late Mr. Gumani Ram Agarwal 0.30 19.86
Mr. Devki Nandan Agarwal 37.30 15.89
Mr. Archit Agarwal 1.59 2.12
Mr. Mahendra Kumar Agarwal 8.79 21.74
Outstanding personal guarantees given on behalf of the Group at the year end
Key Management PersonnelMr. Vinod Kumar Agarwal 198,455.21 167,288.90
Mr. Purshottam Agarwal 198,471.96 168,887.69
Mr. Ajendra Agarwal 156,089.65 122,251.20
Relatives of Key Management PersonnelMr. Mahendra Kumar Agarwal 150,365.65 122,251.20
C. Related party transactions with enterprises over which KMPs and relatives of KMPs exercise significant influence and their closing balances.
(Currency: Indian ` in lakhs)
Particulars Transaction value
31 March 2018 31 March 2017
Rent paid
(i) Grace Buildhome Private Limited 1.80 2.16
(ii) Rahul Infrastructure Private Limited 7.20 7.20
(iii) Udaipur Buildestate Private Limited 1.20 1.20
Loan given by GR Infratech Private Limited taken over
(i) Udaipur Buildestate Private Limited 107.00 -
Loan received back
(i) Udaipur Buildestate Private Limited 107.00 -
Loan received by GR Infratech Private Limited taken over
(i) Grace Buildhome Private Limited 73.50 -
Loan repaid
(i) Grace Buildhome Private Limited 73.50
Guarantees received / (released)
(i) Grace Buildhome Private Limited 28,114.45 119,188.40
(ii) Rahul Infrastructure Private Limited 28,114.45 119,188.40
(iii) Udaipur Buildestate Private Limited 28,114.45 119,188.40
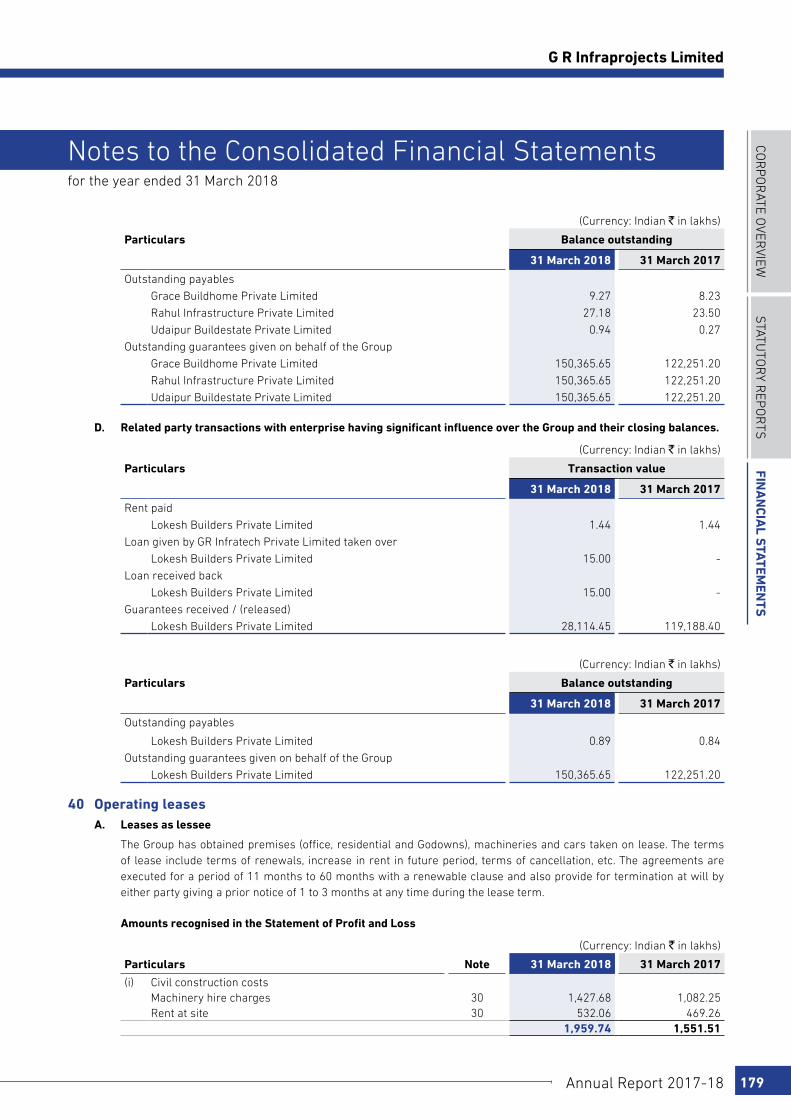
COR
PO
RATE O
VERVIEW
STATu
TOR
y REP
OR
TSFin
an
cial S
tatemen
tS
Annual Report 2017-18 179
G R Infraprojects Limited
for the year ended 31 March 2018
Notes to the Consolidated Financial Statements
(Currency: Indian ` in lakhs)
Particulars Balance outstanding
31 March 2018 31 March 2017
Outstanding payables
Grace Buildhome Private Limited 9.27 8.23
Rahul Infrastructure Private Limited 27.18 23.50
Udaipur Buildestate Private Limited 0.94 0.27
Outstanding guarantees given on behalf of the Group
Grace Buildhome Private Limited 150,365.65 122,251.20
Rahul Infrastructure Private Limited 150,365.65 122,251.20
Udaipur Buildestate Private Limited 150,365.65 122,251.20
D. Related party transactions with enterprise having significant influence over the Group and their closing balances.
(Currency: Indian ` in lakhs)
Particulars Transaction value
31 March 2018 31 March 2017
Rent paid
Lokesh Builders Private Limited 1.44 1.44
Loan given by GR Infratech Private Limited taken over
Lokesh Builders Private Limited 15.00 -
Loan received back
Lokesh Builders Private Limited 15.00 -
Guarantees received / (released)
Lokesh Builders Private Limited 28,114.45 119,188.40
(Currency: Indian ` in lakhs)
Particulars Balance outstanding
31 March 2018 31 March 2017
Outstanding payables
Lokesh Builders Private Limited 0.89 0.84
Outstanding guarantees given on behalf of the Group
Lokesh Builders Private Limited 150,365.65 122,251.20
40 Operating leases A. Leases as lessee
The Group has obtained premises (office, residential and Godowns), machineries and cars taken on lease. The terms of lease include terms of renewals, increase in rent in future period, terms of cancellation, etc. The agreements are executed for a period of 11 months to 60 months with a renewable clause and also provide for termination at will by either party giving a prior notice of 1 to 3 months at any time during the lease term.
Amounts recognised in the Statement of Profit and Loss
(Currency: Indian ` in lakhs)
Particulars Note 31 March 2018 31 March 2017
(i) Civil construction costsMachinery hire charges 30 1,427.68 1,082.25 Rent at site 30 532.06 469.26
1,959.74 1,551.51
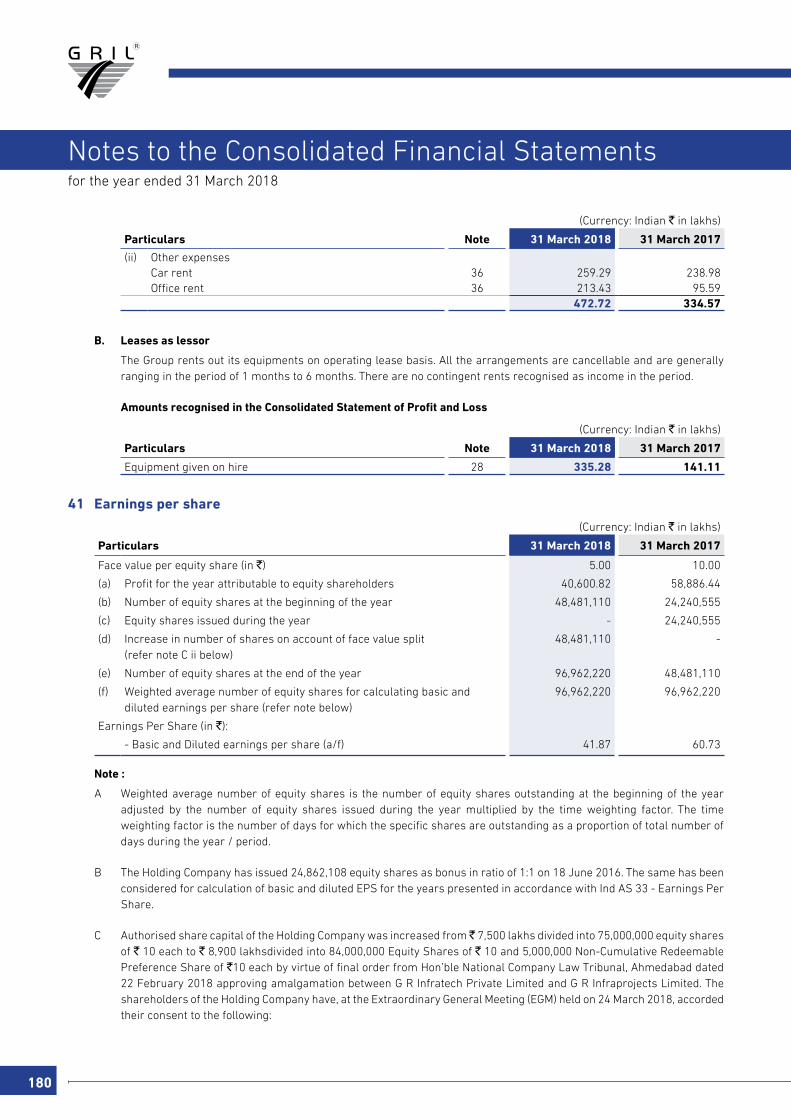
180
for the year ended 31 March 2018
Notes to the Consolidated Financial Statements
(Currency: Indian ` in lakhs)
Particulars Note 31 March 2018 31 March 2017
(ii) Other expensesCar rent 36 259.29 238.98 Office rent 36 213.43 95.59
472.72 334.57
B. Leases as lessor
The Group rents out its equipments on operating lease basis. All the arrangements are cancellable and are generally ranging in the period of 1 months to 6 months. There are no contingent rents recognised as income in the period.
Amounts recognised in the Consolidated Statement of Profit and Loss
(Currency: Indian ` in lakhs)
Particulars Note 31 March 2018 31 March 2017
Equipment given on hire 28 335.28 141.11
41 Earnings per share
(Currency: Indian ` in lakhs)
Particulars 31 March 2018 31 March 2017
Face value per equity share (in `) 5.00 10.00
(a) Profit for the year attributable to equity shareholders 40,600.82 58,886.44
(b) Number of equity shares at the beginning of the year 48,481,110 24,240,555
(c) Equity shares issued during the year - 24,240,555
(d) Increase in number of shares on account of face value split (refer note C ii below)
48,481,110 -
(e) Number of equity shares at the end of the year 96,962,220 48,481,110
(f) Weighted average number of equity shares for calculating basic and diluted earnings per share (refer note below)
96,962,220 96,962,220
Earnings Per Share (in `):
- Basic and Diluted earnings per share (a/f) 41.87 60.73
Note :
A Weighted average number of equity shares is the number of equity shares outstanding at the beginning of the year adjusted by the number of equity shares issued during the year multiplied by the time weighting factor. The time weighting factor is the number of days for which the specific shares are outstanding as a proportion of total number of days during the year / period.
B The Holding Company has issued 24,862,108 equity shares as bonus in ratio of 1:1 on 18 June 2016. The same has been considered for calculation of basic and diluted EPS for the years presented in accordance with Ind AS 33 - Earnings Per Share.
C Authorised share capital of the Holding Company was increased from ̀ 7,500 lakhs divided into 75,000,000 equity shares of ` 10 each to ` 8,900 lakhsdivided into 84,000,000 Equity Shares of ` 10 and 5,000,000 Non-Cumulative Redeemable Preference Share of `10 each by virtue of final order from Hon’ble National Company Law Tribunal, Ahmedabad dated 22 February 2018 approving amalgamation between G R Infratech Private Limited and G R Infraprojects Limited. The shareholders of the Holding Company have, at the Extraordinary General Meeting (EGM) held on 24 March 2018, accorded their consent to the following:
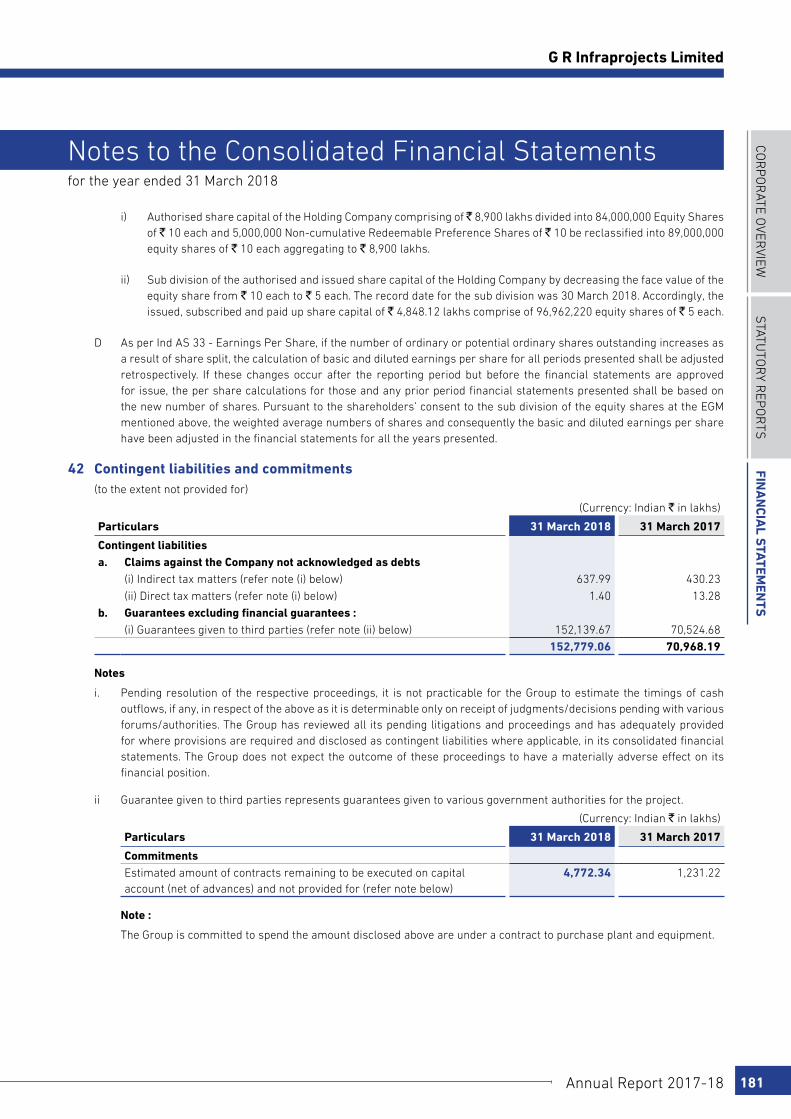
COR
PO
RATE O
VERVIEW
STATu
TOR
y REP
OR
TSFin
an
cial S
tatemen
tS
Annual Report 2017-18 181
G R Infraprojects Limited
for the year ended 31 March 2018
Notes to the Consolidated Financial Statements
i) Authorised share capital of the Holding Company comprising of ̀ 8,900 lakhs divided into 84,000,000 Equity Shares of ` 10 each and 5,000,000 Non-cumulative Redeemable Preference Shares of ` 10 be reclassified into 89,000,000 equity shares of ` 10 each aggregating to ` 8,900 lakhs.
ii) Sub division of the authorised and issued share capital of the Holding Company by decreasing the face value of the equity share from ` 10 each to ` 5 each. The record date for the sub division was 30 March 2018. Accordingly, the issued, subscribed and paid up share capital of ` 4,848.12 lakhs comprise of 96,962,220 equity shares of ` 5 each.
D As per Ind AS 33 - Earnings Per Share, if the number of ordinary or potential ordinary shares outstanding increases as a result of share split, the calculation of basic and diluted earnings per share for all periods presented shall be adjusted retrospectively. If these changes occur after the reporting period but before the financial statements are approved for issue, the per share calculations for those and any prior period financial statements presented shall be based on the new number of shares. Pursuant to the shareholders’ consent to the sub division of the equity shares at the EGM mentioned above, the weighted average numbers of shares and consequently the basic and diluted earnings per share have been adjusted in the financial statements for all the years presented.
42 Contingent liabilities and commitments (to the extent not provided for)
(Currency: Indian ` in lakhs)
Particulars 31 March 2018 31 March 2017
Contingent liabilitiesa. Claims against the Company not acknowledged as debts
(i) Indirect tax matters (refer note (i) below) 637.99 430.23
(ii) Direct tax matters (refer note (i) below) 1.40 13.28
b. Guarantees excluding financial guarantees :(i) Guarantees given to third parties (refer note (ii) below) 152,139.67 70,524.68
152,779.06 70,968.19
Notes
i. Pending resolution of the respective proceedings, it is not practicable for the Group to estimate the timings of cash outflows, if any, in respect of the above as it is determinable only on receipt of judgments/decisions pending with various forums/authorities. The Group has reviewed all its pending litigations and proceedings and has adequately provided for where provisions are required and disclosed as contingent liabilities where applicable, in its consolidated financial statements. The Group does not expect the outcome of these proceedings to have a materially adverse effect on its financial position.
ii Guarantee given to third parties represents guarantees given to various government authorities for the project.
(Currency: Indian ` in lakhs)
Particulars 31 March 2018 31 March 2017
CommitmentsEstimated amount of contracts remaining to be executed on capital account (net of advances) and not provided for (refer note below)
4,772.34 1,231.22
Note :
The Group is committed to spend the amount disclosed above are under a contract to purchase plant and equipment.
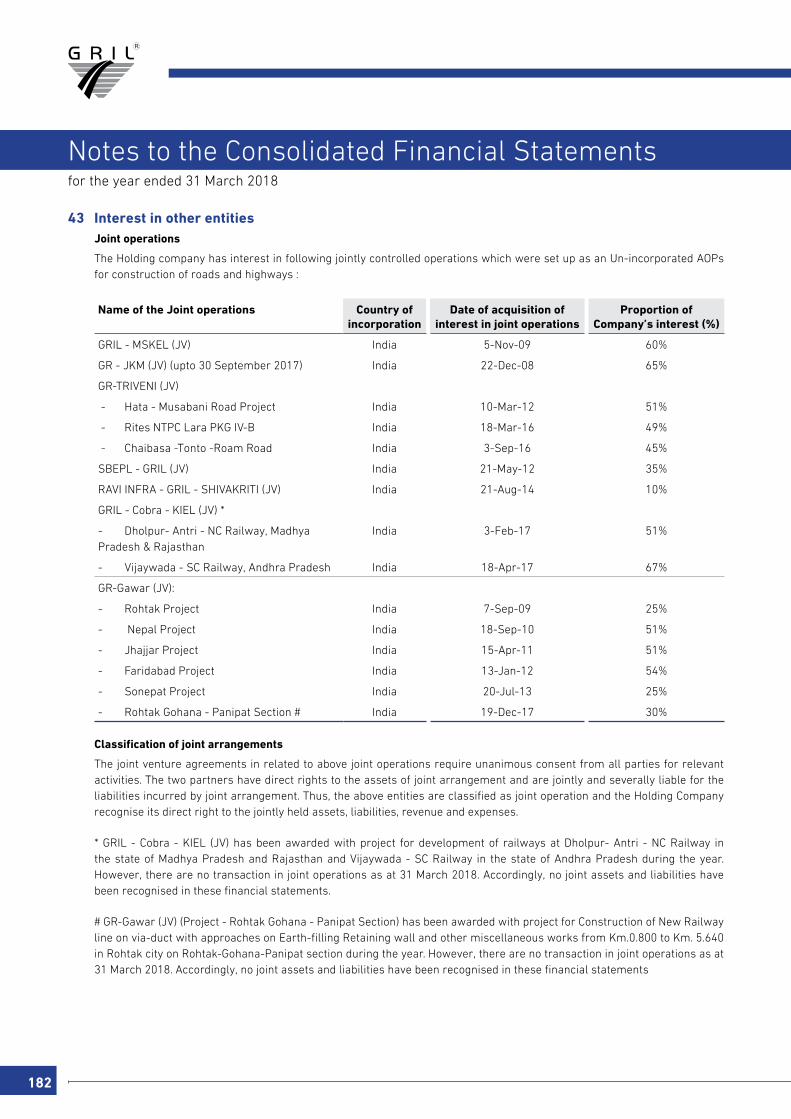
182
for the year ended 31 March 2018
Notes to the Consolidated Financial Statements
43 Interest in other entities Joint operations
The Holding company has interest in following jointly controlled operations which were set up as an Un-incorporated AOPs for construction of roads and highways :
Name of the Joint operations Country of incorporation
Date of acquisition of interest in joint operations
Proportion of Company’s interest (%)
GRIL - MSKEL (JV) India 5-Nov-09 60%
GR - JKM (JV) (upto 30 September 2017) India 22-Dec-08 65%
GR-TRIVENI (JV)
- Hata - Musabani Road Project India 10-Mar-12 51%
- Rites NTPC Lara PKG IV-B India 18-Mar-16 49%
- Chaibasa -Tonto -Roam Road India 3-Sep-16 45%
SBEPL - GRIL (JV) India 21-May-12 35%
RAVI INFRA - GRIL - SHIVAKRITI (JV) India 21-Aug-14 10%
GRIL - Cobra - KIEL (JV) *
- Dholpur- Antri - NC Railway, Madhya Pradesh & Rajasthan
India 3-Feb-17 51%
- Vijaywada - SC Railway, Andhra Pradesh India 18-Apr-17 67%
GR-Gawar (JV):
- Rohtak Project India 7-Sep-09 25%
- Nepal Project India 18-Sep-10 51%
- Jhajjar Project India 15-Apr-11 51%
- Faridabad Project India 13-Jan-12 54%
- Sonepat Project India 20-Jul-13 25%
- Rohtak Gohana - Panipat Section # India 19-Dec-17 30%
Classification of joint arrangements
The joint venture agreements in related to above joint operations require unanimous consent from all parties for relevant activities. The two partners have direct rights to the assets of joint arrangement and are jointly and severally liable for the liabilities incurred by joint arrangement. Thus, the above entities are classified as joint operation and the Holding Company recognise its direct right to the jointly held assets, liabilities, revenue and expenses.
* GRIL - Cobra - KIEL (JV) has been awarded with project for development of railways at Dholpur- Antri - NC Railway in the state of Madhya Pradesh and Rajasthan and Vijaywada - SC Railway in the state of Andhra Pradesh during the year. However, there are no transaction in joint operations as at 31 March 2018. Accordingly, no joint assets and liabilities have been recognised in these financial statements.
# GR-Gawar (JV) (Project - Rohtak Gohana - Panipat Section) has been awarded with project for Construction of New Railway line on via-duct with approaches on Earth-filling Retaining wall and other miscellaneous works from Km.0.800 to Km. 5.640 in Rohtak city on Rohtak-Gohana-Panipat section during the year. However, there are no transaction in joint operations as at 31 March 2018. Accordingly, no joint assets and liabilities have been recognised in these financial statements
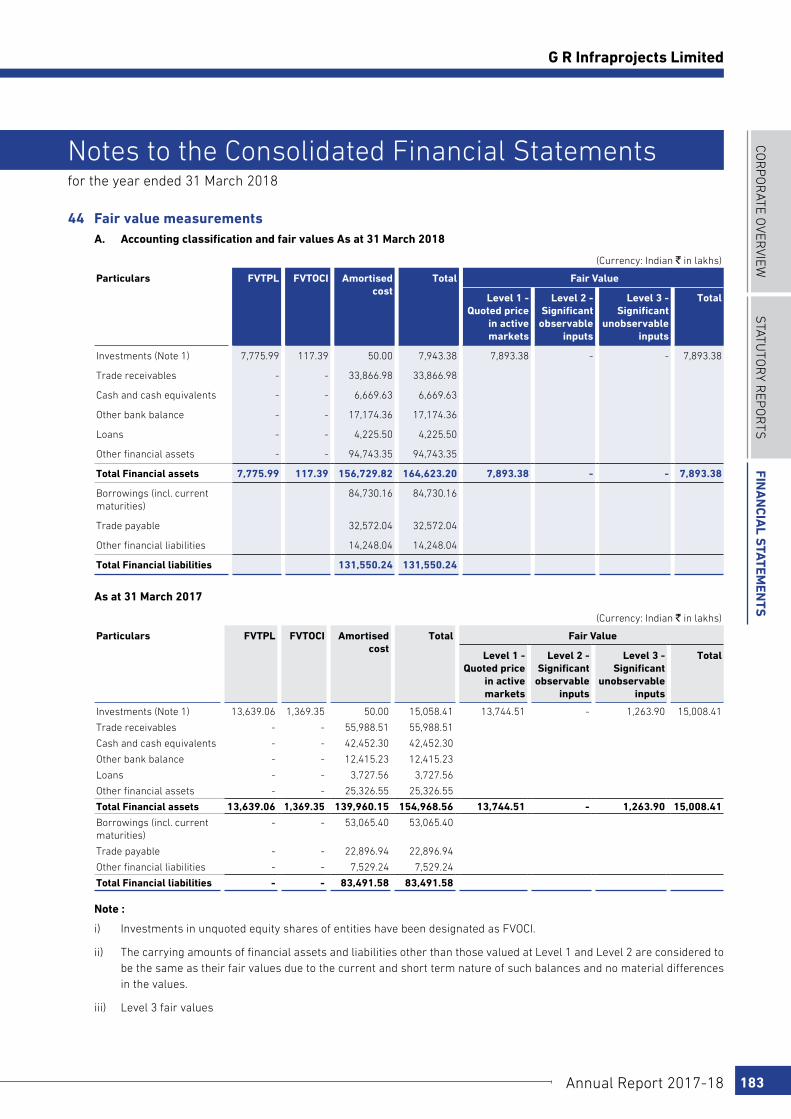
COR
PO
RATE O
VERVIEW
STATu
TOR
y REP
OR
TSFin
an
cial S
tatemen
tS
Annual Report 2017-18 183
G R Infraprojects Limited
for the year ended 31 March 2018
Notes to the Consolidated Financial Statements
44 Fair value measurements A. Accounting classification and fair values As at 31 March 2018
(Currency: Indian ` in lakhs)
Particulars FVTPL
FVTOCI Amortised cost
Total Fair Value
Level 1 - Quoted price
in active markets
Level 2 - Significant
observable inputs
Level 3 - Significant
unobservable inputs
Total
Investments (Note 1) 7,775.99 117.39 50.00 7,943.38 7,893.38 - - 7,893.38
Trade receivables - - 33,866.98 33,866.98
Cash and cash equivalents - - 6,669.63 6,669.63
Other bank balance - - 17,174.36 17,174.36
Loans - - 4,225.50 4,225.50
Other financial assets - - 94,743.35 94,743.35
Total Financial assets 7,775.99 117.39 156,729.82 164,623.20 7,893.38 - - 7,893.38
Borrowings (incl. current maturities)
84,730.16 84,730.16
Trade payable 32,572.04 32,572.04
Other financial liabilities 14,248.04 14,248.04
Total Financial liabilities 131,550.24 131,550.24
As at 31 March 2017
(Currency: Indian ` in lakhs)
Particulars FVTPL FVTOCI Amortised cost
Total Fair Value
Level 1 - Quoted price
in active markets
Level 2 - Significant
observable inputs
Level 3 - Significant
unobservable inputs
Total
Investments (Note 1) 13,639.06 1,369.35 50.00 15,058.41 13,744.51 - 1,263.90 15,008.41
Trade receivables - - 55,988.51 55,988.51
Cash and cash equivalents - - 42,452.30 42,452.30
Other bank balance - - 12,415.23 12,415.23
Loans - - 3,727.56 3,727.56
Other financial assets - - 25,326.55 25,326.55
Total Financial assets 13,639.06 1,369.35 139,960.15 154,968.56 13,744.51 - 1,263.90 15,008.41
Borrowings (incl. current maturities)
- - 53,065.40 53,065.40
Trade payable - - 22,896.94 22,896.94
Other financial liabilities - - 7,529.24 7,529.24
Total Financial liabilities - - 83,491.58 83,491.58
Note :
i) Investments in unquoted equity shares of entities have been designated as FVOCI.
ii) The carrying amounts of financial assets and liabilities other than those valued at Level 1 and Level 2 are considered to be the same as their fair values due to the current and short term nature of such balances and no material differences in the values.
iii) Level 3 fair values
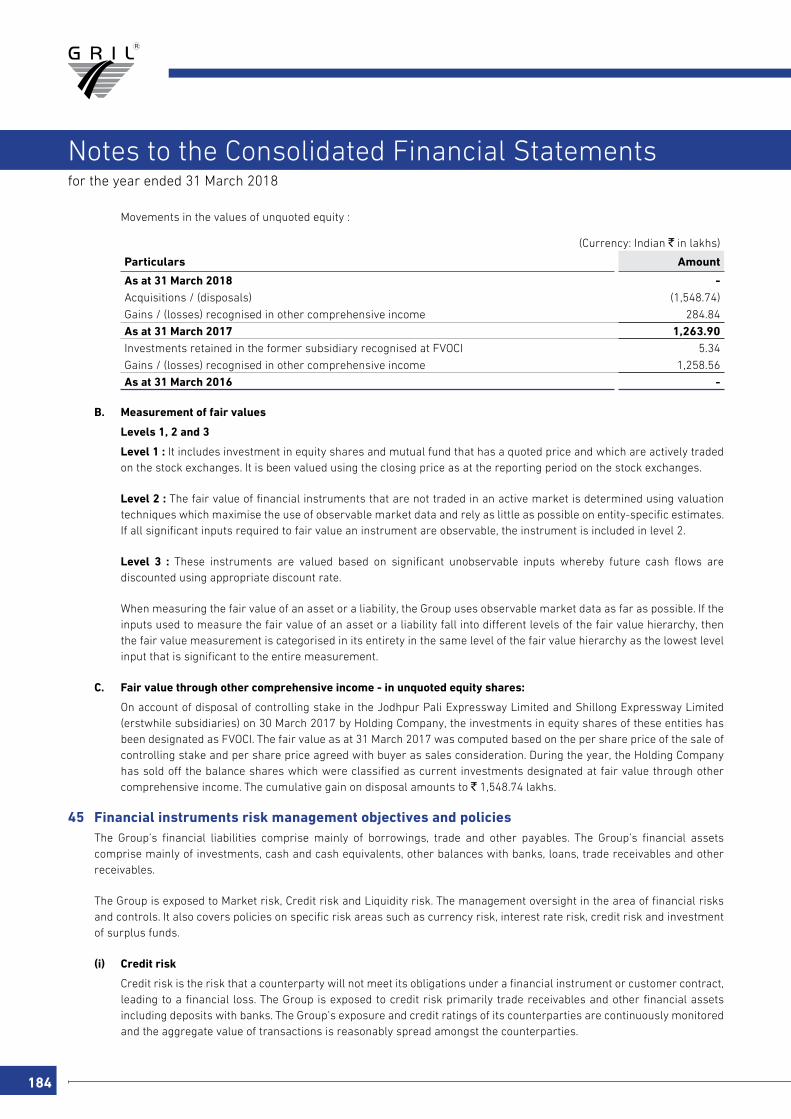
184
for the year ended 31 March 2018
Notes to the Consolidated Financial Statements
Movements in the values of unquoted equity :
(Currency: Indian ` in lakhs)
Particulars Amount
As at 31 March 2018 - Acquisitions / (disposals) (1,548.74)
Gains / (losses) recognised in other comprehensive income 284.84
As at 31 March 2017 1,263.90 Investments retained in the former subsidiary recognised at FVOCI 5.34
Gains / (losses) recognised in other comprehensive income 1,258.56
As at 31 March 2016 -
B. Measurement of fair values
Levels 1, 2 and 3
Level 1 : It includes investment in equity shares and mutual fund that has a quoted price and which are actively traded on the stock exchanges. It is been valued using the closing price as at the reporting period on the stock exchanges.
Level 2 : The fair value of financial instruments that are not traded in an active market is determined using valuation techniques which maximise the use of observable market data and rely as little as possible on entity-specific estimates. If all significant inputs required to fair value an instrument are observable, the instrument is included in level 2.
Level 3 : These instruments are valued based on significant unobservable inputs whereby future cash flows are discounted using appropriate discount rate.
When measuring the fair value of an asset or a liability, the Group uses observable market data as far as possible. If the inputs used to measure the fair value of an asset or a liability fall into different levels of the fair value hierarchy, then the fair value measurement is categorised in its entirety in the same level of the fair value hierarchy as the lowest level input that is significant to the entire measurement.
C. Fair value through other comprehensive income - in unquoted equity shares:
On account of disposal of controlling stake in the Jodhpur Pali Expressway Limited and Shillong Expressway Limited (erstwhile subsidiaries) on 30 March 2017 by Holding Company, the investments in equity shares of these entities has been designated as FVOCI. The fair value as at 31 March 2017 was computed based on the per share price of the sale of controlling stake and per share price agreed with buyer as sales consideration. During the year, the Holding Company has sold off the balance shares which were classified as current investments designated at fair value through other comprehensive income. The cumulative gain on disposal amounts to ` 1,548.74 lakhs.
45 Financial instruments risk management objectives and policies The Group’s financial liabilities comprise mainly of borrowings, trade and other payables. The Group’s financial assets
comprise mainly of investments, cash and cash equivalents, other balances with banks, loans, trade receivables and other receivables.
The Group is exposed to Market risk, Credit risk and Liquidity risk. The management oversight in the area of financial risks and controls. It also covers policies on specific risk areas such as currency risk, interest rate risk, credit risk and investment of surplus funds.
(i) Credit risk
Credit risk is the risk that a counterparty will not meet its obligations under a financial instrument or customer contract, leading to a financial loss. The Group is exposed to credit risk primarily trade receivables and other financial assets including deposits with banks. The Group’s exposure and credit ratings of its counterparties are continuously monitored and the aggregate value of transactions is reasonably spread amongst the counterparties.
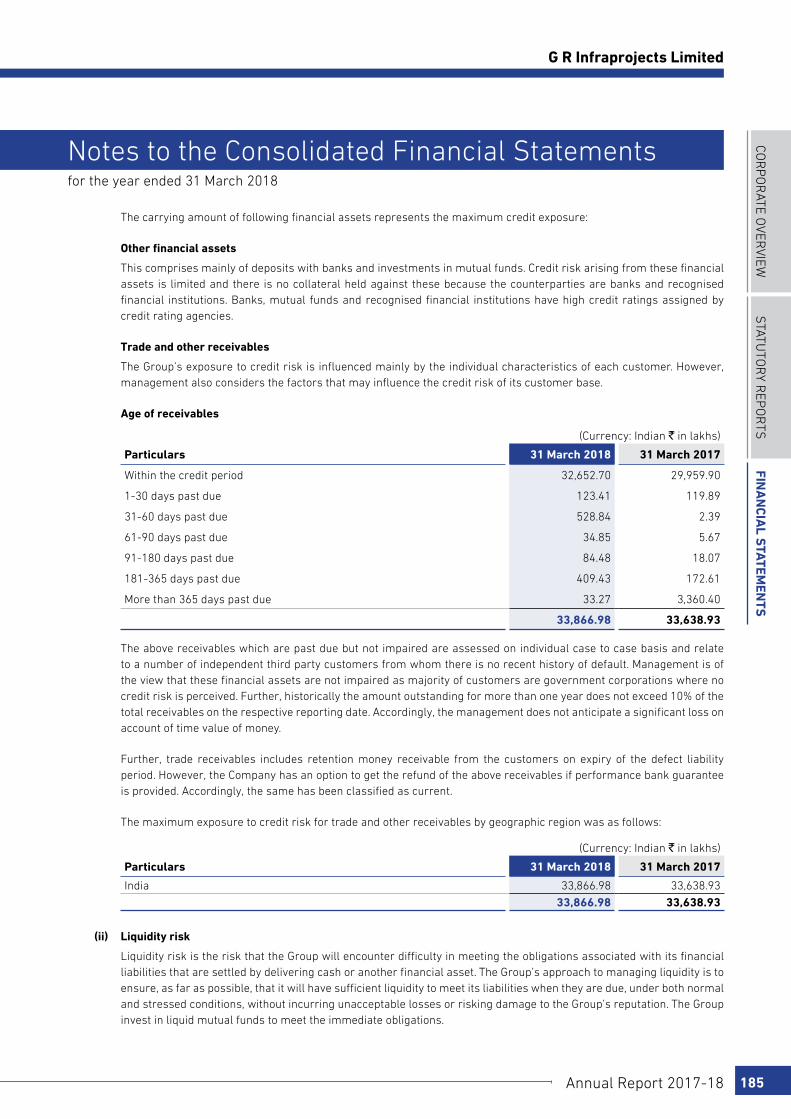
COR
PO
RATE O
VERVIEW
STATu
TOR
y REP
OR
TSFin
an
cial S
tatemen
tS
Annual Report 2017-18 185
G R Infraprojects Limited
for the year ended 31 March 2018
Notes to the Consolidated Financial Statements
The carrying amount of following financial assets represents the maximum credit exposure:
Other financial assets
This comprises mainly of deposits with banks and investments in mutual funds. Credit risk arising from these financial assets is limited and there is no collateral held against these because the counterparties are banks and recognised financial institutions. Banks, mutual funds and recognised financial institutions have high credit ratings assigned by credit rating agencies.
Trade and other receivables
The Group’s exposure to credit risk is influenced mainly by the individual characteristics of each customer. However, management also considers the factors that may influence the credit risk of its customer base.
Age of receivables
(Currency: Indian ` in lakhs)
Particulars 31 March 2018 31 March 2017
Within the credit period 32,652.70 29,959.90
1-30 days past due 123.41 119.89
31-60 days past due 528.84 2.39
61-90 days past due 34.85 5.67
91-180 days past due 84.48 18.07
181-365 days past due 409.43 172.61
More than 365 days past due 33.27 3,360.40
33,866.98 33,638.93
The above receivables which are past due but not impaired are assessed on individual case to case basis and relate to a number of independent third party customers from whom there is no recent history of default. Management is of the view that these financial assets are not impaired as majority of customers are government corporations where no credit risk is perceived. Further, historically the amount outstanding for more than one year does not exceed 10% of the total receivables on the respective reporting date. Accordingly, the management does not anticipate a significant loss on account of time value of money.
Further, trade receivables includes retention money receivable from the customers on expiry of the defect liability period. However, the Company has an option to get the refund of the above receivables if performance bank guarantee is provided. Accordingly, the same has been classified as current.
The maximum exposure to credit risk for trade and other receivables by geographic region was as follows:
(Currency: Indian ` in lakhs)
Particulars 31 March 2018 31 March 2017
India 33,866.98 33,638.93
33,866.98 33,638.93
(ii) Liquidity risk
Liquidity risk is the risk that the Group will encounter difficulty in meeting the obligations associated with its financial liabilities that are settled by delivering cash or another financial asset. The Group’s approach to managing liquidity is to ensure, as far as possible, that it will have sufficient liquidity to meet its liabilities when they are due, under both normal and stressed conditions, without incurring unacceptable losses or risking damage to the Group’s reputation. The Group invest in liquid mutual funds to meet the immediate obligations.

186
for the year ended 31 March 2018
Notes to the Consolidated Financial Statements
Exposure to liquidity risk
The following are the remaining contractual maturities of financial liabilities at the reporting date. The amounts are gross and undiscounted.
(Currency: Indian ` in lakhs)
31 March 2018 Carrying amount
Contractual cash flows
Total Less than 1 year
1-5 years More than 5 years
Non-derivative financial liabilitiesBorrowings (incl. current maturities) 84,730.16 84,730.16 33,629.53 38,934.73 12,165.90
Trade payables 32,572.04 32,572.04 32,572.04 - -
Other current financial liabilities 14,248.04 14,248.04 14,248.04 - -
Financial guarantee contracts (refer note below) 3,810.00 3,810.00 - - 3,810.00
Total 135,360.24 135,360.24 80,449.61 38,934.73 15,975.90
(Currency: Indian ` in lakhs)
31 March 2017 Carrying amount
Contractual cash flows
Total Less than 1 year
1-5 years More than 5 years
Non-derivative financial liabilitiesBorrowings 53,065.40 53,065.40 14,886.57 38,178.83 -
Trade payables 22,896.94 22,896.94 22,896.94 - -
Other current financial liabilities 7,529.24 7,529.24 7,529.24 - -
Financial guarantee contracts (refer note below) 2,506.95 2,506.95 2,506.95 - -
Total 85,998.53 85,998.53 47,819.70 38,178.83 -
Note :
Guarantees issued by the Holding Company on behalf of Subsidiaries are with respect to limits availed by the respective entity. These amounts will be payable on default by the concerned entity. As of the reporting date, none of the subsidiary has defaulted and hence, the Holding Company does not have any present obligation to third parties in relation to such guarantees.
(iii) Market risk
Market risk is the risk that changes in market prices – such as foreign exchange rates, interest rates and equity prices – will affect the Group’s income or the value of its holdings of financial instruments. Market risk is attributable to all market risk sensitive financial instruments including foreign currency receivables and payables. The Group is exposed to market risk primarily related to foreign exchange rate risks. Thus, our exposure to market risk is a function of revenue generating and operating activities in foreign currency. The objective of market risk management is to avoid excessive exposure in foreign currency revenues and costs.
a) Currency risk
“The holding Company’s foreign subsidiaries are exposed to foreign currency risk arising from fluctuations in exchange rates.
Transactions denominated in foreign currency comprises primarily of import of raw material and plant and machineries which are not material. Accordingly, the Group is not significantly exposed to foreign currency risk.

COR
PO
RATE O
VERVIEW
STATu
TOR
y REP
OR
TSFin
an
cial S
tatemen
tS
Annual Report 2017-18 187
G R Infraprojects Limited
for the year ended 31 March 2018
Notes to the Consolidated Financial Statements
Unhedged foreign currency exposure
(Currency: Indian ` in lakhs)
Particulars Currency 31 March 2018 31 March 2017Amount in
foreign currencyAmount in ` Amount in
foreign currencyAmount in `
Financial liabilitiesPayables USD 8.51 554.60 0.05 3.55
EURO 34.75 2,789.45 11.25 779.04
Net exposure to foreign currency
43.26 3,344.05 11.30 782.59
b) Price risk
i) Exposure
The Group’s exposure to price risk in the investment in mutual funds and equity shares arises from investments held by the Group and classified in the balance sheet as fair value through profit or loss including OCI. (refer note 9). Management monitors the prices closely to mitigate its impact on profit and cash flows.
The investments in mutual funds are designated as FVTPL while investment in equity shares are designated as FVOCI.
ii) Sensitivity analysis
Impact on profit before tax
Particulars 31 March 2018 31 March 2017
Investment in mutual funds and equity:
increase 1% (31 March 2017 1%) 77.76 137.45
decrease 1% (31 March 2017 1%) (77.76) (137.45)
c) Interest rate risk
Interest rate risk is the risk that the fair value or future cash flows of a financial instrument will fluctuate because of changes in market interest rates. The Group is exposed to interest rate risk resulting from fluctuations in interest rates. While most of long term borrowings from banks and financial institutions are on fixed rate basis, project specific borrowings primarily consist of floating rate obligations linked to the applicable benchmark rates, which may typically be adjusted at certain intervals in accordance with prevailing interest rates. As at 31 March 2018, approximately 66% of the Group’s borrowings are at fixed rate (31 March 2017 : 61%). Increases in interest rates would increase interest expenses relating to outstanding floating rate borrowings and increase the cost of new debt. In addition, an increase in interest rates may adversely affect ability to service long-term debt and to finance development of new projects, all of which in turn may adversely affect results of operations. The Group seeks to mitigate such risk by maintaining an adequate proportion of floating and fixed interest rate borrowings. Summary of financial assets and financial liabilities has been provided below:
Exposure to interest rate risk
The interest rate profile of the Group’s interest - bearing financial instrument as reported to management is as follows:
(Currency: Indian ` in lakhs)
Particulars 31 March 2018 31 March 2017
Fixed-rate instrumentsFinancial assets 19,011.43 13,451.64 Financial liabilities 55,493.80 32,235.92 Variable-rate instrumentsFinancial assets - - Financial liabilities 28,384.94 20,323.85
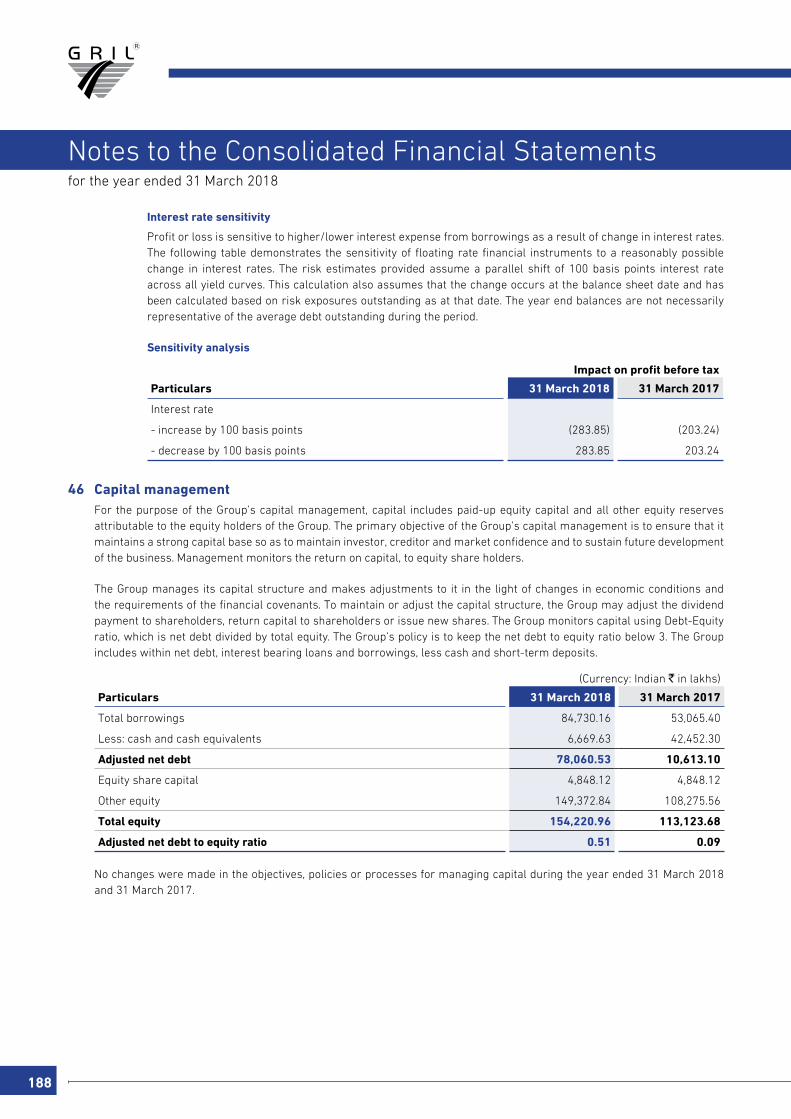
188
for the year ended 31 March 2018
Notes to the Consolidated Financial Statements
Interest rate sensitivity
Profit or loss is sensitive to higher/lower interest expense from borrowings as a result of change in interest rates. The following table demonstrates the sensitivity of floating rate financial instruments to a reasonably possible change in interest rates. The risk estimates provided assume a parallel shift of 100 basis points interest rate across all yield curves. This calculation also assumes that the change occurs at the balance sheet date and has been calculated based on risk exposures outstanding as at that date. The year end balances are not necessarily representative of the average debt outstanding during the period.
Sensitivity analysis
Impact on profit before tax
Particulars 31 March 2018 31 March 2017
Interest rate
- increase by 100 basis points (283.85) (203.24)
- decrease by 100 basis points 283.85 203.24
46 Capital management For the purpose of the Group’s capital management, capital includes paid-up equity capital and all other equity reserves
attributable to the equity holders of the Group. The primary objective of the Group’s capital management is to ensure that it maintains a strong capital base so as to maintain investor, creditor and market confidence and to sustain future development of the business. Management monitors the return on capital, to equity share holders.
The Group manages its capital structure and makes adjustments to it in the light of changes in economic conditions and the requirements of the financial covenants. To maintain or adjust the capital structure, the Group may adjust the dividend payment to shareholders, return capital to shareholders or issue new shares. The Group monitors capital using Debt-Equity ratio, which is net debt divided by total equity. The Group’s policy is to keep the net debt to equity ratio below 3. The Group includes within net debt, interest bearing loans and borrowings, less cash and short-term deposits.
(Currency: Indian ` in lakhs)
Particulars 31 March 2018 31 March 2017
Total borrowings 84,730.16 53,065.40
Less: cash and cash equivalents 6,669.63 42,452.30
Adjusted net debt 78,060.53 10,613.10
Equity share capital 4,848.12 4,848.12
Other equity 149,372.84 108,275.56
Total equity 154,220.96 113,123.68
Adjusted net debt to equity ratio 0.51 0.09
No changes were made in the objectives, policies or processes for managing capital during the year ended 31 March 2018 and 31 March 2017.

COR
PO
RATE O
VERVIEW
STATu
TOR
y REP
OR
TSFin
an
cial S
tatemen
tS
Annual Report 2017-18 189
G R Infraprojects Limited
for the year ended 31 March 2018
Notes to the Consolidated Financial Statements
47 Disclosures pursuant to Indian Accounting Standard (Ind AS) 11 “Construction Contracts”
(Currency: Indian ` in lakhs)
Particulars 31 March 2018 31 March 2017
For ongoing and completed projects during the yearContract revenue recognised for the year 301,888.23 309,217.08
For ongoing and completed projects during the yearGross amount due from customers for contract work 31,969.80 52,743.36
Gross amount due to customers for contract work (Customer advances) 16,032.13 46,550.74
For ongoing projects at the year endAggregate amount of contract costs incurred and recognised profits (less recognised losses) up-to the Balance sheet date
345,259.79 381,638.36
Gross amount due from customers for contract work 24,755.55 26,856.01
Gross amount due to customers for contract work (Customer advances) 15,782.42 44,057.65
Retention amounts due from customers (included in Gross amount due from customers above)
8,442.46 21,434.67
48 Exceptional Items - Sale of investment in subsidiaries
(Currency: Indian ` in lakhs)
Particulars 31 March 2018 31 March 2017
Profit on sale of investment in subsidiaries - 13,568.35
On 30 March 2017, the Holding company has disposed off investment in two subsidiary companies i.e. Jodhpur Pali Expressway Limited (“JPEL”) and Shillong Expressway Limited (“SEL”), except 12% and 10% (approx.) equity shares which will be disposed off on receipt of final completion certificate for respective underlying projects in both the subsidiary companies. The Holding Company is expecting to receive the certificate in the financial year 2017-18. A consideration of ` 29,953.59 lakhs has been received from buyer i.e. India Infrastructure Fund II (IIF II). During current year, the Holding Company has sold the balance shares which were classified as current investments designated at fair value through other comprehensive income. Accordingly, the resultant cumulative gain has been transferred to retained earnings in accordance with Ind AS 109 - “Financial Instruments”.
49 Segment reporting Basis of Segmentation:
a) The Group has identified following business segments viz., Construction and Built, Operate and Transfer (‘BOT’) as reportable segments because they are working as different business model.
Reportable Segment Operations
Engineering Procurement and Construction (EPC) Development of roads
Build, Operate and Transfer (BOT) Projects Operation and maintenance of roadways
Others Others include Sale of products, jobwork charges and other miscellaneous income
b) Operating segment disclosures are consistent with the information provided to and reviewed by the chief operating decision maker.
c) Segment Revenue, Segment Results, Segment Assets and Segment Liabilities include the respective amounts identifiable to each of the segments as also amounts allocated on a reasonable basis.
d) The expenses and income, which are not directly allocated between the segments are shown as unallocated corporate expense or income as the case may be.
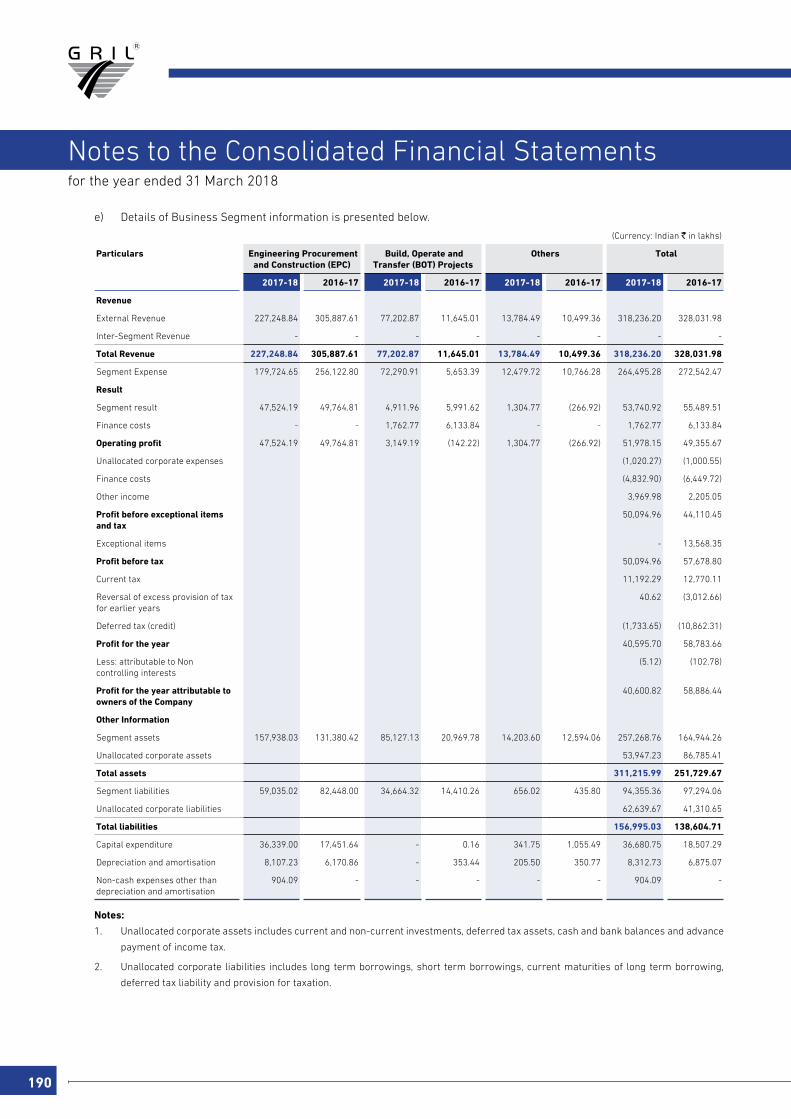
190
for the year ended 31 March 2018
Notes to the Consolidated Financial Statements
e) Details of Business Segment information is presented below.
(Currency: Indian ` in lakhs)
Particulars Engineering Procurement and Construction (EPC)
Build, Operate and Transfer (BOT) Projects
Others Total
2017-18 2016-17 2017-18 2016-17 2017-18 2016-17 2017-18 2016-17
Revenue
External Revenue 227,248.84 305,887.61 77,202.87 11,645.01 13,784.49 10,499.36 318,236.20 328,031.98
Inter-Segment Revenue - - - - - - - -
Total Revenue 227,248.84 305,887.61 77,202.87 11,645.01 13,784.49 10,499.36 318,236.20 328,031.98
Segment Expense 179,724.65 256,122.80 72,290.91 5,653.39 12,479.72 10,766.28 264,495.28 272,542.47
Result
Segment result 47,524.19 49,764.81 4,911.96 5,991.62 1,304.77 (266.92) 53,740.92 55,489.51
Finance costs - - 1,762.77 6,133.84 - - 1,762.77 6,133.84
Operating profit 47,524.19 49,764.81 3,149.19 (142.22) 1,304.77 (266.92) 51,978.15 49,355.67
Unallocated corporate expenses (1,020.27) (1,000.55)
Finance costs (4,832.90) (6,449.72)
Other income 3,969.98 2,205.05
Profit before exceptional items and tax
50,094.96 44,110.45
Exceptional items - 13,568.35
Profit before tax 50,094.96 57,678.80
Current tax 11,192.29 12,770.11
Reversal of excess provision of tax for earlier years
40.62 (3,012.66)
Deferred tax (credit) (1,733.65) (10,862.31)
Profit for the year 40,595.70 58,783.66
Less: attributable to Non controlling interests
(5.12) (102.78)
Profit for the year attributable to owners of the Company
40,600.82 58,886.44
Other Information
Segment assets 157,938.03 131,380.42 85,127.13 20,969.78 14,203.60 12,594.06 257,268.76 164,944.26
Unallocated corporate assets 53,947.23 86,785.41
Total assets 311,215.99 251,729.67
Segment liabilities 59,035.02 82,448.00 34,664.32 14,410.26 656.02 435.80 94,355.36 97,294.06
Unallocated corporate liabilities 62,639.67 41,310.65
Total liabilities 156,995.03 138,604.71
Capital expenditure 36,339.00 17,451.64 - 0.16 341.75 1,055.49 36,680.75 18,507.29
Depreciation and amortisation 8,107.23 6,170.86 - 353.44 205.50 350.77 8,312.73 6,875.07
Non-cash expenses other than depreciation and amortisation
904.09 - - - - - 904.09 -
Notes:
1. Unallocated corporate assets includes current and non-current investments, deferred tax assets, cash and bank balances and advance
payment of income tax.
2. Unallocated corporate liabilities includes long term borrowings, short term borrowings, current maturities of long term borrowing,
deferred tax liability and provision for taxation.
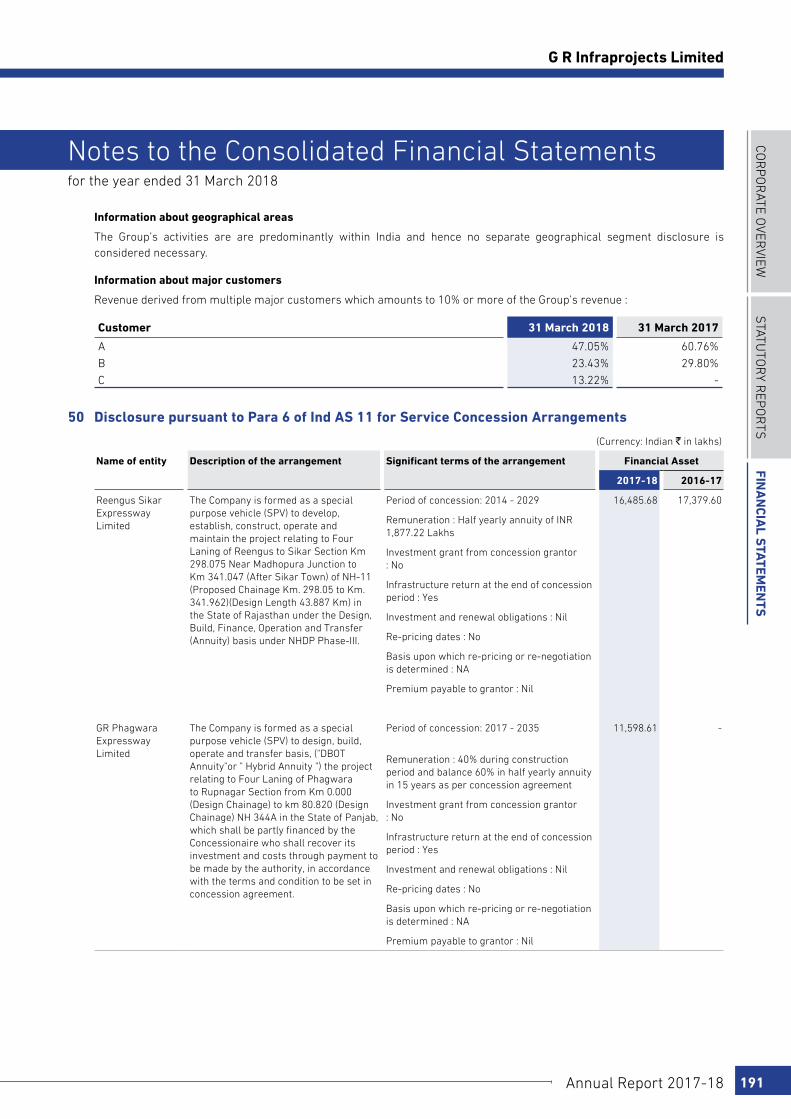
COR
PO
RATE O
VERVIEW
STATu
TOR
y REP
OR
TSFin
an
cial S
tatemen
tS
Annual Report 2017-18 191
G R Infraprojects Limited
for the year ended 31 March 2018
Notes to the Consolidated Financial Statements
Information about geographical areas
The Group’s activities are are predominantly within India and hence no separate geographical segment disclosure is considered necessary.
Information about major customers
Revenue derived from multiple major customers which amounts to 10% or more of the Group’s revenue :
Customer 31 March 2018 31 March 2017
A 47.05% 60.76%
B 23.43% 29.80%
C 13.22% -
50 Disclosure pursuant to Para 6 of Ind AS 11 for Service Concession Arrangements
(Currency: Indian ` in lakhs)
Name of entity Description of the arrangement Significant terms of the arrangement Financial Asset
2017-18 2016-17
Reengus Sikar Expressway Limited
The Company is formed as a special purpose vehicle (SPV) to develop, establish, construct, operate and maintain the project relating to Four Laning of Reengus to Sikar Section Km 298.075 Near Madhopura Junction to Km 341.047 (After Sikar Town) of NH-11 (Proposed Chainage Km. 298.05 to Km. 341.962)(Design Length 43.887 Km) in the State of Rajasthan under the Design, Build, Finance, Operation and Transfer (Annuity) basis under NHDP Phase-III.
Period of concession: 2014 - 2029 16,485.68 17,379.60
Remuneration : Half yearly annuity of INR 1,877.22 Lakhs
Investment grant from concession grantor : No
Infrastructure return at the end of concession period : Yes
Investment and renewal obligations : Nil
Re-pricing dates : No
Basis upon which re-pricing or re-negotiation is determined : NA
Premium payable to grantor : Nil
GR Phagwara Expressway Limited
The Company is formed as a special purpose vehicle (SPV) to design, build, operate and transfer basis, ("DBOT Annuity"or " Hybrid Annuity ") the project relating to Four Laning of Phagwara to Rupnagar Section from Km 0.000 (Design Chainage) to km 80.820 (Design Chainage) NH 344A in the State of Panjab, which shall be partly financed by the Concessionaire who shall recover its investment and costs through payment to be made by the authority, in accordance with the terms and condition to be set in concession agreement.
Period of concession: 2017 - 2035 11,598.61 -
Remuneration : 40% during construction period and balance 60% in half yearly annuity in 15 years as per concession agreement
Investment grant from concession grantor : No
Infrastructure return at the end of concession period : Yes
Investment and renewal obligations : Nil
Re-pricing dates : No
Basis upon which re-pricing or re-negotiation is determined : NA
Premium payable to grantor : Nil
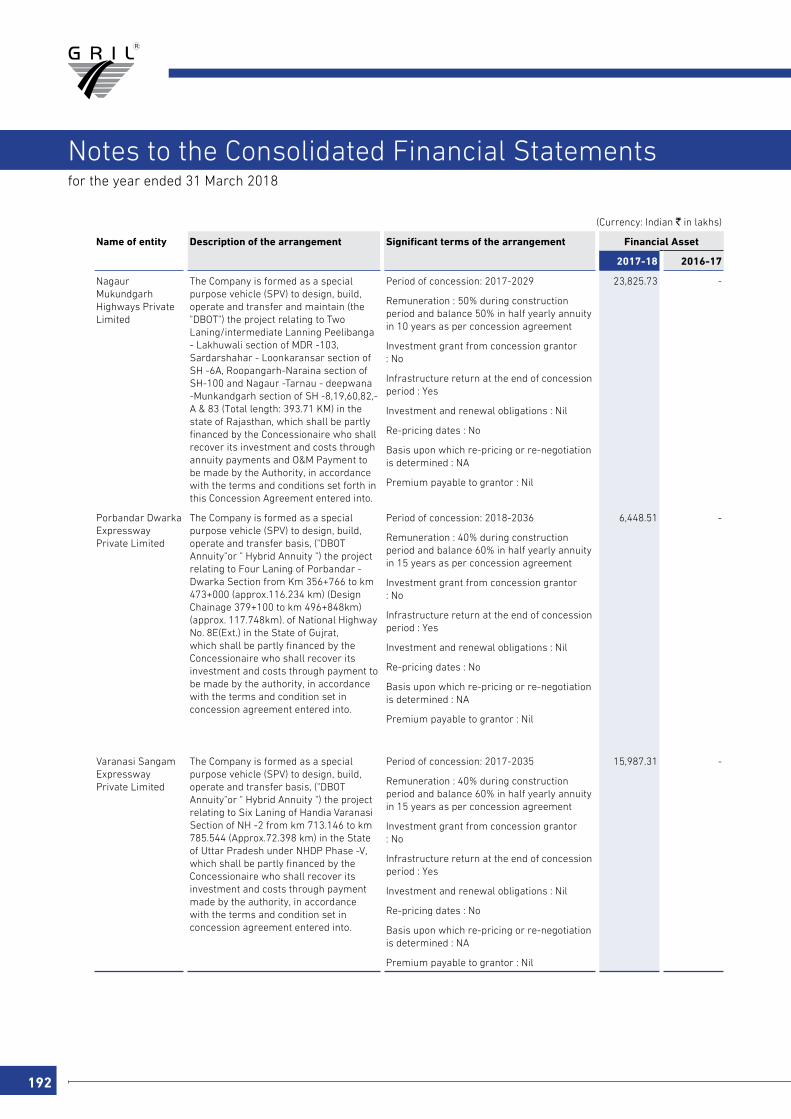
192
for the year ended 31 March 2018
Notes to the Consolidated Financial Statements
(Currency: Indian ` in lakhs)
Name of entity Description of the arrangement Significant terms of the arrangement Financial Asset
2017-18 2016-17
Nagaur Mukundgarh Highways Private Limited
The Company is formed as a special purpose vehicle (SPV) to design, build, operate and transfer and maintain (the "DBOT") the project relating to Two Laning/intermediate Lanning Peelibanga - Lakhuwali section of MDR -103, Sardarshahar - Loonkaransar section of SH -6A, Roopangarh-Naraina section of SH-100 and Nagaur -Tarnau - deepwana -Munkandgarh section of SH -8,19,60,82,-A & 83 (Total length: 393.71 KM) in the state of Rajasthan, which shall be partly financed by the Concessionaire who shall recover its investment and costs through annuity payments and O&M Payment to be made by the Authority, in accordance with the terms and conditions set forth in this Concession Agreement entered into.
Period of concession: 2017-2029 23,825.73 -
Remuneration : 50% during construction period and balance 50% in half yearly annuity in 10 years as per concession agreement
Investment grant from concession grantor : No
Infrastructure return at the end of concession period : Yes
Investment and renewal obligations : Nil
Re-pricing dates : No
Basis upon which re-pricing or re-negotiation is determined : NA
Premium payable to grantor : Nil
Porbandar Dwarka Expressway Private Limited
The Company is formed as a special purpose vehicle (SPV) to design, build, operate and transfer basis, ("DBOT Annuity"or " Hybrid Annuity ") the project relating to Four Laning of Porbandar - Dwarka Section from Km 356+766 to km 473+000 (approx.116.234 km) (Design Chainage 379+100 to km 496+848km) (approx. 117.748km). of National Highway No. 8E(Ext.) in the State of Gujrat, which shall be partly financed by the Concessionaire who shall recover its investment and costs through payment to be made by the authority, in accordance with the terms and condition set in concession agreement entered into.
Period of concession: 2018-2036 6,448.51 -
Remuneration : 40% during construction period and balance 60% in half yearly annuity in 15 years as per concession agreement
Investment grant from concession grantor : No
Infrastructure return at the end of concession period : Yes
Investment and renewal obligations : Nil
Re-pricing dates : No
Basis upon which re-pricing or re-negotiation is determined : NA
Premium payable to grantor : Nil
Varanasi Sangam Expressway Private Limited
The Company is formed as a special purpose vehicle (SPV) to design, build, operate and transfer basis, ("DBOT Annuity"or " Hybrid Annuity ") the project relating to Six Laning of Handia Varanasi Section of NH -2 from km 713.146 to km 785.544 (Approx.72.398 km) in the State of Uttar Pradesh under NHDP Phase -V, which shall be partly financed by the Concessionaire who shall recover its investment and costs through payment made by the authority, in accordance with the terms and condition set in concession agreement entered into.
Period of concession: 2017-2035 15,987.31 -
Remuneration : 40% during construction period and balance 60% in half yearly annuity in 15 years as per concession agreement
Investment grant from concession grantor : No
Infrastructure return at the end of concession period : Yes
Investment and renewal obligations : Nil
Re-pricing dates : No
Basis upon which re-pricing or re-negotiation is determined : NA
Premium payable to grantor : Nil
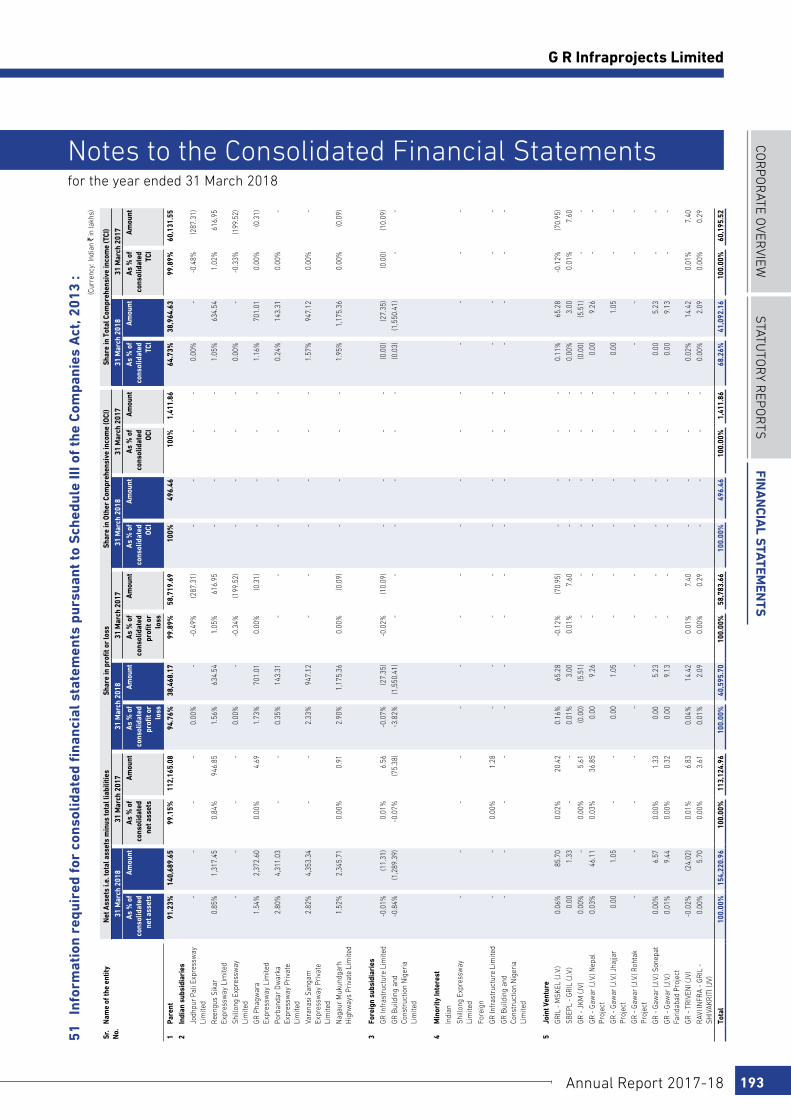
COR
PO
RATE O
VERVIEW
STATu
TOR
y REP
OR
TSFin
an
cial S
tatemen
tS
Annual Report 2017-18 193
G R Infraprojects Limited
for the year ended 31 March 2018
Notes to the Consolidated Financial Statements
51
Info
rmat
ion
requ
ired
for
con
soli
date
d fi
nanc
ial s
tate
men
ts p
ursu
ant
to S
ched
ule
III o
f th
e C
ompa
nies
Act
, 201
3 :
(Cur
renc
y: In
dian
` in
lakh
s)
Sr.
No.
Nam
e of
the
entit
yN
et A
sset
s i.e
. tot
al a
sset
s m
inus
tota
l lia
bilit
ies
Shar
e in
pro
fit o
r lo
ssSh
are
in O
ther
Com
preh
ensi
ve in
com
e (O
CI)
Shar
e in
Tot
al C
ompr
ehen
sive
inco
me
(TCI
)31
Mar
ch 2
018
31 M
arch
201
731
Mar
ch 2
018
31 M
arch
201
731
Mar
ch 2
018
31 M
arch
201
731
Mar
ch 2
018
31 M
arch
201
7As
% o
f co
nsol
idat
ed
net a
sset
s
Amou
ntAs
% o
f co
nsol
idat
ed
net a
sset
s
Amou
ntAs
% o
f co
nsol
idat
ed
profi
t or
loss
Amou
ntAs
% o
f co
nsol
idat
ed
profi
t or
loss
Amou
ntAs
% o
f co
nsol
idat
ed
OCI
Amou
ntAs
% o
f co
nsol
idat
ed
OCI
Amou
ntAs
% o
f co
nsol
idat
ed
TCI
Amou
ntAs
% o
f co
nsol
idat
ed
TCI
Amou
nt
1Pa
rent
91.2
3%14
0,68
9.65
99.1
5%11
2,16
5.08
94.7
6%38
,468
.17
99.8
9%58
,719
.69
100%
496.
4610
0%1,
411.
8664
.73%
38,9
64.6
399
.89%
60,1
31.5
52
Indi
an s
ubsi
diar
ies
Jodh
pur
Pali
Expr
essw
ay
Lim
ited
--
--
0.00
%-
-0.4
9%(2
87.3
1)-
--
-0.
00%
--0
.48%
(287
.31)
Reen
gus
Sika
r Ex
pres
sway
Lim
ited
0.85
%1,
317.
450.
84%
946.
851.
56%
634.
541.
05%
616.
95-
--
-1.
05%
634.
541.
02%
616.
95
Shill
ong
Expr
essw
ay
Lim
ited
--
--
0.00
%-
-0.3
4%(1
99.5
2)-
--
-0.
00%
--0
.33%
(199
.52)
GR P
hagw
ara
Expr
essw
ay L
imite
d1.
54%
2,37
2.60
0.00
%4.
691.
73%
701.
010.
00%
(0.3
1)-
--
-1.
16%
701.
010.
00%
(0.3
1)
Porb
anda
r Dw
arka
Ex
pres
sway
Pri
vate
Li
mite
d
2.80
%4,
311.
03-
-0.
35%
143.
31-
--
--
-0.
24%
143.
310.
00%
-
Vara
nasi
San
gam
Ex
pres
sway
Pri
vate
Li
mite
d
2.82
%4,
353.
34-
-2.
33%
947.
12-
--
--
-1.
57%
947.
120.
00%
-
Nag
aur
Muk
undg
arh
Hig
hway
s Pr
ivat
e Li
mite
d1.
52%
2,34
5.71
0.00
%0.
912.
90%
1,17
5.36
0.00
%(0
.09)
--
--
1.95
%1,
175.
360.
00%
(0.0
9)
3Fo
reig
n su
bsid
iari
es
GR In
fras
truc
ture
Lim
ited
-0.0
1%(1
1.31
)0.
01%
6.56
-0.0
7%(2
7.35
)-0
.02%
(10.
09)
--
--
(0.0
0)(2
7.35
)(0
.00)
(10.
09)
GR B
uild
ing
and
Cons
truc
tion
Nig
eria
Li
mite
d
-0.8
4%(1
,289
.39)
-0.0
7%(7
5.38
)-3
.82%
(1,5
50.4
1)-
--
--
-(0
.03)
(1,5
50.4
1)-
-
4M
inor
ity In
tere
stIn
dian
Shill
ong
Expr
essw
ay
Lim
ited
--
--
--
--
--
--
--
--
Fore
ign
GR In
fras
truc
ture
Lim
ited
--
0.00
%1.
28-
--
--
--
--
--
-
GR B
uild
ing
and
Cons
truc
tion
Nig
eria
Li
mite
d
--
--
--
--
--
--
--
--
5Jo
int V
entu
reGR
IL -
MSK
EL (J
.V.)
0.06
%85
.70
0.02
%20
.42
0.16
%65
.28
-0.1
2%(7
0.95
)-
--
-0.
11%
65.2
8-0
.12%
(70.
95)
SBEP
L - G
RIL
(J.V
.)0.
001.
33-
-0.
01%
3.00
0.01
%7.
60-
--
-0.
00%
3.00
0.01
%7.
60
GR -
JKM
(JV)
0.00
%-
0.00
%5.
61(0
.00)
(5.5
1)-
--
--
-(0
.00)
(5.5
1)-
-
GR -
Gaw
ar (J
.V.)
Nep
al
Proj
ect
0.03
%46
.11
0.03
%36
.85
0.00
9.26
--
--
--
0.00
9.26
--
GR -
Gaw
ar (J
.V.)
Jhaj
jar
Proj
ect
0.00
1.05
--
0.00
1.05
--
--
--
0.00
1.05
--
GR -
Gaw
ar (J
.V.)
Roht
ak
Proj
ect
--
--
--
--
--
--
--
--
GR -
Gaw
ar (J
.V.)
Sone
pat
0.00
%6.
570.
00%
1.33
0.00
5.23
--
--
--
0.00
5.23
--
GR -
Gaw
ar (J
.V.)
Fari
daba
d Pr
ojec
t0.
01%
9.44
0.00
%0.
320.
009.
13-
--
--
-0.
009.
13-
-
GR -
TRIV
ENI (
JV)
-0.0
2%(2
4.02
)0.
01%
6.83
0.04
%14
.42
0.01
%7.
40-
--
-0.
02%
14.4
20.
01%
7.40
RAVI
INFR
A - G
RIL
- SH
IVAK
RITI
(JV)
0.00
%5.
700.
00%
3.61
0.01
%2.
090.
00%
0.29
--
--
0.00
%2.
090.
00%
0.29
Tota
l10
0.00
%15
4,22
0.96
100.
00%
113,
124.
9610
0.00
%40
,595
.70
100.
00%
58,7
83.6
610
0.00
%49
6.46
100.
00%
1,41
1.86
68.2
6%41
,092
.16
100.
00%
60,1
95.5
2
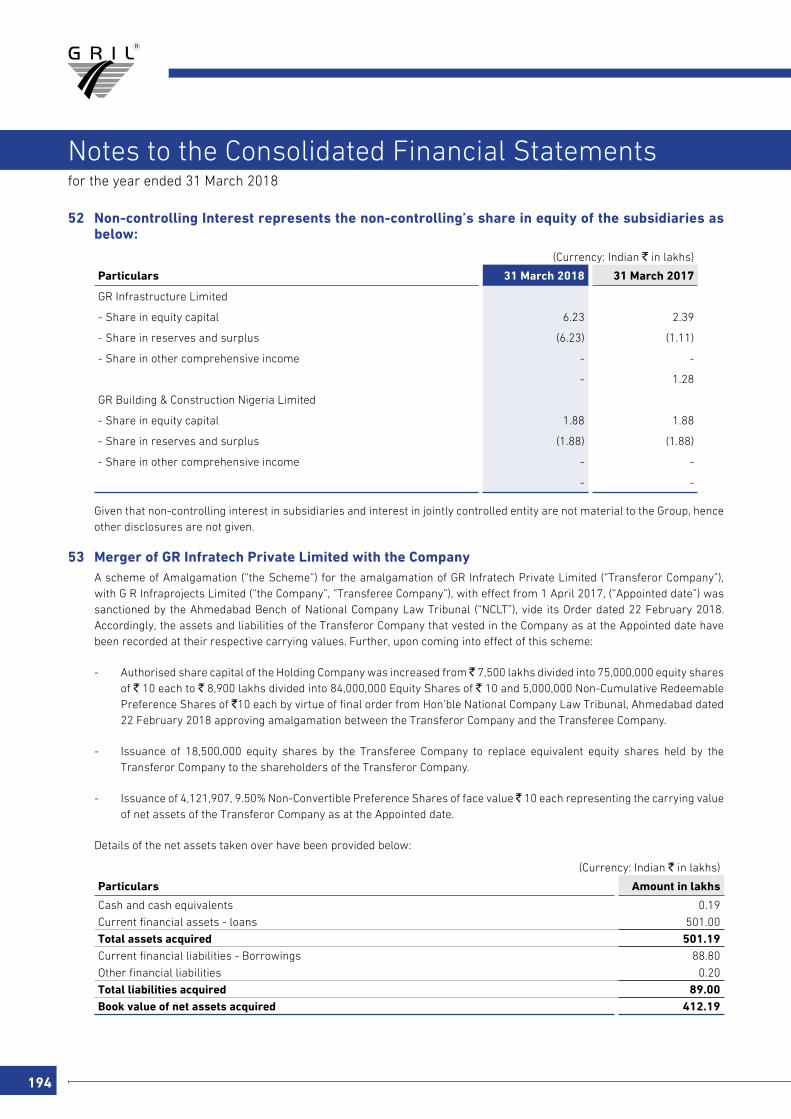
194
for the year ended 31 March 2018
Notes to the Consolidated Financial Statements
52 Non-controlling Interest represents the non-controlling’s share in equity of the subsidiaries as below:
(Currency: Indian ` in lakhs)
Particulars 31 March 2018 31 March 2017
GR Infrastructure Limited
- Share in equity capital 6.23 2.39
- Share in reserves and surplus (6.23) (1.11)
- Share in other comprehensive income - -
- 1.28
GR Building & Construction Nigeria Limited
- Share in equity capital 1.88 1.88
- Share in reserves and surplus (1.88) (1.88)
- Share in other comprehensive income - -
- -
Given that non-controlling interest in subsidiaries and interest in jointly controlled entity are not material to the Group, hence other disclosures are not given.
53 Merger of GR Infratech Private Limited with the Company A scheme of Amalgamation (“the Scheme”) for the amalgamation of GR Infratech Private Limited (“Transferor Company”),
with G R Infraprojects Limited (“the Company”, “Transferee Company”), with effect from 1 April 2017, (“Appointed date”) was sanctioned by the Ahmedabad Bench of National Company Law Tribunal (“NCLT”), vide its Order dated 22 February 2018. Accordingly, the assets and liabilities of the Transferor Company that vested in the Company as at the Appointed date have been recorded at their respective carrying values. Further, upon coming into effect of this scheme:
- Authorised share capital of the Holding Company was increased from ̀ 7,500 lakhs divided into 75,000,000 equity shares of ` 10 each to ` 8,900 lakhs divided into 84,000,000 Equity Shares of ` 10 and 5,000,000 Non-Cumulative Redeemable Preference Shares of `10 each by virtue of final order from Hon’ble National Company Law Tribunal, Ahmedabad dated 22 February 2018 approving amalgamation between the Transferor Company and the Transferee Company.
- Issuance of 18,500,000 equity shares by the Transferee Company to replace equivalent equity shares held by the Transferor Company to the shareholders of the Transferor Company.
- Issuance of 4,121,907, 9.50% Non-Convertible Preference Shares of face value ̀ 10 each representing the carrying value of net assets of the Transferor Company as at the Appointed date.
Details of the net assets taken over have been provided below:
(Currency: Indian ` in lakhs)
Particulars Amount in lakhs
Cash and cash equivalents 0.19
Current financial assets - loans 501.00
Total assets acquired 501.19 Current financial liabilities - Borrowings 88.80
Other financial liabilities 0.20
Total liabilities acquired 89.00 Book value of net assets acquired 412.19

COR
PO
RATE O
VERVIEW
STATu
TOR
y REP
OR
TSFin
an
cial S
tatemen
tS
Annual Report 2017-18 195
G R Infraprojects Limited
for the year ended 31 March 2018
Notes to the Consolidated Financial Statements
For B S R & Associates LLP For and on behalf of the Board of Directors ofChartered Accountants G R Infraprojects LimitedFirm’s Registration No: 116231W/W-100024 CIN U45201GJ1995PLC098652
Jeyur Shah Vinod Kumar Agarwal Ajendra AgarwalPartner Managing Director Director
Membership No: 045754 DIN: 00182893 DIN: 01147897
Anand Rathi Sudhir MuthaChief Financial Officer Company Secretary
Ahmedabad ICAI Memb. No. 078615 ICSI Memb. No. ACS18857
9 July 2018 Gurugram, 9 July 2018
54 Civil proceedings against the Company The Holding Company has on ongoing dispute with a former employee alleging that the former employee had fraudulently
benefitted one of the sub-contractors of the Holding Company – M/s B R Construction (‘BRC’), in connivance with the proprietor of BRC. The Holding Company has alleged that the former employee committed fraud and misappropriation of funds of ` 111.00 lakhs from the Holding Company’s bank account in 2015-2016. The matter is subject to detailed internal investigation and is currently pending. BRC had filed a petition before the National Company Law Tribunal, Ahmedabad Bench (NCLT Bench) to initiate a corporate insolvency proceeding in respect of the Holding Company claiming that an amount aggregating ` 522.70 lakhs has not been paid by the Holding Company to BRC. The NCLT Bench had, vide its order dated January 24, 2018 (the Order), dismissed the Petition, in light of the pre-existing dispute between the BRC and the Holding Company. Pursuant to the Order, BRC has filed appeal against the Order before the National Company Law Appellate Tribunal, New Delhi stating that, inter alia, the Order is quashed and set aside; and that corporate insolvency resolution proceedings be initiated against the Holding Company. The matter is currently pending.
As per our report of even date attached
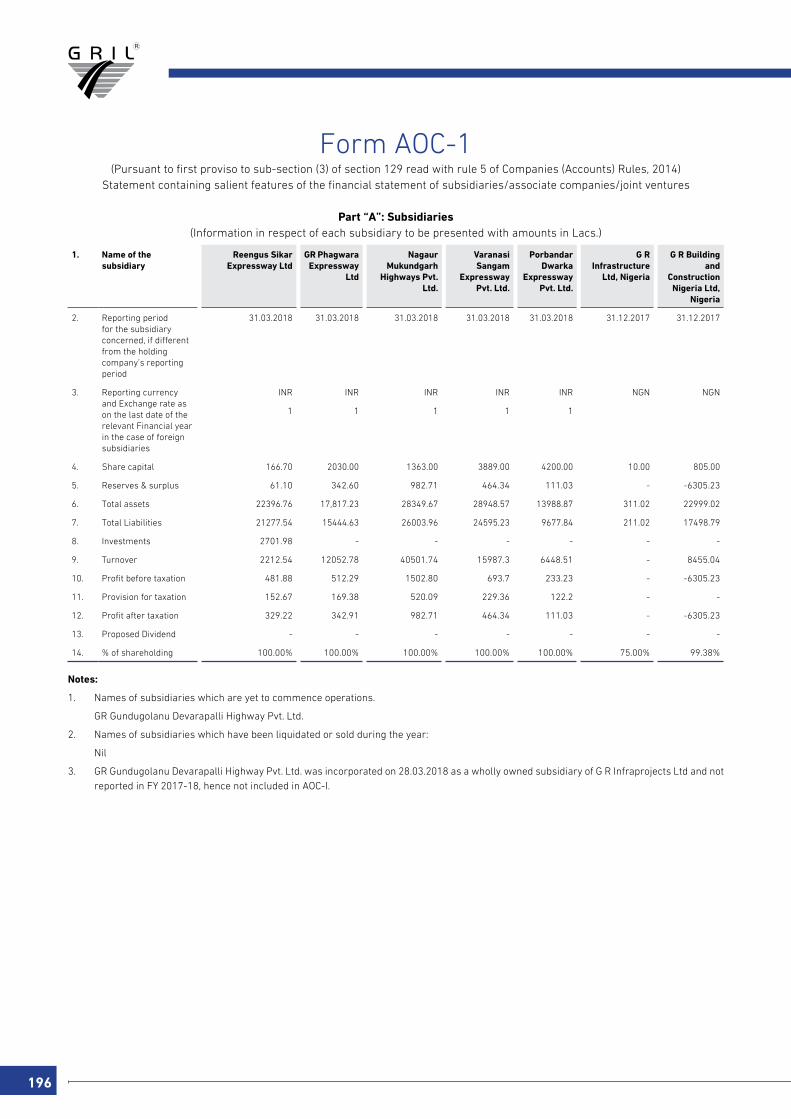
196
1. Name of the subsidiary
Reengus Sikar Expressway Ltd
GR Phagwara Expressway
Ltd
Nagaur Mukundgarh
Highways Pvt. Ltd.
Varanasi Sangam
Expressway Pvt. Ltd.
Porbandar Dwarka
Expressway Pvt. Ltd.
G R Infrastructure
Ltd, Nigeria
G R Building and
Construction Nigeria Ltd,
Nigeria
2. Reporting period for the subsidiary concerned, if different from the holding company’s reporting period
31.03.2018 31.03.2018 31.03.2018 31.03.2018 31.03.2018 31.12.2017 31.12.2017
3. Reporting currency and Exchange rate as on the last date of the relevant Financial year in the case of foreign subsidiaries
INR INR INR INR INR NGN NGN
1 1 1 1 1
4. Share capital 166.70 2030.00 1363.00 3889.00 4200.00 10.00 805.00
5. Reserves & surplus 61.10 342.60 982.71 464.34 111.03 - -6305.23
6. Total assets 22396.76 17,817.23 28349.67 28948.57 13988.87 311.02 22999.02
7. Total Liabilities 21277.54 15444.63 26003.96 24595.23 9677.84 211.02 17498.79
8. Investments 2701.98 - - - - - -
9. Turnover 2212.54 12052.78 40501.74 15987.3 6448.51 - 8455.04
10. Profit before taxation 481.88 512.29 1502.80 693.7 233.23 - -6305.23
11. Provision for taxation 152.67 169.38 520.09 229.36 122.2 - -
12. Profit after taxation 329.22 342.91 982.71 464.34 111.03 - -6305.23
13. Proposed Dividend - - - - - - -
14. % of shareholding 100.00% 100.00% 100.00% 100.00% 100.00% 75.00% 99.38%
Notes:
1. Names of subsidiaries which are yet to commence operations.
GR Gundugolanu Devarapalli Highway Pvt. Ltd.
2. Names of subsidiaries which have been liquidated or sold during the year:
Nil
3. GR Gundugolanu Devarapalli Highway Pvt. Ltd. was incorporated on 28.03.2018 as a wholly owned subsidiary of G R Infraprojects Ltd and not reported in FY 2017-18, hence not included in AOC-I.
Form AOC-1(Pursuant to first proviso to sub-section (3) of section 129 read with rule 5 of Companies (Accounts) Rules, 2014)
Statement containing salient features of the financial statement of subsidiaries/associate companies/joint ventures
Part “A”: Subsidiaries(Information in respect of each subsidiary to be presented with amounts in Lacs.)
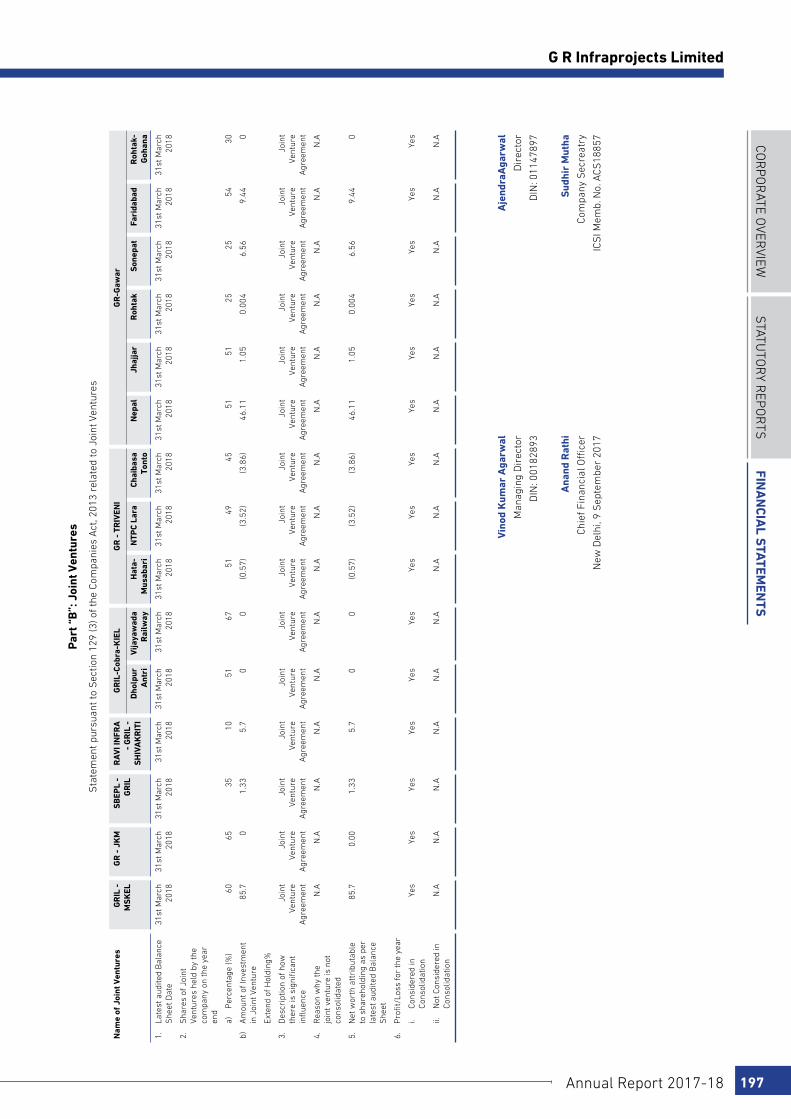
COR
PO
RATE O
VERVIEW
STATu
TOR
y REP
OR
TSFin
an
cial S
tatemen
tS
Annual Report 2017-18 197
G R Infraprojects LimitedPa
rt “
B”:
Joi
nt V
entu
res
Sta
tem
ent p
ursu
ant t
o S
ectio
n 12
9 (3
) of t
he C
ompa
nies
Act
, 201
3 re
late
d to
Joi
nt V
entu
res
Nam
e of
Joi
nt V
entu
res
GR
IL -
M
SK
ELG
R -
JK
M
SB
EPL
- G
RIL
R
AV
I IN
FRA
-
GR
IL -
S
HIV
AK
RIT
I
GR
IL-C
obra
-KIE
LG
R -
TR
IVEN
I G
R-G
awar
Dho
lpur
A
ntri
Vija
yaw
ada
Rai
lway
Hat
a-M
usab
ari
NTP
C La
raCh
aiba
sa
Tont
oN
epal
Jhaj
jar
Roh
tak
Son
epat
Fari
daba
dR
ohta
k-G
ohan
a
1.
Late
st a
udite
d B
alan
ce
She
et D
ate
31st
Mar
ch
2018
31st
Mar
ch
2018
31st
Mar
ch
2018
31st
Mar
ch
2018
31st
Mar
ch
2018
31st
Mar
ch
2018
31st
Mar
ch
2018
31st
Mar
ch
2018
31st
Mar
ch
2018
31st
Mar
ch
2018
31st
Mar
ch
2018
31st
Mar
ch
2018
31st
Mar
ch
2018
31st
Mar
ch
2018
31st
Mar
ch
2018
2.
Sha
res
of J
oint
Ve
ntur
es h
eld
by th
e co
mpa
ny o
n th
e ye
ar
end
a)
P
erce
ntag
e (%
)60
6535
1051
6751
4945
5151
2525
5430
b)
Am
ount
of I
nves
tmen
t in
Joi
nt V
entu
re85
.70
1.33
5.7
00
(0.5
7) (3
.52)
(3.8
6)46
.11
1.05
0.00
46.
569.
440
Ex
tend
of H
oldi
ng%
3.
Des
crip
tion
of h
ow
ther
e is
sig
nific
ant
infl
uenc
e
Join
t Ve
ntur
e A
gree
men
t
Join
t Ve
ntur
e A
gree
men
t
Join
t Ve
ntur
e A
gree
men
t
Join
t Ve
ntur
e A
gree
men
t
Join
t Ve
ntur
e A
gree
men
t
Join
t Ve
ntur
e A
gree
men
t
Join
t Ve
ntur
e A
gree
men
t
Join
t Ve
ntur
e A
gree
men
t
Join
t Ve
ntur
e A
gree
men
t
Join
t Ve
ntur
e A
gree
men
t
Join
t Ve
ntur
e A
gree
men
t
Join
t Ve
ntur
e A
gree
men
t
Join
t Ve
ntur
e A
gree
men
t
Join
t Ve
ntur
e A
gree
men
t
Join
t Ve
ntur
e A
gree
men
t
4.
Rea
son
why
the
join
t ven
ture
is n
ot
cons
olid
ated
N.A
N.A
N.A
N.A
N.A
N.A
N.A
N.A
N.A
N.A
N.A
N.A
N.A
N.A
N.A
5.
Net
wor
th a
ttri
buta
ble
to s
hare
hold
ing
as p
er
late
st a
udite
d B
alan
ce
She
et
85.7
0.00
1.33
5.7
00
(0.5
7) (3
.52)
(3.8
6)46
.11
1.05
0.00
46.
569.
440
6.
Pro
fit/L
oss
for
the
year
i.
Cons
ider
ed in
Co
nsol
idat
ion
Yes
Yes
Yes
Yes
Yes
Yes
Yes
Yes
Yes
Yes
Yes
Yes
Yes
Yes
Yes
ii.
N
ot C
onsi
dere
d in
Co
nsol
idat
ion
N.A
N
.AN
.AN
.AN
.AN
.AN
.AN
.AN
.AN
.AN
.AN
.AN
.AN
.AN
.A
Vin
od K
umar
Aga
rwal
Aje
ndra
Aga
rwal
Man
agin
g D
irec
tor
Dir
ecto
r
DIN
: 001
8289
3D
IN: 0
1147
897
Ana
nd R
athi
Sud
hir
Mut
ha
Chie
f Fin
anci
al O
ffice
rCo
mpa
ny S
ecre
atry
New
Del
hi, 9
Sep
tem
ber
2017
ICS
I Mem
b. N
o. A
CS18
857

Notes

Notes

Notes

G R Infraprojects Limited
Registered Office: Head Office: Corporate Office:
Revenue Block No. 223,
Old Survey No. 384/1, 384/2
Paiki and 384/3, Khata No. 464,
Kochariya, Ahmedabad - 382 220,
Gujarat, India
GR House, Hiran Magri
Sector 11, Udaipur
Rajasthan - 313 002, India
+91 294 2487370
+91 294 2487749 (Telefax)
2nd Floor , Novus Tower,
Plot no 18, Sector 18 Gurugram,
Haryana - 122 015, India
+91 124 6435000