outcome-based and competition-based policies of school ... · web viewoutcome-based and...
TRANSCRIPT
OUTCOME-BASED AND COMPETITION-BASED POLICIES OF SCHOOL EVALUATION:
a comparison of school performance and perverse effects in two mid-sized Hungarian towns1
Dániel Horn2
Max Weber fellow
European University Institute, Florence, Italy
[email protected] (corresponding author)
Lajos Bódis
associate professor
Department of Human Resources, Corvinus University, Budapest, Hungary
1st version
prepared for the
INVALSI-APPAM “Improving Education through Accountability and Evaluation Lessons
from Around the World” conference
Rome, Italy, October 3-5. 2012.
Do not cite without authors’ permission!
1 The Project was supported by the “Közoktatás teljesítményének mérése-értékelése” project of the CERS-HAS and the OTKA K 84273 grant (see: http://www.uni-corvinus.hu/index.php?id=iskolakutatas)2 On leave from the Research Center for Economic and Regional Studies, Hungarian Academy of Sciences (CERS-HAS) and the Economics Department, ELTE, Hungary (ELTEcon)

1 – Introduction
The Hungarian public education legislation entrusts school providers, mostly local
governments, with wide autonomies in adapting various methods of school governance to
manage increased demographic and economic pressures in education.3 Most of the local
governments react to these problems with a “competition-based policy”, by which we mean a
laisses-faire policy that let schools to compete for children and administration interferes only
if there are imminent frictions in the system. Some, however, try to reform.
This paper contrasts two different approaches of school evaluation in two mid-sized
Hungarian towns: “Parktown” and “Birdtown”. While Birdtown’s education policy can be
considered typical in the country, Parktown has initiated a full scale reform in 2007 with the
primary goal to desegregate school. During this process Parktown has transformed the usual
“competition-based policy” into an “outcome-based policy”, a process we shortly describe
below. The paper uses quantitative as well as qualitative data to contrast the effect of the
approaches on school performance. The quantitative data is from 22 mid-sized Hungarian
towns, which we use to compare the performance effects of the two policies. We use the
qualitative data from these two towns to describe the two policies and to highlight the
potential causes of the results we observe in the empirics.
2 – National Background
The Hungarian central government allocates per-student lump-sum grants to education
providers, who are free to allocate the amount among their schools.4 School principals have
very narrow possibilities in changing the staff: teachers are public servants on a set wage-
3 See Fazekas, Köllő and Varga (2009) for an overarching analysis of the education problems facing Hungary. Note that we do not deal with the comprehensive recent changes promising the re-centralization of the public education system due to the newly passed Public Education Act in 2011 which was put into force in 2012 September, since they fall outside the time horizon we study.4 Mostly they straightforwardly pass on the amount to their schools. In fact, almost universally, the local governments must add to this amount to keep the school running (Varga and Hermann 2007)
2

scale and are employed by the local governments; thus hiring is only possible if there is an
opening, while firing is done through the local government. Teachers are also extremely
protected by the law on public servants;5 they are very hard to fire and mostly not accountable
on professional grounds.
There has been a large and steady demographic decline in Hungary. The size of the birth
cohort was decreasing continuously from the early 1980’s to 2000. While the number of
Hungarian children born in 1980 was nearing 150.000, it was under 100.000 in 2000 (see
Lannert 2009). The demographic “shock” has reached the schools just before the transition
and they are still facing decreasing cohorts at the lower-secondary level.
On the demand side, parents are able to choose schools outside the catchment-areas.
Although public-schools must admit anyone from their catchment area, they can admit
students outside of this area only if free places remain after the admission of within-area
children. Naturally, due to the large demographic decline, most schools have free places.
Moreover, due to per-student financing, and to the rather inflexible teacher employment,
schools have no other option but to admit anyone applying, unless they want to fire
colleagues. Those schools, who fail to fill up the free places, will eventually be closed. But
the best schools can even select among the best students, and have the “privilege” to refuse
other applicants. Since skills correlate highly with status and the ability to move (richer
parents can transport children outside the catchment area, in most cases outside the
town/village boundaries) this institutional setup straightforwardly leads to segregated schools,
and a large inequality of opportunity within the system (see Kertesi and Kézdi 2010 for a
detailed analysis).6 5 Law of 1992/XXXIII. on public servants.6 We have to note that §66 (2) in the 1993/LXXIX law on education, in force from July 2008 till September 2012, set the ratio of disadvantaged students in each school. The ratio of disadvantaged students in any of the schools of an education provider could not deviate more than 15% from the same ratio of the education provider. If an education provider has only one school, this rule is meaningless, but if there are more schools, this helps to even-out the composition differences between them. The paragraph also stated that out-of-area disadvantaged students must have had priority if there free places remained. There is still very little evidence on the effects of this regulation.
3

Note moreover that when students are segregated across schools, teaching is harder in
those with lower-status children, and because it is impossible to compensate wages for
increased effort, selection among teachers also takes place (Epple, Newlon, and Romano
2002; Rivkin, Hanushek, and Kain 2005; and for Hungary see Varga 2011).
Although entrusted with wide powers, local governments basically have only two
alternatives: either to adjust bits and pieces or to fully reorganize the system. They either
adapt the implicit and characteristically undocumented “competition-based policy” and to try
to instantaneously solve burning issues within the local system, or reorganize the whole local
education system altogether. While the first offers the advantage of much smaller conflicts
and most likely less resistance by the teachers, an overarching reform is more attractive from
a long-run policy perspective.
The plot of the paper is that the Parktown reform is in line with the most recent changes
in education policy in the developed world, but there are some important institutions that are
missing from its design and implementation. We show that Parktown schools perform
similarly to other schools in mid-sized towns, if we look at the unadjusted level differences;
however it performs much worse after the reform if we look at value-added measures of
school performance. We suggest that this unexpected result is due to some missing
institutions, to the bad outcome measure and maybe to the early stage of the reform process.
3 – Data and Description of the Two Towns
The paper uses two distinct sources to compare the two towns/policies. The quantitative
data is based on the National Assessment of Basic Competencies (OECD 2010a), while the
qualitative data is collected through semi-structured interviews and document analysis in the
two towns (see also Neumann 2011; Oblath 2011).
4

Quantitative Data – NABC
The National Assessment of Basic Competencies (NABC) is a standard based
assessment designed similarly to the OECD PISA survey, but conducted annually in May.7 It
measures reading and mathematical literacy of the 6th, 8th and 10th grade students. “The
primary goal of the National Assessment of Basic Competencies introduced in 2001 is that, in
the light of objective data, it provides as detailed and multi-faceted picture of the effectiveness
of schools as possible so that data on Hungary’s schools are comparable, which thereby
facilitates institutions’ self-assessment and contributes to the completeness of external
assessment. Based on centrally processed data, every school has the opportunity to analyse the
performance of its students in comparison with national outcomes and indicators.” (OECD
2010b, 5) In addition to the mathematics and literacy test scores, the database contains
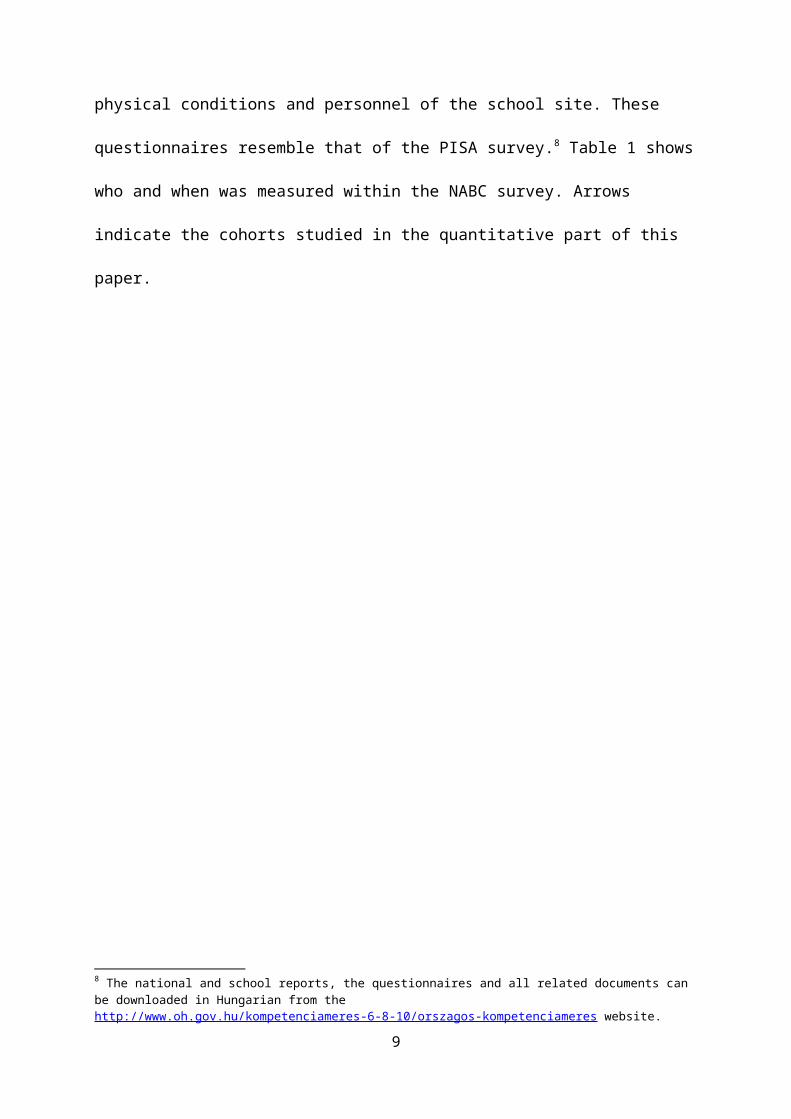
extensive information on the student background and on the physical conditions and
personnel of the school site. These questionnaires resemble that of the PISA survey.8 Table 1
shows who and when was measured within the NABC survey. Arrows indicate the cohorts
studied in the quantitative part of this paper.
7 See Hermann and Molnár (2008) for a more detailed, Hungarian language, description of the NABC database, or the OECD Review on Evaluation and Assessment Frameworks for Improving School Outcomes –Hungary Country Background Report (2010b) for a discussion of the whole evaluation system.8 The national and school reports, the questionnaires and all related documents can be downloaded in Hungarian from the http://www.oh.gov.hu/kompetenciameres-6-8-10/orszagos-kompetenciameres website.
5

1. table – The official NABC database
4th grade 6th grade 8th grade 10th grade2003 0 20 students from every
school0 20 students from each
track from each school2004 0 20 students from every
school20 students from
every school20 students from each track from each school
2006 full cohort every student from a sample of 195 schools
full cohort 30 students from each track from each teaching
site2007 full cohort every student from a
sample of 200 schoolsfull cohort 30 students from each
track from each teaching site
2008*
every student from a sample of 200
schoolsfull cohort full cohort full cohort
2009*
every student from a sample of 200
schools
full cohort full cohort full cohort
2010*
every student from a sample of 200
schools
full cohort full cohort full cohort
2011*
every student from a sample of 200
schools
full cohort full cohort full cohort
* Permanent individual identification numbers are available-> Panel utilized in this paper
Unfortunately, up until 2008 the database could only be analyzed on a cross sectional
basis, because it had not contained permanent student level identification numbers. This is one
of the reasons why many schools and education providers – including Parktown – look at the
mean scores (or sometimes at the status adjusted mean scores) to evaluate the performance of
the schools. Naturally these comparisons are likely to be flawed (Meyer 1997). Therefore we
compare value-added measures of school performance to judge the effectiveness of the reform
(see below). In order to fully account for the effect of the reform we run a dif-in-dif analysis,
6

we compare school value-added before the reform (panel of 2004-2006) and after the reform
(panel of 2008-2010 and 2009-2011).
In order to gather data before the reform we had to connect the NABC cross-sectional
results before 2007. This could only be done by the schools themselves, since they are the
only actors who know both the name of the student and their survey-id. Schools were asked to
connect the results of their 6th grade students in 2004 with their 8th grade results in 2006.9 Our
sample is not representative of all of Hungary. The sample contains only mid-sized (cca.
15000 to 150000 inhabitants) Hungarian towns. We have valid observation on 2819 students,
from 163 schools in 22 towns in the first panel. All towns have more than 50 valid
observations (note that in 2004 only 20 students from a school was sampled), with a mean of
7.5 schools per town. Both Parktown and Birdtown have substantial number of valid
observations. Birdtown has 6 schools with 121 students, while Parktown 7 schools with 118
students.10
The after reform data comes from two cohorts: the 2008 6th grade cohort and the 2009
6th grade cohort. Both are connected with their 8th grade results. All schools and all students
from the 22 towns are in the sample, since the NABC is administrative dataset data attrition is
minimal.11 There are altogether 14848 students in 2008 and 13291 students in 2009 in the
sample. Birdtown has 792 students in 2008, and 679 in 2009 in 12 schools (of which 1 is
foundation run), while Parktown has 437 students in 2008 and 415 students in 2009 in 8
schools (of which two are church schools and one is foundation school).
Qualitative Data - Interviews
9 The data collection was supervised by Zoltan Hermann, and financed by the NKTH Jedlik Ányos Program (B2/063/2006).10 Probability sampling weights were calculated to correct for the 20 student sample from the schools based on the 2006 8th grade family background characteristics of the students to represent the student population in the 22 towns.11 Only the background questionnaire is non-compulsory, with a non-response rate around 10-15% .
7

A small group of researchers conducted over 300 semi-structured interviews with
administrators, principals, teachers and stakeholders of the two towns between 2008 and
2012. Some of the interviews directly concern the reform in Parktown, and there are dozens of
interviews, mainly with the responsible teacher and/or the principal, which are about the
accountability systems of the town, school performance, the National Assessment of Basic
Competencies and the potential perverse effects that an outcome oriented local policy might
generate.
Birdtown is a larger town in the eastern part of Hungary, with around 75 thousand
inhabitants. It is the capital of one of the counties in Hungary. The local government had 14
schools in 2004 (and another run by a foundation) and 11 in 2008, enrolling around 7500
students in 2004 and 6200 in 2008 on the primary level (7,5% drop).
Parktown is bit smaller also in the eastern part of the country, with around 50 thousand
inhabitants. The local government ran 10 schools with primary level education in 2004 (and
there were another church and a foundation school within Parktown), and only 5 in 2008. The
total enrollment of primary level students fell from around 4100 in 2004 to 3500 in 2008
(4,7% drop).
Education Policies
The main difference between Birdtown and Parktown, as the measurement of school
performance is concerned, is that Birdtown looks mainly at the “quality” of the schools, while
Parktown looks mainly at hard outcomes (test scores).
Birdtown representatives as well as teachers have emphasized that any school can be
excellent in one sense or another. One school might focus on language teaching or in
mathematics, while the other might attract more athletically oriented youth. One school might
stress high quality academic teaching while another is respected for its teachers’ ability to
8
cope with problematic students. Although most teachers and all administrators in Birdtown
accepted and respected the NABC and underlined that they look at the yearly reports, the
overall conclusion of the final focus-group highlighted that standardized test scores are only
secondary (at best) in judging school performance.
This approach is reflected in the official evaluation of the schools. In each year three
schools are evaluated by the local government. The evaluation is officially based on three
highly subjective criteria: “constructive way of life”, “local patriotism” and “continuous
professional development”. Also the local government requires the schools to produce self
evaluations on their quality annually. The use of the NABC within these reports should be
straightforward but instead each school collects data on parents’ satisfaction and reports on
these.
As result of this “quality” approach the town does not really interfere with the schools,
unless there is a burning issue.
„It was around 2005 when the politicians and administrators here [in Birdtown] started
to say that the parents are voting with their feet. So we didn’t try to stop it. We said that
if you can’t add Chinese gymnastic course on top of hottentotta language course, and
you can’t make them stay, we’re sorry.
(an administrator at the local government, Birdtown)
As a result, competition between schools is strong. Each school tries to form its own
profile to attract the best students. Although catchment areas exist, since there are surplus of
places, it is not a strict barrier; especially since most schools are close to the town center.12
Naturally, we could find these two approaches – quality versus a “hard” outcome
measure – in Parktown as well, but the emphasis was more on the standardized testing than on
the quality differences between schools, especially from the administration side. The focus on
12 Note that closed schools were almost exclusively outside the city center.
9

testing comes mainly from the very charismatic and politically well imbedded mayor. The
2007 reform was almost exclusively his accomplishment. The reform was planned well before
his reelection in 2006 October and implemented right after that.
The major goal of the school reform in 2007 was to solve the increasing problem of
segregation and as an off-shoot to boost the performance of the schools (Nagy 2008).
The town officially closed all of its 10 schools and reopened 5 new schools on the same
day. This allowed the local government to fire all and hire fewer teachers and also to
reorganize the catchment areas of the new schools. Approximately 30% of the teachers were
laid off in part based on a performance assessment and in part on specialization demand.
Principals were asked to evaluate teachers, and also teachers were asked to evaluate
themselves. Each teacher was shown the results of the evaluation. The newly named
principals were given the right to create the new teaching-staff from the portfolios on the table
(occasionally referred to as the “beef market” by some of the interviewees). The re-hired
teachers were promised to be “left alone” for four years: a promise that has been kept by the
local government. Of the 10 initial schools 3 were not reopened at all, one was merged with
another and one was handed over to the Catholic Church.
Another important change in the system was the increased focus on the NABC results.
The mayor told us in an interview that he used the NABC 2004 results to show that Parktown
schools are not as good as people had thought. He asked a consulting company to report on
the school results.
“Then we went through each school one-by-one, which created the first smaller
turbulence. They [the General Assembly] did not like it. They did not like to face the fact
that there was practically no school, which showed above national average
10

performance. Thus we had no good schools. We had no exceptional primary schools.”
(the mayor of Parktown)
To put an emphasis on the NABC the mayor asked schools to report annually on their
school progress in front of the General Assembly meetings of the local government (the local
television broadcasts all assembly meetings live) in between 2007 and 2010. There was also
general report on the success of the reform in 2008, which included a large section about the
test scores and other “hard” measures of schools performance by the same consulting
company (Blazovicsné Varga 2008). Most of our interviewees have also emphasized that the
local government places a great emphasis on the results. However, we have not documented
any decisions based purely on these. That is to say, while the teachers as well as the
administrators at the local government are clearly aware of the NABC results and the issue is
brought up several times a year, it seems that no financial or other decisions are based on
these.
Note however that the government’s focus is on the cross sectional results. Although it
is likely that these are flawed (Meyer 1997) and help higher status, higher quality schools to
succeed. On the other hand, due to the reorganization of the system (and the re-shuffling of
teachers) differences between schools have decreased.
In Parktown each school tries to advertize its own profile (language, music, athletics,
academic and math), but the profile differences are much smaller than in Birdtown. Due to the
reorganization of the system, the schools have no surplus of places, thus it’s harder to move
cross-catchment areas, which also makes the school composition similar. The administration
also keeps a close eye on these movements, and intervenes if necessary, making competition
between schools – as understood in Birdtown – meaningless, but making competition – as
understood usually, i.e. competing for one goal – stronger. Of course schools could use their
11

profiles to defend their results. Schools specialized on math could make excuses about their
reading scores, while music and athletics schools have (some) reasons on bad results in both
subjects. This we have not seen as common.
4 – Quantitative Analysis
Theory suggest that the education provider’s focus on the outcomes, i.e. increased
accountability, in Parktown should drive performance up (e.g. Carnoy and Loeb 2002; Ladd
1999; Woessmann 2008), at least on the same test score scale (the NABC in this case), which
is used to hold schools accountable. Competition between schools in Birdtown might drive
performance up as well (Hanushek and Rivkin 2003), but since performance is understood
differently by each school, the effect is expected to be less emphatic on the NABC scale. An
expected pitfall of the competition-based system is increased status selection between schools
(Epple, Newlon, and Romano 2002).
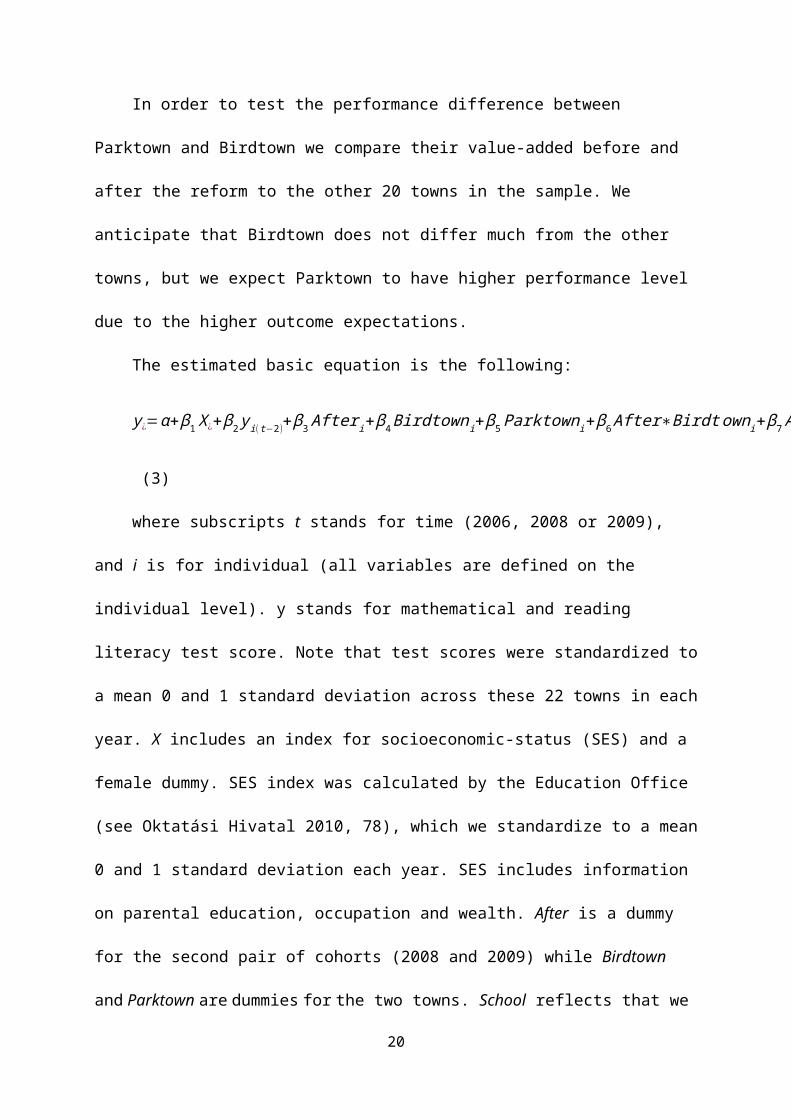
In order to test the performance difference between Parktown and Birdtown we compare
their value-added before and after the reform to the other 20 towns in the sample. We
anticipate that Birdtown does not differ much from the other towns, but we expect Parktown
to have higher performance level due to the higher outcome expectations.
The estimated basic equation is the following:
y¿=α+ β1 X ¿+ β2 y i(t−2 )+ β3 After i+β4 Birdtowni+β5 Parktowni+ β6 After∗Birdt owni+β7 After∗Park t owni+∑s=1
N
γ s School¿+ε¿
(3)
where subscripts t stands for time (2006, 2008 or 2009), and i is for individual (all
variables are defined on the individual level). y stands for mathematical and reading literacy
test score. Note that test scores were standardized to a mean 0 and 1 standard deviation across
these 22 towns in each year. X includes an index for socioeconomic-status (SES) and a female
12

dummy. SES index was calculated by the Education Office (see Oktatási Hivatal 2010, 78),
which we standardize to a mean 0 and 1 standard deviation each year. SES includes
information on parental education, occupation and wealth. After is a dummy for the second
pair of cohorts (2008 and 2009) while Birdtown and Parktown are dummies for the two
towns. School reflects that we control for school fixed effects. Controlling for school fixed
effects is necessary since we are interested in the effects of the towns’ education governance
and not in the difference between the different schools – student composition, teacher
composition, etc.
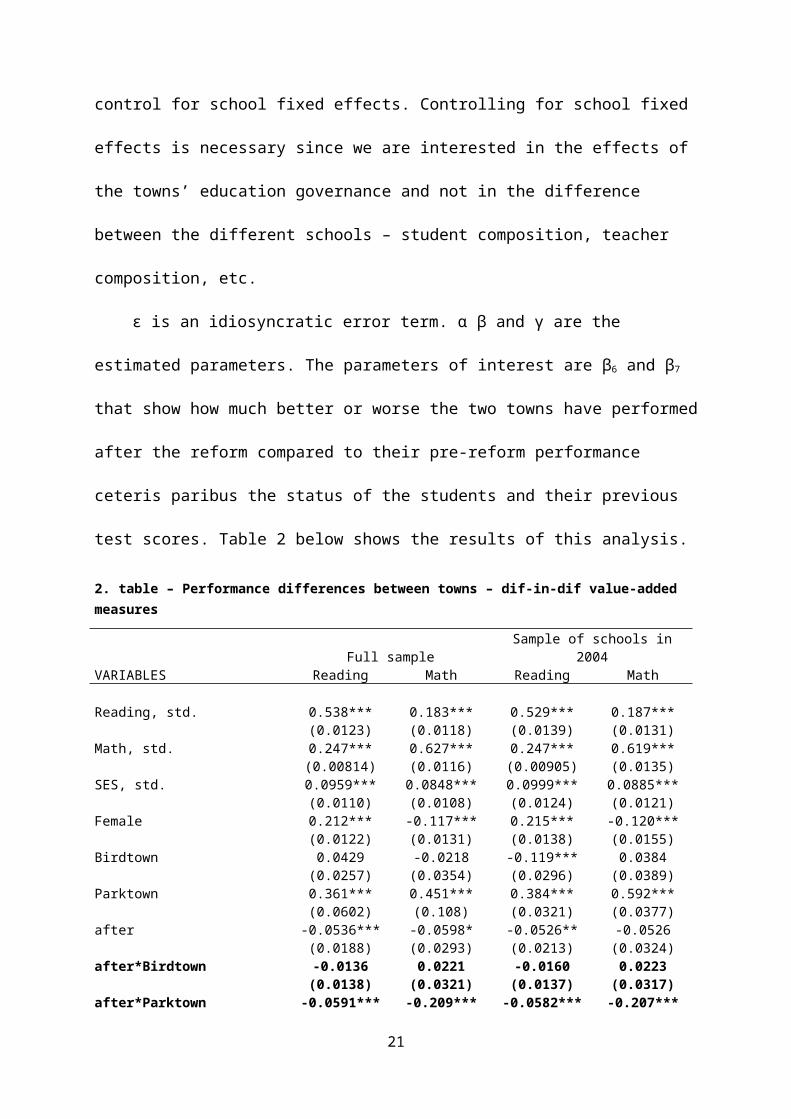
ε is an idiosyncratic error term. α β and γ are the estimated parameters. The parameters
of interest are β6 and β7 that show how much better or worse the two towns have performed
after the reform compared to their pre-reform performance ceteris paribus the status of the
students and their previous test scores. Table 2 below shows the results of this analysis.
2. table – Performance differences between towns – dif-in-dif value-added measures
Full sample Sample of schools in 2004VARIABLES Reading Math Reading Math Reading, std. 0.538*** 0.183*** 0.529*** 0.187***
(0.0123) (0.0118) (0.0139) (0.0131)Math, std. 0.247*** 0.627*** 0.247*** 0.619***
(0.00814) (0.0116) (0.00905) (0.0135)SES, std. 0.0959*** 0.0848*** 0.0999*** 0.0885***
(0.0110) (0.0108) (0.0124) (0.0121)Female 0.212*** -0.117*** 0.215*** -0.120***
(0.0122) (0.0131) (0.0138) (0.0155)Birdtown 0.0429 -0.0218 -0.119*** 0.0384
(0.0257) (0.0354) (0.0296) (0.0389)Parktown 0.361*** 0.451*** 0.384*** 0.592***
(0.0602) (0.108) (0.0321) (0.0377)after -0.0536*** -0.0598* -0.0526** -0.0526
(0.0188) (0.0293) (0.0213) (0.0324)after*Birdtown -0.0136 0.0221 -0.0160 0.0223
(0.0138) (0.0321) (0.0137) (0.0317)after*Parktown -0.0591*** -0.209*** -0.0582*** -0.207***
(0.0199) (0.0336) (0.0195) (0.0333)2009 dummy 0.00403 0.0105 0.00687 0.0247
(0.0243) (0.0240) (0.0292) (0.0291)Constant -0.106*** 0.0743*** -0.0964*** 0.0726***
(0.0106) (0.0169) (0.00999) (0.0152)School FE y y y y
13

R-squared 0.667 0.680 0.661 0.674Robust standard errors clustered on the town level in parentheses
*** p<0.01, ** p<0.05, * p<0.1
Unsurprisingly previous reading and math scores have very strong effect on later test
scores. Status also matters a lot. While a standard deviation higher previous test score
indicates half a standard deviation higher later test score, one standard deviation higher status
predicts 0.1 standard deviation higher test scores. Girls are better in reading, while boys in
math. It seems that Birdtown is not different from the other 20 mid-sized Hungarian towns: it
had the same test scores before or after 2007. Thus our hypothesis was correct in this respect
(or to put it differently, the data is good enough to test the Parktown reform).
Surprisingly Parktown seems to have smaller value-added after the reform. Parktown
had about a 0.4 standard deviation higher performance than the other towns in the sample, but
this has decreased by 0.05-0.2 standard deviations towards the sample mean. (Note that
Parktown still has a higher than sample-mean value-added even after the reform.)13
The last two columns in table 1 show the same estimations on a restricted sample. In
2004 only some of the schools were surveyed. We limit the sample to only those schools,
which were in the 2004-2006 sample, to test the robustness of the results. Birdtown seems to
have a lower than mean value-added in reading before the reform, but none of the other
coefficients have changed significance.
The results are puzzling in two aspects. One is that they are against our hypothesis that
outcome oriented policies would drive performance up. Secondly, the Parktown local
government has explicitly used the fact that they are not above the national mean to facilitate
reforms. Our data suggests that they were and still are above the sample mean.
As for the second puzzle: the local government were not looking at value added
measures, but compared Parktown on a cross sectional basis. Table 3 below supports this
13 Re-estimation of the same model using 2008 or 2009 panels only as after does not change results.
14

hypothesis. If we do not control for previous test scores or status and leave school fixed effect
out, Parktown is not different from the 21 other mid-sized towns. Contrary, Birdtown seems
to perform better than the average, with a large drop in performance after 2007.
3. table - Performance differences between towns – dif-in-dif unadjusted performance measures
Full sample Sample of schools in 2004VARIABLES Reading Math Reading Math Birdtown 0.365*** 0.283*** 0.365*** 0.283***
(0.0497) (0.0565) (0.0497) (0.0565)Parktown 0.0358 0.0581 0.0358 0.0581
(0.0497) (0.0565) (0.0497) (0.0565)after -0.0586 -0.0822* -0.0698 -0.0832
(0.0455) (0.0408) (0.0516) (0.0552)after*Birdtown -0.323*** -0.313*** -0.100** -0.141***
(0.0361) (0.0396) (0.0386) (0.0480)after*Parktown -0.00172 -0.110** 0.0735* -0.0625
(0.0365) (0.0396) (0.0395) (0.0484)Constant 0.0551 0.0856 0.0551 0.0856
(0.0497) (0.0565) (0.0497) (0.0565)Year FE y y y yObservations 27,549 27,551 19,190 19,189R-squared 0.004 0.004 0.007 0.006
Robuststandard errors clustered on the town level in parentheses*** p<0.01, ** p<0.05, * p<0.1
But why have the value-added in Parktown dropped after the reform? There are three
possible explanations for this – without contradicting previous research.
The first is that focusing on cross-sectional outcome results forces the teachers to game
the system. Either by teaching to the test (which we have documented14), or to reallocate
14 One of our interviewees has described how they prepare children for the test. In each October lower secondary students take the previous the tests from the previous year. 5th and 7th grade students take a “light” 2-hour version, while 6th and 8th grade students take the full-blown 4-hour test. There is no teaching on that day, and students are expected to dress nicely as if it were national testing. All staff members correct the tests, partially to reduce workload and partially to involve everyone in the process. The principal holds a special meeting for the parents before the real testing day in May to draw attention to the importance of the testing. Teachers even visit those parents that have not shown up. Students in between marks are promised the better marks if they perform well on the test. When results arrive teachers go through the strengths and weaknesses and assign tasks to all members of the staff. Although it is an extreme case even in Parktown, other schools also devote lot of energy to this testing.
15

resources from other areas of teaching (which we have also seen), or simply to motivate less
talented youth to stay away (which we could not really document) (see Koretz 2002 for the
US ). However, table 3 results show that there is no change in the cross sectional results
either. Parktown schools are not performing better than they were before the reform.
Moreover, this should not explain the drop in the value-added. Even if Parktown schools
game the system, if they do it consistently, this should not have an effect on their value added.
The second argument is that we are too early to judge. Such a full scale reform
undoubtedly generated a large turmoil in the town. Teachers just a principals and
administrators are puzzled by the new system. Each member of the teaching staff, as well as
the parents and students has to adapt to the new circumstances. This takes a lot of effort,
which might harm the teaching as well. Thus we should come back in some years and judge.15
On a similar note, reforms are not a linear process. As Elmore (2003) explains with an
analogy of extreme mountain climbing:
“Consider a group of climbers discussing strategies for an assault on a difficult 20,000-
foot mountain. The goal is achievable only if each member works at full physical and
mental capacity, and only if the group fully develops its capacity to work together on the
assault. Would any reasonable mountaineer suggest that all members of the team head
straight up the mountain, as a group, in one continuous assault? This would be a
formula for disaster. To be successful, the assault must be carefully staged to provide
time for the group to pause, pool its knowledge of the mountain, regain its physical
capacity, regroup, and agree on a plan for the next phase. The more effective the group,
the more skillful it is at finding and using these periods of consolidation.” (Elmore
2003, 19)
15 Note however that we do not observe significant difference between the 2008 and the 2009 cohort. However, if stakeholders only need time to accommodate we should observe a small increase in the results.
16

The third explanation for the puzzle, to which we turn in the next section, is that the
reform in Parktown had some important missing pieces. We recognized some missing
institutions that we think could block the way of a successful outcome-based policy reform.
These institutions are the training of teachers to understand and accept standardized testing
(lack of expert teachers), lack of forums that would help teachers understanding the results
and observe good practices and the inadequacy of running teacher training programs to help
participants in adapting to changed circumstances. In general we find that teachers or schools
have not changed their teaching practice at all due to the introduction of standardized testing.
There are groups of teachers or schools that put larger emphasis on understanding the testing
procedure – an also the ways in which to improve on these tests – but several times we find
that these are not more than efforts to game the system.
5 – Qualitative Analysis
Theoretically any government has three intertwined ways to regulate education: input,
process and output. While input based regulation has been argued to fail to increase school
performance (Hanushek 2003), output-based regulation has been gaining pace in the western
world. In a review of school evaluation practices Faubert (2009) emphasizes the growing
demand for school accountability in the OECD countries over the past decade.16 Most likely
the No Child Left Behind Act of the US also had a major impact on the education policies.
Apparently Parktown in Hungary also follows this route in emphasizing the output-based
coordination. Focusing on output, however, inevitably puts limit on the other two ways of
coordination (Milgrom and Roberts 1992)
In order to effectively coordinate the education system by outcome-based measures, it
is necessary that teachers are able to adapt to changed circumstances, that they understand the
16 But also see Politt and Bouckaert (2000) in describing the spread of output based policies in the public services.
17

system (especially the testing), that they can draw conclusions from the results and put these
into practice and finally that they can provide feedback for the regulator.
As for the input regulation is concerned it means that teachers must be good. They must
be good enough to work together to understand, to develop and to apply new teaching
practices (Barber and Mourshed 2007; OECD 2005; Elmore 2004; Rosenholtz 1989). Since
good teachers are unequally distributed across schools in Hungary (Fazekas, Köllő, and Varga
2009; Varga 2011) focusing on outcomes forces the regulator to equalize teacher quality (a
very important input) across schools. By closing all schools and reshuffling teachers across
schools, Parktown has dealt with this challenge: while there were rumors of excellent or bad
teachers in one school or in another, we have not observed serious quality differences between
teaching staffs in Parktown.
On the other hand teacher quality in Hungary is generally thought to be very poor due
mainly to the long term underpayment of Hungarian teachers (Varga 2007). This inevitably
puts a large emphasis on the process-based regulation: teachers must be taught the new ways,
among others to understand educational measurement and testing.
The most overarching teacher training program in Hungary in the last decade was the
competence-based training, a national program of methods and modern pedagogic techniques
training (European Council 2006; Ministry of Education and Culture, and Ministry of Social
Affairs and Labour 2009; Ministry of National Resources 2011; SROP 2007; Zsigovits 2008).
Since during our research there was no other centrally organized training, we looked at the
participation rates in this program among Birdtown and Parktown teachers to proxy process-
based coordination.
As a rule Birdtown schools could apply for participation in this teacher training program
individually,17 while the local Parktown administration assigned the schools to this program,
17 The education provider applied for the grant at the central agency, but schools signaled whether they would like to participate.
18

so each school have participated in one year or the next. Nevertheless, we observed that even
in Parktown different schools have put different efforts into this program. Some schools have
involved almost all teachers in the training, while others have sent just a few. From this we
deduce that different schools use the modern pedagogic techniques differently, which –
among others – might signal the inability of a school to adapt to changing circumstances.
The ideas and initiatives of teachers or teaching staffs can only be spread if there are
forums where they can be discussed, debated and developed. However, even this well funded
competence-based training program has not included the systematic discussion or debate of
good practices and new ideas.
Schools and local governments had the incentive to participate (or to force teachers to
participate) in this training, since it involved funds for ICT equipment or sometimes wage-
subsidies for teachers. On the other hand it required lot of work from the teachers’ side to
adapt new teaching techniques. Also motivation for the school principals to monitor teachers’
real effort was low, since school accountability was (and nationally still is) low. The NABC
was a cross sectional database up until 2010; thus schools could only be compared on a cross
sectional basis. This hurt the potential of education providers and the national government to
monitor the value-added, i.e. to proxy real teacher effort. There was also no long-term
incentive for the teachers to participate: we do not know about offers of long term decreased
or altered teaching duties or prospects of higher pay for those, who participated. In short, even
if schools participated, teacher participation in this large scale program does not imply that
teachers are able to communicate or even to adapt to a sudden reform.
As for the testing is concerned: we assume that understanding testing, or specifically
understanding the NABC, requires some forms of expertise. Such expertise is rare in
Parktown. We have talked to only a couple of teachers that could convincingly explain the
19
details of the test on a professional level. These two teachers have individually participated in
testing related training. On the other hand all schools have seemed to put much effort in
working with the yearly reports, and also to prepare for the upcoming tests.
Birdtown schools are much more heterogeneous in this respect as well. There are a
couple of schools where students take the tests and then no real effort is made to integrate the
centrally generated knowledge into the local teaching practice. The responsible teachers here
treated the testing as a pure administrative duty (i.e. to organize the testing) and lacked even
the most basic knowledge of the NABC. There are many schools, where the practice is similar
to the schools in Parktown: a responsible teacher or group of teachers without any
professional background tries to understand the results and then a staff meeting is devoted to
the discussion. There are two schools on the other end of the spectrum. One of them
cooperates with an educational measurement group of a national university, and some of the
school teachers are also enrolled in the same university program. And there is one school that
acts as a role-model for the use of the NABC throughout the country. This school has a group
of teachers with expertise in educational measurement specifically assigned to administer the
NABC and also other non-compulsory national and local tests for the school. This school has
a reputation in education measurement and testing.
Even if expertise is available in some schools, there is still need for institutionalized
forums for the teachers to discuss results and for the experts to share observations about the
results. Such forums would not only enable non-expert teachers to learn from their peers and
schools to discuss the results but also would facilitate the discussion between schools and the
local government. We have not found signs of such forums in any of the towns up until late
2010 (see below). Before 2011 Parktown has evaluated schools without opening the
conclusions for any debate. In some cases it even outsourced the evaluation to a company that
20
sent its report to the local government and to the schools directly, and the reports were
publicized during the General Assembly meetings and on the internet.
In short, we found that three important pieces are missing from the outcome-based
reform in Parktown: teacher expertise in testing, forums that would help to facilitate
discussion and the utilization of the test results and lack of training that are shown to be
effective in advancing modern teaching techniques. We consider these missing pieces as
important causes for the below average value-added of Parktown. Or we are just too early to
judge.18
6- Conclusion
Previous research has argued that outcome-based policies could increase school
performance (Carnoy and Loeb 2002; Ladd 1999; Woessmann 2008), especially if we
measure performance by the tested subject. In this paper we look at the performance of
schools in Parktown in Hungary, where an overarching local school reform has taken place in
2007. Parktown have reorganized its primary school system with the main goal of decreasing
18 To be fair: both towns have currently started to realize the potentials in testing. In 2011 Birdtown has established an official group of the teachers responsible for the NABC administration. The town appointed a teacher with testing expertise as administrator at the local government, who called the group together with an explicit goal to facilitate discussion and develop local education testing. Note however that although it exist officially, it has not met up until 2012 June (the end of our study).The local government in Parktown ordered a training on educational testing from an expert in 2010 autumn. One teacher from each school had to take part. These teachers had to organize a short testing of operational speed in their own schools, which was followed up four month later in 2011 spring. The group then discussed its results and asked the participants to discuss it with their staff as well. With this move in 2011 the local government might have eliminated two important concerns that we had about its outcome-based reform: lack of expertise and lack of forums. On the other hand the new introduced testing (operational speed) is highly questionable for outcome-based policy use, since it is not standardized. It also adds to the repertoire of the teachers to defend themselves against the consequences of bad test results – they can argue that they are better in this that in the NABC. Also note that after the outside expert have left the town, the group have not conveyed again up until the end of our study. Also the local government has ceased to pressure the schools with the NABC results in front of the General Assembly in 2011. Thus it is not clear whether Parktown is heading towards the correction of the outcome-based policy, or turning back towards the quality approach we observed in Birdtown.
21

school segregation, and adapting an outcome-based policy during the process in order to
foster school performance.
We compare Parktown to Birdtown. Birdtown has not changed its schooling policy in
the last decades, and thus it can be considered as a typical example. Our small research team
has conducted over 300 interviews in the last four years. Using the findings of this qualitative
research we try to explain why we find a significant drop in the value-added of Parktown as
compared to its value-added before the reform in the quantitative part of the study. That is
Parktown seems to perform worse after than before the reform.
We argue that here are three possible explanations for this. The first is that Parktown
focuses on performance level and not value-added. However, we find no level increase either
in the dif-in-dif analysis. Also, the focus on test score levels should not explain the drop in
value added. The second is that we might be too early to judge. School reform is a slow
process, and even if we find a drop in the beginning it might be going the right direction in the
long run. While this might be the case we argue that the reform lacks three very important
pieces that could also account for the underperformance of the Parktown schools.
As Faubert (2009) argues in her literature review of the OECD countries: “the
effectiveness of school evaluation schemes relies on developing competencies for evaluation
and for using feedbacks.” (p. 3) and also that “more technical support and training is needed
to allow schools to use the findings from external evaluation in a way conducive to school
improvement” (p. 48). In fact this is exactly what we find in Parktown. We miss expert
teachers that would understand testing and specifically the NABC. We also recognize the lack
of forums that would help the discussion and the development of the new system and we find
the major competence-based training in Hungary to be ineffective in advancing modern
teaching techniques.
22

References
Barber, Michael, and Mona Mourshed. 2007. How the World’s Best-performing School Systems Come Out on Top? New York: McKinsey & Company.
Blazovicsné Varga, Marianna. 2008. Az Oktatási Rendszer 2006 Óta Történt Változásainak, Hatásainak Vizsgálata Az Óvodák És Az Általános Iskolák Vonatkozásában. Commitment.
Carnoy, Martin, and Susanna Loeb. 2002. “Does External Accountability Affect Student Outcomes? A Cross-State Analysis.” Educational Evaluation and Policy Analysis 24 (4) (December 21): 305–331. doi:10.3102/01623737024004305.
Elmore, Richard F. 2003. “Knowing the Right Thing to Do: School Improvement and Performance-Based Accountability.” NGA Center for Best Practices: 1–20.
———. 2004. School Reform from the Inside Out: Policy, Practice, and Performance. Cambridge, MA: Harvard University Press.
Epple, Dennis, Elizabeth Newlon, and Richard Romano. 2002. “Ability Tracking, School Competition, and the Distribution of Educational Benefits.” Journal of Public Economics 83 (1) (January): 1–48. doi:10.1016/S0047-2727(00)00175-4.
European Council. 2006. Recommendation of the European Parliament and of the Council of 18 December 2006 on Key Competences for Lifelong Learning. EC.
Faubert, Violaine. 2009. “School Evaluation: Current Practices in OECD Countries and a Literature Review.” OECD Education Working Paper (42): 1–59.
Fazekas, Károly, János Köllő, and Júlia Varga. 2009. Green Book - for the Renewal of Public Education in Hungary. Budapest: Ecostat.
Hanushek, Eric A, and Steven G. Rivkin. 2003. “Does Public School Competition Affect Teacher Quality?” In Economics of School Choice. NBER Conference Report.
Hanushek, Eric A. 2003. “The Failure of Input-based Schooling Policies*.” The Economic Journal 113 (485): F64–F98. doi:10.1111/1468-0297.00099.
Hermann, Zoltan, and Tímea Laura Molnár. 2008. “Országos Kompetenciamérési adatbázis.” http://adatbank.mtakti.hu/files/dokum/7.pdf.
Kertesi, Gábor, and Gábor Kézdi. 2010. “Segregation of Primary Schools in Hungary. A Descriptive Study Using Data from the National Assessment of Basic Competences of 2006.” In The Hungarian Labour Market, 99–119. Budapest: IE-HAS.
Koretz, Daniel M. 2002. “Limitations in the Use of Achievement Tests as Measures of Educators’ Productivity.” The Journal of Human Resources 37 (4) ( 1): 752–777. doi:10.2307/3069616.
Ladd, Helen F. 1999. “The Dallas School Accountability and Incentive Program: An Evaluation of Its Impacts on Student Outcomes.” Economics of Education Review 18 (1) (February): 1–16. doi:10.1016/S0272-7757(97)00044-7.
Lannert, Judit. 2009. “The Effects of Demographic Change on the Public Education Budget.” In Green Book - for the Renewal of Public Education in Hungary, 285–301. Budapest: Ecostat.
Meyer, Robert H. 1997. “Value-added Indicators of School Performance: A Primer.” Economics of Education Review 16 (3): 283–301. doi:10.1016/S0272-7757(96)00081-7.
Milgrom, Paul, and John Roberts. 1992. Economics, Organization and Management. Engelwood Cliffs, NJ: Prentice Hall.
Ministry of Education and Culture, and Ministry of Social Affairs and Labour. 2009. “Education and Training 2010 Work Programme, National Report Exploring Implementation and Progress in Hungary.” http://ec.europa.eu/education/lifelong-learning-policy/doc/natreport09/hungary_en.pdf.
23

Ministry of National Resources. 2011. “National Report on the Implementation of the Strategic Framework for European Cooperation in Education and Training (ET2020).” http://ec.europa.eu/education/lifelong-learning-policy/doc/natreport11/hungary_en.pdf.
Nagy, Judit. 2008. “Kéz a Kézben - A Hódmezővásáhelyi Modell, Egy Lehetséges Válasz a 21. Századi Közoktatás Kihívásaira”. Commitment Köznevelési Kht.
Neumann, Eszter. 2011. “The Politics of the Selection and Distribution of Socially Disadvantaged Pupils in Two Hungarian Towns”. Presentation presented at the European Conference of Education Research, December, Berlin.
Oblath, Marton. 2011. “The Appropriation of Special Education Needs Measures in Organizing Rehabilitation Services”. Presenta presented at the European Conference of Education research, December, Berlin.
OECD. 2005. Teachers Matter: Attracting, Developing and Retaining Effective Teachers. Paris: OECD.
———. 2010a. “OECD Review on Evaluation and Assessment Frameworks for Improving School Outcomes - Hungary Country Background Report”. OECD: PARIS.
———. 2010b. “OECD Review on Evaluation and Assessment Frameworks for Improving School Outcomes - Hungary Country Background Report”. OECD: PARIS.
Oktatási Hivatal. 2010. Orszagos Kompetenciamérés 2010 - Országos Jelentés. Budapest: Oktatási Hivatal.
Pollitt, Christopher, and Geert Bouckaert. 2000. Public Management Reform. A Comparative Analysis. Oxford: Oxford University.
Rivkin, Steven G., Eric A. Hanushek, and John F. Kain. 2005. “Teachers, Schools, and Academic Achievement.” Econometrica 73 (2) ( 1): 417–458.
Rosenholtz, Susan. 1989. Teachers’ Workplace: The Social Organization of Schools. New York: Longman.
SROP. 2007. Social Renewal Operational Programme 2007–2013. The Government of the Republic of Hungary. www.nfu.hu/download/2737/TÁMOP_adopted_en.pdf.
Varga, Júlia. 2007. “Kiből Lesz Ma Tanár? - A Tanári Pálya Választásának Empirikus Elemzése.” Közgazdasági Szemle LIV (Július-Augusztus): 609–627.
———. 2011. “A Tanárok Elosztása a Különböző Szociokulturális Hátterű Tanulókat Tanító Iskolák Között.” In Oktatás És Foglalkoztatás, 65–82. KTI. Budapest: KTI könyvek.
Varga, Júlia, and Zoltan Hermann. 2007. “Financing Public Education.” In Education in Hungary 2006. Budapest: Hungarian Institute for Educational Research and Development.
Woessmann, Ludger. 2008. “Efficiency and Equity of European Education and Training Policies.” International Tax and Public Finance 15 (2) (January): 199–230. doi:10.1007/s10797-008-9064-1.
Zsigovits, Gabriella. 2008. A Kompetencia Alapú Pedagógiai Rendszer Fejlesztése És Bevezetése a Nemzeti Fejlesztési Terv Időszakában. Budapest, Hungary: Educatio Kht.
24