ovarian cancer diagnosis with complementary learning fuzzy...
TRANSCRIPT

Ovarian cancer diagnosis with complementarylearning fuzzy neural network
Tuan Zea Tan a, Chai Quek a,*, Geok See Ng a, Khalil Razvi b
aCentre for Computational Intelligence, School of Computer Engineering, Nanyang TechnologicalUniversity, Block N4, #2A-32, Nanyang Avenue, Singapore 639798, SingaporebDepartment of Obstetric and Gynaecology, Southend University Hospital NHS Foundation Trust,Prittlewell Chase, Westcliff-on-Sea, Essex SS0 0RY, UK
Received 22 November 2006; received in revised form 15 April 2008; accepted 15 April 2008
Artificial Intelligence in Medicine (2008) 43, 207—222
http://www.intl.elsevierhealth.com/journals/aiim
KEYWORDSComplementarylearning;Ovarian cancerdiagnosis decisionsupport;Proteomics diagnosis;Haemostasis bloodassay diagnosis;DNA micro-arraydiagnosis
Summary
Objective: Early detection is paramount to reduce the high death rate of ovariancancer. Unfortunately, current detection tool is not sensitive. New techniques such asdeoxyribonucleic acid (DNA) micro-array and proteomics data are difficult to analyzedue to high dimensionality, whereas conventional methods such as blood test areneither sensitive nor specific.Methods: Thus, a functional model of human pattern recognition known as comple-mentary learning fuzzy neural network (CLFNN) is proposed to aid existing diagnosismethods. In contrast to conventional computational intelligence methods, CLFNNexploits the lateral inhibition between positive and negative samples. Moreover, it isequipped with autonomous rule generation facility. An example named fuzzy adaptivelearning control network with another adaptive resonance theory (FALCON-AART) isused to illustrate the performance of CLFNN.Results: The confluence of CLFNN-micro-array, CLFNN-blood test, and CLFNN-proteo-mics demonstrate good sensitivity and specificity in the experiments. The diagnosisdecision is accurate and consistent. CLFNN also outperforms most of the conventionalmethods.Conclusions: This research work demonstrates that the confluence of CLFNN-DNAmicro-array, CLFNN-blood tests, and CLFNN-proteomic test improves the diagnosisaccuracy with higher consistency. CLFNN exhibits good performance in ovarian cancerdiagnosis in general. Thus, CLFNN is a promising tool for clinical decision support.# 2008 Elsevier B.V. All rights reserved.
* Corresponding author. Tel.: +65 6790 4926;fax: +65 6790 6559.
E-mail address: [email protected] (C. Quek).
0933-3657/$ — see front matter # 2008 Elsevier B.V. All rights resedoi:10.1016/j.artmed.2008.04.003
1. Introduction
Ovarian cancer accounts for 4% of all cancers amongAmerican and Canadian women, and ranks fourth asa cause of their deaths from cancer [1]. This high
rved.

208 T.Z. Tan et al.
death rate is due to the fact that almost 70% ofwomen with ovarian cancer remained undiagnoseduntil the disease has advanced to Stage III or IV. Toalleviate the situation, greater effort has to befocussed on the early detection of ovarian cancersince the survival rate is significantly higher if thedisease is diagnosed at an early stage [2]. However,early detection of ovarian cancer is non-trivial. It isrecorded that 13—21% of women who underwentsurgery were found to be malignant [3]. Even annualroutine gynaecologic and pelvic examinations haveonly detected 3% of the early stage ovarian cancer
Table 1 Ovarian cancer diagnosis modalities
Modality Sens
Bimanual pelvic examination 2
Surgical procedurePap smear 1
ImagingTransabdominal ultrasonography (TAS) 5Transvaginal ultrasonography (TVS) 6TVS & colour Doppler imaging (CDI) 5Power Doppler (with end diastolic velocitydistribution slope parameter)
9
Pulsed Doppler (with time averagedmaximum velocity parameter)
8
Impedance/spectra/colour Doppler(with resistive index)
5
Colour Doppler (with pulsatility Index) 9Power Doppler (with pulsatility index) 8TVS & power Doppler(colour Doppler energy)
10
TVS & morphology index (MI) �10TAS & CA-125 5TVS & CA-125 9TVS & MI & CDI �103D sonography 73D power Doppler 53D sonography & 3D power Doppler 9Computed tomography (CT) 4CT with replicated reading 9Positron emission tomography (PET) 12-Fluoro-2-deoxy-D-glucose & PET (FDG-PET) 1PET-CT 6Immunoscintigraphy 5Magnetic resonance imaging (MRI) 8MRI & immunoscintigraphy 8
Tumour markerCA-125 2CA-125 & OVX1 antibody 8CA-125 & TPS 8Cancer-associated serum antigen 5Platelet counts 5Risk of malignancy index (RMI) 8Carcinoembryonic antigen (CEA) 6Oligonucleotide micro-array analysis 9DNA sequence analysis 8
cases, and 10% of Stages I—IV cancer [4]. This high-lights the difficulty of the task at stake, and the highfalse positive rate of present ovarian cancer diag-nosis techniques.
Bimanual pelvic examination, sonography andtumour marker are some common modalities forovarian cancer diagnosis. The reported accuraciesof these techniques are summarized in Table 1.Sensitivity refers to the ratio of correctly identifiedmalignant cases to the total population of malignantdisease, whereas specificity is the ratio of correctlyidentified benign cases to the total benign popula-
itivity (%) Specificity (%) Reference
6—67 94 [7,8]
0—30 Not available [6]
0—100 98 [5—8]9—100 56—97 [7,9—12]0—100 46—100 [7,9—10,13,14]1—97 90—100 [15]
9 81 [16]
8—100 83—99 [13]
3 60 [13]7 92—96 [13]0 83 [9]
0 99 [7]8—79 100 [6]4—97 91—100 [11]0 97 [7]4 [14]4—95 99 [13,14]8—100 75 [13,14]7—100 79—93 [5,12,14,18,19]3—94 79—85 [20]0—100 40—100 [18,19]0—88 42—100 [18]2—73 40 [18,19]0—92 57—75 [17]1—100 88—100 [5,8,12,17]9 [17]
9—100 58—95 [6,7,11,21—23]0 91 [24]1 82 [25]8 96 [25]9—77 60—65 [26]8 74 [22]0 64 [21]2 100 [27]2 100 [27]

Ovarian cancer diagnosis 209
tion. In Table 1, sensitivity and specificity are esti-mated from the reported accuracies in tumourclassification, malignant detection on pre- and post-menopausal patient.
dFrom Table 1, a large repertoire of ovarianscreening techniques implies thedifficultyassociatedwith theovarian cancerdiagnosis task.Althoughmostof the techniques appeared attractive, their accura-cies are inconsistent. Every technique has its limita-tions. For example, the pelvic examination is thesimplest way to discover ovarian cancer but it isunable to detect ovarian tumour at an early stage[5,6]. Surgical procedure like Pap smear, on the otherhand, has very low sensitivity [6]. As for medicalimaging modalities, they are inconsistent and highlydependent on the skill of the imaging technicians/operators. Hence, medical imaging diagnosis is sub-jective and error-prone [11,12,18].
Another modality is blood assay such as cancerantigen-125 (CA-125), albeit blood assay sensitivity isclaimed to be low [5,21,25]. Furthermore, CA-125becomes unreliable if the woman is pregnant [28].Apart from that, new microbiology techniques suchas deoxyribonucleic acid (DNA) micro-array and pro-teomics have emerged in recent years. Despite DNAmicro-array andproteomics holding promising resultsfor cancer diagnosis [29], both technologies are highdimensional and consequently the analysis becomestime-consuming [30]. Together with the lack ofknowledge on the pre-cancer syndrome of ovariancancer, the limited ovarian cancer micro-array andproteomics samples have hindered the progress ofDNA micro-array and proteomics. In short, none ofthe modalities has sufficient sensitivity and specifi-city when used as a standalone tool [1], resulting inthe difficulty of ovarian cancer diagnosis as well asthe limitation of current screening tool. The highfalse positive rate not only produces suboptimalpatient outcome, at the same time, it also incurredhigher cost to both physician andpatient. Thus,manyhave proposed to aid the ovarian cancer diagnosisusing computational intelligence tools. A plethora ofmethods have been proposed to assist in fightingovarian cancer, as summarized in Table 2.
As shown in Table 2, computational intelligencesignificantly enhances the diagnosis accuracy. Theseclinical decision support systems (CDSSs) reduced theinconsistency in medical decision. However, most ofthe adopted techniques have their shortcomings;they are namely: (1) not comprehensible–—no facilityfor interpretation; (2) time-consuming–—manual ruleconstruction. Furthermore, most of the systems arebased on either positive or neutral learning of casesand do not consider the contribution of negativeclasses. Consequently, these CDSS were unable togain trust from physicians. Thus, complementary
learning fuzzy neural network (CLFNN) is proposed.With complementary learning, the system learnsfrom positive and negative examples. As a result,CLFNN generates positive and negative rules, whichprovides a closer representation of the problem. Atthe same time, CLFNN is capable of producing rela-tively superior classification performance because ofthe lateral inhibition feature existing between thepositive and negative fuzzy rule-bases. In otherwords, a positive sample (malignant case) will con-currently activate the positive rules and inhibit thenegative rules when presented to the system, henceleading to a positive conclusion. This minimizes theconfusion in the inference process and producesrelatively good classification performance. Apartfrom providing fuzzy rules to improve its comprehen-sibility, CLFNN also offers reasoning process that isclosely akin to that performed by humans. Hence,CLFNN is more comprehensible in comparison toconventional methods. In this study, a CLFNN namedfuzzy adaptive learning control networkwith anotheradaptive resonance theory (FALCON-AART) [43] isdescribed to illustrate the feasibility of using CLFNNas an effective ovarian cancer CDSS.
This paper is organized as follows: Section 2states the datasets used in this study, and brieflydescribe the features of CLFNN. Section 2 alsocovers the experimental setup. Section 3 describesthe experimental results and analyses. Section 4concludes the paper.
2. Methods and material
2.1. Dataset
Three datasets are used in this work. They aredescribed in the following sections.
2.1.1. Micro-array gene expressionThe first dataset is the micro-array gene expressionfor ovarian cancer diagnosis. The ovarian cancerdataset [44] consists of 30 samples obtained fromovarian tumours and 24 normal samples. Each ofthese samples comprises 1536 features. Class dis-tribution of this ovarian cancer dataset is as follows:
� 2
4 samples of normal ovarian tumour. � 1 sample of Stage I mucinous ovarian tumour. � 2 4 samples of Stage III serous ovarian tumour. � 5 samples of Stage IV serous ovarian tumour.2.1.2. Blood assaysAnother dataset is the ovarian cancer diagnosisbased on blood tests, collected from SingaporeNational University Hospital (NUH). The dataset

210 T.Z. Tan et al.
Table 2 Reported accuracy on computer-aided ovarian diagnosis or prognosis
Medical inputs/modalities Computational intelligencetool
Accuracy (%) Training/sample size
Ovarian cancer risk factors [22,31] Bayesian network 93 225/300Naıve Bayesian 93Artificial neural network 95Logistic regression 90
CA-125 II & CA-72-4 & CA-15-3 &lipid-associated sialic acid [23]
Multilayer perceptron 90 174/429
Patient data [32] Genetic algorithm 80 Not mentionedFuzzy genetic algorithm 78Fuzzy logic system 70Fuzzy logic + geneticalgorithm
78
Genetic programming(logical rules)
84
Genetic programming(algebraic rules)
81
Multilayer perceptron 59Multilinear regression 41
Laparotomy data [33] Multilayer perceptron 85 166/242Logistic regression 68Linear regression 73
Blood tests [34] Multilayer perceptron 93 35/50Patient history & ultrasonography
measurements & colour Dopplerimaging measurements & bloodserum marker levels [35]
Bayesian network 62 Not mentioned
Magnetic resonance images [36] Linear discriminant analysis 97 Not mentionedPatient history [37] Support vector machine 81 10-fold cross-validation, 199
Gene expression profile [38] k-Nearest neighbour 71 Leave-one-out, 32CAST 43Support vector machine 68AdaBoosting 89
Proteomic serum mass spectra [39] Ensemble of 51 artificialneural network
91 100/215
Proteomics ovarian cancer serummass spectra [40]
Genetic algorithms andKohonen clustering
97 137/253
Proteomic spectrum [41] Genetic algorithm 99 Not mentionedThermogram [42] CLFNN 94 26/78
was collected over a period of 5 years from the NUHDepartment of Oncology and Gynaecology; consist-ing of 172 patients diagnosed using several bloodtests. The class distribution is as follows:
� 2
3 samples of normal patient. � 7 8 samples of benign cyst patient. � 1 0 samples of borderline or proliferating tumourpatient.
� 1 9 samples of Stages I and II patient. � 4 2 samples of Stages III and IV patient.Each diagnosed case is associated with thepatient’s profile, blood composition and some com-
mon blood test such as CA-125, cancer-associatedserum antigen (CASA), etc. All features of the data-set are listed in Table 3.
2.1.3. Proteomic spectraThe third dataset [40] is the proteomic spectra gen-erated by the Protein Biology System 2 surface-enhanced laser desorption/ionization-time of flight(SELDI-ToF) mass spectrometer. It contains 253 insta-nces, each with 15,154 intensity of molecular massper charge ratio. The class distribution is as follows:
� 9
1 samples of normal patient. � 1 62 samples of ovarian cancer patient.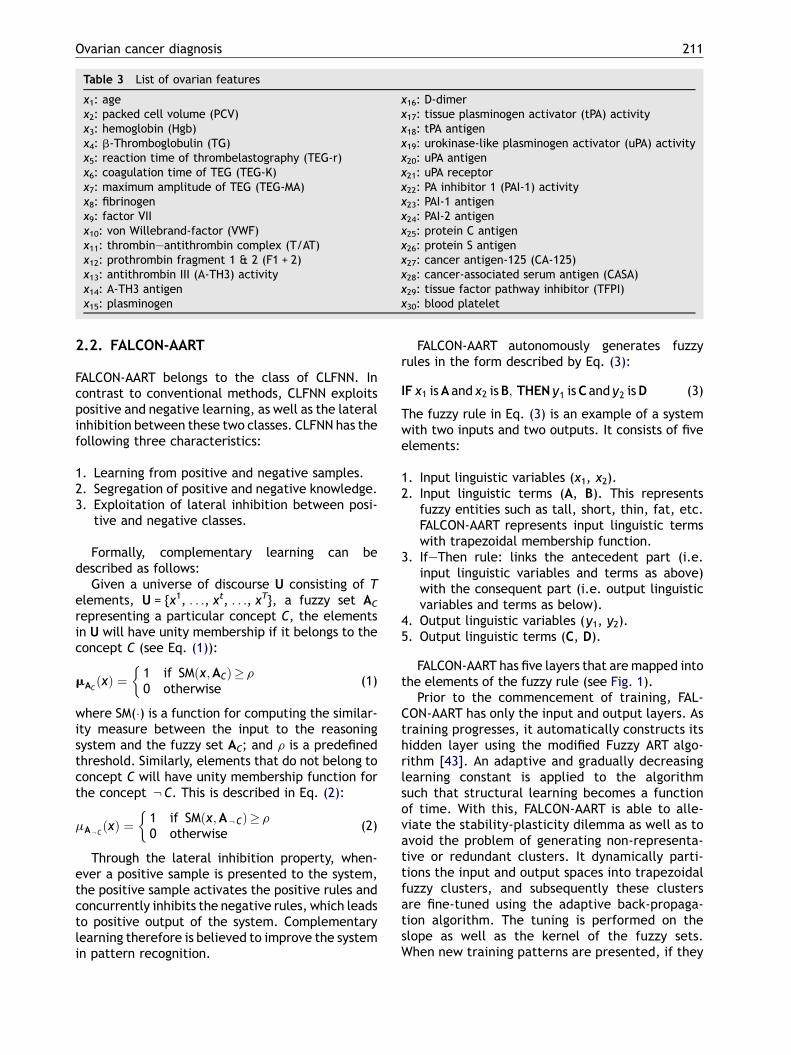
Ovarian cancer diagnosis 211
Table 3 List of ovarian features
x1: age x16: D-dimerx2: packed cell volume (PCV) x17: tissue plasminogen activator (tPA) activityx3: hemoglobin (Hgb) x18: tPA antigenx4: b-Thromboglobulin (TG) x19: urokinase-like plasminogen activator (uPA) activityx5: reaction time of thrombelastography (TEG-r) x20: uPA antigenx6: coagulation time of TEG (TEG-K) x21: uPA receptorx7: maximum amplitude of TEG (TEG-MA) x22: PA inhibitor 1 (PAI-1) activityx8: fibrinogen x23: PAI-1 antigenx9: factor VII x24: PAI-2 antigenx10: von Willebrand-factor (VWF) x25: protein C antigenx11: thrombin—antithrombin complex (T/AT) x26: protein S antigenx12: prothrombin fragment 1 & 2 (F1 + 2) x27: cancer antigen-125 (CA-125)x13: antithrombin III (A-TH3) activity x28: cancer-associated serum antigen (CASA)x14: A-TH3 antigen x29: tissue factor pathway inhibitor (TFPI)x15: plasminogen x30: blood platelet
2.2. FALCON-AART
FALCON-AART belongs to the class of CLFNN. Incontrast to conventional methods, CLFNN exploitspositive and negative learning, as well as the lateralinhibition between these two classes. CLFNN has thefollowing three characteristics:
1. L
earning from positive and negative samples. 2. S egregation of positive and negative knowledge. 3. E xploitation of lateral inhibition between posi-tive and negative classes.
Formally, complementary learning can bedescribed as follows:
Given a universe of discourse U consisting of Telements, U = {x1, . . ., xt, . . ., xT}, a fuzzy set AC
representing a particular concept C, the elementsin U will have unity membership if it belongs to theconcept C (see Eq. (1)):
mACðxÞ ¼ 1 if SMðx;ACÞ� r
0 otherwise
�(1)
where SM(�) is a function for computing the similar-ity measure between the input to the reasoningsystem and the fuzzy set AC; and r is a predefinedthreshold. Similarly, elements that do not belong toconcept C will have unity membership function forthe concept :C. This is described in Eq. (2):
mA:CðxÞ ¼1 if SMðx;A:CÞ� r0 otherwise
�(2)
Through the lateral inhibition property, when-ever a positive sample is presented to the system,the positive sample activates the positive rules andconcurrently inhibits the negative rules, which leadsto positive output of the system. Complementarylearning therefore is believed to improve the systemin pattern recognition.
FALCON-AART autonomously generates fuzzyrules in the form described by Eq. (3):
IF x1 isA and x2 isB; THEN y1 isC and y2 isD (3)
The fuzzy rule in Eq. (3) is an example of a systemwith two inputs and two outputs. It consists of fiveelements:
1. I
nput linguistic variables (x1, x2). 2. I nput linguistic terms (A, B). This representsfuzzy entities such as tall, short, thin, fat, etc.FALCON-AART represents input linguistic termswith trapezoidal membership function.
3. I
f—Then rule: links the antecedent part (i.e.input linguistic variables and terms as above)with the consequent part (i.e. output linguisticvariables and terms as below).4. O
utput linguistic variables (y1, y2). 5. O utput linguistic terms (C, D).FALCON-AART has five layers that are mapped intothe elements of the fuzzy rule (see Fig. 1).
Prior to the commencement of training, FAL-CON-AART has only the input and output layers. Astraining progresses, it automatically constructs itshidden layer using the modified Fuzzy ART algo-rithm [43]. An adaptive and gradually decreasinglearning constant is applied to the algorithmsuch that structural learning becomes a functionof time. With this, FALCON-AART is able to alle-viate the stability-plasticity dilemma as well as toavoid the problem of generating non-representa-tive or redundant clusters. It dynamically parti-tions the input and output spaces into trapezoidalfuzzy clusters, and subsequently these clustersare fine-tuned using the adaptive back-propaga-tion algorithm. The tuning is performed on theslope as well as the kernel of the fuzzy sets.When new training patterns are presented, if they

212 T.Z. Tan et al.
Figure 1 Architecture of FALCON-AART.
are sufficiently similar to the stored cluster, thestored cluster will resonate. The resonant clusterwill then expand to incorporate these patternsusing the structural learning algorithm. Trainingterminates when the mean square errors bet-ween two epochs are sufficiently equal. The infer-ence process of FALCON-AART is summarized asfollows.
Let x = (x1, . . ., xi, . . ., xI) denotes the input,where i 2 [1, I] is the index to the input. Fuzzy setsA and B are the input and output fuzzy sets, respec-tively. A fuzzy set A is described by its membershipfunction, denoted as mA(x).
Step 1 I
nput fuzzification: input xt ¼ ðxt1; xt2; . . . ; xtI Þis fuzzified to xt ¼ ðxt1; xt2; . . . ; xtI Þ beforefeeding into the system.Step 2 A
ntecedent matching: fuzzified input fuzzysets are compared with their correspondingrule antecedents. Subsequently, the simi-larity measure (SM) is computed usingEq. (4):SM ¼ mxti\Ai jðxti Þ
¼ xti \Ai j
¼ mxti
ðxti Þ � mAi jðxti Þ
(4)
where * is the t-norm operation. Since xti isa fuzzy singleton, Eq. (4) can be simplifiedto Eq. (5):
SM ¼ mxti
ðxti Þ � mAi jðxti Þ
¼ 1 � mAi jðxti Þ
¼ mAi jðxti Þ
(5)
Step 3 R
ule fulfilment: in this step, the overallsimilarity measure (OSM) between the fuz-zified inputs and rule antecedents are com-puted using Eq. (6):OSMrule k ¼1
I
XIi
SMik (6)
where SMik is the similarity measure of theith antecedent of rule k, and I is the inputdimension.
Step 4 C
onsequent derivation: the consequents ofthe fired rules are derived based on therules’ OSM, as shown in Eq. (7):mBðlmÞkðymÞ ¼ mBðlmÞk
ðymÞ � zrule k (7)
There may be more than one rule that isconnected to a consequent. Hence, the final

Ovarian cancer diagnosis 213
Table
Human
MakingWeight
thatChoosi
bestRetriev
expeActing
inferred consequent derived is the aggrega-tion of the different consequents inferredusing different rules. The final inferred con-sequent is described in Eq. (8):
Blm ¼ f½BðlmÞk �; where f can be \ ; [ ;P
¼ [k2f1;2;...;Kg
BðlmÞk ; choose f to be [
¼ maxk2f1;2;...;Kg
fmBðlmÞkðymÞg
¼ maxk2f1;2;...;Kg
fmBðlmÞkðymÞ � zrule kg
¼ maxk2f1;2;...;Kg
fzrule kg � mBlmðymÞ
(8)
Output defuzzification: the final consequentderived from the output fuzzy sets are
Step 5
defuzzified to produce a crisp output. Thecenter of area defuzzification is adopted andis described in Eq. (9):
ym ¼PL
l¼1 KrlmBlmPLl¼1 Blm
(9)
where Krlm is the kernel of fuzzy set B.
Every FALCON-AART inference step has a one-to-one mapping to the human inference step, as shownin Table 4. This suggests that FALCON-AART has aninference process that is highly akin in a human.
2.3. Experimental setup
All the experiments are run on a system with an IntelPentium IV 2 GHz processor, and 512 MB randomaccess memory (RAM). Each sample of the datasetis divided into positive (malignant) and negative(benign and normal) classes. For every dataset, threestratified training and testing cross-validation setsare generated. The system is then trained andassessed using the training/testing sets. FALCON-AART is benchmarked against some popular tools[45], namely, naıve Bayesian (NB), radial basis func-tion (RBF), adaptive network-based fuzzy inferencesystem (ANFIS) [46], support vector machine (SVM),C4.5, k-nearest neighbour (kNN), andmultilayer per-
4 Similarity of human and FALCON-AART inference
observationsing the past experience or knowledgedescribes the current situationng the experience or knowledge thatreflects the current situationing the actions of best matched pastrience or knowledgeout the actions
ceptron (MLP). The metrics used apart from classifi-cation accuracy are sensitivity and specificity whichare described in Eqs. (10) and (11), respectively:sensitivity ¼number of positive samples correctly predicted
total number of positive samples
(10)
specificity ¼
number of negative samples correctly predictedtotal number of negative samples
(11)
3. Experiments
3.1. DNA micro-array gene expression
Examination of the gene expression identified byDNA micro-array provides an important insight intothe biology of ovarian cancer detection. However,gene expression obtained using DNA micro-arraycontains a large number of features (1536 genesfor this dataset). It is impossible to employ all thefeatures to classify. Even if it were possible, therewill be redundant genes that may significantly con-tribute to classification error. Furthermore, classi-fication using statistical method such as kNN andMLP cannot be quantitatively evaluated and inter-preted in an intuitive and human-like manner.Owing to these issues, feature selection has to beundertaken to select the most relevant featuresprior to classification. For this dataset, sparse logis-tic regression [47] has been used to select the ninemost relevant features. In order to illustrate thatthe improvement of the performance is due chieflyto the CLFNN and not the feature selection method,the experiments were repeated using another ninemost relevant features selected by the SVM featureselectionmethod [48]. Note that feature selection isonly performed on the training set and not thetesting set so that no bias is introduced. Each FAL-CON-AART is trained with different stratified set of
FALCON-AART
Feeding input to the systemComputing overall similarity
Selecting maximally fired rule
Determining the conclusion impliedby the maximally fired ruleOutput the conclusion

214 T.Z. Tan et al.
Table 5 Classification rate on ovarian cancer dataset (using sparse logistic regression)
Method Sensitivity (%) Specificity (%) Accuracy (%) Training time (s) Number of rules
NB 33.30 96.70 68.50 0.01 NARBF 75.00 76.70 75.90 0.10 NAANFIS 75.00 76.70 75.90 1.80 9SVM 58.30 56.70 57.40 0.80 NAC4.5 79.20 70.00 74.00 0.60 4kNN 70.80 86.70 79.60 0.02 NAMLP 75.00 83.30 79.60 0.50 NAFALCON-AART 62.50 100.00 81.30 0.06 5
NA: not available.
Table 6 Classification rate on ovarian cancer dataset (using SVM attribute selection)
Method Sensitivity (%) Specificity (%) Accuracy (%) Training time (s) Number of rules
NB 87.50 93.30 90.70 0.01 NARBF 83.30 100.00 92.60 0.60 NAANFIS 83.30 96.70 90.70 1.60 12SVM 33.30 100.00 70.40 0.10 NAC4.5 87.50 93.30 90.70 0.30 3Knn 83.30 96.70 90.70 0.02 NAMLP 87.50 96.70 92.60 0.80 NAFALCON-AART 90.00 91.70 90.70 0.50 10
NA: not available.
Figure 2 Fuzzy set constructed.
training and testing data (1/3 for training and 2/3for testing). Classification performance of FALCON-AART is benchmarked against conventional methodsand the averaged results are presented in Tables 5and 6. The settings for the three-layer MLP are nineinput nodes, eight hidden nodes, and one outputnode. Both hidden and output node activation func-tions are sigmoidal functions. It was trained usingback propagation with momentum until the meansquare error of training set reaches 108. The SVMemployed radial basis function as its kernel functionand its C parameter was set at 2. The k value of kNNwas chosen as 5. As for the ANFIS network, themembership function chosen is bell shape and thenumber of epoch is 100.
The most crucial advantage of FALCON-AART is itsability to provide reasoning for its computation. Incontrast, MLP and kNN act as black boxes to the user,no rationale is provided to support their output.Table 7 lists the rules autonomously generated byFALCON-AART and C4.5. The linguistic terms such as‘low’, ‘medium’ and ‘high’ are characterised byfuzzy sets that are dynamically constructed. Exam-ples of the constructed fuzzy sets are shown in Fig. 2.
The number of rules generated by FALCON-AARTis more than in a decision tree. This is becauseFALCON-AART is a CLFNN that learns from bothpositive and negative samples. Consequently, posi-tive and negative rules are generated individuallyand they are segregated from each other. The rules
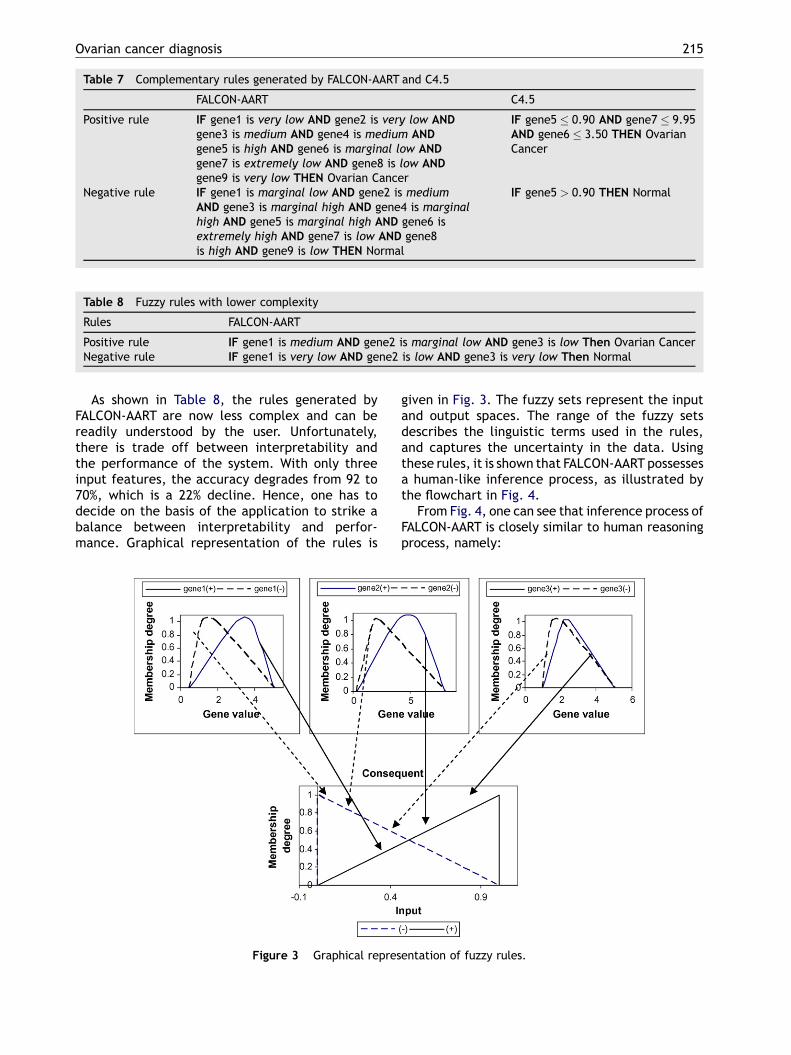
generated by FALCON-AART are equipped with thecapability to capture data uncertainty. In contrastto a decision tree, FALCON-AART is more tolerant tonoise as small perturbation in the data would notgenerate a very different system. In addition, therules in FALCON-AART allow the use of linguisticterms, giving the system greater expressive power.At the same time, it encapsulates unnecessarydetails from the user. From Table 7, the complexityof FALCON-AART rules is higher than those rules in adecision tree. A significant way to reduce the com-plexity of FALCON-AART is through careful featureselection prior to the training process. For illustra-tion, when effective feature selection is performedprior to the FALCON-AART training, the complexityof the rules is significantly reduced. The rules gen-erated by FALCON-AART are given in Table 8. Fig. 3shows the graphical representation of the rules.
Ovarian cancer diagnosis 215
Table 7 Complementary rules generated by FALCON-AART and C4.5
FALCON-AART C4.5
Positive rule IF gene1 is very low AND gene2 is very low ANDgene3 is medium AND gene4 is medium ANDgene5 is high AND gene6 is marginal low ANDgene7 is extremely low AND gene8 is low ANDgene9 is very low THEN Ovarian Cancer
IF gene5 0.90 AND gene7 9.95AND gene6 3.50 THEN OvarianCancer
Negative rule IF gene1 is marginal low AND gene2 is mediumAND gene3 is marginal high AND gene4 is marginalhigh AND gene5 is marginal high AND gene6 isextremely high AND gene7 is low AND gene8is high AND gene9 is low THEN Normal
IF gene5 > 0.90 THEN Normal
Table 8 Fuzzy rules with lower complexity
Rules FALCON-AART
Positive rule IF gene1 is medium AND gene2 is marginal low AND gene3 is low Then Ovarian CancerNegative rule IF gene1 is very low AND gene2 is low AND gene3 is very low Then Normal
As shown in Table 8, the rules generated byFALCON-AART are now less complex and can bereadily understood by the user. Unfortunately,there is trade off between interpretability andthe performance of the system. With only threeinput features, the accuracy degrades from 92 to70%, which is a 22% decline. Hence, one has todecide on the basis of the application to strike abalance between interpretability and perfor-mance. Graphical representation of the rules is
Figure 3 Graphical repres
given in Fig. 3. The fuzzy sets represent the inputand output spaces. The range of the fuzzy setsdescribes the linguistic terms used in the rules,and captures the uncertainty in the data. Usingthese rules, it is shown that FALCON-AART possessesa human-like inference process, as illustrated bythe flowchart in Fig. 4.
From Fig. 4, one can see that inference process ofFALCON-AART is closely similar to human reasoningprocess, namely:
entation of fuzzy rules.

216 T.Z. Tan et al.
Figure 4 Inference process of FALCON-AART.
(1) P
hysician performs laboratory observation simi-larly FALCON-AART receives the data sample,(2) P
hysician determines the matching degree ofthe current observation with his/her knowledgeand experiences similarly FALCON-AART com-putes the matching degree of each rule,(3) P
hysician selects the best-matched knowledgeor experience similarly FALCON-AART activatesthe rule with the maximum overall matchingdegree,(4) P
hysician evaluates the selected knowledge andgives his/her conclusion similarly FALCON-AARTdetermines the consequent linked to the acti-vated rule and derives the conclusion.3.2. Blood test
In the blood assay dataset, not all blood test resultsare available for each case. Some cases have miss-ing value in more than 10 features. Therefore, list-wise deletion [49] is carried out. All cases with
missing values are removed. Hence, the reducedset contains 62 normal and 45 ovarian cancercases. The goal is to diagnose whether a patienthas cancer or not based on the 30 blood test results.The averaged performance of the systems is shownin Table 9.
From Table 9, FALCON-AARToutperforms most ofthe methods in ovarian cancer diagnosis. This showsthat FALCON-AART is able to generalize theacquired/learnt knowledge well. The training timeof FALCON-AART is quite close to the other conven-tional methods, and is acceptably fast. The numberof rules generated by FALCON-AART is similar tothose produced by the decision tree algorithm.However, it outperforms C4.5. These rules can beused to explain why and how FALCON-AART derivesits decision. After careful validation, these fuzzyrules can be used to guide an inexperience physi-cian. Fuzzy rule is better suited than crisp rulegenerated by the decision tree algorithm becausefuzzy rule can handle uncertainty in the data while

Ovarian cancer diagnosis 217
Table 9 Result on ovarian cancer using blood test
Method Sensitivity (%) Specificity (%) Accuracy (%) Training time (s) Number of rules
NB 73.20 60.00 67.60 0.02 NARBF 70.70 50.00 62.00 0.10 NAANFIS 92.00 55.00 74.30 2.60 10SVM 100.00 33.30 60.00 0.05 NAC4.5 100.00 50.00 78.90 20.00 4kNN 87.80 43.30 69.00 0.01 NAMLP 90.20 50.00 73.20 1.90 NAFALCON-AART 95.00 57.00 78.90 0.50 5
Table 10 Different diagnostic rules
Fuzzy rule Expert diagnostic rule Crisp rule
IF age is young AND blood platelet is few AND PCV is highAND Hgb is medium AND TG is medium AND TEG-r is veryfast AND TEG-K is medium AND TEG-MA is quite small ANDfibrinogen is quite small AND factor VII is quite high ANDT/AT is medium AND VWF is quite high AND antithrombinactivity is marginal low AND antithrombin antigen ismedium AND plasminogen is quite small AND D-Dimeris very low AND tPA activity is very high AND tPA antigenis very high AND uPA activity is high AND uPA antigen is veryhigh AND uPA receptor is medium AND PAI-1 activity ismarginal low AND F1 + 2 is quite low AND PAI-1 antigen isquite low AND PAI-2 antigen is quite low AND ProteinS antigen is quite high, THEN Normal
IF CA-125 is less than35 U/ml THEN Normal [28]
IF age < 37 ANDplasminogen 104THEN Normal
IF F1 + 2 is about 1.4 nmol/lTHEN Normal [50]IF T/AT is about 0.8—5.0 mg/lTHEN Normal [51]IF D-Dimer is approximately0.5 mg/ml THEN Normal [50]
Figure 5 Subset of fuzzy set on protein S antigen.
crisp rule cannot. Examples of fuzzy rule, expertdiagnostic rule, and crisp rule are given in Table 10.
As shown in Table 10, FALCON-AARTrule is highlysimilar to the diagnostic rule used by a physician.FALCON-AART not only has a human-like reasoningprocess, but also has the facility that allows phy-sician to justify and evaluate its decision usingfamiliar terms. Note that if the details are needed,the exact range of values mediated by the linguis-tic term can be extracted from FALCON-AART. Incontrast to the crisp rule generated by a decisiontree, the fuzzy rules generated by FALCON-AARTcan cater to uncertainty that may be present in theblood test results due to erroneous recording ormeasurement. Crisp rule generated by a decisiontree is limited in its expressive power because itdoes not allow the application of linguistic hedgessuch as ‘‘about’’, ‘‘approximately’’, which areoften found in expert diagnostic rule. On the con-trary, FALCON-AART rule is more akin to an expertdiagnostic rule, and has superior modelling capa-city because it employs complementary learning by
which rules are generated for each class. FALCON-AART also allows the use of linguistic hedges. Notethat the linguistic terms such as ‘‘young’’, ‘‘few’’and ‘‘high’’ are described by the fuzzy sets auton-omously constructed by FALCON-AART. It encapsu-lates unnecessary details from the physician andhence, allows easier interpretation. An example of

218 T.Z. Tan et al.
Table 11 Result of ovarian cancer diagnosis usinglesser features
Training/testing
Sensitivity(%)
Specificity(%)
Accuracy(%)
G1Benign 66.70 100.00 88.20I & II 40.00 100.00 85.00III & IV 100.00 100.00 100.00
Mean 68.90 100.00 91.10
G2Benign 100.00 90.90 94.10I & II 40.00 100.00 85.00III & IV 100.00 75.00 88.20
Mean 80.00 88.60 89.10
G3Border 20.00 100.00 93.00Benign 60.70 84.60 72.20I & II 14.30 100.00 88. 90III & IV 94.10 81.10 85.20
Mean 47.30 91.40 84.80
G4Border 20.00 100.00 93.00
the fuzzy set is shown in Fig. 5. The total over-lapping region tells that this particular test is notuseful for distinguishing the classes. Triangularfuzzy sets mediate the meaning of less uncertainty,whereas trapezoidal fuzzy sets capture moreuncertainties present in the blood test.
Although the use of full input dimension forclassification can reduce the chance of getting con-tradicting rules, it may render the rule non-readabledue to the higher dimensionality. As interpretabilityof the system is paramount, especially for clinicaldecision support, efforts have to be put in toenhance the system comprehensibility. An estab-lished approach is to perform feature selection priorto the system training. The aim is to reduce thenumber of input dimension, and to trim off irrele-vant blood test that is not a strong discriminatingindicator for the different classes. Simpler rule canbe generated with a reduced set of rules giving riseto clarity and potentially superior recognition per-formance. Four groups of training/testing set aregenerated; each containing the 10 most relevantfeatures selected using Monte Carlo feature selec-tion method [52]:
Benign 57.10 88.50 72.20I & II 14.30 100.00 88. 90
� G 1: x2, x8, x9, x10, x11, x12, x14, x17, x27, and x30. III & IV 82.40 91. 90 88.90 � G 2: x2, x7, x9, x11, x17, x18, x21, x22, x29, and x30.� G
Mean 43.50 95.10 85.80 3: x5, x7, x9, x11, x12, x15, x23, x24, x25, and x27. � G 4: x1, x3, x8, x9, x11, x14, x16, x23, x24, and x30.The results are listed in Table 11. The perfor-mance improves when the 10 most relevant featuresare used for classification. A mean accuracy of 91%can be attained. This suggests that blood tests CA-125, PA inhibitor 1, are important ovarian cancerindicators.
Apart from assisting in diagnosis, FALCON-AARTcan be used as a concept validation tool for hypoth-eses associated with ovarian cancer diagnosis. Forexample, it is known that effective classification ofborderline and benign ovarian cancer is difficult[53], but there is no well-established support forthis. Hence, one can conduct an experiment usingFALCON-AART to classify borderline and benignovarian cancer. To illustrate this, datasets G5—G7that contain only borderline—benign, borderline—Stages I and II, and borderline—Stages III and IV dataare created. The task is to identify the cases ofborderline cancer from the other cases. The result isshown in Table 12. As can be seen in Table 12, it isrelatively easier to distinguish cases of borderlinecancer from other stages of ovarian cancer in con-trast against benign cases. This provides supportingevidence to the conjecture that borderline cases areindeed difficult to be distinguished from benigncases.
3.3. Proteomic pattern
Proteomics is the study of protein. Since disease canoccur due to gene and post-transcription mutation,and the fact that protein is the one that controls thecellular function, protein study provides differentperspective in cancer research and could potentiallyrevolutionize the conventional medical practice.The success of proteomics in other study has demon-strated that it is a promising tool for gynaecologicalcancers [30]. However, the analysis of the largenumber of proteins is difficult, and thereforerequires effective bio-informatics tool. For thisdataset, as there are 15,154 features, it is difficultto incorporate all features to train the system. Itwould incur enormous amount of time and would bevery expensive. Hence, the top 50 most relevantfeatures are extracted using the augmented var-iance ratio (AVR) [54], as described in Eq. (12):
AVRðxÞ ¼ SbðxÞð1=dÞ
Pdi¼1 SiðxÞ=mini 6¼ j jmiðxÞ m jðxÞj
(12)
where d is the number of classes, Si(x) is the within-class variance for ith class, Sb(x) is the between-class variance, and mi(x) is the mean for ith class.

Ovarian cancer diagnosis 219
Table 12 Classification of borderline cancer from other cases
Set Sensitivity(%)
Specificity(%)
Predict(%)
Numberof rules
Trainingtime (s)
G5 (border vs. benign) 0.00 100.00 93.30 14.00 2.00G6 (border vs. I & II) 50.00 100.00 94.70 9.00 0.70G7 (border vs. III & IV) 20.00 100.00 94.70 3.00 0.10
Since the AVR ignores the possible interactionsbetween the features, SVM feature selectionmethod [48] is applied to the top 50 most relevantfeatures, taking into consideration the possible rela-tionship between these features for feature rank-ing. As there is no systematic way of determining theoptimal set of features, FALCON-AART is applied tothis ovarian cancer diagnosis study of proteomicpattern using different number of features. Theaveraged accuracy versus the number of featuresis given in Fig. 6. It can be seen that the confluenceof FALCON-AART and proteomics yields significantand promising performance. Even with only 1/3 ofthe samples used, an accuracy of 100% can beattainable. This shows that generalization capabil-ity of FALCON-AART, as well as the potential ofcomplementing proteomic pattern analysis withCLFNN. From Fig. 6, 97.02% has been achieved withFALCON-AART when using only the most relevantgene. This shows that proteomic pattern analysisis indeed a very promising and effective tool forovarian cancer diagnosis. Most of the conventionalmethods are able to achieve close to 100% accuracyusing the same training and testing sets. Hence, onlyMLP and C4.5 are presented together with FALCON-AART in Fig. 6. As seen in Fig. 6, the proteomicfeatures work differently under different methods.This affirms that there is no panacea that will workfor all types of problems. A method perform well inone area may not perform well in another. Theoscillation observed in the beginning for C4.5 sug-gests that some of the features may act as noise tothe system. These irrelevant features affect thesystem performance. All in all, FALCON-AART offers
Figure 6 Accuracy vs. number of features.
the most consistent performance over differentnumber of features, demonstrating that FALCON-AART is a competent system that is highly feasiblefor realizing CDSS.
4. Conclusion
FALCON-AART has demonstrated its superior capabil-ity as a CDSS for ovarian cancer diagnosis. Fast train-ing, simple fuzzy rule generation, and superioraccuracy are advantages exhibited by FALCON-AARTin this study. Most significantly, FALCON-AART has theability to generate complementary fuzzy rules for itsreasoning process. These rules could potentially aidphysicians in their analysis as well as their diagnosticdecision process for ovarian cancer. FALCON-AARTperforms consistently with accuracies on par orsuperior to other conventional approaches used inthe benchmark for the ovarian cancer diagnostictask. It automatically and judiciously constructsthe complementary fuzzy rule knowledge from largedataset such as micro-array. It outperforms conven-tional artificial neural network and statisticalmethods in terms of accuracy. Furthermore, theFALCON-AART reasoning process is closely akin tothe human reasoning process, which allows systemanalysis using familiar terms. Comparing the experi-mental results of FALCON-AARTwith those in Tables 1and 2, it is shown that FALCON-AART indeed improvesthe accuracy of the diagnosis, providing a highlyattractive alternative to other computational tech-niques for ovarian cancer detection. Moreover, it hasenabled a more consistent performance in ovariancancer detection with accurate decision support.FALCON-AART improves the system comprehensibil-ity as well as the accuracy in ovarian cancer detec-tion. The interpretability of the decision system canbe further enhancedwhen the rules adhere to the setof interpretability criteria [55]. However, they arenot considered in this work. Other related works thathave been developed at the Centre for Computa-tional Intelligence [56] that partially address thisissue are [57,58]whichemploy rough set andHebbianordering in rule reduction. On the other hand, theattractive accuracy offered by the confluence ofFALCON-AART — gene expression profile, and theconfluence of FALCON-AART — proteomic pattern,
220 T.Z. Tan et al.
affirms the values of these tools in ovarian cancerdiagnosis. In the future, FALCON-AART can be builtbased on other clinical ovarian cancer screening toolssuch as sonography, gene expression profile, andproteomicpattern.TheseCDSScan thencomplementeach other in ovarian cancer diagnosis, and thismultimodal diagnostic approach is believed to enha-nce the accuracy of ovarian cancer diagnosis. Also inthis work, it is found that not all the blood tests arerelevant to ovarian cancer diagnosis, as suggestedby the experimental result of training/testing setG1—G4, where using the 10most relevant blood testsboosts the classification accuracy. The proteomicmethod provides the most interesting result, con-firming its huge potential in combating ovarian can-cer. Alternatively, the different types of CLFNN suchas genetic and hierarchical complementary learning[59—63] can also be used to form an ensemble systemto complement each of the medical approach.Another improvement can be achieved by incorpor-ating the concept of chance into the system [64] so asto enhance the interpretability of the CDSS. It hasalso been illustrated that FALCON-AART can beemployed as a concept validation tools to validateclinical hypotheses or conjectures by adequateexperimental settings. In this study, FALCON-AARTwas employed to support for the conjecture:borderline cases are difficult to be classified frombenign cases. In the future, with the availability ofdata, it can be applied to validate other hypothesesor theories associatedwith ovarian cancer. For exam-ple, breast-feeding, age, race, obesity, number ofovulations, level of gonadotropins, carcinogens andgene deficiencies are risk factors for ovarian cancer[31].
References
[1] American Cancer Society. Cancer facts and figures. US:American Cancer Society; 2007.
[2] Jermal A, Murray T, Samuels A, Ghafoor A, Ward E, Thun MJ.Cancer statistic 2003. CA: Cancer Journal for Clinician2003;13:5—26.
[3] NIH, NIH consensus conference. Ovarian cancer. Screening,treatment, and follow-up, NIH Consensus DevelopmentalPanel on Ovarian Cancer. Journal of the American MedicalAssociation 1995;273(6):491—7.
[4] Petignat P, Joris F, Faltin D. Importance of the generalpractitioner in the early detection of ovarian cancer. Gyne-cologic Oncology 2003;90:491—500.
[5] Kurtz AB, Tsimikas JV, Tempany CMC, Hamper UM, Arger PH,Bree RL, et al. Diagnosis and staging of ovarian cancer:comparative values of Doppler and conventional US, CT,and MR imaging correlated with surgery and histopathologicanalysis–—report of the radiology diagnostic oncology group.Radiology 1999;212:19—27.
[6] US Preventive Services Task Force. Guide to preventiveservices, 2nd ed., Washington, DC: US Department of Health
and Human Services, Office of Disease Prevention and HealthPromotion; 1996.
[7] Fiorica JV, Roberts WS. Screening for ovarian cancer. CancerControl 1996;3(2):120—9.
[8] Low RN, Saleh F, Song SYT, Shiftan TA, Barone RM, Lacey CG,et al. Treated ovarian cancer: comparison of MR imagingwith serum CA-125 level and physical examination–—a long-itudinal study. Radiology 1999;211:519—28.
[9] Guerriero S, Alcazar JL, Ajossa S, Lai MP, Errasti T, MallariniG, et al. Comparison of conventional color Doppler imagingand power Doppler imaging for the diagnosis of ovariancancer: results of a European study. Gynecologic Oncology2001;83: 299—304.
[10] Jeong Y, Outwater EK, Kang HK. Imaging evaluation ofovarian masses. Radiographics 2000;20:1445—70.
[11] Kusnetzoff D, Gnochi D, Damonte C, Sananes C, Giaroli A, diPaolo G, et al. Differential diagnosis of pelvic masses:usefulness of CA125, transvaginal sonography and echo-Doppler. International Journal of Gynecology Cancer1998;8(4):315—21.
[12] Loyer EM, Whitman GJ, Fenstermacher MJ. Imaging of ovar-ian carcinoma. International Journal of Gynecology Cancer1999;9:351—61.
[13] Cohen LS, Escobar PF, Scharm C, Glimco B, Fishman DA.Three-dimensional power Doppler ultrasound improves thediagnostic accuracy for ovarian cancer prediction. Gyneco-logic Oncology 2001;82:40—8.
[14] Kurjak A, Kupesic S, Sparac V, Prka M, Bekavac I. Thedetection of stage I ovarian cancer by three-dimensionalsonography and power Doppler. Gynecologic Oncology2003;90:258—64.
[15] Shaharabany Y, Akselrod S, Tepper R. A sensitive new indi-cator for diagnostics of ovarian malignancy, based on theDoppler velocity spectrum. Ultrasound in Medicine & Biology2004;30(3):295—302.
[16] Tailor A, Jurkovic D, Bourne TH, Natucci M, Collins WP,Campbell S. A comparison of intratumoural indices of bloodflow velocity and impedance for the diagnosis of ovariancancer. Ultrasound in Medicine and Biology 1996;22(7):837—43.
[17] Low RN, Carter WD, Saleh F, Sigeti JS. Ovarian cancer:comparison of findings with perfluorocarbon-enhanced MRimaging, in-111-CYT-103 immunoscintigraphy and CT. Radi-ology 1995;195:391—400.
[18] Makhija S, Howden N, Edwards R, Kelley J, Townsend DW,Meltzer CC. Positron emission tomography/computed tomo-graphy imaging for the detection of recurrent ovarian andfallopian tube carcinoma: a retrospective review. Gyneco-logic Oncology 2002;85:53—8.
[19] Pannu HK, Cohade C, Bristow RE, Fishman EK, Wahl RL. PET-CT detection of abdominal recurrence of ovarian cancer:radiologic-surgical correlation. Abdominal Imaging 2004;39:398—403.
[20] Fultz PJ, Jacobs CV, Hall WJ, Gottlieb R, Rubens D, Totter-man SMS, et al. Ovarian cancer: comparison of observerperformance for four methods of interpreting CT scans.Radiology 1999;212:401—10.
[21] Lapchenkov VI, Dudarev AL, Vinokurov VL, Yurkova LE,Barbanel EIu. Comparative evaluation of diagnostic signifi-cance of carbohydrate antigen CA125 and cancer-embryonalantigen in ovarian cancer. Vestnik Rentgenologii I Radiologii1993;5:30—1 (in Russian).
[22] Timmerman D. Ultrasonography in the assessment of ovarianand tamoxifen-associated endometrial pathology. PhD dis-sertation. Leuven University Press; 1997.
[23] Zhang Z, Zhang H, Bast Jr RC. An application of artificialneural networks in ovarian cancer early detection. In: Amari

Ovarian cancer diagnosis 221
S-I, Lee Giles C, Gori M, Piuri V, editors. Proceedings of theIEEE international joint conference on neural networks, vol.4. US: The Institute of Electrical and Electronics Engineers,Inc.; 2000. p. 107—12.
[24] Runowicz CD. Ovarian cancer screening. In: American Col-lege of Medical Genetic Foundation, Genetic susceptibilityto breast and ovarian cancer: assessment, counseling andtesting guidelines. New York State Department of Health;1999.
[25] Sliutz G, Tempfer C, Kainz C, Mustafa G, Gitsch G, Koelbl H,et al. Tissue polypeptide specific antigen and cancer asso-ciated serum antigen in the follow-up of ovarian cancer.Anticancer Research 1995;15(3):1127—9.
[26] Bozkurt N, Yuce K, Basaran M, Kose F, Ayhan A. Correlation ofplatelet count with second-look laparotomy results anddisease progression in patients with advanced epithelialovarian cancer. Obstetric Gynecology 2004;103(1):82—5.
[27] Wen W, Bernstein L, Lescallett J, Beazer-Barclay Y, Sullivan-Halley J, White M, et al. Comparison of TP53 mutationsidentified by oligonucleotide micro-array and conventionalDNA sequence analysis. Cancer Research 2000;60:2716—22.
[28] The University of Iowa’s Cancer Center. Tumour marker tests.University of Iowa; 2002 , available http://www.vh.org/adult/patient/cancercenter/tumormarker [accessed June20, 2006].
[29] Yang ST. Micro-array application inmedicine; 2002, availablehttp://binfo.ym.edu.tw/styang/seminar/medicine/array_medicine.htm [accessed June 20, 2006].
[30] Kohn EC, Mills GB, Liotta L. Promising directions for thediagnosis and management of gynecological cancers. Inter-national Journal of Gynaecology Obstetric 2003;83(Suppl1):203—9.
[31] Antal P, Verrelst H, Timmerman D, Moreau Y, Van Huffel S, DeMoor B, et al. Bayesian networks in ovarian cancer diagnosis:potentials and limitations. In: Proceedings of 13th IEEE oncomputer-based medical systems. US: The Institute of Elec-tricals and Electronics Engineers, Inc.; 2000. p. 103—8.
[32] Odusanya AA. Ovarian cancer prognosis and soft computing.In: Clark JW, McIntire LV, Ktonas PY, Mikos AG, Ghorbel FH,editors. Proceedings of the second joint EMBS/BMES con-ference, vol. 1. US: The Institute of Electricals and Electro-nics Engineers, Inc.; 2002. p. 60—1.
[33] Snow PB, Brandt JM, Larry Williams R. Neural networkanalysis of the prediction of cancer recurrence followingdebulking laparotomy and chemotherapy in Stages III and IVovarian cancer. Molecular Urology 2001;5(4):171—4.
[34] Renz C, Rajapakse JC, Razvi K, Liang SKC. Ovarian cancerclassification with missing data. In: Wang L, Rajapakse JC,Fukushima K, Lee SY, Yao X, editors. Proceedings of the ninthinternational conference on neural information processing,vol. 2. US: The Institute of Electricals and Electronics Engi-neers, Inc.; 2002. p. 809—13.
[35] Antal P, Fannes G, Timmerman D, Moreau Y, De Moor B. Usingliterature and data to learn Bayesian networks as clinicalmodels of ovarian tumors. Artificial Intelligence in Medicine2004;30:257—81.
[36] Wallace JC, Raaphorst GP, Somorjai RL, Ng CE, Fung FK,Senterman M, et al. Classification of 1H MR spectra ofbiopsies from untreated and recurrent ovarian cancer usinglinear discriminant analysis. Magnetic Resonance in Medi-cine 1997;38(4):569—76.
[37] Kusy M. Application of SVM to ovarian cancer classificationproblem. In: Rutkowski L, et al., editors. Proceedings ofthe international conference on artificial intelligenceand soft computing. Lecture Notes in Artificial Intelli-gence 3070. Berlin, Heidelberg: Springer-Verlag; 2004. p.1020—25.
[38] Ben-Dor A, Bruhn L, Friedman N, Nachman I, Schummer M,Yakhini Z. Tissue classification with gene expression profiles.In: Shamir R, Miyano S, Istrail S, Pevzner P, Waterman M,editors. Proceedings of the fourth annual international con-ference on computational molecular biology. New York:ACM; 2000. p. 54—64.
[39] Loo L, Quinn J, Cordingley H, Roberts S, Hrebien L, Kam M.Classification of SELDI-ToF mass spectra of ovarian cancerserum samples using a proteomic pattern recognizer. In:Reisman S, Foulds R, Mantilla B, editors. Proceedings of IEEE29th annual bioengineering conference. US: The Institute ofElectricals and Electronics Engineers, Inc.; 2003. p. 130—1.
[40] Petricoin III EF, Ardekani AM, Hitt BA, Levine PJ, Fusaro VA,Steinberg SM, et al. Use of proteomic patterns in serum toidentify ovarian cancer. Lancet 2002;359:572—7.
[41] Stevens EV, Liotta LA, Kohn EC. Proteomic analysis for earlydetection of ovarian cancer: a realistic approach? Interna-tional Journal of Gynecology Cancer 2003;13(Suppl 2):133—9.
[42] Tan TZ, Quek C, Ng GS, Ng EYK. A novel cognitive inter-pretation of breast cancer thermography with complemen-tary learning fuzzy neural memory structure. Expert Systemswith Applications 2007;33(3):652—66.
[43] Tan TZ, Quek C, Ng GS. Ovarian cancer diagnosis by hippo-campus and neocortex-inspired learningmemory structures.Neural Networks 2005;18(5/6):818—25.
[44] Schummer M, Ng W, Bumgarner R, Nelson P, Schummer B,Bednarski D, et al. Comparative hybridization of an array of21,500 ovarian cDNAs for the discovery genes over-expressed in ovarian carcinomas. Gene 1999;238:375—85.
[45] Witten I, Frank E. Data mining: practical machine learningtools and techniques, 2nd ed., San Francisco: MorganKaufmann; 2005.
[46] Jang JSR. ANFIS: adaptive network based fuzzy inferencesystems. IEEE Transactions on System Man and Cybernetics1993;23(3):665—85.
[47] Shevade SK, Keerthi SS. A simple and efficient algorithm forgene selection using sparse logistic regression. Technicalreport. CD-02-22, Control Division, Department of Mechan-ical Engineering, National University of Singapore, Singa-pore; 2002. p. 117—576.
[48] Liu H, Li J, Wong L. A comparative study on feature selectionand classification methods using gene expression profilesand proteomic patterns. Genomic Informatics 2002;13:51—60.
[49] Timm H, Doring C, Kruse R. Different approaches to fuzzyclustering of incomplete datasets. International Journal ofApproximate Reasoning 2004;35:239—49.
[50] Van Cott EM, Laposata M. Coagulation. In: Jacobs DS, et al.,editors. The laboratory test handbook. 5th ed., Cleveland:Lexi-Comp; 2001. p. 327—58.
[51] Hoek JA, Sturk A, ten Cate JW, Lamping RJ, Berends F, BormJJ. Laboratory and clinical evaluation of an assay of throm-bin—antithrombin III complexes in plasma. Clinical Chemis-try 1988;34:2058—62.
[52] Quah KH, Quek C. MCES: a novel Monte Carlo evaluativeselection approach for objective feature selections. IEEETransactions on Neural Networks 2007;18(2):431—48.
[53] Al-Nafussi A. Ovarian epithelial tumours: common problemsin diagnosis. Current Diagnostic Pathology 2004;10:473—99.
[54] Zhang Z, Liu Y, Zhao T. SVM based feature screening appliedto hierarchical cervical cancer detection. In: Proceedings ofthe international conference on diagnostic imaging andanalysis; 2002. p. 393—8.
[55] Casillas J, Cordon O, Herrera F. Interpretability improve-ments to find the balance interpretability–—accuracy in fuzzymodeling: an overview. In: Casillas J, Cordon O, Herrera F,

222 T.Z. Tan et al.
Magdalena L, editors. Accuracy improvements in linguisticfuzzy modeling, Studies in fuzziness and soft computing.Heidelberg: Springer-Verlag; 2003. p. 27—45.
[56] C2I, Centre for Computational Intelligence, http://www.c2i.ntu.edu.sg/; accessed November 28, 2007.
[57] Ang KK, Quek C. RSPOP: rough set-based pseudo-outer-product fuzzy rule identification algorithm. Neural Compu-tation 2005;17(1):205—43.
[58] Liu F, Quek C, Ng GS. A novel generic Hebbian ordering-basedfuzzy rule reduction approach to mamdani neuro-fuzzysystem. Neural Computation 2007;19(6):1656—80.
[59] Tan TZ, Quek C, Ng GS. Biological brain-inspired geneticcomplementary learning for stock market and bank failureprediction. Computational Intelligence 2007;23(2):236—61.
[60] Tan TZ, Ng GS, Quek C, Koh SCL. Ovarian cancer prognosis byhemostasis and complementary learning.In: Neural Informa-
tion Processing, PT 3, Proceedings. Lecture Notes in Com-puter Science 2006;4234:145—54.
[61] Tung WL, Quek C. FALCON: fuzzy neural control and decisionsystems using FKP and PFKP clustering algorithms. IEEETransactions on Systems Man and Cybernetics Part B2004;34(1):686—94.
[62] Quek C, Tung WL. A novel approach to fuzzy membershipfunctions using the FALCON-MART architecture. PatternRecognition Letters 2001;22(9):941—58.
[63] Tan TZ, Ng GS, Quek C. A novel biologically and psycholo-gically inspired fuzzy decision support system: hierarchicalcomplementary learning. IEEE Transactions on Computa-tional Biology and Bioinformatics 2008;5(1):67—79.
[64] Tan TZ, Quek C, Ng GS. Chance discovery using complemen-tary learning fuzzy neural network. Studies in Computa-tional Intelligence 2006;30:117—34.