overcoming the challenges of inbound supply chain for...
TRANSCRIPT
Overcoming the
Challenges of Inbound Supply Chain for a
US-Mexico Maquiladora
J. Rene Villalobos, Bill Smith, Alejandro Lazzarotto,Omar Ahumada
Department of Industrial EngineeringArizona State University
Tempe, Arizona
TRW AutomotiveChihuahua, Mexico
Agenda
• Overview of the inbound supply chain for
Mexican maquiladoras
• Overview of TRW inbound operations
• Areas of improvement opportunities
• Current projects within TRW supply chain
operations
• Conclusions

Maquiladora
• A Maquiladora is a Mexican assembly or manufacturing
operation that can be wholly or partially owned and
managed by a non-Mexican company.
• A Maquiladora uses competitive priced Mexican labor to
assemble, process or perform manufacturing operations.
• Maquiladora must temporarily import most components
parts from the United States or other countries.
• Mexican law allows these operations to bring in most
capital equipment and machinery from abroad.

5%
15%
80%
3%
89%
8%
1982 2002
Oil & mining
Oil & mining
Agricultural
Agricultural
Manufacturing
Manufacturing
Mexico’s Exports

Maquila Market Share
6%16%
3%
3%
24% 4% 10% 5%
4%
17%
3%
5%
Chihuahua
Monterrey
Saltillo
Matamoros
Nuevo Laredo
Reynosa
Cd. Juarez
Mexicali
Tijuana
Nogales
Torreon
Others

Total Employment Maquiladora Industry
0
200000
400000
600000
800000
1000000
1200000
1400000
1600000
19
90
/01
19
90
/09
19
91
/05
19
92
/01
19
92
/09
19
93
/05
19
94
/01
19
94
/09
19
95
/05
19
96
/01
19
96
/09
19
97
/05
19
98
/01
19
98
/09
19
99
/05
20
00
/01
20
00
/09
20
01
/05
20
02
/01
20
02
/09
Year/Month
Em
plo
ye
es
Source: INEGI

Main Maquiladora States
Others
37%
Baja California
Norte 20%
Chihuahua
19%Tamaulipas
13%
Sonora
6%
Coahuila
5%
January - August 1998
Total Maquila Exports
33,500 Millions of Dollars (1998)Source: SECOFI

Most important segments of Manufacturing
Metallic Products,
Machinery and Equipment
30.5%
Alcohol, Tobacco and food
Industry 23.8%
Wood
Industry
2.4%
Chemical Industry,and
products derived from
oil 15.1%
Paper
Products
4.1%
Mineral Products
7.1%
Basic Metallic
Industry 6.1%
Other
Industries
2.9%
Textiles
8.1%
March 1998
Source: INEGI

Chihuahua
430
Coahuila
258
Nuevo Leon
176
Zacatecas
18
Sonora
208
Baja California
1044
Jalisco
130
Sinaloa
9
Guanajuato
62
Mexico State
48
Distrito Federal
23
Yucatan
108
Tamaulipas
450
Plants by State

Statistics of Maquiladoras
Item 1990 2000 2002 P/
Total Number of sites 1703 3590 3251
Number of sites on Border
States 1523 2686 2362
% on Border 89.43% 74.82% 72.65%
Employees 446436 1291232 1081678
Operators 360358 1045401 860 04
Technicians 53349 153392 138020
Administrators 32 729 92439 83354
Supplies Used (000 pesos) $29,958,614.00 $521,139,822.00 $539,042,007.00
Supplies Imported $29,445,060.00 $505,147,039.00 $518,721,573.00
Mexican Supplies $513,554.00 $15,992,783.00 $20,320,434.00
Added Value (000 pesos) $9,918,504.00 $163,414,471.00 $181,758,729.00
Local Content 1.71% 3.07% 3.77%
Added Value wrt to supplies 33.11% 31.36% 33.72%
Source: INEGI

Supplies Used by Maquiladora
Mexican Supplies
Source: INEGI
Imported Supplies
97.35%
2.65%


OUR CUSTOMERS

TRW Plants


Suppliers
Plant

Europe
Suppliers
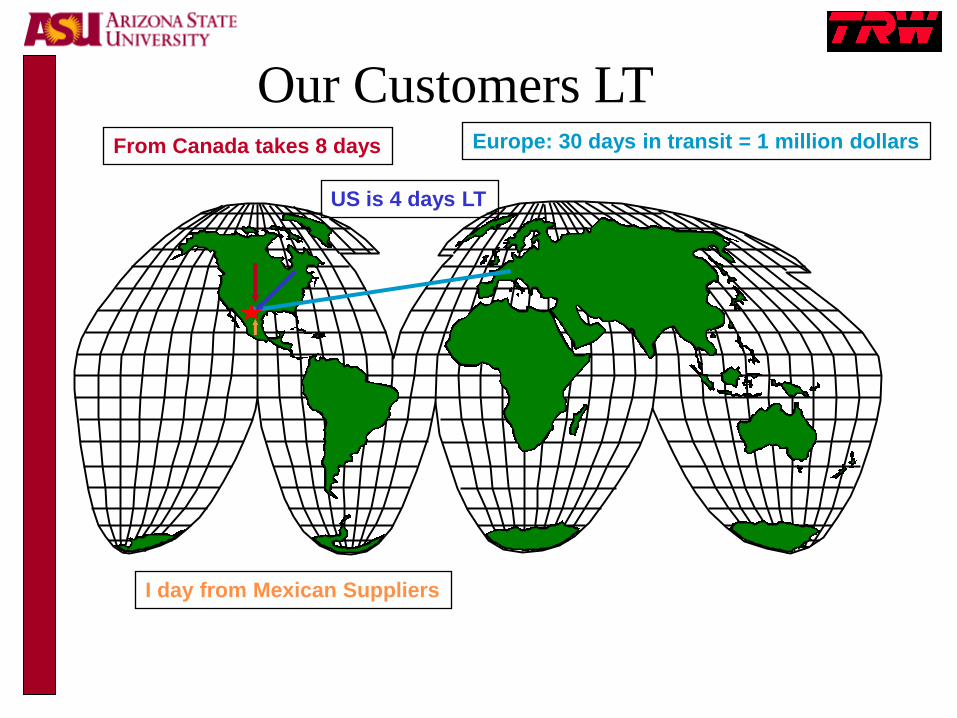
Europe: 30 days in transit = 1 million dollarsFrom Canada takes 8 days
US is 4 days LT
I day from Mexican Suppliers
Our Customers LT

The Question?
Inventory or Freight ?
Answer: Both
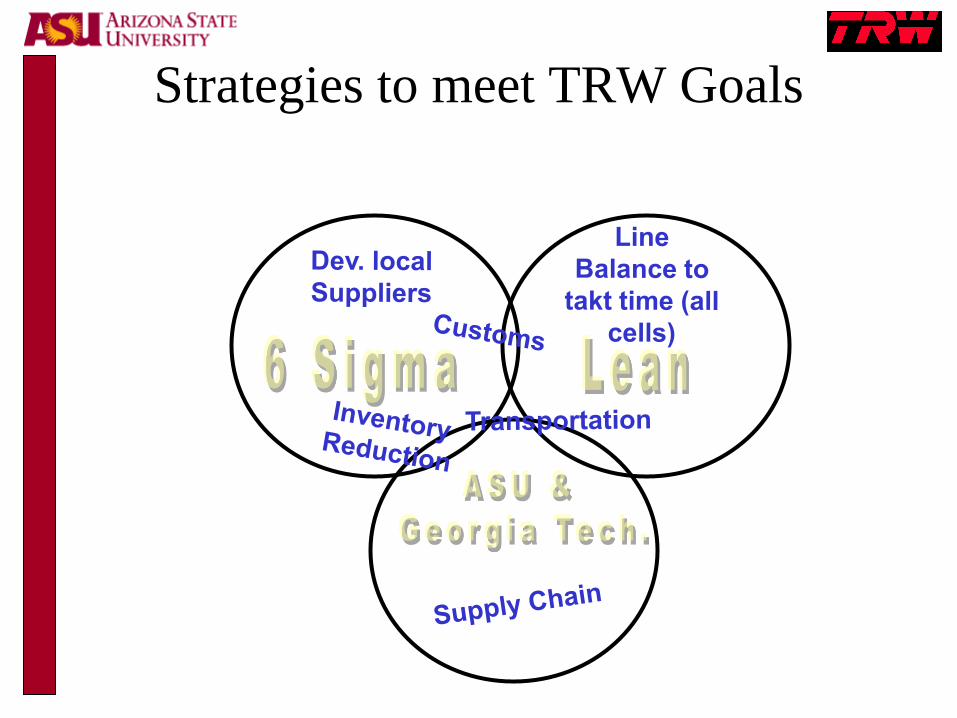
Strategies to meet TRW Goals

Strategies to Meet Materials Goals
Inventory Reduction
Here we are
Starting Point
Six Sigma
Projects
Local Suppliers
Third Party
Warehouse
Inventory Consolidation
Logistics Redefinition
$ 5 M
Consignment
Have 1 year to reduce 5 M USD of inventory

Third Party Process
In Transit
US
In Transit
MEX
Rec’g
TPW
Storage
TPW
Mfg
Product
Finished
Goods
Supplier
Send ASN &
Ship material
to El Paso
TPW
TPW TPW
Ship material
To TPW
Chihuahua
TRW
Pays freight
TPW
Send weekly
inventory
report to TRW
&
Deliver
material to
TRW with a
Packing slip
TRW
Generate a
Customs
invoice
TRW
Import trough a
monthly bases
virtual
pedimento
TPW
Send to
TRW Mex
services
invoice
Period of ownership
Supplier
Emit sales
invoice 24 hr
prior to
delivering
material
Rec’g
TRW
TRW
Send weekly
releases to
Supplier &
TPW
Supplier will
pay TPW
services?
YES
NOT
TRW pay
services to
TPC
Pay services to
TPW and
chargeback to
Supplier
TRW
50 %
TRW
50 %
TPW
Customs
Paperworks
& clearance

Cash Flow, the target
Beginning End of the Month
K USD
13
8
Goal
Actual

Projects with ASU/Georgia Tech
• During the Summer of the year 2002 an analysis of the in-bound logistics procedures was performed and the following areas of opportunities/projects were identified
– Improvement of inbound transportation strategies
– Consolidation center closer to suppliers
– Vendor managed inventory
– Integrated decision systems for transportation/inventory decisions
– Development of metrics to monitor and improve in-bound logistics
Preexisting Transportation Situation
• The raw material from the different suppliers is consolidated in El Paso, TX
• Around 13 different milk runs used to pick up raw materials
• Most of the raw material suppliers located in the mid west
• We estimated that the average truck utilization (excluding fabrics) for the milk runs is around 60%
• The average utilization for cross border transportation is over 80%
• Problem: TRW was paying a lot of money to move “air”
• TRW using a third-logistics party. Question: is this company doing a good job?

Analysis of in-bound Logistics
• Possible problems:
– Inventory/ordering decisions drive movement of material without regarding transportation costs
– Milk runs that do not take into consideration inventory trends/policies
– El Paso might not be an efficient consolidation point (too far from gravity center)
• Some Possible solutions
– Use an integrated supply chain policies (devise an ordering/milk run scheduling policy that minimizes total cost)
– weekly/monthly dynamic generation of milk runs
– Investigate the economic feasibility of a consolidation center closer to the the center of gravity of suppliers that will ship directly into Mexico
– Investigate the economic/technical feasibility of multimodal transportation

Transportation vs. Holding Costs
Demand (Yearly)
1,291,200
Cost per Part
$18.01
Inventory On hand ($) Holding Rate Holding Cost per Year
$353,354.53 20.00% $70,670.91
Cost of Materials Transportation Costs Transportation per Year
$23,254,512.00 3.50% $813,907.92
Single Product Example
$743,237.01
Transportation vs Holding Costs

Sample of Trucks Hired in April 2002
•Possible Savings by increasing efficiency.
• Sample of 107 trucks (April)
Transportation Efficiency
Efficiency $ / (52 Loads) Trailers Demand Cost per month Savings
59% 2,367.69$ 64 151,532.06$ -$
60% 2,360.31$ 64 151,060.00$ 472.06$
70% 2,023.12$ 64 129,480.00$ 22,052.06$
80% 1,770.23$ 64 113,295.00$ 38,237.06$
90% 1,573.54$ 64 100,706.67$ 50,825.39$

** Keeping the original
routes (Not Likely)
Transportation Efficiency Examples: Consolidation
City Weekly Demand (Pallets) Current Route (to El Paso) New Routes
CLEVELAND 25 A 1
BROOKLYN 8 A 1
CELINA 3 A 1
BLACKSTONE 4 B 2
SOUTH HILL 8 B 2
GRAND BLANC 11 C 3
ARCHBOLD 6 C 3
BOWLING 2 C 3
Current Routes
Route Ocupation Number of Pallets Cost per Route Cost/Pallet
A 69.23% 36 $2,238.00 $62.17
B 23.08% 12 $2,200.00 $183.33
C 36.54% 19 $1,926.26 $101.38
Total cost per week $6,364.26
New Routes Number of pallets Cost per route **
1 36 $412.00
2 12 $655.82
3 19 $524.83
Total pick up cost $1,592.65
Storage & handling $134.00
Cost for CIN-ELP $3,152.00
Total Cost per week $4,878.65
Savings = $1,485.61
% of savings = 23.3%

Route:Cleveland-Brooklyn- Celina-El Paso

Route:Blackstone-South Hill-El Paso

Route: Grand Blanc-Archbold-Bowling Green

Proposed: Consolidation of routes in Cincinnati

Consolidation
Brownsville
Cottondale
El Paso
Cincinnati

Coordination of inventory
• Currently the plant in Mexico and its counterpart in the US maintain independent inventories of the same product
• Sharing information to reduce inventory levels at both plants should be explored
• The coordination of inventory-transportation decisions between both plants should be explored
• The consolidation of both inventories should be explored
– Vendor managed inventory
• Problem: How to set costs to be attractive to both Plants?

Possible Implementation of Vendor
Managed Inventory
• US Plant responsible of POC inventory under prearranged rules regarding minimum and maximum inventory and information sharing
• US Plant to manage inventory to seek the minimization of total cots of inventory, transportation as well as production leveling at their plant
• Implement an internal costing system that will encourage both parties to seek the overall optimization of the system

VMI Formulas for Coordination
*
***
,,
),(
)),,()),(((),(..
),(min
wrww
rwwwrwrrrrwr
rwwFRR
CNFRRC
RRCCRRCCNN
CFRRCts
NFRRnCrw
• The optimal cost policy is dependant on the values of Rw and Rr.
• There is also a transfer between suppliers and customers of some of the benefits from the optimal policy, called: F
• As long as the firms are willing to share the benefits of VMI and they are willing to accept fixed transfer payments, all firms can be better off with VMI, and VMI coordinates the Supply Chain
• Cachon 2001

Supply Chain Phases
Day ActivitiesMonday Receive firm releases from customers for next week shipments, together with an update
of the forecast for the next 12 weeks.
Tuesday Enter information from releases into Excel Worksheet that works as an MPS for the
Plant.
Thursday Planner gets a report on inventory of Finish goods on hand. Calculate the amount of
production needed to accomplish customer requirements and also keep the safety stock
at normal level. From the file “Management Inventory”
Report the production program to the Production supervisors so they can schedule
production for next week.
Friday Upload the information from “Management Inventory” into the MRP system using it as
the MPS.

Supply Chain Phases
Day ActivitiesMonday Run MRP system in the morning using the module BOM explosion for calculating the
requirements, the information from order releases is the requirements from the week
entered on Friday.
Along with the start of orders, the production of the customers requirements and
shipment of these ones is also done during this week
Tuesday- After the planners get the information of the requirements from MRP, then they
Friday determine how much to order and when to schedule the shipment from suppliers.
The suppliers are managed by different planners and they schedule the orders to each
one of them on fixed days.

Supply Chain Phases

Supply Chain Phases

Monday Tuesday Wednesday Thursday Friday Saturday Sunday
Production Planning
Receives their
Releases From:
Mon - Wed
Also receives
forecast for 12
weeks
Chihuahua Plant
Demand from
Customers
Production
Plan
Production Planners:
Take the information
from releases and
forecast to plan the
production for weeks
ahead (MPS).
Production Planners:
Send production
schedule to Production
Department.
Upload MPS to Maxcim
Week 1
7/3/02
Send to Mesa:
- On Hand Inventory.
- Demand for next week.Send to Mesa:
Production Plan
for next week
Mesa:
+ Discounts Production from
current week.
+ Discounts Demand received
demand for next week, and
determines Inventory Level
Supply Chain Phases with
Information Sharing
Benefits: Mesa will have 2 weeks in advance the demand for shipments,
also an expected reduction in variability, tending to reduce safety
stock in both plants.

Supply Chain Phases with
Vendor Managed Inventory

Areas of Opportunity• Improvement of systems
• Integrated logistics decisions
• Coordination of inventories
• Improvement of transportation strategies
• Production scheduling decisions based on “historical” and experience with production. Can we take a look at how materials and production are influencing each other? What is their combined performance? Can it be improved?
• Both inventory and transportation costs seem to be a small portion of the total “added cost”. Setting metrics, efficiency goals and continuous benchmarking and improvement programs on the “labor burden” component of cost is recommended to strive for “overall” improvement of the supply chain

Some Recommendations for
improvement• Increase truck utilization by:
– modifying the current milk run routes
– Modifying the frequency of ordering raw materials according to minimize total costs (or at least making the buyers aware of the cost implications of their ordering policies)
– Consolidating orders from different buyers/companies
– More collaboration/communication across Materials Departments from the plants
• Decrease total inventory by:
– Revise current ordering policies to minimize the variability observed by Mesa
– Reduce the information lag between plants
– Sharing information between plants
– Move to Vendor Managed Inventory

Some problems common to
Maquiladora Industry
• Bottlenecks caused by international crossing points
• Under performing transportation system
• Increased use of third party logistic companies
• Effective management of inventory
• Use of paradigms that might not apply to reality of
maquiladoras
• Over reliance on low cost labor
• Lack of effective measures of performance

Some Points• The Mexican content of supplies is still very low
(below 4%)
• The overwhelmingly majority of supplies for the maquiladoras still come from the USA and other countriesthe maquiladoras usually keep their original supplier base when they move to Mexico
• As the maquiladora industry matures more plants have migrated to the interior of Mexico making the procurement and transportation of supplies both more complex and more important
• Very often the inbound supply chains for maquiladoras lack the sophistication to face the challenges of moving to border/interior of Mexico

Conclusions• When a plant (maquiladora or otherwise) is relocated to
Mexico a careful look at the preexisting inbound (and
outbound) supply chain practices should be taken
• The solutions that might have worked well for the original
plant may not work well for the new plant, particularly if the
new plant is located in the interior of Mexico
• Opportunities for improvement include better transportation
practices, integrated inventory/transportation decisions,
judicious use of third party companies, relocation and/or
identification of new suppliers, better coordination
throughout the supply chain