overview of budgets and financial...
TRANSCRIPT
CHAPTER 1Overview of Budgets and Financial Models
BUDGETS
The Cambridge Dictionary defines a budget as “a plan to show how muchmoney a person or organization will earn and how much they will need orbe able to spend.” Businesses use several different types of budgets to man-age their operations. Whatever form various budgets may take, the primarygoal of all budgets is to provide a tangible and quantifiable estimate of thereceipt and allocation of resources. In the context of this book, a budgetrepresents a core element of a financial model; financial models are dis-cussed later in the chapter.
Businesses use several types of budgets for planning purposes. Thesebudgets are typically categorized by the timeframe that they cover. A “long-range plan,” one type of budget, typically forecasts financial statements out5 to 10 years into the future. Long-range plans usually evolve from “strate-gic plans,” which define the overall mission and goals for a business. Theselong-range plans are coordinated with Capital Budgets, which map outlarge monetary commitments for things such as facilities and large pieces ofequipment.
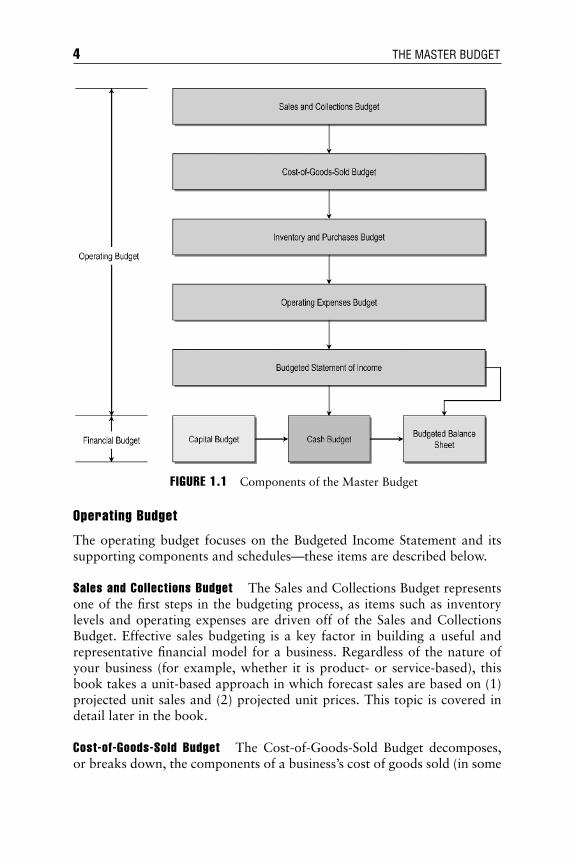
From a budgeting perspective, this book is focused on the “MasterBudget,” which forecasts a business’s complete operations over themedium-term (1–5 years). The Master Budget consists of many interrelatedfinancial and operating schedules, including sales, purchases, and operatingexpenses, among many others. While some of the key outputs of a MasterBudget are the consolidated financial statements (Balance Sheet, IncomeStatement, and Statement of Cash Flows), a vast array of supporting sched-ules are also part of the Master Budget. Figure 1.1 outlines the variouscomponents of the Master Budget.
As Figure 1.1 indicates, there are two key components of the MasterBudget: the Operating Budget and the Financial Budget.
3
ccc_proctor_ch01_3-19.qxd 7/19/04 1:42 PM Page 3
COPYRIG
HTED M
ATERIAL
Operating Budget
The operating budget focuses on the Budgeted Income Statement and itssupporting components and schedules—these items are described below.
Sales and Collections Budget The Sales and Collections Budget representsone of the first steps in the budgeting process, as items such as inventorylevels and operating expenses are driven off of the Sales and CollectionsBudget. Effective sales budgeting is a key factor in building a useful andrepresentative financial model for a business. Regardless of the nature ofyour business (for example, whether it is product- or service-based), thisbook takes a unit-based approach in which forecast sales are based on (1)projected unit sales and (2) projected unit prices. This topic is covered indetail later in the book.
Cost-of-Goods-Sold Budget The Cost-of-Goods-Sold Budget decomposes,or breaks down, the components of a business’s cost of goods sold (in some
4 THE MASTER BUDGET
FIGURE 1.1 Components of the Master Budget
ccc_proctor_ch01_3-19.qxd 7/19/04 1:42 PM Page 4
cases referred to as the cost of revenues). This budget breaks out each sep-arate factor underlying the cost of goods sold for a business.
Inventory and Purchases Budget The Inventory and Purchases Budget,which represents what a business plans to buy and how much inventory itintends to hold over a given timeframe, is based on three factors: a busi-ness’s desired ending inventory, cost of goods sold, and beginning inven-tory. A business’s desired ending inventory will drive that business’sbudgeted purchases over a given period of time. A larger desired ending in-ventory will typically lead to a larger Purchases Budget and vice-versa.While the Purchases Budget, a component of the Inventory and PurchasesBudget, represents an estimate of future purchases, this is an accrual-basedaccounting figure, and it is the Disbursements for Purchases Budget (an-other component of the Inventory and Purchases Budget) that drives acompany’s cash flows. This concept is discussed in detail later in the book.
Operating Expenses Budget The Operating Expenses Budget forecasts allof the elements of a business’s operating expenses, such as salaries, rent,depreciation, and others. Some of these expenses are fixed and some arevariable (in other words, based on another metric, such as revenues); thisconcept of fixed versus variable costs is discussed in detail later in thebook. While the Operating Expenses Budget represents an estimate of fu-ture expenses, this is an accrual-based accounting figure, and it is the Dis-bursements for Operating Expenses Budget, a component of the OperatingExpenses Budget, that drives a company’s cash flows. This concept is alsodiscussed in detail later in the book.
Budgeted Statement of Income The Budgeted Statement of Income (alsoreferred to as the Budgeted Income Statement) integrates components ofeach of the other Operating Budget schedules. The Income Statement com-pares a business’s revenues and costs for a given period of time and oftenserves as a benchmark for the performance of a business.
Financial Budget
The Financial Budget is focused on capital expenditures (large purchases ofassets such as equipment and facilities) and on a business’s budgeted cashposition and Balance Sheet.
Capital Budget A business’s Capital Budget forecasts large expenditures foritems such as machinery. Different companies set different thresholds forwhat qualifies as a capital expenditure (versus an expense). If the purchase ofan item (such as a piece of machinery) is classified as a capital expenditure, it
Overview of Budgets and Financial Models 5
ccc_proctor_ch01_3-19.qxd 7/19/04 1:42 PM Page 5
is then depreciated (or amortized in some cases) over a predetermined periodof time. The Capital Budget covers Capital Expenditures, Disbursements forCapital Expenditures, and Depreciation Budgets.
Cash Budget The Cash Budget tracks a business’s anticipated cash re-ceipts and disbursements. This is a very detailed and important schedulethat draws on information in the Operating Budget.
Budgeted Balance Sheet The budgeted Balance Sheet represents the finalstep in building the Master Budget as outlined in Figure 1.1. The budgetedBalance Sheet integrates components from both the Operating and the Fi-nancial Budgets.
FINANCIAL MODELS
A financial model is a quantitative representation of a company’s past,present, and future business operations. This quantitative representationis expressed through the use of accounting—the language of business. Fi-nance, which may be broadly defined as the science of managing moneyand other assets, is based on accounting. As such, it is important to recog-nize the central role accounting, or the enumeration of business transac-tions, plays in building financial models. While this book does not coveror address accounting concepts in any level of detail, it is worth notingthat the consolidated financial statements (Balance Sheet, Income State-ment, and Statement of Cash Flows) represent the product of a series ofaccounting transactions.
A financial model is a required component of any business plan. Any-one interested in starting a new business, starting a new line of businesswithin an existing company, assessing the operations of an existing or pro-posed business, and/or comparing the operations of two or more busi-nesses, among other tasks, should know how to build, use, and modify afinancial model.
While there are a variety of approaches to building financial models,this book will focus on the inclusion of the following sections in a financialmodel: (1) a Master Budget (which is made up of an Operating Budget anda Financial Budget), (2) the consolidated financial statements (BalanceSheet, Income Statement, and Statement of Free Cash Flows), (3) a freecash flow analysis, (4) a sensitivity analysis of the model’s outputs versusinputs, (5) a contribution margin analysis, (6) a financial ratios analysis,(7) a valuation analysis, and (8) a capitalization chart.
For the sake of illustration, sample templates for each of these sections
6 THE MASTER BUDGET
ccc_proctor_ch01_3-19.qxd 7/19/04 1:42 PM Page 6
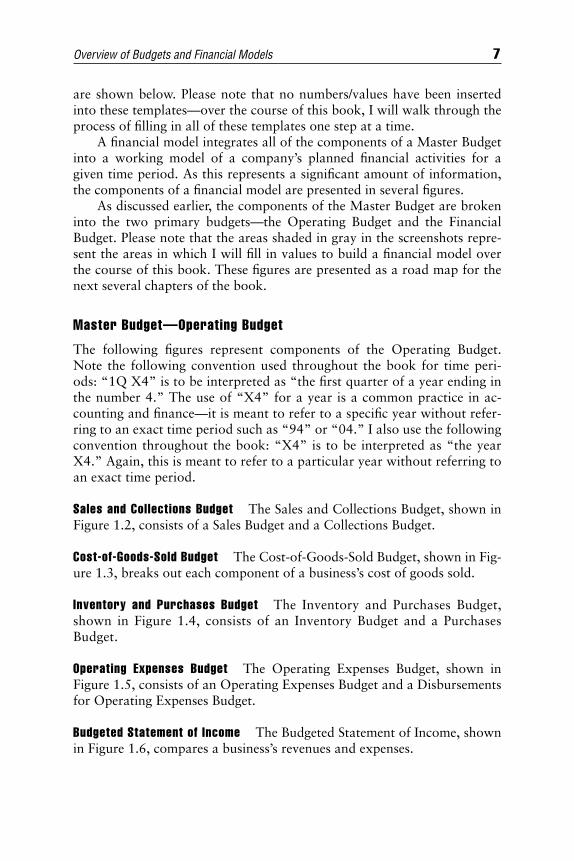
are shown below. Please note that no numbers/values have been insertedinto these templates—over the course of this book, I will walk through theprocess of filling in all of these templates one step at a time.
A financial model integrates all of the components of a Master Budgetinto a working model of a company’s planned financial activities for agiven time period. As this represents a significant amount of information,the components of a financial model are presented in several figures.
As discussed earlier, the components of the Master Budget are brokeninto the two primary budgets—the Operating Budget and the FinancialBudget. Please note that the areas shaded in gray in the screenshots repre-sent the areas in which I will fill in values to build a financial model overthe course of this book. These figures are presented as a road map for thenext several chapters of the book.
Master Budget—Operating Budget
The following figures represent components of the Operating Budget.Note the following convention used throughout the book for time peri-ods: “1Q X4” is to be interpreted as “the first quarter of a year ending inthe number 4.” The use of “X4” for a year is a common practice in ac-counting and finance—it is meant to refer to a specific year without refer-ring to an exact time period such as “94” or “04.” I also use the followingconvention throughout the book: “X4” is to be interpreted as “the yearX4.” Again, this is meant to refer to a particular year without referring toan exact time period.
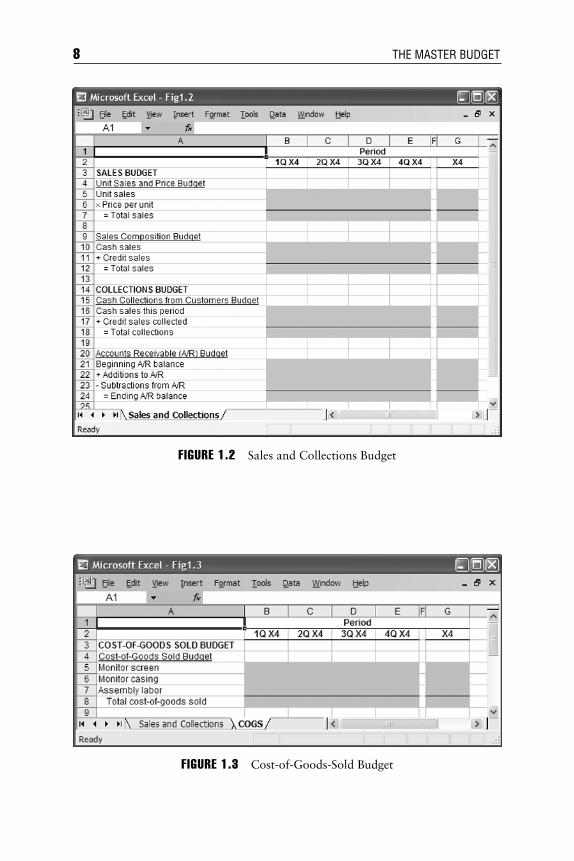
Sales and Collections Budget The Sales and Collections Budget, shown inFigure 1.2, consists of a Sales Budget and a Collections Budget.
Cost-of-Goods-Sold Budget The Cost-of-Goods-Sold Budget, shown in Fig-ure 1.3, breaks out each component of a business’s cost of goods sold.
Inventory and Purchases Budget The Inventory and Purchases Budget,shown in Figure 1.4, consists of an Inventory Budget and a PurchasesBudget.
Operating Expenses Budget The Operating Expenses Budget, shown inFigure 1.5, consists of an Operating Expenses Budget and a Disbursementsfor Operating Expenses Budget.
Budgeted Statement of Income The Budgeted Statement of Income, shownin Figure 1.6, compares a business’s revenues and expenses.
Overview of Budgets and Financial Models 7
ccc_proctor_ch01_3-19.qxd 7/19/04 1:42 PM Page 7
8 THE MASTER BUDGET
FIGURE 1.2 Sales and Collections Budget
FIGURE 1.3 Cost-of-Goods-Sold Budget
ccc_proctor_ch01_3-19.qxd 7/19/04 1:42 PM Page 8

Overview of Budgets and Financial Models 9
FIGURE 1.4 Inventory and Purchases Budget
FIGURE 1.5 Operating Expenses Budget
ccc_proctor_ch01_3-19.qxd 7/19/04 1:42 PM Page 9
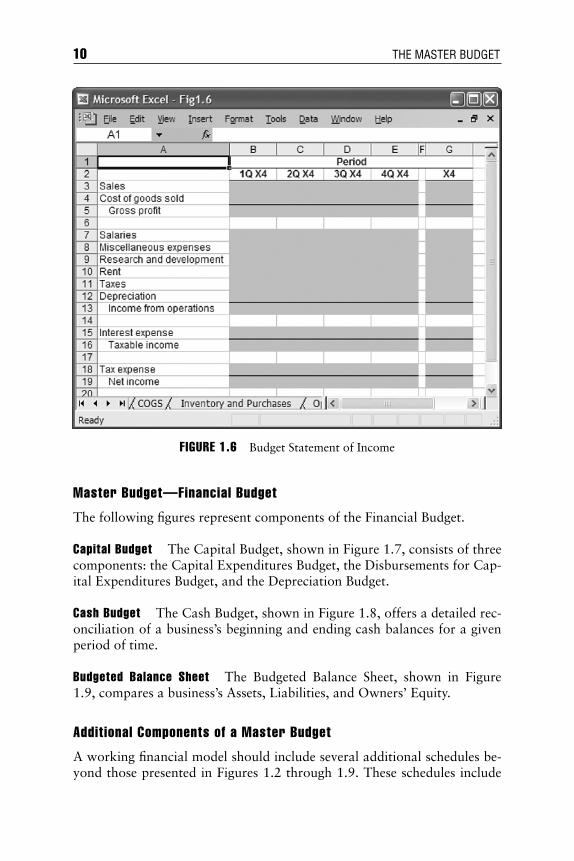
Master Budget—Financial Budget
The following figures represent components of the Financial Budget.
Capital Budget The Capital Budget, shown in Figure 1.7, consists of threecomponents: the Capital Expenditures Budget, the Disbursements for Cap-ital Expenditures Budget, and the Depreciation Budget.
Cash Budget The Cash Budget, shown in Figure 1.8, offers a detailed rec-onciliation of a business’s beginning and ending cash balances for a givenperiod of time.
Budgeted Balance Sheet The Budgeted Balance Sheet, shown in Figure1.9, compares a business’s Assets, Liabilities, and Owners’ Equity.
Additional Components of a Master Budget
A working financial model should include several additional schedules be-yond those presented in Figures 1.2 through 1.9. These schedules include
10 THE MASTER BUDGET
FIGURE 1.6 Budget Statement of Income
ccc_proctor_ch01_3-19.qxd 7/19/04 1:42 PM Page 10

Overview of Budgets and Financial Models 11
FIGURE 1.7 Capital Budget
FIGURE 1.8 Cash Budget
ccc_proctor_ch01_3-19.qxd 7/19/04 1:43 PM Page 11
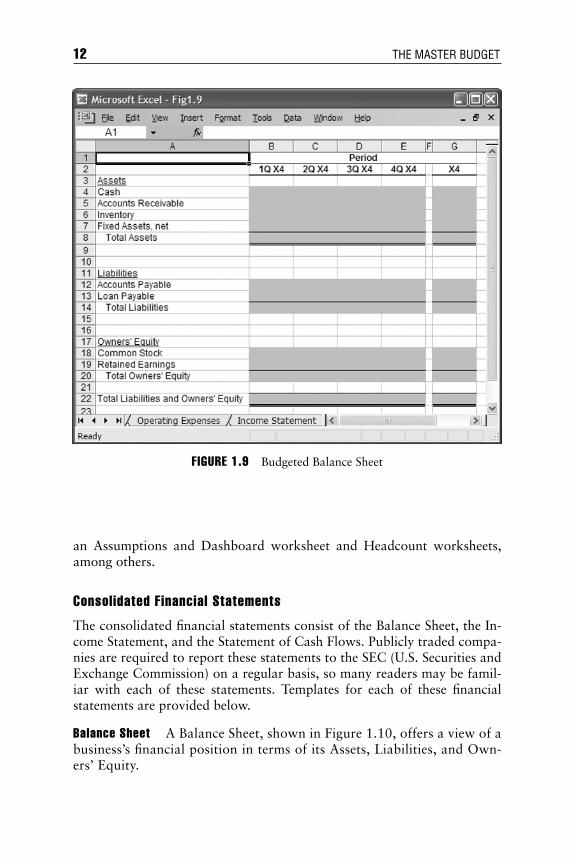
an Assumptions and Dashboard worksheet and Headcount worksheets,among others.
Consolidated Financial Statements
The consolidated financial statements consist of the Balance Sheet, the In-come Statement, and the Statement of Cash Flows. Publicly traded compa-nies are required to report these statements to the SEC (U.S. Securities andExchange Commission) on a regular basis, so many readers may be famil-iar with each of these statements. Templates for each of these financialstatements are provided below.
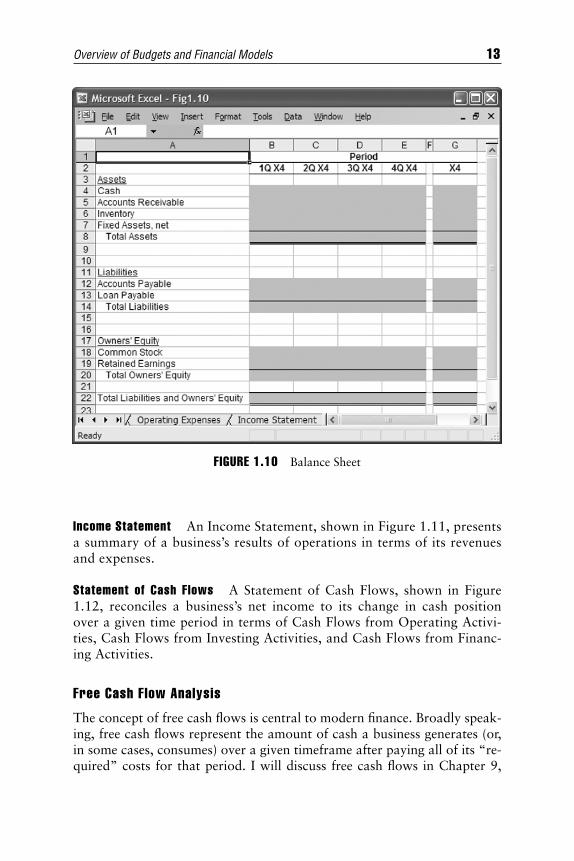
Balance Sheet A Balance Sheet, shown in Figure 1.10, offers a view of abusiness’s financial position in terms of its Assets, Liabilities, and Own-ers’ Equity.
12 THE MASTER BUDGET
FIGURE 1.9 Budgeted Balance Sheet
ccc_proctor_ch01_3-19.qxd 7/19/04 1:43 PM Page 12
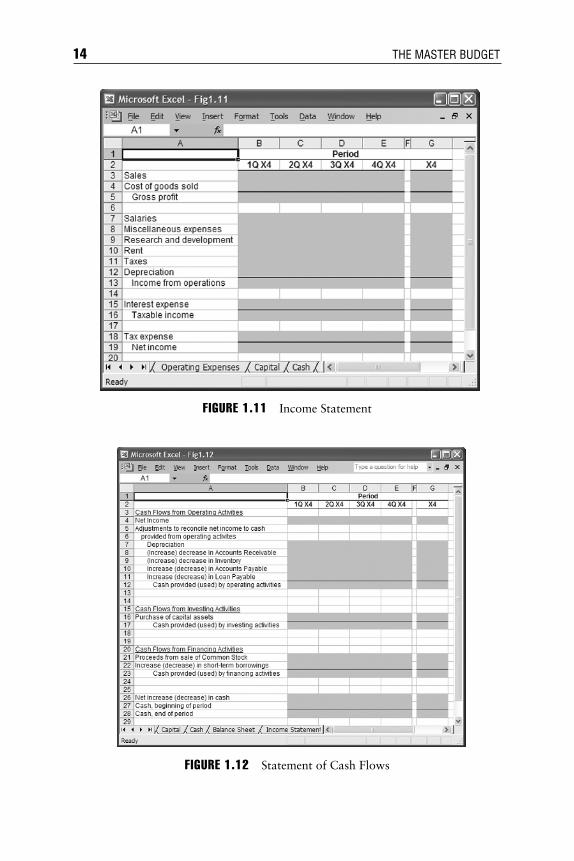
Income Statement An Income Statement, shown in Figure 1.11, presentsa summary of a business’s results of operations in terms of its revenuesand expenses.
Statement of Cash Flows A Statement of Cash Flows, shown in Figure1.12, reconciles a business’s net income to its change in cash positionover a given time period in terms of Cash Flows from Operating Activi-ties, Cash Flows from Investing Activities, and Cash Flows from Financ-ing Activities.
Free Cash Flow Analysis
The concept of free cash flows is central to modern finance. Broadly speak-ing, free cash flows represent the amount of cash a business generates (or,in some cases, consumes) over a given timeframe after paying all of its “re-quired” costs for that period. I will discuss free cash flows in Chapter 9,
Overview of Budgets and Financial Models 13
FIGURE 1.10 Balance Sheet
ccc_proctor_ch01_3-19.qxd 7/19/04 1:43 PM Page 13
14 THE MASTER BUDGET
FIGURE 1.12 Statement of Cash Flows
FIGURE 1.11 Income Statement
ccc_proctor_ch01_3-19.qxd 7/19/04 1:43 PM Page 14
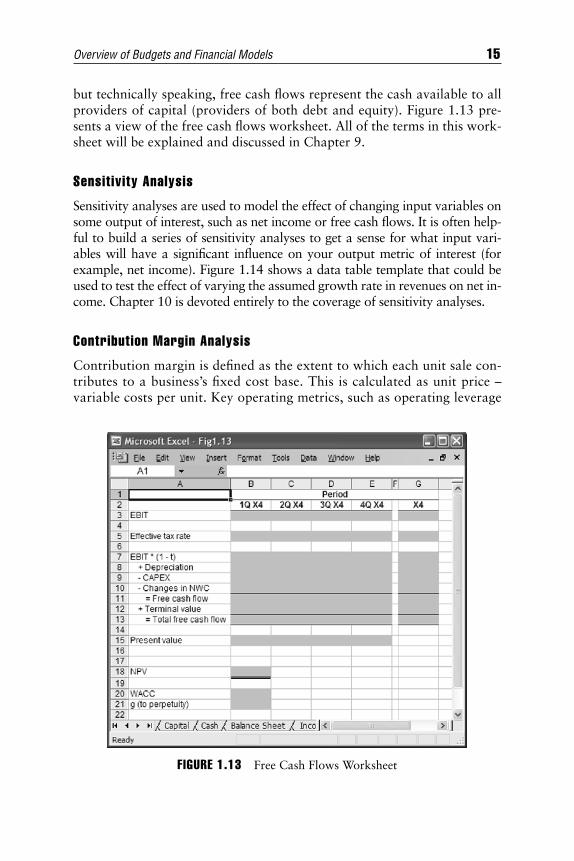
but technically speaking, free cash flows represent the cash available to allproviders of capital (providers of both debt and equity). Figure 1.13 pre-sents a view of the free cash flows worksheet. All of the terms in this work-sheet will be explained and discussed in Chapter 9.
Sensitivity Analysis
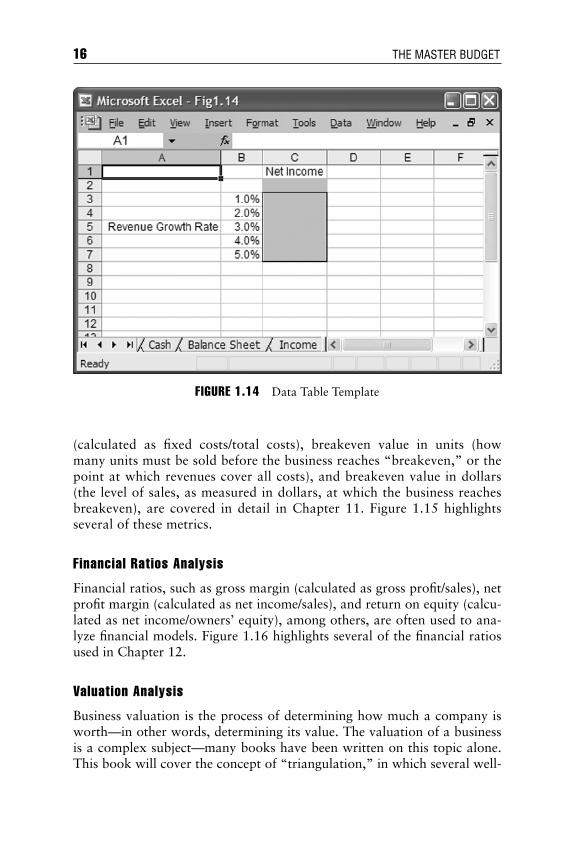
Sensitivity analyses are used to model the effect of changing input variables onsome output of interest, such as net income or free cash flows. It is often help-ful to build a series of sensitivity analyses to get a sense for what input vari-ables will have a significant influence on your output metric of interest (forexample, net income). Figure 1.14 shows a data table template that could beused to test the effect of varying the assumed growth rate in revenues on net in-come. Chapter 10 is devoted entirely to the coverage of sensitivity analyses.
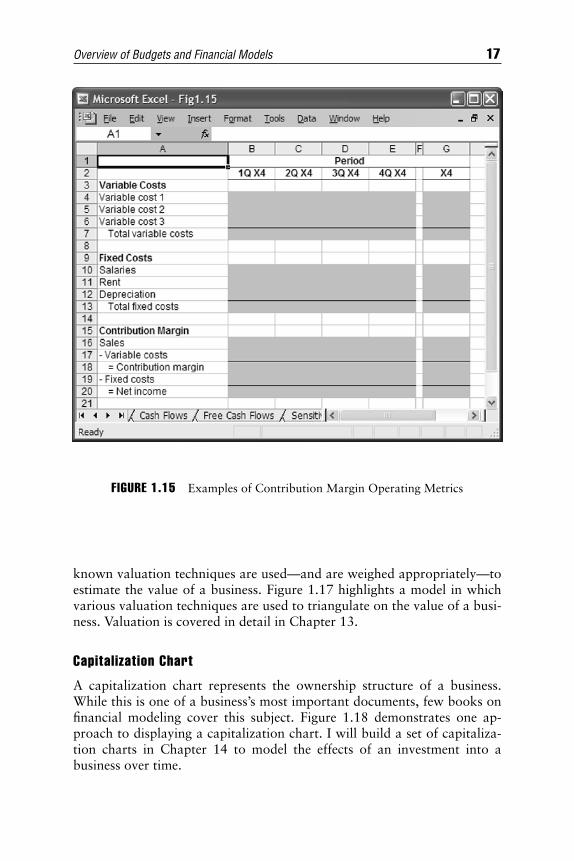
Contribution Margin Analysis
Contribution margin is defined as the extent to which each unit sale con-tributes to a business’s fixed cost base. This is calculated as unit price –variable costs per unit. Key operating metrics, such as operating leverage
Overview of Budgets and Financial Models 15
FIGURE 1.13 Free Cash Flows Worksheet
ccc_proctor_ch01_3-19.qxd 7/19/04 1:43 PM Page 15
(calculated as fixed costs/total costs), breakeven value in units (howmany units must be sold before the business reaches “breakeven,” or thepoint at which revenues cover all costs), and breakeven value in dollars(the level of sales, as measured in dollars, at which the business reachesbreakeven), are covered in detail in Chapter 11. Figure 1.15 highlightsseveral of these metrics.
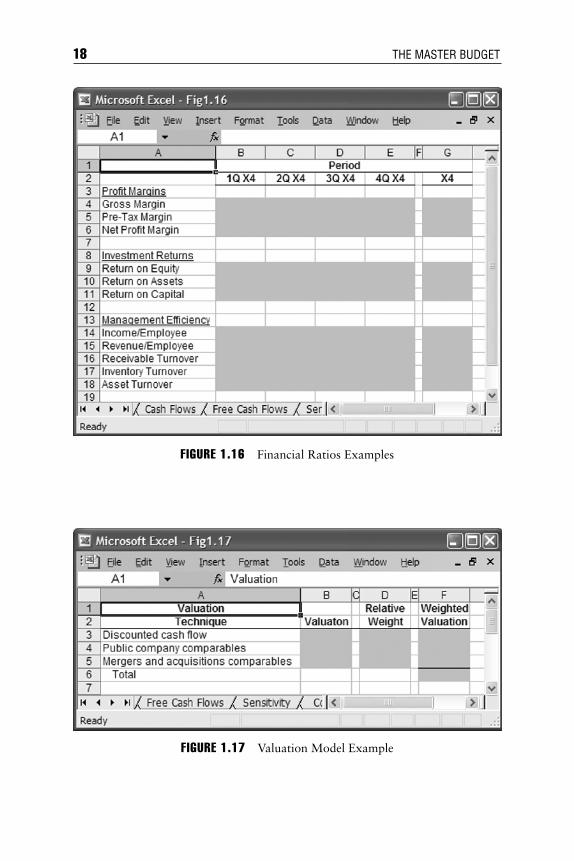
Financial Ratios Analysis
Financial ratios, such as gross margin (calculated as gross profit/sales), netprofit margin (calculated as net income/sales), and return on equity (calcu-lated as net income/owners’ equity), among others, are often used to ana-lyze financial models. Figure 1.16 highlights several of the financial ratiosused in Chapter 12.
Valuation Analysis
Business valuation is the process of determining how much a company isworth—in other words, determining its value. The valuation of a businessis a complex subject—many books have been written on this topic alone.This book will cover the concept of “triangulation,” in which several well-
16 THE MASTER BUDGET
FIGURE 1.14 Data Table Template
ccc_proctor_ch01_3-19.qxd 7/19/04 1:43 PM Page 16
known valuation techniques are used—and are weighed appropriately—toestimate the value of a business. Figure 1.17 highlights a model in whichvarious valuation techniques are used to triangulate on the value of a busi-ness. Valuation is covered in detail in Chapter 13.
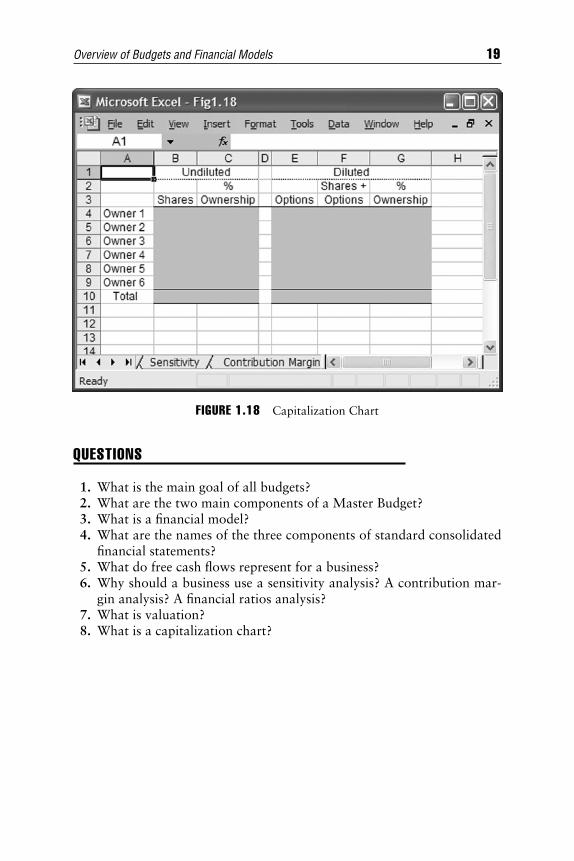
Capitalization Chart
A capitalization chart represents the ownership structure of a business.While this is one of a business’s most important documents, few books onfinancial modeling cover this subject. Figure 1.18 demonstrates one ap-proach to displaying a capitalization chart. I will build a set of capitaliza-tion charts in Chapter 14 to model the effects of an investment into abusiness over time.
Overview of Budgets and Financial Models 17
FIGURE 1.15 Examples of Contribution Margin Operating Metrics
ccc_proctor_ch01_3-19.qxd 7/19/04 1:43 PM Page 17
18 THE MASTER BUDGET
FIGURE 1.17 Valuation Model Example
FIGURE 1.16 Financial Ratios Examples
ccc_proctor_ch01_3-19.qxd 7/19/04 1:43 PM Page 18
QUESTIONS
1. What is the main goal of all budgets?2. What are the two main components of a Master Budget?3. What is a financial model?4. What are the names of the three components of standard consolidated
financial statements?5. What do free cash flows represent for a business?6. Why should a business use a sensitivity analysis? A contribution mar-
gin analysis? A financial ratios analysis?7. What is valuation?8. What is a capitalization chart?
Overview of Budgets and Financial Models 19
FIGURE 1.18 Capitalization Chart
ccc_proctor_ch01_3-19.qxd 7/19/04 1:43 PM Page 19