overview of edc europe
DESCRIPTION
Overview of EDC Europe. 2011. ABOUT EDC. Canada’s Export Credit Agency AAA rated Crown corporation wholly owned by Government of Canada Financially self-sustaining Operates on commercial principles. EDC IS CANADA. 100% AAA Sovereign Issuer - PowerPoint PPT PresentationTRANSCRIPT
Overview of EDCEurope
2011

ABOUT EDC
Canada’s Export Credit Agency
AAA rated Crown corporation wholly owned by Government of Canada
Financially self-sustaining
Operates on commercial principles
2

Domestic Currency Foreign Currency
Long-term Short-term Long-term Short-term
Standard & Poor’s AAA A-1+ AAA A-1+
Moody’s Aaa P1 Aaa P1
JCR AAA AAA
DBRS AAA R-1 (high) AAA R-1 (high)
100% AAA Sovereign Issuer
EDC notes are a direct and unconditional obligation of the Issuer,
therefore are direct and unconditional obligations of Canada
0% BIS risk weighting according to Basel II guidelines
Canada Banking System Is World's Soundest, Economic Forum Says in Survey. Canada’s banking system was ranked the world’s soundest for the third straight year by the World Economic Forum. September 9, 2010
EDC IS CANADA
3
“What Toronto can teach New York and London”
– Financial Times, 29 January 2010

EDC’S ROLE
To support and develop Canada’s export trade and international business efforts
Financing and insurance solutions for Canadian exporters and investors
4

Nominal GDP 2009: $1.53 trillion
GDP per capita: $45,266
Population: 33.8 million
Labor force: 18.6 million
Labor force by occupation:
Services 76%
Manufacturing 13%
Construction 6%
Agriculture 2%
Other 3%
AN INTRODUCTION TO CANADA
5

2009 PERFORMANCE HIGHLIGHTS
Despite the recession, EDC maintained or grew its business as follows:
Global business volume of $82.7 billion
Served 8,469 customers
Supported business in 184 countries
$19 billion in emerging markets
Contributed to 4.4% of GDP, supporting 572,000 jobs
6
0
2
4
6
8
10
12
14
16
2005 2006 2007 2008 2009 2010
Bill
ion
s (C
AD
)
Year
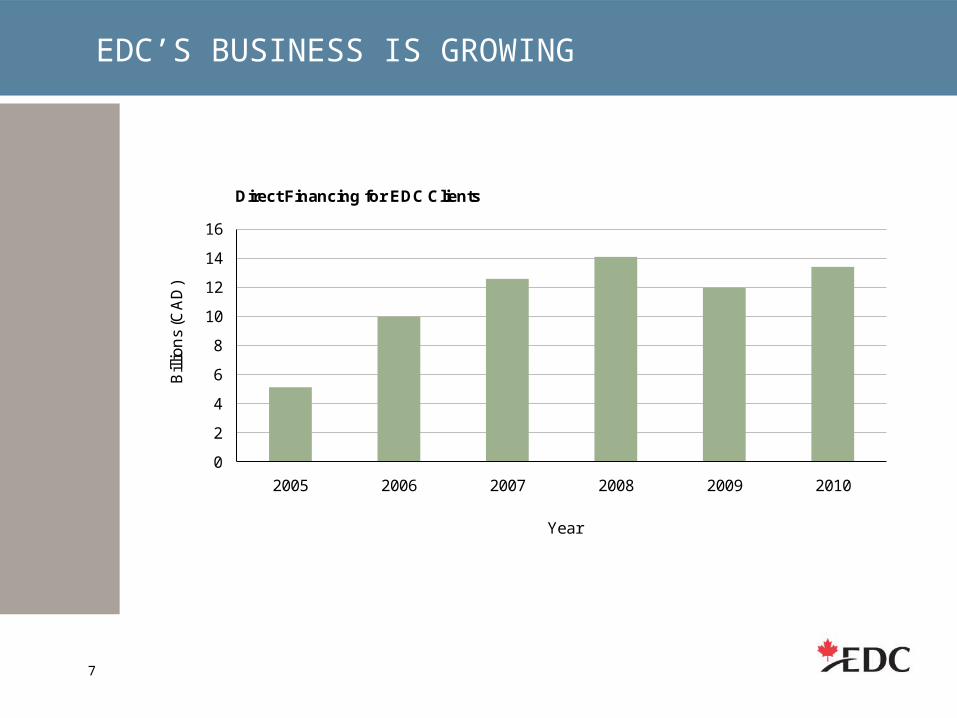
Direct Financing for EDC Clients
EDC’S BUSINESS IS GROWING
7

2007 2008 2009 2010
Business Volume* 70 85.8 82.8 84.6
Assets* 23.1 35.3 32.9 31.9
Net Profit** 473 206 258 1,531
*CAD billions
** CAD millions
EDC’S KEY RESULTS
8

Q1-20
06
Q3-20
06
Q1-20
07
Q3-20
07
Q1-20
08
Q3-20
08
Q1-20
09
Q3-20
09
Q1-20
10
Q3-20
100
100000
200000
300000
400000
500000
600000
Canadian Real Exports
2000 2001 2002 2003 2004 2005 2006 2007 2008 200960.0%
65.0%
70.0%
75.0%
80.0%
85.0%
90.0%
95.0%
100.0%
0.0%
1.0%
2.0%
3.0%
4.0%
5.0%
6.0%
7.0%
8.0%
9.0%
10.0%
Export Destinations as % of TotalUSA Right Axis - Others Left Axis
United States (U.S.)
Asia
Western Europe
China
Japan
Latin America
Mexico
EXPORTS RECOVERING
9
Lima, Peru
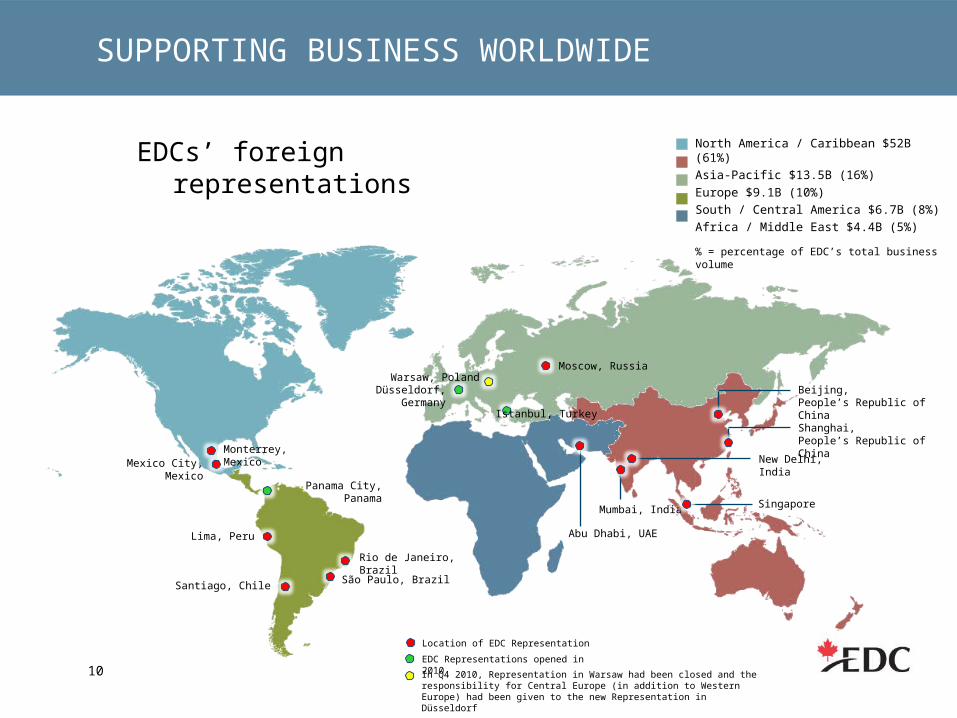
SUPPORTING BUSINESS WORLDWIDE
EDCs’ foreign representations
10
North America / Caribbean $52B (61%)
Asia-Pacific $13.5B (16%)
Europe $9.1B (10%)
South / Central America $6.7B (8%)
Africa / Middle East $4.4B (5%)
% = percentage of EDC’s total business volume
Location of EDC Representation
Monterrey, MexicoMexico City, Mexico
Santiago, ChileSão Paulo, Brazil
Moscow, Russia
Rio de Janeiro, Brazil
Abu Dhabi, UAE
Mumbai, India
New Delhi, India
Beijing, People’s Republic of China
Shanghai, People’s Republic of China
Singapore
EDC Representations opened in 2010
Panama City, Panama
Istanbul, Turkey
Düsseldorf, Germany
In Q4 2010, Representation in Warsaw had been closed and the responsibility for Central Europe (in addition to Western Europe) had been given to the new Representation in Düsseldorf
Warsaw, Poland

** Commercial and sovereign loan exposure - ratio of 93:7
DIVERSIFIED TOTAL EXPOSURE
11
North America/Caribbean$51,973M(60.6%)
Asia/Pacific$13,466M(15.7%)
Europe$9,092M(10.6%)
South America/Central America
$6,669M(7.8%)
Africa/Middle East$4,360M(5.1%)
Other Regions$259M(0.3%)
Aerospace26%
Extractive25%
Surface Transportation
15%
Infrastructure & Environment
13%
Information &Communication
Technology10%
Sovereign & Other
11%
Total loans and guarantees exposure by sector**
Business volumes by market*
* Source: EDC Data as of September 2009

12
16 offices across Canada
Able to respond locally to needs
Edmonton
Vancouver Calgary
Regina
Winnipeg
WindsorLondon
MississaugaToronto
Ottawa
Montréal
Québec City
Ville St-Laurent
Moncton
Halifax
St. John’s
CONNECTING WITH CANADIAN BUSINESSES ACROSS CANADA

2009–2014 CORPORATE PLAN: ROLE OF EDC
Enhancing Canada’s trade performance by being a trusted partner to our customers
How do we do this? Expertise in trade and investment
Broad network of representation
Strong partnerships
Expanded risk appetite
Sound financial management
Timely, quality service
As a Crown corporation, our business strategy is aligned with the Government of Canada’s trade objectives
13

EDC BUSINESS VOLUMES IN EUROPE (2006-2010, $ millions)
14
2006 2007 2008 2009 2010 YTD0
1000
2000
3000
4000
5000
6000
7000
8000
9000
10000
6218 6306
7367
8709
9444
8709
9444

EDC BUSINESS VOLUMES IN EUROPE (2010)
Country CIB FIN ST Grand TotalAUSTRIA 8,364,115 55,678,374 111,805,320 175,847,809BELGIUM 2,475,330 112,055,039 225,295,406 339,825,776CZECH REPUBLIC 3,094,094 635,134 38,178,645 41,907,872DENMARK 1,899,180 134,812,713 136,711,893FINLAND 1,369,555 102,852,038 104,221,592FRANCE 20,269,777 45,105,317 838,552,173 903,927,267GERMANY 15,534,453 254,838,633 879,665,350 1,150,038,437GRENLAND 198,504 198,504HUNGARY 40,116,421 20,429,167 60,545,588ICELAND 237,699,093 6,908,319 244,607,411IRELAND 1,757,340 1,913,957 61,932,011 65,603,308ITALY 7,788,650 4,019,746 806,233,998 818,042,394LIECHTENSTEIN 19,552 19,552LUXEMBOURG 3,222,625 60,307,742 340,595,526 404,125,893MALTA 1,625,556 1,625,556MONACO 519,639 519,639NETHERLANDS 78,176,251 186,849,908 512,019,791 777,045,950NORWAY 94,317 3,000,000 51,342,839 54,437,156POLAND 3,462,376 82,391,120 53,111,088 138,964,585PORTUGAL 1,520,024 1,000,000 57,865,502 60,385,526SLOVAK REPUBLIC 17,388,637 8,640,514 26,029,151SPAIN 7,452,220 269,137,301 539,538,777 816,128,298SWEDEN 5,070,743 1,150,000 124,817,173 131,037,916SWITZERLAND 417,904 71,630,067 203,621,749 275,669,720UNITED KINGDOM 37,834,638 512,209,609 2,166,131,439 2,716,175,686
257,308,649 1,899,621,040 7,286,712,790 9,443,642,479
15

EDC BUSINESS VOLUMES IN EUROPE 2009
Country CIB FIN ST Grand TotalANDORRA 13,715 13,715AUSTRIA 4,476,290 14,842,672 114,319,823 133,638,785BELGIUM 2,633,507 234,819,269 237,452,776CZECH REPUBLIC 538,476 79,922,080 38,446,055 118,906,612DENMARK 1,297,349 95,141,536 96,438,885FINLAND 15,915,842 65,919,680 81,835,522FRANCE 66,973,328 27,584,173 892,801,210 987,358,711GERMANY 16,674,080 245,434,784 667,020,564 929,129,428HUNGARY 87,192,820 25,308,880 112,501,700ICELAND 508,812,610 9,501,503 518,314,113IRELAND 2,811,517 2,459,090 90,931,233 96,201,840ITALY 18,942,854 323,680 855,726,014 874,992,548LIECHTENSTEIN 10,873 10,873LUXEMBOURG 5,144,669 172,606,296 177,750,965MALTA 4,760,775 4,760,775MONACO 1,609,993 1,609,993NETHERLANDS 145,129,901 587,209,698 390,799,778 1,123,139,377NORWAY 1,352,524 47,330,363 48,682,886POLAND 1,185,230 35,341,438 36,526,669PORTUGAL 5,202,750 1,000,000 49,182,886 55,385,636SLOVAK REPUBLIC 148,731 8,859,957 9,008,688SPAIN 29,617,886 168,800 501,904,762 531,691,448SWEDEN 6,257,391 233,531,290 121,180,895 360,969,576SWITZERLAND 689,412 62,708,506 232,970,118 296,368,036UNITED KINGDOM 415,672,179 154,338,958 1,306,401,075 1,876,412,212Grand Total 740,663,916 2,005,529,160 5,962,908,693 8,709,101,769
16

EDC SOLUTIONS
CI: Credit InsuranceFIN: FinancingCIB: Contract Insurance and BondingPRI: Political Risk Insurance
2009 CAD billions
Risk of not getting paid …………………………. CI $ 58.7 (70.9%)
Need financing for themselves
or their buyer …………………………………….FIN $ 11.9 (14.4%)
Need to guarantee their
performance …………………………………….CIB $ 9.6 (11.6%)
Risk of losing their investment
abroad …………………………………………... PRI $ 2.6 (3.1%)
$ 82.8
Exporters’ risks to be mitigated orneeds to be met:
17

ACCOUNTS RECEIVABLE INSURANCE (covers exporters against non-payment of their short-term export receivables)
Major benefits:
covers 90% of losses when foreign buyers don’t pay
increases working capital by using it as collateral against operating lines
allows exporters to offer more competitive payment terms and accept larger orders
improves balance sheet positions by freeing up capital normally provisioned for losses
increases market penetration opportunities with EDC-backed credit decisions
source of market/buyer intelligence
And when the unexpected happens …
… EDC paid CAD 83 million in ARI claims in 200818

CONTRACT INSURANCE & BONDING SERVICES
19
EDC provides a guarantee to your bank so it can issue guarantees to your customers and suppliers
EDC shares the risk with your surety company
Protect yourself from wrongful calls
Get bonds without tying up cash
www.edc.ca/bonding

POLITICAL RISK INSURANCE
20
Coverage for various political risks
Protects your assets, investments from certain political events
Increases access to cash from financial institution
Helps attract additional project capital
www.edc.ca/pri

FOREIGN BUYER FINANCING
21 www.edc.ca/financing
Direct financing to your foreign customer
Loan or guarantee to another financial institution
Lines of credit
Flexible financing options for foreign buyers
EDC assumes risk of non-payment

FINANCING FOR INVESTMENT IN CANADA
EDC can look at providing European investors to Canada financing for that investment where:
The European investor will remain actively involved in the operations of the Canadian subsidiary
> 50% of the output of the Canadian operation will be exported from Canada
Benefits to Canada including employment, research & development, environmental benefits and revenue are present
22

BENEFITS OF PARTNERING WITH EDC
EDC can add valuable capacity and flexibility to your financing packages
Because EDC is an ECA, its borrowers may benefit from elements such as withholding tax exemption
As an ECA, EDC may be able to co-lend with other ECAs and in longer-tenor, ECA specific tranches of debt packages
EDC has many reinsurance partners that enable us to front insurance policies of varying size and scope
23

CONTACT DETAILS OF OUR EUROPE TEAM :
Klaus HoubenSenior Regional Manager Europe, EDC RepresentationTel.: + 49 (0) 211 17217 45Mobile: + 49 (0) 151 5381 6672Email: [email protected]
Charles EdgeworthRegional Manager Europe, HQ OttawaTel.: + 1 613 597 8613Mobile: + 1 416 272 8294Email: [email protected]
Anna WozniakCoordinator Europe, EDC RepresentationTel.: + 49 (0) 211 17217 46Mobile: + 49 (0) 151 5381 2048Email: [email protected]
2424