overview of energy efficiency policies and trends at world ... · overview of energy efficiency...
TRANSCRIPT

Overview of energy efficiency policies and trends at world level
Practical actions for accelerating energy efficiency Manille 7th June 2016
Dr Didier Bosseboeuf (ADEME, France) General secretary of the WEC energy efficiency policies Knowledge network

Content
CCEE-ADB Manille 7 June 2016 2
The WEC-ADEME Project implementation
Energy efficiency policies implementation over the world
Does it work? Energy efficiency trends at world level
The 10 WEC recommendations: To be updated?

Project implementation
3
To facilitate the exchange of information among WEC
membres, 4 activities are developped during the
round 2013-2016:
Survey on energy efficiency policies (95 countries covered))
Management of 2 data bases : P&M and EE indicators
http://www.worldenergy.org/data/energy-efficiency-policies-and-
measures/
http://www.worldenergy.org/data/efficiency-indicators/
In depth evaluation of 3 selected policies case studies
Dissemination and reporting (regional workshops, final report
for the world WEC congres (Istambul Nov 2016),

Link between indicators and policies and measures
4
Target
Introduction of quantitative objectives per country (targets of energy efficiency programmes or in relationship with indicators
Target
Summary of all programmes and targets by country in PDF format related to the selected indicator
CountryName of the program/law sector nature of target target value target year
BulgariaNational Long Term Energy Efficiency Program, 2005-2015
Final
consumers Energy intensity reduction -8% 2015
Bulgaria National Long Term Energy Efficiency Program, 2005-2016 Overall Energy intensity reduction -17% 2015
Czech Rep State Energy Policy Overall Energy intensity reduction 3,22% 2030
FranceEnergy law (2005-781)- Loi POPE
Final
consumers Energy intensity reduction -2%/year 2010
FranceEnergy law (2005-781)- Loi POPE
Final
consumers Energy intensity reduction -2,5%/year 2015
Germany Coalition agreement Overall Energy intensity reduction 3%/year 2020
Hungary Energy Saving and Energy Efficiency Action Programme 1999-2010 Overall Energy intensity reduction 3,5%/year 2010
LithuaniaNational Energy Strategy
Overall
Energy intensity reduction EU average
intensity 2025
Romania National Strategy for Energy Efficiency (2004-2015) Overall Energy intensity reduction 40% 2015
Sw edenEnergy Bill
Final
consumers Energy intensity reduction 20% 2020
Russia Energy Strategy of the Russian Federation (2009) Overall Energy intensity reduction -40% 2020
Canada ecoENERGY Industry Energy intensity reduction
China 11th Plan (2006-2010) Overall Energy intensity reduction -20% 2010
China Policies for the Develpment of Iron and Steel industry (2005) Industry Energy intensity reduction -8% 2020
Hong Kong
(China)APEC Sydney Joint Declaration
OverallEnergy intensity reduction 25% 2030
Indonesia Energy conservation Plan 2005 Overall Energy intensity reduction 1%/year 2025
Taiw an, China Energy eff iciency and conservation programme Overall Energy intensity reduction 20% 2015
Jordan National Energy Strategy Overall Energy intensity reduction 20% 2020
Tunisia Four Year Energy Conservation 2008-2011 Overall Energy intensity reduction -3%/year 2008-2011

95 countries covered based on - a survey for 53 countries and
- a review of horizontal sources for 42 additional countries. Less than half of these countries belong to OECD
WEC - Overview of energy efficiency policies 5
Latin America: 11 Africa:21
Middle East : 11
Asia Other : 12
Europe: 32 CIS: 3
North America: 2
Asia OECD : 3
World overview of energy efficiency policies

Case studies on in-depth evaluation of selected policies
6
Objectives : In depth analysis (based on ex-post evaluation) of good practices.
Review of literature
Compilation of 8 countries with half of non OECD countries.
30-40 pages report for each of the case studies + recommendations
2 pages description of each of the national policies in a common format
Each case study summarized into the overall report A powerpoint presentation will be available
Each report put in the WEC website completing the existing portofolio of
around 40 case studies
1. P&Ms to accelerate the penetration of Efficient Electric motors (Motiva Finland)
2. Implementation of Building codes in emerging countries (Ecotech, Lebanon)
3. Energy efficiency information centers and one stop shop building (ECEEE-Sweden)

Energy efficiency in WEC countries 7
Brazil: National Electricity Conservation Programme (PROCEL) – Industry
China: Minimum Energy Performance Standards (MEPS)/Energy label for motors
European Union: Ecodesign Directive sets requirements for electric motor systems
India: Voluntary energy labels for industrial electric motors
Indonesia: Promoting energy efficiency through system optimization and energy management standards
Japan: Top-runner Programme
The Netherlands: Green Deal – Efficient electric motor systems
South Africa: Energy Efficient Motors Programme
South Korea: Mandatory Energy Audits
Switzerland: Competitive Tender Programme
The United States: MotorMaster+
Electric motors : List of case studies

Content
CCEE-ADB Manille 7 June 2016 8
The WEC-ADEME Project implementation
Energy efficiency policies implementations over the world
Does it work? Energy efficiency trends at world level
The 10 WEC recommendations: To be updated?

Measures covered in the survey
WEC - Overview of energy efficiency policies 9
Regulations:
– Minimum Efficiency Performance Standards (MEPS) and labels for electrical appliances, cars, buildings and electric motors;
– Regulations for designated large consumers: mandatory energy audits, mandatory energy managers, mandatory energy saving plans, energy saving quotas;
– Mandatory training for professionals,
– Energy saving obligations for energy utilities.
Financial measures:
– Subsidies for audits by sector
– Low interest loans (i.e with subsidised interest rates) for energy efficiency investment and equipment by sector and type of equipment
Fiscal measures:
– Tax credit for efficient equipment, and tax on inefficient appliances
– Accelerate depreciation by sector,
– Tax reduction for efficiency investment by type of tax and equipment

50 countries have an energy efficiency law (+ 4 under development)
10
This is more than in 2012 when less than 40 countries had such a law.
Source: WEC energy efficiency policy data base 2015: world overview
Countries with an energy efficiency law

11
Main quantitative targets by end-use sector
0%
20%
40%
60%
80%
100%
Europe America Total Africa & MiddleEast
Asia
Residential Industry Services Transport
In Asia, industry is the main sector targeted (40% of sectoral targets)
There are 10 countries in Europe with sectoral targets, 6 in Africa-Middle East, 5 in
Asia, and 4 in America.
Source: WEC survey 2015
On average more than half of sectoral targets are in the households sector, and around 21% in industry sector.

12
For about 3/4 of them, the target is on the total primary energy consumption .
Half of countries have sectoral targets on end-use sectors, and about 28% on the total final energy consumption. (more in Europe).
0%
20%
40%
60%
80%
100%
Asia Africa & MiddleEast
Europe America Total
Primary Final consumption End-use sectors Energy Suppliers
Quantitative targets by type
Source: WEC survey 2015
Around 90% of countries have a quantitative target

There is a dominant share of regulations in the energy efficiency measures
implemented in the surveyed countries (more than 50% of measures on
average in 2015) with however a declining role since the last survey.
Other measures are spreading.
Distribution of measures by type
20
09
20
12
20
15
20
09
20
12
20
15
20
09
20
12
20
15
20
09
20
12
20
15
20
09
20
12
20
15
20
09
20
12
20
15
20
09
20
12
20
15
20
09
20
12
20
15
Africa Middle East Europe Asia other LatinAmerica
Total Asia OECD NorthAmerica
0%
20%
40%
60%
80%
100%Regulation Financial Fiscal Others*
*Others correspond to voluntary agreements, ESCO and certification
Source: WEC survey 2015 WEC-Manila-6th June 2016

Regulation are important in services and for households (appliances, building codes
& certificates).
Financial incentives are more important in industry and transport (e.g. grants for
energy audits)
Fiscal incentives are shared between households and transport
Distribution of measures by sector
0%
20%
40%
60%
80%
100%
Household Services Industry Transport
Financial Fiscal Regulation Others
Source: WEC survey 2015
WEC-Manila-6th June 2016

Around 80% of countries with labels (or planned )
The number of mandatory labels for households equipment is above 20 in 8 countries ( e.g. Brazil,
Chile, Japan and and New Zealand). In total 40 countries have more than 10 labels (EU countries,
China, South Korea, North America, Costa Rica).
15 Source: WEC energy efficiency policy data base 2015: world overview
Number of mandatory labels for households equipment
Energy efficiency labels are important to guide consumers and motivate manufacturers on energy efficiency products

Examples of labels: case of Air Conditioning
16 Saudi Arabia Singapour
Greece India Ghana
Brazil
China

MEPS for households refrigerators are mandatory in 51 countries and planned in 29 countries. For
AC, MEPS are mandatory in 33 countries and planned in 29 countries. MEPS are often linked to
label classes.
17 Source: WEC energy efficiency policy data base 2015: world overview
Minimum Energy Efficiency Performance Standards (MEPS) for refrigerators
Labels are not sufficient to transform the market. They are the first step but need to be complemented with MEPS to remove inefficient equipment
0%
10%
20%
30%
40%
50%
60%
70%
80%
90%
100%
Africa & Middle East Asia Europe Total America
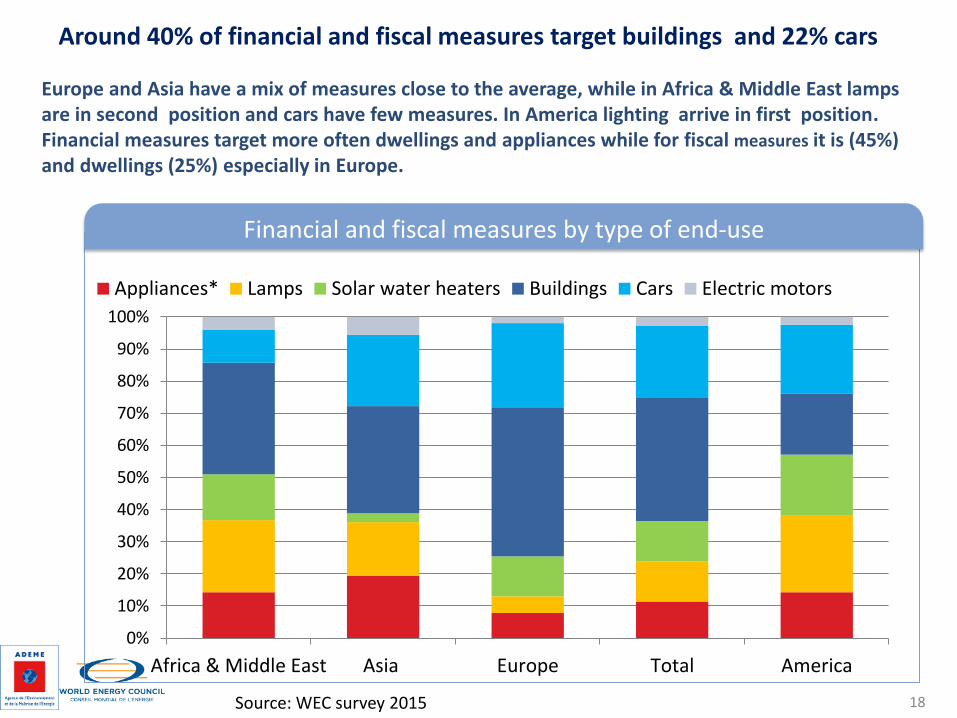
Appliances* Lamps Solar water heaters Buildings Cars Electric motors
Europe and Asia have a mix of measures close to the average, while in Africa & Middle East lamps are in second position and cars have few measures. In America lighting arrive in first position. Financial measures target more often dwellings and appliances while for fiscal measures it is (45%) and dwellings (25%) especially in Europe.
18
Financial and fiscal measures by type of end-use
Source: WEC survey 2015
Around 40% of financial and fiscal measures target buildings and 22% cars

Among financial measures, subsidies are dominant, except in Africa and Asia, and
represent on average 50% of financial measures, followed by soft loans (33%)
Distribution of financial measures by type and world region
0%
20%
40%
60%
80%
100%
Africa Asia Europe America Total
Energy audit Subsidies Soft loan
Tax reduction Tax credit Tax on inefficient equip.
Accelerated depreciation
Source: WEC survey 2015 WEC-Manila-6th June 2016

Content
CCEE-ADB Manille 7 June 2016 20
The WEC-ADEME Project implementation
Energy efficiency policies implementation over the world
Does it work? Energy efficiency trends at world level
The 10 WEC recommendations: To be updated?

Energy efficiency in WEC countries 21
Avoided energy consumption from energy intensity decrease at world level
0
2000
4000
6000
8000
10000
12000
14000
16000
18000
2000 2001 2002 2003 2004 2005 2006 2007 2008 2009 2010 2011 2012 2013 2014
Gto
e
Consumption Negajoules
* Negajoules = avoided consumption; it is calculated as the difference between a fictive consumption at 2000 (o r 1990) energy intensity and the actual energy consumption.
Compared to 1990, the avoided consumption reached 6,1 Gtoe in 2014 These energy productivity improvements since 2000 avoided 7 Gt CO2 at world level in 2014 (13,8 Gt since 1990).
The reduction in the world energy intensity since 2000, avoided an energy consumption of 3.1 Gtoe in 2014, with China contributing for 40%

Energy efficiency in WEC countries 22
Primary energy intensity trends by region
-6%
-5%
-4%
-3%
-2%
-1%
0%
1%
2%
CIS China India OtherAsia
NorthAmerica
Africa Europe World AsiaOECD
LatinAmerica
Middle-East
%/y
ear
2000-2008 2008-2014 2000-2014
At world level, the energy intensity decrease slowed down from 1.6%/year between 2000 and 2008 to 1.3%/year since 2008.
The world economic crisis lowered the energy productivity improvement in most regions

Energy efficiency in WEC countries 23
Contribution of sectors to primary energy intensity (2014)
0.0
0.5
1.0
1.5
2.0
2.5
3.0
CIS China Africa MiddleEast
World NorthAmerica
India AsiaOECD
OtherAsia**
LatinAmerica
Europe EU
Euro
pe
=1
Industry Transport Buildings & agriculture Transformation Non-energy uses
* Energy consumption per sector related to GDP measured at purchasing power parities ** data for 2013
The high contribution of the energy transformations and industry explains part of the higher energy intensity of CIS, China and Middle-East (transformations: 40% in CIS, 35% in Middle-East & China ; industry ~ 33% in China). In Africa, the dominant use of low efficiency biomass in the residential sector explains the dominant of the building sector and this its high intensity.
Structure of GDP explains part of discrepancies of energy intensity among countries

Energy efficiency in WEC countries 24
Structural changes of GDP in final energy intensities (2000-2014)
-6%
-5%
-4%
-3%
-2%
-1%
0%
1%
2%
CIS World NorthAmerica
AsiaOECD
LatinAmerica
Europe MiddleEast
Africa India China
%/y
ear
Actual At constant structure Structural changes
Changes in the GDP structure explain around 1/4 of the final energy intensity decrease in Africa and around 20% in India and China, due to an increasing importance of services in the GDP (+4 points in Africa, +12 points in India and + 5 points in China).
In CIS, structural changes contributed to increase the final energy intensity.
Services are on average 6 to 7 times less intensive than industry (11 times in India).

Energy efficiency in WEC countries 25
Energy consumption of industry per unit of value added*
*: Based on intensities at purchasing power parities in koe/$2005 at ppp ** year 2013
Decrease in the energy intensity of industry everywhere except in Middle East (greater role of
energy intensive industries) : combined effect of energy efficiency gains and structural changes.
Large discrepancies among regions in trends and in value due to differences in energy efficiency
and industry specialisation: intensities around 2-2.5 higher in CIS or China than Europe but
stronger reduction .
0.0
1.0
2.0
3.0
4.0
5.0
Euro
pe
=1
2000 2014
Industry outlook

Despite the convergence of performance, there is sill a large gap between countries at similar process mix ; the distance to the benchmark shows the potential of improvement . Comparisons of specific consumption should be made at similar process mix as non electric steel is roughly 3 times more energy intensive than non electric process.
26
Russia
Argentina Brazil
India
China Australia
Japan France
Germany
Canada
UK South Korea
Indonesia USA
Saudi Arabia
Mexico
Turkey
EU
0.0
0.1
0.2
0.3
0.4
0.5
0.6
0.7
0.8
0.9
1.0
0% 10% 20% 30% 40% 50% 60% 70% 80% 90% 100%
toe/
t
% electric steel
Italy
Energy efficiency potential
Red line: world best practice
Benchmarking in industry should be made with comparable indicators
Average energy consumption per ton of steel (2014)

For road transport, decreasing trends of the unit consumption per car
equivalent in most countries thanks to energy efficiency improvement of
vehicles.
Energy efficiency in WEC countries 27
Consumption of road transport per car equivalent*
0.0
0.5
1.0
1.5
2.0
2.5
USA
Au
stra
lia
Ch
ina*
Ger
man
y
Mex
ico
Sou
th A
fric
a
Spai
n
Ind
ia
Fran
ce
Sou
th K
ore
a
Ru
ssia
Ital
y
Jap
an
Ind
on
esia
toe/
car
equ
ival
ent
2000 2013
*China year 2002 and 2013 1 bus = 15 cars ;1 truck and light veh = 4 cars; 1 two-wheelers = 0.15 car
Transport outlook

Due to policy measures, mainly efficiency or emission standards for new cars, as well as other tax incentives. And this trend will continue in the next decade given the existing standards.
Energy efficiency in WEC countries 28
Specific consumption of new cars
0
1
2
3
4
5
6
7
8
9
10
Fran
ce
Ital
y
EU
Jap
an UK
Ind
ia
Ger
man
y
Mex
ico
Ko
rea
USA
Can
ada
Au
stra
lia*
Ch
ina
l/1
00
km
1995 2000 2015 2020 2025
Source: ODYSSEE, EU Commission, IEA; ICCT
Rapid decrease of the specific consumption of new cars in most countries
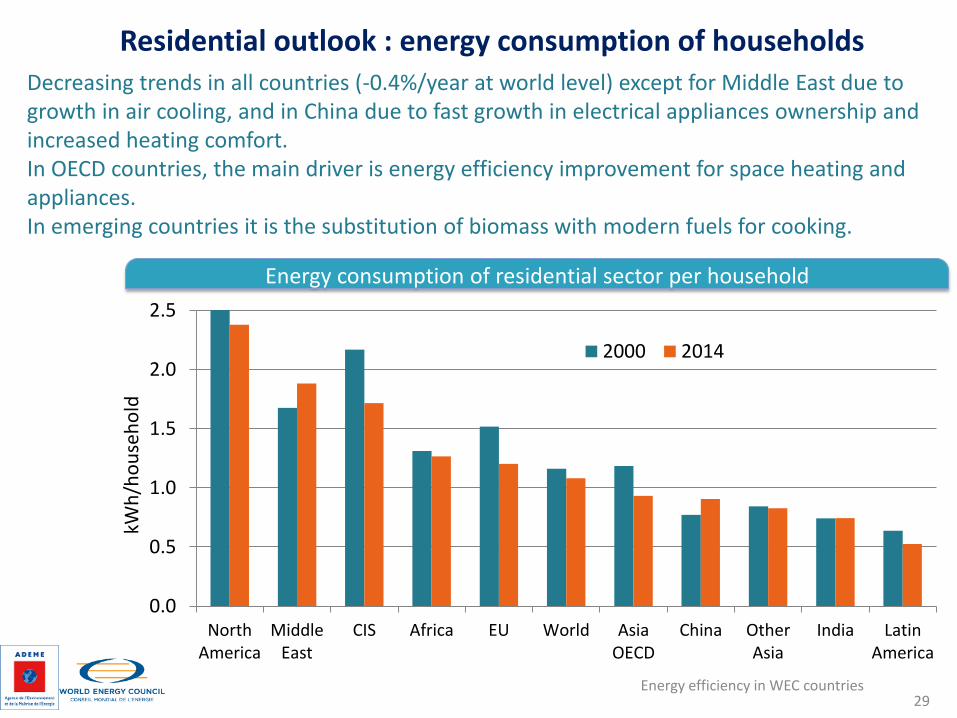
Decreasing trends in all countries (-0.4%/year at world level) except for Middle East due to growth in air cooling, and in China due to fast growth in electrical appliances ownership and increased heating comfort. In OECD countries, the main driver is energy efficiency improvement for space heating and appliances. In emerging countries it is the substitution of biomass with modern fuels for cooking.
Energy efficiency in WEC countries 29
Energy consumption of residential sector per household
0.0
0.5
1.0
1.5
2.0
2.5
NorthAmerica
MiddleEast
CIS Africa EU World AsiaOECD
China OtherAsia
India LatinAmerica
kWh
/ho
use
ho
ld
2000 2014
Residential outlook : energy consumption of households

Large discrepancies among regions in the electricity consumption per electrified dwelling (excluding heating use): from 8 000 kWh in North America to 1 000 kWh for India. There is no always correlation between electricity consumption per electrified dwelling and electricity price: for a same price level (for example 10 $c/kWh), the range of countries is quite large, from 1 300 kWh in Mexico to 7 900 kWh in USA.
30
Electricity consumption per electrified dwelling* and price of electricity (2014**) in G20
* Heating excluded **Electricity prices in 2013 for China and Argentina
Argentina
Australia
Brazil
Canada
China
Korea Japan
UK
Indonesia
Italy
Mexico
India
Germany Russia
Saudi Arabia
Turkey
USA
South Afr.
Saudi Arabia excluding AC
0
1000
2000
3000
4000
5000
6000
7000
8000
0.0 5.0 10.0 15.0 20.0 25.0 30.0 35.0
Ele
ctr
icity co
nsu
mp
tio
n/d
we
llin
g (
kW
h)
Price of electricity (Usc$05p/kWh)
France
Electricity price and consumption in households

Reduction in CO2 intensity everywhere. Most of this reduction was driven by energy intensity decrease (> 100% in Africa and world level; 87% in CIS and 70% in Europe); fuel substitutions contributing for the remainder. in Asia, fuel substitutions have offset part of the energy intensity reduction
Energy efficiency in WEC countries 31
Variation of CO2 intensity: impact of energy efficiency and fuel substitutions (2000-2014)
-4%
-3%
-2%
-1%
0%
1%
2%
India AsiaOECD
OtherAsia
Africa China World LatinAmerica
NorthAmerica
MiddleEast
CIS EU
%/y
ear
CO2 intensity Primary intensity Substitutions

The 10 WEC recommendations on EE policies (2013)
WEC - Overview of energy efficiency policies 32
1. Incentive prices
2. Sustainable institutional support for policies and involvement
3. Innovative financing at a limited cost for the public budget
4. Improving quality of EE equipment, services and practices
5. Regulations should be regularly strengthened, enforced and
expanded
6. For each end-use, address the implementation strategy with
packages of measures rather than single measures
7. Better address the situation of less developed countries
8. Address behaviours as much as technology
9. Need to monitor achievements and impacts of measures
10. Enhance international and regional cooperation : towards
regional policies and programmes

Thank you for your attention
visit us at :
http://www.worldenergy.org/data/ for EE indicators and policies at world level
http://www.odyssee-mure.eu/ for EE indicators and policies in Europe
http://www.cepal.org/drni/biee/ for UN-CEPAL Latin America (BIEE project)
http://www.ademe.fr