overview of north american cattle trade issues christie guinn master of agriculture seminar dr....
Post on 20-Dec-2015
217 views
TRANSCRIPT

Overview of North American Cattle Trade
Issues
Christie GuinnMaster of Agriculture SeminarDr. Rhonda Skaggs, Advisor

North American Beef and Cattle Trade
A Current PerspectiveDecember 2003

2002 Trade Statistics
In 2002, the total value of U.S. beef and cattle trade with Canada and Mexico was $4.12 billion. The U.S. was a net importer of beef and cattle products from Mexico and Canada, just as it has been for the past five years.
Figure 1. 2002 Total Value of U.S. Beef and Cattle Trade with Canada and Mexico
65.64%
34.36%
Imports from Mexico & Canada Exports to Mexico & Canada

North American Beef and Cattle Trade & NAFTA
Implementation of NAFTA led to changes in import policies of the three nations and elimination of tariffs on live cattle and beef
Beef and cattle trade between the U.S., Mexico, and Canada has increased since NAFTA was implemented in 1994
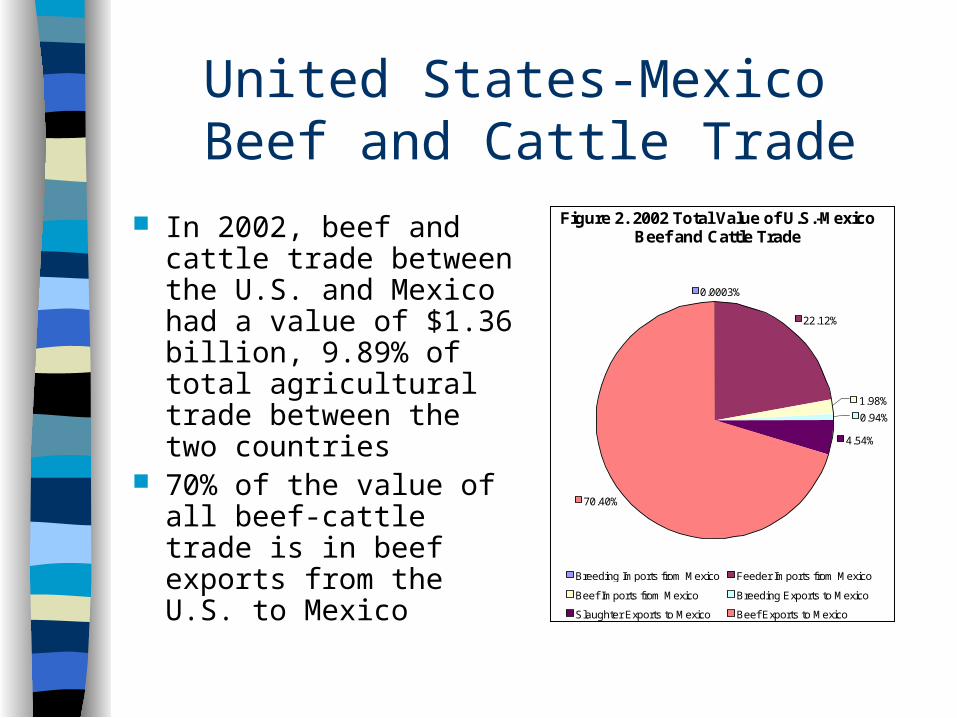
United States-Mexico Beef and Cattle Trade
In 2002, beef and cattle trade between the U.S. and Mexico had a value of $1.36 billion, 9.89% of total agricultural trade between the two countries
70% of the value of all beef-cattle trade is in beef exports from the U.S. to Mexico
Figure 2. 2002 Total Value of U.S.-Mexico Beef and Cattle Trade
0.0003%
22.12%
1.98%
0.94%
4.54%
70.40%
Breeding Imports from Mexico Feeder Imports from Mexico Beef Imports from Mexico Breeding Exports to Mexico Slaughter Exports to Mexico Beef Exports to Mexico

United States-Canada Beef and Cattle Trade
In 2002, U.S.-Canada beef and cattle trade was valued at $2.76 billion, 14.52% of total agricultural trade between the two nations
44.53% of the trade was in beef imports into the U.S. from Canada, while 40.91% was slaughter cattle imports into the U.S.
Figure 3. 2002 Total Value of U.S.-Canada Beef and Cattle Trade
0.67%
40.91%
44.53%
0.12%
1.69%
12.08%
Breeding Imports from Canada Slaughter Imports from Canada Beef Imports from Canada Breeding Exports to Canada Slaughter Exports to Canada Beef Exports to Canada

Beef Trade
Beef trade in North America was greatly influenced by the reduction in tariffs and policy changes resulting from NAFTA
Total North American beef trade in 2002 was 1.9 billion pounds; including hides the total value was $2.5 billion
In 2002, Mexico became the largest export market for U.S. beef, while Canada ranked 4th behind Japan and South Korea
Canada is the #1 source of beef imported into the U.S., followed by Australia and New Zealand

2002 Beef Trade
Exports of beef to Mexico from the U.S. accounted for 40% of beef trade in 2002, an increase of 132% from 1997
U.S. imports of beef from Canada increased 41% from 1997 and comprised 47.5% of 2002 beef trade
Figure 4. 2002 Total Value of U.S. Beef Trade with Mexico and Canada (Imports and Exports)
0.70%
47.50%
40.50%
11.30%
Imports from Mexico Imports from Canada Exports to Mexico Exports to Canada

Cattle Hide Trade
The U.S. trades cattle hides bilaterally with both Canada and Mexico
The most significant trade consists of exports to Mexico, which are assumed to be exported for manufacture into shoes and clothing
In 2002, U.S. cattle hide trade had a value of $200.7 million, with exports to Mexico accounting for 50% of the total trade
Figure 5. 2002 Total Value of U.S. Cattle Hide Trade with Mexico and Canada
(Imports and Exports) 1.37%
30.68%
50.81%
17.14%
Imports from Mexico Imports from Canada Exports to Mexico Exports to Canada
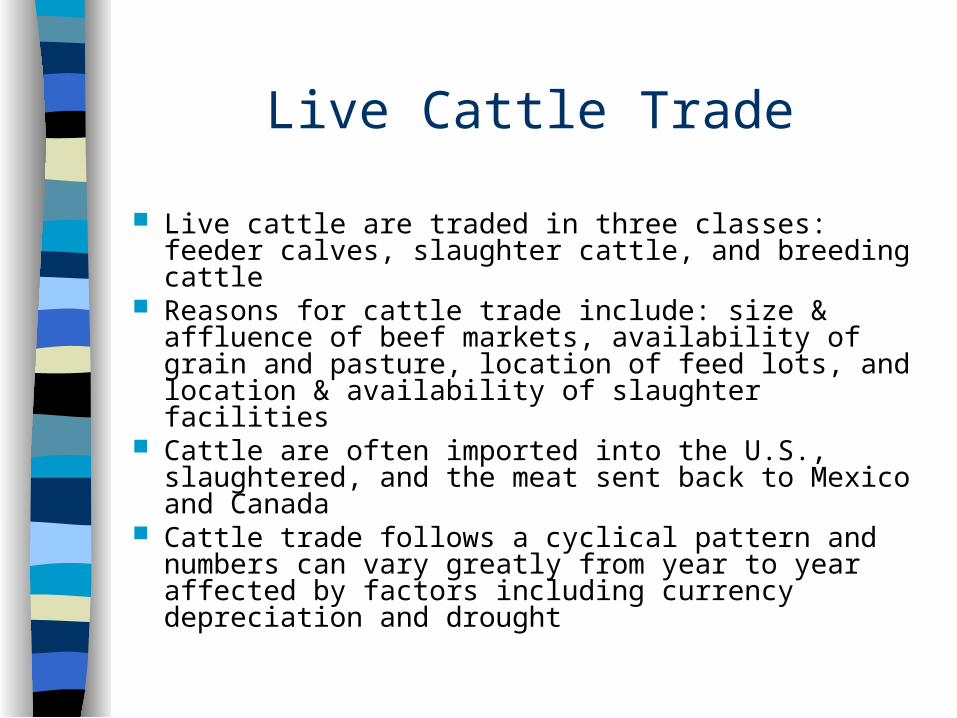
Live Cattle Trade
Live cattle are traded in three classes: feeder calves, slaughter cattle, and breeding cattle
Reasons for cattle trade include: size & affluence of beef markets, availability of grain and pasture, location of feed lots, and location & availability of slaughter facilities
Cattle are often imported into the U.S., slaughtered, and the meat sent back to Mexico and Canada
Cattle trade follows a cyclical pattern and numbers can vary greatly from year to year affected by factors including currency depreciation and drought

Cattle Trade and NAFTA
Although NAFTA led to significant increases in agricultural trade between the U.S. and Mexico, beef and cattle trade between the two countries was well established and saw dramatic increases for decades prior to NAFTA.
Figure 6. Total Annual U.S. Live Cattle Imports from Mexico (1961 - 2003)
0
200
400
600
800
1,000
1,200
1,400
1,600
1,800
1961 1963 1965 1967 1969 1971 1973 1975 1977 1979 1981 1983 1985 1987 1989 1991 1993 1995 1997 1999 2001 2003
He
ad
(1
,00
0s
)

2002 Live Cattle Trade
In 2002, the U.S. traded 2.7 million head of live cattle worth $1.57 billion with Mexico and Canada
Imports of 1.87 million head from Canada accounted for 61.51% of total trade
Imports from Mexico worth $300.5 million accounted for 29.78%
Figure 7. 2002 Total Value of U.S. Live Cattle Trade with Mexico and Canada
(Imports and Exports)
29.78%
61.51%
3.81% 4.90%
Imports from Mexico Imports from Canada Exports to Mexico Exports to Canada
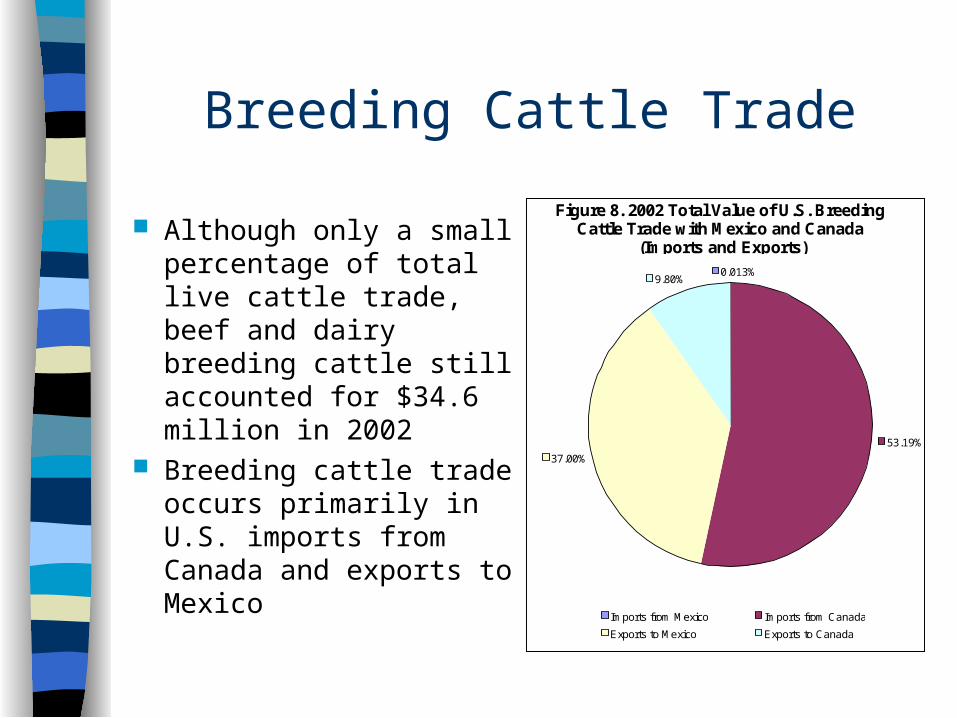
Breeding Cattle Trade
Although only a small percentage of total live cattle trade, beef and dairy breeding cattle still accounted for $34.6 million in 2002
Breeding cattle trade occurs primarily in U.S. imports from Canada and exports to Mexico
Figure 8. 2002 Total Value of U.S. Breeding Cattle Trade with Mexico and Canada
(Imports and Exports)
0.013%
53.19% 37.00%
9.80%
Imports from Mexico Imports from Canada Exports to Mexico Exports to Canada
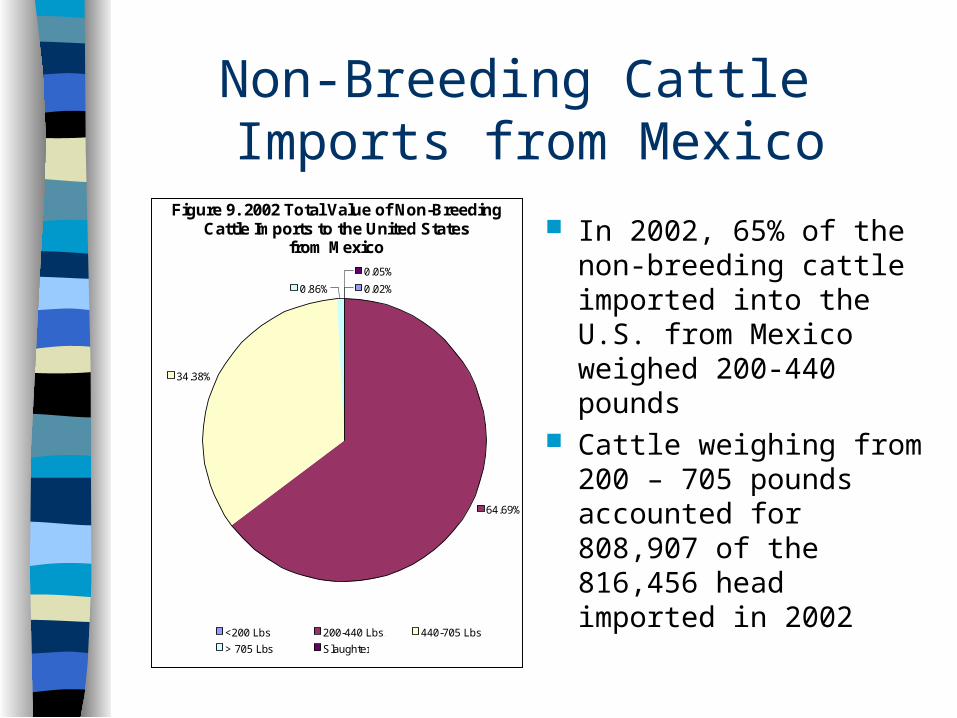
Non-Breeding Cattle Imports from Mexico
In 2002, 65% of the non-breeding cattle imported into the U.S. from Mexico weighed 200-440 pounds
Cattle weighing from 200 – 705 pounds accounted for 808,907 of the 816,456 head imported in 2002
Figure 9. 2002 Total Value of Non-Breeding Cattle Imports to the United States
from Mexico
0.02%
64.69%
34.38%
0.86% 0.05%
<200 Lbs. 200-440 Lbs. 440-705 Lbs. > 705 Lbs. Slaughter
Non-Breeding Cattle Imports from Canada
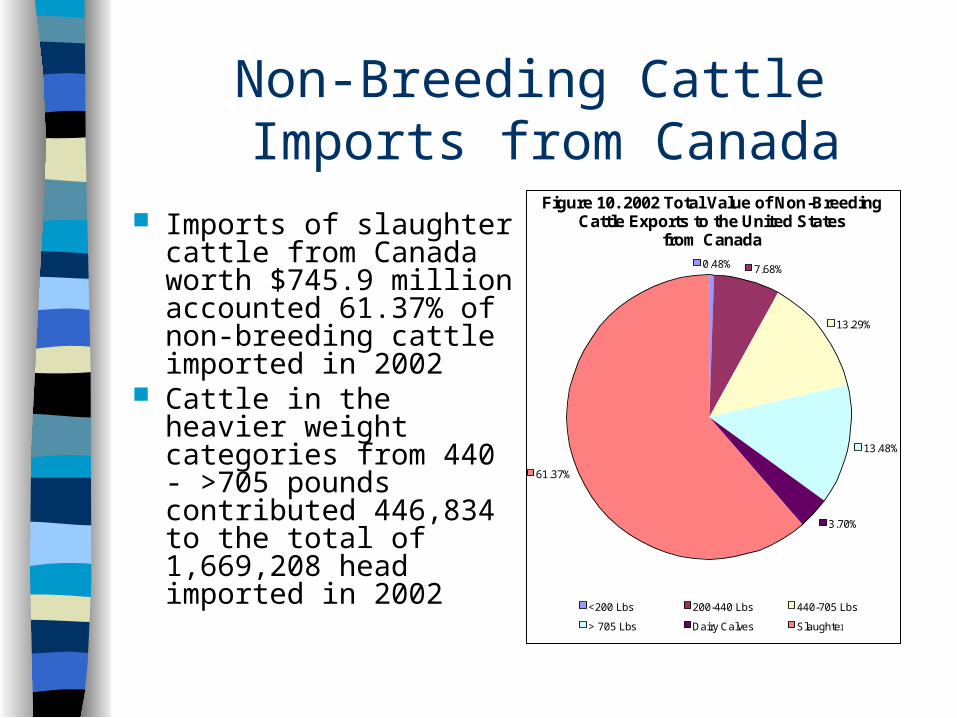
Imports of slaughter cattle from Canada worth $745.9 million accounted 61.37% of non-breeding cattle imported in 2002
Cattle in the heavier weight categories from 440 - >705 pounds contributed 446,834 to the total of 1,669,208 head imported in 2002
Figure 10. 2002 Total Value of Non-Breeding Cattle Exports to the United States
from Canada 0.48%
7.68%
13.29%
13.48%
3.70%
61.37%
<200 Lbs. 200-440 Lbs. 440-705 Lbs. > 705 Lbs. Dairy Calves Slaughter

Analysis of Imports from Mexico and Canada
Average weight of Mexican cattle imported into the U.S. is ~ 450 pounds
The cattle are fed in the U.S. to ~ 1200 pounds Thus, 2/3 of their final carcass weight was
acquired in the United States Average weight of Canadian cattle imported
into the U.S. is ~ 1200 pounds These cattle are fattened in Canada and
slaughtered shortly after entering the United States

Trade of Other Cattle Products
There is also trade of bovine genetic products between the United States, Mexico, and Canada
The majority of this trade involves bovine semen moving between the U.S. and Canada
In 2002, the U.S imported semen worth $13.6 million from Canada
U.S. exports of semen were valued at $3.8 million to Canada and $5.5 million to Mexico
Trade in bovine embryos is relatively small with a total value of $644,884 for U.S. exports and imports in 2002

Looking Toward the Future It is clear that the U.S., Mexican, and Canadian beef
and cattle industries will continue to evolve and face challenges in the future
Trade could become even more liberalized or new trade restrictions could be implemented
Increased protectionism could result from growing concerns about the potential animal and/or human health and economic impacts of diseases such as foot and mouth (FMD), bovine spongiform encephalopathy (BSE), and others
The growing and increasingly affluent North American population will continue to demand greater quantities of high quality beef products
Identification of BSE infected animals in Canada and the United States in 2003 dramatically affected trade in livestock products throughout North America

Live Cattle Imports by Port-of-Entry from Mexico into
the United States
Data and ModelsFebruary 2004

Focus of the Data Study
The study focused on the nine ports of entry with significant numbers of cattle imports. Monthly data by port was obtained from USDA-APHIS.
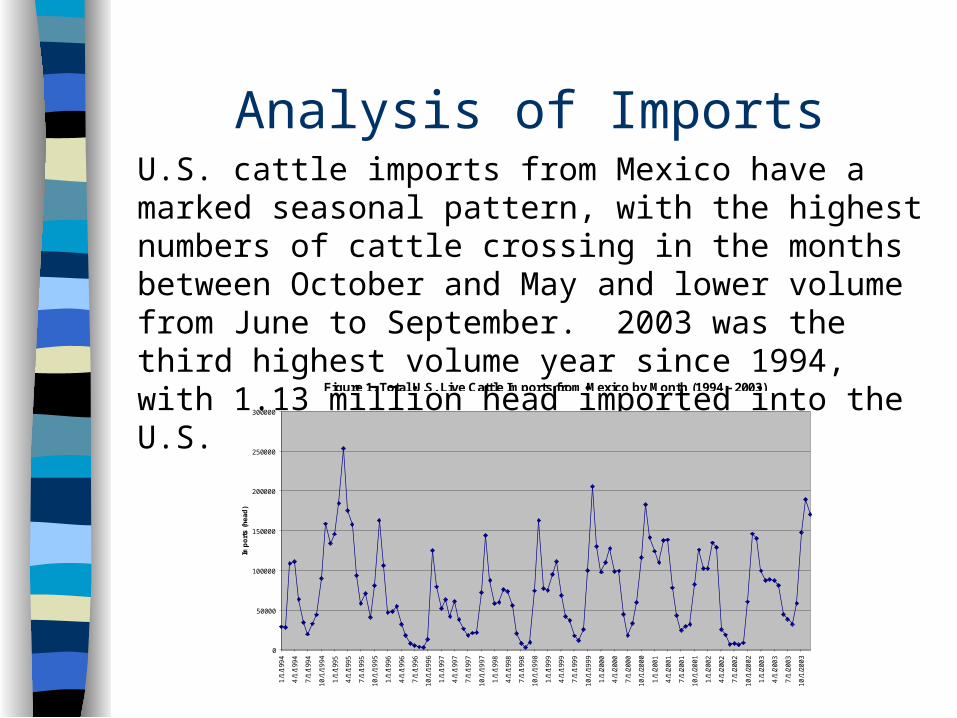
Analysis of ImportsU.S. cattle imports from Mexico have a marked seasonal pattern, with the highest numbers of cattle crossing in the months between October and May and lower volume from June to September. 2003 was the third highest volume year since 1994, with 1.13 million head imported into the U.S.
Figure 1. Total U.S. Live Cattle Imports from Mexico by Month (1994 - 2003)
0
50000
100000
150000
200000
250000
300000
1/1
/199
4
4/1
/199
4
7/1
/199
4
10
/1/1
99
4
1/1
/199
5
4/1
/199
5
7/1
/199
5
10
/1/1
99
5
1/1
/199
6
4/1
/199
6
7/1
/199
6
10
/1/1
99
6
1/1
/199
7
4/1
/199
7
7/1
/199
7
10
/1/1
99
7
1/1
/199
8
4/1
/199
8
7/1
/199
8
10
/1/1
99
8
1/1
/199
9
4/1
/199
9
7/1
/199
9
10
/1/1
99
9
1/1
/200
0
4/1
/200
0
7/1
/200
0
10
/1/2
00
0
1/1
/200
1
4/1
/200
1
7/1
/200
1
10
/1/2
00
1
1/1
/200
2
4/1
/200
2
7/1
/200
2
10
/1/2
00
2
1/1
/200
3
4/1
/200
3
7/1
/200
3
10
/1/2
00
3
Imp
ort
s (
he
ad
)

High Volume Ports of Entry
Ports with the highest volume of imports are Nogales, Santa Teresa, and Presidio
Although they are geographically separated, they share similar tends with respect to import volume
Figure 2. Santa Teresa, NM Live Cattle Imports (1994 - 2003)
0
10000
20000
30000
40000
50000
60000
70000
80000
1/1
/199
4
4/1
/199
4
7/1
/199
4
10
/1/1
99
4
1/1
/199
5
4/1
/199
5
7/1
/199
5
10
/1/1
99
5
1/1
/199
6
4/1
/199
6
7/1
/199
6
10
/1/1
99
6
1/1
/199
7
4/1
/199
7
7/1
/199
7
10
/1/1
99
7
1/1
/199
8
4/1
/199
8
7/1
/199
8
10
/1/1
99
8
1/1
/199
9
4/1
/199
9
7/1
/199
9
10
/1/1
99
9
1/1
/200
0
4/1
/200
0
7/1
/200
0
10
/1/2
00
0
1/1
/200
1
4/1
/200
1
7/1
/200
1
10
/1/2
00
1
1/1
/200
2
4/1
/200
2
7/1
/200
2
10
/1/2
00
2
1/1
/200
3
4/1
/200
3
7/1
/200
3
10
/1/2
00
3
Imp
ort
s (
he
ad
)

Low Volume Ports of Entry
Ports with lower volume of imports are: Douglas, San Luis, Columbus, Del Rio, Eagle Pass, and Laredo
These ports have more variability in the high and low volume months than the high volume ports
Figure 3. Laredo, TX Live Cattle Imports (1994 - 2003)
0
5000
10000
15000
20000
25000
30000
35000
40000
1/1
/199
4
4/1
/199
4
7/1
/199
4
10
/1/1
99
4
1/1
/199
5
4/1
/199
5
7/1
/199
5
10
/1/1
99
5
1/1
/199
6
4/1
/199
6
7/1
/199
6
10
/1/1
99
6
1/1
/199
7
4/1
/199
7
7/1
/199
7
10
/1/1
99
7
1/1
/199
8
4/1
/199
8
7/1
/199
8
10
/1/1
99
8
1/1
/199
9
4/1
/199
9
7/1
/199
9
10
/1/1
99
9
1/1
/200
0
4/1
/200
0
7/1
/200
0
10
/1/2
00
0
1/1
/200
1
4/1
/200
1
7/1
/200
1
10
/1/2
00
1
1/1
/200
2
4/1
/200
2
7/1
/200
2
10
/1/2
00
2
1/1
/200
3
4/1
/200
3
7/1
/200
3
10
/1/2
00
3
Imp
ort
s (
he
ad
)
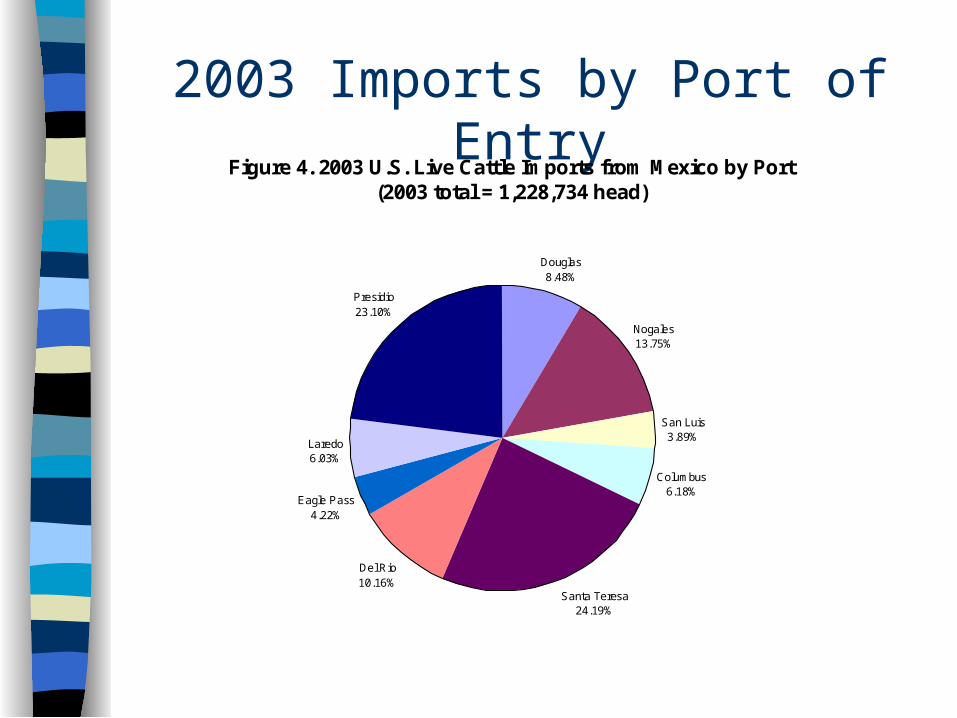
2003 Imports by Port of Entry
Figure 4. 2003 U.S. Live Cattle Imports from Mexico by Port (2003 total = 1,228,734 head)
Douglas 8.48%
Nogales 13.75%
San Luis 3.89%
Columbus 6.18%
Santa Teresa 24.19%
Del Rio 10.16%
Eagle Pass 4.22%
Laredo 6.03%
Presidio 23.10%

2003 Imports by Month
Figure 5. 2003 U.S. Live Cattle Imports from Mexico by Month (2003 total = 1,128,734 head)
0
20,000
40,000
60,000
80,000
100,000
120,000
140,000
160,000
180,000
200,000
January February March April May June July August September October November December
(he
ad
)
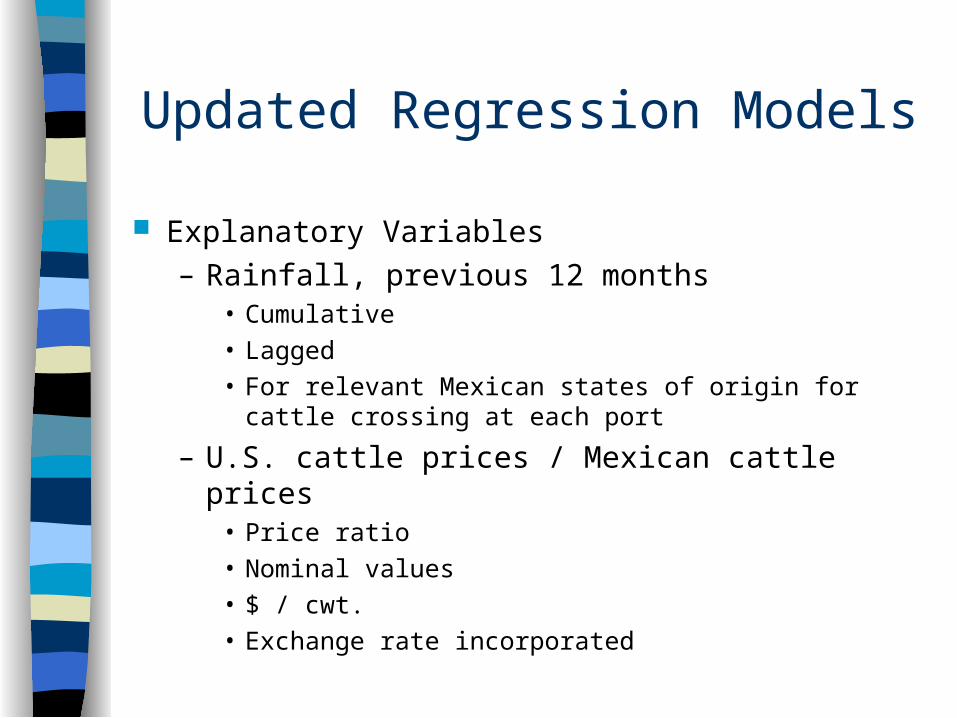
Updated Regression Models
Explanatory Variables– Rainfall, previous 12 months
• Cumulative• Lagged• For relevant Mexican states of origin for cattle
crossing at each port
– U.S. cattle prices / Mexican cattle prices• Price ratio• Nominal values• $ / cwt.• Exchange rate incorporated

Updated Regression Models
Explanatory Variables, Continued– Trend
• Linear (1 - 120)• Used for ports-of-entry with decreasing volume
– Monthly dummy variables• Low volume months = 0• Higher volume months = 1• Intercept shifter
Used stepwise regression to evaluate the monthly dummy variables

Results of Updated Models
SASTM estimation showed that the updated models explained at least 54% of the variability in monthly cattle crossings at each port
Relationship between the U.S. – Mexico live cattle price ratio and the independent variables was consistently positive
Rainfall variable coefficients were mostly negative and none were significantly different from zero
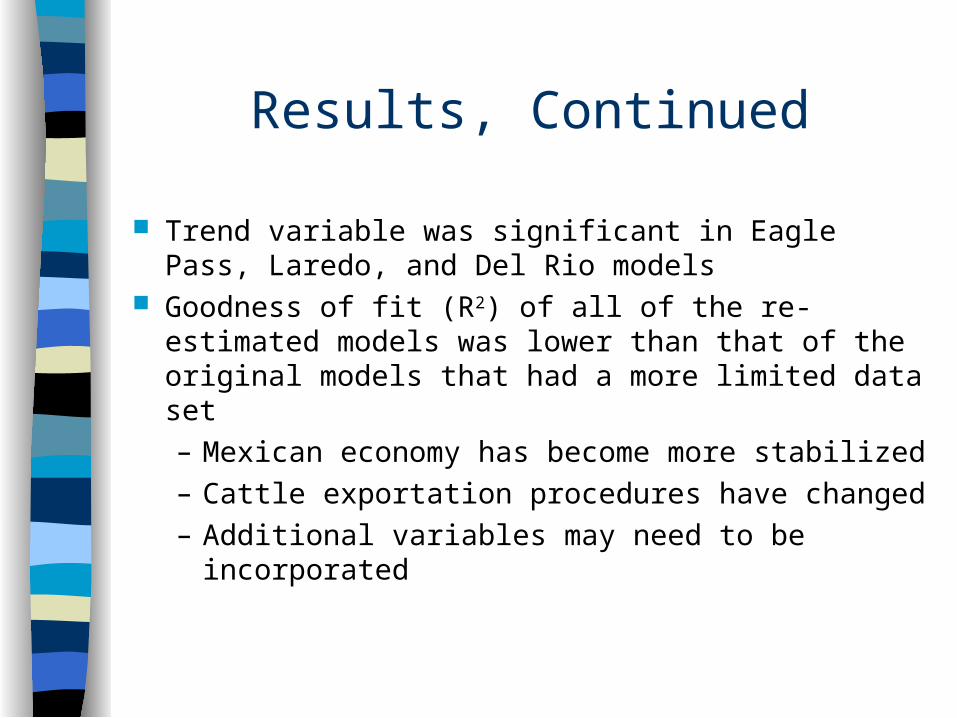
Results, Continued
Trend variable was significant in Eagle Pass, Laredo, and Del Rio models
Goodness of fit (R2) of all of the re-estimated models was lower than that of the original models that had a more limited data set– Mexican economy has become more
stabilized– Cattle exportation procedures have changed– Additional variables may need to be
incorporated

Summary & Conclusion
Econometric analysis of U.S. imports of Mexican cattle is limited by the amount and type of data available– Rainfall as a proxy for pasture conditions
Possibility of autocorrelation between variables Patterns of cattle trade could also be influenced
by infrastructure and institutional factors Future work on these models should be done
with a more expanded data set of at least 15 years & a national model could be developed