overview of statistical methodology used to develop eems...
TRANSCRIPT

Overview of Statistical Methodology Used to Develop EEMs for Broiler
Operations
3/14/2012

Outline of Presentation • Background of National Air Emissions Monitoring Study (NAEMS)
• Consent Agreement Requirements
• Broiler Emissions-Estimating Methodologies (EEMs) Development
• Charge questions to the Science Advisory Board
3/14/2012 1

Background of the NAEMS • Voluntary Consent Agreement
–Coordinated with several stakeholders
• Agreement’s goals are to: –Ensure compliance with applicable Federal
regulations –Monitor and evaluate AFO emissions –Promote a national consensus on methodologies for
estimating AFO emissions
3/14/2012 2

Monitoring Protocol • Developed through a collaborative effort involving numerous stakeholders
• Represents the opinions of the scientists, government experts, and stakeholders involved in the development process
• Designed to provide a framework for developing a comprehensive field sampling plan for collecting quality-assured air emissions data
• Sites were monitored in accordance with the –Quality Assurance Project Plan –Site Monitoring Plan
3/14/2012
3

Monitored Site Selection Process • Candidate farms were identified from those operations participating in the Consent Agreement
• Science Advisor selected farms based on a set of pertinent factors
• Final sites selected for the study were approved by EPA
• Broilers –West Coast site (California) –Southeast site (Kentucky)
3/14/2012 4

NAEMS Organization Structure • Agricultural Air Research Council
–Selected the Science Advisor and Independent Monitoring Contractor
• Independent Monitoring Contractor – Purdue University –Provided technical & administrative oversight
• Science Advisor – Dr. Al Heber –Identified potential farms to be monitored and drafted the
study’s quality assurance project plan –Provided oversight of the Principal Investigators
• Principal Investigators –Monitored selected sites
• US EPA –Interpreted data and developed emissions-estimating
methodologies 3/14/2012
5

Consent Agreement Requirements • The emission estimating methodologies will be used to determine and certify compliance with: –Clean Air Act permitting requirements –CERCLA and EPCRA reporting requirements
• All EEMS (for all animal sectors) will be finalized collectively
• The EPA is required to develop daily and annual emissions-estimating methodologies
3/14/2012 6

Broiler Industry • A vertically integrated industry • Production cycle
–Broiler houses are operated on an “all in-all out” basis and are cleaned between flocks
–Two phases • Grow-out: birds are raised to market weight • Clean-out: houses are cleaned before restocking
–Clean-out types • Decaking: upper layer of litter is removed and may be “top-
dressed” with fresh bedding • Full litter cleanout: all litter is removed and new bedding
added –Most common type of house is an enclosed, single floor,
mechanically ventilated structure with a compact soil floor covered with dry bedding
3/14/2012 7

Broiler EEMs Submitted to SAB for Review • Six pollutants: NH3, H2S, PM10, PM2.5, TSP, VOC
• Two sets of EEMs: –Grow-out periods –Litter clean-out periods
• Grow-out, three types of EEMs: – Inventory (I)
Data are routinely recorded by growers – Inventory and ambient (IA)
Data easily obtained from local meteorological stations – Inventory, ambient, and confinement (IAC)
Data that would require installation of an on-site monitoring system for confinement house parameters
• Clean-out, EEMs for two types of activities: –Decaking –Full litter clean-out
3/14/2012 8

EEM DEVELOPMENT
3/14/2012 9

Grow-out Period EEM Input Daily predictor variables for example
–Number of birds = 25,000 –Flocks since full cleanout = 3 –Mass per bird = 2.3 kg –Temperature = 25 °C –Relative humidity = 39 % –Pressure = 101 kPa
3/14/2012 10

Grow-out Period EEM Output • Daily emissions point prediction (kg) • 95% prediction interval (lower and upper bounds, kg)
NH3 emissions (kg) 3/14/2012
11

Overview of EEM Development Approach
3/14/2012 12

NAEMS Daily and Continuous Broiler Data
Category NAEMS Data
Animal Inventory
No. of birds Avg. weight (kg) Bird age (days)
Stocking density (kg/m2)
Ambient meteorology
Temperature (oC) Relative humidity (%)
Atmospheric pressure (kPa) Wind speed (m/s) Wind direction (o)
Solar radiation (W/m2)
Animal confinement
Temperature (oC) Relative humidity (%)
Fan operational status (on/off) Differential static pressure (Pa)
House ventilation flow rate (dscm)
Phase 1: Selecting Data Sets
3/14/2012 13

NAEMS Periodic Broiler Data Category Description
Mass balance
Incoming bedding
Addition rate Solids content (wet weight %)
Total Kjeldahl Nitrogen (TKN) content (wet weight %)
Litter in house Solids content (wet weight %) TKN content (wet weight %)
Sulfur content (wet weight %)
Litter removed at full clean-out
TKN content (wet weight %)
Solids content (wet weight %)
Decaked litter TKN content (wet weight %)
Solids content (wet weight %) Ash content (wet weight %)
Volume of litter produced (ft3)
Phase 1: Selecting Data Sets
3/14/2012 14

Selection of Broiler Predictor Variables for NH3
Full Dataset: • 1,211 Daily NH3 emissions observations • 8 candidate predictor variables
Completeness and Useability Assessment
Base Dataset: • 994 Daily NH3 emissions observations (~80%) • 8 candidate predictor variables
Cross-validation Dataset: • 217 Daily NH3 emissions observations (~20%) • 8 candidate predictor variables
Phase 1: Selecting Data Sets
NAEMS Data Submitted to EPA: • 1,279 Daily NH3 emissions observations • 15 candidate predictor variables
3/14/2012 15

Selected Broiler Predictor Variables Category Description
Abbreviated Variable
Name
House Inventory (I)
No. of birds birds
Avg. bird weight (kg) avem
Litter build-up buildup
Ambient Meteorology (A)
Temperature (oC) ta
Relative humidity (%) ha
Atmospheric pressure (Pa) pa
Confinement (C)
Temperature (oC) tc
Relative humidity (%) hc
Phase 1: Selecting Data Sets
3/14/2012 16

Normal Distribution Used for Emissions
Phase 2: Choosing the Probability Distribution
• For base data, the distribution was skew right
• For different conditions subset distributions more symmetric
3/14/2012 17

Functional Forms
• Highly variable emissions at lower bird mass
• Emissions decrease at high bird mass
• Cubic function of average bird mass best fit for the data
Phase 3: Developing Candidate Mean Trend Variables
18 3/14/2012

Main Effect Mean Trend Variables
Phase 3: Developing Candidate Mean Trend Variables
Original Predictor Functional Form Name
Litter build-up Indicator variable build
No. of birds Linear birds
Avg. bird mass (kg) Cubic polynomial avem, avem2, avem3
Ambient temperature (oC) Linear ta
Ambient relative humidity (%) Linear ha
Atmospheric pressure (Pa) Linear pa
Confinement temperature (oC) Linear tc
Confinement relative humidity (%) Linear hc
3/14/2012 19

Features Considered • Serial correlation
–Included Auto-regressive order 1 (AR(1)) covariance function
• Random effects of house and site –Not statistically significant
• Different variance under different conditions –No evidence supporting an increase in the variance with
increasing mean emissions –Variance difference for three sites could not be used in
application of EEM
Phase 4: Choosing the Covariance Structure
3/14/2012 20

Variable Selection
•Backward elimination based on p-values –Base data
•Corroborated by other fit statistics –Cross-validation data
Phase 5: Selecting Final Mean Trend Variables
3/14/2012 21

Final NH3 EEM Fit Statistics Fit Statistic I IA IAC
-2LL 3,811 3,676 3,522 BIC 3,815 3,684 3,531
% in PI 94 97 97 Width (kg) 14 13 13 RMSE (kg) 3.8 3.3 3.5
R2 0.81 0.85 0.84 γ0 (kg) -0.14 -0.23 -0.04 γ1 0.99 0.99 0.97
Phase 5: Selecting Final Mean Trend Variables
3/14/2012 22

Grow-out Period EEM Input
Daily predictor variables for example –Number of birds = 25,000 –Flocks since full cleanout = 3 –Mass per bird = 2.3 kg –Temperature = 25 °C –Relative humidity = 39 % –Pressure = 101 kPa
3/14/2012
23

Grow-out Period EEM Output • Daily emissions point prediction (kg) • 95% prediction interval (lower and upper bounds, kg)
NH3 emissions (kg) 3/14/2012
24

Daily NH3 Emissions for Grow-out Period
Phase 6: Producing Point and Interval Predictions
0
200
400
600
800
1000
1200
5/20/08 6/20/08 7/20/08 8/20/08 9/20/08 10/20/08 11/20/08 12/20/08 1/20/09 2/20/09 3/20/09 4/20/09 5/20/09
NH
3 Em
issi
ons
(lb)
Point Prediction for NH3 Emissions 95% Prediction Interval
3/14/2012 25
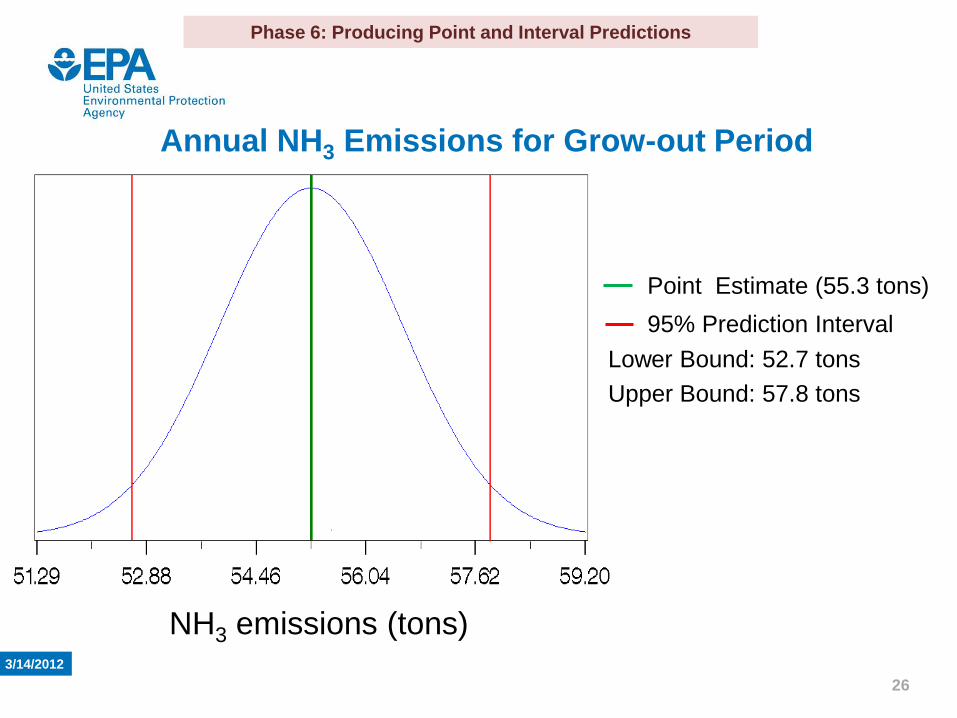
Annual NH3 Emissions for Grow-out Period
Point Estimate (55.3 tons) 95% Prediction Interval Lower Bound: 52.7 tons Upper Bound: 57.8 tons
Phase 6: Producing Point and Interval Predictions
NH3 emissions (tons) 3/14/2012
26

Overview of Clean-out Period Approach
3/14/2012 27
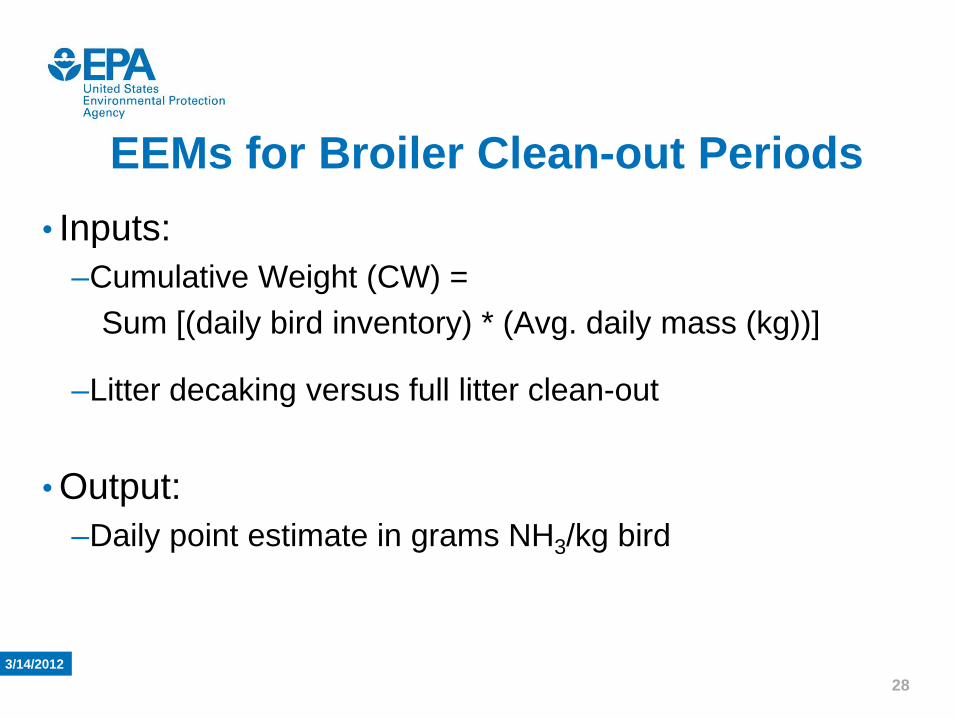
EEMs for Broiler Clean-out Periods • Inputs:
–Cumulative Weight (CW) = Sum [(daily bird inventory) * (Avg. daily mass (kg))]
–Litter decaking versus full litter clean-out
• Output: –Daily point estimate in grams NH3/kg bird
3/14/2012 28

Daily NH3 Emissions for Grow-out and Clean-out Periods
0
100
200
300
400
500
600
700
800
900
1,000
5/20
/200
85/
27/2
008
6/3/
2008
6/10
/200
86/
17/2
008
6/24
/200
87/
1/20
087/
8/20
087/
15/2
008
7/22
/200
87/
29/2
008
8/5/
2008
8/12
/200
88/
19/2
008
8/26
/200
89/
2/20
089/
9/20
089/
16/2
008
9/23
/200
89/
30/2
008
10/7
/200
810
/14/
2008
10/2
1/20
0810
/28/
2008
11/4
/200
811
/11/
2008
11/1
8/20
0811
/25/
2008
12/2
/200
812
/9/2
008
12/1
6/20
0812
/23/
2008
12/3
0/20
081/
6/20
091/
13/2
009
1/20
/200
91/
27/2
009
2/3/
2009
2/10
/200
92/
17/2
009
2/24
/200
93/
3/20
093/
10/2
009
3/17
/200
93/
24/2
009
3/31
/200
94/
7/20
094/
14/2
009
4/21
/200
94/
28/2
009
5/5/
2009
5/12
/200
95/
19/2
009
NH
3 Em
issi
ons
(lb)
Grow-out Decaking Full Litter Removal
Yearly Emissions: Grow-out: 55% Decaking: 29% Full clean-out: 16%
Clean-out
3/14/2012 29

Same Process Used for Other Pollutants
• H2S and PM10 data contained negative emissions values –Percent of total values that were negative = 1.1% for
H2S and 0.3% for PM10 –Negative numbers were not used in EEM
development • Different functional forms for average mass (i.e., exponential, quadratic) for some pollutants
• Only VOC data from Kentucky sites were used to develop the VOC EEM
3/14/2012 30

SAB CHARGE QUESTIONS
3/14/2012 31

Statistical Methodology • Statistical Methodology used to develop draft EEMs:
–The EPA considers this statistical methodology to be the best approach for analyzing the data and intends to use this same approach to develop draft EEMs for the egg-layers, swine and dairy confinement houses.
• Question 1: Please comment on the statistical approach used by the EPA for developing the draft EEMs for broiler confinement houses. In addition, please comment on using this approach for remaining animal types.
3/14/2012 32

Negative and Zero Data • EPA used the following general approach regarding inclusion of
negative and zero emissions values in our data set • The EPA evaluated whether the negative or zero values
represent the variability in emissions measurements due to the means of obtaining the measurements
• The EPA included zero values because these values potentially represent instances where the emissions from the source are zero
• The EPA reviewed the data to determine if data quality measures were properly performed according to the Quality Assurance Project Plan. If the data did not follow data quality measures, the EPA contacted the Science Advisor to determine if the corrected data could be submitted.
• Question 5: Please comment on the EPA’s approach for handling negative or zero emission measurements.
3/14/2012 33

Volatile Organic Compounds (VOC) Data
• The two broiler sites used different VOC measurement techniques. Based on our analysis of the measurement and analytical techniques used for the VOC data, the EPA decided to use only the VOC data from the Kentucky sites when developing the draft VOC emissions estimating methodology
• Question 7: Please comment on the approach EPA used to develop the draft broiler VOC emissions estimating methodology
3/14/2012 34