overview of the power sector - prsindia
TRANSCRIPT

OVERVIEW OF THE
POWER SECTOR
Prachee Mishra
September 2019
Country has surplus
generation capacity but deficits continue in some
regions
Capacity utilisation of thermal plants has declined
Discoms are in poor financial
health and have weak capacity to buy power
Electrification numbers have improved but the quality of
supply is questionable

INSIGHTS
Surplus generation capacity but deficits continue, capacity utilisation declining
Two years ago, the central government announced that India has become a power surplus country,
and all the villages have been electrified. However, since then, several issues have come up in the
sector, and a few others remain to be addressed.
The country continues to face both energy deficit and peak deficit, although at a marginal level. In
2017-18, energy deficit in the country was 0.7%, and peak deficit was 2%. However, the deficit
situation is exaggerated in certain states, and the north-eastern region, in particular.
The capacity utilisation of thermal power plants (also called Plant Load factor or PLF) has declined
from 78% in 2009-10 to 61% in 2018-19. Low PLF implies that thermal plants have been lying
idle, which could be due to non-availability of fuel, surplus capacity (in certain regions of the
country), low demand for power, or demand being met through other sources. One of the key
reasons behind poor capacity utilisation of thermal power plants is the planned shift in the energy
mix. With renewable energy seeing a push through government policies, its tariff has decreased
significantly. This poses a challenge to the existing thermal capacity, which is witnessing subdued
demand, and poor capacity utilisation as a consequence. The renewable energy market is still
developing. However, its growth trajectory may affect the thermal sector, where plants are already
operating at lower capacities and facing insolvency, in certain cases.
Capacity to buy still remains weak as discoms are in poor financial health
The poor financial health of discoms has a significant impact on the power sector. Their poor
finances imply that they are unable to buy power, and invest in the transmission and distribution
infrastructure (including investment for renewable energy). This affects retail consumers and
power producers. Consumers do not get good quality of power, and power producers are unable to
sell power in the market, thereby facing losses, and default on their loans.
As per the Standing Committee on Energy, as on June 2017, there were 34 stressed thermal power
plants with an outstanding debt of Rs 1.74 lakh crore. These thermal power plants are becoming
NPAs due to non-availability of coal at power plants, lack of long term power purchase agreements
with discoms, and failure of discoms in making timely payments. With respect to renewable
energy, the rapidly falling price of power generation due to technological advancements may pose
risk to projects which were set up earlier at higher costs. As per the Ministry of Power, the
aggregate overdue of discoms to all generators is Rs 54,599 crore, as on July 31, 2019.
While UDAY addressed the outstanding debt of discoms partially, they have not been able to
achieve all the goals they were mandated to, under the scheme. Aggregate Technical and
Commercial Losses (includes theft and billing issues) are at 20%, as opposed to the target of 15%
by 2018-19. The gap between cost of supplying power and the average revenue realised is Rs
0.25/unit, as opposed to the target of being eliminated. Note that one of the key reasons for this
revenue gap is the under-pricing of tariff for agricultural and residential consumers. Further, the
RBI has noted that UDAY will increase the liabilities of the states, who are taking on the losses of
the state discoms.
Rural electrification numbers have improved, but the quality of supply is questionable
In April 2018, the central government announced that all villages have been electrified. Under the
Saubhagya scheme, 18,374 households remain to be electrified as on March 31, 2019. However,
continuous supply of electricity continues to remain a challenge. Data also shows that about 53%
of the villages receive electricity for less than 12 hours in a day for domestic use. Further, supply to
rural areas has to be carried out by discoms, many of which are in poor financial health.

2
OVERVIEW OF THE POWER SECTOR
With India looking at rapid industrialisation and urbanisation over the next three decades, the
demand for power in the country is going to increase. The power generation situation in the
country has improved in the last few years. In June 2017, the Minister of Power announced that
India has become a power surplus country, with no shortage of electricity or coal.1 Currently, India
produces a majority of its energy from thermal sources. However, with the commitment to the
Paris Agreement (on climate change), there has been a push towards increasing the renewable
generation capacity in the country. With solar and wind power becoming cheaper, cleaner sources
of energy have also become affordable.
However, the sector continues to face several issues. Access to power and the quality of power
supplied to consumers is still poor. India also continues to face both energy deficit (0.7%) and peak
deficit (2%). The deficit situation is worse in certain states such as Jammu and Kashmir, and the
north-eastern states. Further, data shows that, in 2018, about 53% of the villages received
electricity for domestic use for less than 12 hours in a day.2 Despite all villages being electrified,
continuous supply of electricity continues to remain a challenge.
Another key issue is the poor financial health of the electricity distribution companies, which is
affecting their ability to buy power and improve the supply network. While their debt to banks was
addressed to a certain extent by UDAY, the debt they owe to power plants is also a concern. As per
the Standing Committee on Energy, as on June 2017 (post-UDAY period), there were 34 stressed
thermal power plants with an outstanding debt of Rs 1.74 lakh crore.3
These trends suggest that surplus power capacity, or electrifying villages may not imply continuous,
and good quality power supply across the country. In the first budget of the 17th Lok Sabha, the
central government mentioned that a package of power sector tariff and structural reforms will be
announced soon. In this context, this note looks at how the power sector is regulated, current status
of the power sector, key issues in the sector, recommendations on reforming the sector, and recent
policy developments in the sector.
POWER SECTOR IN INDIA
There are three primary segments in the electricity sector: generation, transmission and distribution.
Generation is the process of producing power using different fuels and is carried out in generating
stations (generation plants). Transmission utilities carry bulk power from the generation plants to
the distribution substations through a grid and at high voltages. Distribution utilities supply
electricity from the substations to individual consumers through a distribution network.
Distribution is the retail stage and operates at lower voltages. Figure 1 shows the overall structure
of the power sector.
Generation
In India, various sources of energy are used to generate power. These include coal, natural gas,
hydro, nuclear, and renewable (includes solar, wind, small hydro, biomass). As on December 2018,
the power generation capacity of the country is at 349 GW.4 In the last two decades, India’s
generation capacity has increased considerably. This increase is attributed to the delicensing of
power generation in 2003, which enabled unrestricted participation of private sector companies.
Today, private utilities generate 46% of the power in the country, followed by state utilities (30%),
and central generating utilities (24%).

3
Figure 1: Structure of the power sector
Coal accounts for a majority of power generation at 55%. Overall thermal power generation
(including coal, and natural gas) is at 64%. Renewable energy accounts for around 21% of the total
generation capacity. Hydro power accounts for 13% of generation and nuclear for 2%. Details of
all-India power generation capacity are provided in Figure 2 and Table 1 below. Power sector is the
largest user of coal. In 2017-18, 576 MT of coal was dispatched to the power sector (84% of the
total coal dispatched in the country).5
Figure 2: All India power generation
capacity (as on January 2019)
Sources: Ministry of Power; PRS.
Figure 3: Grid interactive renewable power
capacities (as on January 2019)
Sources: Ministry of New and Renewable Energy; PRS.
Table 1: Installed generation capacity in MW (as on January 2019)
Thermal
Nuclear Hydro
(renewable) Renewable
sources Grand total Coal Lignite Gas Oil Total
Total capacity
1,91,093 6,360 24,937 638 2,23,028 6,780 45,399 74,082 3,49,289
% of total capacity
54.7% 1.8% 7.1% 0.2% 63.9% 1.9% 13.0% 21.2% 100%
Sources: Ministry of Power; PRS.
Note: Small Hydro, and Hydro projects are classified as Renewable Sources.
64%
21%
13%2%
Thermal Renewable Hydro Nuclear
47%
34%
13%
6%
Wind Power Solar PowerBio Power Small Hydro Power
Energy sources
Generation
plants Transmission utilities
Distribution
utilities
Bulk consumers Small consumers
Power purchase cost
Transmission charges
Generation + Transmission + distribution O&M costs + depreciation + taxes
Charges/ Tariff Flow of energy/ power
Open access

4
Renewable energy
Renewable energy sources include wind, solar, bio power, and small hydro power. In March 2019,
the Union Cabinet announced that hydro power projects will be also classified as renewable energy
projects.6 Renewable sources could either be connected to the grid, or be off-grid systems. Off-
grid systems help in meeting the energy requirements of remote areas, and areas which are not
likely to be electrified in the near future. Examples of off-grid systems include biomass-based heat
and power projects, industrial waste-to-energy projects, and solar roof-top systems.
As of January 2019, the total grid-interactive renewable power capacity (excluding hydro) is at 74
GW.7 Hydro capacity is at 45 GW. The government has set a target of installing 175 GW of
renewable energy capacity by 2022 (excluding hydro).8 This includes 100 GW from solar, 60 GW
from wind, 10 GW from bio-power and 5 GW from small hydro power.9 Roughly, this would
translate into an average capacity addition of about 33 GW every year till 2022. Currently, the
capacity addition is at around 24 GW per year. Note that wind and solar power have a lower plant
load factor (PLF) than thermal power given the intermittent wind speed and sunlight, often
averaging at 20-25%. Therefore, renewable capacity addition needs to be higher than for thermal
plants to generate the same amount of electricity.
Figure 4 below shows the mode-wise electricity generation across several countries. Coal continues
to be the primary source of electricity in several countries. Few countries such as Brazil and
Canada generate most of their electricity from cleaner sources of energy such as hydro power.
Several countries such as Japan, Russia, UK and the US also generate a significant amount of gas-
based power, which is cleaner as compared to coal.
Figure 4: Gross electricity generation in various countries mode-wise (2015)
Sources: Central Electricity Authority; PRS.
Transmission
Transmission is carried out primarily by central and state companies and largely remains a
government controlled activity. The transmission segment was separated from the central
generation agency in 1989 and Power Grid Corporation of India (Powergrid) was set up. Powergrid
is responsible for the planning, implementation, operation and maintenance of inter-state
transmission system, and the operation of national and regional power grids.
The Electricity Act, 2003 allows for open access which enables consumers to buy power from any
power generating plant through non-discriminatory access to transmission and distribution lines, in
0%
20%
40%
60%
80%
100%
Aus
tral
ia
Bra
zil
Can
ada
Chi
na
Fra
nce
Ger
man
y
Japa
n
Kor
ea
Rus
sia
Sou
th A
fric
a
Uni
ted
Kin
gdon
Uni
ted
Sta
tes
Indi
a
Coal Hydro Gas Nuclear Oil Others

5
a manner specified by the respective state/state regulator. The National Load Despatch Centre
(NLDC) manages the scheduling and dispatch of electricity over inter-regional links in accordance
with grid standards, and monitors the national transmission grid. It is also the nodal agency
providing transmission access to the power exchanges. The Regional Load Despatch Centres
(RLDCs) manage the operation of the power system grid in the respective regions.
India’s transmission lines have grown at an average annual rate of 6.5% between 2007 and 2019
(till March 2019); substation capacity has grown during the same period at 11.2%.10,11 Inter-
regional transmission capacity has grown from 14 GW in 2007 to 95 GW till January 2019.12
Distribution
Distribution includes maintenance of the distribution network and retail supply of electricity to the
consumers. It is mostly carried out by state-owned distribution companies (discoms). However, in
cities such as Delhi, Mumbai, Ahmedabad, and Kolkata, private entities own the distribution
business. Discoms (or distribution licensees) purchase power from generation companies through
power purchase agreements (PPAs), and supply it to their consumers (in the area of distribution).
One of the key issues with the power sector currently is the poor financial situation of state
discoms. This has been affecting their ability to buy power for supply, and the ability to invest in
improving the distribution infrastructure. Consequently, this impacts the quality of electricity that
consumers receive.
Power consumption
India’s per capita power consumption was 1,149 kWh as on March 31, 2018.13 This consumption
has increased at an average annual rate of 4.6% since 1990. However, it is much lower as
compared to several other countries (see Figure 5). Across different categories, the consumption by
the agriculture sector in India is higher as compared to other countries. On the other hand, in India,
the consumption by the commercial sector is lower as compared to other countries (see Figure 6).
Figure 5: Per capita power consumption in 2015 (in kWh)
Sources: Central Electricity Authority; PRS.
0
4,000
8,000
12,000
16,000
Aus
tral
ia
Bra
zil
Can
ada
Chi
na
Fra
nce
Ger
man
y
Japa
n
Kor
ea
Rus
sia
Sou
th A
fric
a
UK
US
A
Indi
a*
Wor
ld

6
Figure 6: Category-wise consumption across countries (in 2015)
Sources: Central Electricity Authority; PRS.
Coal linkages and purchase of power
Coal linkages
In May 2017, the Ministry of Power announced a new scheme for coal linkages for thermal power
plants – Scheme for Harnessing and Allocating Koyala (Coal) Transparently in India (SHAKTI).14
Prior to this, coal was supplied to thermal power plants as per the National Coal Distribution Policy,
2007 (NCDP). Under this policy, a Standing Linkage Committee (under the Ministry of Power)
recommended the issuance of Letters of Assurance (LoAs) to power plants. LoA holders that met
certain milestones were entitled to enter into Fuel Supply Agreements (FSAs) with coal companies
for the long-term supply of coal. The new scheme SHAKTI, proposes to move towards an auction
based system for allocation of such linkages (except for central and state generation companies, and
certain exemptions provided in the Tariff Policy, 2016).
Under the scheme, thermal power plants with LoAs will be eligible to sign FSAs after ensuring that
the plants are commissioned, respective milestones are met, and all specified conditions of the LoA
are fulfilled within a specified timeframe. The plants must be commissioned before March 31,
2022. The linkages will be granted by Coal India Limited (CIL) or Singareni Collieries Company
Limited (SCCL). Future coal linkages will be granted as per the following:
i. Central and state generating companies: On the recommendation of the Ministry of Power;
ii. Independent power producers with Power Purchase Agreements (PPAs) (based on
domestic coal): On the basis of auction;
iii. Independent power producers without PPA: Auction where bidding for linkage will be
done over the Notified Price of Coal Company.
Power Purchase Agreements (PPAs)
PPAs are bilateral contracts between the procurers (discoms) and the generators (power plants).
Each PPA has specific terms and conditions setting out the rights and obligations of the generators
and the procurers. This includes the price at which electricity would be purchased, the mechanism
for adjustment of tariffs for select events, mutually agreed conditions for risk sharing and
termination of the PPAs. Typically, PPAs tend to be long-term in nature, i.e., around 20-25 years.
0%
20%
40%
60%
80%
100%
Australia Brazil Canada China Germany Japan Korea Russia SouthAfrica
UnitedKingdon
UnitedStates
India World
Industry Residential Agriculture/forestry Commercial and public services

7
REGULATORY STRUCTURE
With growth in the industrial and services sector in the 80s and the 90s, the power sector has
changed significantly. Regulatory changes during this period sought to increase private sector
participation in the sector, and bring in more competition and efficiency (more details in Table 2).
This resulted in the state owned electricity boards being restructured. The generation segment was
delicensed, and gradually witnessed increased private participation. Independent regulators were
set up at both the central and state level, and Appellate Tribunals were established to hear appeals
against these commissions.
Currently, the Electricity Act, 2003 is the primary law regulating the electricity sector. 27 State
Electricity Regulatory Commissions (SERCs), and the Central Electricity Regulatory Commission
(CERC) regulate inter-state and intra-state matters in generation, transmission, trading and
distribution of power. One of the key roles of the Commissions (typically SERCs) is to approve the
tariff for retail sale of electricity.
Tariff determination: Typically, electricity tariff consists of two parts: (i) Fixed Cost, and (ii)
Variable Cost. It is also called as Two Part Tariff.15 Fixed cost includes interest, depreciation,
operations and maintenance costs, return on equity (profit) and tax liabilities of power generation,
transmission and distribution network. The variable cost primarily includes fuel cost (cost of
electricity purchased from other utilities, cost of power lost in transmission and distribution, and
state levies such as surcharge, tax are also included in certain cases). Discoms/ utilities are required
to file their tariff petitions (annually) with the relevant SERC, who then approves such tariff based
on the specified criteria.
However, it has been observed in the past that state discoms do not necessarily work on market
principles, i.e., they do not price electricity to cover costs and reasonable profit. Many state-owned
discoms did not file tariff revision petitions for multiple years from 2003 to 2011.16 State discoms
in states such as Bihar, Karnataka and Punjab did not revise their tariff between 2008 and 2011, in
spite of an increase in the cost of electricity. During the same time period, the cost of power supply
in these states went up by 12%, 10%, and 29% respectively. In 2011, the Appellate Tribunal for
Electricity passed a judgment requiring SERCs to ensure that tariffs are revised in a timely manner
by discoms. Following the judgement, it was observed that between 2012 and 2014, more than 20
states revised their tariffs.17
Competition in retail supply of electricity: The 2003 Act also provides for multiple distribution
licensees to set up their own parallel network in the same area, thus allowing competition in the
distribution segment.18, Parallel licensing is when multiple licenses are issued to distribution
companies to supply electricity in a specific area of supply. However, the distribution segment has
not seen much private participation (barring a few areas like Mumbai, and Delhi). Setting up of a
new network requires significant capital investment and has acted as an entry barrier for new
participants.
Recently, there have been proposals to bring in more private sector participation in the power
distribution segment. The Electricity (Amendment) Bill, 2014, (which has now lapsed), and
subsequent draft amendments proposed by the Ministry of Power, have proposed further
restructuring of the distribution segment to bring in competition. As per the proposed framework,
the distribution business will be segregated into the supply and network business. Consumers will
have the choice to buy electricity from multiple power suppliers, as opposed to buying from a single
distribution company currently. The discoms will maintain the retail networks which will be used
by the supply companies on payment of usage charges.

8
Figure 7: Key stakeholders in the power sector
Energy sources
Coal (including lignite) is the primary source of power (57%).
Majority coal produced by CIL (84% in 2017-18).
Coal linkages allocated by CIL through auction (SHAKTI).
Tariffs are not regulated. Prices determined through auctions.
Generation
Majority generation by thermal sources (64%).
46% of thermal generation capacity is
with private companies.
24% generation capacity is with central sector
companies. In 2018-19, among the central sector
companies, NTPC generated 73% of power.
Transmission
Powergrid (central grid)
State transmission utilities
Distribution
Almost all distribution companies are state
owned.
Private companies in some areas - Delhi,
Mumbai.
Tariffs regulated by SERCs.
Table 2: Developments in the power sector
Year Key developments
1948 Electricity Supply Act, 1948: Created state-level vertically integrated utilities responsible for power generation, transmission, and distribution, and for setting tariffs.19
1991 1948 Act amended to allow private companies to set up their power generation plants.
1996-98 Some states (Odisha, Haryana) started restructuring their state electricity boards. Restructuring included segregating generation, transmission, and distribution segments, and allowing private participation in the distribution segments.
1998 Established Regulatory Commissions at both the central and state levels through the Electricity Regulatory Commission Act, 1998. These Commissions regulate inter-state and intra-state matters in generation, transmission, and distribution of power.
2003 Electricity Act, 2003: Gave more powers to the Regulatory Commissions; provided for unbundling of the state owned electricity boards and multiple discoms in an area; allowed open access; provided for elimination of cross-subsidies in the sector. The 1948 Act, and 1998 Acts were repealed.
2014 Electricity (Amendment) Bill, 2014 to segregate retail supply from distribution, and bring in multiple supply licensees.
2015-2017 As of March 2015, the state discoms had accumulated losses of approximately Rs 3.8 lakh crore and outstanding debt of approximately Rs 4.3 lakh crore. The Ujwal Discom Assurance Yojana (UDAY) was introduced to allow states to help the discoms by taking over their debt.
2017 - now India declared as a power surplus country. All villages have been electrified. New household electrification scheme, Saubhagya, launched. Draft amendments to the 2003 Act propose to segregate the network and supply business, and introduce a system of direct benefit transfers with regard to subsidies. Coal linkages are being allocated through auction (SHAKTI).
Sources: Electricity Regulatory Commission Act, 1998; Electricity Act, 2003; 14th Report: Transmission and
Distribution Systems and Networks, Standing Committee on Energy; Power Sector Reforms in Odisha: Major Issues and Challenges, Government of Odisha; PRS.

9
ISSUES IN THE POWER SECTOR
While the overall power situation in the country has improved, several issues still remain. The
following sections look at the issues within each segment of the sector.
GENERATION
Peak deficit continues to persist
Generation capacity has increased over the years. Thermal generation capacity has had an average
annual growth of 7% between 2005-06 and 2018-19. However, the country continues to face a
peak deficit of 2%. This implies that in 2017, while the available capacity was 330 GW, the entire
peak demand of 164 GW could not be met. This deficit situation is more pronounced in certain
regions and states (see Figure 10 and Figure 11).
Figure 8: Total installed generation capacity (in MW)
Note: Generation figures are for the end of the financial year.
Sources: Central Electricity Authority; PRS.
Figure 9: Power deficit in India
* Anticipated surplus
Sources: Central Electricity Authority; PRS.
0
50,000
100,000
150,000
200,000
250,000
300,000
350,000
400,000
1947
1950
1956
1961
1966
1969
1974
1979
1980
1985
1990
1992
1997
2002
2007
2012
2017
2018
-25%
-20%
-15%
-10%
-5%
0%
5%
10%
1990
-91
1991
-92
1992
-93
1993
-94
1994
-95
1995
-96
1996
-97
1997
-98
1998
-99
1999
-00
2000
-01
2001
-02
2002
-03
2003
-04
2004
-05
2005
-06
2006
-07
2007
-08
2008
-09
2009
-10
2010
-11
2011
-12
2012
-13
2013
-14
2014
-15
2015
-16
2016
-17
2017
-18
2018
-19*
Energy deficit Peak deficit

10
Figure 10: Region-wise power deficit (2017-18)
In 2017-18, energy deficit in the
country was 0.7%, and peak deficit was
2%.20 However, for 2018-19, the
Central Electricity Authority has
projected an energy surplus of 4.6%
and peak surplus of 2.5%.
The deficit situation is worse in certain
states such as Jammu and Kashmir
(both energy and peak deficit are at
20%), and the north-eastern states (the
region saw energy deficit of 2.8%, and
peak deficit of 4.1%). Further, certain
states such as Chhattisgarh, Odisha,
and Uttar Pradesh continue facing high peak deficit despite having significant generation capacity.
These states have generation capacity of 13.5 GW, 7.6 GW, and 25 GW respectively, and peak
deficits at 6.8%, 5.4%, and 10.9% respectively.
Figure 11: State-wise deficit (as on January 2019)
Sources: Central Electricity Authority; PRS.
Capacity utilisation of thermal power plants has been declining
While generation capacity has been steadily increasing, the capacity utilisation of thermal
power plants (also called Plant Load factor or PLF) has declined from 78% in 2009-10 to 61%
in 2018-19.21 Among the three types of generators (in terms of ownership), the private and
state ones have poorer PLF as compared to the central ones. Table 3 shows details of PLF
across the different types of generators.
The High Level Empowered Committee (HLEC) on Stressed Assets (2018) noted that in the
last six years, 110 GW of generation capacity has been added, of which 100 GW is from coal-
based plants. However, the demand has not increased at the same pace. Consequently, the
available capacity is more than the demand and peak power shortage has reduced. Therefore,
large capacity is lying underutilised.
Low PLF implies that thermal plants have been lying idle, which could be due to non-
availability of fuel (gas or coal), surplus capacity (in some parts of the country), or demand for
power being low, or demand being met through other sources. Thermal plants require
significant fixed costs, and they incur such costs even when the plant is lying idle. Therefore, it
may be pertinent to look at current capacity utilisation when estimating the future thermal
capacity growth.
-25%
-20%
-15%
-10%
-5%
0%
And
hra
Pra
desh
Aru
nach
al P
rade
sh
Ass
am
Bih
ar
Chh
attis
garh
Goa
Guj
arat
Har
yana
Him
acha
l Pra
desh
Jam
mu
& K
ashm
ir
Jhar
khan
d
Kar
nata
ka
Ker
ala
Mad
hya
Pra
desh
Mah
aras
htra
Man
ipur
Meg
hala
ya
Miz
oram
Nag
alan
d
Odi
sha
Pun
jab
Raj
asth
an
Sik
kim
Tam
il N
adu
Tel
anga
na
Trip
ura
Utta
rakh
and
Utta
r P
rade
sh
Wes
t Ben
gal
Energy Deficit Peak Deficit
-10%
-8%
-6%
-4%
-2%
0%
2%
NorthernRegion
WesternRegion
SouthernRegion
EasternRegion
NorthEasternRegion
Energy deficit Peak deficit
Sources: Central Electricity Authority; PRS.

11
Figure 12: Plant load factor (in %)
Table 3: Sector-wise PLF (in %)
Year Central State Private
2009-10 86 71 84
2010-11 85 67 81
2011-12 82 68 70
2012-13 79 66 64
2013-14 76 59 62
2014-15 74 60 61
2015-16 73 55 60
2016-17 72 54 56
2017-18 72 57 55
2018-19* 72 58 56
* indicates provisional numbers (till January 2019)
Sources: Ministry of Power; PRS.
* indicates provisional numbers (till January 2019)
Sources: Ministry of Power; PRS.
Energy mix needs to be balanced for efficient capacity utilisation
The Standing Committee on Energy (2017) had noted that inefficient capacity utilisation is due to
several issues in the power sector.22 Firstly, while there is enough generation capacity, the poor
financial condition of discoms is resulting in suppressed demand for power, which leads to lesser
utilisation of capacities.
Secondly, the substantive fall in solar tariff and its very low gestation period is posing a threat to the
economic viability of thermal power plants. While growth in solar energy is a good sign for the
country, thermal energy has been the primary source for the power sector, and will continue to
remain an important source of power in the future. Further, given that renewable energy sources
are intermittent in nature, a balancing power will be needed to support the grid and even out the
fluctuations. For example, if solar energy is being used in an area, it will require an alternate source
for the night time requirement. This balancing power could come from gas or hydro based power.
As gas is a scarcely available resource, hydro power becomes a more obvious choice.
Thirdly, the share of hydro power has reduced from 25% in 2007-08, to about 13% in 2018-19.
Harnessing hydro potential will also improve the power situation in the north-eastern states,
Uttaranchal, Himachal Pradesh and Jammu and Kashmir, since a large proportion of hydro power
potential is located in these states. It would also help boost economic growth in these states.
Therefore, the Committee recommended that the growth of various sectors should be such that they
complement one another in maintaining a balanced energy mix.
Renewable market is still developing
Renewable energy sources are not evenly spread about the country. The NITI Aayog had observed
that electricity buyers in renewable poor states are relatively less willing to purchase renewable
electricity due to higher costs than the conventional sources.23 On the other hand, discoms in
renewable rich states have indicated that they would support additional renewable deployment only
if they are assured of sufficient willing buyers.23
The Standing Committee on Energy (2015) had noted that due to the intermittent nature of
renewable energy, making renewable generation or purchase mandatory may lead to problems.24
The NITI Aayog had also recommended that pricing should be such that electricity buyers are
indifferent between conventional and renewable energy resources until grid parity is achieved.23 While renewable tariffs have decreased significantly in some state in the recent years, now the issue
is with certain discoms hesitating to honour their renewable PPAs that were based on higher tariffs.
0%
20%
40%
60%
80%
100%
2009
-10
2010
-11
2011
-12
2012
-13
2013
-14
2014
-15
2015
-16
2016
-17
2017
-18
2018
-19*

12
Note that the 2018 draft amendments to the Electricity Act, 2003, make the generation and purchase
of a certain amount of renewable energy mandatory. Renewable purchase obligation is defined as
the minimum percentage of electricity that must be procured by supply licensees from renewable
sources. Renewable generation obligation is defined as the capacity that must be installed or
procured by a coal or lignite based generation station, from renewable sources, or an instrument
representing renewable energy (such as renewable energy certificates).
High cost of power
The Standing Committee on Energy (2017) noted that higher tariff is also a key reason for lower
electricity demand. Note that for discoms the cost of purchasing power from a power plant is
roughly 75-80% of the total expenditure. Therefore, any shift in the cost of power can significantly
affect the retail tariff.
The Committee noted that running power plants at lower PLF also escalates the generation cost.
There is a latent demand for power, which will surface once tariff is made more affordable. It
suggested that generation cost can be reduced by improving the availability of cheaper indigenous
coal, rationalising coal supply sources, and adapting new technology as per indigenous coal.
Imported coal
India’s coal imports have risen from 38.6 million tonnes (MT) in 2005-06 to 208 MT in 2017-18.25
While imported coal helps in bridging certain gaps in the demand and supply of coal, it costs more
(imported coal is 35-55% costlier than domestic coal). Further, there are certain technical limits on
the usage of imported coal.26,27
Imported coal: Mundra UMPP, Gujarat
Coastal Gujarat Power Limited (wholly-owned subsidiary of Tata Power), has implemented the 4,000 MW UMPP near Mundra, Gujarat. Adani Group has also developed almost similar capacity in Gujarat. The UMPP project supplies power to the five states of Gujarat, Rajasthan, Maharashtra, Haryana, and Punjab. These companies were generating power through coal imported from Indonesia. In 2010, due to a change in the mining regulations in Indonesia, the price of coal being exported from the country increased, and hence affected the commercial viability of the generating plants in India.
In December 2016, CERC noted that since the companies had Coal Sales Agreements for imported coal for the entire quantum of coal required for supply of power, the change in regulations completely changed the premises on which they had quoted tariffs in their bids to their consumers.28 CERC ruled that the companies can invoke ‘force majeure’ (unforeseeable circumstances that prevents a contract from being fulfilled). Losses arising due to the increase in price of coal will be paid up by the consumers (through higher power tariff). It also ordered the companies to source domestic coal and reduce dependence on imported coal, subject to technical feasibility.
In October 2018, the Supreme Court ruled that CERC must decide on changes to the Power Purchase Agreements (PPAs) reflecting the increased cost of coal.29 However, it also allowed the petitioners (a consumer rights group) to raise objections to any proposed amendments with the CERC.
Rationalising coal linkages
The Ministries of Power and Coal have been trying to address some of these concerns. For
example, the Standing Committee on Coal (2018) noted that between 2014 and 2016, the
rationalisation of coal linkages (buying coal from a mine closer to the power plant) has resulted in
estimated savings of Rs 3,000 crore per annum on transportation costs. It further noted that
auctioning coal linkages through SHAKTI will give consumers the option to bid for a source of
their choice, thereby reducing coal transportation costs.
The Ministry of Coal had constituted an inter-ministerial group to review the existing sources of
coal for independent power producers (IPPs) with coal linkages in October 2017.30 This group
suggested that the coal linkage of an IPP may be transferred from one coal company to another.

13
Such transfer will be based on the existing availability of coal and the future coal production plan of
the coal company. This would help link coal mines closer to the power plants, reducing coal
transportation costs, resulting in lower coal costs for the power producers.
NPAs in the sector have been increasing
As per the RBI, public sector banks have the highest NPAs, most of which are in the power and the
telecom sector. It also noted that the most severe shock to the power sector will cause the banking
system NPAs to rise by about 68 bps.31 The Standing Committee on Energy (2018), had examined
34 independent power producers (IPPs), with a capacity of 40 GW, that had turned into NPAs. As
of June 2017, there were 34 stressed thermal power plants with an outstanding debt of Rs 1.74 lakh
crore.3 There are several reasons for financial stress in these thermal power projects, some of which
are explained below.
Availability of coal
The Standing Committee on Energy (2018)
noted that coal availability is critical in several
plants of the NTPC.3 It recommended that CIL
should ensure that generators are provided with
the required coal in a time-bound manner.
Further, power plants should be provided
enough coal to enable them to run at 85%
efficiency. Power plants should primarily use
domestic coal. They may be allowed to use 15-
20% of imported coal, only if they can remain
economically viable.
Availability of Power Purchase Agreements
The HLEC on stressed assets in the power
sector (2018) observed that while several coal-
based power plants have FSAs (agreement
between coal company and power plant to buy
coal) they do not have medium term/long term
PPAs. Further, there have been very few bids
by the discoms for long/medium term PPAs,
because of the high fixed costs associated with
them. In the absence of long/medium term
PPAs, these plants are not able to operate
because such linkage coal cannot be used
against short term PPAs. The Committee
recommended that such linkage coal may be
allowed to be used against short term PPAs. In
March 2019, the Union Cabinet allowed such
power plants to use coal from the existing FSAs
for sale of power through short-term PPAs.
Resolving NPAs
RBI circular: In February 2018, the RBI released a framework for restructuring of stressed assets of over Rs 2,000 crore on or after March 1, 2018.32 The framework provided that the resolution plan for restructuring must be unanimously approved by all lenders and implemented within 180 days from the date of the first default. If the plan is not implemented within the stipulated time period, the stressed assets must be referred to the NCLT under the IBC within 15 days. Various power producers appealed to courts against the RBI circular.
Standing Committee’s observations: The Standing Committee on Energy (2018) analysed the impact of the circular on power sector.33 It noted that the new guidelines are stringent and do not consider the problems in the electricity sector. These new guidelines will worsen the NPA crisis in the sector. It recommended that instead of adopting a sector agnostic approach towards stress resolution, more specific and sector friendly approaches should be used.
Supreme Court’s order: The Court held that the circular issued by RBI was outside the scope of the power given to it under section 35AA of the Banking Regulation (Amendment) Act, 2017.34 Consequently, all IBC proceedings initiated under the RBI circular were quashed. During the proceedings, several power companies provided that their reasons for delays in payment of bank dues include: (i) cancellation of coal blocks by the Supreme Court leading to non-availability of fuel, (ii) lack of enough PPAs by states, (iii) non-payment of dues by discoms, and (iv) delays in project implementation leading to cost overruns.
Delayed payments by discoms
The HLEC also noted that one of the major reasons for stress is the delay in payments by the
discoms to the power plants. These power plants are unable to cancel PPAs with such discoms, or
sell power on the power exchange or through short-term PPAs. This adversely affects the latter’s
liquidity and ability to service their debt and operate the plant. It recommended that a power plant
should be able to terminate a PPA in case of default in payment from the discoms.

14
Environmental concerns of thermal generation
Environmental sustainability is one of the major concerns with regard to thermal power generation
across the world. Studies have indicated a rapid increase in the amount of greenhouse gases
including carbon dioxide, methane and nitrous oxide in the atmosphere over the last few decades,
primarily from fossil fuel emissions.35 In 2012, India contributed to about 6% of the world’s CO2
emissions.36 The annual per capita emission of CO2 in India is about 1.6 tonnes as compared to the
world average of 4.9 tonnes.36 With the push towards more domestic manufacturing and
industrialisation, majority of the energy in India being generated from thermal sources, and
increasing levels of consumption, environmental sustainability could become a much bigger
concern in the years to come.
In April 2016, India, as a member country of the United Nations Framework Convention on
Climate Change, signed on to undertake certain climate actions known as Intended Nationally
Determined Contributions (INDCs). India’s INDCs include achieving the following targets by
2030: (i) reducing greenhouse gas emissions per unit of GDP by 33-35% from 2005 levels; (ii)
achieving 40% of installed electric power capacity from non-fuel based energy sources (such as
solar, wind, hydropower); and (iii) creating additional carbon storage and absorption capacity for
2.5- 3 billion tonnes of CO2 by increasing forest and tree cover.
With regard to these specific INDCs, note that between 2005 and 2014, greenhouse gas emissions
per unit of GDP decreased by 19%.37 However, with about 64% of India’s power coming from
thermal sources, and a focus on increasing thermal generation capacity through UMPPs and captive
mining, it is unclear how a 35% reduction in greenhouse gas emissions will be achieved. As on
January 2019, the share of renewable energy (including hydro) in power generation is 34%. This
share has to be increased up to 40% by 2030, and simultaneously the share of thermal power has to
decrease from the current share of 64%.
The Ministries of Power, and Non and Renewable Energy have set a few targets in order to achieve
some of these goals. Some of these include: (i) achieving 40% of electric power installed capacity
from non-fossil fuel by 2030; (ii) generating 175 GW of renewable energy by 2022, and increasing
capacity under the National Solar Mission from 20 to 100 GW; (iii) development of a National
Smart Grid Mission & Green Energy Corridor for efficient transmission & distribution network;
(iv) reduction in fossil fuel subsidies; and (v) providing tax free infrastructure bonds introduced for
renewable energy.38 The central government also increased the coal cess from Rs 50 to Rs 200 per
ton in 2016-17.
Guidelines for thermal power plants
The Ministry of Environment, Forest and Climate Change (MoEFCC) had issued certain
environmental guidelines for thermal power plants in December 2015.39 As per these guidelines,
these plants were required to retrofit or install equipment that would help reduce their emission
levels. The MoEFCC allowed the thermal power industry two years to comply with these
guidelines (i.e., by December 2017). The guidelines categorised thermal power plants into three
categories for compliance purposes. These are plants installed: (i) before December 31, 2003, (ii)
after 2003, and before December 31, 2016, and (iii) after December 31, 2016.
However, these guidelines were opposed by the industry on the grounds that these would increase
the cost of producing power for the plants. In May 2018, the Ministry of Power extended the
deadline to December 2022.40 It also noted that the guidelines will be considered as a change in the
law in certain cases. In such cases, any additional cost implication due to installation of emission
control equipment can be passed through to consumers, in the form of higher tariffs. In April 2018,
theMinistry of Power also allowed for flexibility in generation and scheduling of thermal power
stations to help reduce emissions.41 This would be achieved by optimal utilisation of power
generated from renewable sources.

15
TRANSMISSION
Transmission infrastructure issues affect power supply
As of January 2019, the all India transmission lines are 4.07 lakh circuit km long. Since 2007, the
transmission lines have grown at an average annual rate of 4%. 54% of the transmission lines are
with the state governments, 38% with the centre, and remaining are with private companies.
Figure 13: Length of Transmission lines (in circuit km)
Sources: Central Electricity Authority; PRS.
Bottlenecks in the transmission network cause issues with evacuation of power. Further, a poor
transmission network also leads to underutilisation of generation capacity. Congestion means a
situation where the demand for transmission capacity exceeds the available transfer capability. The
Working Group on Power (2012) had noted that some of the state transmission utilities require
financial support, especially for building transmission systems for renewable energy sources.42 It
had recommended providing viability gap funding on a case-to-case basis for building intra-state
transmission systems.
The 12th Plan had envisaged a growing role for the private sector in transmission, especially in the
intra-state networks. However, private sector transmission projects face challenges such as
difficulties in acquiring right of way and delays in land acquisition and forest clearances, cost
escalation due to such delays, and unavailability of bank credit.42 To mitigate these issues, the
Working Group on Power (2012) had recommended identifying and reserving transmission
corridors in areas with high population density to meet the future growing demand.
Connecting renewable energy sources with the grid
An insufficient transmission network and non-synchronised generation also causes issues with
renewable energy.43 While renewable resources are abundant, the output is variable and subject to
uncertainty. Intermittence of renewable sources along with absence of scientific techniques to
predict the availability of power creates challenges with maintaining grid discipline.43
In the absence of a proper transmission network and poor grid discipline, the generated renewable
power may remain unutilised.23 In contrast, fossil-fired power plants rely on fuels that can be stored
(although they may be subject to supply shortages).23 The Ministry of New and Renewable Energy
has proposed the development of a National Smart Grid Mission & Green Energy Corridor for
efficient transmission & distribution network.44
Increased deployment of large-scale solar, wind power, and small-scale decentralized renewable
energy could lead to several complexities with regard to load balancing.23 These would arise due to
the variability in supply and demand caused by seasonal changes in the weather. However, if wind
and solar energy is taken as an aggregated whole, the variance in output would be more gradual.23
Therefore, if the geographic size of the balancing area, and the size of the system is large, the ability
of the system to absorb and respond to the variability of renewable energy could be improved.
However, this may affect the amount of flexibility of using such power, and the time at which it is
needed in the system.23
0
100,000
200,000
300,000
400,000
500,000
1985 1990 1997 2002 2007 2012 2017 Upto Jan 2019
16
DISTRIBUTION
Poor financial situation of the distribution utilities
Discoms buy power from generation companies and supply it to the consumers. Therefore, for
consumers to receive good quality of electricity it is important that the discoms function well.
However, discoms across the country have been facing high levels of losses and are struggling with
debt. This makes it difficult for them to purchase power, and invest in the distribution network.
This leads to a shortfall in power supply, and poor distribution infrastructure.
The accumulated losses of state discoms (after adjusting for subsidies received from state
governments) had increased from Rs 11,699 crore in 2004-05 to Rs 71,271 crore in 2013-14.45
During the same period, their borrowings increased from Rs 1,06,509 crore to Rs 4,59,145 crore.
As of March 2015, the state discoms had accumulated losses of approximately Rs 3.8 lakh crore
and outstanding debt of approximately Rs. 4.3 lakh crore.46
In the last two decades, several measures have been undertaken to address the debt of the discoms
and improve their financial situation, the latest one being UDAY. However, these measures have
simply addressed part of the problem, and helped the discoms clear their books. Post the bail-outs,
discoms tend to accumulate losses again, and the same cycle repeats.
Financial restructuring and bail-out of the discoms - UDAY
In 2012, the central government had announced a Financial Restructuring Package (FRP) to solve
the immediate funding needs of the highly distressed state discoms.47 Under the scheme, state
governments were to assume 50% of respective utility’s short-term debt while the balance 50%
would be restructured. States were also expected to enact a legislation mandating prudent
management of their utilities. The central government would provide a grant for AT&C loss
reduction in excess of the targets under the Restructured Accelerated Power Development and
Reforms Programme (R-APDRP).
The RBI’s report on state finances for 2015-16 observed that FRP improved the liquidity of
discoms by providing a moratorium on debt repayments. However, the FRP could not deliver the
desired results as there were no deterrents to non-compliance with loss-reduction targets.
In November 2015, the central government announced another bailout scheme for the distressed
state discoms, the Ujwal Discom Assurance Yojana (UDAY). The scheme was optional for states –
27 states signed up for it. Under the scheme, states had to take over 75% of discoms debt (as on
September 30, 2015) over two years (50% in the first year and 25% in the second year). The debt
taken over by the states was not counted in their fiscal deficit for the first two years. States that
accepted the scheme are to receive additional benefits from the central government. These include:
(i) additional or priority funding through Deendayal Upadhyaya Gram Jyoti Yojana (DDUGJY),
Integrated Power Development Scheme (IPDS), Power System Development Fund (PSDF) or any
other such schemes, and (ii) supply of additional coal at notified prices and low cost power from
NTPC and other central PSUs (depending on availability).
However, under UDAY, states also had to fulfil certain operational efficiency improvements such
as compulsory smart metering, and upgradation of transformers. States not meeting these
operational milestones will have to forfeit their claim on the IPDS and DDUGJY grants.
The part of discom debt not taken over by the states would be converted by banks and financial
institutions into loans or bonds, or it may be fully or partly issued by the discom as state guaranteed
discom bonds at the prevailing market rates. States will take over the future losses of discoms in a
graded manner.
While UDAY seeks to improve the financial situation of the state discoms, it is unclear whether it
will help reduce the losses in the long term. The RBI’s report on state finances for 2015-16 noted

17
that while UDAY may alleviate the non-performing asset (NPA) problem of banks, it will increase
the liabilities of participating states. UDAY is expected to help improve the liquidity of the
discoms as well as reduce the losses by lowering the interest burden on them. Further, by involving
the states, UDAY may be able to address the issue of efficiency improvement and cost-reflective
tariff hikes. However, the report noted that this scheme may reduce the fiscal space of states
leading to reduction in the capital expenditure by states. Further, states may not be able to shrink
their deficits, which may put an additional burden on the centre.
The Ministry of Power had mentioned that, post UDAY, AT&C losses have reduced to 18.8% in
2017-18 from 20.8% in 2015-16 (only for the states participating in UDAY).48 The gap between
average cost of supply (ACS) and average revenue realised (ARR) has reduced from Rs 0.6/unit in
2015-16 to Rs 0.17/unit in 2017-18.48 However, as per the latest available information these levels
seemed to have increased again. As of September 2019, the AT&C losses are at 21.4%, and ACS-
ARR gap is at Rs 0.25/unit.49 Note that, all these numbers are self reported by the states
participating in the scheme. As of July 31, 2019, the outstanding dues of power utilities payable to
the central public sector undertakings (such as NTPC) were at Rs 32,968 crore.
While discoms may be able to address some operational issues, there will be challenges to address
some core issues such as (i) differential tariff structure, (ii) delays in tariff revisions and subsidy
payments, and (iii) high levels of Aggregate Technical and Commercial (AT&C) losses. We
discuss some of these issues.
Differential tariff structure
Currently, different consumers buy electricity at different rates. As of September 2019, the gap
between average cost of supply and the average revenue realised is Rs 0.25/unit.49 One of the key
reasons for this gap between ACS and ARR is differential tariff structure for different consumers.
Currently, consumers are charged different tariff rates based on their consumption category. State
governments provide subsidies to most discoms to allow them to charge such differential tariff
(from low paying consumers). In addition to these direct subsidies from the state governments, low
paying consumers (agricultural and residential) are also cross-subsidised by high paying consumers
(commercial and industrial). In case of cross-subsidies, subsidisation is inbuilt in the tariff.
However, the overall revenue realisation may not meet the total cost of supply.
Increasing tariffs for low paying consumers may be a challenging task for discoms. However, the
ACS and ARR gap means that discoms will continue to not recover their costs, and make losses.
Change in tariffs post UDAY: Punjab
In 2013-14, Punjab was providing free electricity to agricultural consumers, while commercial consumers were paying Rs 6.2/kWh. Post UDAY, the agricultural consumers n Punjab continue to be subsidised and receive free electricity. Figure 14 shows the tariffs across different consumer segments in Punjab (as approved by the Punjab State Electricity Regulatory Commission (PSERC)).
Note: PSERC has noted in its tariff order that the number for commercial category for the year 2017-18 may be erroneous based on the bills submitted by the discom, and has requested the discom to submit correct consumption figures.
Sources: PSERC Tariff Orders from 2015-16 to 2019-20; Annual Report (2013-14) on the Working of State Power Utilities & Electricity Departments, Planning Commission, February 2014; PRS.
Figure 14: Tariffs in Punjab (in Rs/MU)
0
2
4
6
8
10
2012
-13
2013
-14
2014
-15
2015
-16
2016
-17
2017
-18
Domestic Commercial
Large Industrial Agricultural
Total

18
Figure 15: Gap between average cost of supply
and tariff (in Rs/kWh)
Figure 16: Consumer category-wise
electricity tariff (in Rs/kWh)
High AT&C losses
Aggregate Technical and Commercial (AT&C) loss is the ratio of power for which the discom did
not receive any payment to the total electricity procured by the utility. AT&C losses can be divided
into technical (transmission) losses and non-technical (commercial) losses. Low levels of
investment in distribution have resulted in overloaded systems, leading to higher technical losses.
Theft and pilferage of power is a key reason for high commercial losses for discoms. Lack of
metering and poor billing and collection systems also contribute to commercial losses.
The national average for AT&C losses for 2014-15 was 25% (for 36 discoms out of a total of 55).50
In comparison, transmission and distribution losses are at about 6% in the US and about 7.2% in the
UK.51,52
Sources: Central Electricity Authority; PRS.
The central government had launched the Accelerated Power Development Program in 2001 (later
changed to the Restructured - Accelerated Power Development and Reform Programme (R-
APDRP)) to improve the working of state power discoms, including reducing AT&C levels. In
2014, the scheme was subsumed under the Integrated Power Development Scheme (IPDS). Despite
the attempts at reforms, reduction in AT&C losses (1.1% per annum between 2001-02 and 2013-14)
has been slower than the target.53 UDAY also mandated states to reduce AT&C losses to 15% by
2018-19. As of September 2019, the AT&C losses for 13 states participating in UDAY is 21.4%.
0
2
4
6
8
2009-10 2010-11 2011-12 2012-13 2013-14
Average cost of supply Average tariff
0
2
4
6
8
2009-10 2010-11 2011-12 2012-13 2013-14
Agriculture Domestic Commercial Industrial
0%
10%
20%
30%
40%
50%
2001
-02
2002
-03
2003
-04
2004
-05
2005
-06
2006
-07
2007
-08
2008
-09
2009
-10
2010
-11
2011
-12
2012
-13
2013
-14
2014
-15
Sources: Power Finance Corporation; PRS. Sources: Power Finance Corporation; PRS.
Figure 17: AT&C losses

19
Figure 18: Transmission and Distribution losses across several countries in 2015 (in %)
Sources: Central Electricity Authority; PRS.
Proposed segregation of the distribution function
The Electricity (Amendment) Bill, 2014 was introduced in Lok Sabha in December 2014, and
lapsed with the dissolution of the 16th Lok Sabha. The 2014 Bill sought to: (i) increase competition
in the sector by segregating the distribution segment into distribution and supply, (ii) rationalise
tariff determination, and (iii) promote renewable energy.54 The 2014 Bill was examined by the
Standing Committee on Energy (2015), which suggested certain changes to the Bill.55 In 2018, the
Ministry of Power then proposed draft amendments based on the Committee’s recommendations
and other stakeholder consultations.56
The 2018 draft amendments retained the segregation of distribution into the network and supply
business. This would allow for multiple supply licensees in an area of supply, and consumers may
choose to buy electricity from multiple suppliers in an area. However, the explicit details of how
such switching, or transition between suppliers will work were not provided in the amendments.
The Standing Committee on Energy examining the 2014 Bill had suggested that the law should
provide certain details regarding consumer switching between supply licensees. These include: (i)
the mechanism for providing the consumer with the option to choose a supply licensee, and (ii) the
transfer from one supplier to another based on the choice of the consumer, and the cost involved in
such choice and transfer.
Removing cross-subsidies in the sector
As discussed earlier, currently, consumers are charged different tariff rates based on their
consumption category. While state governments provide direct subsidies to discoms, low paying
consumers (agricultural and residential) are also cross-subsidised by high paying consumers
(commercial and industrial). In case of cross-subsidies, subsidisation is inbuilt in the tariff. Such
differential pricing and subsequent cross-subsidising raises the input costs for manufacturing and
service sectors.
The draft amendments provided that any subsidy to any category of consumer will be provided by
the state or central government through direct benefit transfer (DBT). Further, the cross-
subsidisation within a distribution area will not exceed 20%, and will be progressively reduced and
eliminated within three years. The CERC/SERC will have to ensure that the reduction in cross-
subsidy is not less than six percent in a year.
The cross-subsidy for a consumer category is the difference between the cost to serve that category
of consumers and the average tariff realised from that category of consumers. Two possibilities
0
5
10
15
20
25
Kor
ea
Japa
n
Ger
man
y
Aus
tral
ia
Sou
th A
fric
a
Fra
nce
Chi
na
US
A
Can
ada
UK
Rus
sia
Bra
zil
Indi
a
Wor
ld

20
may arise due to removal of such cross-subsidy. First, it could increase the tariffs for the currently
low paying consumers (agricultural and residential) who are being subsidised. Second, the state or
central government may choose to alleviate any increase in their tariffs by giving them explicit
subsidies through DBT. This could increase the subsidy burden on the exchequer (either through
the Union budget or state budgets or a combination of both).
Note that in August 2018, the Ministry of Power had also proposed amendments to the Tariff
Policy, 2016 (for electricity) to simplify the current tariff categories and rationalise retail tariff. The
draft suggested that the tariff structure should do away with the concept of different tariff for
different categories of consumers. The price should instead be based on load used and energy
consumed. Consumers with sanctioned load and unit consumption in lower brackets will be
subsidised by consumers in higher load and consumption brackets.
REGULATORS
Electricity regulators need to be strengthened
The Electricity Regulatory Commissions were established in 1998 following the Electricity
Regulatory Commissions Act, 1998. The primary objective of setting up the Commissions was to
have an independent body regulating tariffs. The 2003 Act, broadened the mandate of the
Commissions by providing them the powers to grant licenses for inter-state transmission and
trading of power and to amend, suspend and revoke these licences. The Act also gave
Commissions the powers to regulate licensees by setting performance standards and ensuring their
compliance. The broader objective of the Commissions was to bring in transparency,
accountability, and a professional approach to regulate the sector, and also to impartially balance
the interests of investors as well as consumers.
The Standing Committee on Energy (2012) had noted that the CERC has not been effective in its
role.57 The Committee had recommended that the government should appoint an independent
expert committee to: (i) review the functioning of the CERC, (ii) identify areas to improve the
working and autonomy of the organization, and (iii) limitations of the law. The Committee had also
recommended that the forum of regulators should ensure that adequate steps are taken by all the
SERCs and state discoms to rationalize their tariff annually.
The Committee had observed that the pay structure, service conditions and other amenities
available to CERC employees are discouraging. In addition, there is a shortage of manpower in the
Commission. It had recommended that the personnel policy of the organization should be well laid
down having its own cadre with adequate promotional prospects and better amenities to the officials
of the Commission corresponding to their job profile.
Regulatory issues
The HLEC (2018) noted that delays in payments by discoms hurts the viability of generators. The
regulator must ensure the sustainable operation of the power sector. However, regulators often
insist that the generators forego the late payment surcharge on the delayed payments. This further
affects the viability of generators. It recommended that the Ministry may engage with the
regulators to ensure that the late payment surcharge is mandatorily paid.
QUALITY OF POWER
Villages have been electrified but quality of supply is still an issue
Under the Electricity Act, 2003, the central and state governments have a joint responsibility in
providing electricity to rural areas. Rajiv Gandhi Grameen Vidyutikaran Yojana (RGGVY),
launched in 2005, was the first scheme looking at rural electrification. Under the scheme, an
electrified village as a village that has the following: (i) provision of basic infrastructure such as

21
distribution transformers and lines the inhabited locality, (ii) provision of electricity in public places
such as schools, panchayat office, health centres, dispensaries, community centres, etc., and (iii) at
least 10% of the total number of households in the village are electrified.58 In December 2014, the
Ministry of Power launched the Deendayal Upadhyaya Gram Jyoti Yojana (DDUGJY).59
Components of RGGVY were subsumed under DDUGJY.
In April 2018, the Ministry of Power announced that all villages have been electrified. Just prior to
this, the Pradhan Mantri Sahaj Bijli Har Ghar Yojana (or Saubhagya) was launched. The scheme
seeks to ensure universal household electrification (in both rural and urban areas) by providing last
mile connectivity.
Duration of electricity supply
Currently, 4.3% of villages in India do not receive electricity for domestic use (most of these
villages are in the north-eastern region). 4.7% of villages receive electricity (for domestic use) for
one to four hours in a day. As per data collected under Mission Antyodaya implemented by the
Ministry of Rural Development, in 2018 about 53% of the villages receive electricity for less than
12 hours a day.2 Therefore, while villages have been electrified, the duration and quality of
electricity they receive is poor.
Quality of rural electricity
The Standing Committee on Energy (2017) noted that the village electrification scheme aimed to
provide electricity to households for the limited purpose of illumination. The use of electricity for
illumination only does not provide scope for the beneficiaries to carry out even small electricity
based commercial activities. On the other hand, discoms who provide such connections perceive
rural consumers as a liability with little or no scope for revenue generation for them.
The Committee recommended that the government should seek to provide electricity connections in
the rural areas that are capable of carrying out some commercial activities. Further, the government
should also provide for the supply of quality and reliable power for a reasonable time as mere
electrification without adequate electricity supply does not make sense.
The Committee also recommended that every connection provided by the discoms, irrespective of
the purpose, type or category, must be metered. 100% metering of all connections will help in
better energy auditing and fixing accountability. While free or subsidised electricity could continue
to be provided in rural areas it should be metered to better understand the level of consumption and
losses, if any.
Saubhagya scheme – household electrification
Though the scheme seeks to create the infrastructure to provide electricity across all households in
the country, the supply of electricity continues to be the challenge. If the discoms do not have
enough fiscal space to buy power, then the power supply situation will continue to remain poor.
Also, note that these are rural areas, or areas with more domestic consumers. They pay lower tariffs
and hence more supply to these consumers may lead to increased losses unless the discoms are
compensated by the government.
1. “Three Years’ Achievements & Initiatives of the Ministries of Power, Coal, New & Renewable Energy and Mines”, Press Information Bureau, Ministry of Power, June 12, 2017, http://pib.nic.in/newsite/PrintRelease.aspx?relid=165568.
2. Villages With Availability Of Electricity For Domestic Use, Mission Antyodaya, Ministry of Rural Development, last accessed on September 20, 2019, https://missionantyodaya.nic.in/preloginStateElectricityReport2018.html.
3. 37th Report: Stressed /Non-performing Assets in Electricity Sector, Standing Committee on Energy, March 7, 2018, http://164.100.47.193/lsscommittee/Energy/16_Energy_37.pdf.

4. Executive Summary on Power Sector, Central Electricity Authority, Ministry of Power, January 2019, http://www.cea.nic.in/reports/monthly/executivesummary/2019/exe_summary-01.pdf.
5. Provisional Coal Statistics 2017-18, Coal Controller’s Organisation, Ministry of Coal, December 2018, http://www.coalcontroller.gov.in/writereaddata/files/download/provisionalcoalstat/ProvisionalCoalStat2017-18.pdf.
6. “Cabinet approves Measures to promote Hydro Power Sector”, Press Information Bureau, Cabinet, March 7, 2019,
http://pib.nic.in/newsite/PrintRelease.aspx?relid=189300.
7. All India Installed Capacity (in MW) of Power Stations, Central Electricity Authority, Ministry of Power, As on
February 28, 2019, http://www.cea.nic.in/reports/monthly/installedcapacity/2019/installed_capacity-02.pdf.
8. “Tentative State-wise break-up of Renewable Power target to be achieved by the year 2022”, Ministry of New and
Renewable Energy, http://mnre.gov.in/file-manager/UserFiles/Tentative-State-wise-break-up-of-Renewable-Power-by-2022.pdf.
9. Lok Sabha Unstarred Question No. 2606, Ministry of New and Renewable Energy, August 2, 2018, http://164.100.47.194/Loksabha/Questions/QResult15.aspx?qref=71438&lsno=16.
10. “Progress of Transmission Sector in the Country up to Aug-19”, Central Electricity Authority, http://cea.nic.in/reports/monthly/transmission/2019/growth_summary_tx-08.pdf.
11. “Progress of Substations in the Country up to Aug-19”, Central Electricity Authority,
http://cea.nic.in/reports/monthly/transmission/2019/growth_summary_ss-08.pdf.
12. Growth of Transmission Lines and Transformation Capacity, Central Electricity Authority, As on January 2019,
http://www.cea.nic.in/reports/others/ps/pspm/glance-01.pdf.
13. Growth of Electricity Sector in India from 1947-2018, Central Electricity Authority, June 2018, http://www.cea.nic.in/reports/others/planning/pdm/growth_2018.pdf.
14. “Cabinet approves Signing of Fuel Supply Agreement (FSA) with Letter of Assurance (LoA) holders of Thermal Power Plants (TPPs)”, Press Information Bureau, Ministry of Coal, May 17, 2017.
15. A consumer’s guide to electricity tariff determination, Karnataka Electricity Regulatory Commission, https://www.karnataka.gov.in/kerc/Consumer%20Advocacy/ELECTRICITY-TARIFF-DETERMINATION.pdf.
16. OP No.1 Of 2011, Appellate Tribunal for Electricity, November 11, 2011, pages 8 and 9, http://aptel.gov.in/judgements/OP%20NO.1%20OF%202011.pdf.
17. Power sector operations and impact on state finances, Volume I: All India summary of key aspects of power sector,
14th Finance Commission Report, Chapter III,
http://fincomindia.nic.in/writereaddata%5Chtml_en_files%5Cfincom14/others/41.pdf.
18. Electricity Act, 2003, Section 14, Proviso 6.
19. 14th Report: Transmission and Distribution Systems and Networks, Standing Committee on Energy, March 18, 2011, http://164.100.47.134/lsscommittee/Energy/15_Energy_14.pdf.
20. Load Generation Balance Report 2018-19, Central Electricity Authority, Ministry of Power, July 2018, http://www.cea.nic.in/reports/annual/lgbr/lgbr-2018.pdf.
21. “Energy Generation, Programme, and Plant Load Factor”, Central Electricity Authority, May 1, 2015, http://www.cea.nic.in/reports/monthly/generation_rep/actual/jul15/opm_01.pdf.
22. 30th Report: National Electricity Policy – A Review, Standing Committee on Energy, August 9, 2017, http://164.100.47.193/lsscommittee/Energy/16_Energy_30.pdf.
23. “Report on India’s Renewable Electricity Roadmap 2030”, NITI Aayog, February 2015, https://niti.gov.in/writereaddata/files/document_publication/RE_Roadmap_ExecutiveSummary.pdf.
24. 4th Report: Electricity (Amendment) Bill, 2014, Standing Committee on Energy, May 7, 2015,
http://www.prsindia.org/uploads/media/Electricity/SC%20report-Electricity.pdf.
25. Provisional Coal Statistics (2008-2017), Coal Controller Organisation,
http://www.coalcontroller.gov.in/pages/display/20-provisional-coal-statistics.
26. Based on benchmark coal price and calorific value for Australia (Newcastle), South Africa (Richards Bay), USA
(CME) and Indonesia (McCloskey-CME).
27. Report of the Group for Studying Range of Blending of Imported Coal with Domestic Coal, Central Electricity Authority, April 2012, www.cea.nic.in/reports/articles/thermal/blending_coal.pdf.
28. Petition No. 155/MP/2012, Central Electricity regulatory Commission, December 6, 2016, http://www.cercind.gov.in/2016/orders/155MP2012.pdf.
29. M.A. Nos.2705-2706 of 2018, Civil Appeal Nos.5399-5400 of 2016, Supreme Court of India, October 29, 2018, https://www.sci.gov.in/supremecourt/2018/38117/38117_2018_Order_29-Oct-2018.pdf.
30. “Methodology for Linkage Rationalization for Independent Power Producers (IPPs)”, Press Information Bureau, Ministry of Coal, May 16, 2018.
31. Financial Stability Report Issue No. 17, Reserve Bank of India, June 2018,
https://rbidocs.rbi.org.in/rdocs/PublicationReport/Pdfs/0FSR_JUNE2018A3526EF7DC8640539C1420D256A470FC.PDF

32. Resolution of Stressed Assets – Revised Framework, RBI/2017-18/131, Reserve Bank of India, February 12, 2018, https://www.rbi.org.in/scripts/FS_Notification.aspx?Id=11218&fn=2&Mode=0.
33. 40th Report: Impact of RBI's Revised Framework for Resolution of Stressed Assets on NPAs in the Electricity Sector, Standing Committee on Energy, August 7, 2018, http://164.100.47.193/lsscommittee/Energy/16_Energy_40.pdf.
34. Dharani Sugars and Chemicals Ltd. Versus Union of India & Others, Transferred case (Civil) No.66 of 2018 in
Transfer Petition (Civil) No.1399 of 2018, Supreme Court of India, April 2, 2019, https://www.sci.gov.in/supremecourt/2018/42591/42591_2018_Judgement_02-Apr-2019.pdf.
35. Climate Change 2013: The Physical Science Basis, Fifth Assessment Report, Intergovernmental Panel on Climate Change, 2013, http://www.ipcc.ch/pdf/assessment-report/ar5/wg1/WG1AR5_SPM_FINAL.pdf.
36. India's Intended Nationally Determined Contributions, Ministry of Environment, Forest and Climate Change, October 2, 2015, http://moef.gov.in/wp-content/uploads/2017/08/Press_Statement__INDC_English.pdf.
37. CO2 emissions (kg per PPP $ of GDP), The World Bank, last accessed in August 2019,
https://data.worldbank.org/indicator/EN.ATM.CO2E.PP.GD?end=2014&locations=IN&start=1990&view=chart.
38. “India's Intended Nationally Determined Contributions – Towards Climate Justice”, Ministry of Environment, Forest
and Climate Change, http://envfor.nic.in/sites/default/files/press-
releases/revised%20PPT%20Press%20Conference%20INDC%20v5.pdf.
39. “Directions under Section 5 of the Environmental (Protection) Act, 1986 regarding compliance of emission limit
notified vide notification No.S.O.3305 dated 07.12.2015-reg”, B-33014/07/2018/IPC-II/TPP/395, Central Pollution
Control Board,
http://cpcb.nic.in/openpdffile.php?id=UHVibGljYXRpb25GaWxlLzE2MzBfMTUyMzg3MjM0Nl9tZWRpYXBob3RvMjIwODAucGRm.
40. “Mechanism for Implementation of New Environmental Norms for Thermal Power Plants (TPPs) supplying power to
distribution licensees under concluded long term and medium term Power Purchase Agreement (PPA)”, No. 23/22/2018-
R&R, Ministry of Power, May 30, 2018,
https://powermin.nic.in/sites/default/files/webform/notices/Letter_dated_30th_May_2018_on_New_Environmental_Norms.pdf.
41. “Flexibility in Generation and Scheduling of Thermal Power Stations to reduce emissions.”, No.23/70/2017-R&R,
Ministry of Power, April 5, 2018,
https://powermin.nic.in/sites/default/files/webform/notices/Flexibility_in_Generation_and_Scheduling_of_Thermal_Powe
r_Stations_to_reduce_emissions.pdf.
42. “Report of The Working Group on Power for Twelfth Plan (2012-17)”, Planning Commission, January 2012, http://planningcommission.nic.in/aboutus/committee/wrkgrp12/wg_power1904.pdf.
43. “Large Scale Grid Integration of Renewable Energy Sources - Way Forward”, Central Electricity Authority, November 2013, http://cea.nic.in/reports/others/ps/pspa1/large_scale_grid_integ.pdf.
44. National Smart Grid Mission, Ministry of Power, March 27, 2015, http://powermin.nic.in/sites/default/files/uploads/National_Smart_Grid_Mission_OM.pdf.
45. Reports on the performance of state power utilities for the years 2004-05 to 2013-14, Power Finance Corporation, http://www.pfcindia.com.
46. “UDAY (Ujwal DISCOM Assurance Yojana) for financial turnaround of Power Distribution Companies”, Press Information Bureau, Ministry of Power, November 5, 2015.
47. “Scheme for Financial Restructuring of State Distribution Companies (Discoms)”, Ministry of Power, October 5,
2012. http://powermin.nic.in/whats_new/pdf/Financial_restructuring_of_State_Distribution_Companies_discoms_Oct2012.pdf
48. Lok Sabha Unstarred Question No. 1043, Ministry of Power June 27, 2019, http://164.100.24.220/loksabhaquestions/annex/171/AU1043.pdf.
49. UDAY National Dashboard, Ministry of Power, Last accessed on September 9, 2019,
https://www.uday.gov.in/home.php.
50. Lok Sabha Questions, Untarred Question no 1672, March 5, 2015, http://164.100.47.192/Loksabha/Questions/QResult15.aspx?qref=12726&lsno=16.
51. How much electricity is lost in transmission and distribution in the United States, Frequently Asked Questions, US Energy Information Administration, July 10, 2015, http://www.eia.gov/tools/faqs/faq.cfm?id=105&t=3.
52. Energy Efficiency Directive: An assessment of the energy efficiency potential of Great Britain’s gas and electricity
infrastructure, Office of Gas and Electricity Markets, June 16, 2015,
https://www.ofgem.gov.uk/sites/default/files/docs/2015/06/energy_efficiency_directive_report_-_final_for_publication.pdf.
53. 77th Report: Accelerated Power Development And Reform Programme (APDRP), Public Accounts Committee, October 23, 2008, http://164.100.47.193/lsscommittee/Public%20Accounts/14_Public%20Accounts_77.pdf.
54. Statement of Objects and Reasons, Electricity (Amendment) Bill, 2014, https://www.prsindia.org/sites/default/files/bill_files/Electricity_%28A%29_bill%2C_2014.pdf.
55. 4th Report: The Electricity (Amendment) Bill, 2014, Standing Committee on Energy, May 7, 2015, http://164.100.47.193/lsscommittee/Energy/16_Energy_4.pdf.
56. Draft amendments to Electricity Act, 2003 for stakeholder consultation, September 7, 2018,
https://www.prsindia.org/sites/default/files/bill_files/Draft%20Electricity%20Bill%202018.pdf.
57. “30th Report: Functioning of Central Electricity Regulatory Commission (CERC)”, Standing Committee on Energy,
August 24, 2012, http://164.100.47.193/lsscommittee/Energy/15_Energy_30.pdf.
58. Rural Electrification Policy, Ministry of Power, August 23, 2006, http://powermin.nic.in/sites/default/files/uploads/RE%20Policy_1.pdf.
59. “Office memorandum: Deendayal Upadhyaya Gram Jyoti Yojana”, Ministry of Power, December 3, 2014, http://powermin.nic.in/rural_electrification/pdf/Deendayal_Upadhyaya_Gram_Jyoti_Yojana.pdf.
DISCLAIMER: This document is being furnished to you for your information. You may choose to reproduce or
redistribute this report for non-commercial purposes in part or in full to any other person with due acknowledgement of
PRS Legislative Research (“PRS”). The opinions expressed herein are entirely those of the author(s). PRS makes every
effort to use reliable and comprehensive information, but PRS does not represent that the contents of the report are
accurate or complete. PRS is an independent, not-for-profit group. This document has been prepared without regard to
the objectives or opinions of those who may receive it.
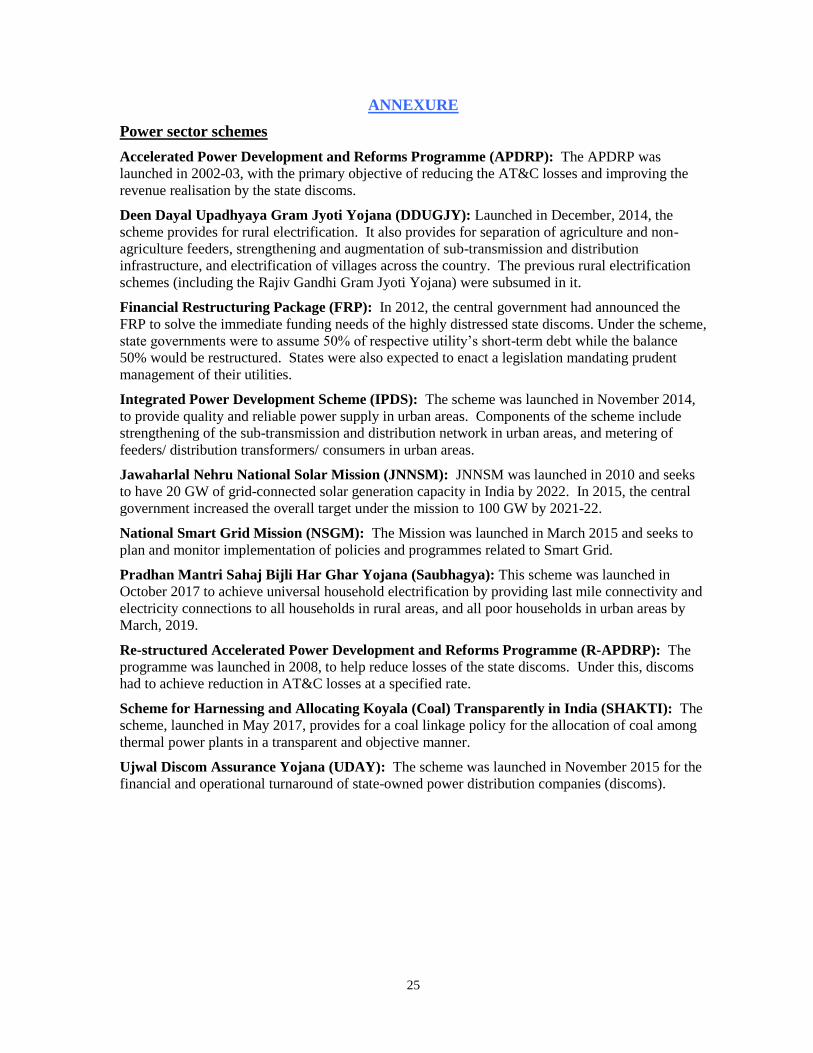
25
ANNEXURE
Power sector schemes
Accelerated Power Development and Reforms Programme (APDRP): The APDRP was
launched in 2002-03, with the primary objective of reducing the AT&C losses and improving the
revenue realisation by the state discoms.
Deen Dayal Upadhyaya Gram Jyoti Yojana (DDUGJY): Launched in December, 2014, the
scheme provides for rural electrification. It also provides for separation of agriculture and non-
agriculture feeders, strengthening and augmentation of sub-transmission and distribution
infrastructure, and electrification of villages across the country. The previous rural electrification
schemes (including the Rajiv Gandhi Gram Jyoti Yojana) were subsumed in it.
Financial Restructuring Package (FRP): In 2012, the central government had announced the
FRP to solve the immediate funding needs of the highly distressed state discoms. Under the scheme,
state governments were to assume 50% of respective utility’s short-term debt while the balance
50% would be restructured. States were also expected to enact a legislation mandating prudent
management of their utilities.
Integrated Power Development Scheme (IPDS): The scheme was launched in November 2014,
to provide quality and reliable power supply in urban areas. Components of the scheme include
strengthening of the sub-transmission and distribution network in urban areas, and metering of
feeders/ distribution transformers/ consumers in urban areas.
Jawaharlal Nehru National Solar Mission (JNNSM): JNNSM was launched in 2010 and seeks
to have 20 GW of grid-connected solar generation capacity in India by 2022. In 2015, the central
government increased the overall target under the mission to 100 GW by 2021-22.
National Smart Grid Mission (NSGM): The Mission was launched in March 2015 and seeks to
plan and monitor implementation of policies and programmes related to Smart Grid.
Pradhan Mantri Sahaj Bijli Har Ghar Yojana (Saubhagya): This scheme was launched in
October 2017 to achieve universal household electrification by providing last mile connectivity and
electricity connections to all households in rural areas, and all poor households in urban areas by
March, 2019.
Re-structured Accelerated Power Development and Reforms Programme (R-APDRP): The
programme was launched in 2008, to help reduce losses of the state discoms. Under this, discoms
had to achieve reduction in AT&C losses at a specified rate.
Scheme for Harnessing and Allocating Koyala (Coal) Transparently in India (SHAKTI): The
scheme, launched in May 2017, provides for a coal linkage policy for the allocation of coal among
thermal power plants in a transparent and objective manner.
Ujwal Discom Assurance Yojana (UDAY): The scheme was launched in November 2015 for the
financial and operational turnaround of state-owned power distribution companies (discoms).

26
Glossary of key terms
Average Cost of Supply (ACS): The average cost incurred by a discom to supply one unit of
power to its consumers. This includes both fixed and variable costs.
Average Revenue Realised (ARR): The average revenue realised by a discom from the sale of
one unit of power to its consumers.
AT&C losses: Aggregate Technical and Commercial (AT&C) loss is the ratio of power for which
the discom did not receive any payment to the total electricity procured by the utility. Technical
losses are incurred due to heat and energy loss in the wires and other equipment. Commercial
losses include non-collection of revenue, and pilferage of electricity.
Cross-subsidy: The cross-subsidy for a consumer category is the difference between the cost to
serve that category of consumers and the average tariff realised from that category of consumers.
Discom/ Distribution utility: Distribution includes maintenance of the distribution network and
retail supply of electricity to the consumers. It is mostly carried out by state-owned distribution
companies (discoms).
Energy deficit: Shortfall in energy supply during a day.
Fuel Supply Agreement (FSA): Agreement between coal company and power producer for the
buying and sale of coal.
Peak deficit: Shortfall in supply during highest consumption period in a day.
Plant Load Factor (PLF): PLF is a measure of the output of a power plant compared to the
maximum output it could produce.
Power Purchase Agreement (PPA): As per the 2003 Act, distribution licensees enter into PPAs
with generation companies for the retail sale of electricity. PPAs are bilateral contracts between the
procurers (discoms) and the generators (power plants).
Smart Grid: Smart Grid is an electricity network that uses information and communication
technology to gather information and act intelligently in automated manner to improve the
efficiency, reliability, economics, and sustainability of generation, transmission and distribution of
electricity.
Tariff petitions and orders: Discoms file tariff petitions with regulators stating the tariff that they
seek to charge from their consumers. The tariffs approved by the regulators are issued in a tariff
order. Typically tariff petitions should be filed annually.
Units: Mega Unit (MU) is one million units of electricity where one unit is equal to one Kilowatt
hour. Giga is equal to billion (109).

27
State-wise data
Table 4 below illustrates the power generation capacity and deficit data across states. Maharashtra
has the maximum generation capacity across all states, followed by Gujarat and Tamil Nadu. The
highest energy deficit is seen in the states of Jammu and Kashmir and Manipur, and in the Union
Territory of Andaman and Nicobar Islands.
Table 4: Power generation capacity and deficit
State/UT
Installed generation capacity (in MW, as on December 31, 2018)
Energy deficit
(2017-18)
Peak deficit
(2017-18)
State Private Central Total (in %) (in %)
Andhra Pradesh 6,968 14,707 2,052 23,726 -0.2% -0.1%
Arunachal Pradesh 107 5 188 301 -1.3% 0.0%
Assam 433 45 1,097 1,575 -3.5% -4.2%
Bihar 781 536 3,024 4,341 -1.5% -0.1%
Chhattisgarh 2,411 9,014 2,101 13,527 -0.3% -6.8%
Goa 0 50 500 550 0.0% -0.2%
Gujarat 7,714 19,356 4,312 31,382 0.0% 0.0%
Haryana 4,032 4,628 2,600 11,261 0.0% -1.4%
Himachal Pradesh 951 1,600 1,498 4,049 -0.6% 0.0%
Jammu and Kashmir 1,534 60 1,795 3,389 -20.0% -20.0%
Jharkhand 554 762 455 1,771 -1.9% -5.4%
Karnataka 8,890 14,782 3,527 27,199 -0.2% -0.5%
Kerala 2,170 998 1,915 5,083 -0.4% -0.6%
Madhya Pradesh 6,528 10,200 5,144 21,873 0.0% -0.3%
Maharashtra 13,901 22,458 7,420 43,779 -0.2% -0.2%
Manipur 41 3 198 242 -5.2% -3.5%
Meghalaya 353 0 212 565 -0.3% -0.3%
Mizoram 36 0 159 196 -1.8% -8.6%
Nagaland 31 1 128 159 -2.9% -5.8%
Odisha 2,488 3,427 1,733 7,648 -0.3% -5.4%
Punjab 4,636 6,558 2,239 13,432 0.0% 0.0%
Rajasthan 7,574 11,242 3,017 21,833 -0.8% -1.3%
Sikkim 412 399 151 962 -0.2% 0.0%
Tamil Nadu 7,145 17,182 6,119 30,447 -0.2% -0.2%
Telangana 8,403 5,427 2,115 15,944 -0.1% -0.1%
Tripura 186 0 548 733 -1.8% 0.0%
Uttarakhand 1,320 1,160 920 3,399 -0.2% 0.0%
Uttar Pradesh 6,218 12,375 6,468 25,061 -1.5% -10.9%
West Bengal 6,578 2,774 1,171 10,523 -0.4% -0.3%
Andaman and Nicobar Islands 45 1 5 52 -9.1% -6.9%
Chandigarh - 32 163 195 -0.6% 0.0%
Dadra and Nagar Haveli - 5 250 255 0.0% 0.0%
Daman and Diu - 13 177 190 0.0% 0.0%
Delhi 1,935 1,153 4,146 7,234 -0.1% -0.4%
Lakshadweep - 1 - 1 0.0% 0.0%
Puducherry 33 2 334 369 -0.3% -0.8%
Total 1,04,408 1,60,958 83,922 3,49,288 -0.7% -2.0% Source: Central Electricity Authority; Power Finance Corporation; PRS.

28
Tables 5 and 6 show the following: (i) the AT&C losses, and (ii) the gap between the average cost
of supplying power (ACS) and the average revenue realised (ARR) from the sale of power, for the
states participating in the UDAY scheme.
Table 5: AT&C losses for states participating in UDAY (in %)
State 2015-16
(base figures) 2016-17 2017-18
As on September 2019
Andhra Pradesh 9.41 10.96 8.69 4.5
Arunachal Pradesh 64.27 35.88 65.45 NA
Assam 25.51 23.81 15.71 22.13
Bihar 43.74 38.97 33.19 27.39
Chhattisgarh 21.79 19.34 18.8 23.28
Goa 17.12 16.79 16.12 26.03
Gujarat 15.04 12.28 11.71 13.09
Haryana 29.83 25.43 20.29 26.18
Himachal Pradesh 12.92 8.48 12.14 8
Jammu & Kashmir 61.6 61.34 53.78 49.76
Jharkhand 34.71 31.8 31.78 31.95
Karnataka 14.94 15.36 14.48 16.1
Kerala 16.03 17.28 12.05 10.29
Madhya Pradesh 23.97 26.53 29.74 29.05
Maharashtra 19.07 18.88 17.41 16.95
Manipur 44.21 36.89 24.61 22.55
Meghalaya 36.48 34.87 34.64 37.76
Punjab 15.9 14.46 17.26 12.04
Rajasthan 30.41 26.02 20.02 29.34
Sikkim 38.06 40.59 32.57 33.04
Tamil Nadu 14.58 14.53 14.23 14.02
Telangana 13.95 15.88 13.5 9.99
Tripura 20.94 16.61 15.52 15.24
Uttar Pradesh 26.47 30.21 27.67 37.95
Uttarakhand 17.19 14.02 15.73 12.64
Dadra & Nagar Haveli − 9.23 6.09 NA
Daman & Diu 13.25 10.65 10.34 NA
Puducherry 19.88 18.98 19.56 16.41
Average for UDAY states 20.8 20.25 18.76 21.41 Note: Depicts data of states that have participated in the UDAY scheme. The data is self-reported by the state discoms. Base year corresponds to the year when the UDAY scheme was started.
Source: UDAY Portal, Ministry of Power; Lok Sabha Unstarred Question No. 1043, June 27, 2019; PRS.

29
Table 6:State-wise details of ACS-ARR Gap Achievement (in Rs/Unit)
State 2015-16
(base figures) 2016-17 2017-18
As on September 2019
Andhra Pradesh 0.82 0.44 0.02 -0.67
Arunachal Pradesh 3.76 5.22 4.32 NA
Assam 0.58 0.3 0.43 1.21
Bihar 0.65 0.59 0.39 0.41
Chhattisgarh 0.18 -0.15 -0.03 0.04
Goa 1.5 0.95 0.41 0.88
Gujarat -0.02 -0.03 -0.04 -0.39
Haryana 0.18 0.04 -0.02 0.41
Himachal Pradesh -0.32 0.21 -0.09 -0.08
Jammu & Kashmir 2.55 2.15 1.96 2.13
Jharkhand 1.22 1.39 0.57 0.54
Karnataka 0.06 0.06 0.07 -0.33
Kerala 0.23 0.53 0.27 0.49
Madhya Pradesh 0.92 0.24 0.33 0.88
Maharashtra 0.3 0.28 -0.07 -0.21
Manipur 1.31 0.1 0.08 0.24
Meghalaya 0.88 1.99 1.3 0.68
Punjab 0.53 0.65 0.48 0.05
Rajasthan 1.65 0.36 -0.33 1.16
Sikkim 7.96 4.62 6.93 0.79
Tamil Nadu 0.6 0.39 0.28 0.85
Telangana 0.69 1.24 0.55 0.42
Tripura 0.24 0.02 0.08 0.05
Uttar Pradesh 0.88 0.62 0.28 0.61
Uttarakhand 0.1 0.22 0.17 0.22
Dadra & Nagar Haveli - 0.27 0.06 NA
Daman & Diu -0.11 -0.11 -0.02 NA
Puducherry 0.03 -0.11 0 0.04
Average for UDAY states 0.6 0.42 0.17 0.25
Note: Depicts data of states that have participated in the UDAY scheme. The data is self-reported by the state discoms. Base year
corresponds to the year when the UDAY scheme was started.
Source: UDAY Portal, Ministry of Power; Lok Sabha Unstarred Question No. 1043, June 27, 2019; PRS.

30
Table 7 shows the estimated requirement of electricity in the year 2019-20.
Table 7: Estimated requirement of electricity in 2019-20 (in million units)
State/UTs 2019-20
Andhra Pradesh 68,034
Arunachal Pradesh 1,210
Assam 11,894
Bihar 31,017
Chhattisgarh 33,463
Delhi 35,380
Goa 5,068
Gujarat 1,20,693
Haryana 57,083
Himachal Pradesh 10,949
Jammu & Kashmir 17,109
Jharkhand 27,488
Karnataka 77,532
Kerala 28,535
Madhya Pradesh 88,022
Maharashtra 1,71,313
Manipur 1,769
Meghalaya 2,378
Mizoram 737
Nagaland 992
Odisha 30,302
Punjab 64,730
Rajasthan 83,168
Sikkim 577
Tamil Nadu 1,23,724
Telangana 75,164
Tripura 1,456
Uttar Pradesh 1,32,476
Uttarakhand 17,007
West Bengal 63,979
Andaman & Nicobar Islands 414
Chandigarh 2,145
Dadra & Nagar Haveli 8,210
Daman & Diu 2,449
Lakshadweep 57
Puducherry 3,387
All India 13,99,913 Sources: Unstarred Question No. 5371, Lok Sabha Questions, July 25, 2019.