owez r 113 20090803 lightning - noordzeewind · analysis and evaluation on collected lightning...
TRANSCRIPT
KEMA Nederland B.V. Utrechtseweg 310, 6812 AR Arnhem P.O. Box 9035, 6800 ET Arnhem The Netherlands T +31 26 3 56 91 11 F +31 26 3 89 24 77 [email protected] www.kema.com Registered Arnhem 09080262
50863511.400-TOS/ECC 09-5341 OWEZ_R_113_20090803
NSW-MEP - design conditions lightning
Analysis and evaluation on collected lightning stri ke data
Arnhem, August 3rd 2009 Author: Luc Verhees
By order of
author : L. Verhees 09-08-03 reviewed : R. de Graaff 09-08-
B 31 pages annexes WSc approved : M.P. de Jong 09-08-

© KEMA Nederland B.V., Arnhem, the Netherlands. All rights reserved. It is prohibited to change any and all versions of this document in any manner whatsoever, including but not limited to dividing it into parts. In case of a conflict between the electronic version (e.g. PDF file) and the original paper version provided by KEMA, the latter will prevail. KEMA Nederland B.V. and/or its associated companies disclaim liability for any direct, indirect, consequential or incidental damages that may result from the use of the information or data, or from the inability to use the information or data contained in this document. The contents of this report may only be transmitted to third parties in its entirety and provided with the copyright notice, prohibition to change, electronic versions’ validity notice and disclaimer.

-3- OWEZ_R_113_20090803 CONTENTS page
SUMMARY...............................................................................................................................4
1 General ...................................................................................................................5
2 Location of the OWEZ ............................................................................................6
3 KNMI lightning data ................................................................................................8 3.1 General Information ................................................................................................8 3.2 Extraction of relevant data ....................................................................................11
4 Determination of potential strokes on turbines .....................................................14
5 Lightning data from OWEZ ...................................................................................22
6 Comparision of the OWEZ SCADA data with the KNMI data ...............................26 6.1 Comparison of the number of strokes...................................................................26 6.2 Taking the position-finding of the FLITS system in closer consideration..............26 6.3 Comparison between the FLITS and SCADA data on a daily time-scale.............28
7 Conclusion............................................................................................................30
REFERENCES.......................................................................................................................31
Appendix I Discharges and strokes in the wind farm and its vicinity ................................32
-4- OWEZ_R_113_20090803 SUMMARY
NoordzeeWind is a joint venture between utility company Nuon and oil company Shell and
has been set up specifically for the development, construction and operation of the Off shore
Wind farm Egmond aan Zee (OWEZ), which counts 36 wind turbines.
As part of the OWEZ project NoordzeeWind will carry out an extensive measurement and
evaluation program (NSW-MEP). One of the tasks in this program is to gain knowledge on
the frequency of occurrence of lightning strokes on wind turbines offshore. In this report the
results of an analysis is presented that KEMA has performed on lightning strike data during
the years 2006 - 2008 from the FLITS system of the Royal Netherlands Meteorological
Institute (KNMI) and the SCADA system of the off shore wind farm near Egmond aan Zee.
The FLITS system is based on the measurements of radio frequency pulses which are
emitted by lightning.
The predicted amount of strokes in wind turbines using data from the FLITS system and the
IEC 61400-24 method for determining the collection area of an isolated structure, are ten to
hundred times lower than the amount of strokes detected by the SCADA system.
Furthermore, there is a mismatch between the data of the FLITS and the SCADA system in
both the position and the time of the strokes. In the same seconds or minutes the SCADA
system detects strokes in wind turbines, the FLITS system hardly shows any corresponding
strokes (this also applies to cloud-cloud discharges). Also on a daily time scale, there is no
significant correlation between the number of strokes detected by the FLITS and the SCADA
system. Therefore the FLITS system is unsuitable for detecting strokes, nor for giving an
indication of lightning stroke activity, in wind turbines at the location of the Off shore Wind
farm Egmond aan Zee.

-5- OWEZ_R_113_20090803 1 GENERAL
NoordzeeWind is a joint venture between utility company Nuon and oil company Shell and
has been set up specifically for the development, construction and operation of the Off shore
Wind farm Egmond aan Zee (OWEZ).
As part of the OWEZ project NoordzeeWind will carry out an extensive measurement and
evaluation program (NSW-MEP). The contents of the NSW-MEP are about generating data
and knowledge. The aim of task 1.1.3 - Design conditions lightning – of the NSW-MEP
program is to gain knowledge on the frequency of occurrence of lightning strokes on wind
turbines offshore.
Lightning strokes hitting wind turbines or one of its components may cause failure of one or
more systems and a stand still of the wind turbine. The consequences of a lightning stroke
may differ to a considerable extent, from a temporarily outage of internal communication
lines to a complete destruction of all rotor blades.
On all wind turbines in the OWEZ offshore park there are lightning detection systems in the
tree blades. This “native” lightning system reports lightning as alarms and warnings to the
SCADA system.
In this report the results of an analysis is presented that KEMA has performed on lightning
strike data during 2006, 2007 and 2008 from the Royal Netherlands Meteorological Institute
(KNMI) and the SCADA system of the off shore wind farm near Egmond aan Zee.
The Off Shore wind Farm Egmond aan Zee has a subsidy of the Ministry of Economic Affairs
under the CO2 Reduction Scheme of the Netherlands.

-6- OWEZ_R_113_20090803 2 LOCATION OF THE OWEZ
The Off shore Wind farm Egmond aan Zee (OWEZ) is located 10-18 kilometres offshore from
the Dutch coastal village Egmond aan Zee. Figure 1 shows the lay out of the wind farm (the
boundaries of the concession area are shown as a solid line) [1]. Table 1 gives the
coordinates of all individual wind turbines in the park, which are shown in figure 1 as
triangles. The minimum distance between two wind turbines is 640 meters.
Figure 1 Boundary of the windpark and positions of the wind turbines
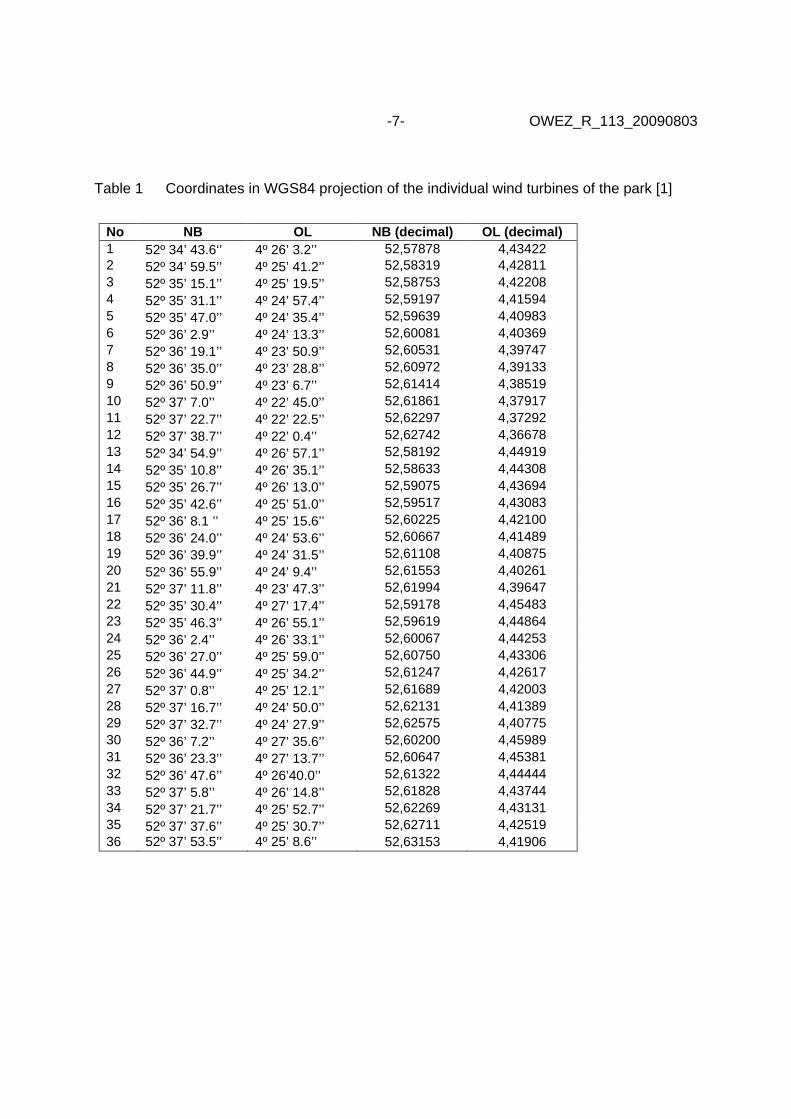
-7- OWEZ_R_113_20090803 Table 1 Coordinates in WGS84 projection of the individual wind turbines of the park [1]
No NB OL NB (decimal) OL (decimal) 1 52º 34’ 43.6‘’ 4º 26’ 3.2’’ 52,57878 4,43422 2 52º 34’ 59.5’’ 4º 25’ 41.2’’ 52,58319 4,42811 3 52º 35’ 15.1’’ 4º 25’ 19.5’’ 52,58753 4,42208 4 52º 35’ 31.1’’ 4º 24’ 57.4’’ 52,59197 4,41594 5 52º 35’ 47.0’’ 4º 24’ 35.4’’ 52,59639 4,40983 6 52º 36’ 2.9’’ 4º 24’ 13.3’’ 52,60081 4,40369 7 52º 36’ 19.1’’ 4º 23’ 50.9’’ 52,60531 4,39747 8 52º 36’ 35.0’’ 4º 23’ 28.8’’ 52,60972 4,39133 9 52º 36’ 50.9’’ 4º 23’ 6.7’’ 52,61414 4,38519 10 52º 37’ 7.0’’ 4º 22’ 45.0’’ 52,61861 4,37917 11 52º 37’ 22.7’’ 4º 22’ 22.5’’ 52,62297 4,37292 12 52º 37’ 38.7’’ 4º 22’ 0.4’’ 52,62742 4,36678 13 52º 34’ 54.9’’ 4º 26’ 57.1’’ 52,58192 4,44919 14 52º 35’ 10.8’’ 4º 26’ 35.1’’ 52,58633 4,44308 15 52º 35’ 26.7’’ 4º 26’ 13.0’’ 52,59075 4,43694 16 52º 35’ 42.6’’ 4º 25’ 51.0’’ 52,59517 4,43083 17 52º 36’ 8.1 ’’ 4º 25’ 15.6’’ 52,60225 4,42100 18 52º 36’ 24.0’’ 4º 24’ 53.6’’ 52,60667 4,41489 19 52º 36’ 39.9’’ 4º 24’ 31.5’’ 52,61108 4,40875 20 52º 36’ 55.9’’ 4º 24’ 9.4’’ 52,61553 4,40261 21 52º 37’ 11.8’’ 4º 23’ 47.3’’ 52,61994 4,39647 22 52º 35’ 30.4’’ 4º 27’ 17.4’’ 52,59178 4,45483 23 52º 35’ 46.3’’ 4º 26’ 55.1’’ 52,59619 4,44864 24 52º 36’ 2.4’’ 4º 26’ 33.1’’ 52,60067 4,44253 25 52º 36’ 27.0’’ 4º 25’ 59.0’’ 52,60750 4,43306 26 52º 36’ 44.9’’ 4º 25’ 34.2’’ 52,61247 4,42617 27 52º 37’ 0.8’’ 4º 25’ 12.1’’ 52,61689 4,42003 28 52º 37’ 16.7’’ 4º 24’ 50.0’’ 52,62131 4,41389 29 52º 37’ 32.7’’ 4º 24’ 27.9’’ 52,62575 4,40775 30 52º 36’ 7.2’’ 4º 27’ 35.6’’ 52,60200 4,45989 31 52º 36’ 23.3’’ 4º 27’ 13.7’’ 52,60647 4,45381 32 52º 36’ 47.6’’ 4º 26’40.0’’ 52,61322 4,44444 33 52º 37’ 5.8’’ 4º 26’ 14.8’’ 52,61828 4,43744 34 52º 37’ 21.7’’ 4º 25’ 52.7’’ 52,62269 4,43131 35 52º 37’ 37.6’’ 4º 25’ 30.7’’ 52,62711 4,42519 36 52º 37’ 53.5’’ 4º 25’ 8.6’’ 52,63153 4,41906
-8- OWEZ_R_113_20090803 3 KNMI LIGHTNING DATA
3.1 General Information
The registration of lightning by the KNMI (Royal Netherlands Meteorological Institute) is
based on the measurements of radio frequency pulses which are emitted by lightning. KNMI
uses the lightning detection system FLITS, which stands for Flash Localisation by
Interferometry and Time of Arrival System [2]. The FLITS system uses two methods for
determining the location of the discharge or stroke:
• time of arrival (TAO): this method uses the time difference between detection of radio
waves in the Low Frequency (LF) area of the radio frequency (< 4 MHz) at several the
lightning detection stations
• detection finding: this method uses the angles of the received radio waves in the Very
High Frequency (VHF) area of the radio frequency (about 110 MHz) at several lightning
detection stations.
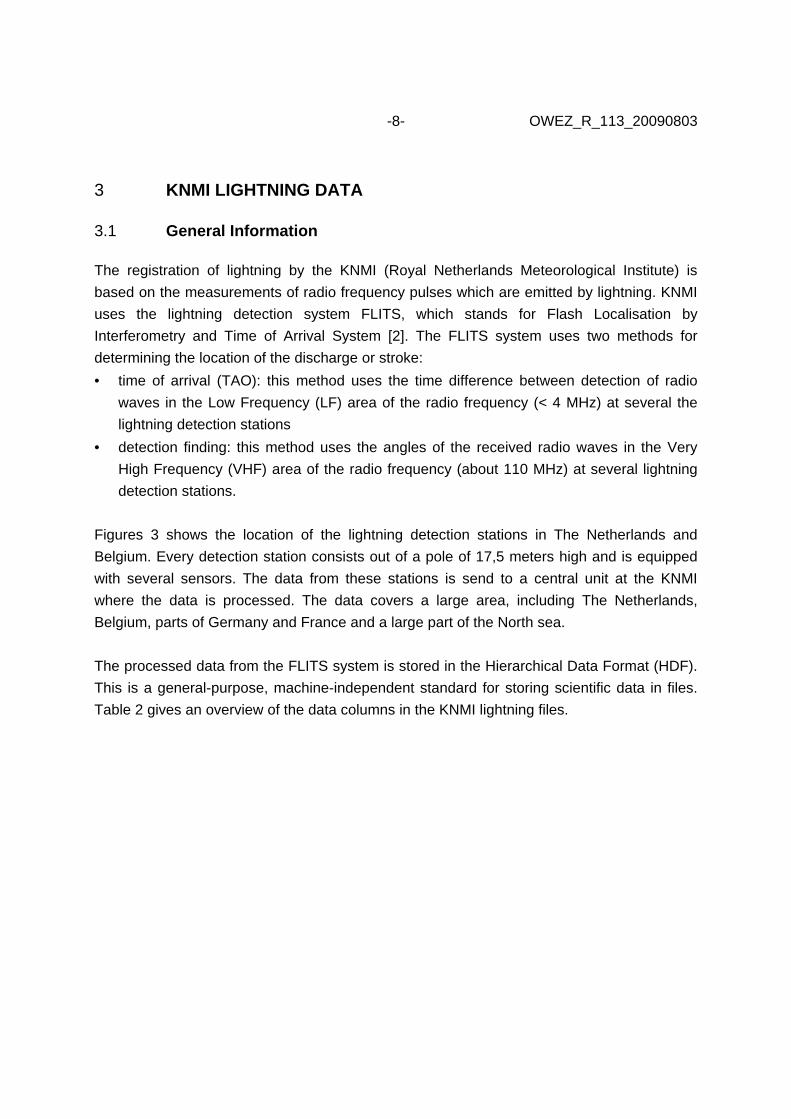
Figures 3 shows the location of the lightning detection stations in The Netherlands and
Belgium. Every detection station consists out of a pole of 17,5 meters high and is equipped
with several sensors. The data from these stations is send to a central unit at the KNMI
where the data is processed. The data covers a large area, including The Netherlands,
Belgium, parts of Germany and France and a large part of the North sea.
The processed data from the FLITS system is stored in the Hierarchical Data Format (HDF).
This is a general-purpose, machine-independent standard for storing scientific data in files.
Table 2 gives an overview of the data columns in the KNMI lightning files.
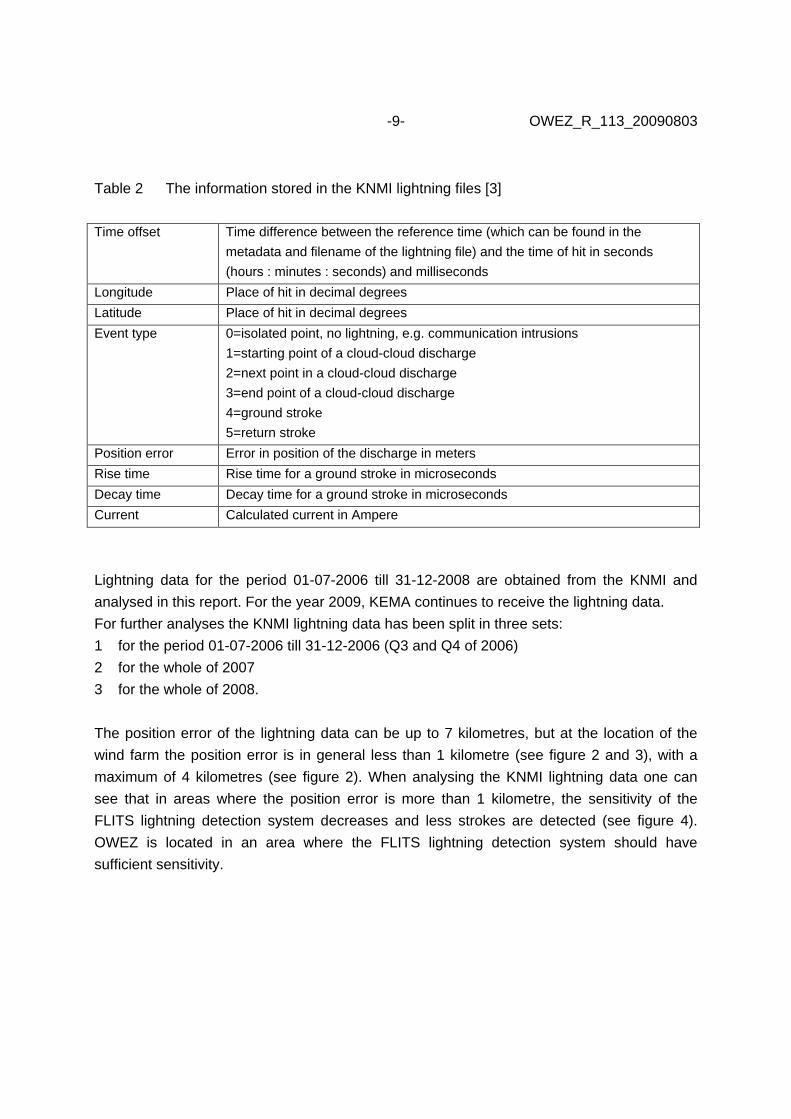
-9- OWEZ_R_113_20090803 Table 2 The information stored in the KNMI lightning files [3]
Time offset Time difference between the reference time (which can be found in the
metadata and filename of the lightning file) and the time of hit in seconds
(hours : minutes : seconds) and milliseconds
Longitude Place of hit in decimal degrees
Latitude Place of hit in decimal degrees
Event type 0=isolated point, no lightning, e.g. communication intrusions
1=starting point of a cloud-cloud discharge
2=next point in a cloud-cloud discharge
3=end point of a cloud-cloud discharge
4=ground stroke
5=return stroke
Position error Error in position of the discharge in meters
Rise time Rise time for a ground stroke in microseconds
Decay time Decay time for a ground stroke in microseconds
Current Calculated current in Ampere
Lightning data for the period 01-07-2006 till 31-12-2008 are obtained from the KNMI and
analysed in this report. For the year 2009, KEMA continues to receive the lightning data.
For further analyses the KNMI lightning data has been split in three sets:
1 for the period 01-07-2006 till 31-12-2006 (Q3 and Q4 of 2006)
2 for the whole of 2007
3 for the whole of 2008.
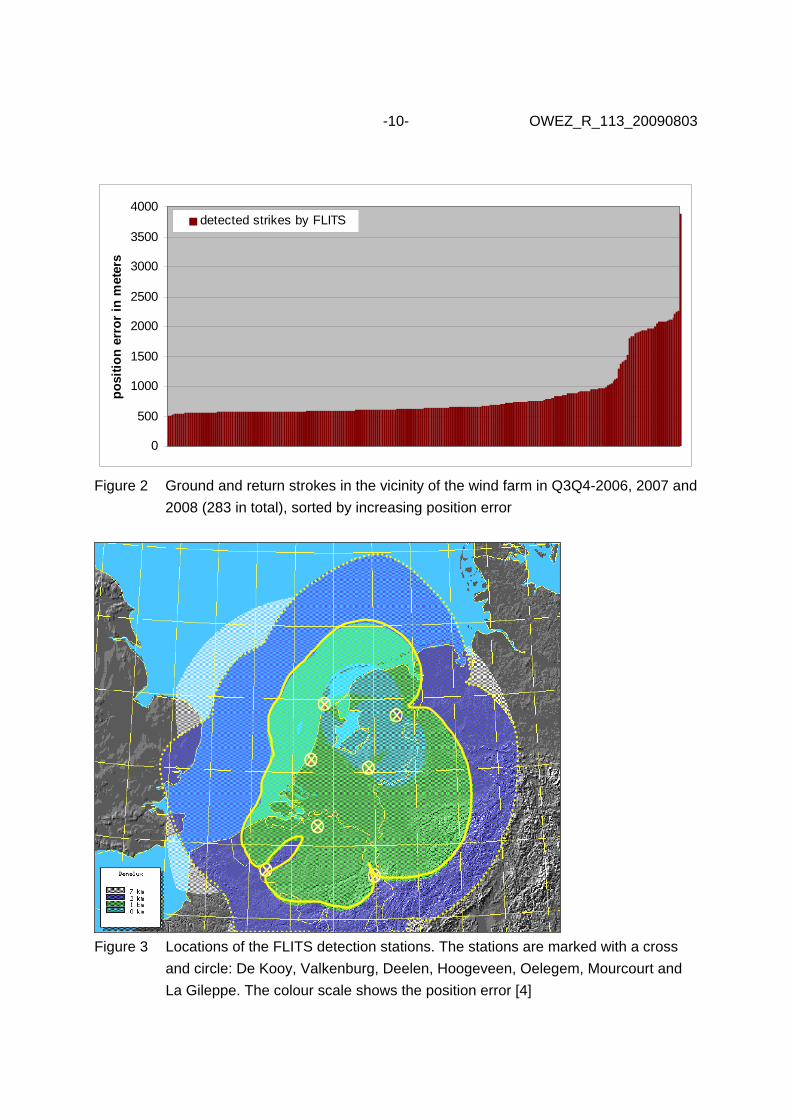
The position error of the lightning data can be up to 7 kilometres, but at the location of the
wind farm the position error is in general less than 1 kilometre (see figure 2 and 3), with a
maximum of 4 kilometres (see figure 2). When analysing the KNMI lightning data one can
see that in areas where the position error is more than 1 kilometre, the sensitivity of the
FLITS lightning detection system decreases and less strokes are detected (see figure 4).
OWEZ is located in an area where the FLITS lightning detection system should have
sufficient sensitivity.
-10- OWEZ_R_113_20090803
0
500
1000
1500
2000
2500
3000
3500
4000
posi
tion
erro
r in
met
ers
detected strikes by FLITS
Figure 2 Ground and return strokes in the vicinity of the wind farm in Q3Q4-2006, 2007 and
2008 (283 in total), sorted by increasing position error
Figure 3 Locations of the FLITS detection stations. The stations are marked with a cross
and circle: De Kooy, Valkenburg, Deelen, Hoogeveen, Oelegem, Mourcourt and
La Gileppe. The colour scale shows the position error [4]

-11- OWEZ_R_113_20090803
Figure 4 All cloud-to-cloud strokes (purple) and ground and return strokes (blue) in
Q3-2007. The little square is the OWEZ area
3.2 Extraction of relevant data
For further analyses, all lightning events were extracted from the data files that took place
within 7 kilometres of the outermost wind turbines of the OWEZ. The surface of the OWEZ
including the buffer is 405 square kilometres. A buffer of 7 kilometres is chosen because this
is the maximum possible location error of a stroke in the FLITS data. In practice, at the
location of the wind farm the position error is less than 7 kilometres (see figure 2 and 3), but
in order to be 100% sure all strokes that can theoretically occur in the wind farm are taken
into account, a boundary of 7 kilometres is chosen.
Analyses of the lightning data shows that the number of days that ground- and/or return
strokes occur within 7 kilometres of the outermost wind turbines of the wind farm are limited.
In Q3 and Q4 of 2006 there were 12 days with ground- and/or return strokes in the wind
farm and its vicinity. In 2007 and 2008 there were respectively 9 and 14 of such days. See
table 3.
The total amount of registered ground- and return strokes is 90 in Q3 and Q4 of 2006, 131 in
2007 and 62 in 2008 (table 3). That is 0,45, 0,32 and 0,15 strokes/km2/year respectively. This
is a considerable lower figure compared to figures found in literature for the Dutch coastal
area. The KNMI gives an average of 1,3 strokes/km2/year [6] and the NEN1014 publication
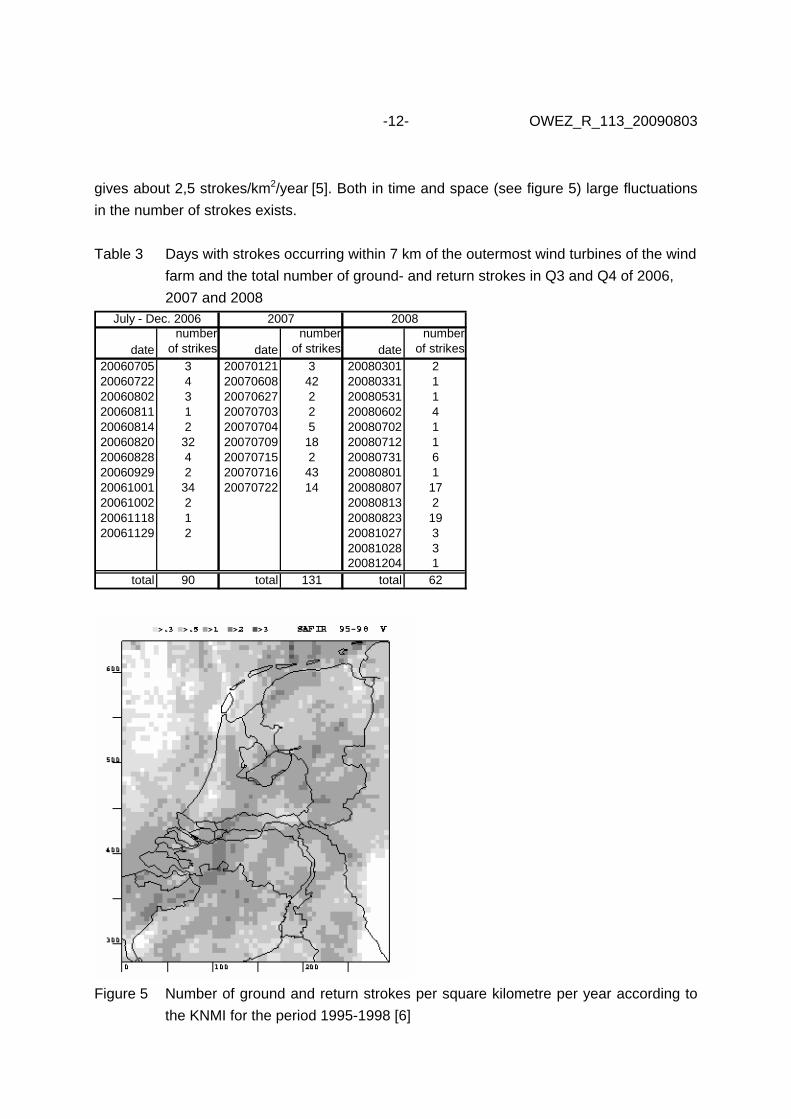
-12- OWEZ_R_113_20090803 gives about 2,5 strokes/km2/year [5]. Both in time and space (see figure 5) large fluctuations
in the number of strokes exists.
Table 3 Days with strokes occurring within 7 km of the outermost wind turbines of the wind
farm and the total number of ground- and return strokes in Q3 and Q4 of 2006,
2007 and 2008
datenumber
of strikes datenumber
of strikes datenumber
of strikes
20060705 3 20070121 3 20080301 220060722 4 20070608 42 20080331 120060802 3 20070627 2 20080531 120060811 1 20070703 2 20080602 420060814 2 20070704 5 20080702 120060820 32 20070709 18 20080712 120060828 4 20070715 2 20080731 620060929 2 20070716 43 20080801 120061001 34 20070722 14 20080807 1720061002 2 20080813 220061118 1 20080823 1920061129 2 20081027 3
20081028 320081204 1
total 90 total 131 total 62
July - Dec. 2006 20082007
Figure 5 Number of ground and return strokes per square kilometre per year according to
the KNMI for the period 1995-1998 [6]
-13- OWEZ_R_113_20090803 Most registered discharges are cloud tot cloud discharges. Only a small percentage of the
discharges develops into a ground or return stroke. Appendix I gives an overview of all
detected discharges and strokes within 7 kilometres of the outermost wind turbines of the
wind farm in Q3 and Q4 of 2006, in 2007 and in 2008.
-14- OWEZ_R_113_20090803 4 DETERMINATION OF POTENTIAL STROKES ON TURBINES
By using the coordinates of the 36 wind turbines (see table 1), and the coordinates of the
ground- and return strokes including their position error, all strokes can be determined that
could theoretically have struck a wind turbine. A GIS (Geographical Information System) was
used for carrying out this analysis.
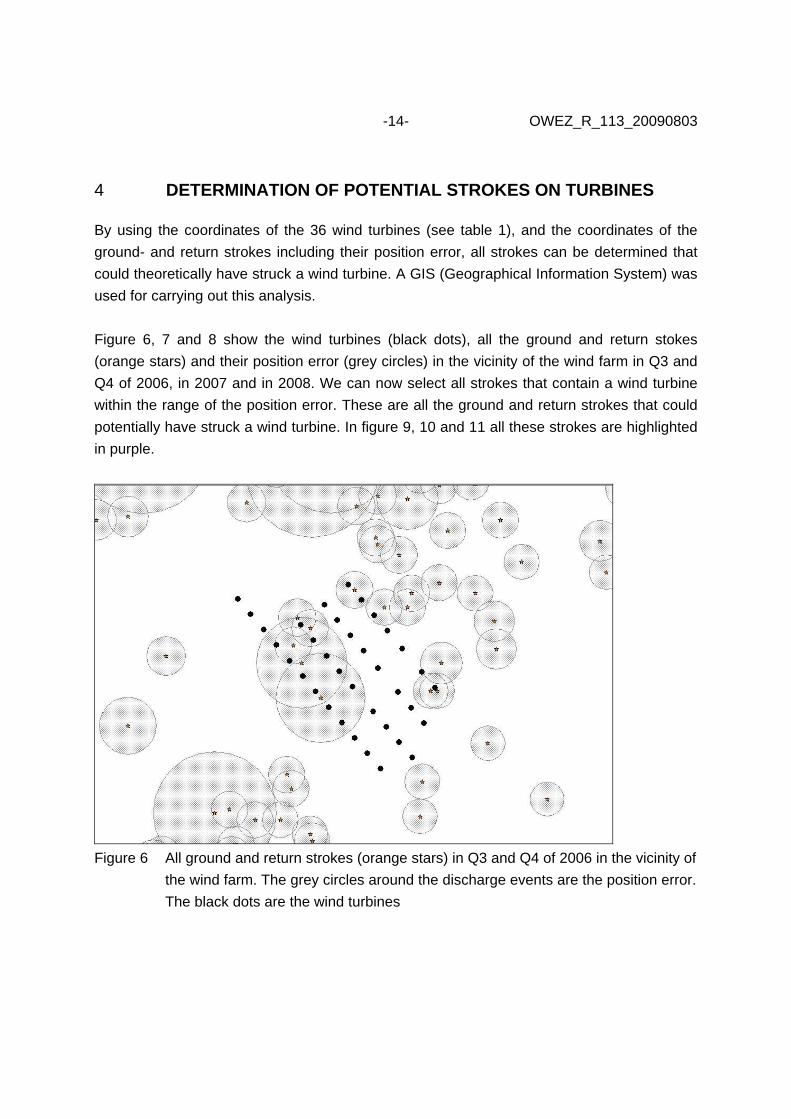
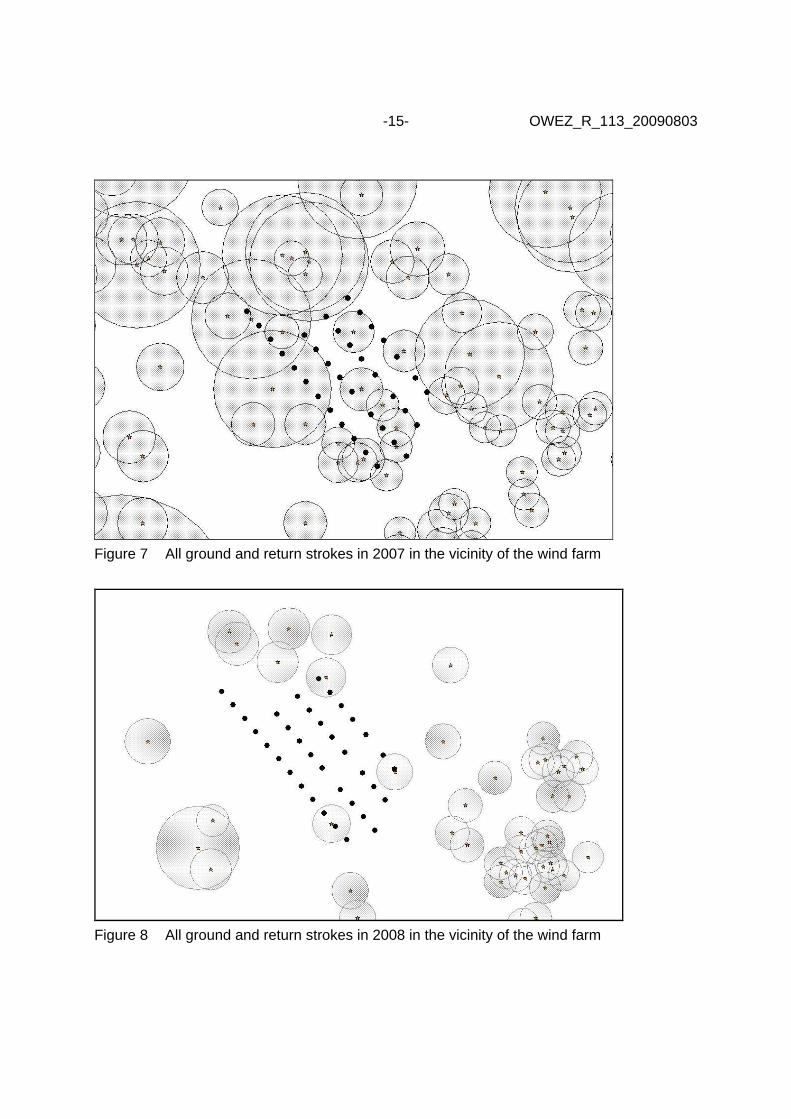
Figure 6, 7 and 8 show the wind turbines (black dots), all the ground and return stokes
(orange stars) and their position error (grey circles) in the vicinity of the wind farm in Q3 and
Q4 of 2006, in 2007 and in 2008. We can now select all strokes that contain a wind turbine
within the range of the position error. These are all the ground and return strokes that could
potentially have struck a wind turbine. In figure 9, 10 and 11 all these strokes are highlighted
in purple.
Figure 6 All ground and return strokes (orange stars) in Q3 and Q4 of 2006 in the vicinity of
the wind farm. The grey circles around the discharge events are the position error.
The black dots are the wind turbines
-15- OWEZ_R_113_20090803
Figure 7 All ground and return strokes in 2007 in the vicinity of the wind farm
Figure 8 All ground and return strokes in 2008 in the vicinity of the wind farm

-16- OWEZ_R_113_20090803
Figure 9 The ground and return strokes in Q3 and Q4 of 2006 in the vicinity of the wind
farm which could potentially have struck one or more wind turbines
Figure 10 The ground and return strokes in 2007 in the vicinity of the wind farm which could
potentially have struck one or more wind turbines
-17- OWEZ_R_113_20090803
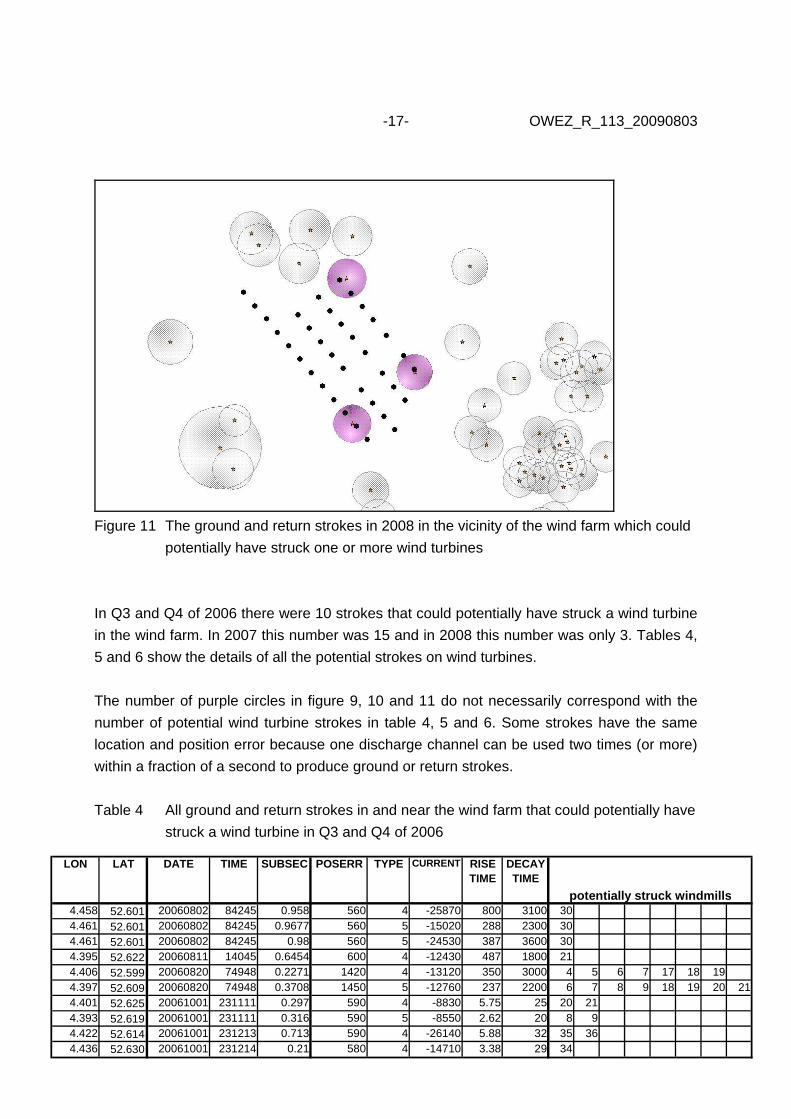
Figure 11 The ground and return strokes in 2008 in the vicinity of the wind farm which could
potentially have struck one or more wind turbines
In Q3 and Q4 of 2006 there were 10 strokes that could potentially have struck a wind turbine
in the wind farm. In 2007 this number was 15 and in 2008 this number was only 3. Tables 4,
5 and 6 show the details of all the potential strokes on wind turbines.
The number of purple circles in figure 9, 10 and 11 do not necessarily correspond with the
number of potential wind turbine strokes in table 4, 5 and 6. Some strokes have the same
location and position error because one discharge channel can be used two times (or more)
within a fraction of a second to produce ground or return strokes.
Table 4 All ground and return strokes in and near the wind farm that could potentially have
struck a wind turbine in Q3 and Q4 of 2006
4.458 52.601 20060802 84245 0.958 560 4 -25870 800 3100 304.461 52.601 20060802 84245 0.9677 560 5 -15020 288 2300 304.461 52.601 20060802 84245 0.98 560 5 -24530 387 3600 304.395 52.622 20060811 14045 0.6454 600 4 -12430 487 1800 214.406 52.599 20060820 74948 0.2271 1420 4 -13120 350 3000 4 5 6 7 17 18 194.397 52.609 20060820 74948 0.3708 1450 5 -12760 237 2200 6 7 8 9 18 19 20 214.401 52.625 20061001 231111 0.297 590 4 -8830 5.75 25 20 214.393 52.619 20061001 231111 0.316 590 5 -8550 2.62 20 8 94.422 52.614 20061001 231213 0.713 590 4 -26140 5.88 32 35 364.436 52.630 20061001 231214 0.21 580 4 -14710 3.38 29 34
LON LAT DATE TIME SUBSEC POSERR TYPE CURRENT
potentially struck windmills
RISETIME
DECAYTIME
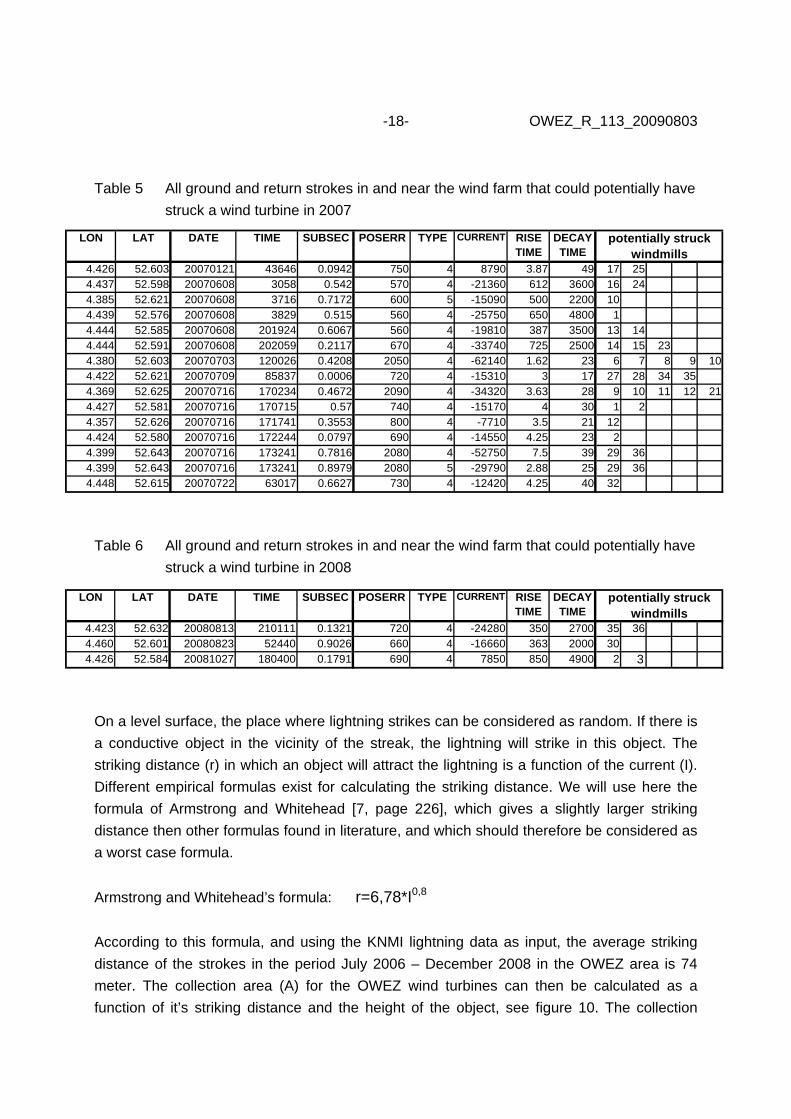
-18- OWEZ_R_113_20090803 Table 5 All ground and return strokes in and near the wind farm that could potentially have
struck a wind turbine in 2007
Table 6 All ground and return strokes in and near the wind farm that could potentially have
struck a wind turbine in 2008
On a level surface, the place where lightning strikes can be considered as random. If there is
a conductive object in the vicinity of the streak, the lightning will strike in this object. The
striking distance (r) in which an object will attract the lightning is a function of the current (I).
Different empirical formulas exist for calculating the striking distance. We will use here the
formula of Armstrong and Whitehead [7, page 226], which gives a slightly larger striking
distance then other formulas found in literature, and which should therefore be considered as
a worst case formula.
Armstrong and Whitehead’s formula: r=6,78*I0,8
According to this formula, and using the KNMI lightning data as input, the average striking
distance of the strokes in the period July 2006 – December 2008 in the OWEZ area is 74
meter. The collection area (A) for the OWEZ wind turbines can then be calculated as a
function of it’s striking distance and the height of the object, see figure 10. The collection
4.423 52.632 20080813 210111 0.1321 720 4 -24280 350 2700 35 364.460 52.601 20080823 52440 0.9026 660 4 -16660 363 2000 304.426 52.584 20081027 180400 0.1791 690 4 7850 850 4900 2 3
SUBSEC POSERRLATLON DATE TIME TYPE CURRENT potentially struck windmills
RISETIME
DECAYTIME
4.426 52.603 20070121 43646 0.0942 750 4 8790 3.87 49 17 254.437 52.598 20070608 3058 0.542 570 4 -21360 612 3600 16 244.385 52.621 20070608 3716 0.7172 600 5 -15090 500 2200 104.439 52.576 20070608 3829 0.515 560 4 -25750 650 4800 14.444 52.585 20070608 201924 0.6067 560 4 -19810 387 3500 13 144.444 52.591 20070608 202059 0.2117 670 4 -33740 725 2500 14 15 234.380 52.603 20070703 120026 0.4208 2050 4 -62140 1.62 23 6 7 8 9 104.422 52.621 20070709 85837 0.0006 720 4 -15310 3 17 27 28 34 354.369 52.625 20070716 170234 0.4672 2090 4 -34320 3.63 28 9 10 11 12 214.427 52.581 20070716 170715 0.57 740 4 -15170 4 30 1 24.357 52.626 20070716 171741 0.3553 800 4 -7710 3.5 21 124.424 52.580 20070716 172244 0.0797 690 4 -14550 4.25 23 24.399 52.643 20070716 173241 0.7816 2080 4 -52750 7.5 39 29 364.399 52.643 20070716 173241 0.8979 2080 5 -29790 2.88 25 29 364.448 52.615 20070722 63017 0.6627 730 4 -12420 4.25 40 32
SUBSEC POSERRLATLON DATE TIME TYPE CURRENT potentially struck windmills
RISETIME
DECAYTIME
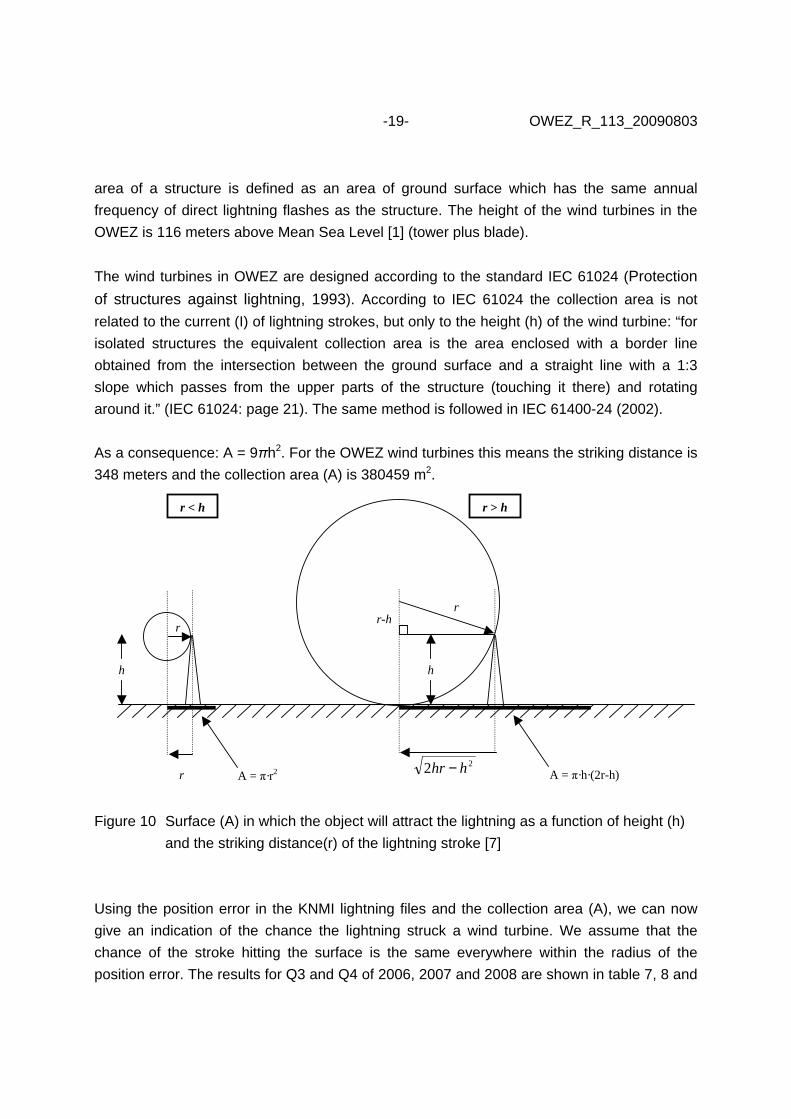
-19- OWEZ_R_113_20090803 area of a structure is defined as an area of ground surface which has the same annual
frequency of direct lightning flashes as the structure. The height of the wind turbines in the
OWEZ is 116 meters above Mean Sea Level [1] (tower plus blade).
The wind turbines in OWEZ are designed according to the standard IEC 61024 (Protection
of structures against lightning, 1993). According to IEC 61024 the collection area is not
related to the current (I) of lightning strokes, but only to the height (h) of the wind turbine: “for
isolated structures the equivalent collection area is the area enclosed with a border line
obtained from the intersection between the ground surface and a straight line with a 1:3
slope which passes from the upper parts of the structure (touching it there) and rotating
around it.” (IEC 61024: page 21). The same method is followed in IEC 61400-24 (2002).
As a consequence: A = 9πh2. For the OWEZ wind turbines this means the striking distance is
348 meters and the collection area (A) is 380459 m2.
r < h r > h
h
A = π·r2 A = π·h·(2r-h)
r
r r-h
h
r22 hhr −
Figure 10 Surface (A) in which the object will attract the lightning as a function of height (h)
and the striking distance(r) of the lightning stroke [7]
Using the position error in the KNMI lightning files and the collection area (A), we can now
give an indication of the chance the lightning struck a wind turbine. We assume that the
chance of the stroke hitting the surface is the same everywhere within the radius of the
position error. The results for Q3 and Q4 of 2006, 2007 and 2008 are shown in table 7, 8 and

-20- OWEZ_R_113_20090803 9. The collection area according to the IEC 61024 method as well as according to Armstrong
& Whitehead’s formula are given in these tables.
Table 7 All ground and return strokes in the OWEZ area in Q3 and Q4 of 2006 and their
chance of hitting a wind turbine Armstrong & Whitehead formula
4.458 52.601 20060802 84245 0.958 560 -25870 985204 90 25691 2.61% 38.62%4.461 52.601 20060802 84245 0.9677 560 -15020 985204 59 10764 1.09% 38.62%4.461 52.601 20060802 84245 0.98 560 -24530 985204 87 23595 2.39% 38.62%4.395 52.622 20060811 14045 0.6454 600 -12430 1130973 50 7952 0.70% 33.64%4.406 52.599 20060820 74948 0.2271 1420 -13120 6334708 53 8669 0.96% 42.04%4.397 52.609 20060820 74948 0.3708 1450 -12760 6605199 51 8292 1.00% 46.08%4.401 52.625 20061001 231111 0.297 590 -8830 1093589 38 4601 0.84% 69.58%4.393 52.619 20061001 231111 0.316 590 -8550 1093589 37 4370 0.80% 69.58%4.422 52.614 20061001 231213 0.713 590 -26140 1093589 91 26121 4.78% 69.58%4.436 52.630 20061001 231214 0.21 580 -14710 1056832 58 10411 0.99% 36.00%
CURRENT (ampère)
striking distance
(r)
chancemill is hit (%)
IEC 61024LON LAT DATE TIME surface
(A)
surfacePOSERR
(m2)
chancemill is hit (%)SUBSEC
POSERR(m)
Table 8 All ground and return strokes in the OWEZ area in 2007 and their chance of
hitting a wind turbine Armstrong & Whitehead formula
4.426 52.603 20070121 43646 0.0942 750 8790 1767146 38 4568 0.52% 43.06%4.437 52.598 20070608 3058 0.542 570 -21360 1020704 78 18909 3.71% 74.55%4.385 52.621 20070608 3716 0.7172 600 -15090 1130973 59 10844 0.96% 33.64%4.439 52.576 20070608 3829 0.515 560 -25750 985204 90 25500 2.59% 38.62%4.444 52.585 20070608 201924 0.6067 560 -19810 985204 73 16762 3.40% 77.23%4.444 52.591 20070608 202059 0.2117 670 -33740 1410261 112 39294 8.36% 80.93%4.380 52.603 20070703 120026 0.4208 2050 -62140 13202545 182 90591 3.43% 14.41%4.422 52.621 20070709 85837 0.0006 720 -15310 1628602 59 11098 2.73% 93.44%4.369 52.625 20070716 170234 0.4672 2090 -34320 13722792 113 40381 1.47% 13.86%4.427 52.581 20070716 170715 0.57 740 -15170 1720336 59 10936 1.27% 44.23%4.357 52.626 20070716 171741 0.3553 800 -7710 2010620 34 3703 0.18% 18.92%4.424 52.580 20070716 172244 0.0797 690 -14550 1495712 57 10230 0.68% 25.44%4.399 52.643 20070716 173241 0.7816 2080 -52750 13591788 160 74271 1.09% 5.60%4.399 52.643 20070716 173241 0.8979 2080 -29790 13591788 101 32197 0.47% 5.60%4.448 52.615 20070722 63017 0.6627 730 -12420 1674155 50 7941 0.47% 22.73%
LON LAT DATE TIMEchance
mill is hit (%)IEC 61024
SUBSECPOSERR
(m)CURRENT (ampère)
striking distance
(r)
chancemill is hit (%)surface
(A)
surfacePOSERR
(m2)
Table 9 All ground and return strokes in the OWEZ area in 2008 and their chance of
hitting a wind turbine Armstrong & Whitehead formula
4.423 52.632 20080813 210111 0.1321 720 -24280 1628602 86 23211 2.85% 46.72%4.460 52.601 20080823 52440 0.9026 660 -16660 1368478 64 12705 0.93% 27.80%4.426 52.584 20081027 180400 0.1791 690 7850 1495712 35 3811 0.51% 50.87%
LON LAT DATE TIMEchance
mill is hit (%)IEC 61024
SUBSECPOSERR
(m)CURRENT (ampère)
striking distance
(r)
chancemill is hit (%)surface
(A)
surfacePOSERR
(m2)

-21- OWEZ_R_113_20090803 The chance that a stroke hits a wind turbine is calculated by multiplying the surface (A) with
the number of potentially hit wind turbines (see table 4, 5 and 6) and divided by the surface
area of the position error. By adding up all the chances in the table, one obtains the number
of lightning strokes in wind turbines according to the theory of probability. Using Armstrong
and Whitehead’s formula, this number is 0.16 strokes for Q3 and Q4 in 2006, 0.31 strokes for
the year 2007 and 0.04 for the year 2008. Using the IEC 61024 approach, the amount of
strokes is 4.82 for Q3 and Q4 in 2006, 5.92 strokes for the year 2007 and 1.25 for the year
2008.
The IEC 61024 method for determining the collection area gives much greater values
compared to the formula’s found in literature, which besides the height of the structure, also
include the current of a lightning stroke. The number of potential strokes determined by the
IEC 61024 method is still much smaller than the registered number of strokes by the SCADA
system, as can be read in chapter 5. This means the IEC 61024 method for determining the
collection area seems to be closer to reality than Armstong & Whitehead’s or other
comparative formula’s. Therefore, from this point on forwards, only the number of potential
strokes according to the IEC 61024 method will be used.
The position error is a factor which introduces a large uncertainty in the analyses carried out
in this chapter. The meaning of the position error is unclear. The manufacturer does not
provide information on this. According to the KNMI (oral communication) the position error of
the lightning stroke could well be larger than the position error as given in the FLITS files.
-22- OWEZ_R_113_20090803 5 LIGHTNING DATA FROM OWEZ
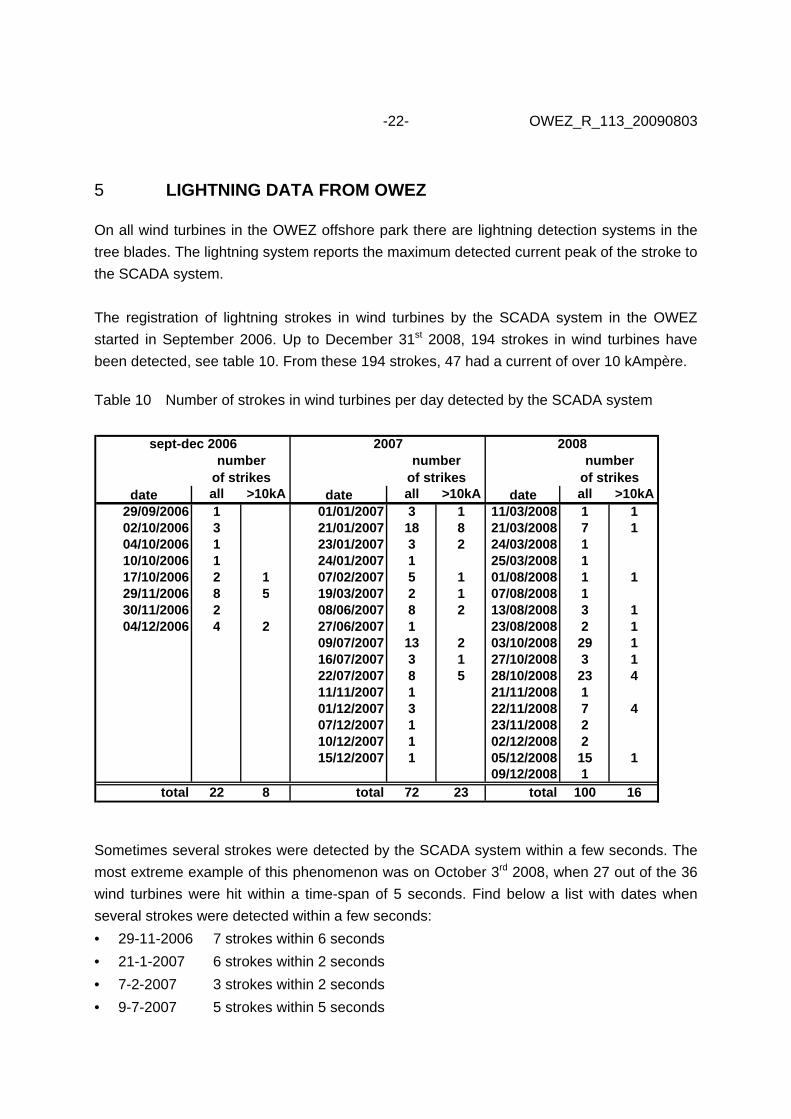
On all wind turbines in the OWEZ offshore park there are lightning detection systems in the
tree blades. The lightning system reports the maximum detected current peak of the stroke to
the SCADA system.
The registration of lightning strokes in wind turbines by the SCADA system in the OWEZ
started in September 2006. Up to December 31st 2008, 194 strokes in wind turbines have
been detected, see table 10. From these 194 strokes, 47 had a current of over 10 kAmpère.
Table 10 Number of strokes in wind turbines per day detected by the SCADA system
all >10kA all >10kA all >10kA29/09/2006 1 01/01/2007 3 1 11/03/2008 1 102/10/2006 3 21/01/2007 18 8 21/03/2008 7 104/10/2006 1 23/01/2007 3 2 24/03/2008 110/10/2006 1 24/01/2007 1 25/03/2008 117/10/2006 2 1 07/02/2007 5 1 01/08/2008 1 129/11/2006 8 5 19/03/2007 2 1 07/08/2008 130/11/2006 2 08/06/2007 8 2 13/08/2008 3 104/12/2006 4 2 27/06/2007 1 23/08/2008 2 1
09/07/2007 13 2 03/10/2008 29 116/07/2007 3 1 27/10/2008 3 122/07/2007 8 5 28/10/2008 23 411/11/2007 1 21/11/2008 101/12/2007 3 22/11/2008 7 407/12/2007 1 23/11/2008 210/12/2007 1 02/12/2008 215/12/2007 1 05/12/2008 15 1
09/12/2008 1total 22 8 total 72 23 total 100 16
20082007sept-dec 2006number
of strikesnumber
of strikesnumber
of strikesdate date date
Sometimes several strokes were detected by the SCADA system within a few seconds. The
most extreme example of this phenomenon was on October 3rd 2008, when 27 out of the 36
wind turbines were hit within a time-span of 5 seconds. Find below a list with dates when
several strokes were detected within a few seconds:
• 29-11-2006 7 strokes within 6 seconds
• 21-1-2007 6 strokes within 2 seconds
• 7-2-2007 3 strokes within 2 seconds
• 9-7-2007 5 strokes within 5 seconds
-23- OWEZ_R_113_20090803 • 22-7-2007 5 strokes within 4 seconds
• 21-3-2008 7 strokes within 4 seconds
• 3-10-2008 27 strokes within 5 seconds
• 28-10-2008 5 strokes within 4 seconds and later that day 6 strokes within 5 seconds
• 4-12-2008 13 strokes within 6 seconds.
It’s possible that a forked lightning strikes at several places at the same time, but these
places then are close to each other. The wind turbines at OWEZ are however placed 700
meters apart. It seems impossible that one discharge causes simultaneous strokes several
kilometres apart. The current of these simultaneous strokes is rarely higher than 10
kAmpère. A possible explanation for this phenomenon is the following: when a heavy
thundercloud is located above the wind farm, the top of the wind turbines will have an
opposite load compared to the cloud. When a lightning stroke causes the cloud to discharge
(both cloud-to-cloud and ground strokes causes the cloud to discharge), the load in the wind
turbine will flow away in a very short time span into the earth. It could be possible this causes
a current larger than the threshold value of the SCADA system (6 kAmpère).
Whereas ‘normal’ lightning strokes can have currents as low as 6 kAmpère, there is no
reason to assume all individual strokes (not coinciding with another stokes in the same
second) with a current below 10 kAmpère are caused by this phenomenon, also because
heavy thunderstorms will have dimensions larger than the area around one individual wind
turbine.
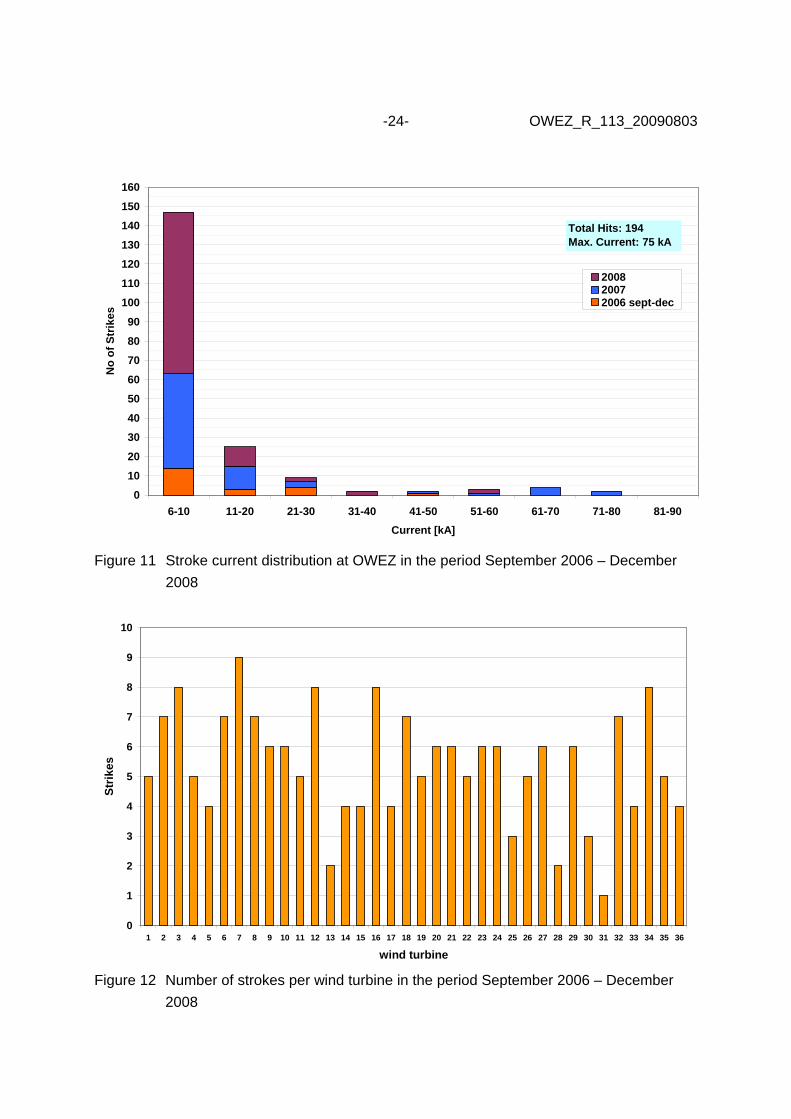
Figure 11 and 12 show the stroke current distribution and the number of strokes per wind
turbine. The maximum current registered in over the period September 2006 – December
2008 is 75 kAmpère.
-24- OWEZ_R_113_20090803
0
10
20
30
40
50
60
70
80
90
100
110
120
130
140
150
160
6-10 11-20 21-30 31-40 41-50 51-60 61-70 71-80 81-90
Current [kA]
No
of S
trik
es
200820072006 sept-dec
Total Hits: 194Max. Current: 75 kA
Figure 11 Stroke current distribution at OWEZ in the period September 2006 – December
2008
0
1
2
3
4
5
6
7
8
9
10
1 2 3 4 5 6 7 8 9 10 11 12 13 14 15 16 17 18 19 20 21 22 23 24 25 26 27 28 29 30 31 32 33 34 35 36
wind turbine
Str
ikes
Figure 12 Number of strokes per wind turbine in the period September 2006 – December
2008

-25- OWEZ_R_113_20090803 From the 194 strokes detected in the period September 2006 – December 2008 by the
SCADA system (see table 10), 9 had a very powerful current of over 50 kAmpère and where
given the status ‘alarm’. The other 185 strokes where given the status ‘warning’. Table 11
shows the 9 strokes which had a current of over 50 kAmpère.
Table 11 Strokes with a current > 50 kAmpère (September 2006 - December 2008)
date time (UTC) turbine current (kAmpère)
21-1-2007 05:44:49 32 72
21-1-2007 06:35:40 20 63
21-1-2007 06:41:03 7 75
7-2-2007 09:46:19 24 52
19-3-2007 22:02:17 14 61
8-6-2007 01:40:23 36 64
8-6-2007 21:28:47 35 64
1-8-2008 01:48:34 15 60
28-10-2008 03:00:14 8 59

-26- OWEZ_R_113_20090803 6 COMPARISION OF THE OWEZ SCADA DATA WITH THE KNMI
DATA
6.1 Comparison of the number of strokes
The number of strokes per square kilometre detected by the FLITS system is much lower
than the number found in literature: 0.15 – 0.45 strokes/km2/year for the area within 7
kilometres of the outermost wind turbines of the wind farm (see chapter 3) versus 1.3 – 2.5
strokes/km2/year found in literature [5][6]. The numbers from the SCADA system are
somewhat higher as found in literature, being 3.4 – 5.1 strokes/km2/year in the area where
the wind turbines are placed (about 20 km2). When not taking into account the several
strokes detected by the SCADA system which take place within a few seconds - they count
only as one stroke – (see also chapter 5), the number of strokes per square kilometre lies
between 2 to 3 strokes/km2/year, which is in accordance with the numbers stated in
literature. However, this number could be higher again because there can also be strokes in
between the wind turbines.
In 2007 and 2008, respectively 72 and 100 strokes have been detected by the SCADA
system (respectively 59 and 60 strokes when not taking into account subsequent strokes that
follow in the same second). This contrasts sharply with the predicted 5.92 strokes in 2007
and 1.25 strokes in 2008 using the data from the FLITS system from the KNMI (see chapter
4).
According to NoordzeeWind there is no reason to cast doubt on the recordings of the
SCADA system. The reason for the mismatch between the FLITS data and the SCADA data
being the SCADA system detecting too many strokes should therefore be rejected.
6.2 Taking the position-finding of the FLITS system in closer consideration
Possible explanations for the huge difference between the number of detected strokes in
wind turbines by the SCADA system and the number of predicted strokes by the FLITS
system (72 versus 5.92 in 2007 and 100 versus 1.25 in 2008) are:
a Wind turbines have a much greater attraction on ground and return strokes as is
suggested by literature (IEC 61024, Armstrong and Whitehead’s formula and other
formula’s [7])
b The position error in the FLITS data is larger in reality (but below 7 kilometres)

-27- OWEZ_R_113_20090803 c Not only ground and return strokes but also cloud-to-cloud discharges will strike wind
turbines when they are inside the range of it’s position error.
In order to investigate the three possible reasons mentioned above, it’s being assumed that
the time recordings of both the SCADA and the FLITS system are correct. The SCADA
system registers lightning strokes with a precision of 1 second and the FLITS system with a
precision of 1 millisecond. Because the precision of the SCADA system is one second,
several strokes that occur during 1 second only count as one in this analyses; the in total 194
registered strokes during the period September 2006 – December 2008 occurred in 138
different seconds.
We determine if in the same second as the SCADA system has detected a lightning stroke,
the FLITS system also detected a stroke within 7 kilometres of the outermost wind turbines of
the wind farm. This is the case for only 1 out of 138 detected strokes by the SCADA system.
This was at January 21st 2007, when the SCADA system detected a stroke in wind turbine 5
and the FLITS system detected a stroke between wind turbine 17 and 25. Now we use a time
span of a minute instead of a second, so it is determined whether the two systems detect a
stroke in the same minute. This is the case for only 4 out of the 138 strokes. If we also take
into consideration cloud-to-cloud discharges (type 1 – 3, table 2) the score is 42 out of the
138 strokes. The average distance between the SCADA system location and the FLITS
system location of these 42 strokes is however large, namely 9.4 kilometres, which is larger
than the maximum position error. The above mentioned reasons a), b) and c) as possible
reasons for the mismatch between the number of strokes detected by the SCADA and the
FLITS system should on the basis of the this information be rejected.
From the 194 strokes detected in the period September 2006 – December 2008 by the
SCADA system (see table 10), 9 had a very powerful current of over 50 kAmpère and where
given the status ‘alarm’ (see table 11). In the same minute as the SCADA system detected
these 9 ‘alarm’ strokes, the FLITS system never detected a ground or return stroke within 7
kilometres of the outermost wind turbines of the wind farm. By 4 out of these 9 ‘alarm’
strokes, cloud-to-cloud strokes were detected by the FLITS system in this area in the same
minute. A clear illustration of the mismatch between the SCADA and the FLITS system is the
lightning stroke detected by the SCADA system on March 19th 2007. This was an ‘alarm’
stroke with current of 61 kAmpère. On March 19th 2007 there was no lightning activity at all in
the vicinity of the wind farm according to the FLITS system, not even a single cloud-to-cloud
discharge.

-28- OWEZ_R_113_20090803 6.3 Comparison between the FLITS and SCADA data on a da ily time-scale
Although in general on days of high lightning activity there are strokes detected by both the
SCADA system and the FLITS system, the correlation between the two is very low. See
figure 13. Here the number of detected strokes by the SCADA system is plotted on the x-axis
and the number of strokes (ground- and return strokes) within 7 kilometres of the outermost
wind turbines of the wind farm according to the FLITS system (see appendix I) is plotted on
the y-axis. Every dot represents one day. The period taken into account is again September
2006 – December 2008.
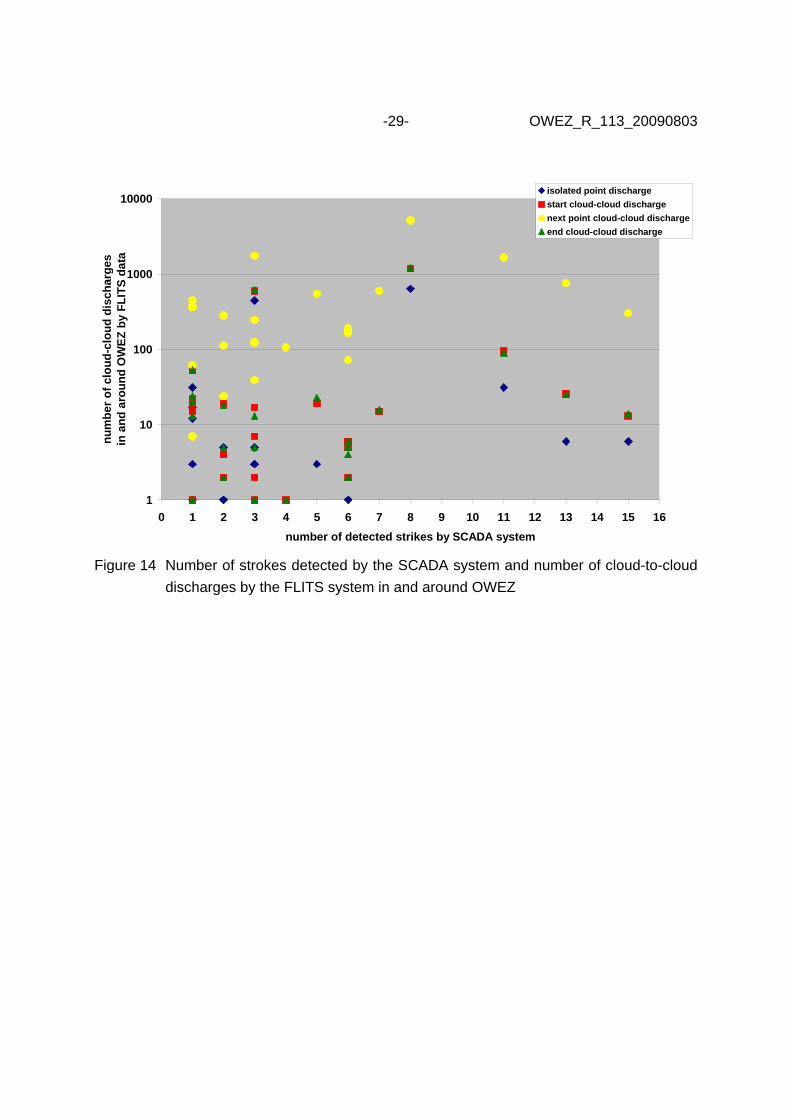
A comparable low correlation is found between strokes detected by the SCADA system and
cloud-to-cloud discharges detected by the FLITS system (type 0 – 3, see table 2), as can be
seen in figure 14. There is hardly any correlation (R2 < 0.10) between amount of type 0 – 3
discharges from the FLITS system and the amount of detected strokes by the SCADA
system. For both figure 13 and figure 14 applies that if more than one stroke is registered by
the SCADA system within one second, it only counts as one stroke. Figure 14 doesn’t show
the cases having zero strokes detected by the SCADA system, but one or more cloud-to-
cloud discharges detected by the FLITS system. The number of days for which this applies
are numerous.
R2 = 0,0379
0
5
10
15
20
25
30
35
40
45
50
0 2 4 6 8 10 12 14 16
number of detected strikes by SCADA system
num
ber o
f stri
kes
in a
nd a
roun
d O
WE
Z b
y F
LIT
S d
ata
Figure 13 Number of strokes detected by the SCADA system and by the FLITS system in
and around OWEZ
-29- OWEZ_R_113_20090803
1
10
100
1000
10000
0 1 2 3 4 5 6 7 8 9 10 11 12 13 14 15 16
number of detected strikes by SCADA system
num
ber
of c
loud
-clo
ud d
isch
arge
s in
and
aro
und
OW
EZ
by
FLI
TS
dat
a
isolated point discharge
start cloud-cloud discharge
next point cloud-cloud discharge
end cloud-cloud discharge
Figure 14 Number of strokes detected by the SCADA system and number of cloud-to-cloud
discharges by the FLITS system in and around OWEZ

-30- OWEZ_R_113_20090803 7 CONCLUSION
From the information in chapter 4, 5 and 6 it can be concluded that there is no significant
match between the SCADA data and the data from the FLITS system from the KNMI.
The amount of strokes in wind turbines predicted using data from the FLITS system are ten
to hundred times lower than the amount of strokes detected by the SCADA system. The
number of strokes per square kilometre detected by the FLITS system in the OWEZ area and
it’s vicinity is also much lower than the number found in literature. The amount of strokes per
square kilometre detected by the SCADA system are more or less in accordance with the
numbers stated in literature.
There is a mismatch between the data of the FLITS and the SCADA system in both the
position and the time (see paragraph 6.2) of the strokes. In the same seconds or minutes the
SCADA system detects strokes in wind turbines, the FLITS system hardly shows any
corresponding strokes (this also applies to cloud-cloud discharges). Also on a daily time
scale, there is no significant correlation between the number of strokes detected by the
FLITS and the SCADA system (see paragraph 6.3).
The reason for the mismatch between de data of the FLITS and the SCADA system is not
clear. A possible explanation could be that the position error of the FLITS data is well over
the stated maximum of 7 kilometres. In that case, strokes which coordinates were more than
7 kilometres outside the outermost wind turbines, in reality could have been located in the
OWEZ area, but they were not included in the analysis in this report. One can think of
numerous other possible reasons for the mismatch in both time and location of the strokes
detected by the FLITS and SCADA systems. Fact is that the FLITS system is not suitable for
detecting strokes, nor for giving an indication of lightning stroke activity, in wind turbines at
the location of the Off shore Wind farm Egmond aan Zee.
-31- OWEZ_R_113_20090803 REFERENCES
[1] Near Shore Windpark Wbr/Wm vergunningaanvraag NSW, 2003.
[2] Processing, validatie, en analyse van bliksemdata uit het SAFIR/FLITS systeem, Saskia
Noteboom.
[3] Output format description of the FLITS HDF file converter program hdf2dis,
version 2.1_20041028, KNMI.
[4] Informatie over het bliksemdetectie systeem, Hans Beekhuis KNMI.
[5] DOWEC CONCEPT STUDY TASK 7, Standards and criteria for offshore wind turbines,
ECN-CX--00-039, H.B. Hendriks, P.P. Soullié, 2000.
[6] KNMI, Onweerswaarnemingen in Nederland, H.R.A. Wessels, 1999
Published in Zenit, 26, 1999, pages 260 – 264.
[7] Insulation Coordination for power systems, Andrew Hileman, 1999.
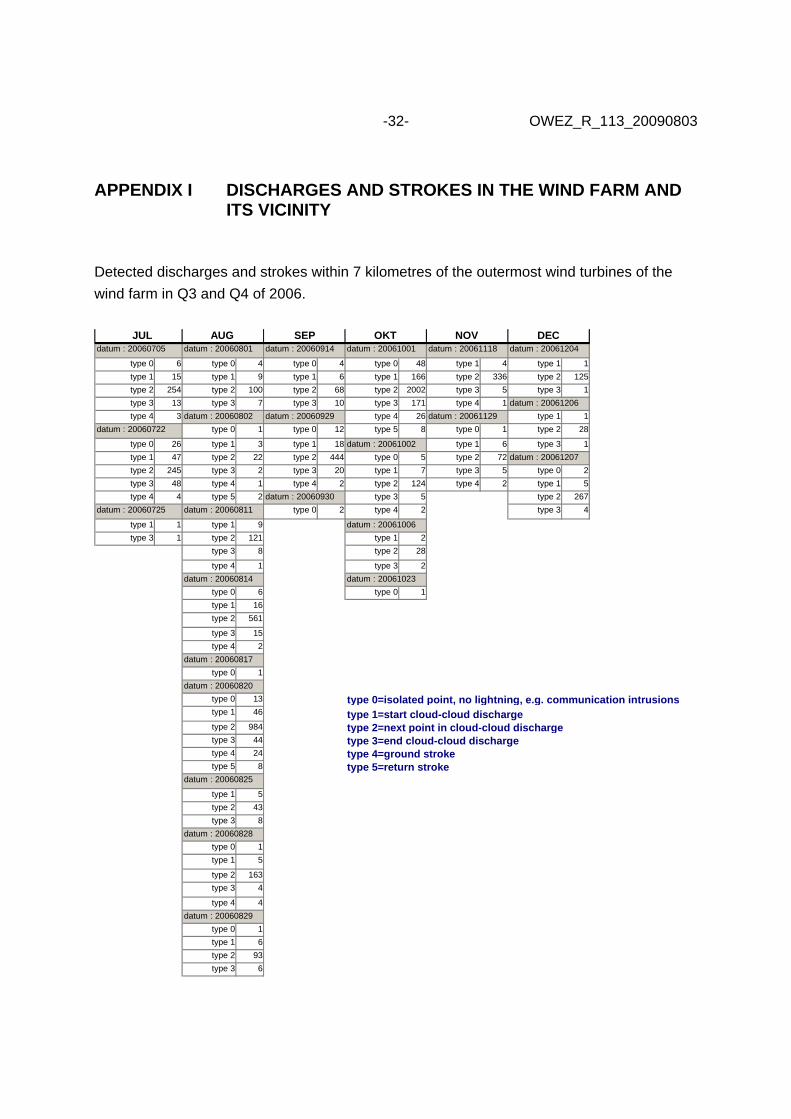
-32- OWEZ_R_113_20090803 APPENDIX I DISCHARGES AND STROKES IN THE WIND FARM AND
ITS VICINITY
Detected discharges and strokes within 7 kilometres of the outermost wind turbines of the
wind farm in Q3 and Q4 of 2006.
JUL AUG SEP OKT NOV DEC
type 0 6 type 0 4 type 0 4 type 0 48 type 1 4 type 1 1
type 1 15 type 1 9 type 1 6 type 1 166 type 2 336 type 2 125
type 2 254 type 2 100 type 2 68 type 2 2002 type 3 5 type 3 1
type 3 13 type 3 7 type 3 10 type 3 171 type 4 1
type 4 3 type 4 26 type 1 1
type 0 1 type 0 12 type 5 8 type 0 1 type 2 28
type 0 26 type 1 3 type 1 18 type 1 6 type 3 1
type 1 47 type 2 22 type 2 444 type 0 5 type 2 72
type 2 245 type 3 2 type 3 20 type 1 7 type 3 5 type 0 2
type 3 48 type 4 1 type 4 2 type 2 124 type 4 2 type 1 5
type 4 4 type 5 2 type 3 5 type 2 267
type 0 2 type 4 2 type 3 4
type 1 1 type 1 9
type 3 1 type 2 121 type 1 2
type 3 8 type 2 28
type 4 1 type 3 2
type 0 6 type 0 1
type 1 16
type 2 561
type 3 15
type 4 2
type 0 1
type 0 13 type 0=isolated point, no lightning, e.g. communication intrusionstype 1 46 type 1=start cloud-cloud dischargetype 2 984 type 2=next point in cloud-cloud dischargetype 3 44 type 3=end cloud-cloud dischargetype 4 24 type 4=ground stroke type 5 8 type 5=return stroke
type 1 5
type 2 43
type 3 8
type 0 1
type 1 5
type 2 163
type 3 4
type 4 4
type 0 1
type 1 6
type 2 93
type 3 6
datum : 20060811
datum : 20060814
datum : 20060705
datum : 20060722
datum : 20060725
datum : 20060829
datum : 20060914
datum : 20060929
datum : 20060930
datum : 20060817
datum : 20060820
datum : 20060825
datum : 20060828
datum : 20060801
datum : 20060802
datum : 20061001
datum : 20061002
datum : 20061006
datum : 20061023
datum : 20061207
datum : 20061118
datum : 20061129
datum : 20061204
datum : 20061206

-33- OWEZ_R_113_20090803
Appendix I page 2
Detected discharges and strokes within 7 kilometres of the outermost wind turbines of the
wind farm in 2007.
JAN FEB MAA APR MEI JUN JUL AUG SEP OKT NOV DEC
type 1 4 type 1 1 type 1 1 type 1 2 type 2 1 type 0 1 type 1 1 type 1 2
type 2 24 type 2 106 type 2 2 type 2 6 type 3 1 type 1 1 type 3 1 type 2 112
type 3 5 type 3 1 type 3 1 type 3 1 type 4 2 type 2 22 type 3 2
type 2 36
type 0 1 type 1 1 type 0 636 type 0 3 type 3 1 type 1 1
type 1 4 type 2 96 type 1 1186 type 1 19 type 2 7
type 2 80 type 3 1 type 2 5167 type 2 286 type 1 1 type 3 1
type 3 4 type 3 1199 type 3 18 type 3 5
type 4 33 type 4 4
type 1 1 type 5 9 type 5 1
type 2 27
type 3 1 type 0 2 type 0 31
type 1 13 type 1 95
type 0 1 type 2 157 type 2 1658
type 2 116 type 3 12 type 3 90
type 3 2 type 4 14
type 0 3 type 5 4
type 0 6 type 1 15
type 1 26 type 2 363 type 0 33
type 2 760 type 3 13 type 1 48
type 3 25 type 4 1 type 2 216
type 4 3 type 5 1 type 3 47
type 4 2
type 0 443
type 1 592
type 2 1754
type 3 610
type 4 27
type 5 16
type 0 3
type 1 4
type 2 59
type 3 3
type 0 3
type 1 19
type 2 548
type 3 23
type 0=isolated point, no lightning, e.g. communication intrusions type 4 10
type 1=start cloud-cloud discharge type 5 4
type 2=next point in cloud-cloud dischargetype 3=end cloud-cloud discharge type 0 1
type 4=ground stroke type 5=return stroke type 0 1
datum : 20071201
datum : 20071207
datum : 20070723
datum : 20070730
datum : 20070822 datum : 20070917
datum : 20070715
datum : 20070716
datum : 20070720
datum : 20070722
datum : 20070918
datum : 20070925
datum : 20070627
datum : 20070703
datum : 20070704
datum : 20070709
datum : 20070507 datum : 20070607
datum : 20070608
datum : 20070620
datum : 20070118
datum : 20070121
datum : 20070207
datum : 20070228
datum : 20070101
datum : 20070110
datum : 20070111
-34- OWEZ_R_113_20090803
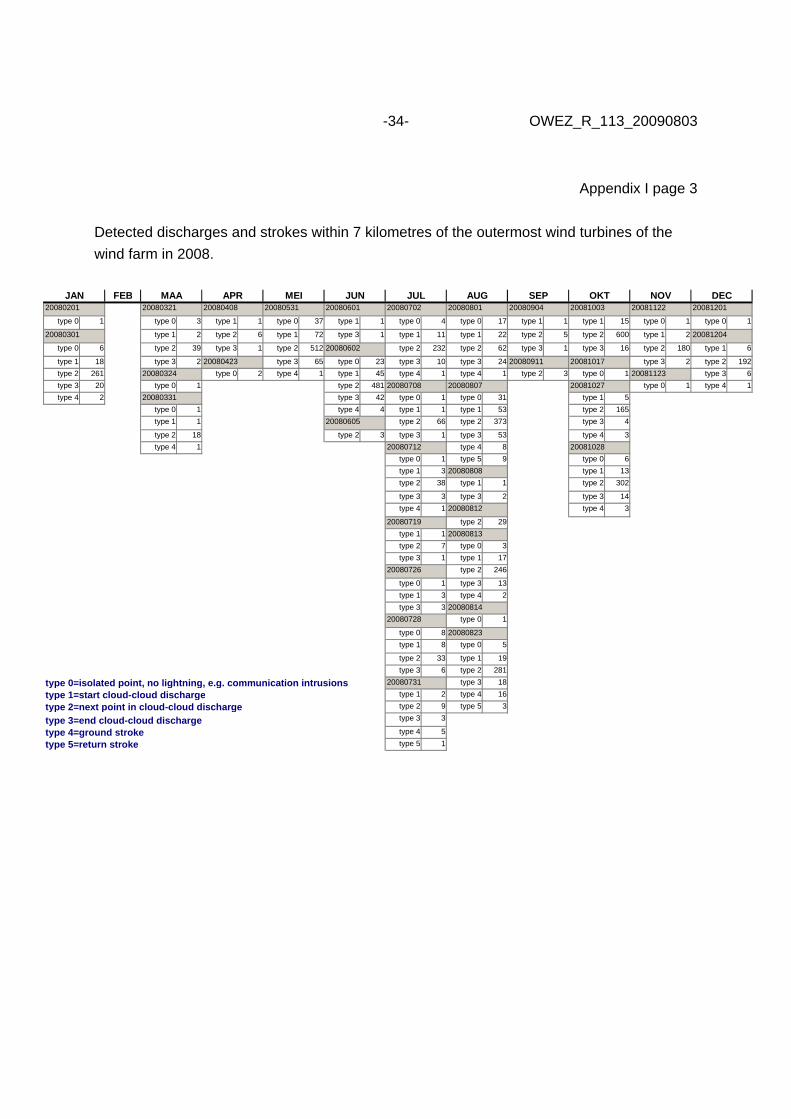
Appendix I page 3
Detected discharges and strokes within 7 kilometres of the outermost wind turbines of the
wind farm in 2008.
FEB
type 0 1 type 0 3 type 1 1 type 0 37 type 1 1 type 0 4 type 0 17 type 1 1 type 1 15 type 0 1 type 0 1
type 1 2 type 2 6 type 1 72 type 3 1 type 1 11 type 1 22 type 2 5 type 2 600 type 1 2
type 0 6 type 2 39 type 3 1 type 2 512 type 2 232 type 2 62 type 3 1 type 3 16 type 2 180 type 1 6
type 1 18 type 3 2 type 3 65 type 0 23 type 3 10 type 3 24 type 3 2 type 2 192
type 2 261 type 0 2 type 4 1 type 1 45 type 4 1 type 4 1 type 2 3 type 0 1 type 3 6
type 3 20 type 0 1 type 2 481 type 0 1 type 4 1
type 4 2 type 3 42 type 0 1 type 0 31 type 1 5
type 0 1 type 4 4 type 1 1 type 1 53 type 2 165
type 1 1 type 2 66 type 2 373 type 3 4
type 2 18 type 2 3 type 3 1 type 3 53 type 4 3
type 4 1 type 4 8
type 0 1 type 5 9 type 0 6
type 1 3 type 1 13
type 2 38 type 1 1 type 2 302
type 3 3 type 3 2 type 3 14
type 4 1 type 4 3
type 2 29
type 1 1
type 2 7 type 0 3
type 3 1 type 1 17
type 2 246
type 0 1 type 3 13
type 1 3 type 4 2
type 3 3
type 0 1
type 0 8
type 1 8 type 0 5
type 2 33 type 1 19
type 3 6 type 2 281
type 0=isolated point, no lightning, e.g. communication intrusions type 3 18
type 1=start cloud-cloud discharge type 1 2 type 4 16
type 2=next point in cloud-cloud discharge type 2 9 type 5 3
type 3=end cloud-cloud discharge type 3 3
type 4=ground stroke type 4 5
type 5=return stroke type 5 1
NOV DECOKTMAA APR MEI JUN JUL AUG SEP20081122
20081123
20081201
20081204
20081003
20081017
20081027
20081028
20080814
20080823
20080904
20080911
20080807
20080808
20080812
20080813
20080726
20080728
20080731
2008080120080702
20080708
20080712
20080719
20080531 20080601
20080602
20080605
20080324
20080331
20080408
20080423
JAN2008032120080201
20080301