oxidation induced failure of...
TRANSCRIPT

THESIS FOR THE DEGREE OF LICENTIATE OF ENGINEERING
Oxidation induced failure of superalloys High temperature crack growth and oxide scale properties
Anand H.S. Iyer
Department of Physics
Chalmers University of Technology Göteborg, Sweden
2017

ii
Oxidation induced failure of superalloys High temperature crack growth and oxide scale properties ANAND H.S. IYER ã Anand H.S. Iyer, 2017 Division of Materials Microstructure Department of Physics Chalmers University of Technology Göteborg, Sweden – 41296 Phone: +46 31 772 6708 [email protected] Cover: SEM image of bending of a type 4 oxide microcantilever. FMS is the force measurement sensor. Printed by: Chalmers Reproservice Göteborg, Sweden 2017
iii
Oxidation induced failure in superalloys High temperature crack growth and oxide scale properties
Anand H.S. Iyer
Department of Physics Chalmers University of Technology
Abstract Gas turbine materials are designed to work in extreme environments in high temperature with an oxidising environment and variable mechanical loading. The study of high temperature fatigue properties of these materials is therefore important. Recent evidences show that oxidation plays an important role in the crack growth of superalloys at high temperatures. The formation and cracking of brittle oxides ahead of the crack tip leads to accelerated crack growth under dwell times. Protective surface oxide scales on superalloys prolong their life by preventing further oxidation. The cracking and spallation of such scales can lead to further oxidation of the material, thus reducing its strength or even lead to crack initiation at the surface. This work is aimed at two different aspects of damage in superalloys – high temperature crack growth and fracture properties of oxide scales. The long-term goal is to develop an oxidation based life assessment model for real microstructures using experimental data. The initial part of the study focuses on the influence of dwell times in high temperature crack growth in superalloy welds. This work showed that the combination of oxidising atmosphere, high temperatures and sustained tensile loads led to accelerated crack growth, and that the interaction of the crack with the materials microstructure depends strongly on the combination of these parameters. In the second part, methods were developed to test the room temperature deformation properties of thermally grown oxides on a superalloy substrate. In-situ microcantilever bending tests in a scanning electron microscope showed the presence of plasticity in the oxides, which is mainly attributed to the size of the scale and lack of internal defects. These methods can be extended to high temperature as well, which can aid in giving an insight into high temperature properties of surface and grain boundary oxide scales, contributing to development of models for oxidation assisted crack growth. Keywords: Nickel superalloys; crack growth; scanning electron microscopy; focused ion beam microscopy; micromechanical testing.

iv

v
Preface The research work presented in this thesis was carried out at the division of Materials Microstructure, Department of Physics, Chalmers University of Technology, Göteborg, Sweden during the period of June 2015 – August 2017, under the supervision of Dr. Magnus Hörnqvist Colliander and Prof. Krystyna Stiller. This work was supported by funding from the FP7 Clean Sky Joint Technology Initiative (Project number 323478), and from High Temperature Corrosion Centre, Swedish Energy Authoriy, and GKN Aerospace Engine Systems. The following papers are included in this thesis: Paper I Influence of dwell time on fatigue crack propagation in Alloy 718 laser welds Anand H.S. Iyer, Krystyna Stiller, Gunnar Leijon, Henrik C.M. Andersson-Östling, Magnus Hörnqvist Colliander Materials Science and Engineering: A, Volume 704, 2017, Pages 440-447. Paper II Room temperature plasticity in thermally grown sub-micron oxide scales revealed by micro-cantilever bending Anand H.S. Iyer, Krystyna Stiller, Magnus Hörnqvist Colliander Submitted to Scripta Materialia Statement of contribution
• Paper I – I performed the microscopy, analysis of results and was the lead author of the paper.
• Paper II – I performed the furnace exposures, sample preparation, microscopy, data analysis and was the lead author of the paper.
The following paper has not been included in this thesis: Crack Growth Studies in a Welded Ni-Base Superalloy Anand H.S. Iyer, Krystyna Stiller, Magnus Hörnqvist Colliander Solid State Phenomena, Vol. 258, pp. 237-240, 2017

vi
vii
Acknowledgments If I had to describe the last two years of my life, I would say it was life-changing. Starting a life in a foreign country and getting to know the place and people is a breathtaking experience. I learned to enjoy work and understood a lot about life and my research field equally. But none of this was a solo achievement. So, I would like to express my appreciation for those who supported me in this journey so far. Firstly, I would like to express my sincere gratitude to Dr. Magnus Hörnqvist Colliander, my supervisor for his immense support, motivation and patience. I have learnt a lot from all our discussions and someday I hope to achieve the same kind of enthusiasm and discipline you have. I would also like to thank my co-supervisor, Prof. Krystyna Stiller, who was equally involved in this work, for her support and constant encouragement. Thank you to both of you for choosing me for this intriguing work and helping me in embarking on a journey of research. I thank Dr. Tomas Månsson, Dr. Thomas Hansson and Dr. Magnus Ekh for their valuable inputs during our project meetings and their collaboration. My sincere thanks to Prof. Lars-Gunnar Johansson and to Patrik Alnegren for helping me with the exposures. I could not have conducted my research work smoothly without all the support from the CMAL group with the instruments, for which I am very grateful. I would also like to thank Ola Löfgren for his timely support with computer related issues. Special thanks to my division members and to Eva Olsson group to creating such a positive work environment and for all the discussions we had, academic or otherwise. I felt welcome in this place because of you and I am very grateful for that. I have had several teachers over the last two years, both colleagues and professors who taught me theoretical and practical aspects of research. I thank all of them for their support. I am indebted to my parents without whom I couldn’t have reached where I am. Thank you for helping me follow my dream. Finally, I want to thank my fiancé, Manta for her unflinching confidence in me and her unconditional love. You believed in me more than myself and that’s why you are my better half.

viii

ix
Contents 1. INTRODUCTION 1
1.1. Background 1
1.2. Motivation 1
1.3. Aim of the study 2
2. OXYGEN ASSISTED DAMAGE IN SUPERALLOYS 3
2.1. High temperature fatigue 3
2.2. Oxygen enhanced crack growth 4
2.3. Oxide cracking and property measurement 7
3. MATERIALS 9
3.1. Superalloys 9
3.2. Superalloy phases 10
3.3. Materials in this work 11
3.3.1. Alloy 718 11
3.3.2. Allvac 718plus 11
4. METHODS 13
4.1. Scanning electron microscopy 13
4.1.1. Electron channeling contrast imaging 14
4.1.2. Electron backscatter diffraction 16
4.2. Focused ion beam microscopy 16
4.3. Microcantilever bending 18
4.3.1. Kleindiek micromanipulator setup 19
4.3.2. Microcantilevers 20
4.3.3. Testing procedure 25
4.3.4. Sources of error 27
4.4. Sample preparation 28
4.5. Furnace exposures 29
5. RESULTS AND OUTLOOK 31
5.1. Summary of results 31
5.1.1. Environmental influence in high temperature crack growth 31
5.1.2. Measuring mechanical properties of oxide scales 32
5.2. Outlook 32
BIBLIOGRAPHY 35


1
1. Introduction 1.1 Background Gas turbines have been an integral part of the aviation industry over a long period of time. Since their introduction in the 1900s, they have dominated the aero engine and power generation industries. Gas turbine is a type of heat engine and therefore, one of the ways to increase its efficiency is to increase the working temperature. But this demands for the development of materials that can withstand higher temperatures, without any loss of properties. This was possible through the development of superalloys, a class of alloys that can maintain their mechanical properties above 0.6 Tm, where Tm is the melting point of the material. They started out as improvements to stainless steels, but soon became nickel or cobalt based. There was widespread research in developing new chemistries of alloys with superior properties which was primarily propelled by the need for efficient gas turbines through increase of operating temperatures. The amount of investment in the complex composition and processing techniques make the cost for superalloys 30 to 200 times costlier than stainless steel [1]. Superalloys in service are exposed to extreme conditions with metal temperatures as high as 1000 °C in the hot zones and a highly corrosive atmosphere. This has been achieved through years of intense research in the field of chemistry and processing of superalloys. The loading experienced by the gas turbine components are a combination of mechanical and thermal loading. Through the course of a flight there are periods of sustained mechanical loading and large variation in temperatures. The nature of fatigue experienced by these materials have a time component to it, which is not the case for most structural components and this makes the life assessment study complex [2]. Due to the thermal loading cycles, the environment plays a critical role in determining the service life. Even though multiple mechanisms have been proposed to explain role of the oxidizing environment, the microscopic details of material degradation are still unclear and need to be studied. The alloys are generally protected by the formation of slow growing oxide scales, which is the reasoning behind addition of adequate amounts of Al and Cr in the alloys. These scales also experience the loading and temperature effects. The durability and service lifetime of the material underneath depends also on the life of these oxide scales as their cracking and/or spallation can lead to accelerated oxidation and damage. Therefore, it is imperative to understand the mechanical properties of the oxide scales as well. The current work is aimed at addressing these issues. 1.2 Motivation Gas turbine materials are used in extreme environments in which they experience high temperatures, mechanical loading and a corrosive environment. They experience thermo-mechanical fatigue (TMF) which is a result of the thermal cycling that the engines undergo. There are long periods of steady loads, as well as rapid changes in temperature and loading, depending on the stage of flight they are in. The environment plays a significant role in determining the service life in TMF. There are two aspects of it: One is the deformation and fracture of protective surface oxide scales during thermal cycling which can lead to fatigue crack initiation at the surface and another is crack tip oxidation and consequent fracture of the brittle crack tip oxides leading to accelerated crack propagation. There have been various studies in high temperature fatigue of superalloys in order to calculate their service life. Due to the nature of loading undergone by superalloys in gas turbines, simple cycles are not enough to simulate the service conditions. It has been shown that the crack growth rate during constant load periods (dwell time) is much higher than pure cycling [3–7]. Dwell fatigue studies
2
highlight the role of the environment in the accelerated crack growth rate. Several mechanisms have been proposed to explain the influence of environment (namely oxygen) in the crack growth, of which two are the most discussed; Dynamic embrittlement (DE) [3,4] and stress assisted grain boundary oxidation (SAGBO) [8,9]. Recent evidences point towards SAGBO as the dominating mechanism of oxidation assisted crack growth [10,11]. A model has been proposed by Chan et al [12] to predict the threshold stress intensity factor for SAGBO. The principal unknown quantity in this equation is the fracture strain of the oxide. The fracture properties of such crack tip oxides need to be measured in order to provide a reliable model to predict oxidation assisted crack growth. But it is also essential to study the aspect of fatigue crack initiation due to cracking or spallation of surface oxide scales. Superalloys form a thin layer of protective oxide (usually Cr2O3 or Al2O3) that enhances their corrosion resistance. The sudden variations in temperature and loading can lead to the fracture and/or of the protective scales which will lead to further oxidation of the material, weakening it. This is the case during out of phase TMF where the thermal and mechanical loading are out of phase. Due to the differences in thermal expansion coefficient of the oxide and the alloy and the brittleness of oxides at room temperature, fracture and spallation can take place during the cold cycles.
In both of the aspects of oxidation assisted damage discussed above, the fracture properties
of the oxide determine the life of the gas turbine component. It is therefore important to study the mechanical properties of such oxides. Mechanical properties of oxides have been mostly studied through indirect methods such as acoustic microscopic and other vibration methods [13–15]. The accuracy of direct methods such as nanoindentation depends on the thickness of the oxide studied due to substrate influence. There is a strong need for advance methods for testing of oxides in order to understand their properties, as highlighted by Schütze and Quaddakers [16]. Micromechanical testing has proven to be efficient in the measurement of mechanical properties at the micro scale. Methods such as microcantilever bending, micropillar compression, etc have been used to measure the mechanical properties of micro features such as coatings [17,18], oxides [19,20], grain boundaries [21,22] etc. 1.3 Aim of the study This research is aimed understanding the deformation and fracture of oxides in superalloys, which play a critical role in fatigue crack initiation and propagation. The following research questions have been addressed in this thesis:
• How is fatigue crack propagation in superalloys affected by the environment in the case of a real and complex microstructure such as welds?
• Is it possible to develop methods to measure deformation and fracture properties of oxides directly without any influence from substrate or residual stresses?
In the long term, it is expected that the experimental data from the measurement of fracture
properties of oxides can be used to develop life assessment models for real microstructures.

3
Chapter 2 Oxygen assisted damage in superalloys 2.1 High temperature fatigue Gas turbine engines undergo a complex loading cycle during service. It consists of several periods of static loading under high temperature conditions and variations in temperature during startup and shutdown of the engines. Due to these conditions, the components experience mechanical and thermal loading which is generally referred to as thermomechanical fatigue (TMF). Fatigue, in general is well established field of study of damage in materials which is more than a century old. There are several concrete models recognized in order to study crack growth under fatigue conditions, such as the famous Paris’ law which is used to calculate fatigue crack growth. It is given by,
𝑑𝑎𝑑𝑁 = 𝐶(∆𝐾)+(1)
were da/dN is the crack growth per cycle, C and n are material constants and DK is the difference between the maximum and minimum stress intensity factor in a fatigue cycle. The stress intensity factor is given by,
𝐾 = 𝑓𝜎 𝜋𝑎(2) where s is the applied (far-field) stress, a is the crack length and f is a geometrical factor depending on the size and shape of the crack and the cracked body. Equation 1 holds good in the subcritical crack growth regime for most materials when the fatigue is independent of time. With the development of materials for high temperature use, it became essential to study the fatigue properties of materials at high temperatures. High temperature fatigue is a complex phenomenon with contributions from creep and/or oxidation [23]. This is evident from studies which identify three distinct regimes of high temperature fatigue by testing at different frequencies: a cycle dependent/ time independent regime at high frequencies; a mixed regime at intermediate frequencies; and a time dependent regime at low frequencies of loading [24,25]. Equation 1 is valid only for the time independent regime. In order to model fatigue crack growth at high temperature, a time dependent term also need to be added. Many models have been developed in order to explain the crack growth in this regime [24,26–28]. The time dependent crack growth can be represented as,
𝑑𝑎𝑑𝑡 = 𝐴𝐾+(3)
where da/dt is the crack growth per second, A and n are material constants. At high temperatures, many factors such as the loading frequencies, environment, microstructure, etc influence the life of the material, which has been revealed through several studies [3,24,29–32]. Early studies by Clavel et al [32] showed that at low stress intensity levels, the fatigue crack growth rate increases with increase in temperature and at higher stress intensity levels, a decrease in frequency causes an increase in fatigue crack growth rate. The increase in crack growth rate was much more pronounced in air environment than vacuum [33]. Work by Floreen

4
et al on the influence of different environments on the crack growth rate of alloy 718 showed that the presence of oxygen and sulphur bearing species leads to higher crack growth rates than other gas environments or vacuum [30]. The crack growth rate was particularly high during the application of dwell times [5,6,29,33]. The dwell time effect is more pronounced in the case of air environment than vacuum, as shown by Smith et al [33] who suggested that the increase in crack growth rate in vacuum with high temperature and a dwell time is due to contribution from creep, which is significantly less compared to the contribution of environment. It was seen that the application of a dwell time changed the crack propagation mode from transgranular to intergranular, particularly at low frequencies of testing [ref]. The nature of interaction of the crack with the microstructure is complex with crack deflections and crack bowing. This makes the crack front jagged, as reported by several studies [3,34,35]. It was observed that random grain boundaries were attacked and fractured more than special grain boundaries [36]. This leaves a number of unbroken ligaments in the crack path. Further crack propagation leads to the plastic deformation and fracture of these ligaments. Krupp et al [31] observed that thermomechanical processing in alloy 718 in order to increase the number of special grain boundaries such as S3 boundaries increased the resistance to high temperature fatigue crack propagation. Thus, it is clear from the aforementioned studies that high temperature fatigue crack growth is a complex phenomenon involving the interaction between variables such as microstructure, environment, loading frequency, temperature, etc. Oxygen plays a crucial role in the acceleration of fatigue crack growth. The precise nature of the action of oxygen is unclear, due to the complexity of the interaction with microstructure. A number of mechanisms [3,4,35,37,38] have been put forward on how oxygen cause intergranular damage. The following section will discuss oxygen enhanced crack growth in detail. 2.2 Oxygen enhanced crack growth At high temperatures and low frequencies, the effect on environment, mainly oxygen, is the principal factor determining the fatigue crack growth rate. Over the past few decades, several attempts have been made to determine the nature of interaction of oxygen with the microstructure of the material. Early studies by Andreiu et al [8,39] explained the interaction of oxygen through formation of oxides of Ni and Fe at the crack tip at higher partial pressures of oxygen for alloy 718. It was followed by the formation of a Cr2O3 layer which is dense and protective unlike the previously formed oxides. They identified a passivation time required during the hold time for the formation of protective Cr2O3 layer. If passivation time is not reached during the hold time, oxidation can proceed. Detailed studies on the influence of environmental variables were conducted by Ghonem et al [9]. The oxidation can proceed through two different diffusions paths: short range diffusion in which only the crack tip gets oxidized resulting in the formation of a wedge like oxide whose fracture accelerates fatigue crack growth; and long range diffusion through grain boundaries and slip planes. It was also noted in this study that the depth of oxygen penetration was controlled by the formation of Cr2O3. More studies were conducted by Molins et al [37] in the same material by varying the partial pressures of oxygen. It was seen that there is a transition pressure below which the environment does not play a role in the crack growth and it was independent of DK. The oxidation mechanism was explained as follows: at low partial pressures, anionic diffusion is the controlling factor; and at high partial pressures, the cationic diffusion is the controlling factor. They suggested that the formation of epitaxial NiO prevented the annihilation of vacancies at the crack tip, leading to material damage.

5
Figure 1: (a) TEM bright field image of a closed crack tip oxide at grain boundary. (b) STEM
EDX of crack tip oxide in Allvac 718plus with Ni+Fe oxide at the center (blue) and chromium oxide around it (red). The green region represents a region enriched in Ni (i.e.
depleted in chromium) [11].
With the use of new techniques such as target specific TEM sample preparation, nanoSIMS and APT, clearer evidence were obtained to show the formation of oxides ahead of the crack tip. Studies by Kitaguchu et al [10] on RR1000 alloy by studying crack tip oxides for dynamic and static cracks revealed the nature of oxidation taking place. TEM results showed the presence of a layered oxide with NiO at the center, Cr2O3 and Al2O3 below, which were in agreement with the thermodynamic sequence. The partial pressures of oxygen required for the formation of each layer of oxide was calculated and it was found that a significant difference in pressures occurred over very small distances. It was interesting to see that the length of the oxide intrusion in the case of a dynamic crack was much smaller than for a crack held below threshold or without applied mechanical load. Also, no protective layers of Cr2O3 or Al2O3 were found in the dynamic crack to prevent further oxygen penetration, similar to the observations in [8]. So, oxygen can penetrate the porous intrusions formed and the cracking will proceed, but the reactive elements present in the grain boundaries such as Ti and Al could form oxide nuclei and limit the extent of penetration. Thus, long range embrittlement for a growing crack is not possible. Similar studies on Allvac 718plus were conducted by Viskari et al [11] with the help of TEM, SIMS and APT. Figure 1 shows the layering of crack tip oxide using STEM EDX. The sustained loading of the specimen was performed in an environment of equal ratio mixture of 16O and 18O. The SIMS analyses showed the presence of oxygen in the same ratio as the environment in the intergranular crack. The TEM and APT analysis showed that the layer of oxide followed the thermodynamic sequence, similar to the mentioned studies.
An alternate explanation to the effect of oxygen is the diffusion of oxygen into grain boundaries ahead of the crack tip leading to their decohesion, and subsequent crack growth. This is generically termed as dynamic embrittlement (DE). This phenomenon has been studied for Ni3Al alloys [40], steel [41], alloy 718 [3,36], etc. McMahon Jr [42] argues that for long range diffusion to occur for the formation of oxides, the diffusion coefficients have to be very high and unrealistic. This issue is addressed in a model developed for stress assisted grain boundary oxidation (SAGBO) by Evans et al [43].

6
Figure 2: Schematic showing crack tip and oxide intrusion ahead (adapted from [43]). A wedge-shaped oxide intrusion (Figure 2) is considered at the crack tip, which has a
stress gradient along the intrusion, ranging from being compressive at the crack tip to tensile at the intrusion tip. According to this model, the local stresses at the crack tip affects the concentration of vacancies. The stress-free oxygen vacancy concentration is inversely related to the partial pressure of oxygen. Since there is a huge difference in partial pressures between the crack tip and the tip of the intrusion, the difference in oxygen vacancy concentrations will also be very large. The stress gradient within the intrusion will lead to the outward flux of oxygen vacancies depending on the stress difference. This provides a physical basis for an accelerated grain boundary oxidation to occur under the influence of stress. A SAGBO parameter is defined in the study to show the ratio of intrusion length under stress and no stress:
𝑆5 = exp𝜎9:Ω<(𝜙 − 1)
𝑘𝑇 (4) where sit is the stress at the tip of the intrusion, Ωm is the volume of the metal atom in the alloy, ϕ is the Pilling-Bedworth ratio, k is the Boltzmann constant and T is the temperature. This gives an idea as to how much the intrusion length would increase under the influence of a stress. According to this model, the intrusion can be expected to be more than an order of magnitude longer if the transformation stress from Cr2O3 formation was considered, which was used to explain the results from [10].
Another significant contribution to the theoretical treatment of oxidation enhanced crack growth was made by Chan [12], who derived a model for the threshold stress intensity factor (Kth) based on previous results and DFT computations to explain high temperature crack growth through oxidation. The threshold due to the fracture of crack tip oxide is given by,
𝐾:B = 𝐸DE𝜀G5𝑡DE
3(1 − 𝜈I) + 2𝑠𝑔𝑛 𝜀:5𝐸DE𝜎N 𝜀:5 𝑡DE2 1 − 𝜈I (5)
where Eox and tox are the elastic modulus and thickness of the oxide, sy is the yield stress, n is the Poisson’s ratio, etr is the transformation strain of the oxide, the sgn function is used to account for the sign of the transformation strain depending on whether the volume of the oxide formed is larger or smaller than that of the oxidized metal, and ecr is the fracture strain of the oxide layer. In this equation, the fracture strain of the oxide is an unknown quantity, that needs to be measured through experiments. Methods need to be developed in order to measure ecr.
Thus, it has been described in the above section on how oxygen enhanced crack growth takes place. There is an ongoing debate regarding the actual mechanism of cracking. But recent evidences from detail work on crack tip oxides point towards to a mechanism similar to SAGBO.

7
2.3 Oxide cracking and property measurement As highlighted by the previous section, the high temperature fatigue properties of superalloys depend on the effect of oxygen and the properties of oxides formed. Oxide properties are critical for service life of superalloys in at least two situations: Cracking or spallation of a protective oxide scale during TMF can lead to accelerated oxidation resulting in strength reduction of the component; and accelerated grain boundary crack propagation due to brittle oxides formed. The oxides experience not only external stresses due to mechanical loading, but also internal stresses. In the case of volumetric expansion during oxidation, the growth of oxides leads to formation of compressive stresses within the oxide scale. This can cause deformation and fracture of the scale as seen in [44], where the oxide got detached from the substrate to accommodate for the strains. Depending on the stress and temperature distribution, the oxide scales can undergo fracture or deformation. Depending on the external stress, oxide scales can fail in multiple manners. The application of a tensile stress leads to scale cracking and a compressive stress leads to spallation [45]. Another possibility is deformation of the oxide scale. Plastic deformation through dislocation glide requires five independent slips systems. Most oxide scales have less than five independent primary slip systems. The stress required to activate the secondary slip systems is higher than that for initiation of cracks below a certain temperature [46]. At high temperatures, plasticity in oxides can occur by creep, which has been observed for Al2O3 [47,48]. There is another possibility where the conditions are such that the oxidation rate is higher than the crack rate, leading to healing of the cracked oxides. This phenomenon is referred to as pseudoplasticity [46]. This was observed in the case of heat resistant steels at 800 °C under tensile strains by Schütze [44]. It was seen that below a critical strain rate, the oxide scale heals itself, thus preventing further oxidation. This effect was more pronounced for adherent scales than detached ones. The properties of an oxide scale determine the life of the alloy protected by it. It is necessary to evaluate the mechanical properties of these scales in order to obtain a reliable model for fatigue life of engineering alloys. The principles of fracture mechanics can be applied to determine the failure conditions of oxide scales. Several studies have attempted to fit fracture mechanics principles for failure of oxide scales [49–51]. One of the challenges faced to determine the fracture strains is the determination of flaw sizes, since the scales are very thin. Optical methods can be used to determine the composite defect size in the oxide scale, as in the case of [49,52]. One of the properties of an oxide scale that is critical is the elastic modulus. There are some indirect methods for the evaluation of elastic modulus such as the vibration method [15]. Vibration method is based on the fact that the resonance frequency of the specimen changes when oxidized. This difference in resonance frequency is utilized in the evaluation of the elastic modulus of the oxide scale. Nicholls et al [15] used this method to determine the elastic modulus of oxide growing on mild steel at 550 °C as 185 GPa. Fracture and spallation of an oxide scale can be detected through the use of acoustic emission [14]. This is based on the principle that these events produce audible signals. The acoustic emission setup was used together with a four-point bending setup in order to determine the fracture strains of oxides in mild steel [53]. This showed a similar aforementioned trend where the critical strain decreases with increasing oxide thickness. It varied from about 0.5% for 10 µm thick oxide to about 0.2% for 40 µm thick oxide. A direct method of determination of the elastic modulus is by using nanoindentation, which also suffers from certain disadvantages such as influence from substrate. Tortorelli [54] used this technique to evaluate the room temperature elastic properties of Cr2O3 scales. For Cr2O3 scale on chromium (oxidized at 850 °C), the elastic modulus was

8
obtained to be 272±62 GPa which was compared with that of bulk sintered Cr2O3 and a similar value of 273±17 GPa was obtained. It is mentioned that the surface roughness of the oxide scales and influence of substrate limit the accuracy of the measured values.
The aforementioned methods have a basic flaw that they are affected by the influence of the substrate at some levels. Since the properties of the isolated oxide cannot be measured using these methods, the values are affected by residual stresses in the oxides as well, which is critical in determining factors such a fracture strain. There is a need for development of novel techniques in order to enable measuring of properties at the micro level [16]. With the use of techniques such as micromachining and FIB milling, it is now possible to manufacture specimens at the micro scale and probe their properties using nanoindenters and micromanipulators. These tools allow mechanical testing of individual grains and probe properties of grain boundaries, which are not possible using conventional mechanical testing. This novel field of testing, termed as micromechanical testing, enables reliable testing of micro features in engineering materials. Within the field of micromechanical testing, several techniques are used depending upon the application and nature of specimens. Micropillar compression is one of the techniques used in determining the deformation properties of individual grains which has been used on a number of materials, as suggested by the review article [55]. It has been used to determine the deformation behavior of sapphire at room temperature [19]. It was seen that plastic deformation occurs in 1 µm sized pillars even though bulk sapphire is brittle at room temperature. This technique is limited by the fact than very thin, sub-micron specimens cannot be analyzed due to limitations in specimen preparation.
Microcantilever bending has been used in the measurement of mechanical properties of thin films, fracture toughness of grain boundaries, etc. Camposilvan et al used microcantilever bending to measure micro scale properties of Zirconia [56]. It was seen that the failure stress was about 4 times larger than standard sized specimen. The size effect plays an important role in determining the properties, as small sized specimens would have very less or no intrinsic defects. Abad et al [57] used this method to determine fracture toughness of oxide scales and the fracture mode in oxide layers, where the whole cantilever was prepared from thick oxides grown on steels in liquid metal coolant environment. The versatility of this method can be seen in the work by Armstrong et al in the case of bismuth embrittled copper grain boundaries [58]. This method enabled the fracture toughness measurement of a single grain boundary with known misorientation determined by EBSD. This technique was also used to determine the properties of oxidized grain boundaries [22,59]. Stratulat et al [59] determined the fracture toughness of oxidized grain boundaries in Alloy 600. In a detailed work by Dugdale et al [22], microcantilever bending is used to determine the nature of crack propagation in an oxidized grain boundary. This study determined that in the case of stress corrosion cracking of Alloy 600, the crack progressed through the oxide metal interface and not through the oxide. The interaction of grain boundary particles with the crack was also studied using this technique. This study was extended in a recent work by Dohr et al [20], which examines the role of surface oxide scales on top of oxidized grain boundaries. With the help of microcantilever bending experiments, it was shown that the surface scale helps in delaying crack initiation at grain boundaries, which is an important result in the field of stress corrosion cracking.
Thus, it can be said that microcantilever bending is an ideal choice for testing of
mechanical properties of micro sized features. The current work involves testing of sub-micron thick oxide scales. It is possible to manufacture and test very thin specimens (< 1 µm) with ease using FIB. It also enables the isolation of thin films from the substrate through FIB techniques, which is the main reasoning behind using microcantilever bending in the current work.

9
Chapter 3 Materials 3.1 Superalloys The term superalloy was first used after the times of World war II to describe a class of high temperature alloys with exceptional properties used in aircraft turbine engines [60]. They are a class of alloys capable of superior performance under high temperature and stress conditions. Typically, they consist of an austenitic matrix with a number of alloying elements and strengthening phases which can withstand loading at temperatures over 0.6 Tm. They also show a substantial resistance to mechanical degradation over long periods of service [61]. In addition to that, they are also able to tolerate extreme operating environments. In the case of power generating turbines, sulphur is present in the combustion gases. For aero engines, kerosene is used as the fuel which can contain salts that accelerate corrosion. This calls for a superior corrosion resistance in the materials used for these applications. When temperatures go above 540 °C, commonly used alloys of titanium and steels lose their strength. Steels are susceptible to accelerated corrosion above these temperatures. Nickel based superalloys can be used at a higher fraction of their melting points without losing any properties. Although refractory metals possess higher melting point than superalloys, their characteristics (such as poor low temperature fabricability) make them undesirable for use in loading applications.
Over the past few decades, considerable progress has been made both in the
development of new superalloys with higher operating temperatures and processing methods to improve their properties. For example, casting replaced wrought materials for blading applications due to better creep performance. Then it was further refined to directional solidification which generates a columnar microstructure, which removed the presence of transverse grain boundaries. For further improvement of performance, machined single crystals are used for turbine blades which has the best creep properties. The importance of superalloys in aviation can be highlighted by the fact that, in 1950s only 10% of the total weight of gas turbine engines comprised of superalloys, which rose to about 50% by 1985 [62].
Superalloys are broadly classified into Ni based, Co based and Ni-Fe based in
accordance with the major alloying element. Ni based superalloys are more common and used in aero engines and power generation turbines. Nickel has an FCC structure that is stable from room temperature to its melting point, unlike cobalt and iron. In the case of cobalt and iron based superalloys, the FCC structure is stabilized through the addition of other alloying elements such as nickel. The FCC structure is preferred for these kinds of applications due to the combination of toughness and ductility. In addition, FCC metals show low values of diffusivity which is essential for high temperature applications [61]. Also, nickel is cheaper than cobalt and is the fifth abundant material on earth.
The strength of superalloys is derived from various phases precipitated in the alloy through heat treatments and also through solid solution strengthening. Superalloys have multiple alloying elements in order to cause solid solution and precipitation strengthening. The formation of a solid solution with multiple elements leads to a local non-uniformity in the lattice and impedes dislocation motion. The precipitates contribute towards strengthening mainly through coherency strain hardening and ordering. The major strengthening phases are coherent with the matrix and have similar crystal structure. They are also ordered structures which implies that the dislocations need a higher energy to pass through them, since an anti-phase

10
boundary needs to be created. Some of the main phases in superalloys are described in the section below. 3.2 Superalloy phases Superalloys have a complex microstructure due to the presence of several alloying elements and secondary phases. The superior mechanical properties at high temperature are derived from the presence of certain strengthening phases. The following section describes the various phases present in superalloys in general, although specific superalloys may have only some of the phases mentioned below.
• Gamma – This constitutes the matrix phase in superalloys which has the FCC structure. It is a solid solution consisting of mainly nickel (for nickel based superalloys) along with some solute elements such as cobalt, iron, chromium, molybdenum, niobium, etc.
• Gamma prime (g’) – This is the principal strengthening phase in many superalloys with
aluminium and titanium. It has an FCC structure (ordered L12). The ordering is maintained up to temperatures close to its melting point of 1375 °C. There is a slight composition dependent lattice parameter mismatch between the matrix and this phase (about 0 to 0.5%), but it is coherent to the matrix. The coherency is maintained through tetragonal distortion of the lattice. The lattice consists of nickel atoms occupying the face centres and the corners shared between aluminium and titanium, which gives the formula Ni3[Al,Ti]. The shape varies from spherical to cubic depending on the exposure time and the lattice parameter mismatch. Changes in the ratio aluminium/titanium also influences the morphology of the precipitate. The aluminium atoms can be replaced by niobium, tantalum or chromium as well.
• Gamma double prime (g”) – This is another precipitate in superalloys such as Alloy 718
which aids the strengthening of the alloy. It has a BCT structure (ordered D022) and have a disc shaped morphology with a nominal composition of Ni3Nb. This is the primary precipitate formed due to the Nb content in Alloy 718, which makes it the principal strengthening phase for the alloy. It has higher coherency strain and has a limited number of slip systems available, which imparts excellent high temperature properties to the alloy. This phase loses its strengthening effect above 650 °C which limits the service temperature of g” strengthened alloys.
• Delta (d) – It is a stable precipitate usually found in Alloy 718 with an ordered
orthorhombic structure. Although it does not contribute much towards strengthening of the alloy, it is used to control gran size and can also increase the creep rupture strength. It has an acicular morphology.
• Carbides – The carbon content in superalloys ranges from 0.02% to 0.2%. This causes
the precipitation of primary carbides of MC type. During aging, they can decompose and lead to the formation of M6C or M23C6. Fine carbides precipitated in the matrix can result in matrix strengthening. Grain boundary carbides of certain morphologies can prevent grain boundary sliding and allow relaxation of stress. They can also aid in the tying up of elements that may otherwise cause instabilities in the alloy.
• Topologically close packed (TCP) phases – These are some phases such as s ( FeCr,
CrCo, FeCrMo ), µ (Co2W6) or Laves (Fe2Nb, Fe2Ti) phases which are detrimental to

11
properties of superalloys. They are usually of plate or needle like morphologies and can cause decrease in rupture strength and ductility. The formation of these phases is usually a result of solute segregation.
3.3 Materials in this work The different alloys used in the work have been described in this section. Alloy 718 was used in the high temperature crack growth studies. Laser welded sheets of this alloy were used to prepare tensile specimens used in the dwell fatigue testing. The other superalloy used in this work is Allvac 718plus which is similar to the previous alloy but capable of higher operating temperature. This was used to study the micromechanical properties of thermally grown oxides in a superalloy. The nominal compositions of the alloys are given in a table below:
Table 1: Nominal compositions of alloys studied in wt%. Ni Cr Fe Co Nb Mo Ti Al W C
Alloy 718 52.5 19.0 18.5 5.1 3.0 0.9 0.5 <0.08 Allvac 718plus 52.0 18.0 9.5 9.1 5.4 2.7 0.75 1.45 1.0 0.02
3.3.1 Alloy 718 Alloy 718 is a nickel-iron based superalloy mainly strengthened by g” phase. It is one of most commonly used superalloys in gas turbine engines, both as turbine disk material and in stationary structures and housings. The high content of iron makes it cheaper than most superalloys. It presents excellent weldability among the different superalloys due to sluggish precipitation kinetics of g” phase and this makes it ideal to be used in welded assemblies in the gas turbine engines. It has excellent hot and cold workability, excellent strength and moderate cost. The main limitation of this alloy arises from the instability and loss of strengthening effect of the strengthening phase above 650 °C. Prolonged exposure to temperatures above 650 °C also lead to g” coarsening and transformation of g” to d which can reduce the strength of the alloy. There is a small amount of g’ formed as well, but the strengthening effect of g’ is much less in this alloy compared to others. The presence of Nb leads to the formation of g” instead of g’. Another phase, d is also precipitated through controlled heat treatments in order to regulate the grain size and improved grain boundary properties. Primary carbides in the form of NbC and TiC are also generally present in the alloy. 3.3.2 Allvac 718plus Allvac 718plus is nickel based g’ strengthened alloy developed recently. It is very similar to Alloy 718 in composition, but half of the Fe content is replaced with Co and the Al/Ti ratio is increased. The advantage with this alloy is that the maximum operating temperature is 704 °C, which is 55°C more than that of Alloy 718. This alloy was a result of years of efforts to increase the operating temperature of 718 without compromising its properties. Some amounts of d (Ni3Nb), h (Ni3Ti), g” and primary carbides are present in this alloy as well. The increased Al/Ti ratio aids in the formation of g’, thus increasing the operating temperature of the alloy. This alloy was used in this work to produce thermally grown oxides and study their mechanical properties. Mechanically polished specimens of Allvac 718plus were exposed to an environment of pure and dry oxygen at 700 °C for 100 hours to form an oxide layer. The

12
mechanical properties of the oxide layer have been studied using micromechanical testing. Additional samples were exposed for a time period of 500 hours, but the work focuses mainly of the 100 hours oxide.
13
Chapter 4 Methods
The methods of characterization and analysis form a major part of any research in the field of materials science. There are several tools that serve purposes such as crystal structure determination, microstructure examination, chemical composition analysis, etc. Some of the principal techniques used are described in this chapter. 4.1 Scanning electron microscopy (SEM) SEM is one of the most versatile electron microscopy techniques. It enables the examination of a wide range of materials from the nanometer to the micrometer scale. It enables the analysis of bulk specimens with a high spatial resolution (a few nanometers) [63]. An SEM uses a focused electron beam with voltages in the range of 1-30 kV for imaging. The beam is scanned over the area of interest which generates a set of signals due to the interaction between the electrons and the specimen. The image in an SEM is generated by the use of this signals. The main signals generated are the secondary electrons (SE) and backscatter electrons used for imaging and characteristic X-rays used for chemical analysis.
• Secondary electrons – They are low energy electrons generated from near the surface of the specimen through inelastic scattering. They can be used to generate topographic contrast. Secondary electrons are detected using an Everhart-Thornley detector, which consists of a scintillator in a faraday cage. A small positive bias is applied to the faraday cage in order attract the low energy electrons.
• Backscatter electrons – They are high energy electrons that are elastically scattered.
Since the primary electrons interact with the nucleus of the specimen, they carry information regarding atomic number. They are detected using a solid stated detector concentric to the electron column.
• Characteristic X-rays – They are emitted when an electron from outer shell fills a
vacancy in an inner shell created by interaction with the primary electrons from SEM. Such X-rays have a unique energy depending on the atomic number of the element from which it is emitted. Thus, it can be used for chemical analysis.
In addition to the above signals, other signals can be used for imaging and analysis such low loss electrons, diffracted backscatter electrons, etc. Even though TEM has the best resolution among all microscopes, there are some advantages to the use of SEM. A wide range of samples can be analyzed with SEM which is not possible using TEM (due to preparation difficulties). The area that is analyzed is much larger when compared to TEM. The sample preparation procedure is simpler in the case of SEM. But one of the requirement of SEM is that the sample needs to be conductive. Non-conducting samples are usually sputter coated with a conductive layer before imaging. They can also be analyzed in an environmental SEM which enables the imaging of non-conductors under low vacuum conditions. Some specific aspects of SEM used in this work has been described below.

14
4.1.1 Electron channeling contrast imaging (ECCI) ECCI is a mode of imaging which utilizes the channeling effect of electrons through a crystalline material to produce crystallographic contrast. This mode of imaging uses the backscattered electrons to produce channeling contrast. The degree of backscatter for an electron depends on the proximity to the nucleus of the atom scattering it. Thus, the number of backscattered electrons depends on the orientation of the lattice with respect to the incident beam. If the low index planes of the crystal are parallel to the incident beam (Figure 3(a)), the electrons penetrate deep before scattering and fewer of the backscattered electrons reach the surface and can be detected. The electrons in this case channel through the crystal planes. If the planes are inclined to the beam direction at a certain angle (Figure 3(b)), the number of backscatter electrons generated will be higher. Imaging using this technique will show crystallographic contrast where the orientations are comparatives of neighboring grains. If the area is scanned by a rocking beam with sufficient variation in incident angle, electron channeling patterns (ECP) can be obtained which are Kikuchi like lines containing crystallographic information. They can be used to obtain crystal orientation information and detection of crystal defects on the surface such as stacking faults and dislocations. This section will focus on the imaging and not on channeling patterns.
Figure 3: Schematic showing contrast mechanism in ECCI. (a) incident beam parallel to
lattice plane of specimen, (b) lattice planes at an angle to incident beam. There are certain requirements of the beam in order to obtain optimal channeling contrast [64]:
• The beam needs to be collimated and not convergent.
• The beam current needs to be high in order to get a higher signal to noise ratio.
• Channeling contrast is obtained at the expense of spatial resolution. The beam diameter needs to be broad in order to obtain sufficient signal.
In addition, the sample has to be prepared according to some conditions in order to obtain the required contrast:

15
• The surface of the specimen needs to be clean and devoid of oxides in order to prevent the degradation of contrast. Hydrocarbon contamination needs to be avoided, which implies the specimen cannot be scanned for a longer time.
• No plastic deformation should be induced by sample preparation methods. It is essential
to obtain a damage layer thinner than the interaction volume for the backscattered electrons.
• The surface to be scanned needs to be smooth without any significant topographic
contrast. Topographical features on the surface of the specimen can mask/distort the channeling contrast.
Some of the advantages of using this technique of imaging is listed below:
• This technique eliminates the need for chemical etching in order to view the microstructure and precipitates in a material in the SEM (Figure 4(a) and (b)).
• A preliminary idea regarding the orientation (Figure 4(a)) of grains can be obtained, even though it is only relative.
• Some features such as plastic deformation is discernible due to a local lattice rotation
and can be utilized in situations such as detection of plasticity around cracks (Figure 4(b)).
• Using cECCI [65], which is ECCI under controlled conditions, individual defects such
as dislocations and stacking faults can be imaged in an SEM, which was previously possible only using a TEM.
Zaeferrer et al [65] commented that mechanical polishing followed by oxide suspension
polishing as the final step gives a higher surface quality than electropolishing and ion-milling. Electropolishing led to the formation of an oxide layer and Ga ion milling lead to the formation of an amorphous damage layer on the surface. This is consistent with our observations that oxide polishing gives a superior surface finish.
Figure 4: (a) Orientation contrast in Allvac 718plus, (b) Plastic deformation visible around a
crack in Alloy 718 (dotted line) and secondary phases visible clearly without etching.

16
4.1.2 Electron backscatter diffraction (EBSD) EBSD is a microanalysis technique used in the SEM in order to obtain crystallographic information from crystalline materials. It can be used to deduce the crystal structure, identify phases, reveal texture, etc. When high energy electrons strike a specimen surface, back scattered electrons are generated which undergo Bragg diffraction. The intersection of the diffraction cone and a phosphor screen placed near the specimen produces a pattern of Kikuchi lines called as electron backscatter patterns (EBSP). This is used as the basis for identification of the orientation of the crystal and the phase. The EBSD detector consists of a phosphor screen that can be moved inside the SEM chamber towards the sample which is place at a steep angle (70°) to the normal plane of the beam (Figure 5). Typically, a voltage of 20 kV is used under high current conditions in order to generate a high number of backscatter electrons.
Figure 5: Schematic of EBSD setup inside the SEM.
The analysis of EBSD patterns is done in different ways according to the purpose. In
this work, EBSD has been mainly used for analyzing crack propagation behavior. The presence of texture in the material can be visualized with the help of inverse pole figure (IPF) maps [66]. These maps show the sample directions (eg: the loading axis) in terms of major crystallographic directions of the material. A fixed color scheme based on orientations is used for the construction of the maps. It is also possible to find the local misorientation using kernel average misorientation (KAM) mapping [66]. KAM mapping is used to qualitative determine the amount of plasticity in a material as a local misorientation is created due to plastic deformation. This is done by comparing the misorientation of a pixel with its neighboring pixels and assigning the average value of misorientation to it. The quality of the EBSD data generated depends on the quality of the specimen surface, which makes sample preparation a critical step for EBSD. The lateral resolution of this technique is limited by the backscatter resolution of the microscope due to the larger interaction volume. 4.2 Focused ion-beam (FIB) microscopy The FIB is an instrument similar to the SEM in setup, but uses ions instead of electrons as the imaging source. This class of instruments have revolutionized the semiconductor industry with respect to nanomachining, enhanced etching etc. In the 1980s they were used mostly in semiconductor industries for masking and circuit repair [67]. They found their way into

17
research laboratories only in the 1990s. One of the most important contributions of FIB to research is the means for target specific TEM lamella preparation. This instrument allows TEM sample preparation with a greater degree of precision than conventional methods at specific microscopic sites. Today, the most common form of FIB microscopes comes with a dual column; an electron column that is vertical and an ion column inclined at an angle to the electron column (angle depends on manufacturers). The main application of FIB is for imaging and sputtering.
Unlike broad ion-beams used for TEM lamella preparation or preparing cross sections, FIB uses a highly focused ion beam. It uses a field ionization source with a size of about 5 nm in order to generate a very fine beam. The source used is usually a liquid metal ion source (LMIS) which can produce bright and focused beams. The source used in most of the cases is gallium due to its low melting temperature and low volatility. Recently there are some FIBs using xenon plasma as source in order to generate higher currents for sputtering of larger areas, but at the expense of the resolution. Since it is impractical to build huge electromagnetic lenses to focus ions, electrostatic lenses are used instead. Although the resolution depends on the beam shape and intensity, the sputtering resolution is material dependent. The stage for this instrument is designed to have a eucentric point, which aids in maintaining the field of view when the specimen is tilted towards the ion column. Imaging in a FIB can be performed thorough the usual detectors in SEM, SE and BSE detectors. In addition to that, ion-induced secondary electrons (ISE) can also be detected. The advantage of using ISE for imaging is a strong channeling effect created by these electrons, enabling a grain structure view in case of crystalline materials. In addition to the imaging and sputtering capabilities, FIBs are also used for target specific CVD. Secondary electrons generated by ion beams or electron beams can be used to crack hydrocarbon precursor gases in order to deposit materials such as platinum, tungsten, carbon or SiO2 films. This can be used as support structures or protective films for materials science applications.
When an ion hits the surface of a solid, more than one type of interaction can take place. Namely, ion reflection, electron emission, electromagnetic radiation, sample damage and heating. The interaction can be either inelastic or elastic. Elastic (nuclear) interactions result in sample displacement and forms the reason for sputtering of material. The generally accepted model for ion-sample interaction is the collision cascade model [68], which determines whether sputtering occurs or emission of secondary electrons. These interactions lead to the implantation of Ga ions in the material. The depth up to which the implantation takes place can be calculated using molecular dynamic or Monte-Carlo simulations. Typically, a Monte-Carlo simulation software called SRIM [69] is used to calculate the implantation depth according to the angle of incidence and energy of ions. There are some aspects of FIB milling that one should consider in order to ensure optimal results:
• Damage layer – The sputtering of material using Ga ions causes ion implantation as discussed previously. This results in a damage layer of certain thickness which is amorphised. It also can lead to creation of point defects and dislocations. This is especially important in the case of TEM foils, atom probe tips and micro-mechanical test specimens. The preparation needs to be done carefully in order to minimize the damage as much as possible.

18
• Curtaining – In crystalline materials, the sputtering creates a surface roughness due to several factors such as surface diffusion, channeling effect etc. In order to obtain a cleaner surface, low currents for milling or a rocking stage can be utilized.
• Redeposition – The sputtered material can get redeposited in the nearby regions which
decreases the sputter yield and require sputtering a second time. Some of the major applications of FIB in the field of materials science is mentioned below:
• TEM lamella preparation – This is one of the most common application of FIB in multiple disciplines of research. TEM lamellae can be prepared from specific sites of interest using a widely known lift out method.
• Atom probe tips – Tips used for Atom Probe Tomography (APT) can be prepared from
specific sites using FIB.
• Micromechanical test specimens – Specimens for micro-mechanical testing can be milled using FIB with a high degree of accuracy. Preparation of micro-cantilevers, micropillars, microbeam specimens etc has been made simple through the use of FIB.
4.3 Microcantilever bending A cantilever is a type of beam which is fixed at one end and is free at the other. It can be used in mechanical testing for measurement of material properties. If the geometric parameters, the load and displacement are known, it can be used to calculate the stresses experienced by the material and the elastic modulus. Micromechanics has gained a significant position in the probing of mechanical properties of micro sized structures. Microcantilever bending is one of the most common methods used in micromechanical testing [22,56–58]. The beam bending theory can be used to derive equations for the displacement of the beam.
Figure 6: A simple cantilever beam of length L with a load F.
Consider a cantilever beam of rectangular cross section which has been loaded at the free end by applying a force F (Figure 6). The displacement of the beam at a distance x from the fixed end can be calculated using,
𝑦 = 𝐹𝑥I
6𝐸𝐼 3𝐿 − 𝑥 (6) where E is the elastic modulus, I is the area moment of inertia, which is bh3/12 for a rectangular cross section of width b and height h, and L is the length of the cantilever. The maximum
19
displacement will be experienced at the free end, which can be obtained from the above equation.
𝑦<VE =𝐹𝐿W
3𝐸𝐼 (7)
The bending stress experienced by the beam can be obtained from the flexural formula,
𝜎 =𝑀𝐼 𝑧(8)
where M is the bending moment and z is the distance from the neutral plane of the beam. Neutral plane is a plane in the beam where only bending is experience without any tensile or compressive stresses.
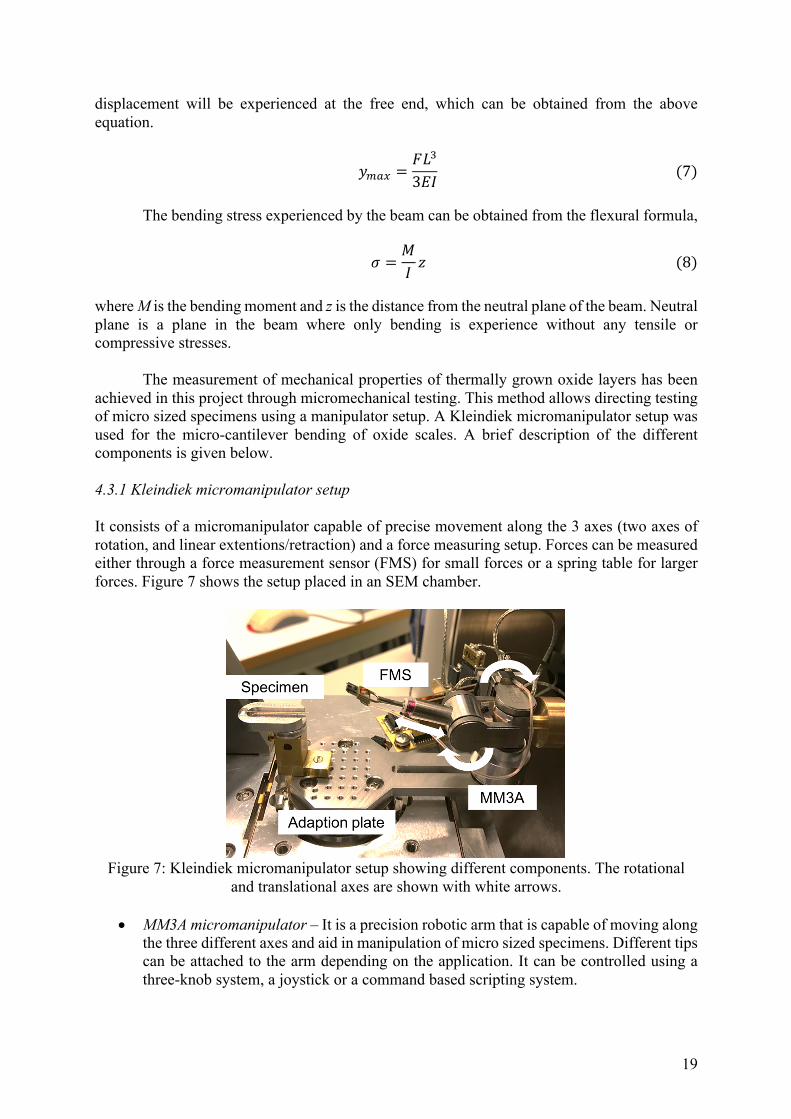
The measurement of mechanical properties of thermally grown oxide layers has been achieved in this project through micromechanical testing. This method allows directing testing of micro sized specimens using a manipulator setup. A Kleindiek micromanipulator setup was used for the micro-cantilever bending of oxide scales. A brief description of the different components is given below. 4.3.1 Kleindiek micromanipulator setup It consists of a micromanipulator capable of precise movement along the 3 axes (two axes of rotation, and linear extentions/retraction) and a force measuring setup. Forces can be measured either through a force measurement sensor (FMS) for small forces or a spring table for larger forces. Figure 7 shows the setup placed in an SEM chamber.
Figure 7: Kleindiek micromanipulator setup showing different components. The rotational
and translational axes are shown with white arrows.
• MM3A micromanipulator – It is a precision robotic arm that is capable of moving along the three different axes and aid in manipulation of micro sized specimens. Different tips can be attached to the arm depending on the application. It can be controlled using a three-knob system, a joystick or a command based scripting system.

20
• Force measurement sensor (FMS) – It consists of a piezo silicon cantilever which generates a voltage signal during bending. This voltage signal can be converted to a force signal by calibration it against a spring of known force constant. The calibration and recording of force can be performed through a software interface. It can be used to measure forces below 360 µN. Above this value the calibration of the silicon cantilever fails. The displacement in measured from a series of SEM images taken at a regular rate of 1Hz. Figure 8 shows the image of FMS and the SEM image of the actual Si cantilever that measures forces.
Figure 8: (a) Picture of FMS highlighting the sensor region; (b) Top view of the Si
cantilever (dotted circle) with the side view of the cantilever shown inset.
• Spring table – For forces larger than the aforementioned value, a spring table is used. It consists of a spring of known spring constant and the specimen can be mounted on the edge of the spring (Figure 9). The deflection is measured through SEM images and a software is used to perform image analysis and extract the force values based on the spring constant. The force is measured from a fixed point in the images and the displacement is measured from the point of application of load. The advantage is that spring tables of a range of values of spring constant can be manufactured depending on the need.
Figure 9: Spring table setup with position of specimen shown.
4.3.2 Microcantilevers The major part of FIB milling in this project has been for the preparation of micro-cantilevers. Various methods were developed in order to prepare specimens of different geometries. The descriptions of the different types of cantilevers, their application, merits and demerits are given in this subsection.

21
1. Type 1 – Composite cantilever with metal and oxide.
Figure 10: Type 1 cantilever with oxide supported by metal substrate.
This was the first type of cantilever developed for the purpose of testing of oxides. It consists of a composite cantilever with an oxide layer on top and a metal substrate supporting the oxide layer. The ratio of thickness of oxide to substrate was about 1:4. During the bending of the cantilever, the upper layers experience tensile force which can cause the oxide layer to fracture. This would be seen in the force displacement curve as a sudden drop in force. Further bending would lead to a change in slope as the stiffness of the oxide layer and the substrate are different (Figure 11).
Figure 11: Schematic force-displacement curve for type 1 cantilever.
The advantage of this method is that the entire oxide layer will be in tension. But the residual
stresses in the oxide layer are not relived and it will influence the measured properties of the oxide. The force resolution of this type of experiment was checked using FEM simulations and it was concluded that the fracture of the oxide should be visible in the force curve with the proportions used (typically a force drop of around 10% is expected, which would be readily observable at the applied load levels). A set of two experiments were conducted using this method, but no force drop was visible. It is not clear whether this was because cracking did not occur or because it was not detectable with the experimental setup. The failure to detect the fracture event could be due to the movement of the force measuring tip during large displacements (see discussion section of paper II) or the effect of residual stresses. The substrate has to be removed in order to relieve the residual stresses in the oxide layer.

22
2. Type 2 – Oxide cantilever with substrate removed In order to relieve the residual stresses in the oxide cantilever, the substrate was completely removed through stepwise milling in FIB. The residual stress in oxides consists of two components; mean stress and gradient stress. Mean stress is caused due to the mismatch in co-efficient of thermal expansion of the oxide layer and the metal beneath. Gradient stress is caused by localised effects such as atomic diffusion and the different in boundary conditions between the bottom and top layer of the oxide [70].
Figure 12: Type 2 cantilever with the metal substrate removed completely.
The advantage of this type of cantilever is that it is possible to obtain the fracture properties of oxide without the influence of residual stress or the substrate properties. But in practice, the removal of the substrate results in a curvature of the cantilever which makes it difficult to achieve sufficient accuracy in the geometry and to apply the load with enough precision to conduct a bending test, as seen in Figure 13.
Figure 13: Actual geometry of type 2 cantilever after milling. Arrows point to geometric
defects.
3. Type 3 – oxide cantilever from spalled oxide scales Another method to isolate the oxide from the substrate is to physically remove it. In the case of oxide scales that are not very adherent to the surface, one can use this property to remove the scale from the specimen surface using the Omniprobe micromanipulator in the FIB. The spalled scales are soldered to the tip of Omniprobe using organometallic platinum and the manipulator is withdrawn to separate the oxide scale from the substrate (Figure 14).

23
Figure 14: Schematic of oxidised surface. The spalled oxide scales can be picked up using the
Omniprobe micromanipulators inside FIB.
The isolated scale is then deposited on a substrate which can be either a TEM half grid or a used atom probe needle. The scale is then milled using FIB in order to obtain the required geometry of the cantilever. Figure 15 demonstrates the steps involved in preparing type 3 microcantilevers (top-view).
Figure 15: Steps for preparation of type 3 micro-cantilevers. (a) spalled oxide scale removed form metal substrate using Omniprobe needle, (b) Scale is soldered to a substrate with Pt, (c)
FIB milling on the scale to prepare microcantilever.
Figure 16: Type 3 cantilever soldered to a TEM half grid.
The advantage of using this method is that the oxide layer is free of residual stresses.
However, there are some concerns regarding this method. The stability of the soldered joint is unknown and needs further analysis. Even if a large amount of Pt is used in the soldering, discontinuities within can act as stress concentrations. Also, the solder material is not stable at high temperatures, which renders this method unsuitable for high temperature testing. Even if a thermally stable solder such as tungsten is used, the thermal mismatch between the solder, specimen and the support would lead to instabilities in the mechanical test.
A type 3 cantilever was manufactured from spalled scales in additional samples of exposed
Allvac 718plus. It can be seen from figure 16 that there is a taper in thickness of the cantilever. This would lead to errors evaluation of properties such as fracture toughness and elastic modulus. The bottom layer needs to be milled carefully in order to make the geometry uniform. The TEM grid also needs to be modified in such a way that the FMS tip can access the microcantilever.

24
4. Type 4 – Alternate geometry for isolated oxide
It was seen from type 2 microcantilevers that it is not possible to produce long cantilevers with isolated oxide scale due to the internal stresses present. So, an alternate geometry was designed by combining the type 1 and 2 microcantilevers. The oxide layer was isolated for a short distance near the fixed end (about 2.5 µm), while keeping the rest of the length of the cantilever attached to the substrate.
Figure 17: Steps involved in making type 4 microcantilevers. (a) area around the cantilever is milled, (b) the oxide layer is isolated through successive milling of the metal substrate, (c) the
cantilever is freed from the support as the final step.
Figure 18: SEM image of a type 4 microcantilever with isolated oxide layer marked. Note that the oxide layer is not visible in the image due to the use of secondary electrons for imaging.
Figure 17 shows the different steps involved in the making of type 4 micro-cantilevers.
After milling a region similar to that for type 1, the metal is milled away step by step, until the oxide layer is reached (Figure 17(b)). The microcantilever is detached from the support as the last step (Figure 17(c)) so that it is stable for the whole of the previous milling steps. The result is a combination of advantages of two different types of cantilevers. The isolated part is the region of interest where the maximum bending takes place (Figure 18). This region is devoid of any residual stresses and free from substrate influence. The rest of the cantilever acts as a support to the oxide scale which would curl up without a substrate due to the residual stress. This method is easily extendable to high temperature tests as well. One drawback of this method, and indeed all methods with isolated oxide scales, is that only the topmost part of the oxide layer is in tension due to a steep stress gradient. Due to the advantages presented above, this type was chosen for the experiments conducted in this study. Since it is not a standard geometry, formula for displacement was derived by combining two standard cases (cantilever with point load, and moment). The detailed derivation is presented in the supplementary material of paper II. The total free end displacement is given by,
𝛿] =𝐹]^𝑔𝐸_𝐼_
(9)
where Feq is the equivalent force (the force applied at free end which gives the same bending moment as an actual force applied away from the free end, see paper II for further details), E1

25
and I1 are the elastic modulus and area moment of inertia of the oxide layer, and g is the geometric factor given by the formula,
𝑔 = 𝐿I𝜒 − 𝐿𝜒I +𝜒W
3 (10) where L is the total length of the cantilever and c is the length of the isolated oxide layer. Since the displacement and the dimensions of the cantilever can be measured using SEM, this formula can be used for the calculation of elastic modulus.
4.3.3 Testing procedure The different steps involved in the method have been described below:
1. Sample preparation – The testing method entirely depends on the perfection of the specimens. The microcantilevers are prepared using focused ion-beam (FIB) milling which is described in detail in the FIB section. Once the sample preparation is done, it is mounted on an aluminum stub in such a way that the bending plane of the micro-cantilever is horizontal. This is in order to enable a proper view of the micro-cantilever while bending through the SEM.
2. Micromanipulator setup – The previously described Kleindiek micromanipulator setup
is used for the bending tests here. This is mounted on the SEM stage with the help of an adaptation plate which holds the specimen and the manipulator. This is in order to ensure that while the stage moves, the sample and the manipulator move together. The first step is to mount the setup with a calibration spring supplied by Kleindiek in order to find the force constant for the FMS. Then the spring is replaced by the sample. A schematic of the test setup is shown in Figure 21.
3. Drift tests – Drift tests are conducted in order to measure the thermal drift in the SEM
with the setup inside. A series of images are recorded at a frequency of 1 Hz and the image is focused on a unique mark in the field of view in order to measure the drift through image analysis. The images are recorded for a time period of 5 minutes and the drift rate is calculated after image processing. This test is performed again after a number of experiments in order to ensure that there is no rapid variation in the drift.
4. Manipulator alignment – The microcantilever of interest is brought within the field of
view and the micromanipulator is slowly brought near the cantilever. The loading point needs to be at the center of the width of the beam in order to ensure pure bending. Loading away from the center point can lead to twisting of the beam. In order to guide us to place the FMS tip at the required loading point, a line of platinum is deposited using FIB at the free end of the cantilever during preparation (Figure 19).
Figure 19: Top and side views of the cantilever with Pt solder deposited at width center for
guiding alignment.
26
5. Elastic bending – A set of small displacement bending tests are performed so that the
bending is within the elastic region of the oxide. This is to calculate the stiffness of the oxide layer. This is done both before and after large displacement tests as a way to ensure that there is no significant change in the stiffness. A change in stiffness indicate the presence of microcracks. As it is difficult to detect microcracks using SEM, this method is used instead. The force is recorded using a FMS software provided by Kleindiek. The displacement is measured with the help of SEM images recorded at the rate of 1 Hz.
6. Large displacement tests – The elastic bending tests are followed by large displacement
tests in which the micro-cantilever is bent as much as possible. In this case, the micro-cantilever can either fracture or deform plastically. In the case of fracture, the loading is stopped at the point of fracture. In the case of plastic deformation, a set of large displacement tests are conducted at a slow loading and unloading rate.
7. Post processing – In this step, the SEM images are used for extracting the displacement
data. A MATLAB script is used to calculate the displacement from the images. This is then put together with the force data from FMS in order to obtain a force-displacement curve. To facilitate easy fit between the force and the displacement data, the data from FMS and the SEM is recorded over the same time.
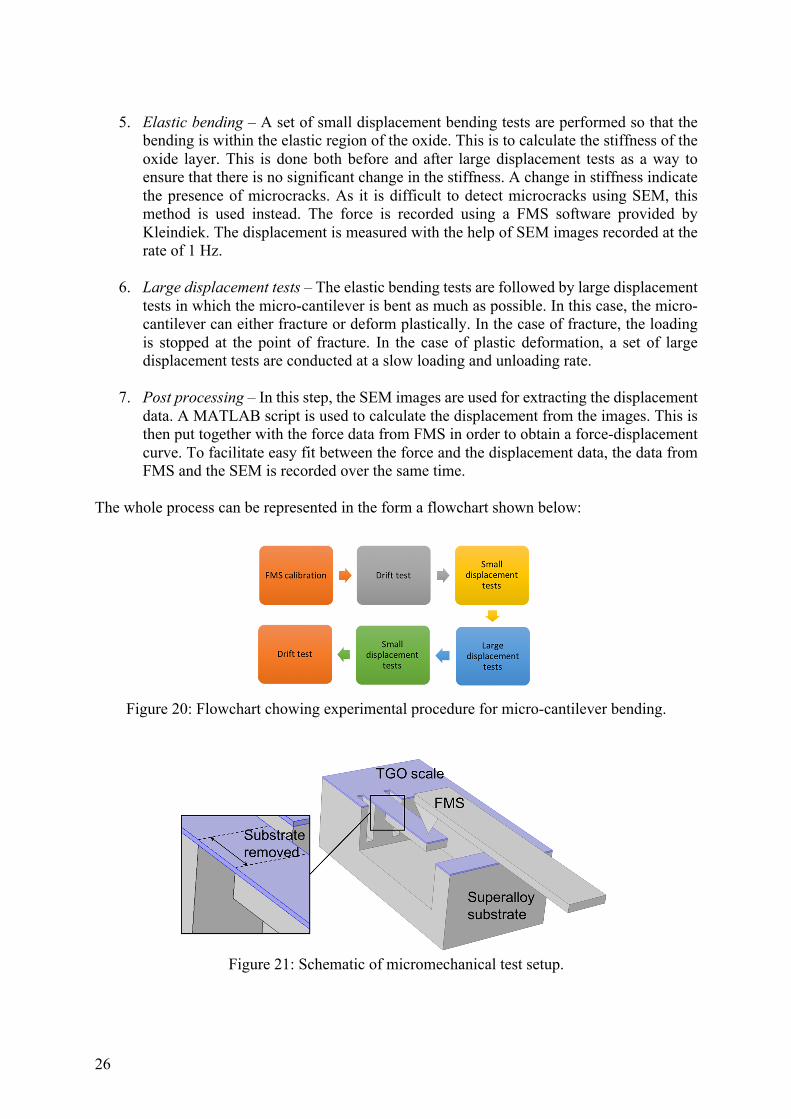
The whole process can be represented in the form a flowchart shown below:
Figure 20: Flowchart chowing experimental procedure for micro-cantilever bending.
Figure 21: Schematic of micromechanical test setup.

27
4.3.4 Sources of error There are a number of factors to take into account that can cause errors in the measurements due to the setup, the microscope or the specimen. Following is a list of the different sources of error possible with the current micromechanical setup.
• Drift in SEM – It can occur due to various reasons such as contamination, grounding problems, loose specimens, etc. Since the displacement in this setup is measured with the help of SEM images, it is essential to take drift into account. This is especially important for the spring table setup. It can lead to wrong values of displacement (or force) if not accounted for. Therefore, the drift is checked in the SEM before and after the experiments in order to quantify and correct for it.
• FMS calibration – As it has been mentioned before, the FMS is calibrated against a
spring of known spring constant, by moving the spring to a distance of 1 µm using the FMS tip. The spring constant has an uncertainty of 10%, as reported by Kleindiek. The positioning of the tip at the end of the spring can affect the value of the voltage constant obtained. Therefore, the calibration was done multiple times to determine the spread in the values and it was found that there is about a 5% variation in the voltage constant obtained through the calibration.
• Misalignment - During the bending test, the FMS tip should be at the width center of
the cantilever. If the tip is away from the center, it can lead to twisting of the cantilever in addition to bending. This results in error in force values and displacement as well. In order to aid the alignment of the tip, a fine line of Pt solder is deposited at the width center of the cantilever and the tip is placed on top of the line.
• Geometrical uncertainties – The geometry of the cantilever is prepared using FIB,
which can lead to uncertainties in dimensions, especially at the oxide-metal interface. In the calculation of the elastic modulus, it can be seen that the thickness of the oxide is present as a power of three. So, the milling as well as the measurement should be done accurately in order to prevent large errors in the calculations.
• Horizontal force component - A point load applied to generate a large displacement will
generate a force component in the x direction in addition to the applied force in y direction. This will affect the bending of the beam, for which a correction factor is required to correct the stress [71] given by,
𝜎GD55 =tan 𝜃𝜃 𝜎(11)
q is the deflection angle at the loading point and s is the uncorrected stress. In addition to this, another related effect was observed in the present case when the displacement became large, in particular during unloading. The sliding of the FMS tip along the top surface of the oxide during unloading induced what is thought to be a non-ideal bending of the FMS silicon cantilever. Consequently, the forces measured during unloading were lower than those measured during loading. This effect is a particular feature of the micromanipulator setup used. It occurs only at large displacements, and therefore does not affect the stiffness measurements.

28
• Compliance error - The model for the cantilever assumes fixed support. But in reality,
the material near the fixed end of the cantilever is free to deform, leading to an error referred to as compliance error. This error is complex and cannot be handled analytically. So, the results are compared to FEM simulations and the correction factors are deduced. In the current study, FEM simulations were performed to compare the results in elastic modulus, showing that in the case of an idealized geometry the compliance error is around 6%, which is small compared to the expected uncertainties in geometry (see supplementary material in paper II for more details).
• Manual errors – There is a possibility of manual errors in the case of image analysis
where a MATLAB script is used to calculate displacement by selecting different points in the images. It is essential to quantify the variation in displacement/force values calculated through image analysis.
4.4 Sample preparation Sample preparation is critical for any characterization method. In order to obtain results that are of good quality, it is essential to prepare the sample carefully. There is no general formula for sample preparation as it depends on the kind of analysis and the type of specimen. A recipe for a specific material is prepared through repeated trials. The different methods of sample preparation used in this work for various purposes have been listed below.
• For SEM imaging and EBSD a metallographic preparation method was used. The specimens were mounted on a conductive thermosetting resin and polished in a metallographic polishing machine. The initial steps consist of grinding using silicon carbide papers with grit sizes from 400 to 4000 for two minutes in each step. This produces a mirror finish on the surface, but it consists of a damage layer of significant thickness. This is followed by polishing using diamond suspensions of 3, 1 and 0.25 µm particles sizes for 15-20 minutes at each step. This reduces the thickness of the damage layer. As the final step, oxide suspension polishing is done using alumina or silica particles of 0.05 µm size. This step has a combined mechanical and chemical effect and aids in the removal of the plasticized damage layer. The result is an excellent surface which can be used for ECCI, EBSD and EDS without any modification.
• For TEM, standard method for thin foil preparation in FIB was used [72].
• For microcantilevers, the rough FIB milling was performed at 30 nA and the current
was reduced in steps to a final polishing current of 100 pA in order to obtain a surface with minimum gallium damage.
• For creating flat edges for preparation of microcantilevers, broad ion-beam (BIB)
polishing was used at a voltage of 6.5 kV and 2.4 mA current for 6 hours.

29
4.5 Furnace exposures Box shaped specimens of Allvac 718plus with approximate dimensions 15´15´4 mm was metallographically prepared up to 1 µm diamond suspension polishing. This ensures that the oxide scale thickness does not vary much due to surface roughness. The exposure was performed in an alumina tube furnace at a temperature of 700 °C for 100 hours. Dry oxygen was circulated through the tube at the rate of 250 ml/min. The uncertainty of temperature in the hot zone of the furnace was ±5 °C. The exposure generated an oxide layer of about 200 nm thickness. These thermally grown oxide layers are used in the micromechanical testing to analyze their fracture properties.

30

31
Chapter 5 Results and outlook 5.1 Summary of results Issues relating to oxidation induced failure have been studied in this work. The influence of dwell time in the high temperature crack growth of Alloy 718 welds was studied with the help of microscopy in the initial part of the work. This work (paper I in the thesis) was recently published in Materials Science and Engineering A. The latter part was focused on developing testing methods for measuring mechanical properties of surface oxide thin films. This part (paper II in the thesis) has been submitted to Scripta Materialia. The following sections will briefly describe the important results from both the parts. The reader is requested to refer to the appended papers for detailed results. 5.1.1 Environmental influence in high temperature crack growth High temperature fatigue testing with pure cyclic and dwell times were performed on laser welded Alloy 718 sheets. Surface flaw type specimens were used for the testing. Two different temperatures of 550 and 650 °C were selected for the fatigue testing. The fatigue testing was performed at Swerea Kimab AB. The crack cross sections were analyzed with the help of SEM imaging and EBSD. ECCI was used for imaging of cracks in order to visualize the secondary phases and plastic deformation. The sample preparation was done through a modified metallographic preparation scheme by optimizing the parameters. In the case of both cyclic and dwell fatigue, an increase in temperature from 550 to 650 °C caused an increase in the crack growth rates. Another effect of temperature was that an increase in temperature led to an increased interaction of the crack with the microstructure. The crack growth mode changed from transgranular for 550 °C to mixed transgranular and intergranular for 650 °C, in the case of cyclic tests. A 15 minute dwell time caused the crack the grow in a mixed mode for both temperatures. In the case of dwell fatigue at 650 °C, it was noted from EBSD maps that the transgranular parts of the dwell crack followed he direction of growth of secondary dendrite arms. This implies that the combined effect of temperature and dwell time led to the environmental embrittlement of the intradendritic interfaces as well. The examination of fracture surfaces of the dwell fatigue specimens revealed that the crack shape was not semi-circular and had different shapes for both 550 °C and 650 °C. This implies that the assumption of a semi-circular crack growth front is invalid for the calculation of stress intensity factor. Due to this, the crack growth data was only used for qualitative comparison in this work. Another interesting aspect of the crack growth was that, at higher temperature and with the application of a dwell time, the interaction of the crack with secondary phases (such as d) increased. This implies that post weld heat treatment to generate grain boundary precipitates might offer a possibility to increase the crack growth resistance of the material.
This work provides an insight into how the environment influences the high temperature fatigue crack growth when a dwell time is applied in the case of a complex microstructure such as welds.

32
5.1.2 Measuring mechanical properties of oxide scales The second part of the work was focused on developing direct testing methods to measure the mechanical properties of thin and protective oxide films formed on superalloys. A microcantilever bending method was developed to measure the deformation and fracture of thin oxide films thermally grown on Allvac 718plus superalloy. A significant time was dedicated to the development of microcantilever geometry suitable for testing of very thin oxide films. A total of four types of cantilevers were proposed of which type 4 was chosen as the best for the purpose. Details on the different types of cantilevers and their merits and demerits has been explained in chapter 4. A Kleindiek micromanipulator setup placed in an SEM was used for the microcantilever bending experiments. The following results have been obtained based on the bending experiments conducted.
• Thermal exposure of Allvac 718plus specimens at 700 °C for 100 hours in a dry oxygen environmental resulted in a composite oxide with an average thickness of 200 nm. The top layer consisted of a spinel followed by a Cr2O3 layer with small amounts of internal Al2O3 extending into the base material.
• It is possible to test the deformation properties of thin oxides using a type 4 micro-
cantilever without the influence of substrate or residual stresses. Large displacement bending tests on the oxide layer confirmed the presence of room temperature plasticity. Due to the size of the scale, the probability of defects is less and therefore, permanent deformation without fracture is possible. Stiffness measurements from small displacement tests conducted before and after the main experiments confirm the absence of microcracks in the oxide layer.
• An analytical model was developed for the type 4 cantilever based on a combination of
standard cantilever models. The displacement formula enables the calculation of elastic modulus of the oxide, which was calculated as, Eeff=194–206 GPa. This value is close to the literature data for spinels.
It has been shown through this work that direct measurement of mechanical properties of thin films such as protective oxide layers are possible and also that plastic deformation is possible at small scale in otherwise brittle oxide scales. 5.2 Outlook The current work is aimed at understanding the deformation of oxides in superalloys. The initial part of the work provided an insight into how dwell time influences material degradation of superalloys at service temperatures. The method developed for testing of thin films has been shown to be effective in determining the fracture/deformation properties at small scales. Further examination is required in order to determine the behavior of the oxide scales under service conditions. This can be done through performing corresponding high temperature tests, which is possible with the use of the currently developed method. The future course that will be taken in the current work is mentioned below.
• Extension of the current results to high temperature through performing high temperature bending tests for oxide scales on Allvac 718plus. The service behavior of these protective oxide scales is of interest, as they have been shown to influence the thermo-mechanical fatigue life of superalloys.
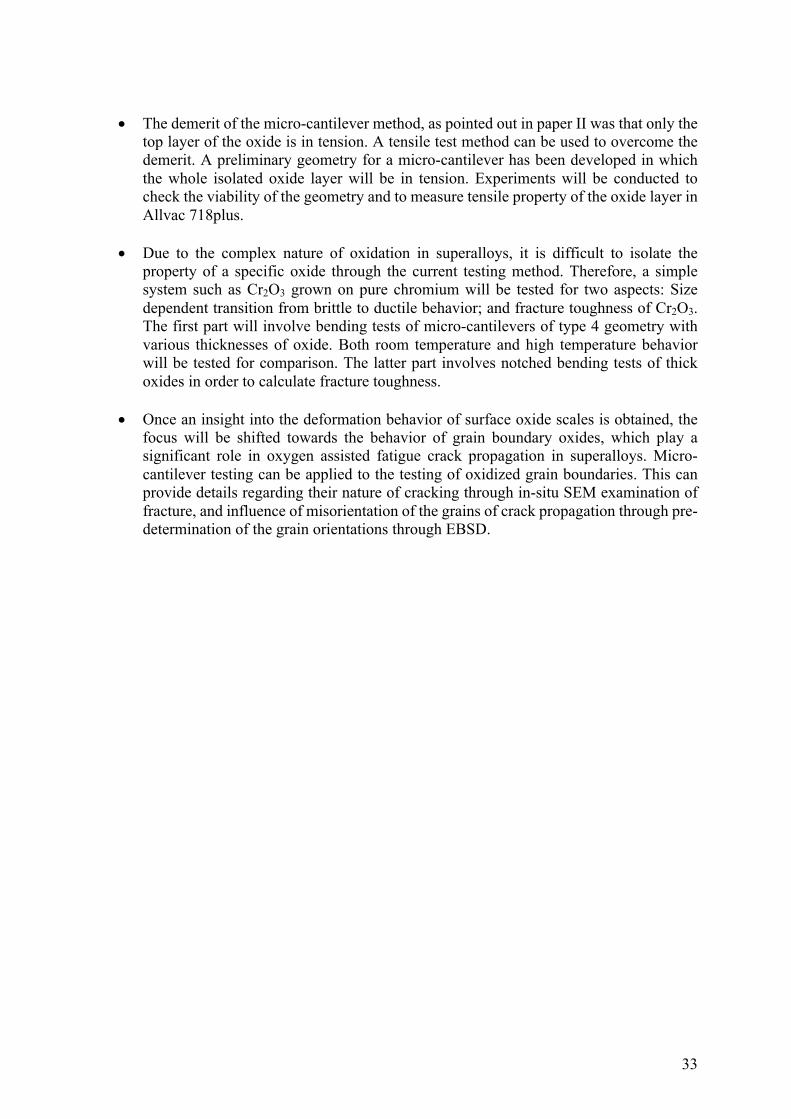
33
• The demerit of the micro-cantilever method, as pointed out in paper II was that only the
top layer of the oxide is in tension. A tensile test method can be used to overcome the demerit. A preliminary geometry for a micro-cantilever has been developed in which the whole isolated oxide layer will be in tension. Experiments will be conducted to check the viability of the geometry and to measure tensile property of the oxide layer in Allvac 718plus.
• Due to the complex nature of oxidation in superalloys, it is difficult to isolate the
property of a specific oxide through the current testing method. Therefore, a simple system such as Cr2O3 grown on pure chromium will be tested for two aspects: Size dependent transition from brittle to ductile behavior; and fracture toughness of Cr2O3. The first part will involve bending tests of micro-cantilevers of type 4 geometry with various thicknesses of oxide. Both room temperature and high temperature behavior will be tested for comparison. The latter part involves notched bending tests of thick oxides in order to calculate fracture toughness.
• Once an insight into the deformation behavior of surface oxide scales is obtained, the
focus will be shifted towards the behavior of grain boundary oxides, which play a significant role in oxygen assisted fatigue crack propagation in superalloys. Micro-cantilever testing can be applied to the testing of oxidized grain boundaries. This can provide details regarding their nature of cracking through in-situ SEM examination of fracture, and influence of misorientation of the grains of crack propagation through pre-determination of the grain orientations through EBSD.

34
35
Bibliography [1] B. Geddes, H. Leon, X. Huang, Superalloys : alloying and performance, ASM
International, 2010. [2] C.T. Sims, N.S. Stoloff, W.C. Hagel, Superalloys II, in: Superalloys II, Wiley, 1987: p.
615. doi:10.1080/10426919208947432. [3] J.A. Pfaendtner, C.J. McMahon Jr, Oxygen-induced intergranular cracking of a Ni-base
alloy at elevated temperatures—an example of dynamic embrittlement, Acta Mater. 49 (2001) 3369–3377. doi:10.1016/S1359-6454(01)00005-2.
[4] U. Krupp, C.J. McMahon Jr, Dynamic embrittlement–time-dependent brittle fracture, J.
Alloys Compd. 378 (2004) 79–84. doi:10.1016/j.jallcom.2003.10.074. [5] D. Gustafsson, J.J. Moverare, S. Johansson, K. Simonsson, M. Hörnqvist, T. Månsson,
S. Sjöström, Influence of high temperature hold times on the fatigue crack propagation in Inconel 718, Int. J. Fatigue. 33 (2011) 1461–1469. doi:10.1016/j.ijfatigue.2011.05.011.
[6] M. Hörnqvist, L. Viskari, K. Stiller, G. Sjöberg, Hold-time fatigue crack growth of
Allvac 718Plus, Superalloys 718 625 706 Var. Deriv. (2010) 705–717. [7] M. Hörnqvist, T. Månsson, D. Gustafsson, High temperature fatigue crack growth in
Alloy 718 – Effect of tensile hold times, Procedia Eng. 10 (2011) 147–152. doi:10.1016/j.proeng.2011.04.027.
[8] E. Andrieu, R. Molins, H. Ghonem, A. Pineau, Intergranular crack tip oxidation
mechanism in a nickel-based superalloy, Mater. Sci. Eng. A. 154 (1992) 21–28. [9] H. Ghonem, T. Nicholas, A. Pineau, Elevated Temperature Fatigue Crack Growth in
Alloy 718-Part II: Effects of Environmental and Material Variables, Fatigue Fract. Engng Mater. Struct. 16 (1993) 577–590.
[10] H.S. Kitaguchi, H.Y. Li, H.E. Evans, R.G. Ding, I.P. Jones, G. Baxter, P. Bowen,
Oxidation ahead of a crack tip in an advanced Ni-based superalloy, Acta Mater. 61 (2013) 1968–1981. doi:10.1016/j.actamat.2012.12.017.
[11] L. Viskari, M. Hörnqvist, K.L.L. Moore, Y. Cao, K. Stiller, Intergranular crack tip
oxidation in a Ni-base superalloy, Acta Mater. 61 (2013) 3630–3639. doi:10.1016/j.actamat.2013.02.050.
[12] K.S. Chan, A Grain Boundary Fracture Model for Predicting Dynamic Embrittlement
and Oxidation-Induced Cracking in Superalloys, Metall. Mater. Trans. A Phys. Metall. Mater. Sci. 46 (2015) 2491–2505. doi:10.1007/s11661-015-2860-1.
[13] M. Rudolphi, M. Schütze, Extracting oxide scale cracking data from acoustic emission
data using the example of oxidized cobalt, Mater. Corros. 68 (2017) 249–255. doi:10.1002/maco.201608924.

36
[14] S.R.J. Saunders, M.M. Nagl, M. Schütze, Measurement methods for the determination of fracture strain, Mater. High Temp. 12 (1994) 103–109. doi:10.1080/09603409.1994.11689475.
[15] J.R. Nicholls, C. Mendes, P. Hancock, Measurement methods to determine the elastic
properties of oxides at elevated temperatures, Mater. High Temp. 12 (1994) 85–94. doi:10.1080/09603409.1994.11689473.
[16] M. Schütze, W.J. Quadakkers, Future Directions in the Field of High-Temperature
Corrosion Research, Oxid. Met. 87 (2017) 681–704. doi:10.1007/s11085-017-9719-3. [17] N. Jaya B, V. Jayaram, S.K. Biswas, A new method for fracture toughness determination
of graded (Pt,Ni)Al bond coats by microbeam bend tests, Philos. Mag. 92 (2012) 3326–3345. doi:10.1080/14786435.2012.669068.
[18] D. Di Maio, S.G.G. Roberts, Measuring fracture toughness of coatings using focused-
ion-beam-machined microbeams, J. Mater. Res. 20 (2005) 299–302. doi:10.1557/JMR.2005.0048.
[19] A. Montagne, S. Pathak, X. Maeder, J. Michler, Plasticity and fracture of sapphire at
room temperature: Load-controlled microcompression of four different orientations, Ceram. Int. 40 (2014) 2083–2090. doi:10.1016/j.ceramint.2013.07.121.
[20] J. Dohr, D.E.J. Armstrong, E. Tarleton, T. Couvant, S. Lozano-Perez, The influence of
surface oxides on the mechanical response of oxidized grain boundaries, Thin Solid Films. 632 (2017) 17–22. doi:10.1016/j.tsf.2017.03.060.
[21] D. Kupka, N. Huber, E.T. Lilleodden, A combined experimental-numerical approach for
elasto-plastic fracture of individual grain boundaries, J. Mech. Phys. Solids. 64 (2014) 455-467. doi:10.1016/j.jmps.2013.12.004.
[22] H. Dugdale, D.E.J. Armstrong, E. Tarleton, S.G. Roberts, S. Lozano-Perez, How
oxidized grain boundaries fail, Acta Mater. 61 (2013) 4707-4713. doi:10.1016/j.actamat.2013.05.012.
[23] D.G. Leo Prakash, M.J. Walsh, D. Maclachlan, A.M. Korsunsky, Crack growth micro-
mechanisms in the IN718 alloy under the combined influence of fatigue, creep and oxidation, Int. J. Fatigue. 31 (2009) 1966–1977. doi:10.1016/j.ijfatigue.2009.01.023.
[24] F.V. Antunes, J.M. Ferreira, C.M. Branco, J. Byme, High temperature fatigue crack
growth in Inconel 718, Mater. High Temp. 17 (2000) 439–448. doi:10.1179/mht.2000.058.
[25] T. Weerasooriya, Effect of frequency on fatigue crack growth rate on Inconel 718 at high
temperatures, Tech. Report. Air Force Wright Aeronaut. Lab. Report, AFWAL-TR-87-4038, Wright-Patterson Air Force Base, OH. (1987).
[26] T. Nicholas, T. Weerasooriya, A model for creep/fatigue interactions in alloy 718, Fract.
Mech. ASTM STP 905. (1985) 167–180.

37
[27] R.H. Van Stone, D.C. Slavik, Prediction of time-dependent crack growth with retardation effects in nickel base alloys, ASTM STP 1389, Spec. Tech. Publ. (2000) 405–426.
[28] K.S. Chan, M.P. Enright, J. Moody, S.H.K. Fitch, A Microstructure-Based Time-
Dependent Crack Growth Model for Life and Reliability Prediction of Turbopropulsion Systems, Metall. Mater. Trans. A. 45 (2014) 287–301. doi:10.1007/s11661-013-1971-9.
[29] J.P.P. Pédron, A. Pineau, The effect of microstructure and environment on the crack
growth behaviour of Inconel 718 alloy at 650 °C under fatigue, creep and combined loading, Mater. Sci. Eng. 56 (1982) 143–156. doi:10.1016/0025-5416(82)90167-7.
[30] S. Floreen, R.H. Kane, Effects of environment on high-temperature fatigue crack growth
in a superalloy, Metall. Trans. A. 10 (1979) 1745–1751. doi:10.1007/BF02811710. [31] U. Krupp, W.M. Kane, X. Liu, O. Dueber, C. Laird, C.J. McMahon, The effect of grain-
boundary-engineering-type processing on oxygen-induced cracking of IN718, Mater. Sci. Eng. A. 349 (2003) 213–217. doi:10.1016/S0921-5093(02)00753-0.
[32] M. Clavel, A. Pineau, Frequency and wave-form effects on the fatigue crack growth
behavior of alloy 718 at 298 K and 823 K, Metall. Trans. A. 9 (1978) 471–480. doi:10.1007/BF02646402.
[33] H.. Smith, D.. Michel, Effect of Environment on Fatigue Crack Propagation Behavior of
Alloy 718 at elevated temperatures, Metall. Trans. A. 17A (1986) 370–374. doi:10.4028/www.scientific.net/AMR.1004-1005.142.
[34] M. Hörnqvist, L. Viskari, K.L. Moore, K. Stiller, High-temperature crack growth in a
Ni-base superalloy during sustained load, Mater. Sci. Eng. A. 609 (2014) 131–140. doi:10.1016/j.msea.2014.04.102.
[35] L. Viskari, S. Johansson, K. Stiller, Oxygen influenced intergranular crack propagation:
analysing microstructure and chemistry in the crack tip region, Mater. High Temp. 28 (2011) 336–341. doi:10.3184/096034011X13189599518971.
[36] U. Krupp, W. Kane, J.A. Pfaendtner, X. Liu, C. Laird, C.J. McMahon Jr., Oxygen-
induced intergranular fracture of the nickel-base alloy IN718 during mechanical loading at high temperatures, Mater. Res. 7 (2004) 35–41. doi:10.1590/S1516-14392004000100006.
[37] R. Molins, G. Hochstetter, J.C. Chassaigne, E. Andrieu, Oxidation effects on the fatigue
crack growth behaviour of alloy 718 at high temperature, Acta Mater. 45 (1997) 663–674. doi: 10.1016/S1359-6454(96)00192-9.
[38] H.S. Kitaguchi, M.P. Moody, H.Y. Li, H.E. Evans, M.C. Hardy, S. Lozano-Perez, An
atom probe tomography study of the oxide–metal interface of an oxide intrusion ahead of a crack in a polycrystalline Ni-based superalloy, Scr. Mater. 97 (2015) 41–44. doi:10.1016/j.scriptamat.2014.10.025.

38
[39] E. Andrieu, R. Cozar, A. Pineau, Effect of environment and microstructure on the high temperature behavior of Alloy 718, Superalloy 718 - Metall. Appl. Miner. Met. Mater. Soc. (1989) 241–256.
[40] C.T. Liu, C.L. White, Dynamic embrittlement of boron-doped Ni3Al alloys at 600°C,
Acta Metall. 35 (1987) 643–649. doi:10.1016/0001-6160(87)90187-8. [41] D. Bika, J.A. Pfaendtner, M. Menyhard, C.J. Mcmahon, Sulfur-induced dynamic
embrittlement in a low-alloy steel, Acta Metall. Mater. 43 (1995) 1895–1908. doi:10.1016/0956-7151(94)00388-X.
[42] C. McMahon Jr, Comments on “ Identification of SAGBO-induced damage zone ahead
of crack tip to characterize sustained loading crack growth in alloy 783 " 54 (2006) 305–307. doi:10.1016/j.scriptamat.2005.09.030.
[43] H.E. Evans, H.Y. Li, P. Bowen, A mechanism for stress-aided grain boundary oxidation
ahead of cracks, Scr. Mater. 69 (2013) 179-182. doi:10.1016/j.scriptamat.2013.03.026. [44] M. Schütze, Deformation and Cracking Behavior of Protective Oxide Scales on Heat-
Resistant Steels under Tensile Strain, Oxidation of metals 24 (1985) 199-232. [45] M. Schütze, 1.08 – Stress Effects in High Temperature Oxidation, in: Shreir’s Corros.,
2010: pp. 153–179. doi:10.1016/B978-044452787-5.00011-1. [46] M. Schütze, Plasticity of protective oxide scales, Mater. Sci. Technol. 6 (1990) 32–38.
doi:10.1179/mst.1990.6.1.32. [47] J.B. Wachtman Jr, L.. Maxwell, Plastic deformation of ceramic-oxide single crystals, J.
Am. Ceram. Soc. 37 (1954) 291–299. [48] R.M. Cannon, W.H. Rhodes, A.H. Heuer, Plastic Deformation of Fine-Grained Alumina
(Al2O3): I, Interface-Controlled Diffusional Creep, J. Am. Ceram. Soc. 63 (1980) 46–53. doi:10.1111/j.1151-2916.1980.tb10648.x.
[49] P. Hancock, J.R. Nicholls, Application of fracture mechanics to failure of surface oxide
scales, Mater. Sci. Technol. 4 (1988) 398–406. doi:10.1179/mst.1988.4.5.398. [50] J. Robertson, M.I. Manning, Limits to adherence of oxide scales, Mater. Sci. Technol. 6
(1990) 81–92. doi:10.1179/mst.1990.6.1.81. [51] M. Schütze, Stresses and decohesion of oxide scales, Mater. Sci. Technol. 4 (1988) 407–
414. doi:10.1179/mst.1988.4.5.407. [52] P. Hancock, J.R. Nicholls, Failure of oxide scales, Mater. High Temp. 12 (1994) 209–
218. doi:10.1080/09603409.1994.11689488. [53] M.M. Nagl, W.T. Evans, S.R.J. Saunders, D.J. Hall, Investigation of failure of brittle
layers under compressive stresses using acoustic emission, Mater. Sci. Technol. 8 (1992) 1043–1050. doi:10.1179/mst.1992.8.11.1043.

39
[54] P.F. Tortorelli, Mechanical properties of chromia scales, Le J. Phys. IV. 3 (1993) C9-943-C9-949. doi:10.1051/jp4:1993997.
[55] S. Korte-Kerzel, Microcompression of brittle and anisotropic crystals: recent advances
and current challenges in studying plasticity in hard materials, MRS Commun. 7 (2017) 109–120. doi:10.1557/mrc.2017.15.
[56] E. Camposilvan, O. Torrents, M. Anglada, Small-scale mechanical behavior of zirconia,
80 (2014) 239-249. doi:10.1016/j.actamat.2014.07.053. [57] M.D. Abad, S. Parker, D. Frazer, M.R. 27002. pdfel. de Figueiredo, A. Lupinacci, K.
Kikuchi, P. Hosemann, Evaluation of the Mechanical Properties of Naturally Grown Multilayered Oxides Formed on HCM12A Using Small Scale Mechanical Testing, Oxid. Met. 84 (2015) 211–231. doi:10.1007/s11085-015-9551-6.
[58] D.E.J. Armstrong, A.J. Wilkinson, S.G. Roberts, Micro-mechanical measurements of
fracture toughness of bismuth embrittled copper grain boundaries, Philos. Mag. Lett. 91 (2011) 394-400. doi:10.1080/09500839.2011.573813.
[59] A. Stratulat, S.G. Roberts, Micromechanical testing of oxidised grain boundaries in Ni
Alloy 600, MRS Proc. 1514 (2013) 119–124. doi:10.1557/opl.2013.140. [60] R. Bowman, Superalloys: A primer and history, (n.d.).
http://www.tms.org/Meetings/Specialty/Superalloys2000/SuperalloysHistory.html. [61] R.C. (Roger C. Reed, The superalloys : fundamentals and applications, Cambridge
University Press, 2006. [62] M.J. Donachie, S.J. Donachie, Superalloys : a technical guide, ASM International, 2002. [63] J.I. Goldstein, D.E. Newbury, P. Echlin, D.C. Joy, C.E. Lyman, E. Lifshin, L. Sawyer,
J.R. Michael, Scanning Electron Microscopy and X-ray Microanalysis, Springer US, Boston, MA, 2003. doi:10.1007/978-1-4615-0215-9.
[64] D.C. Joy, D.E. Newbury, D.L. Davidson, Electron channeling patterns in the scanning
electron microscope, J. Appl. Phys. 53 (1982) R81–R122. doi:10.1063/1.331668. [65] S. Zaefferer, N.N. Elhami, Theory and application of electron channelling contrast
imaging under controlled diffraction conditions, Acta Mater. 75 (2014) 20–50. doi:10.1016/j.actamat.2014.04.018.
[66] S. Suwas, R.K. Ray, Crystallographic Texture of Materials, Springer London, London,
2014. doi:10.1007/978-1-4471-6314-5. [67] C.A. Volkert, A.M. Minor, Focused Ion Beam Microscopy and Micromachining, MRS
Bull. 32 (2007) 389–399. [68] P. Sigmund, Theory of Sputtering. I. Sputtering Yield of Amorphous and Polycrystalline
Targets, Phys. Rev. 184 (1969) 383–416. doi:10.1103/PhysRev.184.383.

40
[69] J.F. Ziegler, M.D. Ziegler, J. Biersack, SRIM – The stopping and range of ions in matter (2010), Nucl. Instruments Methods Phys. Res. Sect. B Beam Interact. with Mater. Atoms. 268 (2010) 1818–1823. doi:10.1016/j.nimb.2010.02.091.
[70] W. Fang, J.A. Wickert, Determining mean and gradient residual stresses in thin films
using micromachined cantilevers, J. Micromechanics Microengineering. 6 (1996) 301–309. doi:10.1088/0960-1317/6/3/002.
[71] J.-Å. Schweitz, Mechanical Characterization of Thin Films by Micromechanical
Techniques, MRS Bull. 17 (1992) 34–45. doi:10.1557/S0883769400041646. [72] L.A. Giannuzzi, B.W. Kempshall, S.M. Schwarz, J.K. Lomness, B.I. Prenitzer, F.A.
Stevie, FIB Lift-Out Specimen Preparation Techniques, in: L.A. Giannuzzi, F.A. Stevie (Eds.), Introd. to Focus. Ion Beams Instrumentation, Theory, Tech. Pract., Springer US, Boston, MA, 2005: pp. 201–228. doi:10.1007/0-387-23313-X_10.