oxidation-reduction processes in ground water at naval ... · oxidation-reduction processes in...
TRANSCRIPT
DistrictCover.fm Page 1 Thursday, October 9, 2003 4:46 PM
In cooperation with the Southern Division Naval Facilities
Engineering Command
Oxidation-Reduction Processes in Ground
Water at Naval Weapons Industrial
Reserve Plant, Dallas, Texas
Water-Resources Investigations Report 03–4046
U.S. Department of the Interior
U.S. Geological Survey
U.S. Department of the Interior U.S. Geological Survey
Oxidation-Reduction Processes in Ground Water at Naval Weapons Industrial Reserve Plant, Dallas, Texas
By S.A. Jones, Christopher L. Braun, and Roger W. Lee
U.S. GEOLOGICAL SURVEY Water-Resources Investigations Report 03–4046
In cooperation with the Southern Division Naval Facilities Engineering Command
Austin, Texas 2003
U.S. DEPARTMENT OF THE INTERIOR
Gale A. Norton, Secretary
U.S. GEOLOGICAL SURVEY
Charles G. Groat, Director
Any use of trade, product, or firm names is for descriptive purposes only and does not imply endorsement by the U.S. Government.
For additional information write to
District Chief U.S. Geological Survey 8027 Exchange Dr. Austin, TX 78754–4733 E-mail: [email protected]
Copies of this report can be purchased from
U.S. Geological Survey Branch of Information Services Box 25286 Denver, CO 80225–0286 E-mail: [email protected]
ii

CONTENTS
Abstract ................................................................................................................................................................................ 1Introduction .......................................................................................................................................................................... 1
Purpose and Scope .................................................................................................................................................... 1Description of Study Area ........................................................................................................................................ 2Hydrogeology ........................................................................................................................................................... 2
Sampling and Analytical Methods and Results ................................................................................................................... 2Volatile Organic Compounds .................................................................................................................................... 2Dissolved Oxygen ..................................................................................................................................................... 6Nitrate and Nitrite ..................................................................................................................................................... 6Ferrous Iron and Total Iron ....................................................................................................................................... 6Sulfate and Sulfide .................................................................................................................................................... 6Dissolved Hydrogen ................................................................................................................................................. 6Total Organic Carbon ............................................................................................................................................... 7
Oxidation-Reduction Processes ........................................................................................................................................... 7Volatile Organic Compounds .................................................................................................................................... 8Dissolved Oxygen ..................................................................................................................................................... 8Nitrate and Nitrite ..................................................................................................................................................... 8Ferrous Iron and Total Iron ....................................................................................................................................... 14Sulfate and Sulfide .................................................................................................................................................... 14Dissolved Hydrogen ................................................................................................................................................. 14Total Organic Carbon ............................................................................................................................................... 14Screening Results ..................................................................................................................................................... 14
Summary .............................................................................................................................................................................. 22References Cited .................................................................................................................................................................. 22Appendix—Data .................................................................................................................................................................. 31
FIGURES
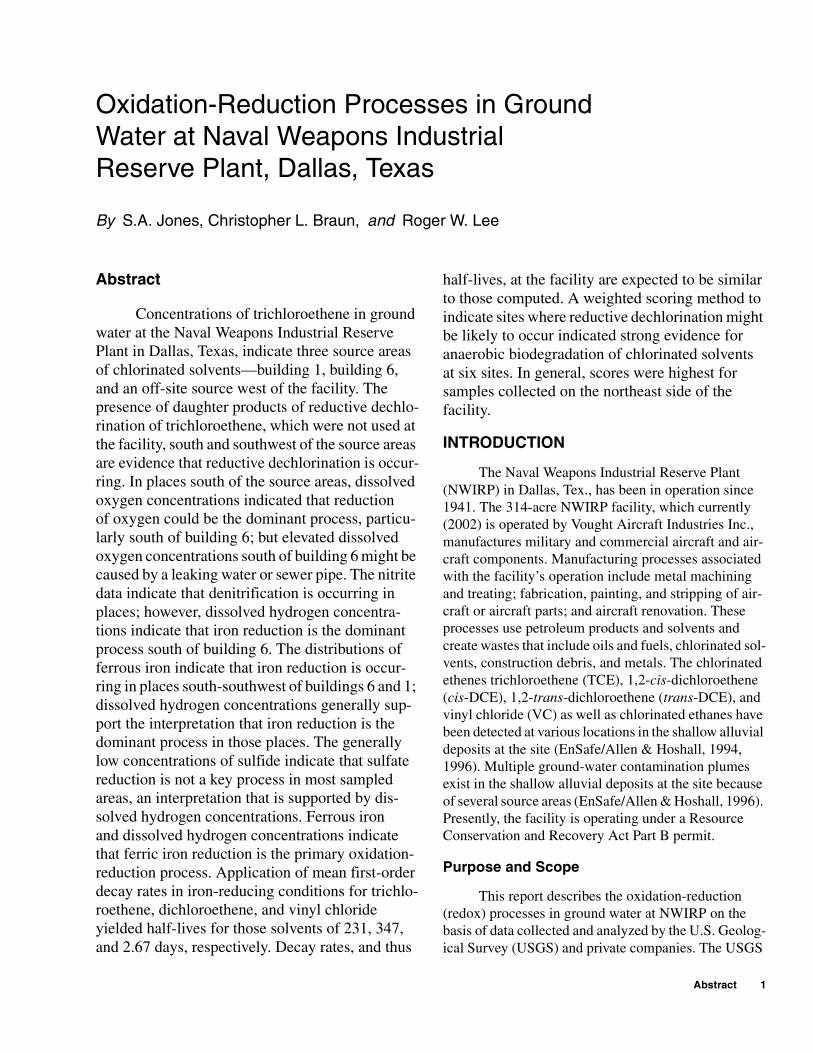
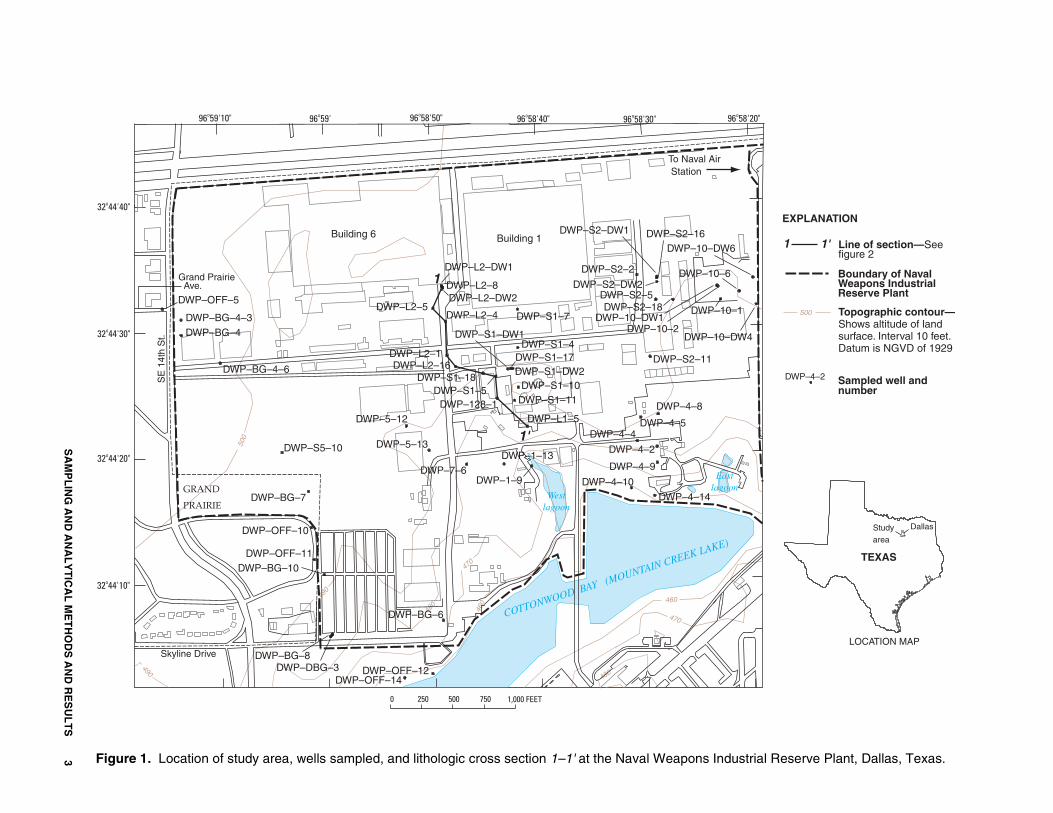
1. Map showing location of study area, wells sampled, and lithologic cross section 1–1' at the NavalWeapons Industrial Reserve Plant, Dallas, Texas ................................................................................................. 3
2. Lithologic section 1–1' at the Naval Weapons Industrial Reserve Plant, Dallas, Texas ....................................... 43. Map showing water-level altitudes in shallow alluvial deposits at the Naval Weapons Industrial Reserve
Plant, Dallas, Texas, March 1998 ......................................................................................................................... 54. Graph showing dissolved hydrogen concentrations associated with oxidation-reduction processes in
ground water ......................................................................................................................................................... 75–16. Maps showing:
5. Trichloroethene concentrations from wells screened in the upper or in the upper and middle parts of the shallow alluvial deposits at the Naval Weapons Industrial Reserve Plant, Dallas, Texas,September 1997 ......................................................................................................................................... 9
6. cis-1,2-Dichloroethene concentrations from wells screened in the upper or in the upper and middleparts of the shallow alluvial deposits at the Naval Weapons Industrial Reserve Plant, Dallas, Texas,September 1997 ......................................................................................................................................... 10
7. Vinyl chloride concentrations from wells screened in the upper or in the upper and middle partsof the shallow alluvial deposits at the Naval Weapons Industrial Reserve Plant, Dallas, Texas,September 1997 ......................................................................................................................................... 11
8. Dissolved oxygen concentrations from wells screened in the upper or in the upper and middle parts of the shallow alluvial deposits at the Naval Weapons Industrial Reserve Plant, Dallas, Texas, September 1997 .............................................................................................................................. 12
CONTENTS iii
9. Dissolved oxygen concentrations from wells screened in the upper or in the upper and middle parts of the shallow alluvial deposits at the Naval Weapons Industrial Reserve Plant, Dallas, Texas, March 1998 ..................................................................................................................................... 13
10. Nitrite concentrations from wells screened in the upper or in the upper and middle parts of the shallow alluvial deposits at the Naval Weapons Industrial Reserve Plant, Dallas, Texas, September 1997 .......................................................................................................................................... 15
11. Ferrous iron concentrations from wells screened in the upper or in the upper and middle parts of the shallow alluvial deposits at the Naval Weapons Industrial Reserve Plant, Dallas, Texas, September 1997 .......................................................................................................................................... 16
12. Ferrous iron concentrations from wells screened in the upper or in the upper and middle parts of the shallow alluvial deposits at the Naval Weapons Industrial Reserve Plant, Dallas, Texas, March 1998 ............................................................................................................................................................ 17
13. Sulfide concentrations from wells screened in the upper or in the upper and middle parts of the shallow alluvial deposits at the Naval Weapons Industrial Reserve Plant, Dallas, Texas, September 1997 .......................................................................................................................................... 18
14. Sulfide concentrations from wells screened in the upper or in the upper and middle parts of the shallow alluvial deposits at the Naval Weapons Industrial Reserve Plant, Dallas, Texas, March 1998 ................................................................................................................................................ 19
15. Dissolved hydrogen concentrations from wells screened in the upper or in the upper and middle parts of the shallow alluvial deposits and indicated oxidation-reduction processes at the Naval Weapons Industrial Reserve Plant, Dallas, Texas, September 1997 .......................................................... 20
16. Dissolved hydrogen concentrations from wells screened in the upper or in the upper and middle parts of the shallow alluvial deposits and indicated oxidation-reduction processes at the Naval Weapons Industrial Reserve Plant, Dallas, Texas, March 1998 ................................................................. 21
TABLES
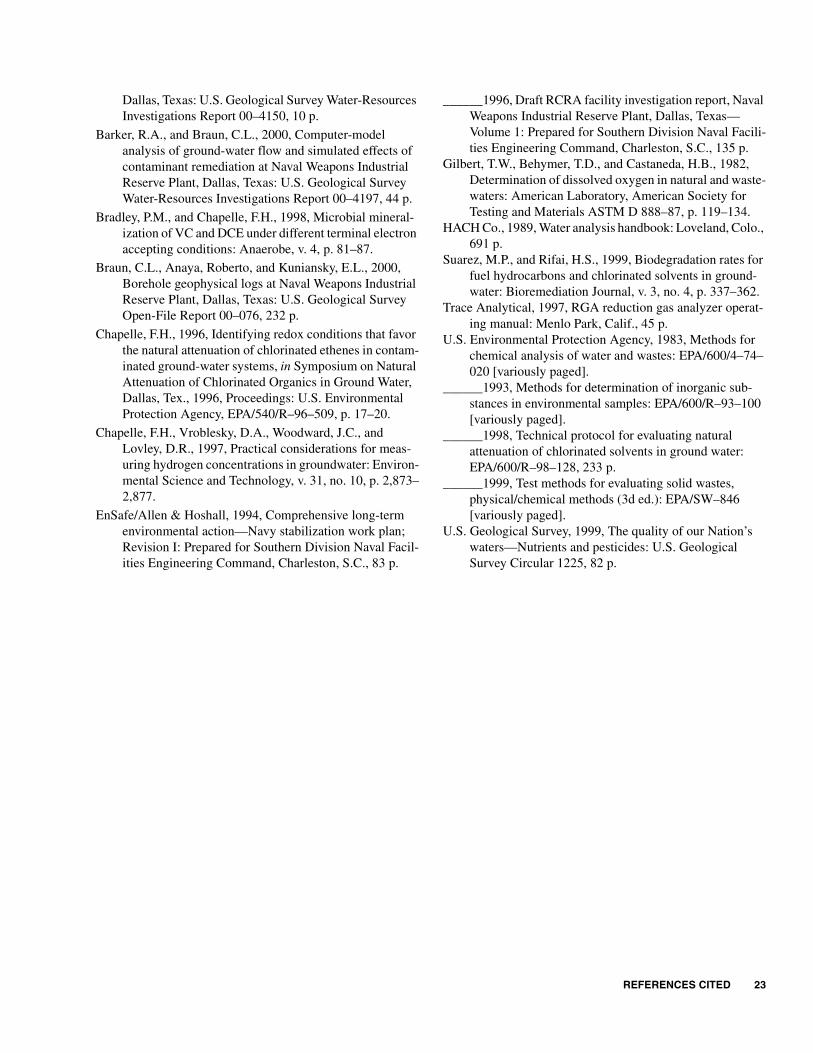
1. Well information and sampling dates for wells sampled at the Naval Weapons Industrial Reserve Plant, Dallas, Texas ......................................................................................................................................................... 24
2. Selected constituents, methods, and procedures used to evaluate oxidation-reduction processes in ground water at the Naval Weapons Industrial Reserve Plant, Dallas, Texas ....................................................... 25
3. Chemical results for selected volatile organic compounds from wells sampled at the Naval Weapons Industrial Reserve Plant, Dallas, Texas ................................................................................................................. 26
4. Selected field and laboratory data from wells sampled at the Naval Weapons Industrial Reserve Plant, Dallas, Texas ......................................................................................................................................................... 28
5. Mean first-order decay rates and computed half-lives for trichloroethene, dichloroethene, and vinyl chloride under five oxidation-reduction conditions .............................................................................................. 30
ABBREVIATIONS AND VERTICAL DATUM
°C, degree Celsius µg/L, microgram per literft, foot mg/L, milligram per literft/ft, foot per foot mL, milliliterft/mi, foot per mile mL/min, milliliter per minutegal/min, gallon per minute nm, nanometerin., inch nM, nanomolar
Vertical coordinate information is referenced to the National Geodetic Vertical Datum of 1929 (NGVD of 1929).
iv
Oxidation-Reduction Processes in Ground Water at Naval Weapons Industrial Reserve Plant, Dallas, Texas
By S.A. Jones, Christopher L. Braun, and Roger W. Lee
Abstract
Concentrations of trichloroethene in ground water at the Naval Weapons Industrial Reserve Plant in Dallas, Texas, indicate three source areas of chlorinated solvents—building 1, building 6, and an off-site source west of the facility. The presence of daughter products of reductive dechlorination of trichloroethene, which were not used at the facility, south and southwest of the source areas are evidence that reductive dechlorination is occurring. In places south of the source areas, dissolved oxygen concentrations indicated that reduction of oxygen could be the dominant process, particularly south of building 6; but elevated dissolved oxygen concentrations south of building 6 might be caused by a leaking water or sewer pipe. The nitrite data indicate that denitrification is occurring in places; however, dissolved hydrogen concentrations indicate that iron reduction is the dominant process south of building 6. The distributions of ferrous iron indicate that iron reduction is occurring in places south-southwest of buildings 6 and 1; dissolved hydrogen concentrations generally support the interpretation that iron reduction is the dominant process in those places. The generally low concentrations of sulfide indicate that sulfate reduction is not a key process in most sampled areas, an interpretation that is supported by dissolved hydrogen concentrations. Ferrous iron and dissolved hydrogen concentrations indicate that ferric iron reduction is the primary oxidation-reduction process. Application of mean first-order decay rates in iron-reducing conditions for trichloroethene, dichloroethene, and vinyl chloride yielded half-lives for those solvents of 231, 347, and 2.67 days, respectively. Decay rates, and thus
half-lives, at the facility are expected to be similar to those computed. A weighted scoring method to indicate sites where reductive dechlorination might be likely to occur indicated strong evidence for anaerobic biodegradation of chlorinated solvents at six sites. In general, scores were highest for samples collected on the northeast side of the facility.
INTRODUCTION
The Naval Weapons Industrial Reserve Plant (NWIRP) in Dallas, Tex., has been in operation since 1941. The 314-acre NWIRP facility, which currently (2002) is operated by Vought Aircraft Industries Inc., manufactures military and commercial aircraft and aircraft components. Manufacturing processes associated with the facility’s operation include metal machining and treating; fabrication, painting, and stripping of aircraft or aircraft parts; and aircraft renovation. These processes use petroleum products and solvents and create wastes that include oils and fuels, chlorinated solvents, construction debris, and metals. The chlorinated ethenes trichloroethene (TCE), 1,2-cis-dichloroethene (cis-DCE), 1,2-trans-dichloroethene (trans-DCE), and vinyl chloride (VC) as well as chlorinated ethanes have been detected at various locations in the shallow alluvial deposits at the site (EnSafe/Allen & Hoshall, 1994, 1996). Multiple ground-water contamination plumes exist in the shallow alluvial deposits at the site because of several source areas (EnSafe/Allen & Hoshall, 1996). Presently, the facility is operating under a Resource Conservation and Recovery Act Part B permit.
Purpose and Scope
This report describes the oxidation-reduction (redox) processes in ground water at NWIRP on the basis of data collected and analyzed by the U.S. Geological Survey (USGS) and private companies. The USGS
Abstract 1
collected ground-water samples from 51 wells in September 1997 and from 57 wells in March 1998 (table 1, at end of report). The USGS analyzed the September 1997 samples in the field for specific conductance, pH, temperature, dissolved oxygen (DO), ferrous iron, total iron, sulfide, carbon dioxide, methane, and hydrogen; the March 1998 samples were analyzed in the field for specific conductance, pH, temperature, bicarbonate alkalinity, and selected volatile organic compounds (VOCs). The USGS sent September 1997 samples to Quanterra Laboratories for analysis of bicarbonate alkalinity; sulfate; chloride; fluoride; silica; nitrate, nitrate plus nitrite, and ammonia nitrogen; orthophosphate phosphorus; boron; and total organic carbon (TOC). EnSafe/Allen & Hoshall (hereinafter, EnSafe), a consultant to the Navy, collected groundwater samples from about 150 wells and had them analyzed by a contract laboratory for selected VOCs and metals in September 1997.
Description of Study Area
The study area is in the southwestern corner of the city of Dallas (fig. 1). NWIRP is located north of Cottonwood Bay, which is a part of Mountain Creek Lake. The climate in north-central Texas is characterized by long, hot summers and short, mild winters. The average annual precipitation in north-central Texas is 32 in., with most of the precipitation occurring during spring and fall. Land-surface altitudes at NWIRP range from about 500 to 460 ft above sea level west to east and north to south (fig. 1). Stormwater runoff drains into a manmade channel of Mountain Creek Lake locally referred to as Cottonwood Bay.
Hydrogeology
NWIRP is located on shallow alluvial deposits about 40 to 80 ft above the present-day flood plain of the West Fork Trinity River. The alluvial deposits range from about 10 to 75 ft thick and overlie the Cretaceous-age Eagle Ford Shale (EnSafe/Allen & Hoshall, 1994). A previous study used borehole geophysical logging and cone penetrometer data to map the relative permeability of the shallow alluvial deposits at the NWIRP site (Anaya and others, 2000; Braun and others, 2000). In that study, the shallow alluvial deposits were divided into upper, middle, and lower parts of roughly equal thickness. A series of intersecting sections was developed (Anaya and others, 2000, pls. 1–3), which indicates that the shallow alluvial deposits occur
as lenticular, interfingering beds of sand, silt, and clay atop the shale bedrock. The relative permeability of the beds is gradational and depends on the amounts of sand (most permeable), silt, and clay (least permeable) present (fig. 2). The shallow alluvial deposits have been replaced by permeable fill material in places.
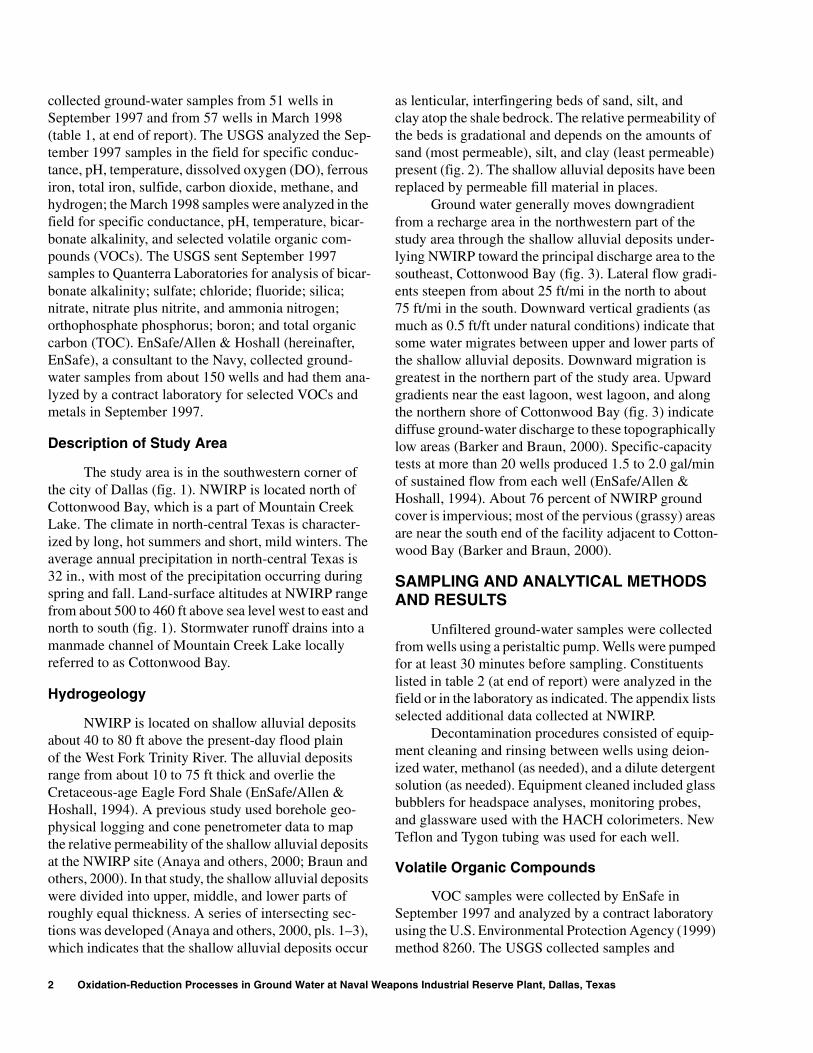
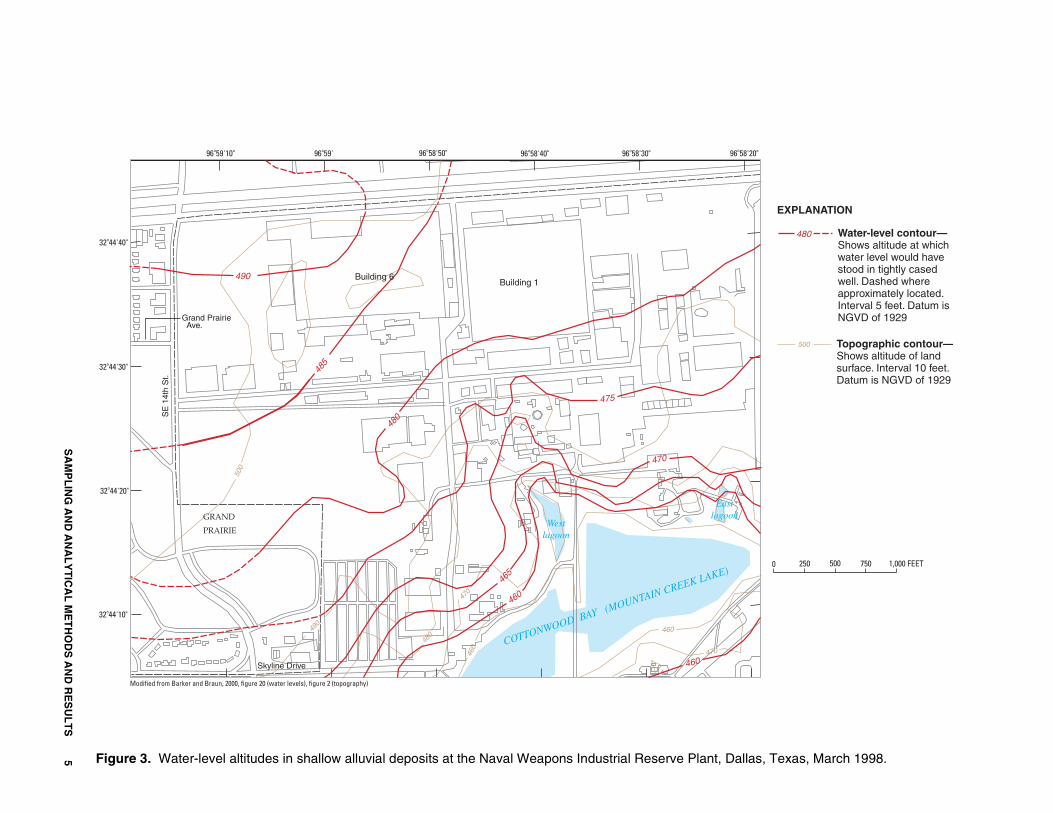
Ground water generally moves downgradient from a recharge area in the northwestern part of the study area through the shallow alluvial deposits underlying NWIRP toward the principal discharge area to the southeast, Cottonwood Bay (fig. 3). Lateral flow gradients steepen from about 25 ft/mi in the north to about 75 ft/mi in the south. Downward vertical gradients (as much as 0.5 ft/ft under natural conditions) indicate that some water migrates between upper and lower parts of the shallow alluvial deposits. Downward migration is greatest in the northern part of the study area. Upward gradients near the east lagoon, west lagoon, and along the northern shore of Cottonwood Bay (fig. 3) indicate diffuse ground-water discharge to these topographically low areas (Barker and Braun, 2000). Specific-capacity tests at more than 20 wells produced 1.5 to 2.0 gal/min of sustained flow from each well (EnSafe/Allen & Hoshall, 1994). About 76 percent of NWIRP ground cover is impervious; most of the pervious (grassy) areas are near the south end of the facility adjacent to Cottonwood Bay (Barker and Braun, 2000).
SAMPLING AND ANALYTICAL METHODS AND RESULTS
Unfiltered ground-water samples were collected from wells using a peristaltic pump. Wells were pumped for at least 30 minutes before sampling. Constituents listed in table 2 (at end of report) were analyzed in the field or in the laboratory as indicated. The appendix lists selected additional data collected at NWIRP.
Decontamination procedures consisted of equipment cleaning and rinsing between wells using deionized water, methanol (as needed), and a dilute detergent solution (as needed). Equipment cleaned included glass bubblers for headspace analyses, monitoring probes, and glassware used with the HACH colorimeters. New Teflon and Tygon tubing was used for each well.
Volatile Organic Compounds
VOC samples were collected by EnSafe in September 1997 and analyzed by a contract laboratory using the U.S. Environmental Protection Agency (1999) method 8260. The USGS collected samples and
Oxidation-Reduction Processes in Ground Water at Naval Weapons Industrial Reserve Plant, Dallas, Texas 2
490
460
480 460
470
500
470
490 480
COTTONWOOD BAY (MOUNTAIN CREEK LAKE)
DWP–BG–6
96o59'10" 96o59' 96o58'50" 96o58'40" 96o58'30" 96o58'20"
To Naval Air Station
32o44'40" EXPLANATION
Building 6 Building 1 DWP–S2–DW1 DWP–S2–16
1 1' Line of section—SeeDWP–10–DW6 figure 2 DWP–L2–DW1 DWP–S2–2 DWP–10–6 Boundary of NavalGrand Prairie
Weapons IndustrialReserve Plant
1 DWP–L2–8 DWP–S2–DW2 Ave. DWP–L2–DW2 DWP–S2–5
DWP–L2–5 DWP–OFF–5
DWP–S2–18 500 Topographic contour— DWP–BG–4–3 DWP–L2–4 DWP–S1–7 DWP–10–DW1
DWP–10–1 Shows altitude of land DWP–10–2 DWP–BG–4 32o44'30" DWP–S1–DW1 surface. Interval 10 feet. DWP–10–DW4
SE
14t
h S
t.
DWP–S1–4 Datum is NGVD of 1929
Sampled well andnumber
DWP–L2–1 DWP–S1–17 DWP–S2–11 DWP–L2–16 DWP–BG–4–6 DWP–S1–DW2 DWP–4–2 DWP–S1–18
DWP–S1–10 DWP–S1–5 DWP–128–1 DWP–S1–11
DWP–4–8 DWP–5–12 DWP–L1–5 DWP–4–5
1' DWP–4–4 DWP–S5–10 DWP–5–13 DWP–4–2
DWP–1–13 32o44'20" DWP–4–9 DWP–7–6
DWP–1–9 DWP–4–10 East
lagoon GRANDWest DWP–4–14
PRAIRIE DWP–BG–7
lagoon
Study DallasDWP–OFF–10 area
TEXASDWP–OFF–11 DWP–BG–10
32o44'10"
LOCATION MAP Skyline Drive DWP–BG–8
SA
MP
LIN
G A
ND
AN
AL
YT
ICA
L M
ET
HO
DS
AN
D R
ES
UL
TS
DWP–DBG–3 DWP–OFF–12 DWP–OFF–14
0 250 500 750 1,000 FEET
Figure 1. Location of study area, wells sampled, and lithologic cross section 1–1' at the Naval Weapons Industrial Reserve Plant, Dallas, Texas. 3

P–L1-
5
1 1' EXPLANATION
High Fill
PE
RM
EA
BIL
ITY Silty sand
Oxid
ation
-Red
uctio
n P
rocesses in
Gro
un
d W
ater at Naval W
eapo
ns In
du
strial Reserve P
lant, D
allas, Texas
510
480
DWP–L
2–DW
1
DWP–L
2–5
DWP–L
2–1
DWP–L
2–16
DWP–L
1–5
DWP–S
1–5
DWP–S
1–18DW
P–L2–
4
DWP–L
2–DW
2
DWP–L
2–8
DWP-1
28-1
Upper
Middle 470
Lower
460
Fine silty sand and sandy to silty clay
500 Sandy to silty clay
ShaleLow 490
Parts of the shallow alluvial aquifer
ALT
ITU
DE
, IN
FE
ET
AB
OV
E N
GV
D O
F 1
929
Well identification number
450
DW Land surface
440
430
420 Screened interval Bottom of borehole
410
400 Location of section shown in figure 1 0 200 400 FEET Note: Distance between closely-spaced wells
not to scaleVERTICAL SCALE GREATLY EXAGGERATED
Figure 2. Lithologic section 1–1' at the Naval Weapons Industrial Reserve Plant, Dallas, Texas (modified from Anaya and others, 2000; Braun and others, 2000).
4
460 48
0 460
470
500
470
485
480
475
470
COTTONWOOD BAY (MOUNTAIN CREEK LAKE)
490
460
460
465
96o59'10" 96o59' 96o58'50" 96o58'40" 96o58'30" 96o58'20"
EXPLANATION
480 Water-level contour— 32o44'40" Shows altitude at which
water level would have stood in tightly cased
490 Building 6 Building 1 well. Dashed where
approximately located. Interval 5 feet. Datum is
Grand Prairie NGVD of 1929 Ave.
500 Topographic contour—
32o44'30" Shows altitude of land surface. Interval 10 feet. Datum is NGVD of 1929
SE
14t
h S
t.
32o44'20"
East lagoon GRAND
West lagoon PRAIRIE
0 250 500 750 1,000 FEET
32o44'10"
Skyline Drive
SA
MP
LIN
G A
ND
AN
AL
YT
ICA
L M
ET
HO
DS
AN
D R
ES
UL
TS
Modified from Barker and Braun, 2000, figure 20 (water levels), figure 2 (topography)
Figure 3. Water-level altitudes in shallow alluvial deposits at the Naval Weapons Industrial Reserve Plant, Dallas, Texas, March 1998. 5
analyzed them with a field gas chromatograph (GC) in March 1998. The field GC results are considered semi-quantitative but compare relatively well with the laboratory data. Samples analyzed in the field were collected in a 40-mL vial. At each well, 20 mL of sample was collected in the vial. The vial was placed in a water bath and brought to 30 °C, the vial was shaken vigorously, and a quantity of headspace was removed with a gas-tight syringe and injected into a Photovac 10S50 GC calibrated for TCE, cis-DCE, trans-DCE, and VC. Results of both laboratory and field GC analyses are listed in table 3 (at end of report).
Dissolved Oxygen
The concentration of DO was measured in the field using the indigo carmine method (Gilbert and others, 1982). Ground water was pumped through Teflon tubing (having a low oxygen-diffusion coefficient) into a sampling cell. An ampoule was placed into the overflowing sample cell, and the tip was broken to draw a fixed size of sample into the ampoule. The tip was covered to ensure against atmospheric contamination of the sample. The ampoule was inverted carefully several times to mix the color-developing reagents with the sample and allowed to react for 2 minutes. The ampoule then was placed in a CHEMetrics VVR photometer, and the DO concentration was recorded. The method detection limit for DO was 0.05 mg/L. Results of DO analyses are listed in table 4 (at end of report).
Nitrate and Nitrite
Nitrate as nitrogen and nitrate plus nitrite as nitrogen samples were collected by the USGS in September 1997 and analyzed by Quanterra Laboratories using methods 300.0 and 353.2 (U.S. Environmental Protection Agency, 1993 and 1983, respectively). Nitrite concentrations are listed in table 4. Nitrate and nitrate plus nitrite concentrations are listed in the appendix.
Ferrous Iron and Total Iron
The concentration of ferrous iron was measured using the HACH phenanthroline powder pillow method (255), and the concentration of total iron was measured using the HACH FerroVer colorimetric method (265) (HACH Co., 1989). For ferrous and total iron, 25 mL of ground water was poured into each of four colorimetric vials. The ferrous and total iron reagents, respectively,
were then added to the first and second sample vials; the vials were filled with sample and allowed to react for 3 minutes. The third and fourth sample vials (the blanks) were placed in a DR2000 spectrophotometer, and the zero concentration was set at a 510-nm wavelength. The blank vials were removed, and each ground-watersample vial was placed in the spectrophotometer; after 3 minutes, concentrations of ferrous and total iron, in milligrams per liter, were recorded. The lower and upper method detection limits for ferrous and total iron using the methods and instrumentation listed above were 0.01 and 3 mg/L, respectively. If a sample concentration was greater than 3 mg/L, a 50-percent dilution of the sample with deionized (DI) water was used, and the sample was re-analyzed. Several of the ferrous iron samples collected in September 1997 became cloudy during color development, causing incorrect readings on the spectrophotometer. The concentrations reported for cloudy ferrous samples in table 4 are qualified.
Sulfate and Sulfide
Sulfate samples were collected by the USGS in September 1997 and analyzed by Quanterra Laboratories (appendix). The concentration of sulfide was measured using the HACH methylene blue colorimetric method (690) (HACH Co., 1989). For sulfide a 25 mL sample of ground water was collected into a sample cell, and a second sample cell was filled with DI water. One mL of sulfide reagent 1 was added to each sample cell and swirled to mix. After mixing, 1 mL of sulfide reagent 2 was immediately added to each vial and swirled to mix. The methylene blue color was allowed to develop for 5 minutes. After 5 minutes, the blank sample was placed into the DR2000 spectrophotometer, and the zero concentration was set at a 665-nm wavelength. The blank sample cell was removed, the sample cell containing the ground-water sample was placed in the colorimeter, and the concentration of sulfide, in milligrams per liter, was recorded. The lower and upper method detection limits for sulfide using the method and instrumentation listed above were 0.001 and 0.6 mg/L, respectively. Sulfide concentrations are listed in table 4.
Dissolved Hydrogen
The concentration of dissolved hydrogen was measured using the “bubble strip” method (Chapelle, 1996) in which ground water was pumped through a glass bubbler fitted with a septum. Once flow was
Oxidation-Reduction Processes in Ground Water at Naval Weapons Industrial Reserve Plant, Dallas, Texas 6
established at about 500 mL/min and the bubbler was filled and free of gas bubbles, 20 mL of hydrogen-free helium was injected. The induced headspace was allowed to equilibrate with the flowing ground water for about 30 minutes. After 30 minutes, 10 mL of the head-space gas was withdrawn using a 10-mL gas-tight syringe with valve; after 5 minutes, a second 10-mL sample of the headspace gas was withdrawn into a second syringe. Both samples were analyzed for hydrogen using a reducing gas detector chromatograph (Trace Analytical, 1997) calibrated with standard gases. Dissolved hydrogen concentrations listed in table 4 are an average of the two measurements.
Total Organic Carbon
TOC samples were collected by the USGS in September 1997 and analyzed by Quanterra Laboratories using method 9060 (U.S. Environmental Protection Agency, 1999). TOC concentrations are listed in the appendix.
OXIDATION-REDUCTION PROCESSES
The most common redox processes in ground water are the reduction of oxygen, nitrate (denitrification), ferric iron, sulfate, and carbon dioxide (methanogenesis). The reduced chemical species produced during redox reactions are used in biological processes that facilitate reductive dechlorination of chlorinated solvents. The efficiency of the reductive dechlorination process varies depending on redox conditions. Dechlo
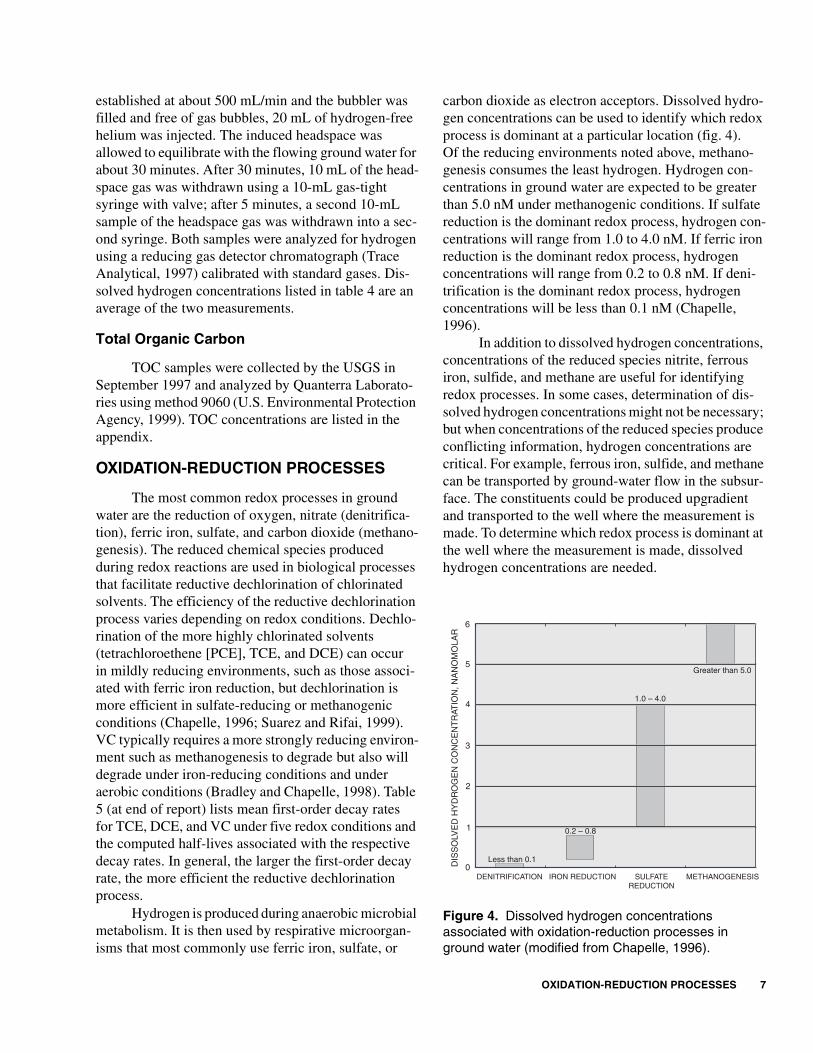
carbon dioxide as electron acceptors. Dissolved hydrogen concentrations can be used to identify which redox process is dominant at a particular location (fig. 4). Of the reducing environments noted above, methanogenesis consumes the least hydrogen. Hydrogen concentrations in ground water are expected to be greater than 5.0 nM under methanogenic conditions. If sulfate reduction is the dominant redox process, hydrogen concentrations will range from 1.0 to 4.0 nM. If ferric iron reduction is the dominant redox process, hydrogen concentrations will range from 0.2 to 0.8 nM. If denitrification is the dominant redox process, hydrogen concentrations will be less than 0.1 nM (Chapelle, 1996).
In addition to dissolved hydrogen concentrations, concentrations of the reduced species nitrite, ferrous iron, sulfide, and methane are useful for identifying redox processes. In some cases, determination of dissolved hydrogen concentrations might not be necessary; but when concentrations of the reduced species produce conflicting information, hydrogen concentrations are critical. For example, ferrous iron, sulfide, and methane can be transported by ground-water flow in the subsurface. The constituents could be produced upgradient and transported to the well where the measurement is made. To determine which redox process is dominant at the well where the measurement is made, dissolved hydrogen concentrations are needed.
6
rination of the more highly chlorinated solvents (tetrachloroethene [PCE], TCE, and DCE) can occur in mildly reducing environments, such as those associated with ferric iron reduction, but dechlorination is more efficient in sulfate-reducing or methanogenic conditions (Chapelle, 1996; Suarez and Rifai, 1999). VC typically requires a more strongly reducing environment such as methanogenesis to degrade but also will degrade under iron-reducing conditions and under aerobic conditions (Bradley and Chapelle, 1998). Table 5 (at end of report) lists mean first-order decay rates for TCE, DCE, and VC under five redox conditions and the computed half-lives associated with the respective decay rates. In general, the larger the first-order decay D
ISS
OLV
ED
HY
DR
OG
EN
CO
NC
EN
TR
ATIO
N, N
AN
OM
OLA
R
5
4
3
2
1
0
1.0 – 4.0
Greater than 5.0
Less than 0.1
0.2 – 0.8
rate, the more efficient the reductive dechlorination DENITRIFICATION IRON REDUCTION SULFATE METHANOGENESIS REDUCTION
process. Hydrogen is produced during anaerobic microbial Figure 4. Dissolved hydrogen concentrations
metabolism. It is then used by respirative microorgan- associated with oxidation-reduction processes in isms that most commonly use ferric iron, sulfate, or ground water (modified from Chapelle, 1996).
OXIDATION-REDUCTION PROCESSES 7
Volatile Organic Compounds
The concentrations of chlorinated solvents at NWIRP are controlled partially by reductive dechlorination, which in turn is controlled by redox processes in ground water. Under anaerobic conditions, reductive dechlorination of TCE proceeds as follows:
TCE => cis-DCE + Cl => VC + 2Cl => ethene + 3Cl. (1)
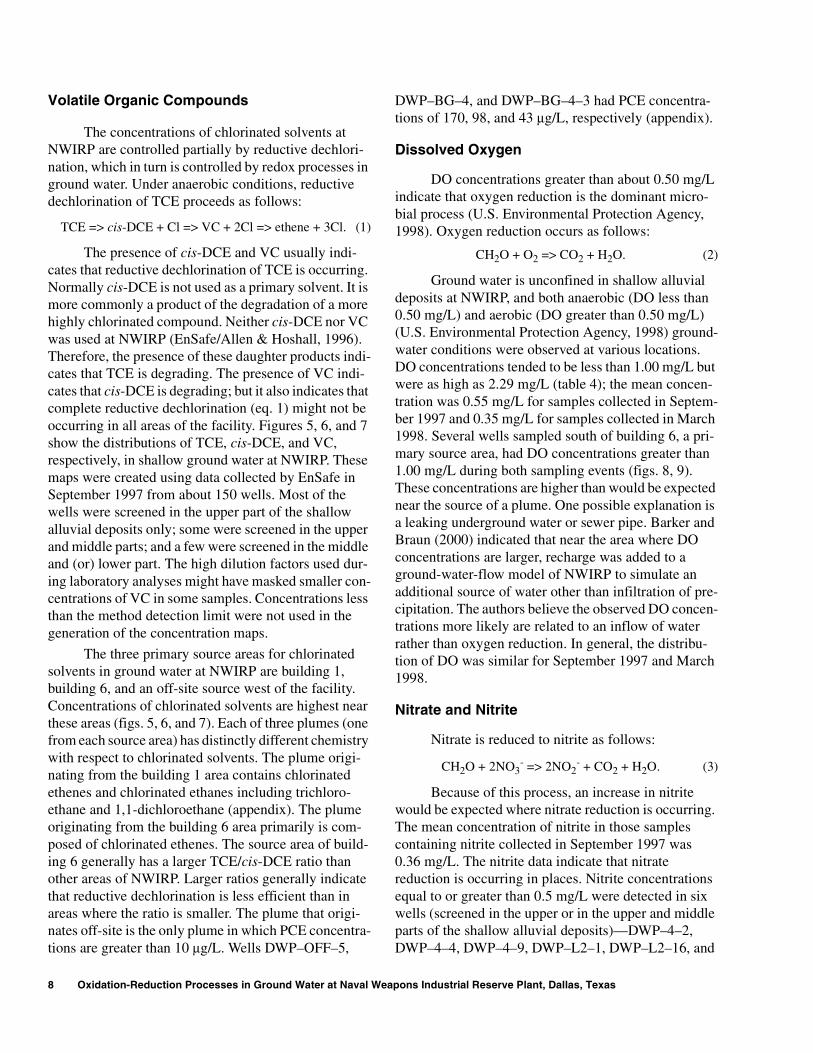
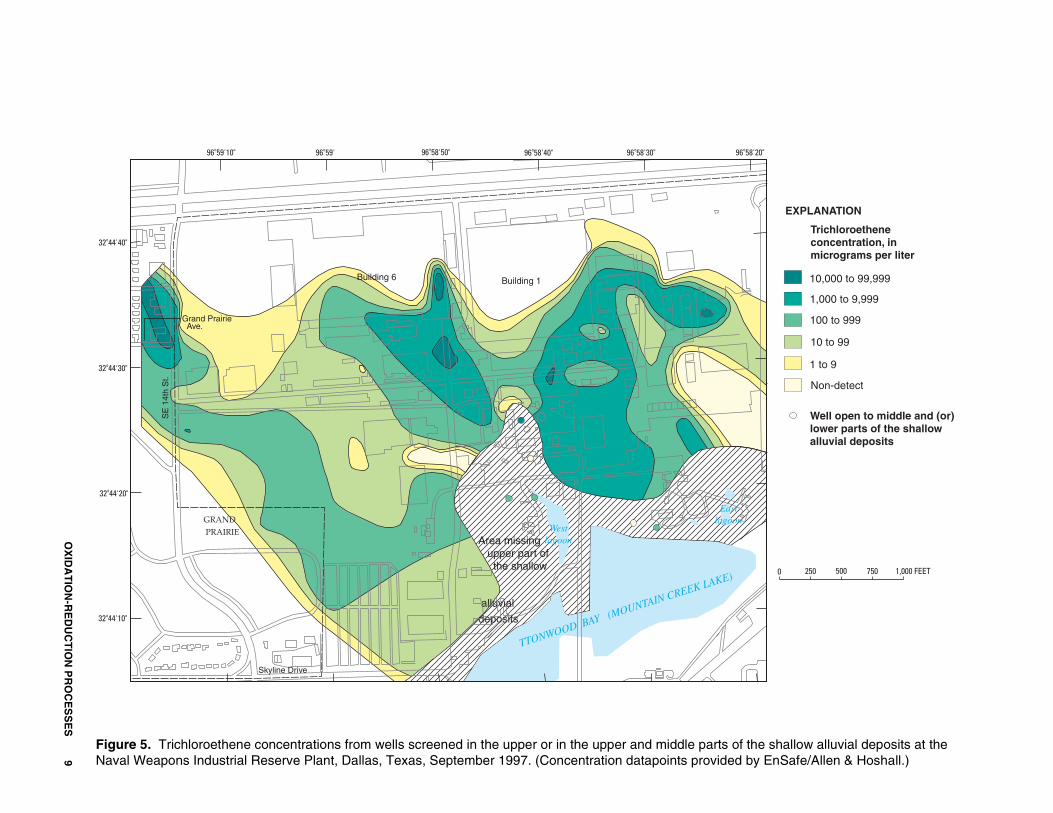
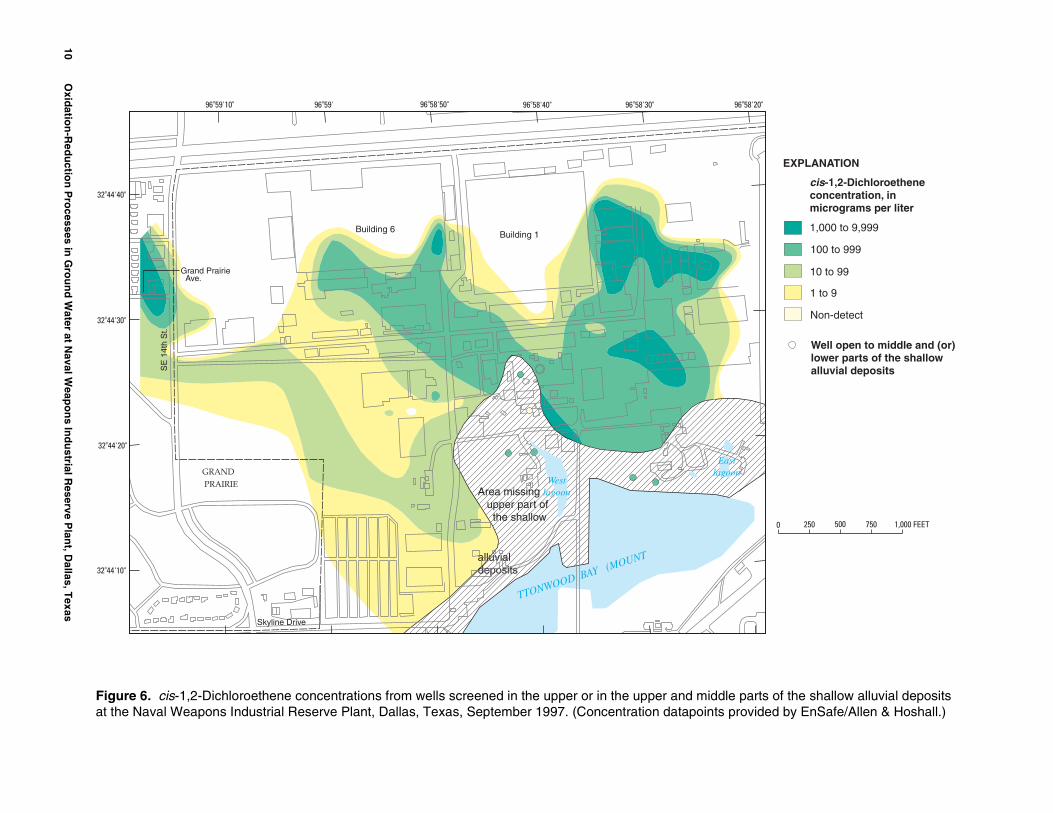
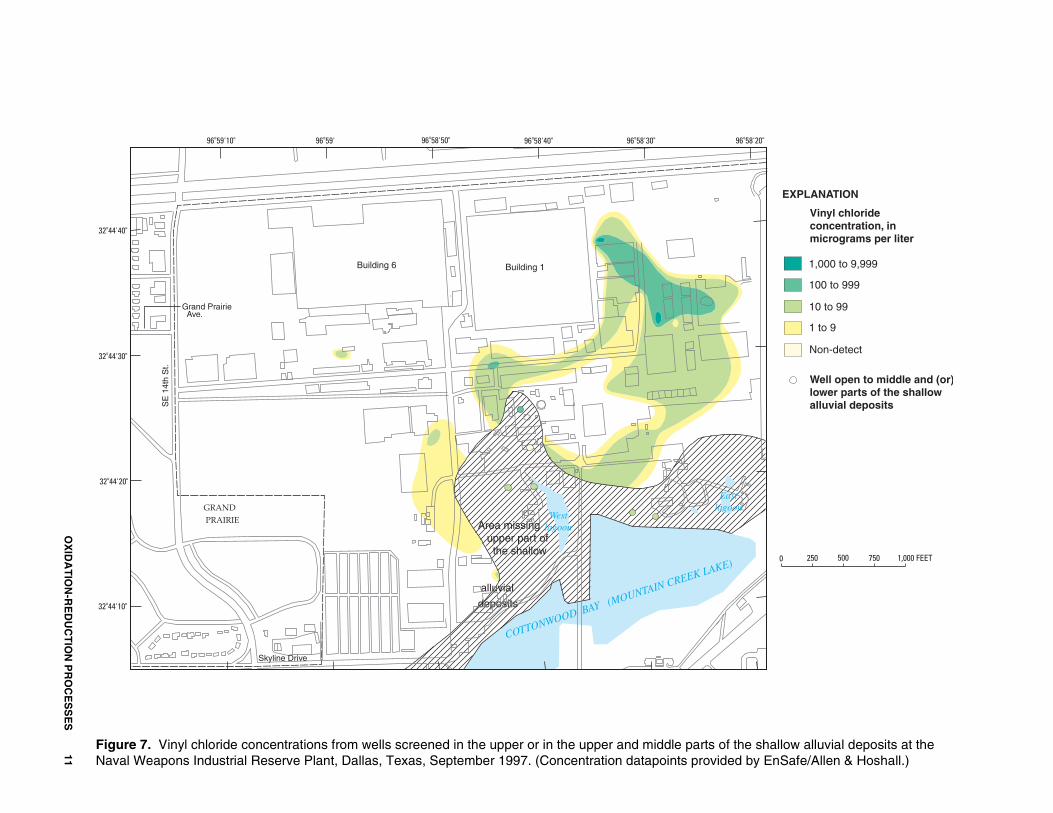
The presence of cis-DCE and VC usually indicates that reductive dechlorination of TCE is occurring. Normally cis-DCE is not used as a primary solvent. It is more commonly a product of the degradation of a more highly chlorinated compound. Neither cis-DCE nor VC was used at NWIRP (EnSafe/Allen & Hoshall, 1996). Therefore, the presence of these daughter products indicates that TCE is degrading. The presence of VC indicates that cis-DCE is degrading; but it also indicates that complete reductive dechlorination (eq. 1) might not be occurring in all areas of the facility. Figures 5, 6, and 7 show the distributions of TCE, cis-DCE, and VC, respectively, in shallow ground water at NWIRP. These maps were created using data collected by EnSafe in September 1997 from about 150 wells. Most of the wells were screened in the upper part of the shallow alluvial deposits only; some were screened in the upper and middle parts; and a few were screened in the middle and (or) lower part. The high dilution factors used during laboratory analyses might have masked smaller concentrations of VC in some samples. Concentrations less than the method detection limit were not used in the generation of the concentration maps.
The three primary source areas for chlorinated solvents in ground water at NWIRP are building 1, building 6, and an off-site source west of the facility. Concentrations of chlorinated solvents are highest near these areas (figs. 5, 6, and 7). Each of three plumes (one from each source area) has distinctly different chemistry with respect to chlorinated solvents. The plume originating from the building 1 area contains chlorinated ethenes and chlorinated ethanes including trichloroethane and 1,1-dichloroethane (appendix). The plume originating from the building 6 area primarily is composed of chlorinated ethenes. The source area of building 6 generally has a larger TCE/cis-DCE ratio than other areas of NWIRP. Larger ratios generally indicate that reductive dechlorination is less efficient than in areas where the ratio is smaller. The plume that originates off-site is the only plume in which PCE concentrations are greater than 10 µg/L. Wells DWP–OFF–5,
DWP–BG–4, and DWP–BG–4–3 had PCE concentrations of 170, 98, and 43 µg/L, respectively (appendix).
Dissolved Oxygen
DO concentrations greater than about 0.50 mg/L indicate that oxygen reduction is the dominant microbial process (U.S. Environmental Protection Agency, 1998). Oxygen reduction occurs as follows:
CH2O + O2 => CO2 + H2O. (2)
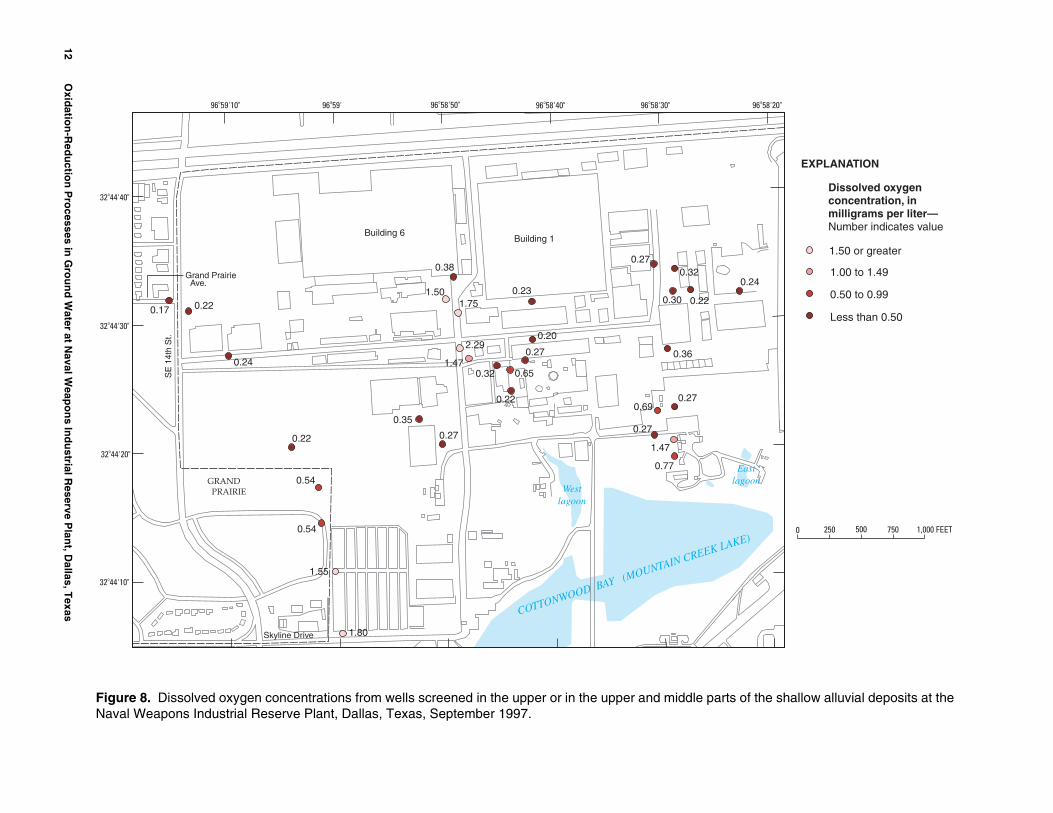
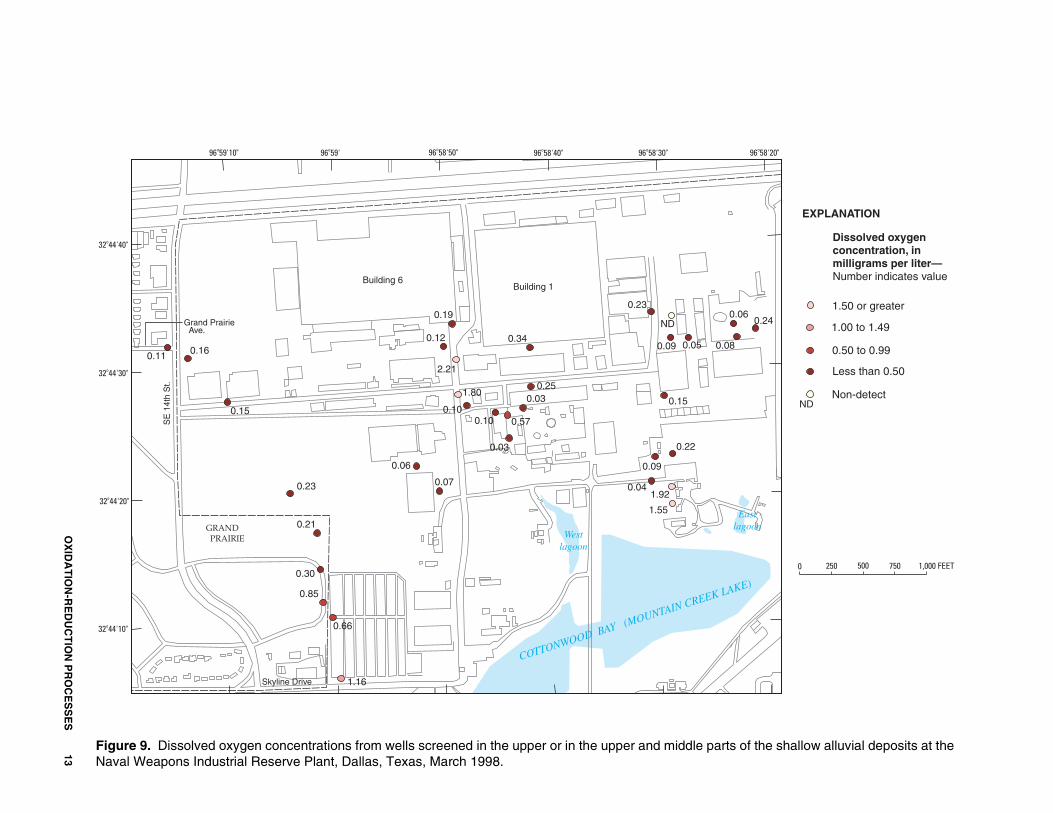
Ground water is unconfined in shallow alluvial deposits at NWIRP, and both anaerobic (DO less than 0.50 mg/L) and aerobic (DO greater than 0.50 mg/L) (U.S. Environmental Protection Agency, 1998) groundwater conditions were observed at various locations. DO concentrations tended to be less than 1.00 mg/L but were as high as 2.29 mg/L (table 4); the mean concentration was 0.55 mg/L for samples collected in September 1997 and 0.35 mg/L for samples collected in March 1998. Several wells sampled south of building 6, a primary source area, had DO concentrations greater than 1.00 mg/L during both sampling events (figs. 8, 9). These concentrations are higher than would be expected near the source of a plume. One possible explanation is a leaking underground water or sewer pipe. Barker and Braun (2000) indicated that near the area where DO concentrations are larger, recharge was added to a ground-water-flow model of NWIRP to simulate an additional source of water other than infiltration of precipitation. The authors believe the observed DO concentrations more likely are related to an inflow of water rather than oxygen reduction. In general, the distribution of DO was similar for September 1997 and March 1998.
Nitrate and Nitrite
Nitrate is reduced to nitrite as follows:
CH2O + 2NO3- => 2NO2
- + CO2 + H2O. (3)
Because of this process, an increase in nitrite would be expected where nitrate reduction is occurring. The mean concentration of nitrite in those samples containing nitrite collected in September 1997 was 0.36 mg/L. The nitrite data indicate that nitrate reduction is occurring in places. Nitrite concentrations equal to or greater than 0.5 mg/L were detected in six wells (screened in the upper or in the upper and middle parts of the shallow alluvial deposits)—DWP–4–2, DWP–4–4, DWP–4–9, DWP–L2–1, DWP–L2–16, and
Oxidation-Reduction Processes in Ground Water at Naval Weapons Industrial Reserve Plant, Dallas, Texas 8
CO
alluvial
deposits
TTONWAY (MOUNTAIN CREEK LAKE)
BOOD
96o59'10" 96o59' 96o58'50" 96o58'40" 96o58'30" 96o58'20"
EXPLANATION
Trichloroethene 32o44'40" concentration, in
micrograms per liter
Building 6 10,000 to 99,999Building 1
1,000 to 9,999
Grand Prairie 100 to 999 Ave.
10 to 99
1 to 932o44'30"
SE
14t
h S
t.
Non-detect
Well open to middle and (or) lower parts of the shallow alluvial deposits
32o44'20"
East GRAND lagoon
West Area missing lagoon upper part of the shallow
PRAIRIE
32o44'10"
Skyline Drive
0 250 500 750 1,000 FEET
OX
IDA
TIO
N-R
ED
UC
TIO
N P
RO
CE
SS
ES
Figure 5. Trichloroethene concentrations from wells screened in the upper or in the upper and middle parts of the shallow alluvial deposits at the Naval Weapons Industrial Reserve Plant, Dallas, Texas, September 1997. (Concentration datapoints provided by EnSafe/Allen & Hoshall.) 9
CO
AIN CREEK LAKE)
alluvial deposits
TTONWAY (MOUNT
BOOD
10 O
xidatio
n-R
edu
ction
Pro
cesses in G
rou
nd
Water at N
aval Weap
on
s Ind
ustrial R
eserve Plan
t, Dallas, T
exas
96o59'10" 96o59' 96o58'50" 96o58'40" 96o58'30" 96o58'20"
EXPLANATION
cis-1,2-Dichloroethene 32o44'40" concentration, in
micrograms per liter
1,000 to 9,999
100 to 999
Grand Prairie
Building 6 Building 1
10 to 99 Ave.
1 to 9
Non-detect32o44'30"
SE
14t
h S
t.
Well open to middle and (or) lower parts of the shallow alluvial deposits
32o44'20"
East GRAND lagoon
West Area missing lagoon upper part of the shallow
PRAIRIE
32o44'10"
Skyline Drive
0 250 500 750 1,000 FEET
Figure 6. cis-1,2-Dichloroethene concentrations from wells screened in the upper or in the upper and middle parts of the shallow alluvial deposits at the Naval Weapons Industrial Reserve Plant, Dallas, Texas, September 1997. (Concentration datapoints provided by EnSafe/Allen & Hoshall.)
COTTONWOOD BAY (MOUNTAIN CREEK LAKE)
alluvial
deposits
96o59'10" 96o59' 96o58'50" 96o58'40" 96o58'30" 96o58'20"
EXPLANATION
Vinyl chloride concentration, in 32o44'40" micrograms per liter
1,000 to 9,999
100 to 999
Building 6 Building 1
Grand Prairie 10 to 99 Ave.
1 to 9
Non-detect32o44'30"
SE
14t
h S
t.
Well open to middle and (or) lower parts of the shallow alluvial deposits
32o44'20"
East GRAND lagoon
West Area missing lagoon upper part of the shallow
PRAIRIE
32o44'10"
Skyline Drive
0 250 500 750 1,000 FEET
OX
IDA
TIO
N-R
ED
UC
TIO
N P
RO
CE
SS
ES
Figure 7. Vinyl chloride concentrations from wells screened in the upper or in the upper and middle parts of the shallow alluvial deposits at the Naval Weapons Industrial Reserve Plant, Dallas, Texas, September 1997. (Concentration datapoints provided by EnSafe/Allen & Hoshall.)
11
12 Oxid
ation
-Red
uctio
n P
rocesses in
Gro
un
d W
ater at Naval W
eapo
ns In
du
strial Reserve P
lant, D
allas, Texas
Building 6Building 1
GRAND PRAIRIE
SE
14t
h S
t.
Grand Prairie Ave.
Skyline Drive
0 250 500 750 1,000 FEET
EXPLANATION
1.50 or greater
1.00 to 1.49
0.50 to 0.99
Less than 0.50
Dissolved oxygenconcentration, inmilligrams per liter—Number indicates value
0.17 0.22
0.24
0.22
0.54
0.54
1.55
1.80
0.35
0.27
0.38
1.501.75
0.23
2.29
1.47
0.20
0.27
0.32 0.65
0.22
0.270.32
0.30 0.22
0.24
0.36
0.270.69
0.27
1.47
0.77
96o58'20"96o58'30"96o58'40"96o58'50"96o59'96o59'10"
32o44'40"
32o44'30"
32o44'20"
32o44'10"
COTTONWOOD BAY (MOUNTAIN CREEK LAKE)
Westlagoon
Eastlagoon
Figure 8. Dissolved oxygen concentrations from wells screened in the upper or in the upper and middle parts of the shallow alluvial deposits at the Naval Weapons Industrial Reserve Plant, Dallas, Texas, September 1997.
OX
IDA
TIO
N-R
ED
UC
TIO
N P
RO
CE
SS
ES
13
Figure 9. Dissolved oxygen concentrations from wells screened in the upper or in the upper and middle parts of the shallow alluvial deposits at the Naval Weapons Industrial Reserve Plant, Dallas, Texas, March 1998.
1.50 or greater
1.00 to 1.49
0.50 to 0.99
Less than 0.50
Non-detect
EXPLANATION
Dissolved oxygenconcentration, inmilligrams per liter—Number indicates value
ND
Building 6Building 1
GRAND PRAIRIE
SE
14t
h S
t.
Grand Prairie Ave.
Skyline Drive
0.11 0.16
0.15
0.23
0.21
0.30
0.06
0.85
1.16
0.19
0.12
2.21
0.34
1.80
0.100.10
0.250.03
0.57
0.03
0.23
ND
0.09 0.05
0.060.24
0.08
0.15
0.22
1.55
0.09
0.041.92
0.66
0.07
0 250 500 750 1,000 FEET
96o58'20"96o58'30"96o58'40"96o58'50"96o59'96o59'10"
32o44'40"
32o44'30"
32o44'20"
32o44'10"
COTTONWOOD BAY (MOUNTAIN CREEK LAKE)
Westlagoon
Eastlagoon
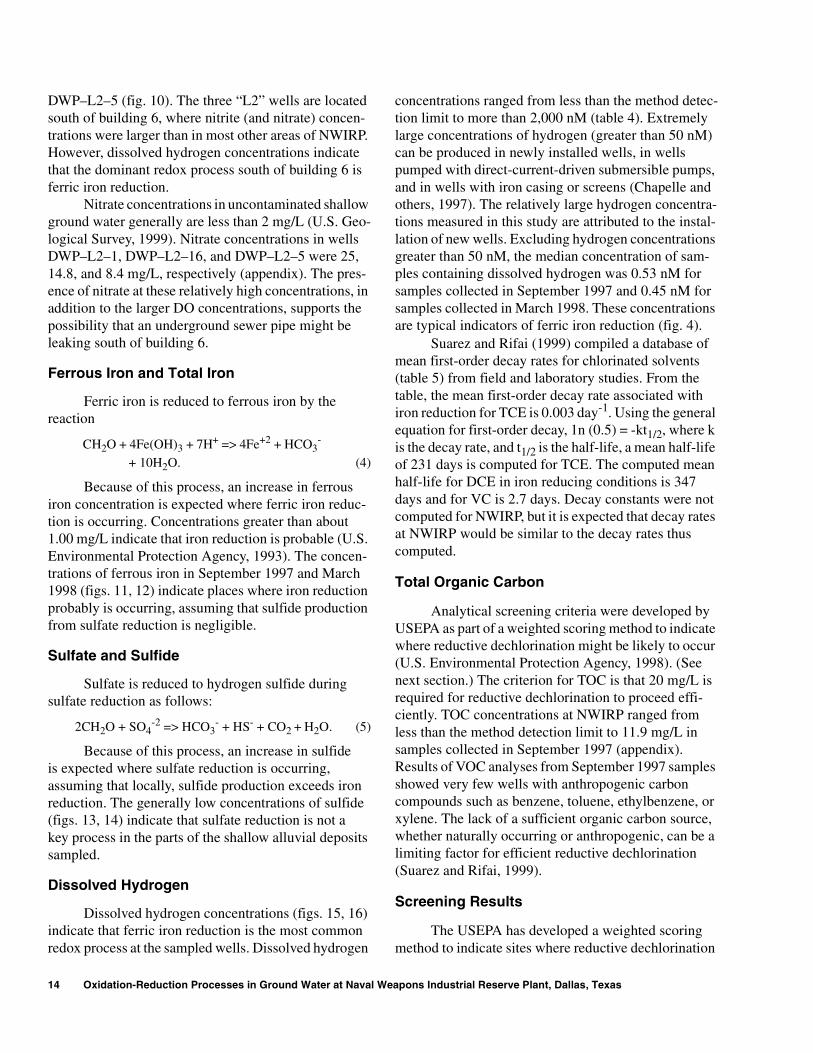
DWP–L2–5 (fig. 10). The three “L2” wells are located south of building 6, where nitrite (and nitrate) concentrations were larger than in most other areas of NWIRP. However, dissolved hydrogen concentrations indicate that the dominant redox process south of building 6 is ferric iron reduction.
Nitrate concentrations in uncontaminated shallow ground water generally are less than 2 mg/L (U.S. Geological Survey, 1999). Nitrate concentrations in wells DWP–L2–1, DWP–L2–16, and DWP–L2–5 were 25, 14.8, and 8.4 mg/L, respectively (appendix). The presence of nitrate at these relatively high concentrations, in addition to the larger DO concentrations, supports the possibility that an underground sewer pipe might be leaking south of building 6.
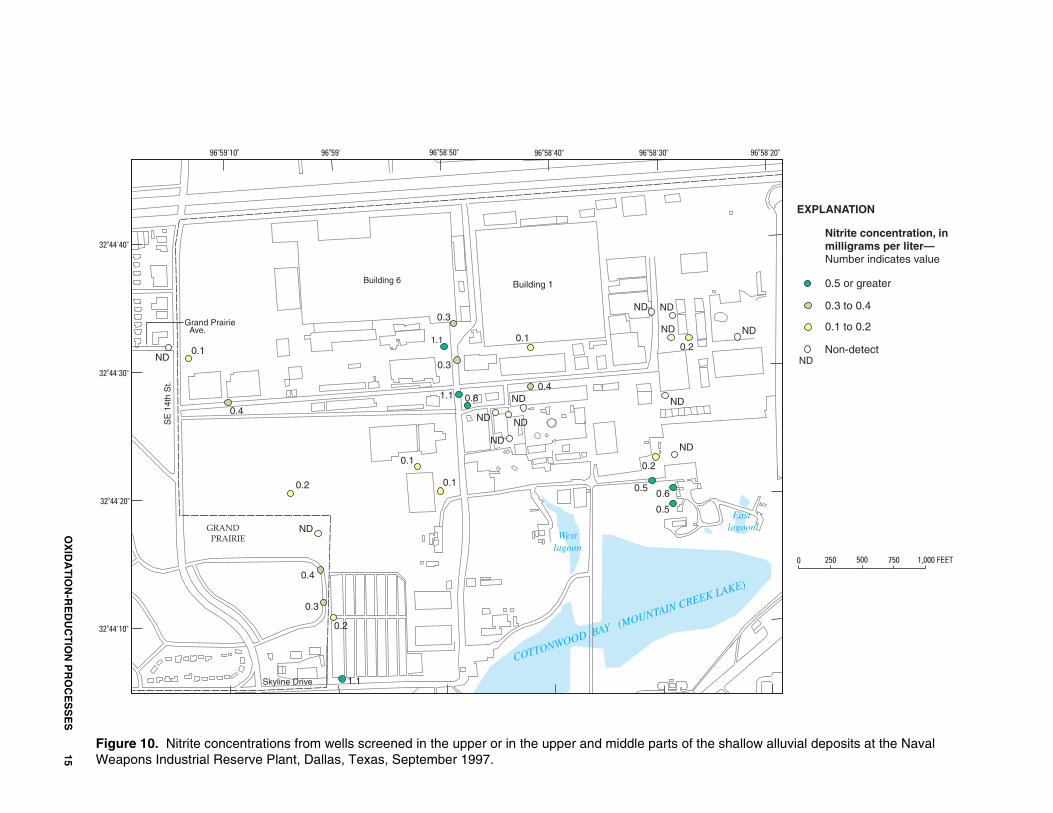
Ferrous Iron and Total Iron
Ferric iron is reduced to ferrous iron by the reaction
-CH2O + 4Fe(OH)3 + 7H+ => 4Fe+2 + HCO3
+ 10H2O. (4)
Because of this process, an increase in ferrous iron concentration is expected where ferric iron reduction is occurring. Concentrations greater than about 1.00 mg/L indicate that iron reduction is probable (U.S. Environmental Protection Agency, 1993). The concentrations of ferrous iron in September 1997 and March 1998 (figs. 11, 12) indicate places where iron reduction probably is occurring, assuming that sulfide production from sulfate reduction is negligible.
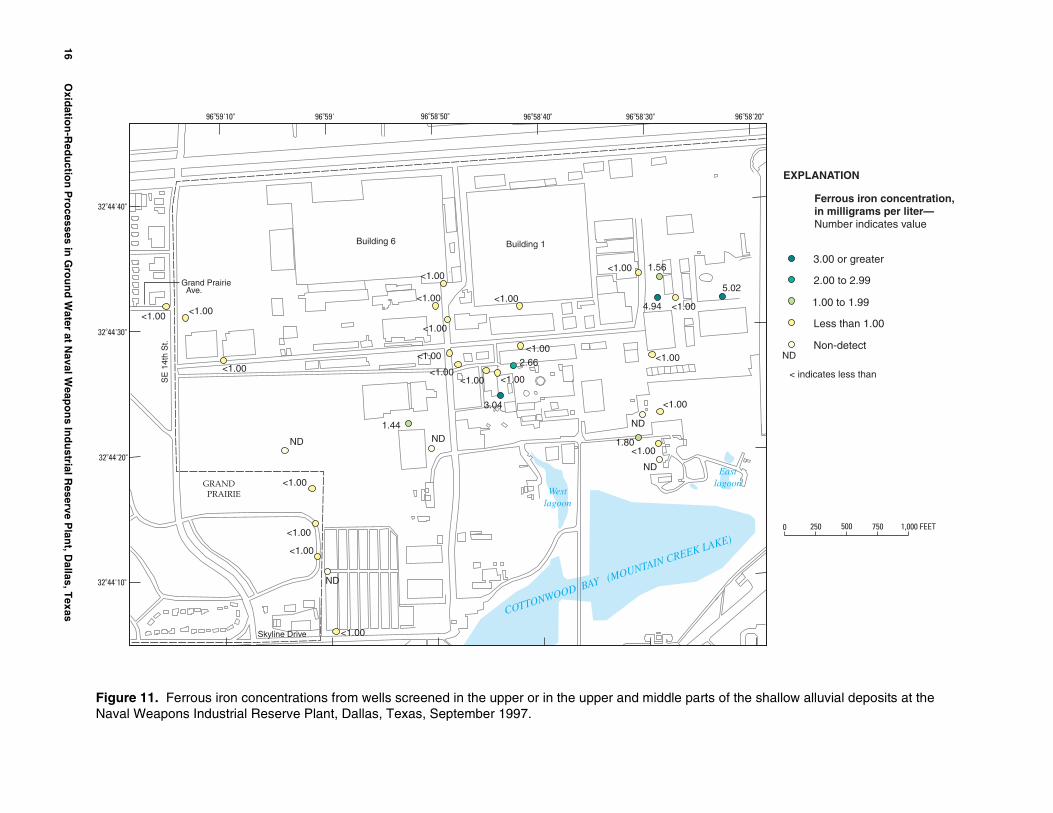
Sulfate and Sulfide
Sulfate is reduced to hydrogen sulfide during sulfate reduction as follows:
2CH2O + SO4-2 => HCO3
- + HS- + CO2 + H2O. (5)
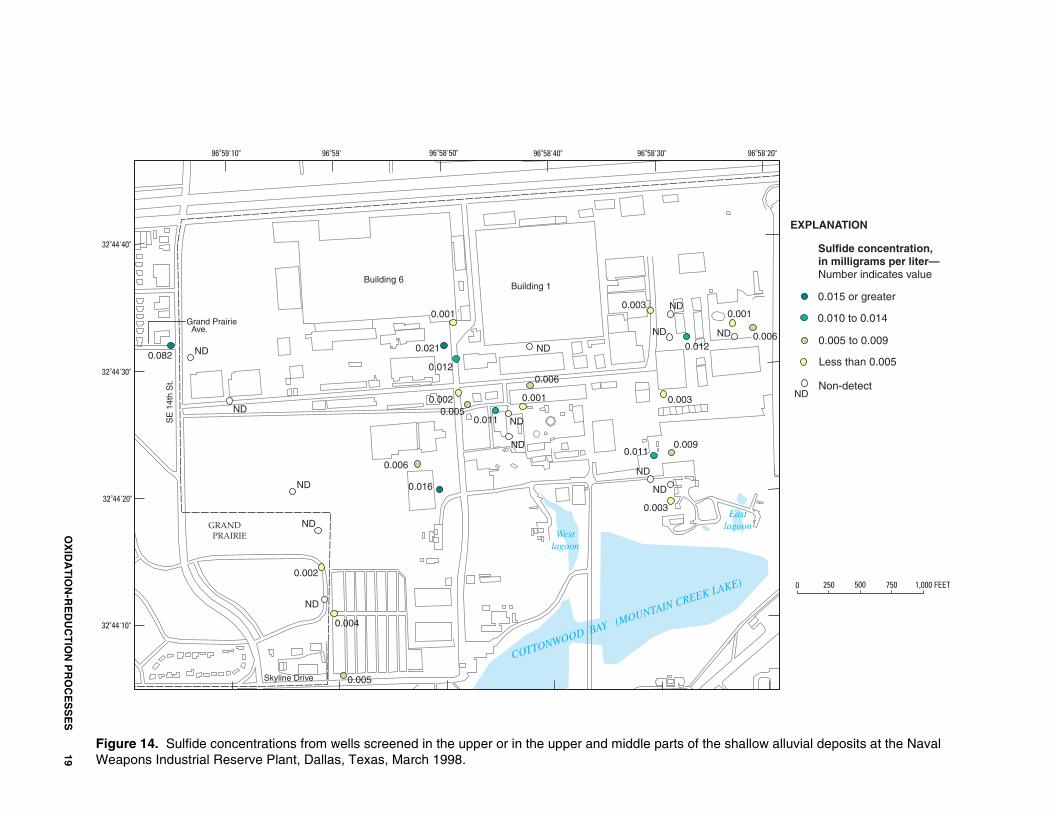
Because of this process, an increase in sulfide is expected where sulfate reduction is occurring, assuming that locally, sulfide production exceeds iron reduction. The generally low concentrations of sulfide (figs. 13, 14) indicate that sulfate reduction is not a key process in the parts of the shallow alluvial deposits sampled.
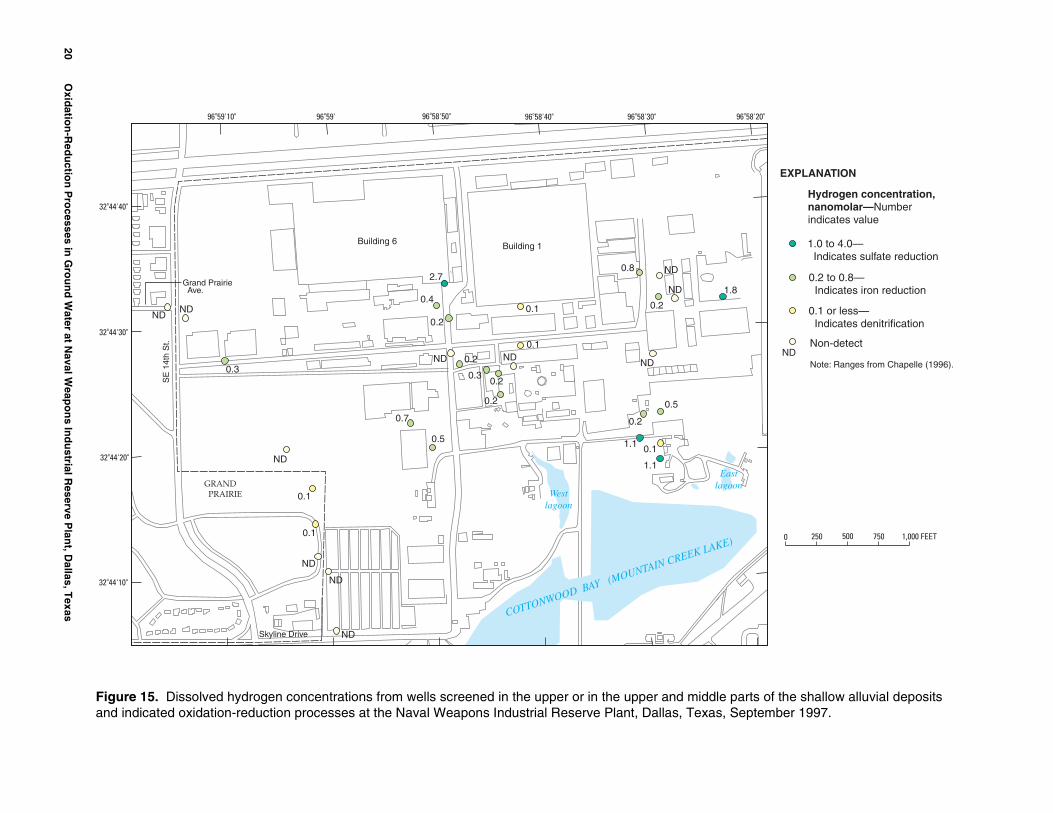
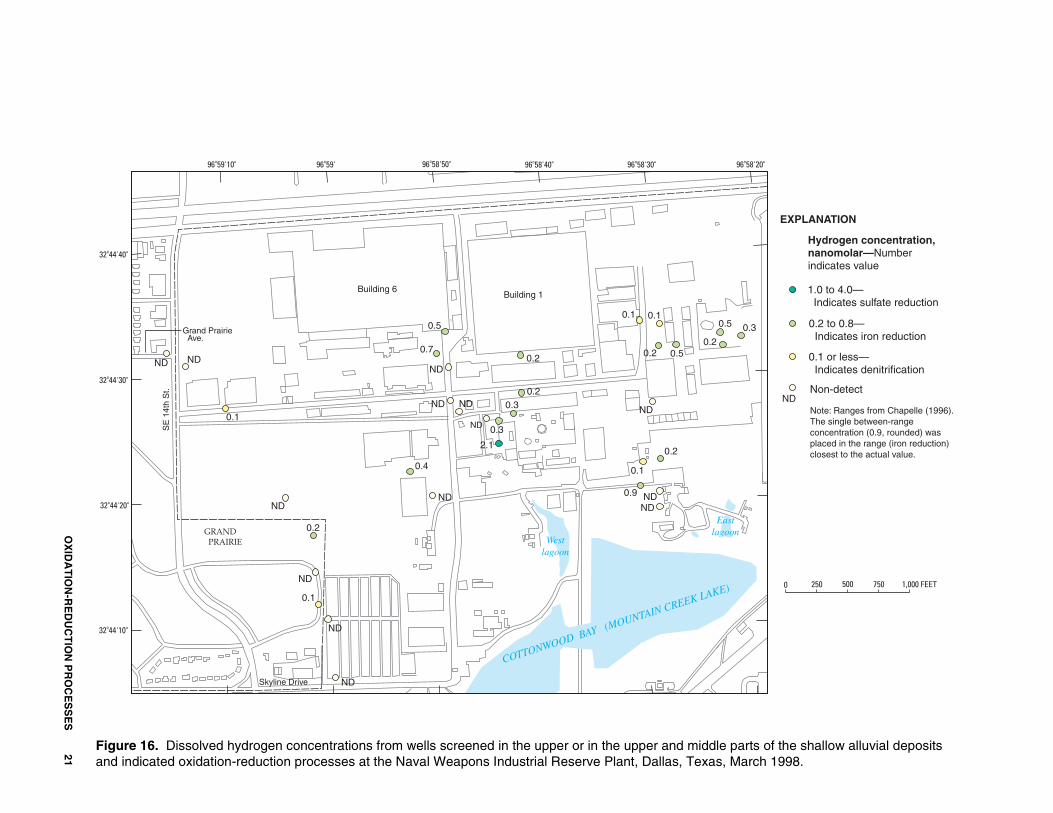
Dissolved Hydrogen
Dissolved hydrogen concentrations (figs. 15, 16) indicate that ferric iron reduction is the most common redox process at the sampled wells. Dissolved hydrogen
concentrations ranged from less than the method detection limit to more than 2,000 nM (table 4). Extremely large concentrations of hydrogen (greater than 50 nM) can be produced in newly installed wells, in wells pumped with direct-current-driven submersible pumps, and in wells with iron casing or screens (Chapelle and others, 1997). The relatively large hydrogen concentrations measured in this study are attributed to the installation of new wells. Excluding hydrogen concentrations greater than 50 nM, the median concentration of samples containing dissolved hydrogen was 0.53 nM for samples collected in September 1997 and 0.45 nM for samples collected in March 1998. These concentrations are typical indicators of ferric iron reduction (fig. 4).
Suarez and Rifai (1999) compiled a database of mean first-order decay rates for chlorinated solvents (table 5) from field and laboratory studies. From the table, the mean first-order decay rate associated with iron reduction for TCE is 0.003 day-1. Using the general equation for first-order decay, 1n (0.5) = -kt1/2, where k is the decay rate, and t1/2 is the half-life, a mean half-life of 231 days is computed for TCE. The computed mean half-life for DCE in iron reducing conditions is 347 days and for VC is 2.7 days. Decay constants were not computed for NWIRP, but it is expected that decay rates at NWIRP would be similar to the decay rates thus computed.
Total Organic Carbon
Analytical screening criteria were developed by USEPA as part of a weighted scoring method to indicate where reductive dechlorination might be likely to occur (U.S. Environmental Protection Agency, 1998). (See next section.) The criterion for TOC is that 20 mg/L is required for reductive dechlorination to proceed efficiently. TOC concentrations at NWIRP ranged from less than the method detection limit to 11.9 mg/L in samples collected in September 1997 (appendix). Results of VOC analyses from September 1997 samples showed very few wells with anthropogenic carbon compounds such as benzene, toluene, ethylbenzene, or xylene. The lack of a sufficient organic carbon source, whether naturally occurring or anthropogenic, can be a limiting factor for efficient reductive dechlorination (Suarez and Rifai, 1999).
Screening Results
The USEPA has developed a weighted scoring method to indicate sites where reductive dechlorination
14 Oxidation-Reduction Processes in Ground Water at Naval Weapons Industrial Reserve Plant, Dallas, Texas
OX
IDA
TIO
N-R
ED
UC
TIO
N P
RO
CE
SS
ES
15
Figure 10. Nitrite concentrations from wells screened in the upper or in the upper and middle parts of the shallow alluvial deposits at the Naval Weapons Industrial Reserve Plant, Dallas, Texas, September 1997.
Building 6 Building 1
GRAND PRAIRIE
SE
14t
h S
t.
Grand Prairie Ave.
Skyline Drive
0 250 500 750 1,000 FEET
0.5 or greater
0.3 to 0.4
0.1 to 0.2
Non-detect
EXPLANATION
Nitrite concentration, inmilligrams per liter—Number indicates value
0.1
0.4
0.3
1.1
0.1
0.3
1.1 0.8 ND0.4
ND ND
NDND
ND
0.2
0.5
0.2
0.6
0.5
ND
ND
1.1
0.3
ND
0.4
ND
0.2
0.2
0.1
0.1
ND
ND
ND
96o58'20"96o58'30"96o58'40"96o58'50"96o59'96o59'10"
32o44'40"
32o44'30"
32o44'20"
32o44'10"
COTTONWOOD BAY (MOUNTAIN CREEK LAKE)
Westlagoon
Eastlagoon
16 Oxid
ation
-Red
uctio
n P
rocesses in
Gro
un
d W
ater at Naval W
eapo
ns In
du
strial Reserve P
lant, D
allas, Texas
Building 6 Building 1
GRAND PRAIRIE
SE
14t
h S
t.
Grand Prairie Ave.
Skyline Drive
0 250 500 750 1,000 FEET
<1.00 <1.00
<1.00
ND
1.44ND
<1.00
<1.00
<1.00
ND
<1.00
<1.00
<1.00
<1.00
<1.00
<1.00
2.66<1.00
<1.00<1.00 <1.00
3.04
1.56
4.94 <1.00
5.02
<1.00
ND
1.80<1.00
ND
ND
< indicates less than
<1.00
<1.00
3.00 or greater
2.00 to 2.99
1.00 to 1.99
Less than 1.00
Non-detect
EXPLANATION
Ferrous iron concentration,in milligrams per liter—Number indicates value
96o58'20"96o58'30"96o58'40"96o58'50"96o59'96o59'10"
32o44'40"
32o44'30"
32o44'20"
32o44'10"
COTTONWOOD BAY (MOUNTAIN CREEK LAKE)
Westlagoon
Eastlagoon
Figure 11. Ferrous iron concentrations from wells screened in the upper or in the upper and middle parts of the shallow alluvial deposits at the Naval Weapons Industrial Reserve Plant, Dallas, Texas, September 1997.

OX
IDA
TIO
N-R
ED
UC
TIO
N P
RO
CE
SS
ES
17
Figure 12. Ferrous iron concentrations from wells screened in the upper or in the upper and middle parts of the shallow alluvial deposits at the Naval Weapons Industrial Reserve Plant, Dallas, Texas, March 1998.
Building 6Building 1
GRAND PRAIRIE
SE
14t
h S
t.
Grand Prairie Ave.
Skyline Drive
0 250 500 750 1,000 FEET
EXPLANATION
Ferrous iron concentration,in milligrams per liter—Number indicates value
ND
3.00 or greater
2.00 to 3.00
1.00 to 1.99
Less than 1.00
Non-detect
< indicates less than
ND ND
ND
ND
ND
1.13
<1.00
<1.00
<1.00
<1.00
<1.00
ND
ND
ND
<1.00
<1.00
<1.00
<1.002.75
ND<1.00
4.10
1.96
3.80 <1.00
<1.00
4.16 ND
4.76
<1.00<1.00
2.56
<1.00
ND
<1.00
96o58'20"96o58'30"96o58'40"96o58'50"96o59'96o59'10"
32o44'40"
32o44'30"
32o44'20"
32o44'10"
COTTONWOOD BAY (MOUNTAIN CREEK LAKE)
Westlagoon
Eastlagoon
18 Oxid
ation
-Red
uctio
n P
rocesses in
Gro
un
d W
ater at Naval W
eapo
ns In
du
strial Reserve P
lant, D
allas, Texas
Figure 13. Sulfide concentrations from wells screened in the upper or in the upper and middle parts of the shallow alluvial deposits at the Naval Weapons Industrial Reserve Plant, Dallas, Texas, September 1997.
Building 6 Building 1
GRAND PRAIRIE
SE
14t
h S
t.
Grand Prairie Ave.
Skyline Drive
0 250 500 750 1,000 FEET
ND
0.003
0.002
0.005
0.002
ND
0.005
0.033
0.007
0.009
ND
ND 0.002
0.008
0.0020.003
0.005
0.005
0.0170.003
0.002 0.001
0.002
0.001
ND
ND
ND ND
ND
ND ND
0.004
0.006
0.015 or greater
0.005 to 0.009
Less than 0.005
Non-detect
EXPLANATION
Sulfide concentration,in milligrams per liter—Number indicates value
ND
96o58'20"96o58'30"96o58'40"96o58'50"96o59'96o59'10"
32o44'40"
32o44'30"
32o44'20"
32o44'10"
COTTONWOOD BAY (MOUNTAIN CREEK LAKE)
Westlagoon
Eastlagoon
OX
IDA
TIO
N-R
ED
UC
TIO
N P
RO
CE
SS
ES
19
Figure 14. Sulfide concentrations from wells screened in the upper or in the upper and middle parts of the shallow alluvial deposits at the Naval Weapons Industrial Reserve Plant, Dallas, Texas, March 1998.
Building 6Building 1
GRAND PRAIRIE
SE
14t
h S
t.
Grand Prairie Ave.
Skyline Drive
0 250 500 750 1,000 FEET
0.001
0.021
0.012
ND
0.0020.005
0.011
0.006
0.001
ND
ND
0.003 ND
0.003
ND
0.0110.009
0.003
0.012NDND
0.002
0.004
0.005
ND
0.082 ND
ND
ND
0.006
0.016
ND
0.006
0.001
ND
0.015 or greater
0.010 to 0.014
0.005 to 0.009
Less than 0.005
Non-detect
EXPLANATION
Sulfide concentration,in milligrams per liter—Number indicates value
ND
96o58'20"96o58'30"96o58'40"96o58'50"96o59'96o59'10"
32o44'40"
32o44'30"
32o44'20"
32o44'10"
COTTONWOOD BAY (MOUNTAIN CREEK LAKE)
Westlagoon
Eastlagoon
20 Oxid
ation
-Red
uctio
n P
rocesses in
Gro
un
d W
ater at Naval W
eapo
ns In
du
strial Reserve P
lant, D
allas, Texas
Building 6 Building 1
GRAND PRAIRIE
SE
14t
h S
t.
Grand Prairie Ave.
Skyline Drive
0 250 500 750 1,000 FEET
NDND
0.3
ND
0.7
0.5
0.1
0.1
ND
ND
ND
2.7
0.4
0.20.1
0.1
ND 0.2
0.3
ND
0.2
0.2
0.8 ND
1.8ND
0.2
ND
0.2
0.5
1.1 0.1
1.1
1.0 to 4.0— Indicates sulfate reduction
0.2 to 0.8— Indicates iron reduction
0.1 or less— Indicates denitrification
Non-detect
Note: Ranges from Chapelle (1996).
EXPLANATION
Hydrogen concentration,nanomolar—Numberindicates value
ND
96o58'20"96o58'30"96o58'40"96o58'50"96o59'96o59'10"
32o44'40"
32o44'30"
32o44'20"
32o44'10"
COTTONWOOD BAY (MOUNTAIN CREEK LAKE)
Westlagoon
Eastlagoon
Figure 15. Dissolved hydrogen concentrations from wells screened in the upper or in the upper and middle parts of the shallow alluvial deposits and indicated oxidation-reduction processes at the Naval Weapons Industrial Reserve Plant, Dallas, Texas, September 1997.
OX
IDA
TIO
N-R
ED
UC
TIO
N P
RO
CE
SS
ES
21
Building 6Building 1
GRAND PRAIRIE
SE
14t
h S
t.
Grand Prairie Ave.
Skyline Drive
1.0 to 4.0— Indicates sulfate reduction
0.2 to 0.8— Indicates iron reduction
0.1 or less— Indicates denitrification
Non-detect
Note: Ranges from Chapelle (1996).The single between-rangeconcentration (0.9, rounded) wasplaced in the range (iron reduction)closest to the actual value.
EXPLANATION
Hydrogen concentration,nanomolar—Numberindicates value
ND
96o58'20"96o58'30"96o58'40"96o58'50"96o59'96o59'10"
32o44'40"
32o44'30"
32o44'20"
32o44'10"
ND ND
0.1
ND
0.4
ND
0.2
ND
0.1
ND
ND
0.5
0.7
0.2
0.2
NDND
ND
0.3
0.3
2.1
ND
0.1 0.1
0.2 0.5
0.5 0.3
0.2
ND
0.1
0.2
0.9
NDND
0 250 500 750 1,000 FEET
COTTONWOOD BAY (MOUNTAIN CREEK LAKE)
Westlagoon
Eastlagoon
Figure 16. Dissolved hydrogen concentrations from wells screened in the upper or in the upper and middle parts of the shallow alluvial deposits and indicated oxidation-reduction processes at the Naval Weapons Industrial Reserve Plant, Dallas, Texas, March 1998.
might be likely to occur (U.S. Environmental Protection Agency, 1998). Monitored natural attenuation (MNA) scores for sites (wells) are computed on the basis of concentrations of selected constituents. An MNA score of 0 to 5 of a possible 49 indicates inadequate evidence for anaerobic biodegradation of chlorinated solvents; a score of 6 to 14 indicates limited evidence for anaerobic biodegradation of chlorinated solvents; a score of 15 to 20 indicates adequate evidence for anaerobic biodegradation of chlorinated solvents; and a score greater than 20 indicates strong evidence for anaerobic biodegradation of chlorinated solvents. The work at NWIRP was done before the USEPA released its list of screening constituents; therefore not all the screening constituents were analyzed for this study. To score the ground-water samples collected from NWIRP in September 1997, a possible total score of 30 rather than 49 was used. Accordingly, the scoring also was modified—an MNA score of 0 to 3 indicated inadequate evidence for anaerobic biodegradation of chlorinated solvents; a score of 4 to 9 indicated limited evidence for anaerobic biodegradation of chlorinated solvents; a score of 10 to 12 indicated adequate evidence for anaerobic biodegradation of chlorinated solvents; and a score greater than 12 indicated strong evidence for anaerobic biodegradation of chlorinated solvents. The MNA score for each well is listed in table 3. Six wells had scores greater than 12. In general, scores were highest for samples collected on the northeast side of the facility, although three wells in the central part of the facility, DWP–5–12, DWP–S1–10, and DWP–S1–4 had scores greater than 12.
SUMMARY
Concentrations of TCE in ground water at NWIRP indicate three source areas of chlorinated solvents—building 1, building 6, and an off-site source west of the facility. The presence of cis-DCE and VC, products of reductive dechlorination of TCE that were not used at the facility, south and southwest of the source areas are evidence that reductive dechlorination is occurring.
The efficiency of reductive dechlorination in ground water is controlled by redox processes. The most common redox processes in ground water are the reduction of oxygen, nitrate (denitrification), ferric iron, sulfate, and carbon dioxide (methanogenesis). Concentrations of reduced species (for example, nitrite, ferrous iron) at a particular site can indicate which redox pro
cess is dominant, but sometimes concentrations of reduced species are not definitive. In such cases, concentrations of dissolved hydrogen in specific ranges can indicate which redox process is dominant. In places south of the source areas, DO concentrations indicated that reduction of oxygen could be the dominant process, particularly south of building 6; but elevated DO concentrations south of building 6 might be caused by a leaking water or sewer pipe. The nitrite data indicate that denitrification is occurring in places; however dissolved hydrogen concentrations indicate that iron reduction is the dominant process south of building 6. The distributions of ferrous iron indicate that iron reduction is occurring in places south-southwest of buildings 6 and 1; dissolved hydrogen concentrations generally support the interpretation that iron reduction is the dominant process in those places. The generally low concentrations of sulfide indicate that sulfate reduction is not a key process in most sampled areas, an interpretation that is supported by dissolved hydrogen concentrations.
Dissolved hydrogen concentrations at sampled wells were most frequently in the range that indicated ferric iron reduction is the primary redox process. Applying mean first-order decay rates for TCE, cis-DCE, and VC in iron-reducing conditions from a recent study resulted in mean half-lives for TCE, cis-DCE, and VC of 231, 347, and 2.67 days, respectively. Decay rates were not computed for NWIRP, but it is expected that decay rates, and thus half-lives, at NWIRP would be similar to those computed.
Small concentrations of TOC indicate the lack of an organic carbon source, which could be a limiting factor for efficient reductive dechlorination at NWIRP.
The USEPA has developed a weighted scoring method to indicate sites where reductive dechlorination might be likely to occur. At NWIRP, a score greater than 12 indicated strong evidence for anaerobic biodegradation of chlorinated solvents. Scores greater than 12 were computed for six sites. In general, scores were highest for samples collected on the northeast side of the facility, although three sites in the central part of NWIRP had scores greater than 12.
REFERENCES CITED
Anaya, Roberto, Braun, C.L., and Kuniansky, E.L., 2000, Use of borehole geophysical logs for improved site characterization at Naval Weapons Industrial Reserve Plant,
22 Oxidation-Reduction Processes in Ground Water at Naval Weapons Industrial Reserve Plant, Dallas, Texas
Dallas, Texas: U.S. Geological Survey Water-Resources Investigations Report 00–4150, 10 p.
Barker, R.A., and Braun, C.L., 2000, Computer-model analysis of ground-water flow and simulated effects of contaminant remediation at Naval Weapons Industrial Reserve Plant, Dallas, Texas: U.S. Geological Survey Water-Resources Investigations Report 00–4197, 44 p.
Bradley, P.M., and Chapelle, F.H., 1998, Microbial mineralization of VC and DCE under different terminal electron accepting conditions: Anaerobe, v. 4, p. 81–87.
Braun, C.L., Anaya, Roberto, and Kuniansky, E.L., 2000, Borehole geophysical logs at Naval Weapons Industrial Reserve Plant, Dallas, Texas: U.S. Geological Survey Open-File Report 00–076, 232 p.
Chapelle, F.H., 1996, Identifying redox conditions that favor the natural attenuation of chlorinated ethenes in contaminated ground-water systems, in Symposium on Natural Attenuation of Chlorinated Organics in Ground Water, Dallas, Tex., 1996, Proceedings: U.S. Environmental Protection Agency, EPA/540/R–96–509, p. 17–20.
Chapelle, F.H., Vroblesky, D.A., Woodward, J.C., and Lovley, D.R., 1997, Practical considerations for measuring hydrogen concentrations in groundwater: Environmental Science and Technology, v. 31, no. 10, p. 2,873– 2,877.
EnSafe/Allen & Hoshall, 1994, Comprehensive long-term environmental action—Navy stabilization work plan; Revision I: Prepared for Southern Division Naval Facilities Engineering Command, Charleston, S.C., 83 p.
______1996, Draft RCRA facility investigation report, Naval Weapons Industrial Reserve Plant, Dallas, Texas— Volume 1: Prepared for Southern Division Naval Facilities Engineering Command, Charleston, S.C., 135 p.
Gilbert, T.W., Behymer, T.D., and Castaneda, H.B., 1982, Determination of dissolved oxygen in natural and wastewaters: American Laboratory, American Society for Testing and Materials ASTM D 888–87, p. 119–134.
HACH Co., 1989, Water analysis handbook: Loveland, Colo., 691 p.
Suarez, M.P., and Rifai, H.S., 1999, Biodegradation rates for fuel hydrocarbons and chlorinated solvents in groundwater: Bioremediation Journal, v. 3, no. 4, p. 337–362.
Trace Analytical, 1997, RGA reduction gas analyzer operating manual: Menlo Park, Calif., 45 p.
U.S. Environmental Protection Agency, 1983, Methods for chemical analysis of water and wastes: EPA/600/4–74– 020 [variously paged].
______1993, Methods for determination of inorganic substances in environmental samples: EPA/600/R–93–100 [variously paged].
______1998, Technical protocol for evaluating natural attenuation of chlorinated solvents in ground water: EPA/600/R–98–128, 233 p.
______1999, Test methods for evaluating solid wastes, physical/chemical methods (3d ed.): EPA/SW–846 [variously paged].
U.S. Geological Survey, 1999, The quality of our Nation’s waters—Nutrients and pesticides: U.S. Geological Survey Circular 1225, 82 p.
REFERENCES CITED 23

Table 1Table 1. Well information and sampling dates for wells sampled at the Naval Weapons Industrial Reserve Plant, Dallas, Texas—Continued
Table 1. Well information and sampling dates for wells sampled at the Naval Weapons Industrial Reserve Plant, Dallas, Texas
[“Both” indicates that the screen penetrates both the upper and middle parts of the shallow alluvial aquifer]
Well number (fig. 1)
Date sampled
USGS EnSafe/ Allen & Hoshall
Well depth (feet below
land surface)
Screened interval (feet below
and surface)
Part of shallow alluvial aquifer in which well is screened
Well altitude (feet above
NGVD of 1929)
DWP–10–1 9/97 and 3/98 9/97 24 8–23 Both 486.6
DWP–10–2 3/98 -- 29 13–28 Both 486
DWP–10–6 3/98 -- 24 13–23 Upper 490
DWP–10–DW1 3/98 9/97 59 50–55 Lower 486
DWP–10–DW4 9/97 and 3/98 9/97 64 59–64 Lower 490.1
DWP–10–DW6 3/98 9/97 54 34–54 Middle & lower 492
DWP–1–13 9/97 and 3/98 9/97 19 3–18 Middle 471.4
DWP–128–1 9/97 and 3/98 9/97 25 4.5–24.5 Upper 484.9
DWP–1–9 9/97 and 3/98 9/97 29 13–28 Lower 464.5
DWP–4–10 9/97 and 3/98 9/97 14 3–13 Middle 458.4
DWP–4–14 9/97 and 3/98 9/97 22 10–20 Lower 461.5
DWP–4–2 9/97 and 3/98 -- 22 11–21 Both 479.7
DWP–4–4 9/97 and 3/98 -- 31 10–30 Both 483.1
DWP–4–5 9/97 and 3/98 9/97 29 13–28 Both 490.2
DWP–4–8 9/97 and 3/98 9/97 33 17–32 Both 489.6
DWP–4–9 9/97 and 3/98 9/97 29 13–28 Both 476.6
DWP–5–12 9/97 and 3/98 -- 32 16–31 Upper 488.7
DWP–5–13 9/97 and 3/98 9/97 29 13–28 Both 485.3
DWP–7–6 9/97 and 3/98 -- 32 15–25 Middle 476.9
DWP–BG–10 9/97 and 3/98 9/97 21 5–20 Both 486.8
DWP–BG–4 9/97 and 3/98 9/97 34 18–33 Middle 501.7
DWP–BG–4–3 9/97 and 3/98 9/97 28 18–28 Both 503.2
DWP–BG–4–6 9/97 and 3/98 9/97 30 15–30 Both 500.2
DWP–BG-6 9/97 and 3/98 -- 39 23–38 Lower 470.8
DWP–BG–7 9/97 and 3/98 9/97 29 13–28 Upper 499.6
DWP–BG–8 9/97 and 3/98 -- 19 3.5–18.5 Both 478.9
DWP–DBG–3 9/97 and 3/98 9/97 47 38–43 Lower 479
DWP–L1–5 9/97 and 3/98 9/97 34 18–33 Middle 488.7
DWP–L2–1 9/97 and 3/98 9/97 34 18–33 Upper 496.6
DWP–L2–16 9/97 and 3/98 9/97 29 13–28 Upper 494.6
DWP–L2–4 9/97 and 3/98 9/97 29 13–28 Upper 494.6
DWP–L2–5 9/97 and 3/98 -- 27 11–26 Upper 494.6
DWP–L2–8 9/97 and 3/98 9/97 27 11–26 Upper 494.9
DWP–L2–DW1 9/97 and 3/98 9/97 60.5 55–60 Lower 495
DWP–L2–DW2 9/97 and 3/98 9/97 48 42–47 Middle 495
24 Oxidation-Reduction Processes in Ground Water at Naval Weapons Industrial Reserve Plant, Dallas, Texas
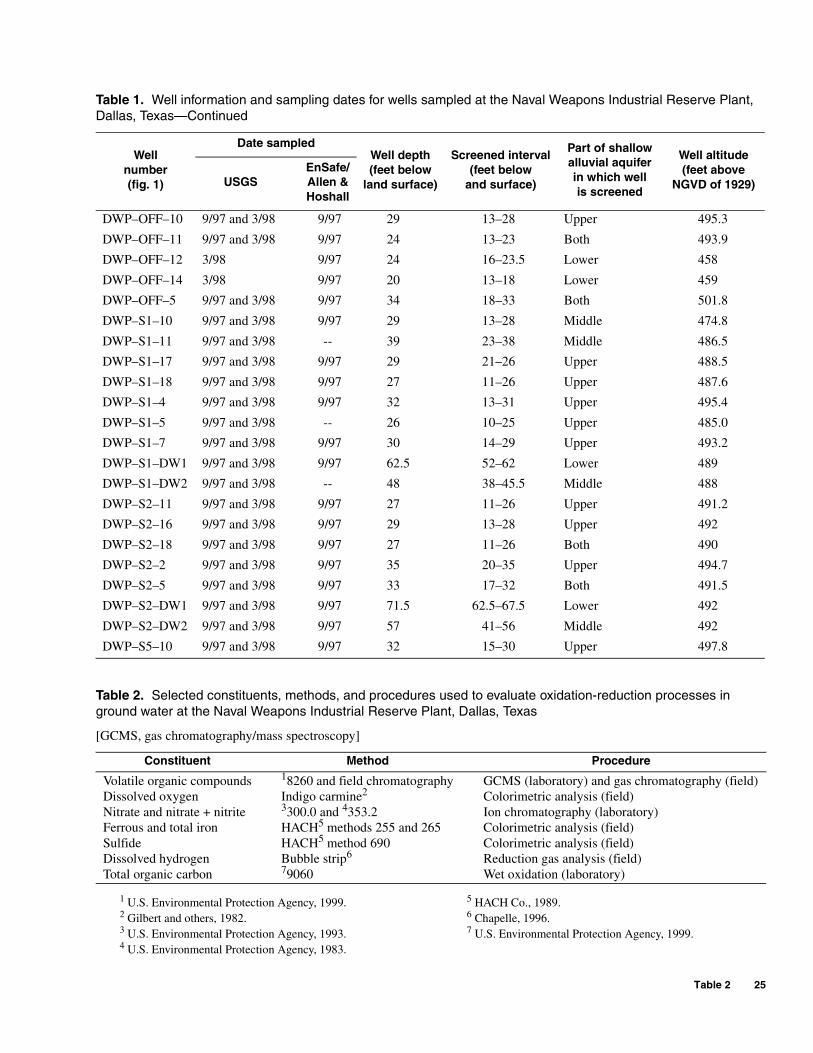
Table 2
Table 1. Well information and sampling dates for wells sampled at the Naval Weapons Industrial Reserve Plant, Dallas, Texas—Continued
Well number (fig. 1)
Date sampled
USGS EnSafe/ Allen & Hoshall
Well depth (feet below
land surface)
Screened interval (feet below
and surface)
Part of shallow alluvial aquifer in which well is screened
Well altitude (feet above
NGVD of 1929)
DWP–OFF–10 9/97 and 3/98 9/97 29 13–28 Upper 495.3
DWP–OFF–11 9/97 and 3/98 9/97 24 13–23 Both 493.9
DWP–OFF–12 3/98 9/97 24 16–23.5 Lower 458
DWP–OFF–14 3/98 9/97 20 13–18 Lower 459
DWP–OFF–5 9/97 and 3/98 9/97 34 18–33 Both 501.8
DWP–S1–10 9/97 and 3/98 9/97 29 13–28 Middle 474.8
DWP–S1–11 9/97 and 3/98 -- 39 23–38 Middle 486.5
DWP–S1–17 9/97 and 3/98 9/97 29 21–26 Upper 488.5
DWP–S1–18 9/97 and 3/98 9/97 27 11–26 Upper 487.6
DWP–S1–4 9/97 and 3/98 9/97 32 13–31 Upper 495.4
DWP–S1–5 9/97 and 3/98 -- 26 10–25 Upper 485.0
DWP–S1–7 9/97 and 3/98 9/97 30 14–29 Upper 493.2
DWP–S1–DW1 9/97 and 3/98 9/97 62.5 52–62 Lower 489
DWP–S1–DW2 9/97 and 3/98 -- 48 38–45.5 Middle 488
DWP–S2–11 9/97 and 3/98 9/97 27 11–26 Upper 491.2
DWP–S2–16 9/97 and 3/98 9/97 29 13–28 Upper 492
DWP–S2–18 9/97 and 3/98 9/97 27 11–26 Both 490
DWP–S2–2 9/97 and 3/98 9/97 35 20–35 Upper 494.7
DWP–S2–5 9/97 and 3/98 9/97 33 17–32 Both 491.5
DWP–S2–DW1 9/97 and 3/98 9/97 71.5 62.5–67.5 Lower 492
DWP–S2–DW2 9/97 and 3/98 9/97 57 41–56 Middle 492
DWP–S5–10 9/97 and 3/98 9/97 32 15–30 Upper 497.8
Table 2. Selected constituents, methods, and procedures used to evaluate oxidation-reduction processes in ground water at the Naval Weapons Industrial Reserve Plant, Dallas, Texas
[GCMS, gas chromatography/mass spectroscopy]
Constituent Method Procedure
Volatile organic compounds 18260 and field chromatography GCMS (laboratory) and gas chromatography (field)Dissolved oxygen Indigo carmine2 Colorimetric analysis (field)Nitrate and nitrate + nitrite 3300.0 and 4353.2 Ion chromatography (laboratory)Ferrous and total iron HACH5 methods 255 and 265 Colorimetric analysis (field)Sulfide HACH5 method 690 Colorimetric analysis (field)Dissolved hydrogen Bubble strip6 Reduction gas analysis (field)Total organic carbon 79060 Wet oxidation (laboratory)
1 U.S. Environmental Protection Agency, 1999. 5 HACH Co., 1989. 2 Gilbert and others, 1982. 6 Chapelle, 1996. 3 U.S. Environmental Protection Agency, 1993. 7 U.S. Environmental Protection Agency, 1999.4 U.S. Environmental Protection Agency, 1983.
Table 2 25
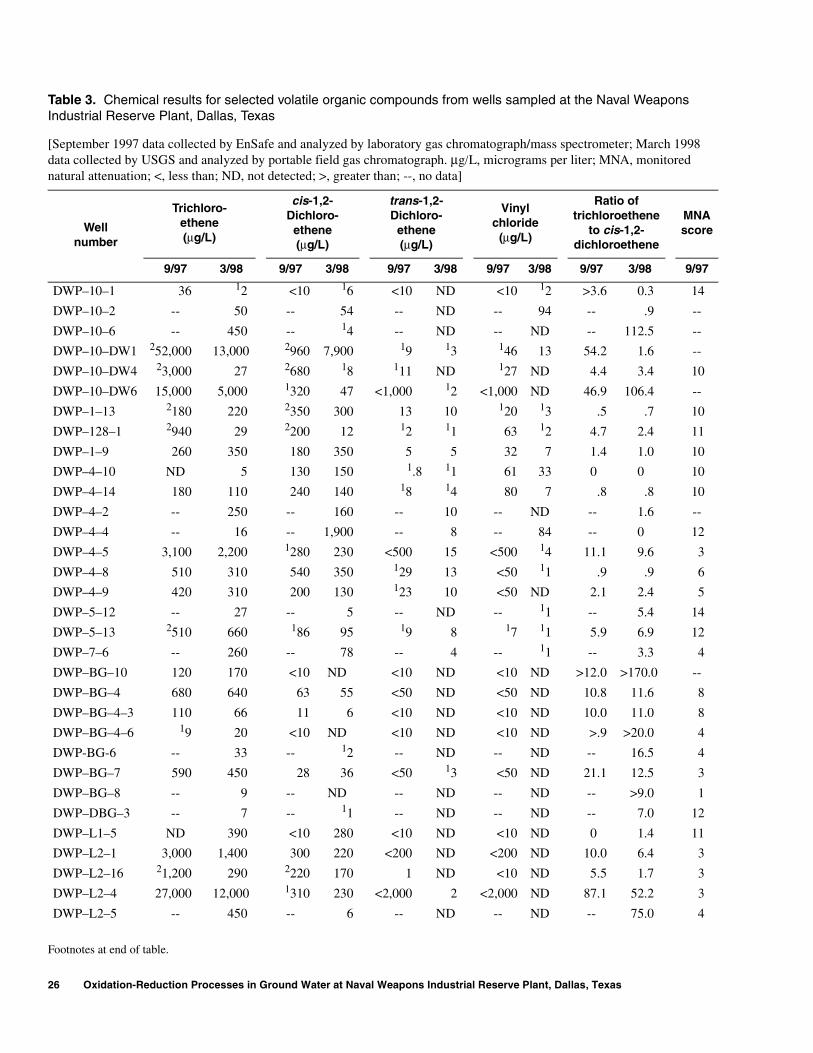
Table 3
Table 3. Chemical results for selected volatile organic compounds from wells sampled at the Naval Weapons Industrial Reserve Plant, Dallas, Texas—Continued
Table 3. Chemical results for selected volatile organic compounds from wells sampled at the Naval Weapons Industrial Reserve Plant, Dallas, Texas
[September 1997 data collected by EnSafe and analyzed by laboratory gas chromatograph/mass spectrometer; March 1998 data collected by USGS and analyzed by portable field gas chromatograph. µg/L, micrograms per liter; MNA, monitored natural attenuation; <, less than; ND, not detected; >, greater than; --, no data]
Well number
Trichloroethene (µg/L)
cis-1,2Dichloro
ethene (µg/L)
trans-1,2Dichloro
ethene (µg/L)
Vinyl chloride
(µg/L)
Ratio of trichloroethene
to cis-1,2dichloroethene
MNA score
9/97 3/98 9/97 3/98 9/97 3/98 9/97 3/98 9/97 3/98 9/97
DWP–10–1 36 12 <10 16 <10 ND <10 12 >3.6 0.3 14
DWP–10–2 -- 50 -- 54 -- ND -- 94 -- .9 --
DWP–10–6 -- 450 -- 14 -- ND -- ND -- 112.5 --
DWP–10–DW1 252,000 13,000 2960 7,900 19 13 146 13 54.2 1.6 --
DWP–10–DW4 23,000 27 2680 18 111 ND 127 ND 4.4 3.4 10
DWP–10–DW6 15,000 5,000 1320 47 <1,000 12 <1,000 ND 46.9 106.4 --
DWP–1–13 2180 220 2350 300 13 10 120 13 .5 .7 10
DWP–128–1 2940 29 2200 12 12 11 63 12 4.7 2.4 11
DWP–1–9 260 350 180 350 5 5 32 7 1.4 1.0 10
DWP–4–10 ND 5 130 150 1.8 11 61 33 0 0 10
DWP–4–14 180 110 240 140 18 14 80 7 .8 .8 10
DWP–4–2 -- 250 -- 160 -- 10 -- ND -- 1.6 --
DWP–4–4 -- 16 -- 1,900 -- 8 -- 84 -- 0 12
DWP–4–5 3,100 2,200 1280 230 <500 15 <500 14 11.1 9.6 3
DWP–4–8 510 310 540 350 129 13 <50 11 .9 .9 6
DWP–4–9 420 310 200 130 123 10 <50 ND 2.1 2.4 5
DWP–5–12 -- 27 -- 5 -- ND -- 11 -- 5.4 14
DWP–5–13 2510 660 186 95 19 8 17 11 5.9 6.9 12
DWP–7–6 -- 260 -- 78 -- 4 -- 11 -- 3.3 4
DWP–BG–10 120 170 <10 ND <10 ND <10 ND >12.0 >170.0 --
DWP–BG–4 680 640 63 55 <50 ND <50 ND 10.8 11.6 8
DWP–BG–4–3 110 66 11 6 <10 ND <10 ND 10.0 11.0 8
DWP–BG–4–6 19 20 <10 ND <10 ND <10 ND >.9 >20.0 4
DWP-BG-6 -- 33 -- 12 -- ND -- ND -- 16.5 4
DWP–BG–7 590 450 28 36 <50 13 <50 ND 21.1 12.5 3
DWP–BG–8 -- 9 -- ND -- ND -- ND -- >9.0 1
DWP–DBG–3 -- 7 -- 11 -- ND -- ND -- 7.0 12
DWP–L1–5 ND 390 <10 280 <10 ND <10 ND 0 1.4 11
DWP–L2–1 3,000 1,400 300 220 <200 ND <200 ND 10.0 6.4 3
DWP–L2–16 21,200 290 2220 170 1 ND <10 ND 5.5 1.7 3
DWP–L2–4 27,000 12,000 1310 230 <2,000 2 <2,000 ND 87.1 52.2 3
DWP–L2–5 -- 450 -- 6 -- ND -- ND -- 75.0 4
Footnotes at end of table.
26 Oxidation-Reduction Processes in Ground Water at Naval Weapons Industrial Reserve Plant, Dallas, Texas
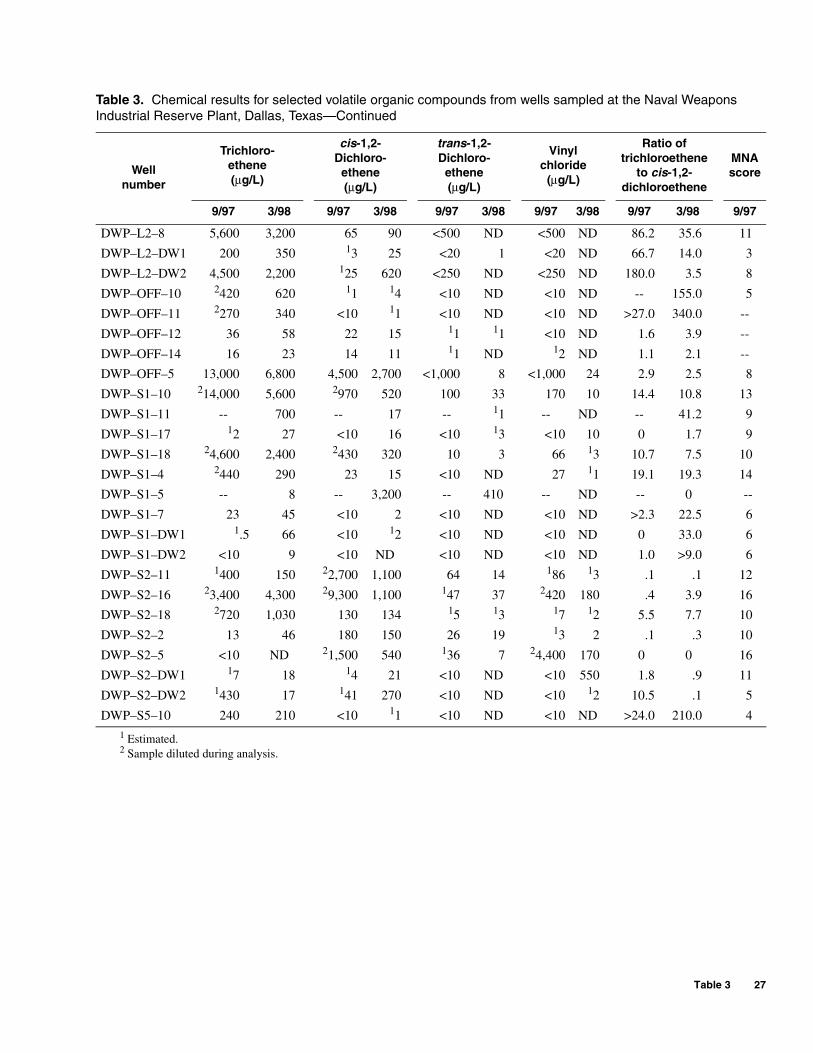
Table 3. Chemical results for selected volatile organic compounds from wells sampled at the Naval Weapons Industrial Reserve Plant, Dallas, Texas—Continued
cis-1,2- trans-1,2- Ratio of Trichloro- Vinyl
Dichloro- Dichloro- trichloroethene MNA Well ethene
ethene ethene chloride
to cis-1,2- score number (µg/L)
(µg/L) (µg/L) (µg/L)
dichloroethene
9/97 3/98 9/97 3/98 9/97 3/98 9/97 3/98 9/97 3/98 9/97
DWP–L2–8 5,600 3,200 65 90 <500 ND <500 ND 86.2 35.6 11
DWP–L2–DW1 200 350 13 25 <20 1 <20 ND 66.7 14.0 3
DWP–L2–DW2 4,500 2,200 125 620 <250 ND <250 ND 180.0 3.5 8
DWP–OFF–10 2420 620 11 14 <10 ND <10 ND -- 155.0 5
DWP–OFF–11 2270 340 <10 11 <10 ND <10 ND >27.0 340.0 -
DWP–OFF–12 36 58 22 15 11 11 <10 ND 1.6 3.9 -
DWP–OFF–14 16 23 14 11 11 ND 12 ND 1.1 2.1 -
DWP–OFF–5 13,000 6,800 4,500 2,700 <1,000 8 <1,000 24 2.9 2.5 8
DWP–S1–10 214,000 5,600 2970 520 100 33 170 10 14.4 10.8 13
DWP–S1–11 -- 700 -- 17 -- 11 -- ND -- 41.2 9
DWP–S1–17 12 27 <10 16 <10 13 <10 10 0 1.7 9
DWP–S1–18 24,600 2,400 2430 320 10 3 66 13 10.7 7.5 10
DWP–S1–4 2440 290 23 15 <10 ND 27 11 19.1 19.3 14
DWP–S1–5 -- 8 -- 3,200 -- 410 -- ND -- 0 -
DWP–S1–7 23 45 <10 2 <10 ND <10 ND >2.3 22.5 6
DWP–S1–DW1 1.5 66 <10 12 <10 ND <10 ND 0 33.0 6
DWP–S1–DW2 <10 9 <10 ND <10 ND <10 ND 1.0 >9.0 6
DWP–S2–11 1400 150 22,700 1,100 64 14 186 13 .1 .1 12
DWP–S2–16 23,400 4,300 29,300 1,100 147 37 2420 180 .4 3.9 16
DWP–S2–18 2720 1,030 130 134 15 13 17 12 5.5 7.7 10
DWP–S2–2 13 46 180 150 26 19 13 2 .1 .3 10
DWP–S2–5 <10 ND 21,500 540 136 7 24,400 170 0 0 16
DWP–S2–DW1 17 18 14 21 <10 ND <10 550 1.8 .9 11
DWP–S2–DW2 1430 17 141 270 <10 ND <10 12 10.5 .1 5
DWP–S5–10 240 210 <10 11 <10 ND <10 ND >24.0 210.0 41 Estimated.2 Sample diluted during analysis.
Table 3 27
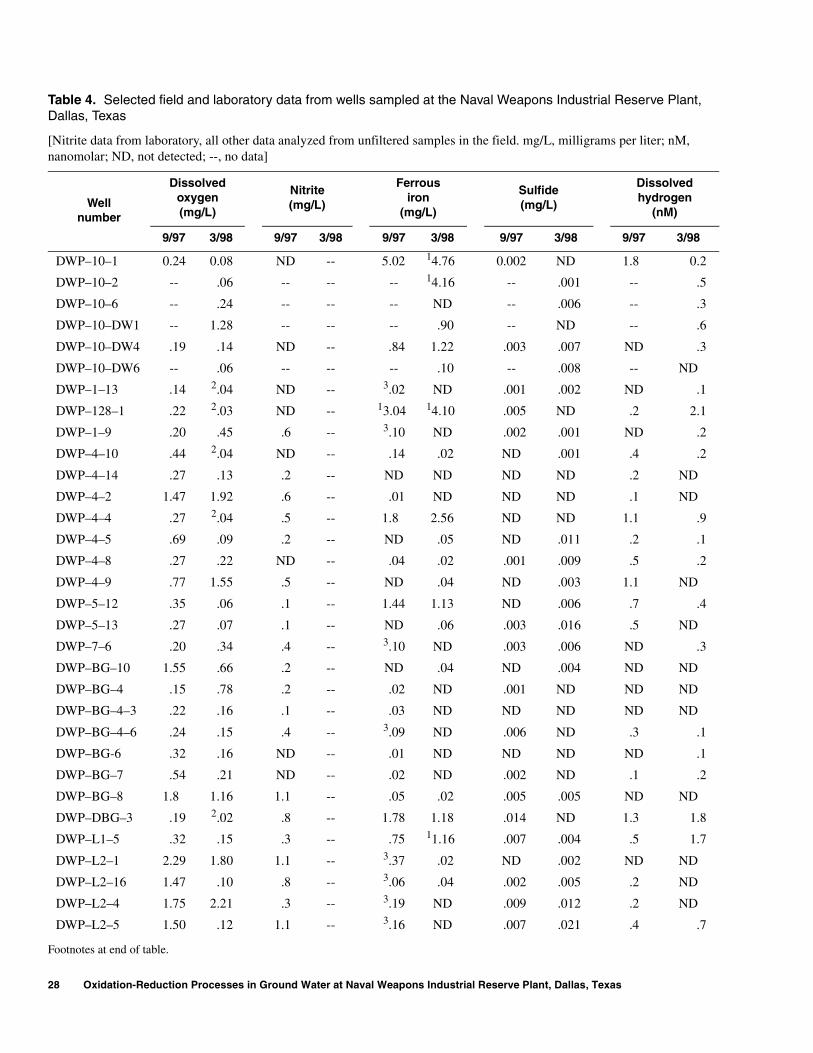
Table 4 Table 4. Selected field and laboratory data from wells sampled at the Naval Weapons Industrial Reserve Plant, Dallas, Texas—Continued
Table 4. Selected field and laboratory data from wells sampled at the Naval Weapons Industrial Reserve Plant, Dallas, Texas
[Nitrite data from laboratory, all other data analyzed from unfiltered samples in the field. mg/L, milligrams per liter; nM, nanomolar; ND, not detected; --, no data]
Well number
Dissolved oxygen (mg/L)
Nitrite (mg/L)
Ferrous iron
(mg/L)
Sulfide (mg/L)
Dissolved hydrogen
(nM)
9/97 3/98 9/97 3/98 9/97 3/98 9/97 3/98 9/97 3/98
DWP–10–1 0.24 0.08 ND -- 5.02 14.76 0.002 ND 1.8 0.2
DWP–10–2 -- .06 -- -- -- 14.16 -- .001 -- .5
DWP–10–6 -- .24 -- -- -- ND -- .006 -- .3
DWP–10–DW1 -- 1.28 -- -- -- .90 -- ND -- .6
DWP–10–DW4 .19 .14 ND -- .84 1.22 .003 .007 ND .3
DWP–10–DW6 -- .06 -- -- -- .10 -- .008 -- ND
DWP–1–13 .14 2.04 ND -- 3.02 ND .001 .002 ND .1
DWP–128–1 .22 2.03 ND -- 13.04 14.10 .005 ND .2 2.1
DWP–1–9 .20 .45 .6 -- 3.10 ND .002 .001 ND .2
DWP–4–10 .44 2.04 ND -- .14 .02 ND .001 .4 .2
DWP–4–14 .27 .13 .2 -- ND ND ND ND .2 ND
DWP–4–2 1.47 1.92 .6 -- .01 ND ND ND .1 ND
DWP–4–4 .27 2.04 .5 -- 1.8 2.56 ND ND 1.1 .9
DWP–4–5 .69 .09 .2 -- ND .05 ND .011 .2 .1
DWP–4–8 .27 .22 ND -- .04 .02 .001 .009 .5 .2
DWP–4–9 .77 1.55 .5 -- ND .04 ND .003 1.1 ND
DWP–5–12 .35 .06 .1 -- 1.44 1.13 ND .006 .7 .4
DWP–5–13 .27 .07 .1 -- ND .06 .003 .016 .5 ND
DWP–7–6 .20 .34 .4 -- 3.10 ND .003 .006 ND .3
DWP–BG–10 1.55 .66 .2 -- ND .04 ND .004 ND ND
DWP–BG–4 .15 .78 .2 -- .02 ND .001 ND ND ND
DWP–BG–4–3 .22 .16 .1 -- .03 ND ND ND ND ND
DWP–BG–4–6 .24 .15 .4 -- 3.09 ND .006 ND .3 .1
DWP–BG-6 .32 .16 ND -- .01 ND ND ND ND .1
DWP–BG–7 .54 .21 ND -- .02 ND .002 ND .1 .2
DWP–BG–8 1.8 1.16 1.1 -- .05 .02 .005 .005 ND ND
DWP–DBG–3 .19 2.02 .8 -- 1.78 1.18 .014 ND 1.3 1.8
DWP–L1–5 .32 .15 .3 -- .75 11.16 .007 .004 .5 1.7
DWP–L2–1 2.29 1.80 1.1 -- 3.37 .02 ND .002 ND ND
DWP–L2–16 1.47 .10 .8 -- 3.06 .04 .002 .005 .2 ND
DWP–L2–4 1.75 2.21 .3 -- 3.19 ND .009 .012 .2 ND
DWP–L2–5 1.50 .12 1.1 -- 3.16 ND .007 .021 .4 .7
Footnotes at end of table.
28 Oxidation-Reduction Processes in Ground Water at Naval Weapons Industrial Reserve Plant, Dallas, Texas
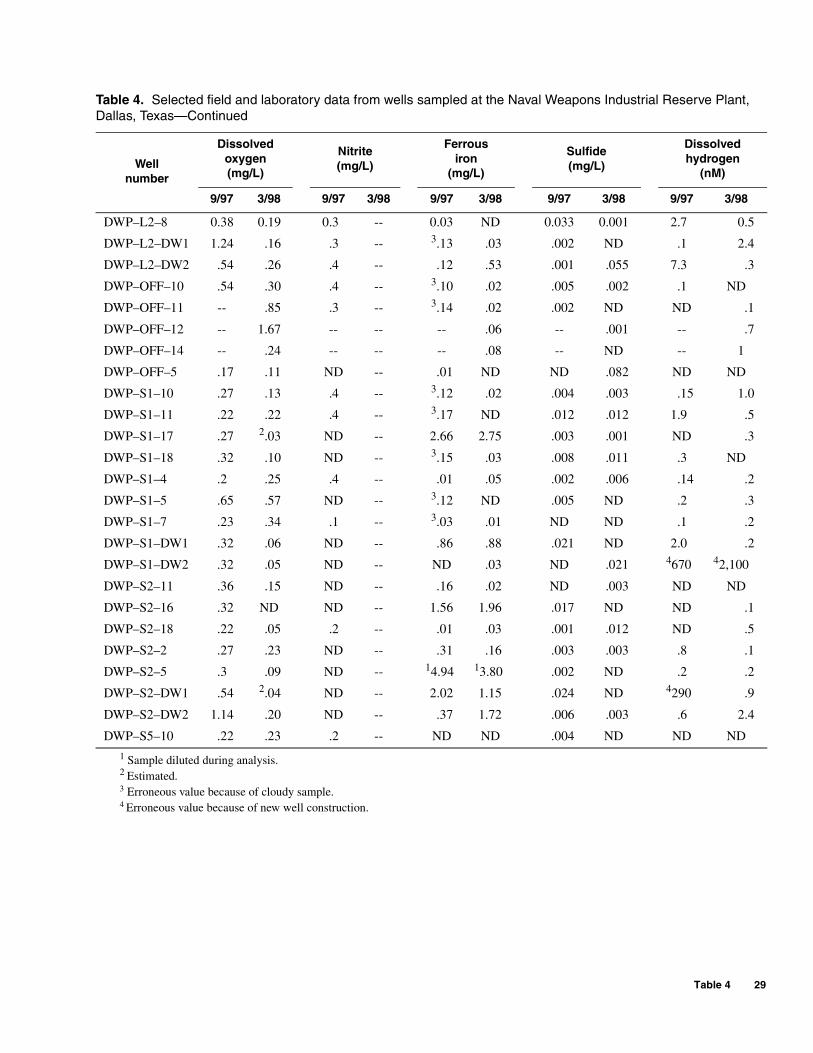
Table 4. Selected field and laboratory data from wells sampled at the Naval Weapons Industrial Reserve Plant, Dallas, Texas—Continued
Well number
Dissolved oxygen (mg/L)
Nitrite (mg/L)
Ferrous iron
(mg/L)
Sulfide (mg/L)
Dissolved hydrogen
(nM)
9/97 3/98 9/97 3/98 9/97 3/98 9/97 3/98 9/97 3/98
DWP–L2–8 0.38 0.19 0.3 -- 0.03 ND 0.033 0.001 2.7 0.5
DWP–L2–DW1 1.24 .16 .3 -- 3.13 .03 .002 ND .1 2.4
DWP–L2–DW2 .54 .26 .4 -- .12 .53 .001 .055 7.3 .3
DWP–OFF–10 .54 .30 .4 -- 3.10 .02 .005 .002 .1 ND
DWP–OFF–11 -- .85 .3 -- 3.14 .02 .002 ND ND .1
DWP–OFF–12 -- 1.67 -- -- -- .06 -- .001 -- .7
DWP–OFF–14 -- .24 -- -- -- .08 -- ND -- 1
DWP–OFF–5 .17 .11 ND -- .01 ND ND .082 ND ND
DWP–S1–10 .27 .13 .4 -- 3.12 .02 .004 .003 .15 1.0
DWP–S1–11 .22 .22 .4 -- 3.17 ND .012 .012 1.9 .5
DWP–S1–17 .27 2.03 ND -- 2.66 2.75 .003 .001 ND .3
DWP–S1–18 .32 .10 ND -- 3.15 .03 .008 .011 .3 ND
DWP–S1–4 .2 .25 .4 -- .01 .05 .002 .006 .14 .2
DWP–S1–5 .65 .57 ND -- 3.12 ND .005 ND .2 .3
DWP–S1–7 .23 .34 .1 -- 3.03 .01 ND ND .1 .2
DWP–S1–DW1 .32 .06 ND -- .86 .88 .021 ND 2.0 .2
DWP–S1–DW2 .32 .05 ND -- ND .03 ND .021 4670 42,100
DWP–S2–11 .36 .15 ND -- .16 .02 ND .003 ND ND
DWP–S2–16 .32 ND ND -- 1.56 1.96 .017 ND ND .1
DWP–S2–18 .22 .05 .2 -- .01 .03 .001 .012 ND .5
DWP–S2–2 .27 .23 ND -- .31 .16 .003 .003 .8 .1
DWP–S2–5 .3 .09 ND -- 14.94 13.80 .002 ND .2 .2
DWP–S2–DW1 .54 2.04 ND -- 2.02 1.15 .024 ND 4290 .9
DWP–S2–DW2 1.14 .20 ND -- .37 1.72 .006 .003 .6 2.4
DWP–S5–10 .22 .23 .2 -- ND ND .004 ND ND ND
1 Sample diluted during analysis. 2 Estimated.3 Erroneous value because of cloudy sample.4 Erroneous value because of new well construction.
Table 4 29
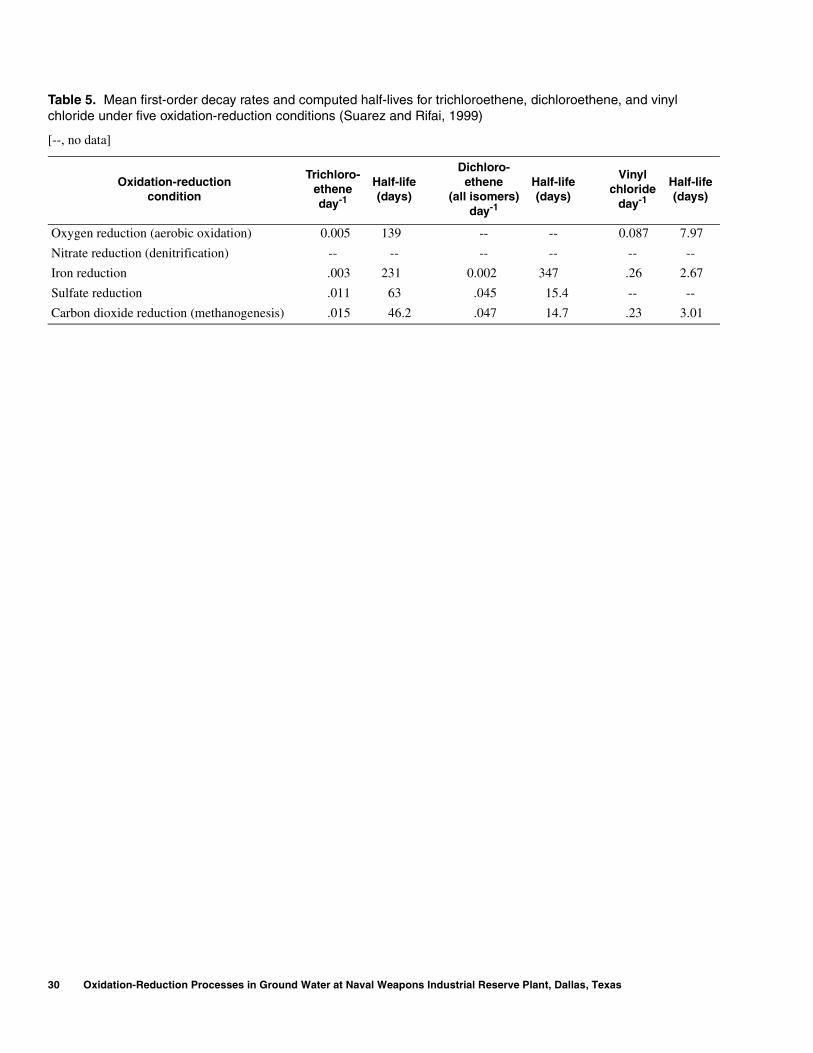
Table 5 Table 5. Mean first-order decay rates and computed half-lives for trichloroethene, dichloroethene, and vinyl chloride under five oxidation-reduction conditions (Suarez and Rifai, 1999)
[--, no data]
Dichloro-Trichloro- Vinyl
Oxidation-reduction Half-life ethene Half-life Half-life ethene chloride
condition (days) (all isomers) (days) (days) day-1
day-1 day-1
Oxygen reduction (aerobic oxidation) 0.005 139 -- -- 0.087 7.97
Nitrate reduction (denitrification) -- -- -- -- -- -
Iron reduction .003 231 0.002 347 .26 2.67
Sulfate reduction .011 63 .045 15.4 -- -
Carbon dioxide reduction (methanogenesis) .015 46.2 .047 14.7 .23 3.01
30 Oxidation-Reduction Processes in Ground Water at Naval Weapons Industrial Reserve Plant, Dallas, Texas
Oxidation-Reduction Processes in Ground Water at Naval Weapons Industrial Reserve Plant, Dallas, Texas
Appendix—Data Appendix—Data
Appendix—Data 31
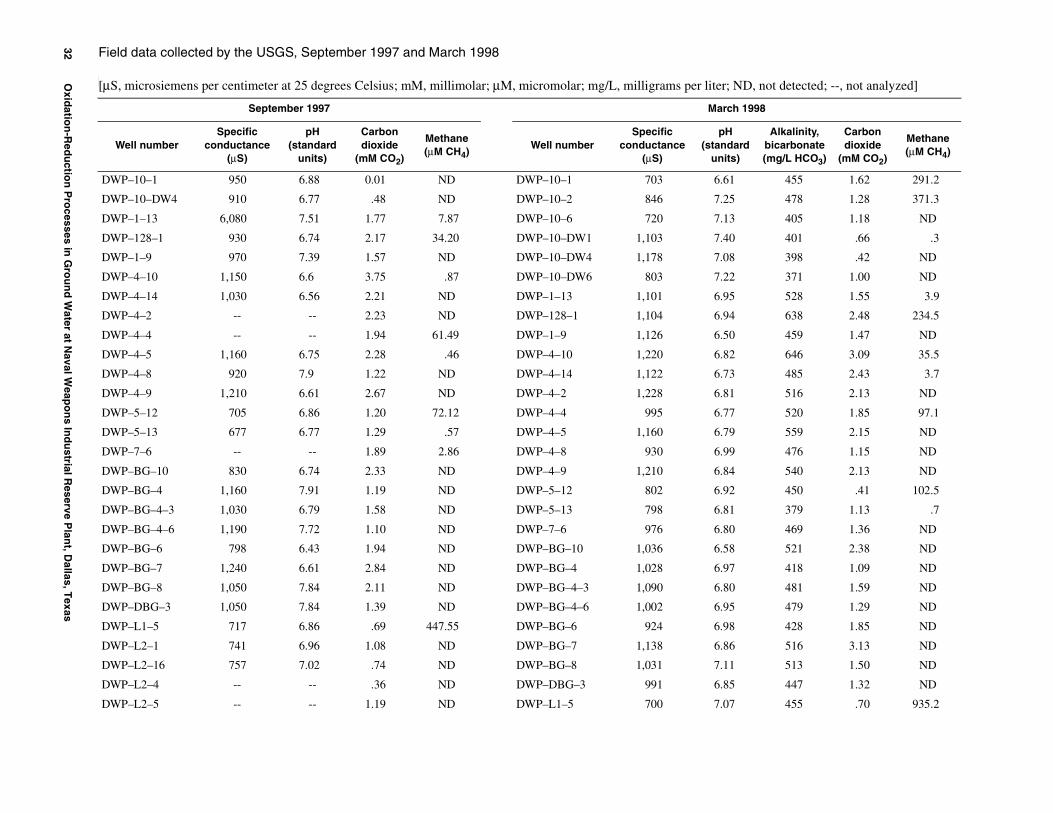
Field data collected by the USGS, September 1997 and March 1998—Continued
32 O
xidatio
n-R
edu
ction
Pro
cesses in G
rou
nd
Water at N
aval Weap
on
s Ind
ustrial R
eserve Plan
t, Dallas, T
exas
Field data collected by the USGS, September 1997 and March 1998
[µS, microsiemens per centimeter at 25 degrees Celsius; mM, millimolar; µM, micromolar; mg/L, milligrams per liter; ND, not detected; --, not analyzed]
September 1997 March 1998
Well number Specific
conductance (µS)
pH (standard
units)
Carbon dioxide
(mM CO2)
Methane (µM CH4)
Well number Specific
conductance (µS)
pH (standard
units)
Alkalinity, bicarbonate (mg/L HCO3)
Carbon dioxide
(mM CO2)
Methane (µM CH4)
DWP–10–1 950 6.88 0.01 ND DWP–10–1 703 6.61 455 1.62 291.2
DWP–10–DW4 910 6.77 .48 ND DWP–10–2 846 7.25 478 1.28 371.3
DWP–1–13 6,080 7.51 1.77 7.87 DWP–10–6 720 7.13 405 1.18 ND
DWP–128–1 930 6.74 2.17 34.20 DWP–10–DW1 1,103 7.40 401 .66 .3
DWP–1–9 970 7.39 1.57 ND DWP–10–DW4 1,178 7.08 398 .42 ND
DWP–4–10 1,150 6.6 3.75 .87 DWP–10–DW6 803 7.22 371 1.00 ND
DWP–4–14 1,030 6.56 2.21 ND DWP–1–13 1,101 6.95 528 1.55 3.9
DWP–4–2 -- -- 2.23 ND DWP–128–1 1,104 6.94 638 2.48 234.5
DWP–4–4 -- -- 1.94 61.49 DWP–1–9 1,126 6.50 459 1.47 ND
DWP–4–5 1,160 6.75 2.28 .46 DWP–4–10 1,220 6.82 646 3.09 35.5
DWP–4–8 920 7.9 1.22 ND DWP–4–14 1,122 6.73 485 2.43 3.7
DWP–4–9 1,210 6.61 2.67 ND DWP–4–2 1,228 6.81 516 2.13 ND
DWP–5–12 705 6.86 1.20 72.12 DWP–4–4 995 6.77 520 1.85 97.1
DWP–5–13 677 6.77 1.29 .57 DWP–4–5 1,160 6.79 559 2.15 ND
DWP–7–6 -- -- 1.89 2.86 DWP–4–8 930 6.99 476 1.15 ND
DWP–BG–10 830 6.74 2.33 ND DWP–4–9 1,210 6.84 540 2.13 ND
DWP–BG–4 1,160 7.91 1.19 ND DWP–5–12 802 6.92 450 .41 102.5
DWP–BG–4–3 1,030 6.79 1.58 ND DWP–5–13 798 6.81 379 1.13 .7
DWP–BG–4–6 1,190 7.72 1.10 ND DWP–7–6 976 6.80 469 1.36 ND
DWP–BG–6 798 6.43 1.94 ND DWP–BG–10 1,036 6.58 521 2.38 ND
DWP–BG–7 1,240 6.61 2.84 ND DWP–BG–4 1,028 6.97 418 1.09 ND
DWP–BG–8 1,050 7.84 2.11 ND DWP–BG–4–3 1,090 6.80 481 1.59 ND
DWP–DBG–3 1,050 7.84 1.39 ND DWP–BG–4–6 1,002 6.95 479 1.29 ND
DWP–L1–5 717 6.86 .69 447.55 DWP–BG–6 924 6.98 428 1.85 ND
DWP–L2–1 741 6.96 1.08 ND DWP–BG–7 1,138 6.86 516 3.13 ND
DWP–L2–16 757 7.02 .74 ND DWP–BG–8 1,031 7.11 513 1.50 ND
DWP–L2–4 -- -- .36 ND DWP–DBG–3 991 6.85 447 1.32 ND
DWP–L2–5 -- -- 1.19 ND DWP–L1–5 700 7.07 455 .70 935.2
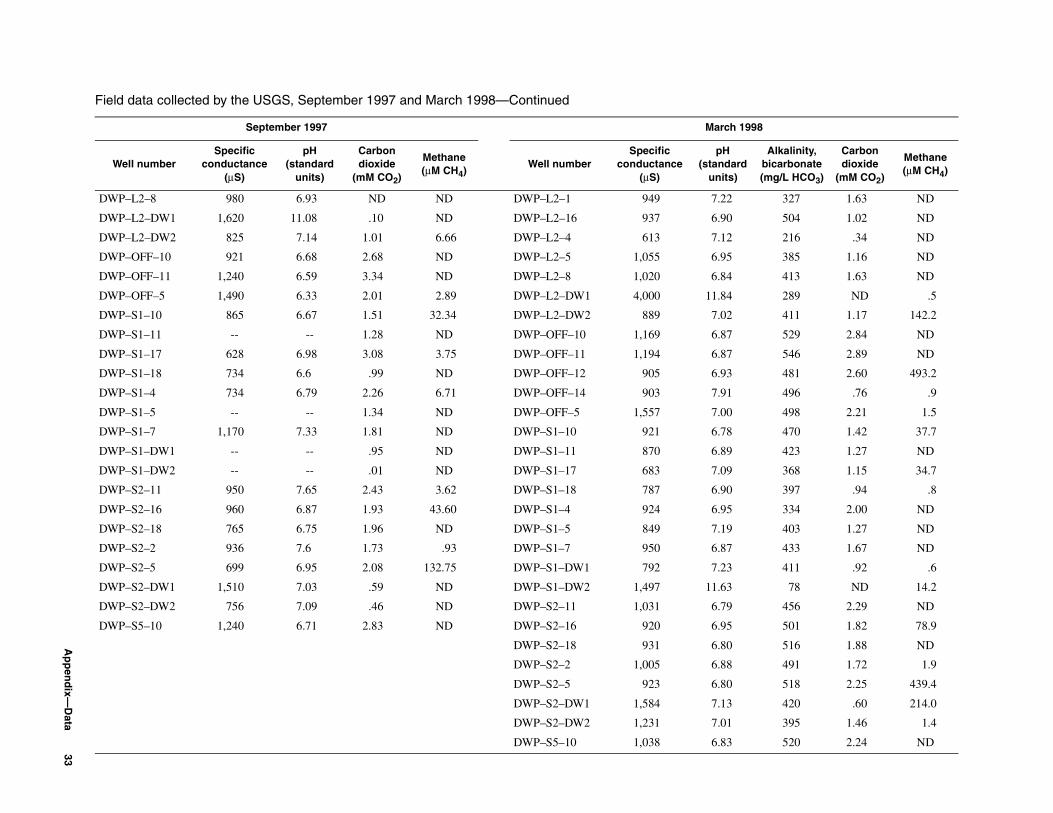
Field data collected by the USGS, September 1997 and March 1998—Continued
September 1997 March 1998
Well number Specific
conductance (µS)
pH (standard
units)
Carbon dioxide
(mM CO2)
Methane (µM CH4)
Well number Specific
conductance (µS)
pH (standard
units)
Alkalinity, bicarbonate (mg/L HCO3)
Carbon dioxide
(mM CO2)
Methane (µM CH4)
DWP–L2–8 980 6.93 ND ND DWP–L2–1 949 7.22 327 1.63 ND
DWP–L2–DW1 1,620 11.08 .10 ND DWP–L2–16 937 6.90 504 1.02 ND
DWP–L2–DW2 825 7.14 1.01 6.66 DWP–L2–4 613 7.12 216 .34 ND
DWP–OFF–10 921 6.68 2.68 ND DWP–L2–5 1,055 6.95 385 1.16 ND
DWP–OFF–11 1,240 6.59 3.34 ND DWP–L2–8 1,020 6.84 413 1.63 ND
DWP–OFF–5 1,490 6.33 2.01 2.89 DWP–L2–DW1 4,000 11.84 289 ND .5
DWP–S1–10 865 6.67 1.51 32.34 DWP–L2–DW2 889 7.02 411 1.17 142.2
DWP–S1–11 -- -- 1.28 ND DWP–OFF–10 1,169 6.87 529 2.84 ND
DWP–S1–17 628 6.98 3.08 3.75 DWP–OFF–11 1,194 6.87 546 2.89 ND
DWP–S1–18 734 6.6 .99 ND DWP–OFF–12 905 6.93 481 2.60 493.2
DWP–S1–4 734 6.79 2.26 6.71 DWP–OFF–14 903 7.91 496 .76 .9
DWP–S1–5 -- -- 1.34 ND DWP–OFF–5 1,557 7.00 498 2.21 1.5
DWP–S1–7 1,170 7.33 1.81 ND DWP–S1–10 921 6.78 470 1.42 37.7
DWP–S1–DW1 -- -- .95 ND DWP–S1–11 870 6.89 423 1.27 ND
DWP–S1–DW2 -- -- .01 ND DWP–S1–17 683 7.09 368 1.15 34.7
DWP–S2–11 950 7.65 2.43 3.62 DWP–S1–18 787 6.90 397 .94 .8
DWP–S2–16 960 6.87 1.93 43.60 DWP–S1–4 924 6.95 334 2.00 ND
DWP–S2–18 765 6.75 1.96 ND DWP–S1–5 849 7.19 403 1.27 ND
DWP–S2–2 936 7.6 1.73 .93 DWP–S1–7 950 6.87 433 1.67 ND
DWP–S2–5 699 6.95 2.08 132.75 DWP–S1–DW1 792 7.23 411 .92 .6
DWP–S2–DW1 1,510 7.03 .59 ND DWP–S1–DW2 1,497 11.63 78 ND 14.2
DWP–S2–DW2 756 7.09 .46 ND DWP–S2–11 1,031 6.79 456 2.29 ND
DWP–S5–10 1,240 6.71 2.83 ND DWP–S2–16 920 6.95 501 1.82 78.9
DWP–S2–18 931 6.80 516 1.88 ND
DWP–S2–2 1,005 6.88 491 1.72 1.9
DWP–S2–5 923 6.80 518 2.25 439.4
DWP–S2–DW1 1,584 7.13 420 .60 214.0
DWP–S2–DW2 1,231 7.01 395 1.46 1.4
DWP–S5–10 1,038 6.83 520 2.24 ND
Ap
pen
dix—
Data
33
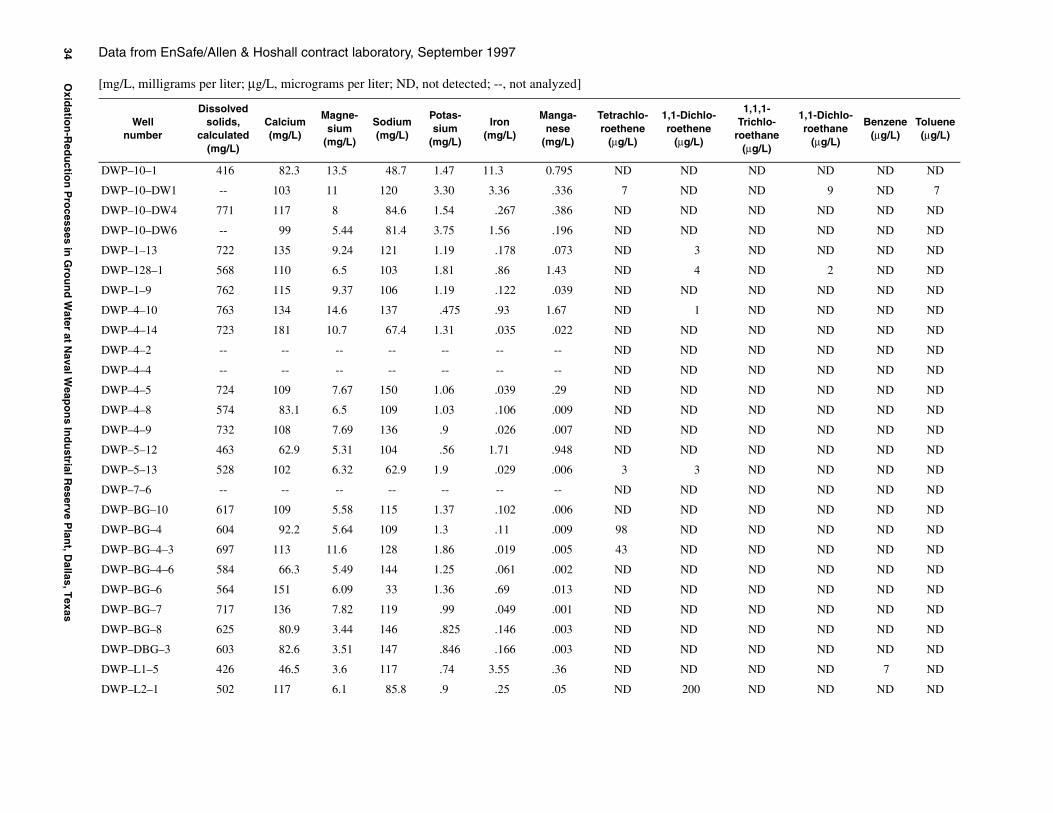
Data from EnSafe/Allen & Hoshall contract laboratory, September 1997—Continued
34 O
xidatio
n-R
edu
ction
Pro
cesses in G
rou
nd
Water at N
aval Weap
on
s Ind
ustrial R
eserve Plan
t, Dallas, T
exas
Data from EnSafe/Allen & Hoshall contract laboratory, September 1997
[mg/L, milligrams per liter; µg/L, micrograms per liter; ND, not detected; --, not analyzed]
Well number
Dissolved solids,
calculated (mg/L)
Calcium (mg/L)
Magnesium
(mg/L)
Sodium (mg/L)
Potassium
(mg/L)
Iron (mg/L)
Manganese
(mg/L)
Tetrachloroethene
(µg/L)
1,1-Dichloroethene
(µg/L)
1,1,1Trichlo
roethane (µg/L)
1,1-Dichloroethane
(µg/L)
Benzene (µg/L)
Toluene (µg/L)
DWP–10–1 416 82.3 13.5 48.7 1.47 11.3 0.795 ND ND ND ND ND ND
DWP–10–DW1 -- 103 11 120 3.30 3.36 .336 7 ND ND 9 ND 7
DWP–10–DW4 771 117 8 84.6 1.54 .267 .386 ND ND ND ND ND ND
DWP–10–DW6 -- 99 5.44 81.4 3.75 1.56 .196 ND ND ND ND ND ND
DWP–1–13 722 135 9.24 121 1.19 .178 .073 ND 3 ND ND ND ND
DWP–128–1 568 110 6.5 103 1.81 .86 1.43 ND 4 ND 2 ND ND
DWP–1–9 762 115 9.37 106 1.19 .122 .039 ND ND ND ND ND ND
DWP–4–10 763 134 14.6 137 .475 .93 1.67 ND 1 ND ND ND ND
DWP–4–14 723 181 10.7 67.4 1.31 .035 .022 ND ND ND ND ND ND
DWP–4–2 -- -- -- -- -- -- -- ND ND ND ND ND ND
DWP–4–4 -- -- -- -- -- -- -- ND ND ND ND ND ND
DWP–4–5 724 109 7.67 150 1.06 .039 .29 ND ND ND ND ND ND
DWP–4–8 574 83.1 6.5 109 1.03 .106 .009 ND ND ND ND ND ND
DWP–4–9 732 108 7.69 136 .9 .026 .007 ND ND ND ND ND ND
DWP–5–12 463 62.9 5.31 104 .56 1.71 .948 ND ND ND ND ND ND
DWP–5–13 528 102 6.32 62.9 1.9 .029 .006 3 3 ND ND ND ND
DWP–7–6 -- -- -- -- -- -- -- ND ND ND ND ND ND
DWP–BG–10 617 109 5.58 115 1.37 .102 .006 ND ND ND ND ND ND
DWP–BG–4 604 92.2 5.64 109 1.3 .11 .009 98 ND ND ND ND ND
DWP–BG–4–3 697 113 11.6 128 1.86 .019 .005 43 ND ND ND ND ND
DWP–BG–4–6 584 66.3 5.49 144 1.25 .061 .002 ND ND ND ND ND ND
DWP–BG–6 564 151 6.09 33 1.36 .69 .013 ND ND ND ND ND ND
DWP–BG–7 717 136 7.82 119 .99 .049 .001 ND ND ND ND ND ND
DWP–BG–8 625 80.9 3.44 146 .825 .146 .003 ND ND ND ND ND ND
DWP–DBG–3 603 82.6 3.51 147 .846 .166 .003 ND ND ND ND ND ND
DWP–L1–5 426 46.5 3.6 117 .74 3.55 .36 ND ND ND ND 7 ND
DWP–L2–1 502 117 6.1 85.8 .9 .25 .05 ND 200 ND ND ND ND
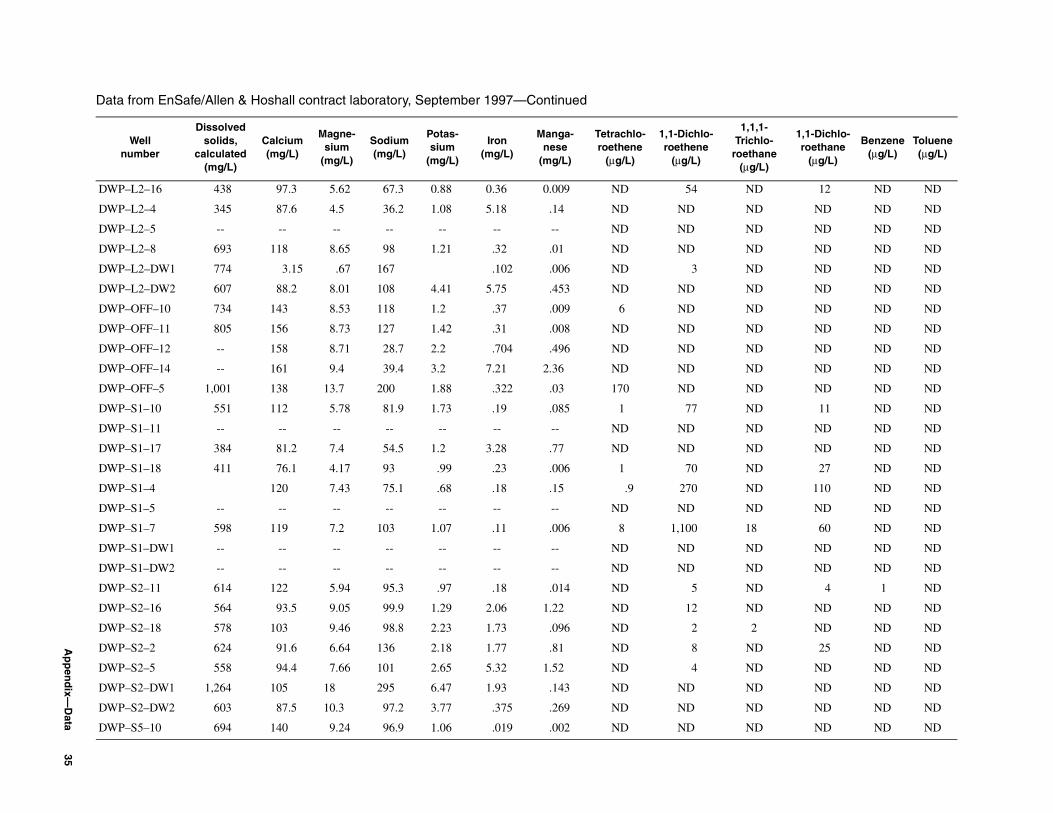
Data from EnSafe/Allen & Hoshall contract laboratory, September 1997—Continued
Ap
pen
dix—
Data
Well number
Dissolved solids,
calculated (mg/L)
Calcium (mg/L)
Magnesium
(mg/L)
Sodium (mg/L)
Potassium
(mg/L)
Iron (mg/L)
Manganese
(mg/L)
Tetrachloroethene
(µg/L)
1,1-Dichloroethene
(µg/L)
1,1,1Trichlo
roethane (µg/L)
1,1-Dichloroethane
(µg/L)
Benzene (µg/L)
Toluene (µg/L)
DWP–L2–16 438 97.3 5.62 67.3 0.88 0.36 0.009 ND 54 ND 12 ND ND
DWP–L2–4 345 87.6 4.5 36.2 1.08 5.18 .14 ND ND ND ND ND ND
DWP–L2–5 -- -- -- -- -- -- -- ND ND ND ND ND ND
DWP–L2–8 693 118 8.65 98 1.21 .32 .01 ND ND ND ND ND ND
DWP–L2–DW1 774 3.15 .67 167 .102 .006 ND 3 ND ND ND ND
DWP–L2–DW2 607 88.2 8.01 108 4.41 5.75 .453 ND ND ND ND ND ND
DWP–OFF–10 734 143 8.53 118 1.2 .37 .009 6 ND ND ND ND ND
DWP–OFF–11 805 156 8.73 127 1.42 .31 .008 ND ND ND ND ND ND
DWP–OFF–12 -- 158 8.71 28.7 2.2 .704 .496 ND ND ND ND ND ND
DWP–OFF–14 -- 161 9.4 39.4 3.2 7.21 2.36 ND ND ND ND ND ND
DWP–OFF–5 1,001 138 13.7 200 1.88 .322 .03 170 ND ND ND ND ND
DWP–S1–10 551 112 5.78 81.9 1.73 .19 .085 1 77 ND 11 ND ND
DWP–S1–11 -- -- -- -- -- -- -- ND ND ND ND ND ND
DWP–S1–17 384 81.2 7.4 54.5 1.2 3.28 .77 ND ND ND ND ND ND
DWP–S1–18 411 76.1 4.17 93 .99 .23 .006 1 70 ND 27 ND ND
DWP–S1–4 120 7.43 75.1 .68 .18 .15 .9 270 ND 110 ND ND
DWP–S1–5 -- -- -- -- -- -- -- ND ND ND ND ND ND
DWP–S1–7 598 119 7.2 103 1.07 .11 .006 8 1,100 18 60 ND ND
DWP–S1–DW1 -- -- -- -- -- -- -- ND ND ND ND ND ND
DWP–S1–DW2 -- -- -- -- -- -- -- ND ND ND ND ND ND
DWP–S2–11 614 122 5.94 95.3 .97 .18 .014 ND 5 ND 4 1 ND
DWP–S2–16 564 93.5 9.05 99.9 1.29 2.06 1.22 ND 12 ND ND ND ND
DWP–S2–18 578 103 9.46 98.8 2.23 1.73 .096 ND 2 2 ND ND ND
DWP–S2–2 624 91.6 6.64 136 2.18 1.77 .81 ND 8 ND 25 ND ND
DWP–S2–5 558 94.4 7.66 101 2.65 5.32 1.52 ND 4 ND ND ND ND
DWP–S2–DW1 1,264 105 18 295 6.47 1.93 .143 ND ND ND ND ND ND
DWP–S2–DW2 603 87.5 10.3 97.2 3.77 .375 .269 ND ND ND ND ND ND
DWP–S5–10 694 140 9.24 96.9 1.06 .019 .002 ND ND ND ND ND ND
35
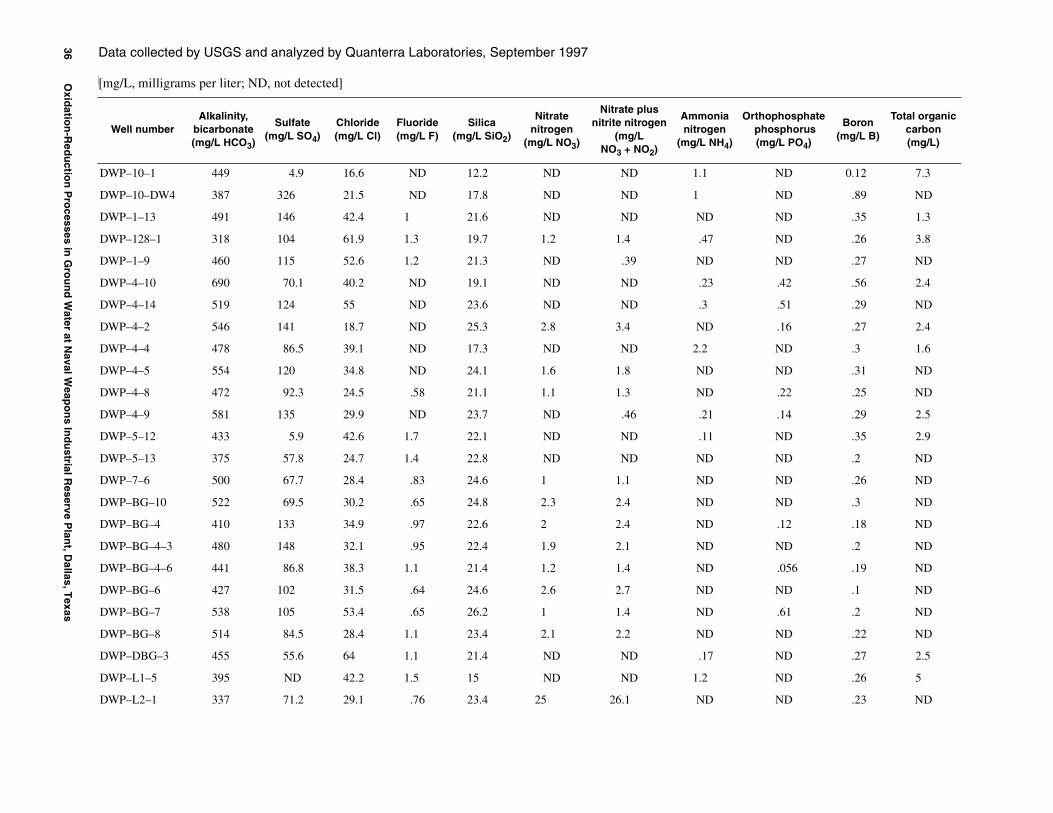
Data collected by USGS and analyzed by Quanterra Laboratories, September 1997—Continued
36 O
xidatio
n-R
edu
ction
Pro
cesses in G
rou
nd
Water at N
aval Weap
on
s Ind
ustrial R
eserve Plan
t, Dallas, T
exas
Data collected by USGS and analyzed by Quanterra Laboratories, September 1997
[mg/L, milligrams per liter; ND, not detected]
Well number Alkalinity,
bicarbonate (mg/L HCO3)
Sulfate (mg/L SO4)
Chloride (mg/L Cl)
Fluoride (mg/L F)
Silica (mg/L SiO2)
Nitrate nitrogen
(mg/L NO3)
Nitrate plus nitrite nitrogen
(mg/L NO3 + NO2)
Ammonia nitrogen
(mg/L NH4)
Orthophosphate phosphorus (mg/L PO4)
Boron (mg/L B)
Total organic carbon (mg/L)
DWP–10–1 449 4.9 16.6 ND 12.2 ND ND 1.1 ND 0.12 7.3
DWP–10–DW4 387 326 21.5 ND 17.8 ND ND 1 ND .89 ND
DWP–1–13 491 146 42.4 1 21.6 ND ND ND ND .35 1.3
DWP–128–1 318 104 61.9 1.3 19.7 1.2 1.4 .47 ND .26 3.8
DWP–1–9 460 115 52.6 1.2 21.3 ND .39 ND ND .27 ND
DWP–4–10 690 70.1 40.2 ND 19.1 ND ND .23 .42 .56 2.4
DWP–4–14 519 124 55 ND 23.6 ND ND .3 .51 .29 ND
DWP–4–2 546 141 18.7 ND 25.3 2.8 3.4 ND .16 .27 2.4
DWP–4–4 478 86.5 39.1 ND 17.3 ND ND 2.2 ND .3 1.6
DWP–4–5 554 120 34.8 ND 24.1 1.6 1.8 ND ND .31 ND
DWP–4–8 472 92.3 24.5 .58 21.1 1.1 1.3 ND .22 .25 ND
DWP–4–9 581 135 29.9 ND 23.7 ND .46 .21 .14 .29 2.5
DWP–5–12 433 5.9 42.6 1.7 22.1 ND ND .11 ND .35 2.9
DWP–5–13 375 57.8 24.7 1.4 22.8 ND ND ND ND .2 ND
DWP–7–6 500 67.7 28.4 .83 24.6 1 1.1 ND ND .26 ND
DWP–BG–10 522 69.5 30.2 .65 24.8 2.3 2.4 ND ND .3 ND
DWP–BG–4 410 133 34.9 .97 22.6 2 2.4 ND .12 .18 ND
DWP–BG–4–3 480 148 32.1 .95 22.4 1.9 2.1 ND ND .2 ND
DWP–BG–4–6 441 86.8 38.3 1.1 21.4 1.2 1.4 ND .056 .19 ND
DWP–BG–6 427 102 31.5 .64 24.6 2.6 2.7 ND ND .1 ND
DWP–BG–7 538 105 53.4 .65 26.2 1 1.4 ND .61 .2 ND
DWP–BG–8 514 84.5 28.4 1.1 23.4 2.1 2.2 ND ND .22 ND
DWP–DBG–3 455 55.6 64 1.1 21.4 ND ND .17 ND .27 2.5
DWP–L1–5 395 ND 42.2 1.5 15 ND ND 1.2 ND .26 5
DWP–L2–1 337 71.2 29.1 .76 23.4 25 26.1 ND ND .23 ND

Data collected by USGS and analyzed by Quanterra Laboratories, September 1997—Continued
Ap
pen
dix—
Data
Well number Alkalinity,
bicarbonate (mg/L HCO3)
Sulfate (mg/L SO4)
Chloride (mg/L Cl)
Fluoride (mg/L F)
Silica (mg/L SiO2)
Nitrate nitrogen
(mg/L NO3)
Nitrate plus nitrite nitrogen
(mg/L NO3 + NO2)
Ammonia nitrogen
(mg/L NH4)
Orthophosphate phosphorus (mg/L PO4)
Boron (mg/L B)
Total organic carbon (mg/L)
DWP–L2–16 271 75.4 33.7 0.82 22.3 14.8 15.6 ND ND 0.18 ND
DWP–L2–4 218 42.7 37.3 .79 20.9 3.2 3.5 ND ND .18 ND
DWP–L2–5 386 108 59 ND 25.1 8.4 9.5 ND ND .25 ND
DWP–L2–8 682 79.3 20.5 1.5 25.8 ND ND .93 ND .37 2.9
DWP–L2–DW1 406 128 41.5 ND 27.6 3.9 4.2 ND ND .21 ND
DWP–L2–DW2 497 60 54.2 2.5 29.8 ND ND ND ND .31 11.9
DWP–OFF–10 528 107 66.6 .68 25.2 2.8 3.1 ND ND .19 ND
DWP–OFF–11 538 123 95.2 ND 24.4 1.5 1.8 ND .091 .19 1
DWP–OFF–5 495 278 96.1 ND 25.8 2.3 2.7 ND .18 .22 ND
DWP–S1–10 425 71.8 43.3 ND 21.5 2.1 2.5 ND ND .22 ND
DWP–S1–11 422 88.7 21.3 .65 21.9 ND .25 ND ND .58 ND
DWP–S1–17 348 25.5 18.1 1.6 17.9 ND .12 .87 ND .18 2.3
DWP–S1–18 271 54.8 22.9 .83 23.2 2 2.4 ND ND .22 ND
DWP–S1–4 372 62.9 33.8 1.3 25.5 ND ND ND ND .2 ND
DWP–S1–5 398 59.8 35.1 1.4 23.2 1.7 2.1 ND ND .21 ND
DWP–S1–7 442 85.5 35.1 .75 26.2 1.5 1.9 .5 ND .21 1.1
DWP–S1–DW1 247 55.7 27.7 .89 21.9 ND ND .89 ND .52 4.7
DWP–S1–DW2 420 61.6 19 ND 20.2 ND ND .32 ND .6 ND
DWP–S2–11 488 75.8 45 ND 24.5 ND .35 ND ND .22 ND
DWP–S2–16 494 60 30.4 .64 19.1 ND ND .42 .12 .21 ND
DWP–S2–18 520 59.2 21.3 .83 22.3 ND .12 .41 .57 .23 ND
DWP–S2–2 520 65 38.7 .78 21 ND ND .21 .41 .27 ND
DWP–S2–5 513 32.3 39.1 .59 18 ND ND 1.9 .18 .21 1.9
DWP–S2–DW1 389 594 32.3 1.8 16.5 ND ND 1.4 ND 1.7 11.7
DWP–S2–DW2 293 220 21.2 .69 15.4 ND ND .37 .083 .42 ND
DWP–S5–10 494 130 45.4 .65 24.4 1.6 1.8 ND .094 .18 ND
37
Jones, Braun, and Lee— Oxidation-Reduction Processes in Ground Water at Naval Weapons —USGS WRIR 03–4046Industrial Reserve Plant, Dallas, Texas