oxnard, california - state water resources control board
TRANSCRIPT

Reliant Energy, Inc.
Oxnard, California
Proposal for Information Collection for Ormond Generating Facility
ENSR International
October 2005
Document Number 10267-023-100

October, 2005
Proposal for Information Collection for Ormond Generating Facility
ENSR Document No. 10287-023-100
October 2005
Prepared for
Reliant Energy, Inc.
Oxnard, California
ENSR International 1220 Avenida Acaso
Camarillo, California 93012

October, 2005 i
CONTENTS
EXECUTIVE SUMMARY…………………………………………………………………………………..ES-1
1.0 INTRODUCTION ............................................................................................................... 1-1
1.1 Goals, Process, and Timing of the Rule ..................................................................... 1-3
1.2 CDS Schedule........................................................................................................... 1-5
1.3 Specific Goals of this PIC .......................................................................................... 1-5
1.4 Review of Document Organization............................................................................. 1-6
2.0 SOURCE WATER BODY INFORMATION......................................................................... 2-1
2.1 Source Water Body Flow Information......................................................................... 2-1
2.2 Source Water Body Physical Data ............................................................................. 2-1
3.0 TECHNOLOGIES, OPERATIONAL, AND RESTORATION MEASURES........................... 3-1
3.1 USEPA’s Baseline Configuration for Estimating the Calculation Baseline ................... 3-1
3.2 In-place Technologies, Operational Measures............................................................ 3-2 3.2.1 Review of Existing Technologies, Operational Measures, and Restoration
Measures........................................................................................................ 3-2 Restoration Measures ............................................................................................... 3-4 3.2.2 Performance Estimates ................................................................................... 3-4
3.3 Potential Technologies, Operational Measures, and Restoration Measures................ 3-5 3.3.1 Review of Technologies................................................................................... 3-8 3.3.2 Review of Operational Measures ................................................................... 3-15 3.3.3 Review of Restoration Measures ................................................................... 3-16 3.3.4 Estimate of Technology and Operational Measures Costs and Effectiveness.. 3-18 3.3.5 EPA’s Appraisal of Technologies ................................................................... 3-19
3.4 Selection of Proposed Technologies, Operational and Restoration Measures........... 3-19
4.0 HISTORICAL STUDY REVIEW ......................................................................................... 4-1

CONTENTS (Cont’d)
October, 2005 ii
4.1 Historical Biological and Physical Data....................................................................... 4-1
4.2 Summary of Historical Impingement and Entrainment Rates ...................................... 4-2
4.3 Assessment of Data Sufficiency................................................................................. 4-5
5.0 AGENCY CONSULTATIONS ............................................................................................ 5-1
5.1 Section 316(b)-Specific Consultations........................................................................ 5-1
5.2 Other Relevant Consultations .................................................................................... 5-1
6.0 PROPOSED COMPLIANCE APPROACH ......................................................................... 6-1
6.1 Outline of CDS Activities............................................................................................ 6-2
6.2 Review of CDS Approach .......................................................................................... 6-3
6.3 Schedule................................................................................................................... 6-4
7.0 PROPOSED SAMPLING PLAN......................................................................................... 7-1
7.1 Impingement Sampling Plan...................................................................................... 7-1
7.2 Entrainment Sampling Plan – In-Plant........................................................................ 7-2
7.3 Ambient Sampling Plan ............................................................................................. 7-3
APPENDIX A TECHNOLOGY REVIEW
APPENDIX B REVIEW OF ORMOND BEACH FISHERIES
APPENDIX C EPA COST ESTIMATE
APPENDIX D SAMPLING PLAN

October, 2005 iii
LIST OF TABLES
Table 3-1 Summary of the Ormond CWIS..........................................................................................3-3
Table 3-2 Estimated CWIS Performance............................................................................................3-6
Table 3-3 Review of Potential Measures ............................................................................................3-9
Table 4-1 Assessment of Data Sufficiency .........................................................................................4-7
LIST OF FIGURES
Figure 2-1: Station Location ..................................................................................................... 2-3
Figure 2-2: Estimated Zone of Hydraulic Influence of the CWIS ................................................ 2-4

October, 2005 ES-1
EXECUTIVE SUMMARY
Reliant Energy Incorporated’s Ormond Beach generating station (Ormond) is subject to both the impingement mortality and entrainment performance goals under the Clean Water Act Section 316(b) Phase II Rule (Rule). This Proposal for Information Collection (PIC) is developed as part of Reliant’s obligations under the Phase II Rule.
We have undertaken a substantial data collection and review effort in support of this PIC. This review has included evaluation of past and current biological, technical, and operational data. The data provide a detailed understanding of the ambient environment from which Mandalay draws its cooling water, the volumes of water withdrawn, and the levels of impingement and entrainment. In addition, we have reviewed the range of potential technologies that exist to reduce impingement mortality and entrainment and have evaluated the potential applicability of each of these technologies to Mandalay. We have also examined how the design and operation of the existing facilities relate to the calculation baseline defined in the Rule. By establishing a calculation baseline, the Rule allows credit for any actions taken previously in the design or operation of the facility to minimize the potential for adverse environmental impact.
The scope of this document extends beyond the direct requirements of the PIC as outlined within the Rule. We believe that this broader review was important to allow sharing of early findings on the practicable compliance alternatives and to clarify those that will be subject to detailed evaluation as part of the required Comprehensive Demonstration Study (CDS). This approach is consistent with the request by Los Angeles Regional Water Quality Board (LARWQCB) staff to report preliminary information and findings as part of the PIC. We therefore have identified the likely compliance alternatives to be pursued and the additional data and supporting reports required to comprehensively demonstrate that these alternatives, or combination of alternatives, are viable.
The Comprehensive Demonstration Study will consider all relevant factors, including:
• The specific mandates of the Rule;
• The feasibility, reliability, costs and effectiveness of alternative technologies and measures;
• The nature of the losses at the cooling water intake structure; and
• The potential to propose restoration measures to offset adverse environmental impact within the watershed.

October, 2005 ES-2
ENSR International (ENSR), which has extensive biological and engineering qualifications relevant to this purpose, has provided the technical support for this assessment. The following paragraphs provide a general overview of the facility and highlight the key observations and current findings.
The Ormond station consists of two generating units. The two units employ open cycle cooling therefore the Ormond station has one CWIS regulated by the Phase II Rule. The open cycle units have a submerged offshore intake and obtain water from the Pacific Ocean. The cooling water intake structure (CWIS) is located approximately 1,950 feet offshore in 35 feet of water.
Rates of impingement were evaluated by a number of studies completed in the 1970s and early 1980s and renewed during the last eight years. The CWIS configuration and operation during these studies was essentially the same as is in place today. The earlier studies found that queenfish comprised over half of impinged fish (54.2%), with the next most common species being white croaker (14.9%); walleye surfperch (7.1%); northern anchovy (6.7%); Pacific butterfish (5.3%), white surfperch (5.9%), shiner surfperch (2.4%), and kelp bass (0.2%). The more recent studies found that the dominant species are the same as those encountered in the earlier studies with queenfish still comprising the majority of impinged fish (52%); and the next most common fish being white croaker (1.0%), walleye surfperch (5.0%); northern anchovy (20.7%); Pacific butterfish (4.6%), white surfperch (2.7%), shiner surfperch (12.4%), and kelp bass (0.3%) among the 91 species of fish counted.
We believe that the combined historical and ongoing more recent data represent a robust dataset to assess impingement rates and patterns at Ormond.
The frequency and nature of entrained organisms were also measured during the 1970s. The estimated entrainment rates were dominated by 316(b) target species including northern anchovy (41.8%), white croaker (33.8%), and queenfish (8.2%). It should be noted that only ichthyoplankton were sampled for; invertebrate zooplankton were not included in the entrainment studies. While Reliant believes that the data set is generally representative of conditions at the CWIS, we have proposed an additional year of impingement and entrainment monitoring to augment the existing data.
Two important aspects of the operation and design of the Ormond station’s cooling water system suggest that potential rates of impingement mortality and entrainment are far less than the calculation baseline condition: water is withdrawn through a velocity cap and the intake is located offshore. In fact, Reliant believes that the impingement mortality goal is likely to be met by the combination of these two factors. While entrainment may be reduced somewhat due to lower ambient densities of entrainable organisms roughly 1,950 feet from shore, the extent of the reduction is uncertain and may not allow full conformance with goals of the Rule.

October, 2005 ES-3
In assessing the potential costs of the Phase II Rule, the Environmental Protection Agency (EPA) assumed that the Ormond station was essentially compliant and that no additional capital or operation/maintenance costs would need to be expended at the station. This cost (i.e., $0) serves as the basis of the Cost-cost test that might be pursued under the Site-Specific Best Technology Available assessment provided for by the Rule. For a variety of reasons (provided in Appendix C and discussed in Section 3 of this PIC), Reliant believes that many of the available control technologies are likely to have limited applicability to Ormond and, even where suitable, clearly exceeds the zero cost that EPA has identified. This EPA cost estimate serves as the benchmark should a site-specific Best Technology Available (BTA) assessment be undertaken, either though the cost/cost or cost/benefit provisions on the Rule.
As noted, this PIC provides a detailed review of available control technologies and concludes that most are not likely to be feasible or effective at significantly reducing impingement mortality and entrainment. Three technologies and operational measures will be retained for further analysis as part of the CDS: acoustic deterrence, reduction in heat treatment frequency and duration, and restoration. Based on our preliminary review, one or more of these measures have the potential to be demonstrated as practicable for minimizing adverse environmental impacts (AEI) at the Mandalay plant.
Given the available impingement and entrainment data, Reliant proposes to supplement that dataset by intensive sampling in 2006 for both impingement and entrainment. The biological field data collection effort has been designed to explicitly address the requirements of the Rule to characterize baseline rates and to confirm the suitability of the candidate technology, operating and restoration alternatives.
The CDS will ultimately identify and demonstrate the appropriateness of the future proposed compliance path. Reliant is not in a position to select a final compliance alternative at this time. In fact, different alternatives or combination of alternatives are likely to manifest themselves as a result of these detailed research efforts. However, these candidate alternatives are defined generally as follows In the language of the Rule:
• Compliance Alternative 2: Demonstration that the current technologies and measures achieve the performance goals. The contributing factors include the location of the CWIS and use of a velocity cap. These potential credits will be evaluated in combination with new measures adopted under Compliance Alternative 3, below.
• Compliance Alternative 3: Demonstrate that currently used and newly adopted technologies and measures achieve the performance goals. Three potential technologies and measures (e.g., acoustic deterrence, reduction in heat treatment frequency, additional restoration measures) will be evaluated further as part of the CDS and may be adopted to
October, 2005 ES-4
contribute toward additional control. Of the potential measures, we believe that restoration is likely to be the most cost-effective. Reliant has been an active participant in projects in the vicinity of our two Ventura County power plants. These projects have included efforts to preserve and restore coastal wetlands and to restock impacted white sea bass and white abalone. Based on our experience and understanding of the local environmental concerns, we believe that restoration would have substantial and continuing beneficial effects within the watershed that would be more effective than flow reduction and filtering technologies in minimizing adverse environmental impact. While discretionary, restoration also offers the flexibility to address watershed priorities for critical species that are impacted by other factors, such as the noted efforts to restore white abalone and sea bass. We also recognize that the restoration provision in currently undergoing court challenge. The decision of the court on this matter is not expected until probably the middle of next year. CDS development will be undertaken such that contingencies are identified in the event that the court acts to overturn the current restoration provision.
• Compliance Alternative 5: Define a site-specific Best Technology Available (BTA). This alternative is based on demonstrating that fully achieving the performance goals will be significantly more costly than the EPA’s estimate of the cost of compliance or of the determined monetized benefit of compliance. Consistent with the Rule, control measures will be identified under this alternative that achieve compliance as close as practicable to the performance benchmarks identified in the Rule.
Reliant and its technical consultants will continue to evaluate and update the alternatives as data and analyses become available. We view the PIC and related process to be an iterative process and, as such, we anticipate continuing our coordination with the LARWQCB, the LAR 316(b) stakeholder group, and others throughout this development process.

October, 2005 1-1
1.0 INTRODUCTION
Reliant Energy Incorporated’s (Reliant) Ormond Beach generating station (Ormond) is located approximately 3 miles northwest of the Mugu Lagoon and approximately 2½ miles southeast of the entrance to Port Hueneme. The station consists of two units and has a combined rated capacity of 1,500 megawatts (MW). Because both of the facility’s units use cooling water from the Pacific Ocean in excess of 50 million gallons per day (MGD), the facility is regulated by the Phase II Rule developed under the Clean Water Act’s Section 316(b). By virtue of its capacity utilization rate (i.e., greater than 15%) and its presence on an ocean, Ormond station is subject to the Rule’s performance goals for both impingement mortality and entrainment.
The goals of this Proposal for Information Collection (PIC) for Ormond station include the following:
• Address the requirements of the Code of Federal Regulations (CFR), Title 40, Section 125.95(b)(1); and
• Facilitate the compliance process by describing Reliant’s proposed approach.
40 CFR Section 125.95(b)(1) describes the PIC requirements as follows:
“You must submit to the Director for review and comment a description of the information you will use to support your Study. The Proposal for Information must be submitted prior to the start of information collection activities, but you may initiate such activities prior to receiving comment from the Director. The proposal must include:
(i) A description of the proposed and/or implemented technologies, operational measures, and/or restoration measures to be evaluated in the Study;
(ii) A list and description of any historical studies characterizing impingement mortality and entrainment and/or physical and biological conditions in the vicinity of the cooling water intake structures and their relevance to this proposed Study. If you propose to use existing data, you must demonstrate the extent to which the data are representative of current conditions and that the data were collected using appropriate quality assurance/quality control procedures;
(iii) A summary of any past or ongoing consultations with appropriate Federal, State, and Tribal fish and wildlife agencies that are relevant to this Study and a copy of written comments received as a result of such consultations; and
(iv) A sampling plan for any new field studies you propose to conduct in order to ensure that you have sufficient data to develop a scientifically valid estimate of impingement

October, 2005 1-2
mortality and entrainment at your site. The sampling plan must document all methods and quality assurance/quality control procedures for sampling and data analysis. The sampling and data analysis methods you propose must be appropriate for a quantitative survey and include consideration of the methods used in other studies performed in the source waterbody. The sampling plan must include a description of the study area (including the area of influence of the cooling water intake structure(s)), and provide a taxonomic identification of the sampled or evaluated biological assemblages (including all life stages of fish and shellfish).”
The following tabulation provides the section of the PIC where each of the above mentioned regulatory requirements are presented.
Regulatory Requirement PIC Section
§ 125.95(b)(1)(i) – Review of Measures and Technologies 3.0
§125.95(b)(1)(ii) – Historical Studies 4.0
§ 125.95(b)(1)(iii) – Agency Consultations 5.0
§ 125.95(b)(1)(iv) – Proposed Sampling Plan 7.0
The Phase II Rule allows for significant discretion by the Los Angeles Regional Water Quality Control Board (LARWQCB) Director during the implementation process. In fact, the Rule allows for flexibility in the compliance approach taken at a facility by including several specific criteria associated with assessing compliance including:
• Which species and life stages upon which to base the compliance assessment;
• Whether to base the assessment on numbers of individuals or biomass;
• The specifics of estimating the Calculation Baseline condition;
• The averaging period to use in estimating the Calculation Baseline or assessing compliance;
• The ability to discount “unavoidable, episodic impingement or entrainment events” in the assessment of performance;

October, 2005 1-3
• The specific design parameters (e.g., slot size) for the cooling water intake structure (CWIS);
• The need for, and nature of, peer review for assessment of restoration and/or monetized benefits;
• The need for additional information collection to support the CDS;
• The nature of the Technology Installation and Operation Plan;
• The nature of Approved Technology (i.e., Compliance Alternative 4);
• The definition of “significantly greater” under site-specific Best Technology Available (BTA) (Compliance Alternative 5); and
• The timing of the component reports of the CDS.
Reliant believes that this level of discretion allows the LARWQCB to oversee a focused and efficient compliance program to:
• Assess the current performance of the CWIS and operation/restoration measures;
• Review the alternative measures to determine those that are feasible and cost effective;
• If appropriate, implement cost-effective measures; and
• Develop a CDS within the context of one of the Rule’s Compliance Alternatives.
Toward this end, Reliant has prepared this PIC that both addresses the requirements of the Rule and defines Reliant’s recommended Phase II compliance program for the Ormond station.
1.1 Goals, Process, and Timing of the Rule
The U.S. Environmental Protection Agency (EPA) has produced final regulations under Clean Water Act Section 316(b) that establish performance standards for existing CWIS for electricity generators using in excess of 50 million gallons per day (MGD). The Phase II Rule was published in the Federal Register on July 9, 2004 and became effective on September 7, 2004.
The Phase II Rule calls for a 60 to 90 percent reduction in entrainment and an 80 to 95 percent reduction in impingement mortality from the “calculation baseline,” essentially the entrainment and impingement mortality rates at a similarly sized once-through shoreline CWIS with no impingement and/or entrainment reduction controls at the same location. These rates of

October, 2005 1-4
protection are deemed by EPA to be “commensurate with closed cycle cooling.” There is no requirement for power plants to adopt closed-cycle cooling. The Rule also provides for site-specific BTA in the event that site specific costs of compliance are “significantly greater” than either the costs estimated by EPA for the station or for the monetized benefits of compliance at the station.
The Rule allows for five different means of demonstrating compliance with the requirements of the Rule.
• Compliance Alternative 1: Flow Reduction. Under Option 1(a) the facility owner can demonstrate that it uses closed-cycle cooling to show compliance with the Rule. Alternatively, if the through-screen velocity can be shown to be less than or equal to 0.5 ft/s, the performance goals relative to impingement mortality will be deemed to be met under Option 1(b). This latter approach does not address the potential entrainment performance goals, if applicable.
• Compliance Alternative 2: Demonstrate that the current system achieves the relevant goals. Through the execution of a CDS, the plant can show that it is currently meeting the performance goals through some combination of technologies as well as operation and restoration measures.
• Compliance Alternative 3: Demonstrate that a newly installed and operated system (i.e., technology and operation/restoration measures) will meet the goals. Again, through development of a CDS, the plant can design and implement a set of controls estimated to achieve the performance goals.
• Compliance Alternative 4: Install and operate an approved technology. As part of the Rule, EPA designated wedge wire screens in a riverine environment as an approved technology. Proper installation and operation of this technology will meet the goals of the Rule. NPDES Permit Directors have the ability to designate other technologies as “Approved.” Note that there is no currently approved technology applicable to Ormond station.
• Compliance Alternative 5: Site-Specific BTA. Under this option, the facility can show that the actual costs of compliance are “significantly greater” than either the costs or benefits assumed by EPA. Under this option, the plant is still required to pursue “cost-effective measures.”
These various options are each associated with differing requirements relative to the CDS. Under Option 1(a), no CDS is required for assessment of impingement mortality, while under some of the other options, relatively extensive analyses may be required along with submittal of several documents.

October, 2005 1-5
1.2 CDS Schedule
The Ormond station’s current NPDES permit expires on May 10, 2006. Thus, the NPDES permit renewal application and, potentially the CDS, will be filed on or before November 1, 2005. Given Reliant’s proposed compliance approach it is unlikely that the CDS will be completed so that it can be submitted by that date. The Rule allows for request of a compliance schedule that partly decouples the NPDES permit application and the CDS. Under this scenario, Reliant can request a compliance schedule that allows the submission of the CDS no later than January 7, 2008. Reliant will request a compliance schedule.
1.3 Specific Goals of this PIC
The Ormond station is affected by both the impingement and entrainment performance goals of the Phase II Rule.
Reliant has three measures in-place to mitigate impingement mortality and entrainment at Ormond station:
• The use of a velocity cap;
• Location of the cap 2,100 feet offshore in a area that generally has lower population densities than on shore; and
• Implementation of restoration measures including rearing and stocking of white abalone
and white sea bass as well as wetlands restoration.
Reliant believes that no additional technology or operational measure available to reduce impingement mortality and/or entrainment is likely to be feasible and cost-effective at Ormond. This conclusion is based on the analyses presented in the following sections of this document. There are substantial technical difficulties with many of the potential technologies in particular the difficulty of returning impinged organisms to the ocean given the setting of the facility. Some technologies or actions may be cost-effective (e.g., restoration, reduction of frequency of heat treatment of the CWIS) and Reliant has retained them for further assessment as part of the CDS.
Reliant proposes to evaluate the various Compliance Alternatives as more data and analyses become available. Reliant anticipates selecting some combination of Compliance Alternatives 2, 3, and 5 for reducing/mitigating impingement mortality and entrainment.

October, 2005 1-6
1.4 Review of Document Organization
Data on the physical configuration, flow, and water quality of the Pacific Ocean are presented in Section 2. Discussion of existing and potential additional technologies and measures to mitigate impingement mortality and entrainment are presented in Section 3. The nature of historical studies and the resulting data are summarized in Section 4. The potential utility of these data to support the CDS is also discussed. Section 5 presents a review of relevant agency consultations. Reliant’s proposed compliance approach is summarized in Section 6. Section 7 presents the proposed sampling workplan.
The PIC document is also supported by appendices that:
(1) Provides a general review of impingement mortality and entrainment mitigation measures (Appendix A);
(2) Reviews the general nature of the fisheries of the Pacific Ocean including the station-specific data (Appendix B);
(3) Presents the EPA’s estimated cost of compliance as summarized in the Phase II Rule (Appendix C);
(4) Provides details on the proposed sampling procedures (Appendix D).

October, 2005 2-1
2.0 SOURCE WATER BODY INFORMATION
This PIC provides the LARWQCB with information regarding the circumstances that affect operation and performance of the current Ormond station CWIS, the potential additional measures to reduce impingement mortality and entrainment, and the compliance approach that Reliant proposes to pursue. All three of these issues may be affected by either the source water body flow rate or the physical configuration of the source water. Reliant believes that it would be productive to consider the relevance of these issues as part of the PIC, although the Rule anticipates their discussion either as a separate part of the CDS (i.e., the Source Water Body Flow Information – 40 CFR 125.95(b)(2) or the NPDES application itself (i.e., the Source Water Body Physical Data Report - 40 CFR 122.21(r)(2)). In order to facilitate LARWQCB evaluation of these data, Reliant has slightly expanded the scope of the PIC to include the discussion here.
2.1 Source Water Body Flow Information
The Phase II Rule requires consideration of Source Water Body Flow Information (40 CFR 125(b)(2)) under two circumstances:
(1) The CWIS is on a river or stream and the proportion of river flow taken in by the CWIS is an important potential threshold for the performance goals; and
(2) The CWIS is on a lake or reservoir and a proposed expansion of the CWIS flow might adversely impact the stratification of the water body.
Neither of these circumstances applies at Ormond Station. It is located on an ocean and it is clearly affected by both of the Rule’s performance goals. No expansion in the CWIS flow is anticipated at Ormond.
2.2 Source Water Body Physical Data
The Phase II Rule requires, as part of the NPDES permit application submission, the following information to support Phase II compliance:
(1) A narrative description and scaled drawings showing the physical configuration of all source water bodies used by your facility, including aerial dimensions, depths, salinity and temperature regimes, and other documentation that supports your determination of the waterbody type where each CWIS is located;
(2) Identification and characterization of the source waterbody’s hydrological and geomorphological features, as well as methods used to conduct any physical studies to

October, 2005 2-2
determine the intake’s area of influence within the waterbody and the results of such studies; and
(3) Locational maps.
Ormond station is located several hundred yards from the Pacific Ocean and approximately 2½ miles southeast of the entrance to Port Hueneme and 3 miles northwest of the Mugu Lagoon (see Figure 2-1). The Ormond station CWIS is located at the end of a 1,950 foot intake pipe originating from the shore. The cooling water discharge is at the end of an approximately 1,790 foot pipe that extends away from shore parallel and a few hundred feet to the southeast of the intake pipe.
The physical configuration of the CWIS is that of a capped riser pipe that allows water to enter laterally in every direction but not vertically (i.e., a velocity cap). The zone of hydraulic influence has been estimated to be that area in which the water velocity induced by the intake exceeds the ambient velocity.
Maps of surficial ocean currents that were available for the western Santa Barbara Channel indicate a cyclonic, largely counterclockwise flow pattern that is strongest during the spring through fall and weakest during winter (Nishimoto and Washburn, 20021). The current measurements, developed using high frequency radar to measure approximately the upper 1 meter of the water column, indicated nearshore velocities of approximately 10 cm/sec (0.32 ft/sec) during late spring and early summer. These currents are assumed to represent the high end of the range of velocities in the vicinity of the Reliant facility. Surficial water velocities were available from the Mandalay CODAR (Coastal Ocean Dynamics Applications Radar) station (longitude -119.2563, latitude 34.1978) indicate a similar velocity. Measurements at the station, located approximately 600 meters offshore, indicate an average surficial velocity of 0.16 ft/sec to the south-southeast during May 2003; however, deeper current velocities could be much less (personal communication, Brian Emery UCSB). A substantially lower velocity of 0.05 ft/sec is assumed to represent wintertime conditions and therefore act as the low end of the range of velocities in the immediate vicinity of the intake structure. This velocity of 0.05 ft/sec is used for comparison to induced intake velocities.
As the circular cross-sectional area available for the induced flow increases beyond the end of the intake pipe, the ambient velocity will tend to overcome the induced velocity. The estimated surface at which the ambient velocity of 0.05 ft/s exceeds the induced velocity is shown in Figure 2-2.
1 Nishimoto, M.M. and Washburn, L., 2002. Patterns of coastal eddy circulation and abundance of pelagic juvenile fish in the Santa Barbara Channel, California, USA. Marine Ecology Progress Series. Vol. 241:183-199.

� � � � � � � �
� � � � � � � � � � � � � � � � � � � � � � � � � � � � � � � �
� � � � � � � � � � � � � � � � � � � � � � � � �
� � � ! " # � � � � $ � � � � � �
� � � % � � & � � � # � � � � � ' ( � ) � � � � � � � *
� � � � # � � � + � , - . , + �
� / � ) 0 � � � ! " #
1 � 2 � ) � � & % � ! � � + - � 3 4 + � � 4 � + +
� � � � � � � � � � � 3 � � � $ � % � � � 5 � 6 � � � 6 / � ) � 7 % � � � � ( � � � � � � � � �
� � � � � � � � � � � � �8 � � � � � 3 � � + 3 9 � - � 9 9
8 � � � � � � . � � � + 9 � - : 9 9
� � � 0 �

Figure 2-1 Estimated Zone of Hydraulic Influence of the CWIS

October, 2005 2-5
This estimate is made at low tide with the assumption that the average water depth in the vicinity of the velocity cap is 30 feet.
The cooling water used by the Ormond station is likely to be typical of ambient coastal water in the area: the salinity will be typical of coastal ocean water and the temperature will be close to ambient conditions. To date, Reliant has acquired only limited site-specific water quality data. Water quality will not directly affect application of the Rule (e.g., the station clearly uses seawater well above the Rule’s threshold of 0.5 ppt) nor is reduced water quality likely to be found to affect the biological community. Despite this, Reliant will provide a brief survey of the water quality in the area of the velocity cap as part of the CDS.

October, 2005 3-1
3.0 TECHNOLOGIES, OPERATIONAL, AND RESTORATION MEASURES
This section reviews current and potential future technologies as well as operational and restoration measures relative to their potential to cost-effectively meet the performance goals of the Phase II Rule. This section begins with a comparison of the Ormond station’s CWIS relative to the EPA’s baseline configuration to be used for estimating the Calculation Baseline. This review, along with the historical data on impingement and entrainment at the Ormond facility and available data on the Pacific Ocean presented in Section 4 and Appendix B, provide the rationale for the sampling plan in Section 7 and Reliant’s proposed approach to compliance with the Phase II Rule.
The effectiveness of alternative technologies and operational measures at Ormond have previously been evaluated as part of the 316(b) evaluation (LMS, 19822). The 316(b) Demonstration concluded that the existing technologies were BTA.
3.1 USEPA’s Baseline Configuration for Estimating the Calculation Baseline
The Phase II Rule’s performance standards require reductions in impingement mortality and entrainment relative to the Calculation Baseline, defined as:
“an estimate of impingement mortality and entrainment that would occur at your site assuming that: the cooling water system has been designed as a once-through system; the opening of the cooling water intake structure is located at, and the face of the standard 3/8-inch mesh traveling screen is oriented parallel to, the shoreline near the surface of the source waterbody; and the baseline practices, procedures, and structural configuration are those that your facility would maintain in the absence of any structural or operational controls, including flow or velocity reductions, implemented in whole or in part for the purposes of reducing impingement mortality and entrainment.”
As discussed in Section 3.2.3, two aspects of the CWIS are likely to contribute to reductions in impingement mortality and entrainment: 1) its location 2,100 feet offshore in waters that are less productive than those immediately along shore; and 2) use of a velocity cap that induces horizontal water movement that fish better avoid. The mitigation provided by these two measures is estimated below.
2 LMS. 1982. Intake technology review. Final Report to Southern California Edison Co. SCE Co. R&D Series: 82-RD-102. September 1982.

October, 2005 3-2
Reliant Energy supports fish and shellfish stocking and is in the process of planning wetlands restoration efforts. These measures have been selected to improve the local ecosystem and are reasonable “out-of-kind” restoration measures under the Rule. These and potential other restoration measures will be evaluated as mitigation measures under the Rule as part of the CDS.
3.2 In-place Technologies, Operational Measures
This section describes the current CWIS as well as its apparent performance relative to the performance goals of the Rule.
A concise summary of the Ormond station, its CWIS, and the available data is provided in Table 3-1. The details described in this table are presented in more detail below.
3.2.1 Review of Existing Technologies, Operational Measures, and Restoration Measures
Ormond has two natural gas-fired units (see Figure 3-1 for a plot plan). Once-through cooling water for both units is withdrawn from the Pacific Ocean through a vertical intake structure equipped with a velocity cap. The CWIS is located approximately 1,950 ft offshore in 35 ft of water (MLLW). The top of the cap is 20 feet below the water surface. The average through-cap velocity is 2.7 ft/sec. The CWIS has a capacity of 476,000 gpm which is conveyed to the onshore screen structure through a single 14-foot inside diameter concrete conduit at a velocity of 6.9 ft/sec.
The CWIS includes four 11.2 feet wide bays each fitted with trash racks, traveling water screens, and cooling water pump. The trash racks are sloped and have 4½-inch typical bar spacing.
The traveling water screens have a course (5/8 inch) mesh size and are located upstream of the circulating water pumps. Screens are rotated automatically based on head differential across the screen.
Heat treatment is used to control marine fouling and is typically conducted every five weeks and lasts for about two hours per conduit. No provision exists for fish handling and return.
Cooling water is discharged to the Pacific Ocean via a discharge structure located approximately 1,790 feet offshore. Total permitted discharge from the plant through the canal (not only cooling water) is approximately 688.2 MGD.

Summary of Facility CWIS and Overall Information Collection Strategy
NPDES Permit No. CA0001198 (CI-5619)NPDES Permit Application Dates Current Permit Expires on May 10, 2006; Renewal Application Due November 1, 2006 - Compliance Schedule Likely
NecessarySetting Pacific OceanCapacity Factor >15%, base load facility
Number of Units 2 (both open cycle)Performance Goals Impingement Mortality; EntrainmentSummary of CWIS Ocean water is supplied to the station through a 14-foot inside diameter concrete conduit at a flow rate of 476,000 gpm.
The intake is located 2,000 ft. offshore at approximately 35 feet. It is fitted with a concrete 'velocity cap' to discourage fish entry. Seawater flows to the intake structure located within the station. At the intake structure there are two pumps per unit (four total) that deliver water to the condensers, one for each generating unit. Units 1&2: Each unit has two circulation pumps. Approximately 238,000 gpm of ocean water is supplied to each unit for a total pump capacity of 476,000 gpm. The approach velocity at the pumps is ~1.1 ft/s. Each unit has two trash bars (4.5 inch mesh) and associated rakes to remove large debris and two traveling screens (5/8 inch mesh). There is no fish return.
Relationship to Baseline Condition Significant differences: 1) off-shore location; 2) velocity cap.Availability of Historical Data Biological Data:
1) SCE, 1982a: Bight-wide plankton investigation. Extensive survey to estimate populations and age structure of ichthyoplankton of 14 target species.2) SCE, 1982b: 316(b) demonstration. Focus on 14 target species. 163 24-hr samples of impingement over 2 years. 20 samples during heat treatment. Entrainment measured in pumped samples collected monthly with 24 sub-samples over a 24-hour period. Several non-target species also enumerated. Estimated impacts on mortality due to both impingement and entrainment found to be small (generally less than 1%) and unlikely to affect local populations.3) Proteus, 2005: Observations of 24-hour impingement during 84 episodes over 8 years. Both fin- and shellfish and their biomass quantified. 81 finfish species observed with 10 species comprising 88% of the number impinged. Ten (slightly different species) comprise 82% of impinged biomass. Small schooling fish dominate numbers.
Alternatives:SCE (1982) summarizes alternative assessment performed by LMS. 9 of 28 alternatives are deemed feasible but none estimated to significantly reduce station-associated population impacts.
Applicability of Historic Data Recent impingement data completely relevant. Older impingement data generally in agreement with more recent information but does not address some of current dominants nor full range of diversity. Older data useful for perspective and evaluation of inter-annual variation.Historical entrainment data should be considered but is unlikely to fully support the goals of the rule.Evaluation of ichthyoplankton populations useful in assessing long-term trends as well as perpsective on historical IM and E.
US EPA Compliance Cost and Technology Estimates
US EPA has estimated that the costs of compliance at Ormond Station will be $0, based on use of velocity cap and offshore location.
Outline of Compliance Strategy 1) Compliance Alternatives 2, 3, and/or 5.2) A weight-of-evidence approach will be developed based on feasibility and costs of potential alternatives, effectiveness of current measures (including restoration), and low level of apparent impacts.3) Restoration measures as well as benefits of current CWIS will be considered. Difficulty in directly demonstrating benefits relative to the Calculation Baseline will be acknowledged. Focus of restoration will be improvement of biotic integrety rather than direct replacement of losses that might have relatively limited ecological value.4) Collect one-year of data on entrainment and one additional year of impingement in order to support benefits or restoration assessment.
Approach to Estimating Calculation Baseline; Comprehensive Demonstration Study
1) Base the Calculation Baseline on historical, newly collected, and literature data.2) Acknowledge high spatial and temporal variability in biological data and emphasize tangible measures for the Calculation Baseline.3) Rely on the weight-of-evidence and de-emphasize direct measurement of the Calculation Baseline.
Ormond BeachTable 3-1:
3-3 October 2005

October, 2005 3-4
Restoration Measures
Reliant is pursuing ecological improvement measures at its Ormond Beach Generating Station including propagation and stocking of white abalone and white seabass and wetlands restoration. These measures will be evaluated as a means of improving the biological integrity of the area and represent potential “out-of-kind” restoration measures. No attempt has been made in this document to estimate the effectiveness of these measures at restoration under the Rule, but this will be done as part of the CDS.
3.2.2 Performance Estimates
Estimates of performance relative to the Rule’s goals are contained in Table 3-2. The following paragraphs provide discussion of data used to estimate the performance based on the CWIS’s differences from the Calculation Baseline. The important differences include: (1) impingement reductions associated with the use of a velocity cap; (2) placement of the CWIS well offshore in relatively deep water.
The action of the velocity cap (i.e., induction of horizontal velocities) is likely to reduce impingement. This is endorsed by the EPA in its Technical Development Document3 for the Phase II Rule in which reductions in impingement as high as 90% are cited. Schuler and Larson (1975)4 evaluated several alternative intake designs including velocities caps. These authors cite work done by Southern California Edison at its generating stations in which impingement was monitored before and after re-fitting with velocities caps. These studies found reductions in impingement by as much as 90% with the retrofitting for a velocity cap. Controlled laboratory studies indicated similar rates of impingement reduction in side-by-side tests. The reduction in impingement for bay anchovy was 85-90% and was apparently attributed to the ability of the schooling fish to sense and avoid the horizontally induced current. Other, bottom-dwelling fish also saw greatly reduced levels of impingement apparently because the cap minimized induced velocities close to the bottom due to its placement on a “riser”. For the purposes of this preliminary analysis, Reliant has estimated that the velocity cap reduces entrainment by approximately 80% relative to an uncontrolled structure. In fact, the rate of impingement under normal operating conditions at Ormond is extremely low (i.e., 0.9 fish/10,000 m3 – far lower than at Mandalay – 4.95 fish/10,000m3). This supports the premise that the combination of the velocity
3 US EPA, 2005. Technical Development Document for the Final Section 316(b) Phase II Existing Facilities Rule. EPA 821-R-04-007.
4 Schuler, V.J. and L.E. Larson. 1975. Improved fish protection at intake systems. J. of Environ. Engineering Division, American Society of Civil Engineers: 897-910.
October, 2005 3-5
cap and the offshore location reduce impingement mortality No benefit is estimated for entrainment due to the velocity cap.
Placement of the cap in offshore water is also likely to reduce the densities of fish potentially subject to impingement. Fish would be distributed through a larger water column than if the CWIS were directly at the shore. Placement of the CWIS offshore is estimated to reduce impingement mortality by 50%. When coupled with the use of the velocity cap, this technology is assumed to meet the impingement mortality goals.
The physical location of the CWIS 2,100 feet offshore and the configuration such that it withdraws water from roughly 6 feet above the bottom may also reduce the rates of entrainment relative to the Calculation Baseline. Similar to what occurs in riverine situations, the density of ichthyoplankton may be lower in water a short way from the shore directly right onshore. In fact, such placement is given significant importance by the EPA, which considered making it a design requirement for new CWIS under the Phase 1 Rule. Placement of the CWIS offshore is estimated to reduce entrainment by 10% but, although the estimate is associated with a high degree of uncertainty.
As mentioned above, Reliant Energy supports propagation and stocking of two important fish and shellfish species as well as wetlands restoration. These activities are relevant to out-of-kind restoration of impingement losses and the CDS will evaluate means of quantifying their benefit as well as potentially identifying other restoration activities. The credit toward the Rule’s performance goals of these activities has not been considered in Table 3-2.
As depicted in Table 3-2, Reliant estimates that the current CWIS reduces impingement mortality by 90% and reduces entrainment by approximately 10%. The significant reduction in impingement mortality is consistent with very low rates of impingement observed at Ormond (see Appendix B). Thus, Reliant believes that the performance goal for impingement mortality has been achieved while the rate of entrainment has been only slightly reduced.
3.3 Potential Technologies, Operational Measures, and Restoration Measures
The Rule requires that each facility evaluate the technologies and the operational or restoration measures that either exist or could be incorporated to achieve compliance with the performance standards. A summary of general technologies and operational measures available to address impingement mortality and entrainment are presented in Table 3-3. This table presents the technology, estimated effectiveness in addressing impingement mortality and entrainment, estimated technology cost, and notes on why or why not the technology was retained for further feasibility analysis. Appendix A provides a more in-depth analysis of each technology and operational measure considered in Table 3-3. A specific discussion of those technologies that were considered most promising for the Ormond station is provided in Section 3.3.1. A specific discussion on operational measures is provided in Section 3.3.2.

Table 3-2:Ormond Beach
Estimated CWIS Performance Relative to Calculation BaselinePerformance Does Not Consider Committed Reductions in Capacity Factor
Performance Goal:80 to 95% Reduction in Impingement Mortality (IM) 60 to 90% Reduction in Entrainment (E)
EstimatedReduction in IM
(%)Velocity Cap 80 US EPA estimates that velocity cap
can reduce impingement by up to 90%. In fact, studies at Huntington Beach and Segundo are cited as demonstrating reductions of "80 to 90%." Work done by SCE demonstrated a high level of performance following retrofit of intake with velocity cap.
Conservative estimate employed. Litle or no benefit for entrainment.
Location 2000' offshore 50 Population densities are reduced at offshore locations relative to worst-case.
Very approximate estimate.
Total IM Protection 90 Impingement mortality goal estimated to be achieved
EstimatedReduction in E
(%)
Location 2000' offshore 50 Population densities are reduced at offshore locations relative to worst-case.
Very approximate estimate.
Total E Protection 50 Goal not achieved but entrainment significantly reduced.
IM - Difference from Baseline Basis Notes
E - Difference from Baseline Basis Notes
3-6 October 2005

October, 2005 3-7
3.3.1 Review of Technologies
The following criteria are used to assess the technologies and operational measures presented in Table 3-3:
• Technical feasibility and reliability;
• Effectiveness in meeting the Rule’s performance goals;
• Costs relative to EPA estimate developed as part of the Rule-making; and
• Potential for other adverse effects.
Site-specific technologies considered for the Ormond station included:
• Traveling screen modifications;
• Fixed screen devices;
• Offshore intake structure location; and
• Fish diversion and avoidance.
In Table 3-3, the capital costs for technology installation have been estimated for planning purposes. These costs are approximate but they do account for a number of site specific aspects (e.g., distance from the ocean to the plant, number and capacity of CWIS, etc.). Table 3-3 also provides a qualitative discussion of potential operation and maintenance costs. Costs associated with facility downtime during construction are also likely but have not been estimated here due to the uncertainty in construction timing and the need to suspend operations at a given unit. In the execution of the Cost-cost test, all of these issues will be revisited in a more formal fashion and their results expressed consistent with the requirement of the Rule.
The cost estimates for the various technologies were prepared by using the following resources:
• EPA Technical Development Document for the Final Section 316(b) Phase II Existing Facilities Rule, February 12, 2004. (EPA-821-R-04-007);
• EPA Technical Development Document for the Proposed Section 316(b) Phase II Existing Facilities Proposed Rule, April 2002. (EPA-821-R-02-003);
• Cost estimates and/or installed costs for similar equipment obtained by ENSR from vendors and other operating facilities; and

October, 2005 3-8
• Brayton Point Station 316(b) Demonstration5.
Available costs were adjusted to account for size/capacity differences as follows:
• proportionally for components/equipment whose costs were judged to be proportional to size (e.g. pipe length) and
• by the 6/10ths Rule for those components whose costs were judged to not be directly proportional to size (e.g. pumps).
ENSR also applied the following factors, where appropriate:
• 10% Allowance for Indeterminants (AFI), a contingency on costs of the items included;
• 30% Contingency, to address unforeseen items, especially with regard to a facility retrofit; and
• Escalation based on the time frame of the basis cost estimate. Since the basis cost year varied, estimated costs were escalated based on 3% annual rate of inflation.
Traveling Screen Modifications
The intake structure for Units 1 and 2 has four 12-foot wide bays each containing 10-foot wide 38-ft high 5/8 inch square mesh traveling screens located 25 feet upstream of the cooling water pumps. The trash racks 14 feet upstream of the traveling screens have 4½-inch mesh. Front and rear mounted spray nozzles wash debris from the screens into two sluiceways. The two sluice ways combine into one sluice which discharges to the trash conveyor belt. The belt carries debris into a large container for disposal offsite. There is no provision for returning fish to the ocean.
Several alternative technologies exist that are intended to reduce either impingement mortality or entrainment. These include major changes to the structure of the screen. Major modifications to the intake screens (dual flow, angled, or inclined) to reduce through-screen velocity or improve impingement mortality performance may pose significant engineering challenges and possibly require major modifications (i.e., expansion) to the intake structure.
5 This document is a recent and detailed engineering assessment and costing of CWIS for a coastal power station. As such it represents a reasonable basis for screening of likely costs of mitigation measures.
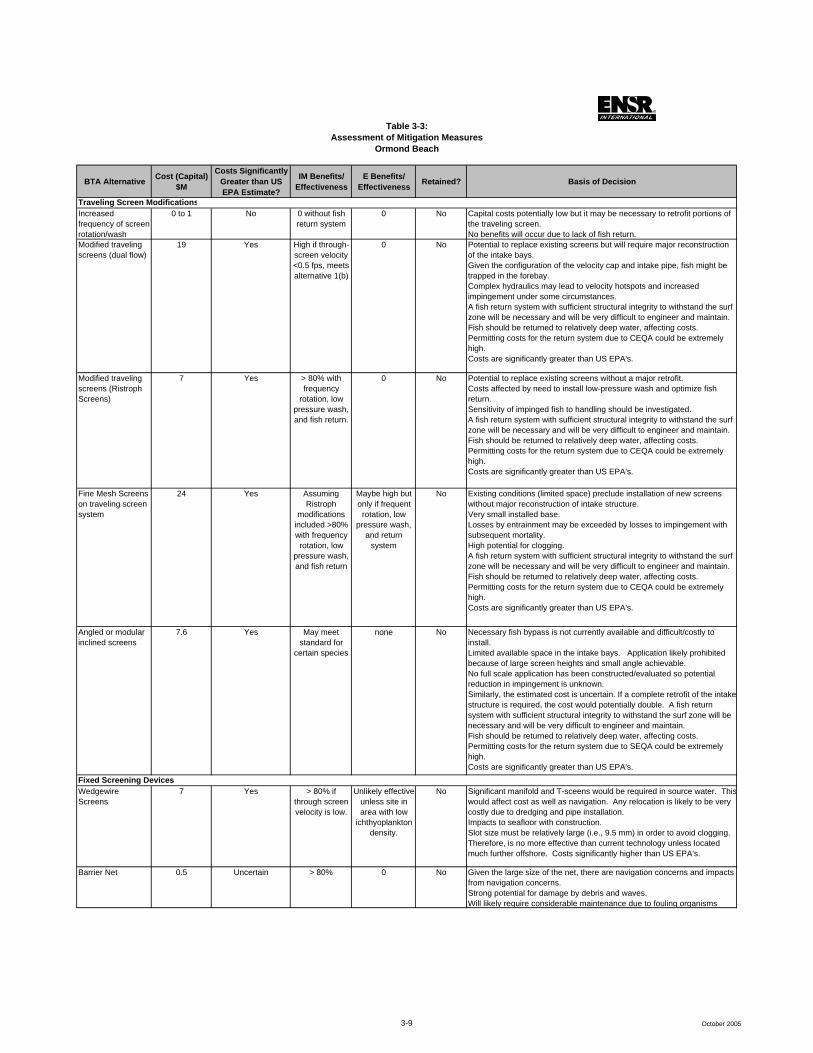
Table 3-3:Assessment of Mitigation Measures
Ormond Beach
BTA Alternative Cost (Capital)$M
Costs Significantly Greater than US EPA Estimate?
IM Benefits/ Effectiveness
E Benefits/ Effectiveness Retained? Basis of Decision
Increased frequency of screen rotation/wash
0 to 1 No 0 without fish return system
0 No Capital costs potentially low but it may be necessary to retrofit portions of the traveling screen.No benefits will occur due to lack of fish return.
Modified traveling screens (dual flow)
19 Yes High if through-screen velocity <0.5 fps, meets alternative 1(b)
0 No Potential to replace existing screens but will require major reconstruction of the intake bays. Given the configuration of the velocity cap and intake pipe, fish might be trapped in the forebay.Complex hydraulics may lead to velocity hotspots and increased impingement under some circumstances.A fish return system with sufficient structural integrity to withstand the surf zone will be necessary and will be very difficult to engineer and maintain.Fish should be returned to relatively deep water, affecting costs.Permitting costs for the return system due to CEQA could be extremely high. Costs are significantly greater than US EPA's.
Modified traveling screens (Ristroph Screens)
7 Yes > 80% with frequency
rotation, low pressure wash, and fish return.
0 No Potential to replace existing screens without a major retrofit.Costs affected by need to install low-pressure wash and optimize fish return.Sensitivity of impinged fish to handling should be investigated.A fish return system with sufficient structural integrity to withstand the surf zone will be necessary and will be very difficult to engineer and maintain.Fish should be returned to relatively deep water, affecting costs. Permitting costs for the return system due to CEQA could be extremely high. Costs are significantly greater than US EPA's.
Fine Mesh Screens on traveling screen system
24 Yes Assuming Ristroph
modifications included >80% with frequency rotation, low
pressure wash, and fish return
Maybe high but only if frequent
rotation, low pressure wash,
and return system
No Existing conditions (limited space) preclude installation of new screens without major reconstruction of intake structure.Very small installed base.Losses by entrainment may be exceeded by losses to impingement with subsequent mortality.High potential for clogging.A fish return system with sufficient structural integrity to withstand the surf zone will be necessary and will be very difficult to engineer and maintain.Fish should be returned to relatively deep water, affecting costs.Permitting costs for the return system due to CEQA could be extremely high. Costs are significantly greater than US EPA's.
Angled or modular inclined screens
7.6 Yes May meet standard for
certain species
none No Necessary fish bypass is not currently available and difficult/costly to install.Limited available space in the intake bays. Application likely prohibited because of large screen heights and small angle achievable.No full scale application has been constructed/evaluated so potential reduction in impingement is unknown. Similarly, the estimated cost is uncertain. If a complete retrofit of the intake structure is required, the cost would potentially double. A fish return system with sufficient structural integrity to withstand the surf zone will be necessary and will be very difficult to engineer and maintain. Fish should be returned to relatively deep water, affecting costs.Permitting costs for the return system due to SEQA could be extremely high. Costs are significantly greater than US EPA's.
Wedgewire Screens
7 Yes > 80% if through screen velocity is low.
Unlikely effective unless site in area with low
ichthyoplankton density.
No Significant manifold and T-sceens would be required in source water. Thiswould affect cost as well as navigation. Any relocation is likely to be very costly due to dredging and pipe installation.Impacts to seafloor with construction.Slot size must be relatively large (i.e., 9.5 mm) in order to avoid clogging. Therefore, is no more effective than current technology unless located much further offshore. Costs significantly higher than US EPA's.
Barrier Net 0.5 Uncertain > 80% 0 No Given the large size of the net, there are navigation concerns and impacts from navigation concerns.Strong potential for damage by debris and waves.Will likely require considerable maintenance due to fouling organisms
Traveling Screen Modifications
Fixed Screening Devices
3-9 October 2005

Table 3-3:Assessment of Mitigation Measures
Ormond Beach
BTA Alternative Cost (Capital)$M
Costs Significantly Greater than US EPA Estimate?
IM Benefits/ Effectiveness
E Benefits/ Effectiveness Retained? Basis of Decision
Aquatic Filter Barrier (e.g., Gunderboom)
16.0 Yes > 80% if through- fabric velocity is low
Maybe high but only with low through-fabric
velocity
No Very long barrier (>.5 mile) required to meet hydraulic loading specifications.Impediment to boating.Performance is uncertain given small installed base especially in marine settings.Susceptible to debris and wave damage.Existing system performance is relatively high.High potential for long-term impingement of ichthyoplankton given relatively low sweeping velocities. Maintenance (especially compressed aircleaning) difficult given distance to the plant.Resulting costs are very high relative to US EPA's.
Porous Dike 12 Yes > 80% if behavioral measures perform
Uncertain No Potential clogging by algae and debris - significant maintenance issues.Dike would have to be constructed around the entire reconstructed intakes; obstacle to navigation. Significant impacts to benthic habitat. Costs significantly higher than US EPA's.
Placement of Structure Further Offshore
10 Yes ? Maybe high but only if well offshore
No No significantly different habitat is readily accessible with movement offshore. Existing system already has high performance. Extremely costly to move the intake any appreciable distance.Potential impacts to seafloor with construction.Costs significantly higher than US EPA's.
Diversion Devices: Louvers and Bar Racks
5 Yes ? none No Fish behavioral avoidance; effective for some species but not others.Only effective when debris loading is low.Required by-pass system not feasible given facility configuration. Would be navigation hazard. Costs significantly higher than US EPA's.
Behavioral Barriers: Strobe Lights, acoustic deterrent, bubbles, chains
0.5 No Uncertain none Yes, acoustic deterrence
Effectiveness highly uncertain and species-specific. IM performance is already high.Does not address entrainment.
Flow Reduction and Other Operational MeasuresVariable Speed Pumps
3 Yes Low depending on frequency of flow reduction.
Low depending on frequency of flow reduction.
No Effectiveness is likely to be low given the nature of the station operation (i.e., pumps only used as needed).
Reduce frequency of heat treatment of CWIS
0 Uncertain Potential significant
none Yes Based on available data, total impingement loses during heat treatments are 53.6% of total at Ormond Beach.Costs of the change could be relatively small. This finding will be re-evaluated with newly collected data.
Evaporative Cooling Towers
100 Yes >90% >90% No Reduction in station efficiency.Visual impact from vapor plume.Discharge issues associated with blowdown.Challenge of using salt water towers (e.g., salt drift impacts to plants, arcing, etc.).Cost may be significantly greater if existing condensers not rated for additional pressure. Costs significantly higher than US EPA's.
Dry Cooling Tower 200 Yes >90% >90% No Significant reduction in station efficiency.Adverse visual impact of large towers.Adverse noise impact.Cost may be significantly greater if existing condensers not rated for additional pressure.Costs significantly higher than US EPA's.
Restoration .1 to 5 Uncertain Uncertain Uncertain Yes Restoration measures could be effective mitigation. Ongoing restoration of white abalone and white seabass successful but considered out-of-kind. Restoration of wetlands near the facility also being considered. Focus should be most effective improvement of ecological function rather than strict restoration of IM and E losses.
New Intake Location
Fish Diversion and Avoidance
Increased Fish Production
Note: Capital costs do NOT include outage costs, O&M, or efficiency penalties
3-10 October 2005
October, 2005 3-11
Each of the screen modification technologies requires the installation of a fish return system, which would include a 1,750-foot flume and a fish elevator/pump. A flume to return the fish to the ocean is complex at this facility because it involves construction across the beach and beyond the surf zone. For the purposes of this analysis, the flume is assumed to be a pipe that is directionally drilled across the beach, below the ocean bottom, to a location offshore. Due to the complexity of such construction, the estimated cost of the fish return system alone would be $3.9M for each technological option requiring a fish return (i.e., those that rely on significant modification of the traveling screens – see discussion below and Table 3-3). The estimated cost of the fish return is added to the capital costs for any modification of the screens themselves in the cost estimated provided in Table 3-3. The Rule does not allow consideration of the permitting costs in the economic assessment of potential technologies under site-specific BTA based on the belief that permitting costs would be relatively constant regardless of compliance technology. Despite this, permitting the construction of a fish return flume or pipe across the beach would be complex and would substantially increase the cost of the screening technologies relative to other mitigation measures and Reliant believes that this should be considered. Finally, the rate of impingement survival may not be significantly improved by a fish handling and return system.
Prior to installation of a screening system, the ability of the impinged organisms to survive handling and return to the water should be evaluated. The resilience of the organisms to handling varies substantially by species, and several organisms common at this location are relatively intolerant to handling. There is a good potential that once deposited back to a concentrated area in the ocean, the fish disoriented by handling may be subject to high rates of predation. If such species are among the dominant organisms impinged, retrofitting with more sophisticated screening devices would yield limited beneficial effect. EPRI6 provides a review of survival of various fish species and families upon handling at traveling screens. No datum is provided for queenfish but members of the relevant family (Sciaenidae) have moderate but variable extended survival. Northern anchovy is reported to experience low extended survival.
Dual flow screens: The dual flow screen option would, by design, reduce the through screen velocity to 0.5 ft/s. To achieve this velocity, the existing flow through screens would be replaced with new 12-ft dual flow, 3/8-inch mesh screens. The replacement will require a complete retrofit of the existing structure to ensure sufficiently low through-screen velocity. The cost for dual flow screens was estimated to be $19M. The cost includes the intake reconstruction, Ristroph features and a 1750-ft fish return flume. The effectiveness of such a technology is uncertain pending review of the handling tolerance of the species impinged at the Ormond Station. This
6 EPRI, 2003. Evaluating the Effects of Power Plant Operations on Aquatic Communities. Summary of Impingement Survival Studies. EPRI Document No. 1007821.

October, 2005 3-12
technology was not retained due to elevated costs associated with the reconstruction of the intake and the potential low effectiveness of the technology for impingement and ineffectiveness for entrainment.
Ristroph screens: Ristroph-type screens (for reduction of impingement mortality only) are feasible but would require the installation of a low pressure wash system and a fish return system. The design of the fish return will be critical to ensure survival of the fish being returned, yet would be problematic. There is a strong potential that the CWIS bays would need to be entirely reconfigured in order to accommodate new traveling screens with smooth top mesh and other Ristroph features. The cost of these modifications (screen modifications, low pressure wash, and new fish return system) is estimated to be $7M, assuming a 1750-foot fish return flume. The costs would increase substantially if the CWIS requires a major retrofit. Again, the ability to susceptibility to handling of the dominant impinged species should be investigated. The technology would be ineffective for entrainment. The technology was not retained because the estimated cost would be significantly greater than the EPA cost and would be minimally effective.
Angled or Inclined screens: Assuming that angled or inclined screens could be installed in the screen house with minor intake structure modifications, the cost for either the angled or inclined screens with fish handling and return is estimated to be $7.6M. For the reasons discussed above, the ability to provide an effective fish by-pass is highly suspect. This technology would be ineffective for entrainment. Because the angled/inclined screens have not been installed and demonstrated feasible in any full-scale applications at power stations and significant engineering constraints would be present at the Ormond CWIS, this technology was not retained.
Fine mesh screens: The addition of fine mesh screens would require major reconstruction of the intake structure to install traveling water screens as well as decrease the through-screen velocity and provide the organism handling capacity. The potential survival of impinged ichthyoplankton has not been well defined in any application. Such technology is highly susceptible to clogging and in most applications is only deployed on a seasonal basis. Even in those circumstances, clogging is common and the screens must be removed during “debris events”. The cost of the installation of fine mesh screens including a completely reconstructed intake with fish return system is estimated to be $24 M. Because the cost estimate for the fine mesh screens is significantly greater than the EPA estimate and there are significant issues of effectiveness and feasibility, this option was not retained.
Fixed Screening Devices
Installation of a fixed screen in the water body can, under certain conditions, provide effective reduction in both impingement and entrainment. Because the CWIS is located 1,950 feet offshore, placement of fixed screening devices would have to be offshore. Aside from the

October, 2005 3-13
practical difficulties of anchoring and maintaining such a structure, it would pose a sufficient impediment to navigation to make it impractical.
Wedgewire screens: Cylindrical wedgewire screens with a 3/8-inch slot size could be considered for Ormond. For a through screen velocity of 0.5 ft/s, at the design flow rate, a possible configuration would include seventeen 72-inch diameter T-screens on a 100 foot manifold located at the location of the existing intake. Clogging may be problematic as the location offshore complicates the use of an airburst system. This issue drives the selection of a relatively coarse screen which eliminates potential reduction in entrainment. Assuming that the wedgewire screen could be installed in the ocean without major challenges, the cost of this alternative is estimated to be $7M. This technology was not retained due to high cost and limitations on effectiveness.
Barrier net: A 180-ft long by 40-ft deep coarse mesh barrier net necessary to exclude fish and larger ichthyoplankton could be installed using anchors and floats around the submerged intake. The through-net velocity would be less than 0.15 ft/s at normal water level. The estimated capital cost for the barrier net is $0.5M. Such a system would be highly susceptible to fouling and storm damage. In addition, this technology may pose issues with marine mammals that may be present in the area, and would present a hazard to navigation. For these reasons, it is not retained.
Aquatic filter barrier (i.e., Gunderboom): The feasibility of installing the aquatic filter barrier at the depth required (i.e. 40 feet) is highly questionable. It would represent a impediment to navigation and would be subject to fouling and storm damage. The mechanism for cleaning the system (air injection) would be greatly complicated by the offshore location. No aquatic filter barrier has been installed in such a setting. Assuming such a complex installation is feasible, the estimated cost of such a barrier would be a minimum of $16 M. This technology was not retained due to the high cost and low technical feasibility.
Porous dike: The porous dike alternative could be constructed at the end of the intake; however, its massive size due to the depth required precludes using it at this location. In addition, there is the potential for obstruction of navigation. A conceptual design would require a dike 40 feet high, 160 feet wide at the base, and several hundred feet long. The estimated capital cost for this option is $12M. Because of the high costs, impracticality, and uncertain performance, this technology was not retained.
Offshore Intake Structure
The existing CWIS is already 2,100 feet offshore and achieves separation from the near-shore communities. The bottom slope present at Ormond Beach is shallow so that accessing significantly deeper water with substantially reduced habitat quality would require movement of
October, 2005 3-14
10,000 feet or more. Such a measure would be prohibitively expensive while yielding uncertain mitigation. For these reasons, this option is not considered further.
Fish Diversion and Avoidance Devices
Louvers and bar racks: Louvers and bar racks can be effective in reducing impingement with a consistent sweeping flow of the current. They have not been demonstrated to be effective in the ocean setting and the effectiveness varies significantly with different species. Such a system would also be subject to fouling and clogging with debris. If a set of louvers were installed to enclose the submerged intake, the estimated cost would be $5M. It was not retained because of cost, likely difficulties in implementation, and significant questions regarding effectiveness.
Other behavioral barriers such as strobe lights, acoustic deterrent, bubbles, and chains have been used as fish deterrents. Their effectiveness is highly uncertain and species-specific. While acoustic deterrence systems have been shown to be effective in certain settings for certain species, the other mechanisms are largely ineffective. As a result, only acoustic deterrence has been retained. If acoustic deterrents were installed around the existing velocity cap, the estimated cost would be $0.5M. Such a system would be ineffective for entrainment. Given the high level of performance of the existing system, the monetized benefits of such a system is likely to be small. In addition, sound generators may be of significant concern to both the Department of Defense due to the site’s proximity to the US Navy’s Missile Test Range as well as resource agencies concerned with marine mammals that might be adversely affected. These considerations will be examined in the CDS.
3.3.2 Review of Operational Measures
Flow Reduction
Variable speed pumps: Variable speed pumps are most effective for those facilities located in areas where intake water temperatures vary significantly because of season. If variable speed drives were installed on all cooling water pumps, the estimated cost is $3M. Ormond currently experiences periods of no or reduced operation during which flow is greatly reduced. While flow reduction during these periods could be credited toward the Rule’s performance goals, Reliant is not prepared to propose extensive flow reduction associated with reduced operation since operation of the facility is largely determined by the California Independent System Operator.
Seasonal variation in impingement rate at Ormond is modest suggesting that seasonal cooling water flow restrictions are not likely to be productive.

October, 2005 3-15
Evaporative cooling towers and dry cooling: Evaporative cooling towers and dry cooling are much more costly than EPA’s estimate for compliance. In addition, space constraints at the site greatly complicate their installation. Finally, both technologies are likely to result in other environmental issues (e.g., water consumption by evaporative towers, salt drift, visual and noise impacts). For these reasons, installation of cooling towers will not be considered further.
Other Operational Measures – Reduction of Heat Treatment Frequency
Reliant subjects its cooling water intake structure to heat treatment by circulating hot water from the condensers back to the screens on a periodic basis in order to reduce biofouling. Per the requirements of the NPDES permit, impingement rates are monitored throughout the entire duration of this process. Based on data collected over the last several years, the impingement losses during heat treatment rival those associated with routine operation despite the fact that heat treatments are very limited in duration. In fact, 53.6% of fish impingement occurs during the heat treatment. Thus, it may be possible to reduce the frequency of heat treatment or pursue an alternative mechanism to control biofouling and significantly reduce the annual rate of impingement. This potential will be evaluated further as part of the CDS and will include evaluation of impingement data collected in the future
3.3.3 Review of Restoration Measures
Restoration can be a cost-effective measure for mitigating losses of aquatic organisms and is allowed under the Phase II Rule. Under some circumstances (i.e. when losses are to commercially/recreationally important and/or special status species) it may be possible to affect in-kind replacement. On the other hand, in some cases it may be more appropriate to pursue “out-of-kind” restoration (i.e., restoration through ecosystem or watershed-based resource management approaches with a focus on resources other than those lost at the CWIS). This approach is explicitly allowed by the Rule. Both “in-kind” and “out-of-kind” restoration has been pursued as a mitigation strategy at a number of generating stations in California, most notably at the San Onofre Nuclear Generating Station.
Possible restoration methods generally include:
• Fish or shell-fish restocking programs;
• Habitat creation;
• Habitat restoration;
• Habitat enhancement;
October, 2005 3-16
• Acquisition and protection of habitat;
• Watershed management and protection to reduce sedimentation or improve water quality; and
• Support of a state or locally-sponsored restoration program.
Of these measures: four have some degree of precedent in the area of the Ormond station: (1) wetland restoration; (2) wetland enhancement; (3) acquisition of wetland habitat; and (4) fish restocking programs.
Fish restocking programs are a way of directly restoring species populations impacted by impingement and entrainment. Restocking programs have proven successful in increasing specific species populations in Southern California. However, the dominant species involved in impingement and potentially entrainment at Ormond are not species of significant commercial or recreational importance. Thus, direct replacement of the most commonly impinged species may not be the most ecologically or commercially/recreationally beneficial approach. Alternatively, Reliant believes that taking an ecosystem perspective and participating in restocking programs that target at-risk, rare, threatened, and/or endangered fish and invertebrate species such as white seabass, rockfish, and abalone may yield valuable benefits on multiple fronts. Proteus Sea Farms currently raises white seabass and white abalone as part of an ongoing restoration program at a marine laboratory located on the Ormond site. Reliant anticipates continuing its support of Proteus for this demonstrated successful restocking program.
Habitat restoration and enhancement, as well as acquisition of nearshore, coastal wetland, and coastal watershed habitats, are indirect methods of mitigating impacts to nearshore fish populations that may be associated with impingement and entrainment at Ormond. Nearshore habitats are hydrologically connected to and thus are part of the same coastal watershed, a requirement for restoration under the Rule. As such, restoration of coastal watersheds can lead to improvement of nearshore habitats. Coastal wetlands can serve as spawning, nursery, and feeding grounds for fish and invertebrates that are integral to the local marine ecosystem. Thus, restoration and/or protection of coastal watersheds are good focal points for managing coastal resources as these restoration activities will contribute to the long-term health of the ecosystem.
Reliant believes that embracing a watershed approach and pursuing “out-of-kind” restoration efforts that increase the biological, physical, and chemical quality of the coastal watersheds influenced by the Ormond station (including Ventura River, Santa Clara River, and Calleguas Creek Watersheds) are appropriate potential mitigation measures under the Rule. Restoration projects currently underway in Ventura County which Reliant could contribute to include:

October, 2005 3-17
• Ormond Beach Wetland Restoration Project (Mugu Lagoon) wetland restoration, enhancement, and acquisition projects of the Ormond Beach wetlands;
• The Nature Conservancy: wetland restoration, enhancement, and acquisition projects along the lower and upper Santa Clara River Watershed;
• Southern California Wetlands Restoration Project: wetland restoration, enhancement, and acquisition projects at Ormond Beach and along the lower and upper Santa Clara River Watershed;
• Santa Clara River Wildlands Protection Project: enhancement and acquisition projects along the lower and upper Santa Clara River Watershed;
• Grunion Greeter Program: research projects including a long-term grunion population assessment and an assessment of the usefulness of grunion as an environmental indicator for sandy beach habitats;
• McGrath State Beach: threatened and endangered species habitat protection;
• Proteus SeaFarms/Channel Islands: restocking program for white abalone and white seabass; opportunity for expansion to include additional species;
• Water Quality Improvement Projects: agricultural and non-point source stormwater runoff;
• Matilija Coalition: wetland restoration and enhancement projects along the Ventura River including removal of Matilija Dam, recovery of Southern Steelhead trout and, restoration of the natural sediment supply to the beaches of Ventura.
As part of the CDS, Reliant will evaluate these and other restoration measures as means of cost-effectively restoring impingement and entrainment losses while improving the biotic integrity of the local coastal ecosystem. The evaluation will consider the findings and goals of relevant resource agencies as well as the interested public.
3.3.4 Estimate of Technology and Operational Measures Costs and Effectiveness
The estimated costs and effectiveness of the evaluated technologies and operational measures are summarized in Table 3-3.

October, 2005 3-18
3.3.5 EPA’s Appraisal of Technologies
As part of the Rule making process, the EPA developed an estimate of the cost of compliance with the Phase II Rule at each of the affected plants. These data are provided for the Ormond station, with some slight modification to their presentation, as Appendix C.
The EPA has estimated that the Ormond station was essentially compliant with both impingement mortality and entrainment and that no additional capital or operation/maintenance costs would need to be expended at the station. This cost (i.e., $0) serves as the basis of the Cost-cost test that might be pursued under the Site-Specific Best Technology Available (BTA) assessment provided for by the Rule.
In the final Rule, the EPA does not present facility-specific estimates of the benefit of compliance to area fisheries. Instead, the EPA requires that the benefits of potential technologies and measures be estimated based on likely technology effectiveness and those benefits expressed as a monetized value using procedures defined in the Rule. The monetized value will be compared to the costs of the potential technology or measure. Under the Rule, if the costs are “significantly greater” than the estimated benefits, a site-specific BTA can be issued.
Reliant anticipates that no entrainment technology is likely to be cost-effective at Ormond, therefore, based on the Cost-cost test or the Cost-benefit test, Compliance Approach #5 will be the selected option.
3.4 Selection of Proposed Technologies, Operational and Restoration Measures
Based on our review of the technologies and operational measures available and the circumstances at the Ormond station we conclude that three should be retained for additional consideration: reduction in the frequency and duration of heat treatment, installation of acoustic deterrence systems, and restoration measures. Technologies to further reduce the rate of impingement mortality are subject to significant issues of performance and cost, especially as a marginal rate of impingement reduction would be small. No technology to minimize entrainment directly has been demonstrated to be either reliable or effective especially in circumstances like those at Ormond. There is a good potential that restoration measures could improve the local environment, especially if they are focused on important biological resources (i.e., potentially out of kind restoration).

October, 2005 4-1
4.0 HISTORICAL STUDY REVIEW
Several studies were conducted by MBC during October 1978 through September 1980 to assess the Ormond station under Sections 316(a) and 316(b) of the Clean Water Act (thermal discharge and intake-related effects, respectively). Relevant impingement and entrainment studies have been conducted at Ormond station as well as other, similar power stations in the area. The studies performed at Ormond are briefly presented in Section 4.1. A more complete discussion of these studies as well as data from other sources is presented in Appendix B. The ability of the combined data set to support the requirements of the Phase II Rule, in particular the Impingement Mortality and Entrainment Characterization Study (IMECS), is discussed in Section 4.2. Studies performed in the Pacific Ocean and available in the literature were reviewed for additional information that could help characterize physical and biological conditions near the facility (Section 5.2)
4.1 Historical Biological and Physical Data
The following provides a citation to the relevant study followed by a very brief summary of the documents scope and findings. SCE, 1983. Ormond Generating Station 316(b) Demonstration. Prepared for LARWQCB. 82-RD-100.
Focus on Impingement Characterization Newly collected data (October 1979 - September 1980) Species list shows dominance of impingement by target 316(b) species with 98.8% of total daily impingement during the two-year period; of these 54.2% were queenfish; 14.9% white croaker; 7.1% walleye surfperch; and 6.7 % northern anchovy Annual rates of impingement estimated Summary of zooplankton entrainment at station; Impact assessment model for each species Intake technology evaluation
SCE, 1982. 316(b) Demonstration Technical Appendix: Impact Assessment Model, Bight-Wide Plankton Investigations. Prepared for LARWQCB, SDRWQCB, and SARWQCB.
Evaluation of impingement and entrainment losses; Evaluation of ichthyoplankton densities in the Southern California Bight;

October, 2005 4-2
Data from several physical, hydraulic, and biological studies at coastal generating stations and source waters were utilized to develop the Impact Assessment Model
MBC, 2002. National Pollutant Discharge Elimination System 2002 Receiving Water Monitoring Report, Reliant Energy Ormond Generating Station. Prepared for Reliant Energy
24-hour monitoring of impingement – summarized in Proteus (2005). Monitoring of fisheries resources in the vicinity of the outfall and at reference locations.
MBC, 2003. National Pollutant Discharge Elimination System 2003 Receiving Water Monitoring Report, Reliant Energy Ormond Generating Station. Prepared for Reliant Energy.
24-hour monitoring of impingement – summarized in Proteus (2005). Monitoring of fisheries resources in the vicinity of the outfall and at reference locations.
MBC, 2004. National Pollutant Discharge Elimination System 2004 Receiving Water Monitoring Report, Reliant Energy Ormond Generating Station. Prepared for Reliant Energy.
24-hour monitoring of impingement – summarized in Proteus (2005). Monitoring of fisheries resources in the vicinity of the outfall and at reference locations.
Proteus SeaFarms, 2005. Summary of Fish Impingement at Reliant Energy’s Ormond Beach Generating Station. Oxnard, CA. 1997-2004.
Summary of data collected as described in MBC reports, above. 84 monitoring episodes over 8 years. Both fish and shellfish numbers and biomass were quantified. 81 fish species observed with 10 comprising 88% of the numbers. Small schooling fish dominate.
4.2 Summary of Historical Impingement and Entrainment Rates
As noted above, SCE evaluated impingement and entrainment at Ormond during the development of the original CDS in the early 1980s. This evaluation included measurement of impingement and entrainment measurements. Further efforts to track impingement since 1980 have been documented in annual monitoring reports since the condition to collect such data was included in the latest NPDES permit (i.e., since 1997). No site-specific effort has been undertaken to evaluate entrainment at Ormond in recent years.

October, 2005 4-3
These studies used standard sampling and analysis techniques that are appropriate for quantifying impingement and entrainment under the Rule. These data are expected to be useful data within the context of the goals of the Rule as well as in providing a broad understanding of the fisheries of the Southern California Bight. The following is a brief discussion of the overall trends observed in the two data sets and their implications for the PIC. Information on the fishery of the Southern California Bight is also considered. A more extensive discussion of site-specific observations as well as the more general literature is presented in Appendix B.
Based on the available data, several generalities regarding impingement and entrainment are possible:
• The more recent survey of impingement is of very high quality. Several samples are available over a number of years. The methods are standard ones and the full suite of fish and shellfish are enumerated, weighed, and measured for length. These data, which will continue to be collected, fully address the goals of the IMECS as articulated in the Rule.
• A moderate number of species are subject to impingement at Ormond. These species are
typical of coastal environment. A lower number of species are impinged at Mandalay again favoring species typical of coastal environments. Most of the impinged fish at both stations are schooling species. The overall rate of impingement (i.e., fish/10,000 m3) is far lower at Ormond than at Mandalay.
• The older surveys of impingement mortality and entrainment at both stations used
appropriate methods but suffer from a focus on 14 target species. The target species do not include the dominant species in the most recent data at Mandalay, grunion. Entrainment was measured at Ormond. The older data on entrainment at Mandalay is collected at another facility.
• The overall pattern of impingement of the 14 target species is similar between the two
surveys (r2 = 0.93 for Mandalay, r2 = 0.80 for Ormond). This similarity includes overall species composition as well as the number and biomass of fish impinged.
• The impinged species in the two surveys include several but not all of those that are
common in embayment or nearshore habitat of the Pacific Ocean. • No large-scale impingement events are apparent in the record at Ormond while they
dominated many events at Mandalay. This result leads to relatively low inter-sample variation in impingement rates at Ormond than at Mandalay.

October, 2005 4-4
• Recent surveys of ambient fish populations have occurred offshore of the Mandalay station for several years and Historical fish populations were sampled in the late 1970s off both stations. The species encountered during these sampling events have been relatively consistent over the last 20+ years and are very similar in composition to the fish impinged at Ormond station. In sharp contrast, the most important components of the ambient population are impinged very infrequently at Mandalay and the dominant species impinged are very poorly represented in the ambient nearshore fish population.
• The flow normalized rate of fish impingement during normal operation is far lower at
Ormond (0.09 fish/10,000 m3) than at Mandalay (4.96 fish/10,000 m3). This difference is likely associated with the location and configuration of the Ormond CWIS (e.g., the velocity cap) including the absence of major impingement events associated with spawning fish.
• Both stations use heat treatment to control biofouling of the CWIS. Total impingement is
monitored during the entire duration of any heat treatment event and tallied separately from impingement during normal operations. Impingement during heat treatment was compared to the annual rate of impingement estimated by extrapolating 24-hour sampling events to the full year. At Mandalay, heat treatment losses were found to be only 0.13% of the total estimated annual losses. At Ormond, the relative losses during heat treatment were far higher: 53.6% of estimated annual losses. This result suggests that management of heat treatment at Ormond could significantly reduce annual impingement losses.
• No listed Threatened or Endangered species or other special status species have been
affected by impingement. Only special-status marine mammals and reptiles (i.e., sea turtles) are believed to be present in the area, they have not been encountered during impingement surveys.
• The monthly rates of impingement are variable but exhibit only slight seasonal patterns.
Some of this variability is likely due to the periodicity of plant operation as well as local schooling events.
• Two of the most frequently impinged fish species, queenfish and northern anchovy, are
large for the species (i.e. more than a couple grams) indicating that they are adult and young of year.
• The fish species (i.e. northern anchovy, queenfish, white croaker) affected by entrainment
at Ormond were generally the same ones affected by impingement (i.e. queenfish , Pacific sardine, and northern anchovy). Supplemental data on entrainment at Ormond is proposed. There is a strong seasonality in the rate of entrainment of fish with the great majority occurring in the early spring, February through May and August through October

October, 2005 4-5
(which corresponds to northern anchovy spawning); minimum entrainment occurred during summer months.
• The original demonstrations in 1983 concluded that the operation of the CWIS did not
result in an Adverse Environmental Impact on the fisheries in the vicinity. The LARWQCB concurred with this decision.
• Shifts in the populations of some fish species are expected since the completion of the
demonstrations in 1983. In particular, the populations of rock fish are expected to have decreased. Despite this change in populations for some fish species, significant changes in the patterns of impingement and entrainment are not expected. Importantly, the two dominant impinged species and entrained species are expected to continue to be most important at both stations.
• Based on the Historical and recent data collected in support of the demonstrations and
NPDES monitoring, fish populations within the Southern California Bight that have shown substantial population changes are different from the species impinged and historically entrained at Ormond.
4.3 Assessment of Data Sufficiency
Among the requirements of the CDS is the performance of a study of impingement mortality and entrainment. The results of this study may be used to assess the performance of the current CWIS as well as evaluate additional potential technologies and measures. The Rule sets out specific requirements for this study and addressing these goals is an important aspect of the PIC. The Rule anticipates that it may be possible to base the CDS completely or in part on existing data. For these reasons, Table 4-1 presents the specific data requirements for the study and reviews the relevance of available data to these requirements. The table also comments on the potential necessity of additional field data.
Significant data are available on the impingement mortality and entrainment patterns at the Ormond station. One of the impingement surveys and the entrainment survey was performed in the early 1980s and focused on 14 target fish species. The data were collected using reasonable methods and will provide historical perspective on temporal trends. This conclusion is bolstered by the common representation of the 14 target species among the dominant impinged fish in the more recent data. An ongoing program of impingement monitoring provides a very good record of current rates of impingement. This program uses current procedures, enumerates the full suite of fin- and shellfish, and has been accepted by the LARWQCB. Appendix B discusses the data available at Ormond within the context of other relevant data including:
October, 2005 4-6
• Data on impingement and entrainment collected at another power station (Mandalay) in the area ;
• Ongoing, consistent surveys on the fisheries of the Southern California Bight; and
• The general literature on fisheries including habitat preferences and seasonality of important species.
Reliant believes that the Historical record on impingement is representative of current conditions given that operation of the facility has not changed significantly. Despite this, we acknowledge the potential utility of updating information to both address potential changes in the fishery as well as routine inter-annual variation.
Compliance Option #2 under the Phase II Rule allows a facility to demonstrate that the existing CWIS meets the performance standards’ required reductions relative to the Calculation Baseline. Compliance Option #3 includes demonstrating compliance with additional technological, operational, or restoration measures. Compliance Option #5 provides for a demonstration that cost-effective reductions are not feasible. As noted in Section 6, below, Reliant does not believe that it is possible to definitively select a final compliance alternative but anticipates that some combination of the three alternatives will be applicable to both impingement mortality and entrainment. For this reason, it has evaluated the available data for their ability to support any of the three alternatives including selection among them.
Having inspected the available data and based on information collected in the literature, Reliant has concluded that collection of ambient data in order to define the differences between the current CWIS and the Calculation Baseline is not likely to be productive. Most importantly, the temporal and spatial variation in populations is significant and is likely to overwhelm, at least periodically, potential differences associated with CWIS configuration, location, and operation. For this reason, Reliant proposes to base the estimate of the Calculation Baseline on the available data (from the literature as well as the site), tangible factors such as flow reduction, and Best Professional Judgment. For example, reliance on data from more controlled experiments on velocity caps, both in the laboratory and following retrofit, are much more likely to be reliable estimates of the performance of the Ormond velocity cap. These are available in the literature and will be used to support the assessment of performance of the current CWIS relative to impingement mortality. In addition, Reliant is likely to pursue, at least in part, the site-specific BTA alternatives as well as restoration measures, both of which are less dependent upon the Calculation Baseline.

October, 2005 4-7
Table 4-1 Assessment of Data Sufficiency
Rule Citation Requirement Historical Data Source Notes
Additional Data
Proposed?
125.95(b)(3)(i)
Taxonomic identifications of all life stages of fish, shellfish, and any species protected under Federal, State, or Tribal Law (including threatened or endangered species) that are in the vicinity of the cooling water intake structure(s) and are susceptible to impingement and entrainment.
Site-Specific; Regional Literature
Historical data at the plant provide information on rates of impingement and entrainment of aquatic organisms. This can be confirmed by comparison to rates at other stations. Surveys of extant populations and reference materials can be used to assess historical trends and current populations in the area.
Yes
125.95(b)(3)(ii)
A characterization of all life stages of fish, shellfish, and any species protected under Federal, State, or Tribal Law (including threatened or endangered species) identified pursuant to paragraph (b)(3)(i) of this section, including a description of the abundance and temporal and spatial characteristics in the vicinity of the cooling water intake structure(s), based on sufficient data to characterize annual, seasonal, and diel variations in impingement mortality and entrainment.
Site-Specific; Regional Literature
Station-specific data will be used and supplemented by more recent data from other stations as well as surveys of extant populations and the general literature.
Yes

October, 2005 4-8
Rule Citation Requirement Historical Data Source Notes
Additional Data
Proposed?
125.95(b)(3)(iii)
Documentation of the current impingement mortality and entrainment of all life stages of fish, shellfish, and any species protected under Federal, State, or Tribal Law (including threatened or endangered species) identified pursuant to paragraph (b)(3)(i) of this section and an estimate of impingement mortality and entrainment to be used as the calculation baseline. Impingement mortality and entrainment samples to support the calculations required in Section 125.95(b)(4)(i)(C) and 125.95(b)(5)(iii) of the Rule must be collected during periods of representative operational flows for the cooling water intake structure and the flows associated with the samples must be documented.
Site-Specific; Regional Literature
Historical rates of impingement mortality and entrainment are believed to be representative of current conditions based on comparison to more recent data at other stations as well as surveys of extant populations.
Yes
In summary, Reliant believes that additional data collection is appropriate both to address the specific requirements of the IMECS as well as support the selection and execution of the appropriate compliance alternative. Reliant believes that a demonstration is possible under Option #2 in that the Ormond Generating Station meets the performance standard for impingement mortality and entrainment relative to the Calculation Baseline. Reliant proposes to collect data to support this demonstration by characterizing the existing impingement mortality and entrainment rates at the facility and to support the estimate of these rates for the Calculation Baseline. The collection of these data would also support a potential demonstration of compliance under Option 3 by providing current, site-specific data that would identify the optimal selection of technological, operational, or restoration measures to meet the performance

October, 2005 4-9
standards. The data would further support a demonstration under the cost-benefit option of Compliance Alternative 5 by quantifying current rates of losses. The sampling plan described in Section 7 describes Reliant’s approach to collect these data. A more detailed sampling plan is provided in Appendix D.

October, 2005 5-1
5.0 AGENCY CONSULTATIONS
The PIC must include a summary of any past or ongoing consultations with appropriate Federal, State, and Tribal fish and wildlife agencies that are relevant to this Study and a copy of written comments received as a result of such consultations. Reliant believes that the goals of this summary are to provide LARWQCB with full perspective on the historical permitting of the CWIS as well as any potential concern by relevant fisheries management or other natural resources agencies. Such a summary has been prepared from the records retained by the facility and by Reliant corporate offices as well as the collective memories of the station and environmental staffs.
5.1 Section 316(b)-Specific Consultations
Reliant has been unable to find specific correspondence from LARWQCB or the EPA regarding the Section 316(b) compliance status of the Ormond station from the late 1970s and early 1980s. We infer from the presence of several studies performed during the 1970s that analysis under Section 316(b) was performed and likely reviewed by the NPDES permitting agency. From the history of operation at the facility, we believe that the NPDES agency generally concurred with the conclusion that no Adverse Environmental Impacts were being caused by the CWIS at the plant.
The current NPDES permit does not mention any conclusion by LARWQCB relative to the BTA status of the CWIS at the Ormond station.
Reliant has been participating in the LARWQCB stakeholder group meetings that have been convened periodically since 2003.
5.2 Other Relevant Consultations
Reliant has had no consultations with fisheries or other agencies relative to impingement and entrainment of fisheries at the Ormond station. Communications with the California Department of Fish and Game (CDFG) and United States Fish and Wildlife Service (USFWS) have indicated that there are no state- or federally-listed species in the vicinity of the CWIS and therefore no potential impacts to protected species (see Appendix B).

October, 2005 6-1
6.0 PROPOSED COMPLIANCE APPROACH
At this point in the 316(b) compliance effort, it is not clear which Compliance Alternative(s) will ultimately be selected during the completion of the CDS. Based on information reviewed above, some combination of Compliance Alternatives 2, 3, and 5 will be pursued. Thus, the PIC has been written to collect data relevant to each of these three approaches. The following is a brief summary of the potential application of the three compliance alternatives at Ormond:
• Compliance Alternative 2: Demonstration that the current technologies and measures achieve the performance goals. The contributing factors may include the location of the CWIS and the use of a velocity cap. As discussed in the body of the PIC, preliminary estimates of the effectiveness of these measures indicate that CWIS does meet the compliance goals for impingement mortality. An important goal of the CDS will be to bolster this conclusion. The impingement mortality performance will be based on the literature as well as a discussion of the low absolute rates of impingement that currently occur. The literature describes relatively controlled investigations (i.e., side-by-side performance tests in the field or the laboratory that indicate impingement rates before and after retrofitting with a velocity cap). Such assessments will be associated with far less uncertainty than any attempt to correlate ambient population densities with rates of impingement. It is less likely that the entrainment performance goal is being achieved at Ormond but this potential will also be evaluated. Ongoing restoration measures will be considered as contributing to both the impingement mortality and entrainment performance goals.
• Compliance Alternative 3: Demonstrate that currently used and newly adopted technologies and measures achieve the performance goals. A number of potential technologies and measures (e.g., acoustic deterrence, reduction in heat treatment frequency, additional restoration measures) will be evaluated further as part of the CDS and may be adopted to contribute toward additional mitigation. The combined performance of the existing and newly pursued technologies and measures will be evaluated based on a weight-of-evidence including biological data, engineering data, and Best Professional Judgment. The nature of potential restoration measures will be considered relative to the quantified losses at the station as well as those measures that are likely to have significant biological benefit.
• Compliance Alternative 5: Define a site-specific Best Technology Available (BTA). This alternative will be based on showing that fully achieving the performance goals will be significantly more costly than the EPA’s estimate of the cost of compliance or the monetized benefit of compliance. Reliant notes that the Rule requires that any cost-

October, 2005 6-2
effective measures should be pursued even under the adoption of a site-specific BTA. For this reason, restoration of losses is likely to play a role under this option. Therefore, observed rates of losses are likely to be used to support design of restoration measures as well as estimate the monetized benefits of potential mitigation measures.
As stated earlier in this PIC, the EPA has determined that costs for Ormond to meet the requirements of the Rule are zero.
6.1 Outline of CDS Activities
According to 40 CFR Section 125.95(b), the “Comprehensive Demonstration Study (CDS) is to characterize impingement mortality and entrainment, to describe the operation of your cooling water intake structures, and to confirm that the technologies, operational measures, and/or restoration measures you have selected and installed, or will install, at your facility meet the applicable requirements of §125.94.” Under the provisions of the Rule (40 CFR 125.95(b)), the composition of the CDS will depend on the specific Compliance Alternative selected. In fact, there is a possibility that one Compliance Alternative will be selected to address impingement mortality and another one for entrainment. Thus, a CDS intended to support a combination of Compliance Alternatives 2 (or 3) and 5 that is based, at least in part, on restoration would include the following components:
• Proposal for Information Collection
• Source Waterbody Flow Information
• Impingement Mortality and/or Entrainment Characterization Study
• Technology and compliance assessment information
o Design and Construction Technology Plan
o Technology Installation and Operation Plan
• Restoration Plan
• Information to support site-specific determination of best technology available for minimizing adverse environmental impact
o Comprehensive Cost Evaluation Study
o Valuation of Monetized Benefits of Reducing IM&E
o Site-Specific Technology Plan
• Verification Monitoring Plan

October, 2005 6-3
The documents required for Compliance Alternative 3 are the same as those required for Compliance Alternative 2. In the event that only Compliance Alternative 5 is selected, a Design and Construction Technology Plan would not be required7. As appropriate to the selected Alternative, Reliant will prepare each of these documents and submit them to LARWQCB for review.
6.2 Review of CDS Approach
The CDS approach for the Ormond station includes providing the required information and submittals so that:
• Impingement mortality compliance can be demonstrated under Compliance Alternative 2 or 3. Compliance Alternative 5 will be available as an alternative position and
• Entrainment compliance can be demonstrated under Compliance Alternatives 2, 3, or 5. The extent to which the existing CWIS meets the entrainment goal will be quantified and alternative technologies or measures to control impingement entrainment will be evaluated for effectiveness, feasibility, and costs.
The following information will be compiled and submitted in support of the compliance approach:
• Rates of impingement mortality will continue to be quantified at the Ormond Generating Station consistent with the program currently in place;
• Rates of entrainment will be quantified for one year;
• The Impingement Mortality and Entrainment Characterization Study will summarize the full range of available data in order to estimate the extent of mitigation from the Calculation Baseline as well as estimate the current losses;
• Existing technologies and operational measures to achieve the impingement mortality and entrainment goals will be described and their effectiveness estimated based on available data. The assessment will consider the feasibility and reliability of the technology as well as its likely effectiveness and cost. The additional measures of installation of acoustic deterrence systems, reduction in the frequency and duration of heat treatment of CWIS,
7 Reliant notes that the nature of the Design and Construction Technology Plan is very similar to that of the Site-Specific Technology Plan so that LARWQCB will have an opportunity to review the relevant information under either circumstance.

October, 2005 6-4
and restoration will also be assessed as potentially cost-effective measures to further reduce impingement mortality and/or entrainment;
• Following the assessment of the biological and engineering data, the final Compliance Alternative will be selected for impingement mortality and entrainment. As noted above, while it is not possible to select the final alternative at this time, it is likely that it will rely on an approach that credits existing mitigation measures, proposes adoption of cost-effective additional measures, and, to the extent that the performance goals are not fully achieved, proposes a site-specific BTA;
• Information demonstrating that compliance costs for measures effective at reducing entrainment exceeds the EPA-estimated costs allowing access to Compliance Alternative 5. The Calculation Baseline may be estimated based on differences in ichthyoplankton density between the shoreline and the location of the CWIS derived from the literature. It is unlikely that the Calculation Baseline calculation will demonstrate full attainment of the entrainment performance goal. For this reason, the Cost-cost test will be pursued. Consistent with the requirements of the Rule, Reliant will investigate other cost-effective measures as well as restoration activities to reduce entrainment impacts;
• The technology assessment and discussion of the installation and operation of selected measures will be presented in the Design and Construction Technology Plan, the Site-Specific Technology Plan, and/or the Restoration Plan, as appropriate; and
• The nature of the proposed ongoing compliance activities including their timing will be outlined in the Technology Installation and Operation Plan.
6.3 Schedule
The following is a tentative schedule for the execution of the Phase II process at Ormond station based on target dates for submission of the PIC and the completed CDS. The following is a proposed Rule compliance schedule for Ormond that incorporates these two milestones:
• PIC submittal by October 15, 2005;
• Submission of a request for compliance schedule consistent with the Rule’s provisions by October 15, 2005;

October, 2005 6-5
• Submission of the application of NPDES permit renewal and, potentially, materials called for under Section 122.218 by October 10, 2005;
• LARWQCB comments on the PIC, within 60 days of submittal –November15, 2005;
• Field work for Impingement Mortality and Entrainment Characterization Study Report begins by January 1, 2006 and is completed one year later;
• Compilation and analysis of the impingement mortality and entrainment data will be complete by approximately March 1, 2007 and the balance of the CDS will begin in earnest at this time;
• Submit Comprehensive Demonstration Study, including items identified below by a date consistent with the compliance schedule (i.e., January 7, 2008).
o Impingement Mortality and Entrainment Characterization Report;
o Technology and compliance assessment, including the Design and Construction Technology Plan (DCTP) and the Technology Installation and Operation Plan (TIOP);
o Information to support the site-specific best technology available (BTA), potentially including the Comprehensive Cost Evaluation Study (CCES), Valuation of Monetized Benefits (VMB), and the Site-Specific Technology Plan (SSTP);
o Verification Monitoring Plan (VMP).
• Negotiation of the TIOP as part of the LARWQCB determination of Section 316(b) BTA;
• LARWQCB BTA determination and CDS approval completed by approximately June, 2008; and
• Implementation of additional remedies under the schedule defined in the TIOP.
8 Reliant believes that those materials called for under 40 CFR 122.21 related to Section 316(b) are most useful when reviewed in the context of the CDS. For this reason, Reliant believes that it is logical to delay their submission until the completion of the CDS and Reliant will request this strategy as part of its Compliance Schedule.

October, 2005 6-6
Reliant notes that this schedule is only an approximation. The CDS is due to LARWQCB by November 1, 2005 (the NPDES permit renewal application date) unless a compliance schedule is requested in which case LARWQCB can extend the due date to as late as January 7, 2008. Reliant has requested, under a separate cover, such a compliance schedule. We view the PIC and related process to be an iterative process and, as such, we anticipate continued discussions and interactions with the LARWQCB on this process.

October, 2005 7-1
7.0 PROPOSED SAMPLING PLAN
The Proposed Sampling Workplan, as presented below, will provide a basis for current impingement and entrainment estimates at Ormond. Such estimates, when combined with the existing site-specific data and information available from the literature, will allow Reliant to complete the IMECS as required by the Rule. In addition to addressing the requirements of the IMECS, the data would be useful in defining the rate of losses in order to evaluate the monetized benefits of additional mitigation measures as well as developing restoration targets. These data will also support, in part, definition of the Calculation Baseline relative to current rates of impingement mortality and entrainment.
The following section will present a brief overview of the proposed scope of field work. The proposed workplan itself is provided as Appendix D to this document. Section 4 and Appendix D provide background information on the likely nature of the impingement and entrainment at Ormond. These sections also provide a brief summary of the data available on fisheries in the area including monitoring of ambient conditions. These data will be collected and more formally reviewed as part of the IMECS.
Three types of biological sampling could be included as part of the field work to support the IMECS: 1) quantification of impingement mortality; 2) quantification of entrainment; and 3) sampling of ambient populations of fish and/or ichthyoplankton. Consistent with the anticipated compliance alternatives, Reliant has proposed to characterize impingement mortality and entrainment but not to perform sampling of ambient populations of either ichthyoplankton or adults. These two potential activities are discussed separately below.
7.1 Impingement Sampling Plan
The Ormond Generating Station currently quantifies impingement as required by its NPDES permit. Sampling is done at an approximately monthly frequency, as plant operations allow, during normal operation. Finfish and shellfish that are impinged are characterized to species, enumerated, and weighed. Consistent with the operation of the CWIS, impinged fish are assumed to be subject to mortality. The CWIS flow rate is recorded during each sampling event. The daily rate of impingement and the CWIS flow rate are used to extrapolate from the measured daily impingement to an integrated annual impingement rate.
In addition, fish impinged during heat treatment of the CWIS are sampled, enumerated, and characterized as described above. Losses during heat treatment are roughly comparable to those measured during normal operation. All impinged fish for all heat treatments were counted and
October, 2005 7-2
identified to species. Because of the comprehensive nature of the sampling activities for the heat treatments, no extrapolation to annual conditions is necessary.
Reliant believes that the current sampling program is sufficient to support the goals of the IMECS and its compliance approach. In particular, the relatively extensive data set collected over the last eight years, combined with data collected in the next year will provide an excellent record of the rate of impingement mortality.
It should be noted that, over the last few years, the Ormond Generating Station has operated on an intermittent basis. For this reason, scheduled sampling events have not occurred due to the lack of plant operation. Reliant believes that it is inappropriate (and costly) to operate the CWIS pumps simply to sample and LARWQCB has concurred. While this results in less data on an annual basis, over the duration of the program, seasonal and interannual trends can be defined. Reliant plans to continue this practice of sampling as scheduled when the plant is operational.
Impingement data will be reported on a per-survey, per-season, per-sampled volume, and estimated annual basis. The raw data will be included as an Access® database.
7.2 Entrainment Sampling Plan – In-Plant
Reliant proposes to sample for entrainment at one month frequency throughout the year. Given the relatively limited nature of available data and the relatively short duration of the sampling period (i.e., a few hours for each subsample versus 24 hours for impingement), determined efforts will be made to collect a sample during each month even if the sampling efforts have to be rescheduled. This may include rescheduling events, collection of a second daily sampling early in the following month, and/or pursuing the day-time and night-time sampling events on different days. Running of the cooling water pumps for the sole purpose of sampling will not be pursued.
Samples will be collected by deploying a 333 µm plankton net with a 0.5 m diameter mouth in the cooling water intake flow in front of the rotating screens. The net will be equipped with an impeller to allow estimation of the filtered volume. The target filtered volume will be 100 m3. The actual sampled volume as well as the plant cooling water flow rate will be recorded. Separate samples will be collected beginning at sunrise and sunset in order to evaluate diel variation.
Each sample will be preserved in 10% formalin, stored, and analyzed separately. Fish eggs and larvae will be identified to lowest distinguishable taxonomic category and counted. When a species is especially abundant, subsamples will be obtained by a plankton splitter. Specimens will be measured for definition of length frequencies. Common and scientific names will be those established by the American Fisheries Society. Counts will be expressed relative to 10,000 m3 of water.
October, 2005 7-3
Entrainment data will be summarized and expressed on a per survey, per flow volume, and estimated annual basis. Diel and seasonal trends will be evaluated. Raw data will be available as an Access® or comparable database.
7.3 Ambient Sampling Plan
Reliant does not propose to perform sampling of ambient populations of either fish or ichthyoplankton. This decision is driven by three factors:
• The candidate compliance alternatives can be developed without ambient data. We believe that the effectiveness of in-place or planned mitigation measures can be estimated based on a weight-of-evidence approach. Our analysis will include an assessment of the feasibility and cost-effectiveness of alternative measures. Data on the actual rates of impingement mortality and entrainment potentially necessary to support the estimation of monetized benefits of mitigation measures or the extent of restoration measures will be collected.
• Ambient population densities of fish are a poor predictor of impingement rates. Fish species vary dramatically in their susceptibility to impingement. Schooling fish that live higher in the water column tend to be more vulnerable than benthic dwellers, as are fish that are relatively slow swimmers. Fish that tend to orient their travel parallel to water flow (i.e., sardines) are likely to be more susceptible than other species. Smaller fish, even within a given species, tend to be weaker swimmers and may be impinged more readily. Thus, a comprehensive sample of the fishery population in a given area may say little about the number or type of organisms susceptible to impingement. This is a important issue for the concept of the Calculation Baseline as defined by the Rule.
• Ambient densities of fish, shellfish, and ichthyoplankton are highly variable in time and in space limiting their utility in supporting the Calculation Baseline. Rates of impingement have been observed to vary at Ormond and similar variation is likely in rates of entrainment. Much of this variation is due to variation in the ambient conditions including on a relatively fine time or space scale. For example, movement of large schools of fish, including their encountering the area proximal to the CWIS, may have a quasi-random nature. Such variation may overwhelm changes that might occur with installation of mitigation measures. This is illustrated by the fact that the Rule calls for reductions in impingement mortality by 80 to 95% yet the variation in impingement rates without a change in technology may be two orders of magnitude or more. In short, defining changes relative to the Calculation Baseline based on biological data is likely to be fraught with uncertainties and may lead to an ambiguous compliance status.

APPENDIX A
TECHNOLOGY REVIEW

A-1
APPENDIX A
TECHNOLOGY REVIEW
General Technology Overview
This section provides a general review of a comprehensive list of potential mitigation methods to reduce impingement mortality and entrainment. The nature of the technology is briefly reviewed and its approximate costs1 are presented. The effectiveness under the conditions at the Reliant plant is discussed and factors affecting performance, reliability, and other environmental issues are reviewed. In addition to CWIS technologies, plant operation and restoration measures are considered.
The following list of CWIS alternatives have been evaluated in this screening assessment:
Alternative 1 - Traveling Screen Modifications − 1a - Dual Flow Screens (Impingement) − 1b - Ristroph Screens (Impingement) − 1c - Fine Mesh Screens (Impingement and Entrainment) − 1d - Angled and modular inclined screens (Impingement)
Alternative 2 – Fixed Screening Devices − 2a - Wedgewire Screens (Impingement and possibly entrainment) − 2b - Perforated Pipes (Impingement) − 2c – Barrier Net (Impingement) − 2d – Aquatic Filter Barrier (Impingement and Entrainment) − 2e – Porous Dike/Leaky Dam (Impingement and Entrainment)
Alternative 3 - Offshore Intake (Impingement and Entrainment)
Alternative 4 – Fish Diversion and Avoidance − 4a – Louvers and Bar Racks (Impingement) − 4b – Velocity Cap (Impingement) − 4c – Strobe lights, acoustic deterrent, bubbles, chains (Impingement)
1 This report presents estimates of the capital costs of potential mitigation measures as a means of illustrating their potential cost-effectiveness. The estimates should be considered approximate and final costs may vary by as much as factor of two or more. Cost estimates for mitigation measures do not account for facility down-time associated with construction nor operation/maintenance. These costs will be estimated with input from Entergy and included in the final CDS document especially in the information to support the Site-specific BTA. Costs will be annualized according the procedures defined in the rule.

A-2
Alternative 5 – Flow Reduction − 5a - Variable Speed Pumps (Impingement and Entrainment) − 5b - Capacity Factor Reduction (Impingement and Entrainment) − 5c - Evaporative Cooling Towers (Impingement and Entrainment) − 5d - Dry Cooling (Impingement and Entrainment)
Alternative 6 – Restoration (Impingement and Entrainment)
Table A-1 provides a brief review of ENSR’s findings relative to the various technologies. The findings are supported by a more detailed evaluation below.
Alternative 1 - Traveling Screen Modifications with Fish Removal and Return System
− 1a - Dual Flow Screens
Description:
This discussion evaluates the Beaudry-type dual-flow screen system, which is commonly used for new or retrofit applications. With dual-flow, single-exit screen, incoming water is filtered with both the upward and downward moving parts of the screen, and the water flows toward the pump from the interior through the open side of the screen. The screen faces are oriented parallel to the direction of flow. If space is available, the screen length can be extended outward such that the area of the screens can be greater than the area of a conventional flow-through screen in the same location. Therefore, the dual-flow design has the potential to reduce through-screen velocity compared to flow-through (single entry, single exit) design.
The dual-flow design also provides an advantage of eliminating the potential for debris that is stuck on the screen to be dislodged on the downstream side of the screen. This feature may have the added benefit of lower wash water pressure requirements depending on the configuration.
Technical Feasibility and Reliability:
For retrofit applications, the space available to install may be limited by the existing structure (trash racks upstream and pump vault downstream) and water body constraints (navigation). Such limitations would limit the ability to increase screen surface area, thereby limiting the ability to reduce through-screen velocity.
Hydraulic issues with a dual-flow screen are commonly encountered. One of the common limitations is the flow disruption that is caused by the two 90-degree turns that cooling

A-3
water must undergo to pass through the system. These issues can be minimized (but not eliminated) by proper hydraulic analysis and design.
Dual flow screen are commercially available and have been in use for years.
For the site-specific evaluations, the dual-flow screens with conventional mesh are assumed to provide adequate screen area to reduce through-screen velocity to 0.5 feet per second (ft/s). Otherwise, there would be no advantage to changing from a through-flow screen to a dual-flow screen. In some cases, the required screen area may result in the need for additional new intake structures to accommodate the screens.
Cost Considerations:
The cost of dual-flow screens is expected to be up to 20% higher than comparable through-flow screens.
Effectiveness:
Dual-flow screens have the potential to reduce through-screen velocities and therefore impingement mortality, with the addition of an appropriate fish handling and return system. However, depending on the proximity of other screens and structures, the full screen area may not be effectively used, and through-screen velocities on parts of the screen may be substantially higher than design, thereby reducing the potential to reduce impingement. In fact, if dual-flow screens are placed in relatively narrow intake bays, the approach velocity to the screen will likely increase and the impingement rate could increase. In general, space constraints would limit effective application of this technology.
Potential for Other Adverse Effects:
An intake structure that is reconstructed to accommodate a larger dual-flow screen may interfere with navigation.
Overall Assessment of Alternative:
Installation of dual-flow screens could result in a reduction of impingement mortality but would not reduce entrainment. Site-specific constraints may limit effectiveness of this technology to reduce through-screen velocity.
• 1b - Ristroph Screens

A-4
Description:
This alternative would involve modification of the traveling screens so that fish which are impinged on the screens could be removed and returned to the source water body with minimal stress and mortality.
A range of measures could be pursued to optimize fish handling and return. This might include more frequent rotation of the screens, re-fitting the screen with fish buckets, institution of low-pressure wash, replacement of the fish return trough, and rerouting of the fish return to a more suitable location. A complete refurbishment might consist of the following measures: A low-pressure spray would be used for fish removal prior to the high-pressure debris removal spray wash. Fish would be carried in fish buckets – i.e. water-filled lifting buckets designed such that they will hold approximately 2 inches of water once they have cleared the surface of the water during the normal rotation of the traveling screens. The fish bucket would be designed to hold the fish in water until the screen reaches the point where the fish are washed by the low pressure spray onto a sluiceway. The modified traveling screens would be operated continuously during periods when fish are being impinged. Removed fish would be returned to the source water body by a sluiceway wide a smooth surface and sides that retain water such that organisms are gently returned to a location removed at least 100 feet from the intake structure such that the potential for re-impingement would be minimized. All surfaces of the fish handling and return system would be smooth to minimize abrasion damage to organisms.
Technical Feasibility and Reliability:
The technology proposed for this alternative is well known and has been implemented for numerous power plants. However, a separate collection and piping system may need to be constructed to provide a separate return path for fish to the river or lake. This piping system would have to be constructed within the existing power plant footprint which could present engineering, construction, and logistics problems. Routine maintenance, primarily consisting of inspection and cleaning of the fish handing and return system, would be required but not expected to be extensive. Maintaining the system during icing conditions is likely to be complicated. The modified fish troughs extend farther out from the screens than conventional troughs. Therefore, space limitations may affect the cost and feasibility of installation.
Cost Considerations:
The retrofit of a fish removal and return system should consider complete replacement of the existing traveling screens. Installation of an effective fish return system can be complex and expensive. Operation and maintenance activities include frequent, if not continuous, screen operation and power costs for screen and water spray operation.

A-5
Effectiveness:
Modified screens and fish handling and return systems have been used to minimize impingement mortality at a wide number of plants throughout the United States. Studies have demonstrated survival of impinged fish over a wide range. Survival rates of 70-80% are typically achieved for some species. It is notable that many small schooling species (e.g., anchovies) suffer from high mortality at traveling screens, even those with Ristroph-type modifications.
Potential for Other Adverse Effects:
No adverse effects are expected from this alternative.
Overall Assessment of Alternative:
Modification to traveling screens would likely result in a reduction of impingement mortality and would not reduce entrainment.
• 1c - Fine Mesh Traveling Screens
Description:
Typical vertical traveling screens, with mesh sizes ranging from 1/8-inch to ¾-inch, are not designed to screen ichthyoplankton or eggs from the intake water. This alternative would involve replacement of the existing traveling screens with fine mesh screens having mesh spacing as small as one millimeter. This mesh spacing would result in a reduction of entrainment of fish eggs and larvae. In addition, an intake approach velocity of 0.5 ft/s or less would be necessary to minimize physical damage to plankton that would be impinged on the fine mesh screens.
Because of flow area for a screen with one-mm (about 1/32-inch) mesh is approximately two thirds that of a 3/8-inch mesh, the screen area would have to be increased by nearly 50% to maintain the same through-screen velocity. For most plants, the screen area would have to be further increased to maintain a 0.5 ft/s velocity to reduce mortality of impinged fish or shellfish. In most cases, the area around the existing pump house/screen house structure is not sufficient to allow for the increased number of fine mesh screens without substantial modification to the plants. The screens would be operated continuously to prevent excessive accumulation of debris and organisms.
The fine mesh screen structure would include curtain walls to protect against floating debris, bar racks to prevent submerged debris from damaging the fine mesh screens, and
A-6
a screen wash and marine biota removal and open sluice biota return system (similar to that described for the Ristroph screen).
Technical Feasibility/Reliability:
The technology and construction techniques required for this option have been used at a limited number of power plants, often with limited reliability. At two power plants, Millstone and Brayton Point, the fine mesh screens were replaced with standard screen mesh after clogging incidents. Based on the available information, it is concluded that there is a relatively high potential for fouling of the intake screens and that extensive maintenance would likely be required.
In conclusion, because of the potentially large increase in screen area required, site-specific conditions may preclude the installation of a modified intake structure of sufficient size.
Cost Considerations:
The capital cost of the fine mesh screen alternative should include any necessary modifications to the intake structure, as well as construction of an effective fish return system to handle the more sensitive species or life stages of fish and shellfish. Operation and maintenance costs include one maintenance episode (6 days) each year, replacement parts, system monitoring by plant staff (10 hours per week), and power costs.
Effectiveness:
Fine mesh screens, with a low pressure wash and return system, have not been demonstrated to result in consistent effectiveness in reducing mortality at early life stages. This is a significant concern because organisms that are entrained and discharged may have a far greater chance of survival than if such organisms are impinged and subsequently washed back to the receiving water. Therefore, even though entrainment reductions of 50% to over 90% have been achieved at number of power plants using fine mesh screens, compliance with the impingement mortality performance standard could be in jeopardy. Because the calculation baseline levels of entrained organisms are typically far greater than the levels of impinged organisms, the reduction in impingement mortality will likely need to be nearly 100% for the early life stages to meet the 80-95% performance standard.
Potential for Other Adverse Effects:
The major potential adverse effect associated with the technology is the potential unreliability of the cooling water flow associated with clogging events.

A-7
Overall Assessment of Alternative:
Fine mesh screens can meet performance requirements for entrainment, but impose a relatively high potential for operational issues associated with screen clogging. Mortality of ichthyoplankton removed from the screens is likely to be high. The cost of the screen panels, as well as the cost of a revamped intake structure to accommodate the additional screen area required, is extremely high. Space limitations may preclude the installation of adequate screen area.
• 1d - Angled and Modular Inclined Screens
Description:
Angled and inclined screens use standard flow-through traveling screens set at an angle to the incoming flow. With these screens, the angle causes the fish to move toward the end of the screen, where a bypass facility returns the fish to the water body.
Technical Feasibility/Reliability
Angled screens have been used at Brayton Point. The installation requires considerably more space than conventional screens. Retrofit applications would likely require substantial modifications to the existing intake structure. The fish handling and return system requires independently induced flow, adding to the complexity of the system.
Cost Considerations:
Retrofit of angled or inclined screens should include the need to revamp the intake structure, as well as the installation of an effective fish return system.
Effectiveness:
Brayton Point has had mixed results with both diversion and latent survival, depending on fish species. EPA reports survival efficiency ranging from 0.1% for bay anchovy to 97% for tautog. The difference in effectiveness between angled screens and conventional screens with fish return is not evident.
Potential for Other Adverse Effects:
The bypass flow can be substantial, resulting in additional operating costs.

A-8
Overall Assessment of Alternative:
Angled or inclined screens are in limited use. Although they may be effective in reducing impingement mortality, it is not clear whether their performance differs from a conventional screen. Because there is no apparent advantage, angled or inclined screens are not considered further in this analysis.
Alternative 2 – Fixed Screening Devices
• 2a – Wedgewire Screens
Description:
Wedgewire screen is constructed of wire of triangular cross section such that the surface of the screen is smooth while the screen openings widen inwards. Fine mesh screens have slot spacing of less than 9.5 mm (3/8 inch) and are typically less than 3 mm. Slot size for coarse mesh screens is 9.5 mm or greater. The cylindrical screen design has been used at several power plant applications. However, most of these applications have been for closed-cycle cooling systems.
A typical installation would include an array of tee shaped cylindrical screens. If 1-mm slot size were required, a plant with a 500 MGD cooling water flow would require approximately 15 7-foot diameter by 23-foot long screens. The screens would be placed in the intake water body at a depth such that it would not present a hazard to navigation.
The screens would be cleaned periodically with an automatic compressed air system when located near shore. A large plenum structure would be added to the front of the intake structure to distribute the flow from the intake array. The existing intake structure would remain intact and functional. It could be used as a backup to the wedgewire screen system. The plenum structure would have openings that would allow flow to pass in case of screen clogging. Alternatively, wedgewire screen must be sized to minimize clogging and is subject to periodic manual cleaning.
For far-offshore applications, a compressed air cleaning system is not practical. Under such conditions, the reliability of fine mesh screens is highly uncertain due to debris loading as well as fouling with in situ growth. Therefore, in these circumstances, only coarse mesh wedgewire screens should be considered.
Technical Feasibility/Reliability:
Wedgewire screens have been widely used for hydropower diversion structures. The cylindrical screen structures have been used successfully for many years for water
A-9
withdrawals up to 100,000 gpm. Withdrawals of larger quantities are rare. The wedgewire cylindrical screens have been implemented at only two relatively large power plants with once-through cooling systems: Campbell Unit 3 on Lake Michigan, and Eddystone Unit 1 on the Delaware River. The high number of wedgewire screens required for many plants is higher than has been previously used and likely poses impractical logistical issues associated with placement in an off-shore environment.
The long-term reliability of the wedgewire screens of the one-millimeter size is unknown. Although some vendors have proposed construction materials which would prevent mussel or other biological growth on the screens, the requirements for biofouling control are uncertain and differential pressures across the screens could create substantial unit reliability issues. The automatic back flushing would reduce screen fouling from both biological growth and suspended particulate matter. However, to be effective for screen cleaning, this system requires an ambient current to transport the removed particles from the vicinity of the screens. In waters with minimal current, debris accumulation may be excessive and backwashing ineffective. Small or negligible currents in the intake water body could make wedgewire screens impractical, especially fine-mesh screens.
In addition, if the screens were to be located at a distance from the shore, considerable length of large diameter piping would be necessary to connect the screens to the existing cooling water system. Installation of such a system will result in significant cost as well as potential disruption of the site and the waterbody.
Cost:
The cost for the wedgewire screen alternative should consider the distance offshore, needed piping, and air-burst cleaning system. Operation and maintenance costs include two maintenance dives (6 days each) each year, replacement parts, and system monitoring by plant staff (10 hours per week).
Effectiveness:
Wedgewire screens have been demonstrated to essentially eliminate impingement and, for smaller slot sizes, reduce larval entrainment. The 1-mm slot size has been demonstrated to reduce entrainment by over 80 percent at some plants. However, achievement of such results is dependent on the presence of relatively high ambient currents that can sweep the plankton along past the screens.
Potential for Other Adverse Effects:
The primary adverse effect associated with this alternative is the potential for obstruction to navigation caused by multiple submerged structures in the waterbody near the plant. In

A-10
addition, the presence of rock rip-rap around a large number of screen structures can result in a “reef effect,” causing the fish population density to increase in the vicinity of the screen structure. This phenomenon is more likely in cases where there is very little spawning habitat near the intake location. As previously mentioned, the engineering requirements for biofouling control are uncertain and differential pressures across the screens could cause cavitation of circulating water pumps creating substantial unit reliability issues.
Overall Assessment of Alternative:
Wedgewire screens have the potential for clogging and interference with navigation. Without adequate sweeping velocity, a small enough slot size to reduce entrainment is not recommended. The cost of this alternative is high and is strongly dependent on the number of screens needed and the length of new pipeline construction needed to interconnect all of the screens and to build a common tunnel to the shoreline.
− 2b – Perforated Pipes
Description:
With perforated pipes, water is drawn through perforations or slots in a pipe located in the waterbody. EPA included this technology in its discussion of intake technologies. However, perforated pipes have been used only in small water withdrawal applications. It is also subject to clogging and fouling. It is also similar in principal to wedgewire screens. Therefore, this technology alternative will not be discussed further.
− 2c - Barrier Nets
Barrier nets are wide-mesh nets that are placed in front of the intake structure entrance. The nets are sized to prevent the fish to pass through, and low velocities are maintained at the net to allow affected fish to swim away. Barrier nets would be mounted on a frame that would allow ease of cleaning or replacement.
Technical Feasibility and Reliability:
Barrier net systems involve technologies that are in widespread in freshwater systems but less so in marine settings. Construction techniques that would be used for these systems are commonplace but would have to be engineered to withstand wave and current energies. Maintenance requirements, include routine cleaning of debris and/or net replacement, are far higher in marine settings than in freshwater ones. Finally, placement of a barrier net at the intake has the potential to adversely affect boat traffic. Placement

A-11
typically involves suspension from existing pylons or walls. Creation of a new set of anchors, etc. will complicate installation and increase costs.
Cost Considerations:
For typical power plants, the estimated capital cost for installation of barrier nets is $0.5M to $1.5M. The estimated operation and maintenance cost is approximately $50,000 per year for freshwater deployments. Operation and maintenance costs include monthly change out and deployment and removal.
Effectiveness:
Barrier nets have been shown to be effective for impingement reduction at a number of plants, and greater than 90% reduction in impingement has been realized at a number of plants. However, they are not effective in deterring fish eggs and larvae, or other planktonic organisms. There is the potential for clogging with debris; hence a routine cleaning operation is essential. Adequate area to allow low through net velocity (<0.5 ft/s, often <0.1 fps) is important to prevent clogging and collapse.
Potential for Other Adverse Effects:
This alternative could pose limitations on navigation in the vicinity of the intake.
Overall Assessment of Alternative:
There have been a number of positive experiences with barrier nets for reduction in impingement, and the cost is very low compared to other technologies. Barrier nets will not address entrainment, routine cleaning is essential, and removal during the winter is necessary to avoid serious damage to the nets.
− 2d - Aquatic Filter Barrier System
Description:
Aquatic filter barrier systems are designed to completely enclose an existing intake structure and essentially filter the water drawn through the fabric to the intake structure. The best known manufacturer of aquatic filter fabric systems for power plant intake applications is Gunderboom. The Gunderboom system is a double panel, full water depth fabric curtain suspended from flotation billets at the water surface and secured in place by an anchoring system. The system includes mooring lines, ballast chain, anchoring system and an automated compressed air cleaning system. Automatic alarms and monitors may
A-12
be installed in an appropriate control room to monitor the fabric alignment and system operation.
The standard design hydraulic loading rate of the Gunderboom fabric is 3-5 gpm per square foot with a generally recommended maximum range of 10-12 gpm per square foot. At the recommended design hydraulic loading and an assumed water depth of 15 feet, a length of fabric of more than one mile would be required for a 500 MGD cooling water flow. Therefore at a minimum, this alternative would require that a large area around the intake structure be encompassed by the fabric for most large power plants with once-through cooling.
Technical Feasibility/Reliability:
The technology and construction techniques required for this option have been fully implemented only at the Lovett Power Plant in New York State. Clogging of the Gunderboom is a routine maintenance issue. The length of fabric required would encompass a large area around an intake structure. Aquatic filter barriers are not likely to stand up to high energy environments such as those offshore of the California coast. Fouling and impacts of debris are also likely to be an issue.
Cost Considerations:
The estimated capital cost of the Gunderboom alternative is high compared to other near-shore technologies. The operation and maintenance costs include the mobilization and installation/ demobilization and removal of the system each year. They also include regular underwater inspections of the filter curtain each month and one thorough underwater inspection each year.
Effectiveness:
Aquatic filter barriers have been demonstrated to be effective in substantially reducing larvae entrainment and fish impingement losses at power plant intakes on the Hudson River. As a result, the New York State DEC is a strong advocate of this technology for entrainment and impingement reduction. However, clogging and ambient conditions can increase the risk of fabric failure, rendering the system ineffective.
Potential for Other Adverse Effects:
Because this aquatic filter barrier application would require closing off much of the waterbody near the plant, marine navigation would be restricted. The potential for aquatic organisms to be impinged in the fabric is a concern.

A-13
Overall Assessment of Alternative:
Based on the logistical and potential navigation issues associated with the extensive area of the waterbody that would be encompassed by the aquatic filter fabric, and operational issues associated with potential clogging of the fabric, it is not likely that this alternative would be practical in any once-through application with large flow rates.
− 2e - Porous Dams/Leaky Dikes
Description:
Porous dams, also known as leaky dams or leaky dikes, are filters constructed of stones surrounding the cooling water intake. The core of the dike is composed of gravel or stone which allows water to be drawn through it. The exterior of the dike is armored with larger rocks. The dam serves as a behavioral and physical barrier to aquatic organisms. The reduced flow rate across the full face of the dam greatly reduces impingement; however, “hot spots” of high velocity may be present in local areas of high porosity, and its effectiveness in screening fish eggs and larvae is not well established.
Technical Feasibility and Reliability:
Because of its size, a porous dam constructed around an intake structure may not be practical in waterbodies of limited size, because of potential impacts to navigation.
Cost Considerations:
Because of its large size, a large part of the capital cost of a porous dam is materials (stone and gravel). Operation and maintenance would include routine maintenance and potentially heavy cleaning or dredging every five years.
Effectiveness:
If the surface area is sufficiently large, the porous dam intake structure could result in a lower impingement rate, but may not decrease the entrainment rate. The porous dam would decrease impingement due to low intake velocity across the dam face and the physical barrier created by the stones used in the dam. The dam structure would need to be located such that its construction does not impact known spawning beds. The presence of the stone could create spawning areas where there were none and could actually serve to increase entrainment. Alternatively, potential spawning areas created by the porous dam may act as a restoration measure and increase the production of fish in the water body.

A-14
Potential for Other Adverse Effects:
Significant biofouling could be expected due to algae, aquatic weeds (e.g., watermilfoil), and zebra mussel. Biofouling of the porous dam would reduce plant cooling water intake rate. The size of the porous dam is large, and its construction has the potential to damage fish spawning areas. In smaller waterbodies, a dam of sufficient size to effectively reduce intake velocity could impede marine navigation.
Overall Assessment of Alternative:
A porous dam will likely be effective for reduction in impingement if designed for low intake velocity. Entrainment performance is uncertain. Reliability of water flow is uncertain because of the potential for fouling.
Alternative 3 - Submerged Offshore Intake Structure
Description:
An offshore intake structure alternative would consist of a structure with velocity cap (or other technology such as wooden cribs or wedgewire screens), and a single pipeline into the plant. The size of the structures would be designed to achieve a nominal intake velocity of 0.5 ft/s. The velocity cap on the structure provides horizontal flow that reduces the potential for fish impingement. The intake structures would be located in the water body at a water depth of at least 20 feet. The intake pipeline would be placed by either trenching or tunneling.
Technical Feasibility/Reliability:
The technology and construction techniques required for installation of submerged intake structures are well known and understood. Submerged intakes have been constructed at several plants and have been shown to be reliable in the long term. Considerations for designing and constructing the alternative include (1) technology associated with sub-surface placement of the pipe and potential impacts to the bottom along pipeline route, (2) the length of pipeline needed to reach sufficient depth, (3) prevention of fouling on the structure, (4) the potential for adverse impacts due to debris, and (5) the need to avoid obstruction of navigable waters.
Another technical consideration for the offshore intake structure alternative is that the intake water could have a reduced temperature which would potentially improve power plant performance.

A-15
Cost Considerations:
The estimated capital cost of submerged offshore intake is highly dependent on the length of new pipeline needed. One 6-day dive per year would be required for maintenance.
Effectiveness:
The offshore intake structures could result in a lower impingement rate if designed with low intake velocity and velocity cap. Suitable placement of the intake off-shore may reduce the density of eggs and larvae subject to entrainment relative to an on-shore location. The intake structure construction could impact spawning beds. The presence of the intake structure and associated anchor stone and rip-rap could create new spawning areas that did not previously exist and could actually act to increase entrainment.
Overall Assessment of Alternative:
The submerged offshore intake has the potential for reducing impingement and entrainment, if the intake can be located where the density of eggs and larvae is low. Cost is high, and will depend on the required distance offshore. However, potentially cooler intake water temperature may improve power plant performance.
Alternative 4 – Fish Diversion and Avoidance
− 4a – Louvers and Angled Bar Racks
Description:
Diversion devices are physical structures intended to guide fish away from and out of the intake flow. Examples of such devices include angled bar racks and louvers, which are made of a series of evenly spaced, vertical slats placed across a channel at an angle leading to a bypass area. The louvers create localized turbulence that the fish detect and avoid. The louver systems have been tested at hydroelectric plants on rivers.
Typically, angled bar racks and louvers would be in semicircular fashion around a shoreline intake or placed across the mouth of an intake canal. Louvers would be constructed of material compatible with the environment (for example, polyethylene slats for louvers and nylon for nets), and would be mounted on a stainless steel frame, approximately 12 inches apart.

A-16
Technical Feasibility/Reliability:
Louver systems involve technologies that are in widespread use. Construction techniques that would be used for these systems are commonplace. Maintenance requirements could be potentially extensive. Divers will likely be required to routinely clean and/or replace the bar racks or louvers. The potential for damage and clogging from debris is real. Finally, placement of a louver at the intake has the potential to adversely affect boat traffic.
Cost Considerations:
The capital cost for installation of louvers should include consideration for debris loading and damage. Operation and maintenance costs include two 6-day dives per year to clean and maintain the louvers.
Potential Effectiveness:
These diversion devices are not effective in deterring fish eggs and larvae, or other planktonic organisms. Louvers have been tested only in rivers with a substantial current velocity along the bank. They are most effective in diverting migratory fish from intakes in confined river channels, and therefore would be less effective in lakeside applications.
Potential for Other Adverse Effects:
This alternative could pose limitations on navigation in the vicinity of the intake.
Overall Assessment of Alternative:
Louvers/bar racks can effectively reduce impingement of some species of fish, but would not be effective for reducing entrainment. This technology would be effective only with an ambient current. This alternative has relatively high probability of clogging associated with debris, and biological growth and in some settings could impact navigation.
• 4b – Velocity Caps (installed on existing offshore intake)
Description:
A velocity cap is a cover placed on a vertical inlet of an offshore intake structure. The cover results in a horizontal flow to the intake, and may reduce impingement because fish tend to avoid rapid changes in horizontal flow. Intake velocities of 0.5 to 1.5 ft/s are common.

A-17
Technical Feasibility/Reliability:
Installation of a velocity cap on an existing offshore intake may be limited because of water depth and potential interference with navigation. For some applications, a velocity cap may require routine inspection and maintenance to remove accumulated debris.
Cost Considerations:
Costs of installation of a velocity cap on an existing offshore intake should consider intake modifications and materials of construction.
Potential Effectiveness:
Although velocity caps in new offshore intakes have been shown to result in reduced impingement, it is uncertain whether the reported reductions are due to the velocity caps or the new offshore locations. Velocity caps should be designed to minimize intake velocity through the intake structure openings; a maximum intake velocity of 0.5 feet per second should be considered to meet the Phase II intake velocity threshold. In some cases, additional measures (e.g. intake screen improvements, deterrent systems) may be needed to meet impingement performance goals. Velocity caps have no impact on entrainment, although the off-shore location may result in lower entrainment levels compared to an on-shore calculation baseline intake configuration.
Potential for Other Adverse Effects:
The addition of a velocity cap to an existing intake may interfere with navigation.
Overall Assessment of Alternative:
Velocity caps may reduce impingement, but have no effect on entrainment. If the maximum intake velocity is 0.5 feet per second, the Phase II velocity threshold in Compliance Option 1(ii) would be met. As noted above, the offshore location may result in compliance with the entrainment reduction standard.
− 4c - Strobe Lights, Acoustic Deterrent, Bubbles, Chains
General Description:
Behavioral barriers are intended to cause fish to actively avoid entry into the intake flow. Examples include sound barriers, light barriers, air bubble curtains, chains and cables, and electrical barriers. They are often implemented in combination with other devices such as

A-18
physical barriers (e.g., fish nets). The potential behavioral barriers are briefly described below.
Sound barriers consist of devices located at the intake structure, which create sound that repels the fish. Three types of underwater sound have been tested for this application: low-frequency infra-wave sound, low-frequency sound generated by pneumatic/mechanical devices, and transducer-generated sound covering a wide range of frequencies. Low frequency, high-intensity devices have been shown to be effective. High frequency (125 kHz) devices have been reported to be effective in the Great Lakes. Pneumatic impact devices, “poppers”, and “hammers” are examples of devices that have been effective in reducing impingement of some fish such as alewife at power plant intakes. There is some concern that pressure waves from pneumatic devices may be harmful to nearby organisms. In most cases, the use of high-intensity, multi-frequency sound has not been effective in repelling a wide range of fish species from intakes due to the diversity of species and sizes of species in the receiving water.
Light barriers consist of a series of underwater lamps that emit a constant or intermittent (strobe) beam of light. The effectiveness of light barriers as a deterrent has been variable, and even contradictory, in many studies. In some studies fish have been attracted to light while in others they have been repelled. Constant light has been more effective than strobe light in guiding young salmon whereas strobe light has been effective in repelling alewife and gizzard shad. Filtered mercury vapor light has been found to attract certain species of fish away from strobe lights in field studies in Europe. At the Nanticoke Generating Plant on Lake Ontario, smelt, shad, white bass and shiner have been successfully guided away from intake trash racks using mercury vapor light. However, evidence of consistently reliable effectiveness for a wide range of fish species does not exist.
Air bubble curtains or screens consist of a series of diffuser pipes mounted on the base of the intake structure. The diffusers create a continuous, dense curtain of bubbles, which can repel fish. Generally, the air bubble screens have not been successful. They are not effective at night and in turbid water. In one case, at Indian Point Generating Plant on the Hudson River, the air bubble screen actually attracted fish at night.
Chains or cables can be hung vertically from the top of the intake structure to form a physical, visible barrier to fish. The results of studies of this behavioral barrier have been contradictory. The effectiveness of chain barriers is dependent on flow velocity, turbidity and illumination. Debris buildup on hanging chains can disrupt hydraulic flow patterns at the intake.
Electrical barriers consist of a series of electrodes at either side of the intake structure. These barriers have had limited success and can present a safety threat.

A-19
Technical Feasibility/Reliability:
All of the behavioral barrier systems are technically feasible and reliable from the perspective of construction, operation, and maintenance. The behavioral barrier systems that have been implemented with the greatest frequency are sound and light barrier type systems. Each of these potential alternatives would consist of a metal support structure constructed at the front of the intake, sound or light emitting devices mounted on the supports, a power supply, controllers, power cables and mounting hardware. The construction and technology used for these alternatives have been regularly applied. To ensure long-term reliability of these systems, ongoing maintenance will be required. Maintenance of the systems would include cleaning and replacement of light bulbs (for light barrier systems) and prevention of corrosion of the supporting structure.
Cost:
The estimated capital cost of behavioral barriers (e.g. a strobe light barrier system) is generally lower than other technologies. Operation and maintenance costs include items such as the replacement of strobe lights each year using divers, and 10 hours per week of on-site monitoring by plant staff. Costs for other behavioral barrier systems would be similar.
Effectiveness:
Because these barriers rely on the ability of the organism to respond to a stimulus, they are not effective in protecting fish eggs and larvae, or other planktonic organisms. In addition, the effectiveness of these barriers varies among species and across age groups within species. These barriers are most effective when a single species of fish of the same size and age is to be protected. Many the behavioral barriers have not been field-tested so their effectiveness has been extrapolated from laboratory studies. None of these devices has been demonstrated to be consistently reliable in obtaining an avoidance response from a wide range of fish species. Therefore, installation of behavioral barriers would not result in reduction of entrainment, and a reduction in impingement is possible but uncertain.
Potential for Other Adverse Effects:
A potential adverse effect of the behavioral barrier alternative is a slight potential for increased attraction of fish to the intake structure. Also, any structure installed near the intake has the potential to disrupt navigation.
A-20
Overall Assessment of Alternative:
Behavioral barrier technology will not reduce entrainment. However, the technology may effectively divert specific fish species and therefore could be a component of an overall impingement mortality reduction. Based on site- and species-specific variation in response, pilot testing is likely to be necessary.
Alternative 5 - Flow Reduction
− 5a - Variable Speed Pumps
Description:
Variable speed cooling water intake pumps are potentially useful for reducing cooling water flow and the associated entrainment and impingement during peak periods of biological activity. The decrease in cooling water flow results in an increase in plant condenser ∆T (temperature increase through the condenser) and discharge temperature. Therefore, variable speed pumps are most appropriate during cold water periods of the year (winter and spring) in temperate climates where an increase in discharge temperature will not cause a significant increase in biological effects or cause discharge temperatures in excess of maximum acceptable levels.
For other plants, this alternative was considered with the assumption that variable speed pumps would be installed to decrease the cooling water flow by 25% during periods of potentially high entrainment and impingement. This alternative would require replacement of existing single speed drives with adjustable speed drives (ASD) on the circulating water pumps. An on-line condenser tube cleaning system is included in this alternative to alleviate tube fouling which could potentially occur because of lower water flow rates.
Technical Feasibility and Reliability:
The replacement of the existing single speed drives with ASDs is a technically feasible and reliable alternative. However, under full power production conditions using the existing condensers for the units, this alternative, specifically a 25% reduction in flow, could reduce the reliability and efficiency of the entire system. Specifically, the reduction in flow through the condensers could cause operational difficulties (i.e, condenser tube fouling), cause decreased thermal efficiency in the turbines, limit or reduce maximum power production, require condenser replacement, and alter the thermal plume effects at the discharge.

A-21
Cost:
The estimated capital cost of the variable speed pump alternative is $0.5M per cooling water pump. This capital cost assumes that replacement of the existing condensers would not be required. Operation and maintenance costs are difficult to estimate without input from the individual plants regarding thermal efficiency as well as market rates. It should be noted that costs associated with loss of thermal efficiency are likely to be partially offset by the gain in not operating the pumps at full capacity. This cost assumes that the plant could be operated at full capacity during reduced cooling water flow.
Effectiveness:
The use of variable speed pumps to decrease the flow of cooling water through the intake would effectively reduce the entrainment and impingement in the system; however, the resulting increase in temperature in the discharge could increase thermal plume effects. The alternative would amount to a relatively small reduction in flow – and corresponding reduction in impingement and entrainment effects – of approximately 25% for the entire plant during periods of time when the ASDs are in operation. Since the ASDs would not be used during the entire year, the overall reduction in impingement and entrainment would be substantially less than 25%.
Potential for Other Adverse Effects:
As noted above, reduction in cooling water flow during normal plant output would result in an increased discharge ∆T value which could, in turn, cause altered thermal plume effects.
Overall Assessment of Alternative:
By itself, this alternative will not likely achieve performance goals for impingement and entrainment reduction. However, it may be considered as one component of an overall compliance.
− 5b – Capacity Factor Reduction
Description:
A power plant can reduce impingement and entrainment by reducing cooling water requirements through reduced capacity factor of the plant. This approach would require a commitment on the part of the plant to limit cooling water flow to a level below the design flow rate. Unless a very low capacity factor is intended, this approach will likely be used in conjunction with other technologies to meet performance goals.

A-22
There is the potential that regulatory agencies will limit the applicability of this approach for plants with historically low capacity factor. Although the calculation baseline is based on design capacity, the commitment to set a capacity factor limit by a plant with historically low capacity factor may be viewed as an inappropriate approach to meeting the performance goals unless a restriction is included in the plant NPDES permit.
Technical Feasibility and Reliability:
Reduced water flow rate will limit the power production rate based on thermodynamics as well as the thermal discharge limits for the plant.
Cost Considerations:
Reduction on capacity of a plant will have very large financial impact on the ability of a plant to generate revenue. The capital cost to implement this approach could involve installation of equipment to limit operations; however, recordkeeping may be all that would be required to demonstrate the flow reduction achieved.
Effectiveness:
A capacity factor reduction and resulting reduced flow rate should at least reduce impingement and entrainment in proportion to flow reduction. Seasonal differences in density of aquatic life would need to be considered to determine the overall annual reductions in impingement and entrainment from the calculation baseline.
Potential for Other Adverse Effects:
This approach reduces power generation capacity, which would have to be made up elsewhere.
Overall Assessment of Alternative:
If acceptable to the regulating agencies, this alternative may be an important component of a well balanced compliance program.
− 5c - Evaporative Cooling Towers
Description:
The existing cooling water systems use of seawater pumped through a steam condenser and discharged back to the source water body. These systems are generally referred to

A-23
as open cycle or once-through cooling system because the water simply passes through the condenser (no recirculation) where heat is transferred from the steam to the cooling water prior to discharge. Closed cycle systems recirculate the cooling water in a closed piping system. The heated water from the condenser is cooled down in each cycle using evaporative cooling. This cooled water is then recirculated to the condenser to cool and condense the steam from the turbine. In the mechanical draft-cooling tower, fans are used to circulate air that flows against the heated water sprayed inside the tower. Cooled water is collected in the tower basin and returned to the condenser. Water must be introduced into the system at regular intervals to make up for losses due to blowdown and evaporation. The closed cycle evaporative cooling systems require a water withdrawal rate that is about 3 to 5% of the amount of water required in once-through cooling systems.
The makeup water flow for a mechanical draft-cooling tower is typically less than 5 percent of the flow required for once-through cooling. The makeup flow would be pumped to the circulating water system from the current intake structure. Blowdown would be discharged from the tower basin to the discharge canal.
Technical Feasibility and Reliability:
The technology proposed for this alternative is well known and has been implemented for similar power plants. However, this alternative requires substantial open space, consumes a substantial amount of electricity, and reduces the thermal efficiency of the system. In addition, the ability of the existing condensers to handle the higher pressures associated with the recirculating system is uncertain and could have a large effect on the costs for this alternative.
Costs:
The capital cost of the mechanical cooling tower alternative is very high. Operation and maintenance costs are typically estimated to be in the millions of dollars per year, primarily due to additional fan and pump power demands and water treatment requirements. Finally, the increased temperature of cooling water in the steam condensers will results in both efficiency and capacity loss for the generating units. During the hottest summertime conditions when electricity demand is highest, the efficiency and capacity losses could be as high as 10%. This results in the need to purchase replacement power at a premium because a public utility has an obligation to serve its customers and will be required to bear that expense.

A-24
Effectiveness:
The mechanical draft cooling tower alternative would effectively reduce both impingement and entrainment in proportion to the flow reduction, typically 95% or more. This technology meets both the impingement mortality reduction and entrainment reduction performance standards set by the 316(b) Phase II rule for existing plants.
Other Potential Adverse Effects:
The primary adverse effects for the mechanical draft cooling tower alternative are associated with increased water vapor content in the immediate area of the cooling towers. This will result in a visible plume for some periods and has the potential to result in fogging impacts. To reduce the potential for these effects, a plume abatement system would be employed. Because cooling tower drift cannot be eliminated completely, the tower would be located as far as possible from electrical equipment, off-site receptors, and sensitive vegetation. Space limitations may make it difficult to locate the cooling towers to minimize these effects. A cooling tower also imposes noise and aesthetic impacts. Another significant environmental effect is that the decrease in efficiency means that more fuel is burned per unit of electrical energy output. Therefore, a plant with cooling towers will have more emissions than a plant utilizing an open cycle system. The increase in emissions will be proportional to the decrease in plant efficiency. Depending on the weather conditions, the negative effect on efficiency could be anywhere from 1% to 10%.
Overall Assessment of Alternative:
A cooling tower alternative would be effective for reduction of both entrainment and impingement mortality; however, due to the very high costs and limited space available for construction, this alternative is not considered as a part of the compliance.
− 5d – Dry Cooling
Description:
With a dry cooling system air is used as a heat sink to condense steam in the system. Cooling water is essentially eliminated. However, a dry cooling system requires a large cooling surface, many cooling fans, and a more sophisticated steam ducting system, which would require extensive modifications to an existing plant. In addition, an annual average thermal efficiency penalty of 2% to 5% is likely for the power plant. During the hottest summertime conditions when electricity demand is highest, the efficiency and capacity losses could be well over 10%. Because of these high costs, dry cooling is not considered a part of the compliance for any existing plant.

A-25
Alternative 6 - Restoration
Description:
Restoration can be a cost-effective measure for mitigating losses of aquatic organisms and is allowed under the Phase II rule. Under some circumstances (i.e. when loses are to commercially or recreationally important and/or to special status species) it may be possible to affect in-kind replacement. On the other hand, in some cases it may be more appropriate to pursue “out-of-kind” restoration (i.e., restoration through ecosystem or watershed-based resource management approaches with a focus on resources other than those lost at the CWIS). This approach is explicitly allowed by the rule. Both “in-kind” and “out-of-kind” restoration has been pursued as a mitigation strategy at a number of generating stations in California, most notably at the San Onofre Nuclear Generating Station.
Possible restoration methods generally include:
• Fish or shell-fish restocking programs;
• Habitat creation;
• Habitat restoration;
• Habitat enhancement;
• Acquisition and protection of habitat;
• Watershed management and protection to reduce sedimentation or improve water quality; and;
• Support of a state or locally-sponsored restoration program.
Of these measures: four have some degree of precedent in the area of the two Reliant stations: (1) wetland restoration; (2) wetland enhancement; (3) acquisition of wetland habitat; and (4) fish restocking programs.
Fish restocking programs are a way of directly restoring species populations impacted by impingement and entrainment. Restocking programs have proven successful in increasing specific species populations in Southern California. However, the dominant species involved in impingement and potentially entrainment at both plants are not species of significant commercial or recreational importance. Thus, direct replacement of the most commonly impinged species may not be the most ecologically or commercially/recreationally beneficial approach. Alternatively, Reliant believes that taking
A-26
an ecosystem perspective and participating in restocking programs that target at-risk, rare, threatened, and/or endangered fish and invertebrate species such as white seabass, rockfish, and abalone may yield valuable benefits on multiple fronts. Proteus Sea Farms, which is a marine laboratory facility located at Reliant’s Ormond Beach generating station, currently raises white seabass and white abalone as part of an ongoing restoration program. Reliant anticipates continuing its support of Proteus for this demonstrated successful restocking program.
Habitat restoration and enhancement as well as acquisition of nearshore, coastal wetland, and coastal watershed habitats are indirect methods of mitigating impacts to nearshore fish populations that may be associated with impingement and entrainment at both stations. Nearshore habitats are hydrologically connected to and thus are part of the same coastal watershed, a requirement for restoration under the rule. As such, restoration of coastal watersheds can lead to improvement of nearshore habitats. Coastal wetlands can serve as spawning, nursery, and feeding grounds for fish and invertebrates that are integral to the local marine ecosystem. Thus, restoration and/or protection of coastal watersheds are good focal points for managing coastal resources as these restoration activities will contribute to the long-term health of the ecosystem.
Reliant believes that embracing a watershed approach and pursuing “out-of-kind” restoration efforts that increase the biological, physical, and chemical quality of the coastal watersheds influenced by both stations (including Ventura River, Santa Clara River, and Calleguas Creek Watersheds) are appropriate potential mitigation measures under the rule. While there is little opportunity for intertidal restoration at and in the vicinity of either facility, there are numerous restoration projects currently underway in Ventura County to which Reliant could contribute including:
• Ormond Beach Wetland Restoration Project (Mugu Lagoon) wetland restoration, enhancement, and acquisition projects of the Ormond Beach wetlands;
• The Nature Conservancy: wetland restoration, enhancement, and acquisition projects along the lower and upper Santa Clara River Watershed;
• Southern California Wetlands Restoration Project: wetland restoration, enhancement, and acquisition projects at Ormond Beach and along the lower and upper Santa Clara River Watershed;
• Santa Clara River Wildlands Protection Project: enhancement and acquisition projects along the lower and upper Santa Clara River Watershed;
• Grunion Greeter Program: research projects including a long-term grunion population assessment and an assessment of the usefulness of grunion as an environmental indicator for sandy beach habitats;

A-27
• McGrath State Beach: threatened and endangered species habitat protection;
• Proteus SeaFarms/Channel Islands: restocking program for white abalone and white seabass; opportunity for expansion to include additional species;
• Water Quality Improvement Projects: agricultural and non-point source stormwater runoff;
• Matilija Coalition: wetland restoration and enhancement projects along the Ventura River including removal of Matilija Dam, recovery of Southern Steelhead trout and, restoration of the natural sediment supply to the beaches of Ventura
As part of the CDS, Reliant will evaluate these and other restoration measures as means of cost-effectively restoring impingement and entrainment loses while improving the biotic integrity of the local coastal ecosystem. The evaluation will consider the findings and goals of relevant resource agencies as well as the interested public.
Technical Feasibility/Reliability:
Each of the potential restoration methods has been used with success in a number of applications. Each of the restoration methods would require an assessment of whether any conditions in the water bodies would preclude long-term success. The potential for court-remanding of the restoration measures should be considered.
Cost Considerations:
The capital costs of this alternative as well as ongoing operational and/or monitoring costs are expected to range widely depending on the number and type of restoration efforts selected. Reliant is committed to cooperating with local, regional, state, and federal agencies to leverage funds they provide to secure matching funds thereby maximizing the overall benefit to the environment.
Effectiveness:
There is little existing quantitative information on increases in biological production at habitat areas to offset impingement and entrainment losses. However, restored habitat areas have been demonstrated to result in an increase in biota and spawning. Additionally, a well-designed stocking program would provide a direct replacement of important species on an adult-equivalency basis, although the replacement would be out of kind from those removed by the CWIS.

A-28
The out of kind restoration discussed above would have a high potential to be effective in restoring important local habitats, however, these benefits would not readily equated to losses from the CWIS.
Other Adverse Effects:
There are no likely adverse effects of the restoration alternative.
Overall Assessment of Alternative:
This alternative is technically feasible, may have relatively low costs, and is likely to be effective (though at this point it is difficult to quantify the degree of mitigation that would be obtained). The alternative would also provide an overall environmental benefit to the affected water bodies.

APPENDIX B
REVIEW OF PACIFIC OCEAN FISHERIES

B-i
APPENDIX B REVIEW OF IMPINGEMENT AND ENTRAINMENT AT RELIANT’S PHASE II ASSETS
TABLE OF CONTENTS
EXECUTIVE SUMMARY ............................................................................................................ 1
1.0 INTRODUCTION .................................................................................................................. 4
1.1 Goals ........................................................................................................................... 4
1.2 Organization of Document ............................................................................................ 5
2.0 REVIEW OF THE RULE’S GOALS....................................................................................... 6
3.0 TAXONOMIC IDENTIFICATIONS [125.95(B)(3)(I)]............................................................... 7
3.1 Pacific Ocean/Southern California Bight Species Composition ...................................... 8 3.1.1 Summary of Literature ........................................................................................ 9 3.1.2 Species-Specific Discussion ............................................................................. 11
3.2 Historical Patterns....................................................................................................... 15
3.3 Commercial and Recreational Species........................................................................ 15
3.4 Threatened and Endangered Species......................................................................... 16
4.0 CHARACTERIZATION OF LIFE STAGES [125.95(B)(3)(II)]............................................... 16
4.1 Entrainment................................................................................................................ 17
4.2 Impingement............................................................................................................... 17
5.0 DOCUMENTATION OF CURRENT IMPINGEMENT MORTALITY AND ENTRAINMENT [125.95(B)(3)(III)]...................................................................................................................... 17
5.1 Current Status of Fishery Population and Representativeness of Historical Data ......... 18
5.2 Review of Impingement and Entrainment Data at Reliant Facilities.............................. 18 5.2.1 Ormond............................................................................................................ 18 5.2.2 Mandalay ......................................................................................................... 22

B-ii
5.2.3 Discussion of IM and E Data at Reliant Facilities............................................... 25
5.3 Sufficiency of Data to Estimate Calculation Baseline ................................................... 28
6.0 SUFFICIENCY OF DATA IN SUPPORTING THE IMECS ................................................... 29
6.1 Data Quality Assurance/Quality Control ...................................................................... 29
6.2 Most Common Species Impinged/Entrained................................................................ 30
6.3 Implications for CWIS Placement, Design, and Operation............................................ 30
7.0 REFERENCES ................................................................................................................... 31
LIST OF TABLES
B-1 Ten most abundant fish species impinged during normal operations and heat treatment at Ormond (1980–2004) .................................................................................................B-34
B-2 Twenty Most Abundant fish species impinged during normal operations and heat treatment at Mandalay (2001-2004) ............................................................................B-35
B-3 Twenty most abundant fish species taken during trawl surveys at Mandalay (1979-2004) ...............................................................................................................B-36
B-4 Impingement Data for Ormond (1997-2004)................................................................B-37
B-5 Impingement Data for Mandalay (2001–2004) ............................................................B-41
B-6 Historical Entrainment Data for Ormond (1979-1980) ..................................................B-42
B-7 Estimated Impact of Ormond Station Operation on Fish Resources.............................B-43
B-8 Historical Entrainment Data for Mandalay taken at Haynes Generating Station (1979-1980) .........................................................................................................................B-44
B-9 Estimated Impact of Mandalay Station Operation on Fish Resources ..........................B-45
B-10 Habitat Description for Commonly Impinged Fish Species at Reliant’s Ormond & Mandalay Stations......................................................................................................................B-46
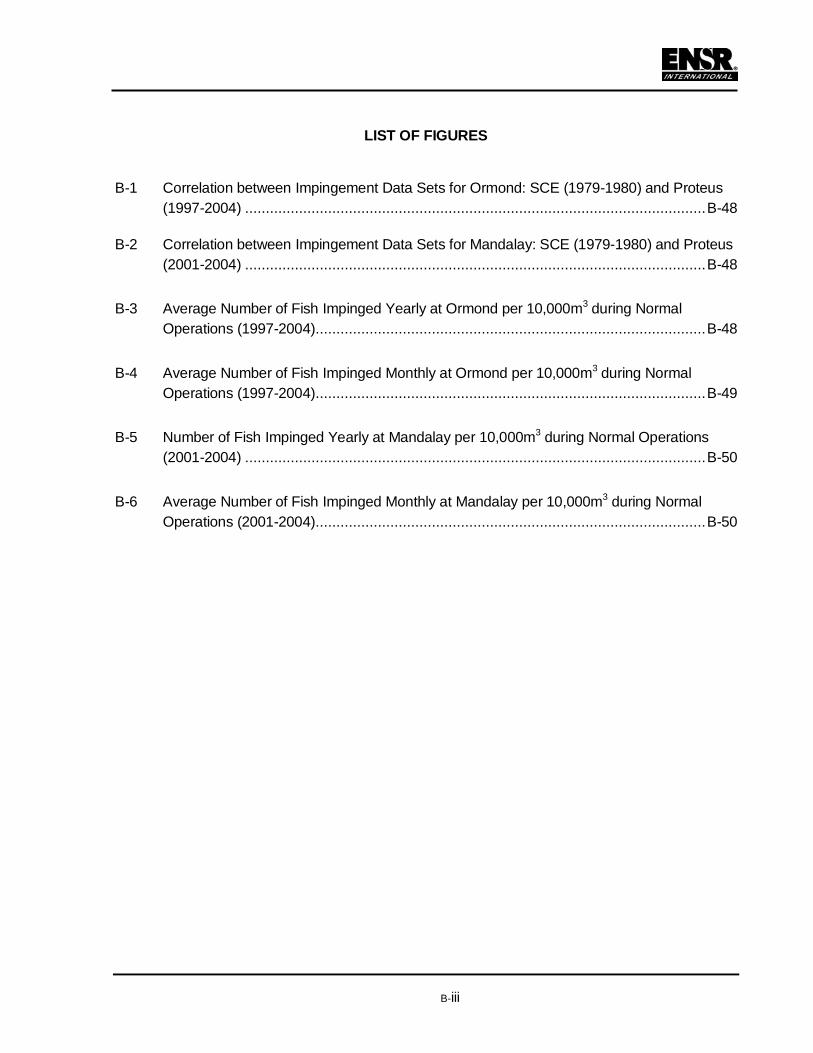
B-iii
LIST OF FIGURES
B-1 Correlation between Impingement Data Sets for Ormond: SCE (1979-1980) and Proteus (1997-2004) ...............................................................................................................B-48
B-2 Correlation between Impingement Data Sets for Mandalay: SCE (1979-1980) and Proteus (2001-2004) ...............................................................................................................B-48
B-3 Average Number of Fish Impinged Yearly at Ormond per 10,000m3 during Normal Operations (1997-2004)..............................................................................................B-48
B-4 Average Number of Fish Impinged Monthly at Ormond per 10,000m3 during Normal Operations (1997-2004)..............................................................................................B-49
B-5 Number of Fish Impinged Yearly at Mandalay per 10,000m3 during Normal Operations (2001-2004) ...............................................................................................................B-50
B-6 Average Number of Fish Impinged Monthly at Mandalay per 10,000m3 during Normal Operations (2001-2004)..............................................................................................B-50

B-1
EXECUTIVE SUMMARY
The Phase II rule developed under Section 316(b) of the Clean Water Act requires consideration of the fishery of the cooling water source. The specific make up of a portion of the Comprehensive Demonstration Study (CDS), the Impingement Mortality and Entrainment Characterization Study (IMECS) is outlined by the rule. This Appendix will review these requirements within the context of the available literature for Reliant’s Ormond Beach (Ormond) and Mandalay (Mandalay) generating stations located on the Pacific Ocean. The literature reviewed includes data collected at the Ormond and Mandalay stations as well as the more general literature. This Appendix will evaluate whether these data are sufficient to support development of the IMECS and will also evaluate several important issues relative to the assessment and mitigation of impingement and entrainment at the stations.
Two efforts have been made to characterize impingement and entrainment at the two stations:
• Section 316(b) Demonstrations studies developed in the late 1970s; and
• Ongoing studies of impingement at both stations.
As shown below, Reliant has drawn the following conclusions based on the review of available literature:
• The more recent survey of impingement is of very high quality. Several samples are available over a number of years. The methods are standard ones and the full suite of fish and shellfish are enumerated, weighed, and measured for length. These data, which will continue to be collected, fully address the goals of the IMECS as articulated in the rule.
• A relatively small number of species are subject to impingement at Mandalay. These species are typical of coastal environment. Few species that favor harbor or estuary habitats are impinged. A much larger number of species are impinged at Ormond Beach including those from coastal and estuarine environments. Most of the impinged fish at both stations are schooling species. The overall rate of impingement (i.e., fish/10,000 m3) is far lower at Ormond Beach than at Mandalay.
• The older surveys of impingement mortality and entrainment at both stations used appropriate methods but suffer from a focus on 14 target species. The target species do not include the dominant species in the most recent data at Mandalay, grunion. Entrainment was measured at Ormond Beach. The older data on entrainment at Mandalay was collected at another facility.
B-2
• The overall pattern of impingement of the 14 target species is similar between the two surveys (r2 = 0.93 for Mandalay, r2 = 0.80 for Ormond Beach). This similarity includes overall species composition as well as the number and biomass of fish impinged.
• The impinged species in the two surveys include several but not all of those that are common in embayment or nearshore habitat of the Pacific Ocean.
• Grunion and other schooling species show significant periodicity in impingement at Mandalay but far less so at Ormond Beach. This results in very high inter-sample variation in impingement rates at Mandalay. This apparent periodicity is likely due to a combination of factors including the normal periodicity in the presence of the species (e.g., grunion runs on spring tides in March through June) and the irregular schedule of operation of the plant. For example, 2004 surveys indicate that few grunion were collected during the survey, yet they were the species with the highest rates of collection during sampling in 2002 and 2003. These results may indicate that grunion were not impinged in 2004, although it is more likely that the sampling in 2004 did not occur while the grunion were spawning. No large-scale impingement events are apparent in the record at Ormond Beach.
• Recent surveys of ambient fish populations have occurred offshore of the Mandalay station for several years and historical fish populations were sampled in the late 1970s off both stations. The species encountered during these surveys have been relatively consistent over the last 20+ years and are very similar in composition to the fish impinged at Ormond station which is located a relatively short distance down the coast from Mandalay. In sharp contrast, the most important components of the ambient population are impinged very infrequently at Mandalay and the dominant species impinged are very poorly represented in the ambient population.
• At Mandalay, the set of observations above suggest that coastal species, especially grunion, may run into the Channel Island Harbor and the Edison Canal. This movement may be encouraged, in part, by the induced flow velocity into the canal. If these coastal species orient their movement to flow while harbor residences do not, this may help to explain the importance of coastal species among impinged fish. No such behavior is apparent in the Ormond Beach impingement data set.
• The flow normalized rate of fish impingement during normal operation is far lower at Ormond Beach (0.09 fish/10,000 m3) than at Mandalay (4.96 fish/10,000 m3). This is likely associated with the location and configuration of the Ormond Beach CWIS (e.g., the velocity cap) including the absence of major impingement events associated with spawning fish.
• Both stations use heat treatment to control biofouling of the CWIS. Total impingement is monitored during the entire duration of any heat treatment event and tallied separately
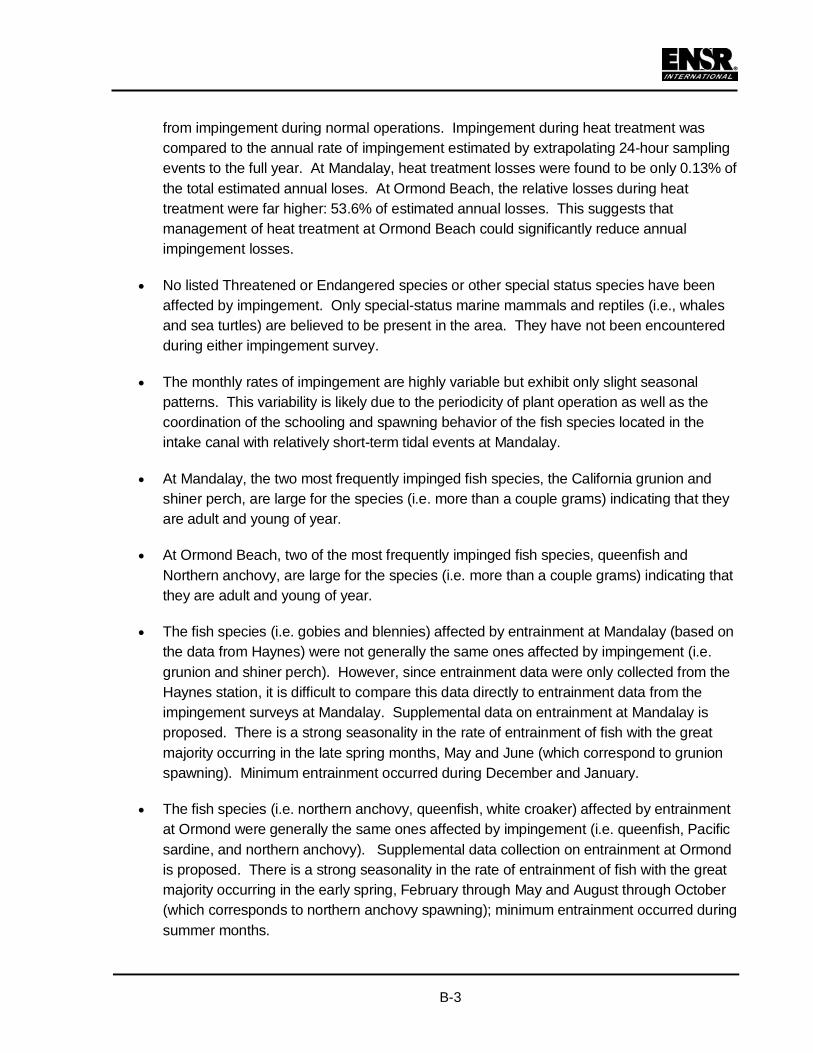
B-3
from impingement during normal operations. Impingement during heat treatment was compared to the annual rate of impingement estimated by extrapolating 24-hour sampling events to the full year. At Mandalay, heat treatment losses were found to be only 0.13% of the total estimated annual loses. At Ormond Beach, the relative losses during heat treatment were far higher: 53.6% of estimated annual losses. This suggests that management of heat treatment at Ormond Beach could significantly reduce annual impingement losses.
• No listed Threatened or Endangered species or other special status species have been affected by impingement. Only special-status marine mammals and reptiles (i.e., whales and sea turtles) are believed to be present in the area. They have not been encountered during either impingement survey.
• The monthly rates of impingement are highly variable but exhibit only slight seasonal patterns. This variability is likely due to the periodicity of plant operation as well as the coordination of the schooling and spawning behavior of the fish species located in the intake canal with relatively short-term tidal events at Mandalay.
• At Mandalay, the two most frequently impinged fish species, the California grunion and shiner perch, are large for the species (i.e. more than a couple grams) indicating that they are adult and young of year.
• At Ormond Beach, two of the most frequently impinged fish species, queenfish and Northern anchovy, are large for the species (i.e. more than a couple grams) indicating that they are adult and young of year.
• The fish species (i.e. gobies and blennies) affected by entrainment at Mandalay (based on the data from Haynes) were not generally the same ones affected by impingement (i.e. grunion and shiner perch). However, since entrainment data were only collected from the Haynes station, it is difficult to compare this data directly to entrainment data from the impingement surveys at Mandalay. Supplemental data on entrainment at Mandalay is proposed. There is a strong seasonality in the rate of entrainment of fish with the great majority occurring in the late spring months, May and June (which correspond to grunion spawning). Minimum entrainment occurred during December and January.
• The fish species (i.e. northern anchovy, queenfish, white croaker) affected by entrainment at Ormond were generally the same ones affected by impingement (i.e. queenfish, Pacific sardine, and northern anchovy). Supplemental data collection on entrainment at Ormond is proposed. There is a strong seasonality in the rate of entrainment of fish with the great majority occurring in the early spring, February through May and August through October (which corresponds to northern anchovy spawning); minimum entrainment occurred during summer months.

B-4
• The original demonstrations in 1983 concluded that the operation of the CWIS did not result in an Adverse Environmental Impact on the fisheries in the vicinity. The LARWQCB concurred with this decision.
• Shifts in the populations of some fish species are expected since the completion of the demonstrations in 1983. In particular, the populations of rock fish are expected to have decreased. Despite this change in populations for some fish species, significant changes in the patterns of impingement and entrainment are not expected. Importantly, the two dominant impinged species and entrained species are expected to continue to be most important at both stations.
• Based on the historical and recent data collected in support of the demonstrations and NPDES monitoring, fish populations within the Southern California Bight that have shown substantial population changes are different from the species impinged and entrained at either station.
1.0 INTRODUCTION
The Section 316(b) Phase II rule requires consideration of several biological issues during the evaluation of current and potential measures to mitigate impingement mortality and entrainment. This Appendix represents the first step in that process: a review of the fishery resources of the Pacific Ocean off the coast of Southern California, specifically the Southern California Bight and its implications for rule compliance.
1.1 Goals
This Appendix was generated to support the submittal of the Proposal for Information Collections (PICs) for Reliant’s Mandalay and Ormond stations. Much of this information will be incorporated into the Impingement Mortality and Entrainment Characterization Studies (IMECS), part of the Comprehensive Demonstration Study (CDS) required in the Phase II Section 316(b) rules. This document will be prepared for each facility and will include an expanded discussion of the data as well as a more complete discussion of the data’s implications at the plants. The goal of this Appendix is to review fisheries-related data available for the Southern California Bight. This review is intended to support the compliance options Reliant has elected to pursue in response to the regulations that pertain to the reduction of impingement mortality (IM) and entrainment (E) at electric power generating stations. In particular, this Appendix will address whether sufficient data are available to address the goals of the rule within the context of the compliance strategies outlined in the PIC. In addition, the data will be reviewed for their utility to support assessment of potential mitigation measures as well as in the design of biological sampling programs. The rates of impingement and entrainment at each facility are considered within the context of our understanding of the biological resources of the Southern California Bight in order to address

B-5
several important questions relevant to the assessment of current and potential controls on IM and E. Potentially relevant questions are presented in Section 2.0 (below).
The aquatic biology of the Southern California Bight is relatively well characterized by various agencies as well as private entities. In an effort to determine species that may be subject to impingement or entrainment at the two Reliant facilities, a literature review was conducted.
This Appendix reviews impingement data collected at the Mandalay and Ormond stations. These data provide important perspective on the biological performance of the CWIS and, when coupled with other literature data, may provide a sufficient basis for the IMECS called for by the rule. The absolute rates of impingement will be considered relative to the location, design, and operation of the CWIS, and temporal trends will be discussed. The frequency of the species impinged will be discussed relative to population surveys of the Southern California Bight. Finally, a brief discussion of habitats of the most commonly impinged species is provided.
Although many relevant data sources were obtained during the literature review, it should be noted that several sources have collected a considerable amount of data but these data have not yet been collated and evaluated. Such a review is beyond the scope of the PIC but review of this information will occur during the preparation of the IMECS for each of the Reliant facilities.
1.2 Organization of Document
A review of the Rule’s goals is provided outlining the requirements for the IMECS. A general review of the fisheries resources of the Southern California Bight is then presented. Taxonomic identification of the most common species impinged or entrained is provided. A summary of the fisheries in the ambient water follows with species-specific discussions including habitat preference, spawning habits, and food preference. Species with clear economic benefit and recreational importance are discussed.
Documentation of current IM and E at Ormond and Mandalay follows, focusing on actual measurements. The representativeness of historical data are addressed considering potential fisheries trends in the Southern California Bight and whether the impingement data were collected under normal operating conditions. Available data were analyzed to determine their sufficiency to estimate the Calculation Baseline. The sufficiency of the data is also discussed as it pertains to supporting the other goals of the each CDS.
Lastly, a discussion is presented that addresses whether the available data are sufficient in supporting the IMECS. The most common species impinged and entrained are listed in this section. Implications for CWIS placement, design, and operation are discussed as well. References cited are found at this end of this Appendix as are Tables and Figures.

B-6
2.0 REVIEW OF THE RULE’S GOALS
The Phase II rule provides relatively specific requirements for the IMECS in amendments to 40 CFR 125.95(b)(3) (see excerpt, below). Reliant understands that these requirements are intended to support the assessment of the current CWIS as well as its alternatives within the context of the various Compliance Strategies. Among the specific questions that might be relevant are:
• What are the species potentially affected by the CWIS? Do they include species of potential concern such as those with high commercial or recreational value or those receiving special protections?
• Do the characteristics of the relevant species (e.g., temporal and spatial distributions, size of larvae and eggs, swimming speed) provide a basis for selection and design of mitigation technologies or measures?
• What are the actual rates of impingement and entrainment in order to calculate the monetized benefit of potential mitigation measures?
• How do the current rates of impingement and entrainment relate to those of the hypothetical Calculation Baseline? That is, what is the effect of mitigation measures expressed as a percent reduction, relative to the Calculation Baseline, in impingement mortality and entrainment?
As noted in the PIC, the relative importance of these questions will vary significantly depending on the Compliance Strategy selected. Although current data on the rates of impingement mortality and entrainment may be more useful to the Cost-benefit test than to the Cost-cost test, available data are likely to allow a conservative estimate of potential monetized benefits. Similarly, it is likely to be much simpler to demonstrate consistency for some mitigation technologies than for others and the nature of the necessary data collection will vary accordingly. For example, the EPA and other literature estimate that the use of a velocity cap reduces impingement by 90 percent, providing a tangible basis for estimation of its efficacy. On the other hand, reliance on differences in population densities at two different locations is fraught with uncertainties.
The following is the Rule’s requirements for the IMECS:
a) 125.95(b)(3)(i). Taxonomic identifications of all life stages of fish, shellfish, and any species protected under Federal, State, or Tribal Law (including threatened or endangered species) that are in the vicinity of the cooling water intake structure(s) and are susceptible to impingement and entrainment.

B-7
b) 125.95(b)(3)(ii). A characterization of all life stages of fish, shellfish, and any species protected under Federal, State, or Tribal Law (including threatened or endangered species) identified pursuant to paragraph (b)(3)(i) of this section, including a description of the abundance and temporal and spatial characteristics in the vicinity of the cooling water intake structure(s), based on sufficient data to characterize annual, seasonal, and diel variations in impingement mortality and entrainment.
c) 125.95(b)(3)(iii). Documentation of the current impingement mortality and entrainment of all life stages of fish, shellfish, and any species protected under Federal, State, or Tribal Law (including threatened or endangered species) identified pursuant to paragraph (b)(3)(i) of this section and an estimate of impingement mortality and entrainment to be used as the calculation baseline. Impingement mortality and entrainment samples to support the calculations required in Section 125.95(b)(4)(i)(C) and 125.95(b)(5)(iii) of the Rule must be collected during periods of representative operational flows for the cooling water intake structure and the flows associated with the samples must be documented.
Within the context of the selected Compliance Strategies, these requirements will serve as the basis for assessing the sufficiency of the existing data to support the IMECS (see Section 4 of the PIC).
The following three sections of this Appendix are organized consistent with the three separate provisions of the rule relative to the IMECS.
3.0 TAXONOMIC IDENTIFICATIONS [125.95(B)(3)(I)]
40 CFR 125.95(b)(3)(i) sets out the requirements of the IMECS relative to identification of fish and shellfish taxa potentially affected by impingement mortality and entrainment. The goals of this effort are to identify these species that are likely to dominate impingement mortality and entrainment with a special focus on those that have commercial or recreational importance. In addition, any species subject to special protections (e.g., state- or federally-listed threatened or endangered species) must be noted.
This section will review the available information in order to identify the relevant species and will provide a brief review of the nature of several important species. The discussions rely on station-specific data as well as the more general literature, including scientific literature on the fishery of the Southern California Bight.

B-8
3.1 Pacific Ocean/Southern California Bight Species Composition
The fishery of the Pacific Ocean changes with progression from shore to open ocean. The change is driven by several factors including age, habitat preference, ocean currents, and water temperature. For the purposes of this document, nearshore fishery resources are discussed exclusively.
The nearshore ocean zone extends from the shoreline (including sandy beaches, boulder fields and rocky outcroppings, as well as associated kelp beds, sandy and muddy bottoms), to the boundary between the continental shelf and continental slope (depths range from 100 to 300 meters, depending on the location). Waters of this zone are rich in nutrients primarily from upwelling currents.
Upwelling provides essential nutrients needed to support vast populations of microscopic organisms collectively known as plankton and thus stimulates biological productivity and diversity in both nearshore and offshore ocean waters. Plankton are the basis of the food chain and a vital component of numerous food webs supporting important fish, mammal and bird populations.
Interactions between offshore currents influence temperature, nutrients, and distribution of organisms and their offspring and create a distinct biogeographical region (or bioregion) extending from the Mexican border to near Point Conception. This biogeographic region is known as the Southern California Bight, which primarily supports temperate and warm water fish and invertebrate species.
The Southern California Countercurrent, a portion of the California Current, is a cold water current that carries cold waters from northern California to the coast of Southern California. Surface speeds in the counter current ranges between 5 and 10 cm/s. In contrast, the Davidson Current is a periodic, nearshore current that flows in a northerly direction, carrying warm waters from semitropical seas to Southern California.
Nearshore, coastal currents are strongly influenced by a combination of wind, tides and local topography. When wind-driven currents are superimposed on tidal motions, a strong diurnal pattern is usually apparent. Therefore, short term observations of currents near the coast often vary in both direction and speed.
Interannual variability in the California Current influences distribution and abundance of plankton, invertebrates, and fish. Periodic disruptions of the California Current, often associated with El Niño-Southern Oscillation (ENSO) events, affect available nutrients and zooplankton in central and southern California.

B-9
3.1.1 Summary of Literature
This section will review the available information in order to identify the relevant species and will provide a brief review of the nature of several important species. The discussions rely on station-specific data as well as the more general literature, including scientific literature on the fishery of the Pacific Ocean. A more in-depth profile of the status of fisheries in the Southern California Bight as well as the biology of species subject to impingement and entrainment at will be included with the IMECS submittal.
3.1.1.1 Southern California Bight
The Pacific Ocean is a dynamic and diverse ecosystem. The near shore ecosystem along the Southern California coast is composed of several habitats including kelp forests, rocky intertidal, sandy and muddy bottoms, and open water that allow a diverse assemblage of organisms to persist. Over 500 species of fishes have been recorded to occur in the Pacific Ocean off the coast of Southern California.
Common species with commercial importance in the nearshore ecosystem of the Southern California Bight include a variety of rockfish species (Sebastes sp.), cabezon (Scorpaenichthys marmoratus), sheephead (Semicossyphus pulcher), kelp bass (Paralabrax Clathratus), Pacific sardine (Sardinops sagax), Pacific mackerel (Scomber japonicus), jack mackerel (Trachurus symmetricus), northern anchovy (Engraulis mordax), California corbina (Menticirrhus undulates), surfperches (Amphistichus sp.), croakers (Family Sciaenidae), California halibut (Paralichthys californicus), sanddabs (Citharichthys sp.), and skates and rays are also fairly common. In addition to the fish, several commercially important invertebrate species are abundant including market squid (Loligo opalescens), purple sea urchin (Strongylocentrotus purpuratus), spiny lobster (Panulirus interruptus), red rock shrimp (Lymata californica), and spot prawn (Pandalus platycerus).
3.1.1.2 Ormond
Southern California Edison (SCE) the original owners of the Ormond and Mandalay facilities, collected data on fisheries populations for the 316(b) demonstration and NPDES monitoring for Ormond in the mid 1970s and early 1980s (MBC 1975 and 1981). Fish collected included northern anchovy, queenfish, white croaker, white surfperch and shiner surfperch. The data were representative of the dominant nearshore species in the Southern California Bight.
SCE and Reliant have conducted impingement monitoring at Ormond between 1980 and 2004 as part of their CDS and subsequent annual receiving water NPDES monitoring program. These data characterize the species and their relative abundance impinged at Ormond during both normal operations and heat treatments. The sampling data have been extrapolated to monthly impingement rates based on flow (Table B-1). Queenfish, Pacific sardine, northern anchovy, and

B-10
shiner surfperch are the long-term dominants, comprising over 90 percent of the individuals impinged at Ormond. These data are consistent with the fish species and relative abundance historically impinged at Ormond during the original 316(b) demonstration (Figure B-1). In addition, the data are consistent with the ambient fish data collected for the Mandalay NPDES ambient biological monitoring discussed in the next section.
3.1.1.3 Mandalay
SCE collected data on fisheries populations for NPDES monitoring in the late 1970s and early 1980s (MBC 1979 and 1981). Fish collected included northern anchovy, queenfish, white croaker, white surfperch and walleye surfperch. The data were representative of the dominant nearshore species in the Southern California Bight. Reliant’s more recent sampling offshore of Mandalay between 1980 and 2004 continued to find white croaker, queenfish and northern anchovy as the long-term community dominants, comprising over 90 percent of the individuals collected offshore of Mandalay.
SCE and Reliant have also conducted impingement monitoring at Mandalay between 1980 and 2004 as part of SCE’s original CDS and the subsequent annual receiving water monitoring programs. These data characterize the species and their relative abundance impinged at Mandalay during both normal operations and heat treatment. The sampling data have been extrapolated to monthly impingement rates based on flow (Table B-2). Grunion, shiner perch, topsmelt and Pacific sardine are the long-term dominants, comprising over 98 percent of the individuals impinged at Mandalay. Additionally, the current (2001-2004) fish impingement data and relative abundance is consistent with historical data (1979-1980) as shown in Figure 2.
In comparing the ambient biological data (Table B-3) to the impingement data at Mandalay it should be noted that of the ten most abundant species in ambient surveys off Mandalay only one was among the top ten species most commonly impinged at the facility. Thus, although the species mix observed in the impingement samples taken at Mandalay is generally similar in composition and relative abundance to the species mix found in the Southern California Bight itself, some species are noticeably absent or under-represented from the impingement samples. For example, one of the most common fish in the ambient samples, queenfish, is rarely observed in the impingement samples at Mandalay (0.001% of total impingement). Similarly, white croaker, are common in the ambient samples, but are not among the fish species impinged. Conversely, California grunion account for the largest number of individuals impinged but account for less than 0.1% of the individuals observed in the offshore biological monitoring surveys. This trend is confirmed by four years of impingement data conducted by Reliant at the Mandalay station (see Table B-3). While quantitative comparisons are difficult, it is apparent that several species that dominate the impingement samples are poorly represented in biological monitoring performed offshore of Mandalay. The differences in composition and frequency of fish known to be common in the Southern California Bight and those observed in the impingement samples is likely to be
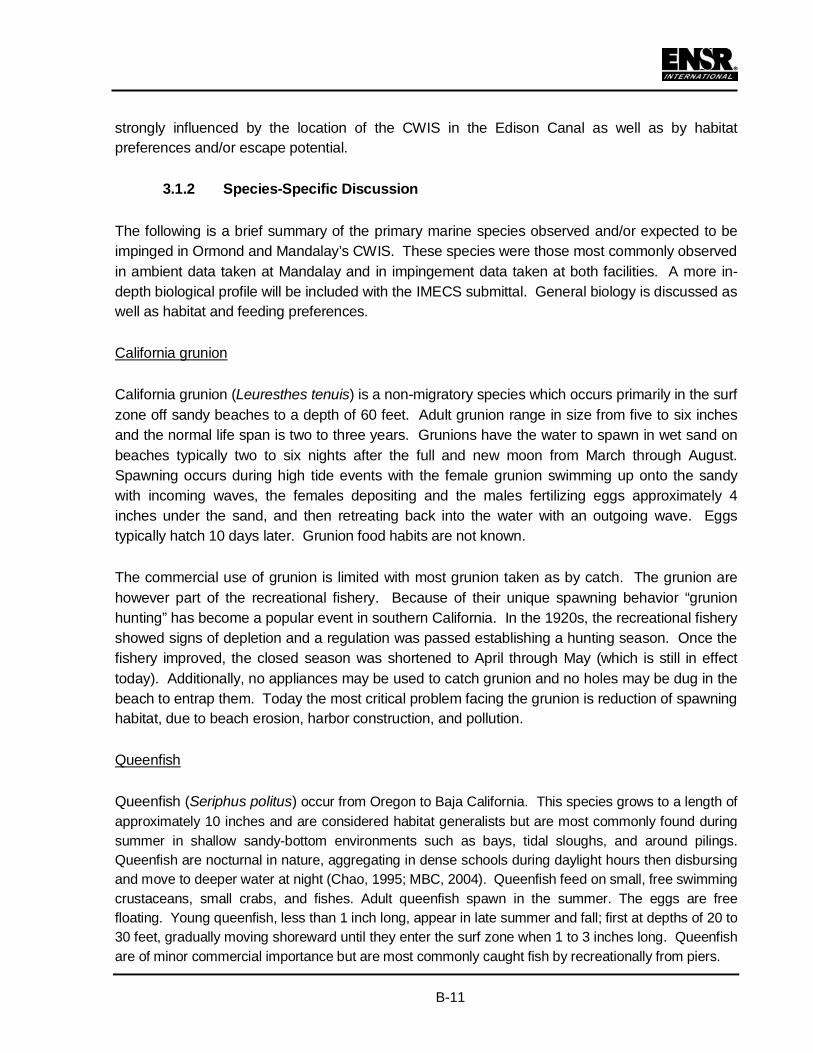
B-11
strongly influenced by the location of the CWIS in the Edison Canal as well as by habitat preferences and/or escape potential.
3.1.2 Species-Specific Discussion
The following is a brief summary of the primary marine species observed and/or expected to be impinged in Ormond and Mandalay’s CWIS. These species were those most commonly observed in ambient data taken at Mandalay and in impingement data taken at both facilities. A more in-depth biological profile will be included with the IMECS submittal. General biology is discussed as well as habitat and feeding preferences.
California grunion
California grunion (Leuresthes tenuis) is a non-migratory species which occurs primarily in the surf zone off sandy beaches to a depth of 60 feet. Adult grunion range in size from five to six inches and the normal life span is two to three years. Grunions have the water to spawn in wet sand on beaches typically two to six nights after the full and new moon from March through August. Spawning occurs during high tide events with the female grunion swimming up onto the sandy with incoming waves, the females depositing and the males fertilizing eggs approximately 4 inches under the sand, and then retreating back into the water with an outgoing wave. Eggs typically hatch 10 days later. Grunion food habits are not known.
The commercial use of grunion is limited with most grunion taken as by catch. The grunion are however part of the recreational fishery. Because of their unique spawning behavior “grunion hunting” has become a popular event in southern California. In the 1920s, the recreational fishery showed signs of depletion and a regulation was passed establishing a hunting season. Once the fishery improved, the closed season was shortened to April through May (which is still in effect today). Additionally, no appliances may be used to catch grunion and no holes may be dug in the beach to entrap them. Today the most critical problem facing the grunion is reduction of spawning habitat, due to beach erosion, harbor construction, and pollution.
Queenfish
Queenfish (Seriphus politus) occur from Oregon to Baja California. This species grows to a length of approximately 10 inches and are considered habitat generalists but are most commonly found during summer in shallow sandy-bottom environments such as bays, tidal sloughs, and around pilings. Queenfish are nocturnal in nature, aggregating in dense schools during daylight hours then disbursing and move to deeper water at night (Chao, 1995; MBC, 2004). Queenfish feed on small, free swimming crustaceans, small crabs, and fishes. Adult queenfish spawn in the summer. The eggs are free floating. Young queenfish, less than 1 inch long, appear in late summer and fall; first at depths of 20 to 30 feet, gradually moving shoreward until they enter the surf zone when 1 to 3 inches long. Queenfish are of minor commercial importance but are most commonly caught fish by recreationally from piers.

B-12
Topsmelt
Topsmelt (Atherinops affinis) is a nearshore species which inhabits a variety of habitat including kelp beds, harbor areas, and sandy beach areas. They usually form loose schools but will congregate while feeding. Topsmelt reach a maximum size of 14 inches and live to seven or eight years old. Their spawning period is from April through October. Topsmelt larvae are particularly abundant in tidal basins and the shallow edges of coastal bays. Juvenile topsmelt generally move into the open water of estuaries, bays, and coastal kelp beds. The food of topsmelt consists primarily of plankton.
Topsmelt are part of both the commercial and recreational fisheries. The commercial fishery is comprised of fish marketed for human consumption or bait. Topsmelt also make up a significant portion of the pier and shore sport catch throughout California. While the stock size of topsmelt has not been determined, at present there are no indications that this species is being overfished in California. The greatest risk to this species is pollution and loss of habitat through development.
Pacific Sardine
Pacific sardine (Sardinops sagax) is a pelagic fish which inhabits the coastal areas of warm temperate zones of nearly all ocean basins. The northern subpopulation ranges from northern Baja California to Alaska with sardines migrating north in the summer months and returning south to southern California and northern Baja in the fall. Pacific sardines are roughly 12 inches in size and live to eight years old. They spawn in loosely aggregated schools in the upper 165 feet of the water column and in Southern California their spawning peaks between April and August. Sardines are filter feeders and feed on plankton.
The Pacific sardine has historically been an important commercial fishery, supporting the largest fishery in the Western Hemisphere during the 1930s and 1940s. The fishery collapsed the 1940s due to overfishing and natural changes in the environment. The population has since recovered due to closure of the fishery and development of favorable environmental conditions. Currently, Pacific sardines are processed mainly for human consumption, pet food, or export.
Northern Anchovy
Northern anchovy (Engraulis mordax) is a small, short-lived species typically found in schools near the surface. Adults are typically found offshore whereas juveniles are found in nearshore areas. This species is typically seven inches long and lives to an approximate age of four years old and feeds on plankton. Northern anchovy are distributed from British Columbia to Baja California. The population is divided into three subpopulations. The central subpopulation ranges from San Francisco to Baja California with the bulk of the population located in the Southern California Bight.

B-13
Live baitfish for the sportfishing community is the principle fishery for northern anchovy within southern California, with only a limited reduction fishery (i.e. use as fish meal, oil, or soluble protein) currently operating (MBC, 2004). Biomass estimates of the central subpopulation of northern anchovy have been declining slowly since the 1970s. It is believed that the Northern anchovy population is currently determined by natural influences, such as ocean temperatures rather than fishery influences.
Shiner Surfperch
Shiner surfperch (Cymatogaster aggregata) occur primarily in shallow water, around eelgrass beds, piers and pilings. They are also commonly found in bays and quiet back waters and calm areas of exposed coast. The species is most often found in loose schools or aggregations. Surfperch reproduction is viviparous, their young being highly developed and free swimming at birth. The young feed on copepods, while adults eat various small crustaceans, mollusks, and algae. Shiner surfperch generally grow to 7 inches. While surfperch as a whole comprise a commercial and recreational fishery, as a species shiner surfperch have little commercial or recreational importance. Total commercial surfperch landings have declined over the long-term by 25 percent since the 1950s. Research has indicated that some of the decline is associated with the increases in water temperature. Additionally, pollution and habitat destruction are threats to the population.
Walleye Surfperch
Walleye surfperch (Hyperprosopon argenteum) occur primarily along sandy beaches, jetties, kelp beds, and other habitat rich in invertebrate life. This species is most often found in large schools. Surfperch reproduction is viviparous, their young being highly developed and free swimming at birth which typically occurs in mid-April. Similar to the shiner perch young feed on copepods, while adults eat various small crustaceans, mollusks, and algae. Walleye surfperch are 1.5 inches at birth and can grow to 12 inches. While surfperch as a whole comprise a commercial and recreational fishery, as a species walleye surfperch are most notable for their importance to the recreational fishery. Recent recreational take has averaged 112,000 individuals per year (CDFG, 2001). However, the total stock size is unknown at this time. As noted for the shiner surfperch, total commercial surfperch landings have declined over the long-term by 25 percent since the 1950s. Research has indicated that some of the decline is associated with the increases in water temperature. Additionally, pollution and habitat destruction are threats to the population.
Pacific Staghorn Sculpin
Pacific staghorn sculpin (Leptocottus armatus) is a nearshore species which inhabits sandy bottoms of shallow subtidal waters, but may be found as deep as approximately 500 meters (Eschmeyer et al., 1983) (Froesce & Pauly, 2005). They are occasionally found in the lower

B-14
reaches of freshwater streams (Tenera, 2000). Adults tend to live in the shallow lower estuary and further offshore whereas juveniles recruit to shallow inshore waters and sloughs (Tenera, 2000). This species is typically 17 inches long and lives to an approximate age of 10 years. They feed primarily on crabs, shrimps and amphipods, but also take larval, juvenile and adult fishes, as well as polychaete worms, mollusks and other invertebrates (Fitch & Lavenberg, 1975). Pacific staghorn sculpin are distributed from Alaska to Baja California. Spawning takes place from October through April in shallow coastal bays, inlets, sounds, and sloughs (Tenera, 2000). This species is not an important species to either the recreational or commercial fisheries (Emmett et al., 1991). This species is widespread and abundant. It does not appear that there are any immediate threats to this population however long-term threats are relatively unknown.
Diamond Turbot
Diamond turbot (Hypsopsetta guttulata) is a flat-fish species which inhabits muddy and sandy bottoms of shallow waters, often of bays and estuaries, but may be found as deep as 164 feet (Froesce & Pauly, 2005). The species is typically 18 inches long and lives to approximately eight years of age (Fitch and Lavenberg, 1975). The range of the diamond turbot extends from Cape Mendocino in northern California south to Baja California (Miller & Lea, 1972).
Diamond turbot have negligible commercial value, but are taken incidentally in commercial ground fisheries (CDFG, 2001). However, this species is part of the recreational fishery and are often taken by sport fishermen from Point Conception southward along the California coast (Fitch and Lavenberg 1975). The status of this population is unknown.
Bay Pipefish
Bay pipefish (Syngnathus leptorhynchus) is a nearshore species which inhabits eelgrass beds of bays and estuaries, but is sometimes found in shallow offshore waters (Dawson 1985). This species ranges from Alaska to southern Baja California in Mexico with the southern population extending from Morro Bay southward. This species is typically 12 inches long and feeds on crustaceans (Froesce & Pauly, 2005). The bay pipefish is ovoviviparous and the male carries the eggs in a brood pouch which is found under the tail (Breder & Rosen, 1964). This species is not part of either the commercial or recreational fishing industry. The status of this population is unknown.
Pacific Pompano
Pacific Pompano (Peprilus simillimus) is a benthopelagic species which commonly inhabits sandy bottom and shallow nearshore waters of exposed coasts in depths up to 300 feet (Fitch and Lavenberg 1975). This species occurs in small, but fairly dense, schools. The range of the Pacific pompano extends from British Columbia south to Baja California. This species typically reaches

B-15
11cm long (Ahlstrom, 1965). Pacific pompano is a valuable commercial species as well as a recreational species (Hart 1973). The status of this population is unknown.
3.2 Historical Patterns
The marine ecosystem of the Southern California Bight has been impacted by many factors over the past decades. Populations of several key fish species including rockfish, California halibut, and abalone have decreased recently in the Southern California Bight (CDFG 2001). Factors that have been identified as potentially contributing to changes in the local ocean’s flora and fauna (CDFG 2001) include:
• Habitat loss and degradation;
• Point and non-point pollution;
• Toxic substances;
• Commercial and recreational fishing;
• Interannual variability in sea surface temperature due to El Nino-Southern Oscillation events;
• Reduced availability of key plant and invertebrate food sources; and
• Invasion of nonindigenous species.
3.3 Commercial and Recreational Species
Several of the most commonly impinged species at the Reliant facilities have substantial recreational or commercial value, including the grunion, shiner perch, Pacific sardine, northern anchovy and topsmelt species. Despite this removal, adverse impacts to their populations or to the commercial harvest are not expected since the annual impingement rates associated with Reliant’s two CWIS are relatively low.
Commercial harvest in the Pacific Ocean off the coast of Ventura and Santa Barbara Counties is dominated by three general types of fishes including groundfish (rockfish, cabezon, and sheephead), sand bass, and ocean white fish, as well as three invertebrate species including market squid, red sea urchin, and California spiny lobster (CDFG, 2003). The fishery for Southern California as a whole is dominated by four types of fishes including groundfish, albacore and other tunas, coastal pelagics, and shark and swordfish, as well as the three invertebrate species mentioned above. Together these fisheries represent 90% of the total commercial catch (CDFG, 2001). Because none of these commercially harvested fishes or invertebrates are commonly represented in impingement samples, these species are expected to have a minimal potential to be impinged at either Ormond or Mandalay. Based on their life histories it similarly unlikely that they would be subject to substantial entrainment at either facility.

B-16
Recreational species targeted most often in the Pacific Ocean off of the coast of Santa Barbara, Ventura, and Los Angeles Counties include the rockfish, calico and sand bass, Pacific mackerel, and bonito species. As with the commercial species, based on historical impingement data, there is minimal potential for these species to be impinged in the CWIS at either Ormond or Mandalay (MBC, 2001). Based on their life histories it is similarly unlikely that they would be subject to substantial entrainment at either facility.
3.4 Threatened and Endangered Species
There are several federal and/or state listed threatened or endangered marine mammals, reptiles, fish and invertebrate species located in the marine waters of the Southern California Bight. Marine mammals include: southern sea otter (Enhydra lutris neresis), blue whale (Balaenoptera musculus), finback whale (Balaenoptera physalus), humpback whale (Megaptera novaeangliae), right whale (Balaena glacialis), sperm whale (Physeter catodon), and sei whale (Balaenoptera borealis). Marine turtles are rare visitors to the Southern California Bight including: olive Ridley sea turtle, (Leptdochelys olivacea), leatherback sea turtle (Dermochelys coriacea), loggerhead turtle (Caretta caretta), and green sea turtle (Chelonia mydas). Only one marine fish, the Federally endangered tidewater goby (Eucyclobobius newberryi) and one marine invertebrate, the federally endangered white abalone (Haliotis sorenseni) occur in the vicinity of the Reliant Plants. However, based on their biology, known locations of populations (tidewater goby), and current structure of the CWIS, these species do not have the potential to be impinged or entrained at either facility.
Marine mammals are also protected under the Marine Mammal Protection Act. The waters along the Southern California Bight support a variety of species of marine mammals including many of those discussed above that are listed as threatened or endangered. For the same reasons as presented above, these species are not expected to be affected by the operation of the CWIS for either facility.
4.0 CHARACTERIZATION OF LIFE STAGES [125.95(B)(3)(II)]
The rule calls for the characterization of all stages that might be subject to impingement and, if appropriate, entrainment. This characterization is necessary to ensure the full scope of potential impacts is understood and that implications for selection of mitigation measures are known. Reliant believes that the general literature, the original demonstrations, and ongoing/proposed data collection collectively support a sufficient understanding of the potential impacts to the different life stages of the main species affected by entrainment or impingement at the two generating stations. The impingement studies that were performed in support of the original demonstration evaluated spatial and temporal (diel and annual) variations. This section presents a summary of this life stage information. The results of the investigations relevant to IM and E assessments are presented in Section 5.0. As noted in Section 7.0, additional characterization of

B-17
entrainment, including diel and annual variation, is proposed as part of the CDS. More detailed review of the integrated data set will be provided in the IMECS submittal.
Life stages subject to entrainment are determined primarily by intake screen mesh size. A life stage of an organism less than the screen mesh size is subject to entrainment (including egg and post-larval individuals) while those larger than the mesh size are subject to impingement. Eggs are more susceptible than larvae since eggs lack swimming capabilities. Post-larval organisms do have some swimming capabilities, although limited, and can at times escape the approach velocity associated with CWIS. As the organism grows larger than the mesh size of the CWIS screens, they become subject to impingement. Both Reliant stations are subject to performance goals for impingement and entrainment mortality.
4.1 Entrainment
The 316(b) demonstration reports did not enumerate larvae but focused entirely on larval fish. No effort was undertaken to discriminate larval stages. The proposed assessment of entrainment will include characterization of eggs as well as, when feasible, larval stage/size.
4.2 Impingement
Length and weight data, surrogates of individual age, have been collected as part of the earlier demonstrations as well as the current, on-going program. The size of impinged individuals varies with species. Length data collected in the impingement monitoring studies at Ormond between 2001 and 2004 demonstrate that impingement is typically dominated by Age 0 to Age 3 size classes depending on the species. Average age classes for impinged individuals are as follows: queenfish (Age 1 to Age 3); Northern anchovy (Age 1 and Age 2); shiner surfperch (Age 0 to Age 3).
Length data collected in the 2002 and 2004 impingement monitoring studies at Mandalay demonstrate that adult and young of year (YOY) California grunion and shiner perch typically dominate impingement. Average lengths for impinged individuals are as follows: California grunion (4 inches) and shiner perch (3.5 inches).
5.0 DOCUMENTATION OF CURRENT IMPINGEMENT MORTALITY AND ENTRAINMENT [125.95(B)(3)(III)]
The rule requires the estimation of current rates of impingement mortality and, when appropriate, entrainment. These data may be necessary to support three potential activities:
• Estimation of the CWIS performance relative to the Calculation Baseline;
B-18
• Assessment of additional mitigation measures; and
• Estimation of the monetized benefit of potential mitigation measures under the Cost-benefit test.
5.1 Current Status of Fishery Population and Representativeness of Historical Data
The population dynamics of marine species within the Southern California Bight have shown a diversity of patterns over the past decades ranging from substantial losses (e.g., many rock fish species and abalone), to losses and recoveries (e.g., grunion, sardines, and market squid), to little documented changes (e.g., many of the non-commercial fishes). A variety of factors have been implicated as affecting these population changes, including both human influences, such as fishing pressures, changes in water quality, and loss of habitat, and natural variations, such as changes in water temperature such as that associated with El Nino.
A key driver for the development and implementation of the rule is to determine how much, if any, the operation of CWIS contributes to the observed losses of local fish and invertebrate species. Based on the data collected over the past decades documenting the species affected by their two coastal plants, Reliant believes that the available data on the local fisheries will be adequate to support the goals of the rule and the development of an IMEC.
5.2 Review of Impingement and Entrainment Data at Reliant Facilities
Historic impingement and entrainment data from Ormond and Mandalay are summarized in Tables B-1, B-2, and B-4 through B-9. Impingement and entrainment rates were calculated based on abundance of individuals collected during monthly sampling events. These observed rates were then adjusted for the total flow for the month to produce extrapolated monthly impingement and entrainment rates. Annual impingement rates were the sum of monthly extrapolated impingement plus impingement during heat treatment events.
5.2.1 Ormond
SCE and Reliant have collected data to evaluate impacts of both impingement and entrainment from the operation of Ormond. The studies are discussed below.
5.2.1.1 Ormond 316(b) Demonstration & Technical Appendix
The 316(b) Demonstration originally prepared for Ormond included sampling in support of both impingement and entrainment impacts. The results of each evaluation are considered in the following sections.

B-19
Entrainment
Entrainment monitoring occurred between August 1979 and July 1980 at Ormond. Monthly samples were taken at six periods (two day, two night, and two crepuscular1) of a 24 hour day. Samples were collected following standard ichthyoplankton sampling protocols. Entrainment mortality was assumed to be 100%. As shown in Table B-6 target species comprised approximately 84% of the total daily entrainment during the one-year period; of these 41.8% were northern anchovy; 33.8% white croaker; and 8.2% queenfish. The balance of non-target species were dominated by gobies, and unidentified and other miscellaneous larvae.
Bight-wide Plankton Investigation
To supplement the site-specific data, SCE participated in a more comprehensive data collection effort in the Southern California Bight. Data were collected along 20 transects with stations at 8 and 22 meter contour depths for the majority of transects. Plankton samples were collected with Bongo nets, Manta nets and Auriga nets depending on the depth of the sample. Net mesh was 335 micron on all nets. Ichthyoplankton data collected included larval stage, area (transect location), depth, sampling method, and year class.
The raw data for each sample were scaled to reflect ichthyoplanton densities in numbers per 1000m3 in the portion of the water column sampled by each device. Mean density through the water column was determined by proportionally summing the densities according to the amount of water column sampled and dividing by total depth. Density was then multiplied by the estimated percentage of the Southern California Bight volume occupied by water of that depth. Using the volume weighting factors for each depth range, densities were determined independently for each 1mm size class for each depth range. Density throughout the Bight was then calculated for each size class by summing densities from each depth range then dividing the number of depth ranges considered. The results were incorporated into the Impact Assessment Model as the term defining abundance and distribution of offshore stocks for key target species.
Impingement
Impingement monitoring data were taken between October 1978 and July 1980. Data taken in August and September 1980 were taken twice per week while the remaining data were taken once per week. All screen/trash basket washings collected during normal operations. Species were grouped into algal, invert, & fish categories. The following data was calculated: (1) number of fish species; (2) number of individuals per species; and (3) weight per species. Up to 200 individuals of the target species were measured for length and up to 50 individuals were sexed.
1 Period of twilight between day and night

B-20
Non-target species found in large numbers were also counted and sexed. Oceanographic, climatological, and plant operational parameters were measured during each sampling period. Daily impingement rates were averaged across the sample size of 154 samples. Target species comprised 63.6% of total daily impingement during the two-year period; of these 41.2% were shiner surfperch; 7.2% queenfish; 6.8% anchovy; and 3.2% white surfperch.
Heat treatment data was collected at approximately four to six week intervals. Fish were separated by species, counted and weighed. Select species were measured for length frequency distributions. Normal operation fish losses were estimated by multiplying the mean daily impingement loss times the number of days that circulating water pumps were in operation during the period. Heat treatment fish loss was added to the estimated normal operation fish loss to determine total annual fish loss.
Daily impingement rates were averaged across the sample size of 163 normal operation samples and 20 heat treat samples. Target species comprised 98.8% of total daily impingement during the two-year period; of the fish collected 54.2% were queenfish; 14.9% white croaker; 7.1% walleye surfperch; and 6.7 % northern anchovy.
Impact Assessment Model
The purpose of the assessment was to compare cooling system intake fish losses (entrainment and impingement) to offshore larval and adult stocks and determine the impact of station operation on fish resources in the nearshore of the Southern California Bight. The data collected included estimates of field population abundance, distribution, and age structure of selected 316(b) target species. A database of offshore ichthyoplankton stocks was developed during a one year sampling program by the Los Angeles County Museum of Natural History. The estimates were compared to entrainment and impingement losses resulting in a probability (Rc) of survival for individuals of each species over a five-year period (Table B-7). The statistic (1-Rc) indicated the percent probability of mortality due to station operation. This study indicated that no significant adverse effect on the nearshore populations of target species was expected.
The conclusion of this series of investigations was that the operation of Ormond would not make a significant or substantial impact to the local marine species.
5.2.1.2 Ormond Receiving Water Monitoring Reports
Ormond conducts a marine monitoring program in order to comply with specifications set forth by the Los Angeles Regional Water Quality Control Board, (LARWQCB) as part of NPDES Permit Number CA0001198 dated June 28, 2001. This program includes physical monitoring of the receiving waters and underlying sediments, and biological sampling of the benthic infaunal assemblages and mussels. Fish and macroinvertebrate impingement studies were also conducted periodically throughout the year. Results of the impingement reports submitted to the

B-21
LARWQCB between 2001 and 2004 are discussed below. Each of the reports concludes that fish and macroinvertebrate species collected were typical of the nearshore environment from which the generating station withdraws its cooling water.
Impingement
Impingement sampling was conducted during representative periods of normal operation and during all heat treatment operations. A normal operation survey was defined as a sample of all fish and macroinvertebrates impinged onto traveling screens during a 24 hour period with all circulating pumps operating, if possible. Normal operation abundance and biomass for the year were estimated by extrapolating the monitored abundance and biomass based on the percentage of the annual flow into the plant on the days sampled. During heat treatment sessions impinged fish and macroinvertebrates were collected, sorted by species, counted and weighed. Data were combined with the estimated normal operation data to determine the total impingement loss for the year. The reports concluded that the operation of the Ormond station had no detectable adverse effects on the beneficial uses of the receiving waters.
2004
A total extrapolated count of 5,000 individual fish representing 42 species weighing over 1,100 kg were impinged at the generating station in 2004 during heat treatment and normal operations. Northern anchovy, shiner perch, and Pacific sardine were the most abundant species taken. Abundance of impinged macroinvertebrates totaled 17,000 individual of 19 species. Normal operations yielded 70% of the fish impinged, whereas 30% were taken during heat treatments. Species composition and abundance were similar to those noted during the previous ten years. The macroinvertebrate population was also abundant and diverse, with red jellyfish, sheep crab, and Pacific rock crab most abundant.
2003
A total extrapolated count of 11,132 individual fish representing 53 species weighing over 770 kg were impinged at the generating station in 2003 during heat treatment and normal operations. Queenfish, northern anchovy, and shiner perch were the most abundant species taken. Abundance of impinged macroinvertebrates totaled an estimated 11,132 individual of at least 20 species. Normal operations yielded 47% of the fish impinged, whereas 53% were taken during heat treatments. Species composition and abundance were similar to those noted during the previous ten years. The macroinvertebrate population was also abundant and diverse, with Pacific rock crab, California two-spot octopus and purple-striped jellyfish most abundant.
2002

B-22
A total extrapolated count of 16,209 individual fish representing 54 species weighing over 440 kg were impinged at the generating station in 2002 during heat treatment and normal operations. Queenfish and northern anchovy were the most abundant species taken. Abundance of impinged macroinvertebrates totaled 16,958 individual of 19 species. Normal operations yielded 77.5% of the fish impinged, whereas 22.5% were taken during heat treatments. Species composition and abundance were similar to those noted during the previous ten years. The macroinvertebrate population was also abundant and diverse, with common salp and red rock crab most abundant.
2001
A total extrapolated count of 15,583 individual fish representing 47 species weighing over 2,687 kg were impinged at the generating station in 2001 during heat treatment and normal operations. Pacific pompano and queenfish were the most abundant species taken. Abundance of impinged macroinvertebrates totaled 11,225 individual of at least 19 species. Normal operations yielded 78.3% of the fish impinged, whereas 21.7% were taken during heat treatments. Species composition and abundance were similar to that noted in the previous ten years, but much greater than that seen in the unusually low years of 1999-2000. MBC indicated that the changes seen were likely due to the abundance of recently departed La Nina, a cooler-than-normal oceanographic perturbation that is known to shift population centers. Especially significant was that this phenomenon followed a two-year long El Nino that brought warmer-than-normal waters to southern California. The macroinvertebrate population was also abundant and diverse, with the Pacific rock crab most abundant species.
5.2.2 Mandalay
SCE and Reliant have collected data to evaluate impacts of both impingement and entrainment from the operation of Mandalay. The studies are discussed below:
5.2.2.1 Mandalay 316(b) Demonstration & Technical Appendix
Site-specific data for the original 316(b) Demonstration were collected only for impingement. Impacts on entrainment were inferred from entrainment impacts at Los Angeles Department of Water and Power’s Haynes Generating Station (HGS). The conclusions were based on the assumption that generating stations with CWISs in similar habitats, in this case in a channel/embayment environment, along the Southern California Bight would have similar entrainment impacts.
Entrainment
Entrainment monitoring occurred between October 1979 and September 1980 at the HGS. Day and night samples were taken approximately two times per week Samples were collected near the entrance of the intake conduit structure. Day samples were collected from the midwater with a

B-23
high volume pump. Night samples were collected from discrete water column levels. Mean daily larval entrainment densities for each month were calculated from larval abundance, day length, and station flow volume. Entrainment mortality was assumed to be 100%. Estimates of entrainment at Mandalay were developed by applying a factor (0.3286) to HGS entrainment levels based on Mandalay’s lower flow volumes roughly 1/3 as much. As shown in Table B-8 target species comprised 16.20% of the total daily entrainment during the two-year period; of these 8.6% were of the Engraulid sp. complex; 5.7% white croaker; and 1.9% queenfish. The balance or non-target species were dominated by gobies and blennies.
Bight-wide Plankton Investigation
The Bight-wide plankton investigation is described above in section 4.2.1.1.
Impingement
Impingement monitoring data were taken between October 1979 and September 1980. Data taken between August 1979 and July 31 1980 were taken twice per week while the remaining data were taken once per week. All screen/trash basket washings were collected during normal operations. Heat treatment was unnecessary with the configuration of the CWIS at that time. Species were grouped into algal, invertebrate, and fish categories. The following data were calculated: (1) number of fish species; (2) number of individuals per species; and (3) weight per species. Up to 200 individuals of the target species were measured for length and up to 50 individuals were sexed. Non-target species found in large numbers were also counted and sexed. Oceanographic, climatological, and plant operational parameters were measured during each sampling period. Daily impingement rates were averaged across the sample size of 154 samples. Target species comprised 63.6% of total daily impingement during the two-year period; of these 41.2% were shiner surfperch; 7.2% queenfish; 6.8% anchovy; and 3.2% white surfperch.
Impact Assessment Model
The Impact Assessment Model is described above in section 4.2.1.1. The statistic (1-Rc) shown in Table B-9 indicates the percent probability of mortality due to station operation. This study indicated that no significant adverse effect on the nearshore populations of target species was expected.
The conclusion of this series of investigations was that the operation of Mandalay would not make a significant or substantial impact to the local marine species.

B-24
5.2.2.2 Mandalay Receiving Water Monitoring Reports
Mandalay conducts a marine monitoring program in order to comply with specifications set forth by the LARWQCB as part of NPDES Permit Number CA0001180 dated April 26, 2001. This program includes physical monitoring of the receiving waters and underlying sediments, and biological sampling of the benthic infaunal, fish, and macroinvertebrate assemblages. Results of the impingement and biological monitoring reports submitted to the LARWQCB between 2001 and 2004 are discussed below. Each of the reports concludes that fish and macroinvertebrate species collected were typical of the bay/nearshore environment from which the generating station withdrawals its cooling water.
Impingement
Fish impingement sampling was conducted during representative periods of normal operation and during all heat treatment operations. A normal operation survey was defined as a sample of all fish and macroinvertebrates impinged onto sliding screens during a 24 hour period with all circulating pumps operating, if possible. The yearly abundance and biomass of impacted species under normal operation are estimated by multiplying the daily mean catch per unit effort by the annual total cooling water flow. During heat treatment sessions impinged fish and macroinvertebrates were collected, sorted by species, counted and weighed. Data were combined with the estimated normal operation data to determine the total impingement loss for the year. The reports indicated that the operation of the Mandalay station had no detectable adverse effects on the beneficial uses of the receiving waters.
2004
A total extrapolated count of 23,053 individual fish representing 13 species were impinged at the generating station in 2004. Abundance of impinged macroinvertebrates was much lower, totaling 190 individuals of eight species. Annual impingement estimates were derived by combining the loss during the one heat treatment with the extrapolating results of the five normal operation surveys over the entire year. Two species accounted for over 80% of impingement abundance: shiner perch and California grunion. These two species have been the most abundant species impinged since 2002. The most abundant macroinvertebrates impinged were the purple shore crab and the nudibranch, navanax, which were collected only during normal operation surveys.
2003
A total extrapolated count of approximately 7,500 individual fish representing 11 species were impinged at the generating station in 2003. Abundance of impinged macroinvertebrates was much lower, totaling 20 individual of four species. Annual impingement estimates were derived by combining the loss during two heat treatments and extrapolating the results of the four normal operation surveys over the entire year. Over 500 California grunion were recorded during the

B-25
February 2003 normal operation survey. The February 2003 survey coincided with a full moon and expected spawning event of the California grunion. Alternatively, the sampling event two months later, April 9, 2003, coincided with a neap tide and only 1 grunion individual was impinged in the sampling event on June 18, 2003, which again coincided with a neap tide, resulted in the impingement of 2 individual grunion. Given that grunion activities are typically highest in the April through June time frame yet the data document low impingement during this time frame for 2003, it is apparent that calculating an annual impingement rate of California grunion is open to considerable uncertainty. As shown by these results, the biology of the grunion will strongly affect the magnitude of the impact on this species from impingement. Aside from the many grunion, the other dominant fish and macroinvertebrate species collected were typical of a bay-type environment from which the generating station withdrawals its cooling water.
2002
A total extrapolated count of 136,749 individual fish representing 20 species were impinged at the generating station in 2002. Abundance of impinged macroinvertebrates was much lower, totaling 46 individual of three species. Annual impingement estimates were derived by extrapolating the results from one heat treatment and five normal operation surveys over the entire year. Over 4,000 California grunion were recorded during the March 2002 normal operation survey, and over 800 shiner perch were impinged during the May 2002 survey. The March 2002 survey coincided with a full moon and expected spawning event of the California grunion.
2001
A total extrapolated count of 186 individual fish representing 6 species was impinged at the generating station in 2001. Abundance of impinged macroinvertebrates totaled 154 individuals of five species. Annual impingement estimates were derived by combining the loss during one heat treatment and extrapolating the results of the two normal operation surveys over the entire year. Three species accounted for over 70% of impingement abundance: Pacific staghorn sculpin, shiner perch and California halibut. The most abundant macroinvertebrates impinged were the California squid and the purple shore crab. Of particular note is the absence of grunion, although the limited number of samples likely missed times that the species might have been present.
5.2.3 Discussion of IM and E Data at Reliant Facilities
Ambient data collected for the original 316(b) Demonstrations and the recent data collected for the NPDES permits show a consistency in major species composition of the nearshore fish community adjacent to these two facilities. In addition, the impingement data for Ormond, shows a similar consistency and close correlation with the existing data on the local fish populations. While the data are insufficient to identify if there have been any changes in population densities of the impinged species, the consistency of the data (Figure B-1) coupled with the low absolute rate of impingement suggests that the operation of the Ormond CWIS has not affected the local fish

B-26
community. In contrast, the frequency of species impinged at Mandalay differs substantially from both the ambient populations and those impinged at Ormond.
The average impingement rate at Ormond was 0.09 fish per 10,000 cubic meters (m3) of seawater pumped and at Mandalay was 4.96 fish per 10,000 m3 of seawater. The monthly and yearly impingement rates for each facility are shown in Figures B-3 through B-6.
5.2.3.1 Temporal variations in IM and E
Temporal variations in IM and E are the result of both biological factors (e.g., spawning season, migrations, ocean productivity etc.) and non-biological factors (e.g., sea surface temperature, tidal height, plant operational status, etc.). Due to the multitude of factors that can potentially affect impingement mortality and entrainment at a given location, temporal variations may difficult to ascertain unless they are substantial.
Understanding of the temporal variations in impingement and entrainment is important for two potential reasons:
• In order to characterize accurately impacts of impingement mortality and entrainment. For example, if impingement events were significantly more common during the night, failure to sample during both day and night would bias the daily estimates of impingement. Reliant believes that the existing data sets have addressed this issue by inclusion of sampling over a 24-hour period and throughout the year.
• In order to assess whether periodic flow reduction might serve as a mitigation measure. For example, if it can be demonstrated that impingement mortality occurs during a specific season and the plant can be idled or run with reduced cooling water flow during that period, this might present an effective mitigation strategy.
As discussed earlier, impingement at Mandalay is highly episodic, primarily due to impingement of grunion during their spawning events or as schooling events (i.e. schooling of shiner perch and topsmelt). These observations suggest that coastal species, especially grunion, may run into the Channel Island Harbor and move to the Edison Canal in response to the induced flow velocity into the canal. These coastal species would be expected to orient their movement to flow more strongly than resident harbor species because the former species would be responding to longer period currents while the latter species would be used to responding to tidal ebb and flow and other regular shallow water movement.
These observations may help to explain the importance of coastal species among impinged fish and harbor species among entrained fish. Reliant recognizes that this pattern can be used to manage the impacts to grunion since the occurrence of grunion follows a highly predictable cycle.

B-27
Both Ormond and Mandalay are presently on a “peaking reserve” status and operate on a limited basis, only when energy production is needed. Typically power demand increases in mid to late summer, thus increasing impingement mortality and entrainment rates during the warmer months due to the increase in water withdrawal. Locally, energy demand also peaks at the end of the year as residents use more electricity during the holidays. Based on recent operating history, both facilities have shown this pattern of use.
By limiting generation and therefore water flow at Mandalay during peak grunion spawn season (March to June) to times when grunion are not spawning, impingement to grunion could be greatly reduced. The primary limitation in implementing this management practice is in Reliant’s contractual requirements to deliver power. Due to the seemingly ever changing demands for power generation in California, Reliant can not commit to not running the plant during spring tides between March and June. However, by planning ahead and limiting the time that Mandalay would be operation during the peak grunion spawning months of March through June, impacts could be minimized.
As characterized by the grunion, spawning season is one of the most important biological factors affecting impingement mortality and entrainment rates. The primary period of reproduction and peak abundance of most Southern California Bight taxa is during the months of spring (typically March through May). The peak time of egg recruitment is during early spring, while larval recruitment is primarily late spring and early summer. Spring and summer therefore appear to be the most important seasons in the Southern California Bight in regards to entrainment, as this is the time eggs and larval organisms are most abundant. Many of these organisms will be able to avoid entrainment later in the year as they grow larger, and increase their swimming ability.
Monthly impingement data collected for receiving water monitoring at Ormond demonstrate that fish abundance was somewhat episodic with more fish being taken during fall and winter months. This observation is in line with the annual impingement trends demonstrated in the CDS.
The original 316(b) Demonstration at Ormond indicated that larval entrainment peaked in the spring months, March through May, and again in the late summer/fall period during September and October. Minimum entrainment of larval fish occurred during June and July. The peak periods entrainment for commonly entrained species are as follows: anchovy (Feb-May and August-October); white croaker (correspond to periods of reduced water temperature in November-April); queenfish (April-September).
Biological monitoring offshore of the Mandalay station indicated that fish species abundance and richness were generally highest during the summer months. MBC speculated that this increase is likely due to increased day length, water temperatures and productivity during the summer (MBC 2004).

B-28
Entrainment sampling for the 1983 CDS at Ormond was conducted four times throughout a 24 hour period (day, night, sunrise, and sunset). The magnitude of daily ichthyoplankton entrainment at this facility was directly related to the time of day. Entrainment densities were highest between dusk and early morning hours, prior to sunrise, and were observed to be lowest near mid-day.
Additionally, day and night entrainment samples were collected for the Mandalay 1982 CDS. While these samples were collected at the HGS they provide useful information. The magnitude of daily ichthyoplankton entrainment was directly related to time of day. The majority of larvae of all taxa taken during the study were collected at night in the middle and lower water column.
The primary value of this information is to ensure that ichthyoplankton sampling be completed during a full 24-hour cycle rather than simply as a day and night sampling events.
5.2.3.2 Spatial Differences in IM and E
Spatial differences in population densities are caused by many factors including habitat, water depth, and velocity. During the development of the Phase I 316(b) rules, the EPA specifically noted that the selection of the location of the CWIS is one construction and design technology which can be used to minimize the impact of impingement mortality and entrainment. The Phase II 316(b) rule also allows the highest density of organisms in the vicinity of the CWIS to be used as the Calculation Baseline. Using the reasoning for the Phase I rule and the Phase II Calculation Baseline, the location of existing intake structures could be used to “claim” credit for the reduction of impingement mortality and entrainment.
This feature of the Rule is an important consideration at the Mandalay facility since the CWIS is situated at the end of the 2.5 mile long Edison Canal, which originates at northern terminus of the 1.3 mile long Channel Islands Harbor and is thus substantially removed from the Southern California Bight. Notably the species composition of impinged fishes at Mandalay differs greatly from the fish species composition found in the nearshore habitat right off Mandalay. Table B-10 outlines the habitats of commonly impinged species at both facilities as well as species observed in ambient sampling at Mandalay. Additionally, it suggests strongly that the ichthyoplankton species entrained at Mandalay would be different from those seen offshore of the facility, since it would be unlikely that significant numbers of eggs and larvae of those nearshore species would selectively travel into Mandalay via the harbor and Edison Canal. The net flow into the harbor and canal is considerably smaller than the longshore current affecting the nearshore species.
5.3 Sufficiency of Data to Estimate Calculation Baseline
Reliant reviewed current and historical data to assess the quantitative value of existing data and to determine if the data were sufficient to support estimating calculation baseline for Mandalay and Ormond. This review was conducted in light of the compliance alternative that Reliant anticipates pursuing for each station.

B-29
Data currently available in the literature suggests that existing research provides an adequate quantitative assessment of the status of the main fisheries in the Southern California Bight. These data when combined with the available data from the impingement and entrainment studies conducted at Mandalay and Ormond, provides a good qualitative assessment of the fish diversity and relative abundance in the Southern California Bight.
Data collected in the previously discussed impingement and entrainment studies were initially evaluated based on operating condition at the time the study was conducted. These operating conditions are estimated to be at or near maximum operating capacity. Evaluating these data and applying it to current operating conditions requires several assumptions:
• Approach velocities and through screen velocities are assumed to be the same;
• Intake structures have not undergone of retrofits or other changes in operation; and
• Densities of local fish and invertebrates and their diversity have not changed significantly.
Based on the available information, we believe that each of these assumptions is valid. However, of particular note is that as compared to when the original 316(b) assessment was completed, both plants are now operated as peak load facilities, not base load facilities. From this standpoint alone, these plants have reduced their impingement and entrainment substantially. However, because Reliant cannot commit to operating these facilities at less than their historical capacity, they have prepared this data review and will prepare the IMECS. Based on these considerations, Reliant feels that the historical data can be deemed to be representative of current conditions.
Reliant does note, however, that the lack of entrainment data at Mandalay is a limitation that should be addressed. While minimal entrainment rates are expected at Mandalay, and the entrainment study (1979-80) conducted at SCE’s Haynes Generating Station showed that goby and blenny species dominated the samples (Table B-4) Reliant recognizes the need to verify these assumptions.
Reliant has proposed a data collection program that will support the various potential compliance alternatives including the estimation of the Calculation Baseline (see Section 6, above).
6.0 SUFFICIENCY OF DATA IN SUPPORTING THE IMECS
6.1 Data Quality Assurance/Quality Control
Data collection and analysis has been completed for the past 30 years by a small number of firms with MBC Applied Environmental Sciences (MBC) having been actively involved with the bulk of the sampling, and data analysis as well as the data interpretation and reporting. MBC has

B-30
followed standard operating procedures (SOPs) that are well documented and well known. The more recent impingement studies at both stations has been conducted by Proteus Sea Farms, which has been located on the Ormond Beach generating station for over two decades, again using well documented and widely accepted SOPs. This continuity of data collection efforts as well as the adherence to SOPs ensures that the data that have been collected are of appropriate consistency and quality.
6.2 Most Common Species Impinged/Entrained
The most commonly entrained species are listed in Table B-6 (Ormond) and B-8 (Mandalay) and included gobies and blennies at Mandalay, and northern anchovy and white croaker at Ormond. Reliant acknowledges that the data upon which these determinations were made is relatively old (Ormond and Mandalay) and not site specific (Mandalay). It is within that context that Reliant has proposed ichthyoplankton sampling within the intake bays of the two plants.
The most abundantly impinged species are the California grunion and the shiner perch at Mandalay and queenfish, Pacific sardine, northern anchovy, and shiner perch at Ormond. Based on the quality of the impingement data, Reliant believes that these data are sufficiently robust to support the IMECS. However, to complement these data and consistent with the on-going requirements of their existing NPDES permits, Reliant will continue to collect impingement data on a regular basis for development of the IMECS.
6.3 Implications for CWIS Placement, Design, and Operation
Reliant believes that the data available on the fisheries of the Southern California Bight provides a sufficient perspective on the existing fisheries potentially affected by impingement or entrainment at Ormond and Mandalay. Reliant has reviewed three primary sources of information in for this PIC and will continue to acquire and evaluate additional information for the IMECS. These data sources include:
• Site-specific data collected by SCE during the late 1970s and early 1980s. The data in these reports will be compared to recently collected data to try to assess if there are changes that can be identified.
• Data collected by Reliant during from the late 1990s on impingement rates and ambient populations as required by the NPDES permits. The general patterns of impingement (e.g., relative frequency of species) are consistent with those observed from impingement studies conducted at the facility in the 1970s. These patterns will be compared to the new data to be collected for the IMECS.
• The general literature on fisheries of the Southern California Bight. Reliant will continue to mine this literature to document important background regarding the behaviors of

B-31
important species such as the timing and distribution of their eggs and larvae, their likely survival upon impingement, their habitat preferences.
When this literature is considered as a whole and the studies proposed in this PIC are completed, we believe that there will be sufficient data to complete an IMECS consistent with the goals of the rule (see Section 4.2).
7.0 REFERENCES
Ahlstrom, E. H. 1965. Kinds and abundance of fishes in the California current region based on egg and larval surveys. California Coop. Oceanic Fish. Invest. Report, 10:31-52.
Breder, C.M. and D.E. Rosen, 1966. Modes of reproduction in fishes. T.F.H. Publications, Neptune City, New Jersey. 941 p.
California Department of Fish and Game, The Resource Agency. 2001. California’s Living Marine Resources: A Status Report, (eds.) W.S. Leet., C.M. Dewees, R. Klingbiel, & E.J. Larson.
California Department of Fish and Game, The Resource Agency. 2003. Annual Report of Statewide Fish Landings.
Chao, L.N., 1995 Sciaenidae. Corvinas, barbiches, bombaches, corvinatas, corvinetas, corvinillas, lambes, pescadillas, roncachos, verrugatos. p. 1427-1518. In W. Fischer, F. Krupp, W. Schneider, C. Sommer, K.E. Carpenter and V. Niem (eds.) Guia FAO para identificacion de especies para los fines de la pesca. Pacifico Centro-oriental. 3 volumes. 1813 p.
Dawson, C.E., 1985 Indo-Pacific pipefishes (Red Sea to the Americas). The Gulf Coast Research Laboratory Ocean Springs, Mississippi, USA.
Emmett, R.L., S.A. Hinton, S.L. Stone, and M.E. Monaco. 1991. Distribution and abundance of fishes and invertebrates in west coast estuaries, Volume II: Species life history summaries. ELMR Rep. No. 8 NOAA/NOS Strategic Environmental Assessments Division, Rockville, MD, 329 pp.
EPRI. 2003. Evaluating the Effects of Power Plant Operations on Aquatic Communities: Summary of Impingement Survival Studies.
Eschmeyer, W.N., E.S. Herald and H. Hammann, 1983 A field guide to Pacific coast fishes of North America. Houghton Mifflin Company, Boston, U.S.A. 336 p
Fitch, J.E. and R.J. Lavenberg, 1975 Tidepool and nearshore fishes of California. California Natural History Guides:38. University of California Press, Berkelley and Los Angeles, California. 156 p.

B-32
Froese, R. and D. Pauly. Editors. 2005. FishBase. World Wide Web electronic publication. www.fishbase.org, version (05/2005).
Hart, J. L. 1973. Pacific fishes of Canada. Bull. Fish. Res. Board Can. 180. 740 pp.
MBC Applied Environmental Sciences. 2000. National Pollutant Discharge Elimination System 2001 receiving water monitoring report, Reliant Energy Ormond Beach Generating Station, Ventura County, California. Prepared for Reliant Energy. 46 p. plus appendices
MBC Applied Environmental Sciences. 2000. National Pollutant Discharge Elimination System 2001 receiving water monitoring report, Reliant Energy Mandalay Beach Generating Station, Ventura County, California. Prepared for Reliant Energy. 46 p. plus appendices
MBC Applied Environmental Sciences. 2002. National Pollutant Discharge Elimination System 2002 receiving water monitoring report, Reliant Energy Ormond Beach Generating Station, Ventura County, California. Prepared for Reliant Energy. 46 p. plus appendices
MBC Applied Environmental Sciences. 2002. National Pollutant Discharge Elimination System 2002 receiving water monitoring report, Reliant Energy Mandalay Beach Generating Station, Ventura County, California. Prepared for Reliant Energy. 46 p. plus appendices
MBC Applied Environmental Sciences. 2003. National Pollutant Discharge Elimination System 2003 receiving water monitoring report, Reliant Energy Mandalay Beach Generating Station, Ventura County, California. Prepared for Reliant Energy. 46 p. plus appendices
MBC Applied Environmental Sciences. 2003. National Pollutant Discharge Elimination System 2003 receiving water monitoring report, Reliant Energy Ormond Beach Generating Station, Ventura County, California. Prepared for Reliant Energy. 46 p. plus appendices
MBC Applied Environmental Sciences. 2004. National Pollutant Discharge Elimination System 2004 receiving water monitoring report, Reliant Energy Ormond Beach Generating Station, Ventura County, California. Prepared for Reliant Energy. 46 p. plus appendices
MBC Applied Environmental Sciences. 2004. National Pollutant Discharge Elimination System 2004 receiving water monitoring report, Reliant Energy Mandalay Beach Generating Station, Ventura County, California. Prepared for Reliant Energy. 46 p. plus appendices
Miller and Lea 1972. Miller D. J. and R. N. Lea. 1972 (1976). Guide to the coastal marine fishes of California. California Department of Fish and Game Bulletin 157. 249 pp.

B-33
Southern California Edison Company. 1982. Mandalay Generating Station 316(b) Demonstration. Prepared for California Regional Water Quality Control Board. Southern California Edison Company, Research and Development Series: 82-RD-97.
Southern California Edison Company. 1983. Ormond Beach Generating Station 316(b) Demonstration. Prepared for California Regional Water Quality Control Board. Southern California Edison Company, Research and Development Series: 82-RD-100.
Southern California Edison Company. 1982a. Marine ichthyoplankton entrainment studies. August 1979-September 1980. Ormond Beach, Redondo Beach Units 5&6 and 7&8, and San Onofre Nuclear Generating Station Unit 1. Volume II-Analysis and Interpretation. Prepared by MBC Applied Environmental Sciences. Southern California Edison Company, Research and Development Series: 82-RD-12. 62 p.
Southern California Edison Company. 1982b. 316(b) demonstration technical appendix: Impact assessment model and Bight-wide plankton investigations. Southern California Edison Company, Research and Development Series: 82-RD-93. 30pp. with appendices.
Tenera Environmental Services, 2000. Moss Landing Power Plant Modernization Project 316(b) Resource Assessment. Prepared for Duke Energy Moss Landing, LLC. p. 343.

B-34
Table B-1
Ten Most Abundant Fish Species Impinged During Normal Operations and Heat Treatment at Ormond 1980-2004
Species 1980 1991 1992 1993 1994 1995 1996 1997 1998 1999 2000 2001 2002 2003 2004* Total Total %
queenfish 7,460 43,501 16,697 82,521 16,382 24,008 4,218 4,725 6,632 161 361 3,057 11,089 2,684 375 223,872 61.1 Pacific sardine 322 86 110 1,643 362 1,056 197 2,921 21,434 24 89 295 483 107 632 29,760 8.1 northern anchovy 301 365 891 631 2,022 1,600 2169 4,329 73 177 564 1,144 2,095 4,076 1,395 21,833 6.0 shiner perch 278 270 997 1,333 1,023 8,830 503 2,423 891 8 366 542 532 1,397 1,113 20,506 5.6 walleye surfperch 1,506 1,521 3,942 550 126 616 10 1,353 431 2 611 432 266 11 11,376 3.1 white seaperch 1,606 987 1,054 1,019 1,169 2,454 395 926 158 35 36 75 86 55 10,056 2.7 plainfin midshipman 1,844 1,484 999 490 336 432 11 46 58 1 172 2 5,874 1.6 Pacific pompano 1 157 72 738 22 16 4 1 1 5 3,350 186 280 8 4,841 1.3 white croaker 14 707 149 2,506 58 679 50 4 433 101 65 5 4,771 1.3 speckled sanddab 390 230 504 60 240 461 1,330 102 454 40 3,811 1.0 Total Number of Individuals 14,680 51,860 28,796 94,602 23,403 41,996 8,664 19,266 31,545 761 3,078 10,467 16,209 11,132 4,987 366,361 90.5% Number of Species 54 65 54 60 59 48 41 38 47 28 42 49 54 53 43 *2004 normal operation surveys based on estimated annual abundance, derived by multiplying mean annual CPUE by total report flow (152,367.48 mg). Taken from MBC 2004 NPDES Receiving Water Monitoring Report, Ormond Generating Station

B-35
Table B-2
Twenty Most Abundant Fish Species Impinged During Normal Operations and Heat Treatment at Mandalay 2001-2004
Common Name Total Percent of TotalCalifornia grunion 372,755 74.72Shiner Perch 98,125 19.67Topsmelt 16,032 3.21Pacific sardine 3,121 0.63Pacific staghorn sculpin 2,858 0.57Northern anchovy 2,840 0.57Diamond turbot 1,021 0.21
bay pipefish 803 0.16Pacific pompano 290 0.06Pacific halibut 218 0.04California halibut 149 0.03Pacific jack mackererl 146 0.03bat ray 145 0.03white surfperch 74 0.02crevice kelpfish 73 0.02bay goby 73 0.02specklefin midshipman 73 0.02round stingray 73 0.02spotted kelpfish 6 0.00queenfish 3 0.00
Species Abundance

B-36
Table B-3
Twenty Most Abundant Fish Species Taken During Trawl Surveys at Mandalay 1978-2004
Species 1978 1980 1986 1988 1990 1991 1992 1993 1994 1997 1999 2000 2001 2002 2003 2004 Total Total %
white croaker 6,713 8,446 1,464 1,150 1,592 2,291 2,756 3,043 7,237 20 363 5,363 1,033 9,342 0 16 50,829 48.8% queenfish 966 4,889 830 195 957 1,341 6,049 3,009 5,483 0 76 1,352 4,630 3,971 8 138 33,894 32.5% northern anchovy 1,476 494 2 52 88 359 1,469 159 115 0 640 256 383 1,216 9 3,322 10,040 9.6% speckled sanddab 36 8 40 64 76 217 4 75 16 7 143 219 38 224 51 476 1,694 1.6% shiner perch 107 24 0 4 33 63 4 58 88 17 190 42 11 529 18 118 1,306 1.3% barred surfperch 210 172 46 223 38 95 29 115 41 18 1 33 9 42 0 20 1,092 1.0% white seaperch 245 321 2 17 18 26 5 5 80 12 25 0 1 225 0 0 982 0.9% walleye surfperch 335 340 8 18 0 50 5 26 28 1 1 16 37 28 1 9 903 0.9% kelp pipefish 0 0 0 0 0 0 0 0 0 0 80 149 104 179 3 118 633 0.6% thornback 27 21 12 16 6 56 4 167 2 3 13 14 6 52 0 2 401 0.4% California halibut 25 54 66 58 21 27 1 8 11 0 2 5 1 4 0 0 283 0.3% California corbina 15 3 79 0 0 3 2 33 19 0 2 73 24 9 0 8 270 0.3% California lizardfish 17 5 0 0 8 0 1 2 4 0 1 1 26 115 0 1 181 0.2% yellowfin croaker 2 0 11 1 0 1 0 79 50 0 0 0 3 0 0 0 147 0.1% barcheek pipefish 3 0 0 77 5 0 0 0 58 0 0 0 0 0 0 0 143 0.1% fantail sole 0 10 17 10 1 3 1 1 5 1 39 27 1 16 0 0 132 0.1% English sole 22 8 5 49 7 0 0 1 4 1 7 0 0 15 0 1 120 0.1% basketweave cusk-eel 1 3 9 0 8 45 0 28 4 0 1 5 0 0 0 0 104 0.1% shovelnose guitarfish 6 11 6 22 13 18 0 19 2 0 1 2 0 2 0 0 102 0.1%
Pacific pompano 2 23 0 6 0 1 7 0 3 0 0 30 2 20 0 1 95 0.1%
Total Number of Individuals 10,299 14,986 2,648 2,009 2,896 4,674 10,399 6,892 13,296 89 1,597 7,616 6,324 16,056 91 4,304 104,176 99.2% Number of Species 41 35 29 24 23 30 21 28 33 10 25 22 24 27 7 23 Total Number of Trawls 28 24 12 12 16 16 16 16 16 8 16 16 16 16 4 16 Seasons Sampled 2 2 2 2 2 2 2 2 2 1 2 2 2 2 2 2 Taken from MBC 2004 NPDES Receiving Water Monitoring Report, Mandalay Generating Station

B-37
Table B-4
Impingement Data For Ormond 1997-2004 Species Abundance
Species Common Name Heat
Treatment
Monitored
Extrapolated Total Percent of
Total Seriphus politus queenfish 12438 814 21007.94 33445.94 29.99Sardinops sagax Pacific sardine 23535 130 3355.08 26890.08 24.11Engraulis mordax Northern Anchovy 9809 133 3432.50 13241.50 11.87Cymatogaster aggregata shiner perch 3226 184 4748.72 7974.72 7.15Atherinops affinis topsmelt 3898 41 1058.14 4956.14 4.44Hyperprosopon argenteum walleye surfperch 2784 16 412.93 3196.93 2.87Peprilus simillimus Pacific pompano 155 109 2813.10 2968.10 2.66Citharichthys stigmaeus speckled sanddab 2 92 2374.36 2376.36 2.13Phanerodon furcatus white surfperch 1148 23 593.59 1741.59 1.56Platyrhinoidis triseriata thornback ray 4 47 1212.99 1216.99 1.09Porichthys myriaster specklefin midshipmen 17 43 1109.76 1126.76 1.01Parophrys vetulus english sole 0 43 1109.76 1109.76 1.00Leptocottus armatus Pacific staghorn sculpin 10 40 1032.33 1042.33 0.93Syngnathus leptorhynchus bay pipefish 15 33 851.67 866.67 0.78Myliobatis californica bat ray 11 33 851.67 862.67 0.77Leuresthes tenuis California grunion 7 28 722.63 729.63 0.65Pleuronichthys verticalis hornyhead turbot 3 26 671.02 674.02 0.60Paralabrax nebulifer barred sandbass 597 1 25.81 622.81 0.56Genyonemus lineatus white croaker 411 8 206.47 617.47 0.55Torpedo californica torpedo ray 8 21 541.97 549.97 0.49Rhacochilus toxotes rubberlip surfperch 264 6 154.85 418.85 0.38Sebastes auriculatus brown rockfish 272 4 103.23 375.23 0.34Synodus lucioceps California lizardfish 1 14 361.32 362.32 0.32Amphistichus argenteus barred surfperch 241 3 77.42 318.42 0.29Pleuronichthys decurrens curlfin sole 1 12 309.70 310.70 0.28Psettichthys melanostictus sand sole 0 9 232.27 232.27 0.21Citharichthys sordidus Pacific sanddab 1 8 206.47 207.47 0.19Scorpaenichthys marmoratus cabezon 130 3 77.42 207.42 0.19Otophidium scrippsi 0 8 206.47 206.47 0.19

B-38
Table B-4 Impingement Data For Ormond 1997-2004
Species Abundance
Species Common Name Heat
Treatment
Monitored
Extrapolated Total Percent of
Total Paralichthys californicus California halibut 9 7 180.66 189.66 0.17Paralabrax clathratus kelp bass 138 1 25.81 163.81 0.15Porichthys notatus plainfin midshipman 5 6 154.85 159.85 0.14Symphurus atricauda California tonguefish 0 5 129.04 129.04 0.12Rhinobatos productus Shovelnose guitarfish 22 4 103.23 125.23 0.11Trachurus symmetricus Pacific jack mackerel 19 4 103.23 122.23 0.11Brachyistius frenatus kelp perch 44 3 77.42 121.42 0.11Urolophus halleri round stingray 7 4 103.23 110.23 0.10Scorpaena guttata scorpion fish 23 3 77.42 100.42 0.09Paralabrax maculatofasciatus spotted sand bass 59 1 25.81 84.81 0.08Heterostichus rostratus giant kelpfish 7 3 77.42 84.42 0.08Pleuronichthys ritteri spotted turbot 0 3 77.42 77.42 0.07Triakis semifasciata leopard shark 0 3 77.42 77.42 0.07Oxyjulis californica seniorita 48 1 25.81 73.81 0.07Rhacochilus vacca pile surfperch 43 1 25.81 68.81 0.06Chromis punctipinnis blacksmith 42 1 25.81 67.81 0.06Scomber japonicus chub mackerel 37 1 25.81 62.81 0.06Embiotoca jacksoni black surfperch 62 0 0.00 62.00 0.06Menticirrhus undulatus California king croaker 3 2 51.62 54.62 0.05Syngnathus californiensis kelp pipefish 1 2 51.62 52.62 0.05Mustelus californicus grey smooth-hound 0 2 51.62 51.62 0.05Pleuronichthys coenosus 0 2 51.62 51.62 0.05Raja inornata 0 2 51.62 51.62 0.05Xenistius californiensis 48 0 0.00 48.00 0.04Atherinopsis californiensis 32 0 0.00 32.00 0.03Sebastes paucispinis 3 1 25.81 28.81 0.03Agonopsis sterletus 1 1 25.81 26.81 0.02Anisotremus davidsonii 1 1 25.81 26.81 0.02Cephaloscyllium ventriosum 0 1 25.81 25.81 0.02Citharichthys xanthostigma 0 1 25.81 25.81 0.02

B-39
Table B-4 Impingement Data For Ormond 1997-2004
Species Abundance
Species Common Name Heat
Treatment
Monitored
Extrapolated Total Percent of
Total Gibbonsia elegans 0 1 25.81 25.81 0.02Hydrolagus colliei 0 1 25.81 25.81 0.02Hypsopsetta guttulata 0 1 25.81 25.81 0.02Lepidogobius lepidus 0 1 25.81 25.81 0.02Mola mola 0 1 25.81 25.81 0.02Squalus acanthias 0 1 25.81 25.81 0.02Hexagrammos decagrammus 16 0 0.00 16.00 0.01Sebastes serranoides 16 0 0.00 16.00 0.01Oxylebius pictus 15 0 0.00 15.00 0.01Cheilotrema saturnum 14 0 0.00 14.00 0.01Atractoscion nobilis 13 0 0.00 13.00 0.01Chinocottus embryum 12 0 0.00 12.00 0.01Sebastes rastrelliger 9 0 0.00 9.00 0.01Ophiodon elongatus 7 0 0.00 7.00 0.01Sebastes caurinus 7 0 0.00 7.00 0.01Halichoeres semicinctus 6 0 0.00 6.00 0.01Embiotoca lateralis 5 0 0.00 5.00 0.00Hypsurus caryi 5 0 0.00 5.00 0.00Hermosilla azurea 4 0 0.00 4.00 0.00Hypsoblennius gilberti 4 0 0.00 4.00 0.00Heterodontus francisci 3 0 0.00 3.00 0.00Hypsoblennius gentilis 3 0 0.00 3.00 0.00Medialuna californiensis 3 0 0.00 3.00 0.00Sebastes flavidus 3 0 0.00 3.00 0.00Amphistichus koelzi 2 0 0.00 2.00 0.00Sebastes atrovirens 2 0 0.00 2.00 0.00Umbrina roncador 2 0 0.00 2.00 0.00Apodichthys flavidus 1 0 0.00 1.00 0.00Aulorhynchus flavidus 1 0 0.00 1.00 0.00Gibbonsia montereyensis 1 0 0.00 1.00 0.00

B-40
Table B-4 Impingement Data For Ormond 1997-2004
Species Abundance
Species Common Name Heat
Treatment
Monitored
Extrapolated Total Percent of
Total Girella nigricans 1 0 0.00 1.00 0.00Mustelus henlei 1 0 0.00 1.00 0.00Neoclinus blanchardi 1 0 0.00 1.00 0.00Sebastes goodei 1 0 0.00 1.00 0.00Sebastes hopkinsi 1 0 0.00 1.00 0.00Sebastes serriceps 1 0 0.00 1.00 0.00Sebastes wilsoni 1 0 0.00 1.00 0.00Semicossyphus pulcher 1 0 0.00 1.00 0.00Sphyraena argentea 1 0 0.00 1.00 0.00Survey totals 59,805 2,004 51,720 111,525 Number of species 81 62 62 98

B-41
Table B-5
Impingement Data for Mandalay 2001-2004
Species Common Name Heat Treatment Monitored Extrapolated Total Percent of TotalLeuresthes tenuis California grunion 32 5,138 372,723 372,755 74.72Cymatogaster aggregata Shiner Perch 555 1,345 97,570 98,125 19.67Atherinops affinis Topsmelt 0 221 16,032 16,032 3.21Sardinops sagax Pacific sardine 2 43 3,119 3,121 0.63Leptocottus armatus Pacific staghorn sculpin 29 39 2,829 2,858 0.57Engraulis mordax Northern anchovy 11 39 2,829 2,840 0.57Hypsopsetta guttulata Diamond turbot 5 14 1,016 1,021 0.21
Syngnathus leptorhynchus bay pipefish 5 11 798 803 0.16Peprilus simillimus Pacific pompano 0 4 290 290 0.06Hippoglossus stenolepis Pacific halibut 0 3 218 218 0.04Paralichthys californicus California halibut 4 2 145 149 0.03Trachurus symmetricus Pacific jack mackererl 1 2 145 146 0.03Myliobatis californica bat ray 0 2 145 145 0.03Phanerodon furcatus white surfperch 1 1 73 74 0.02Gibbonsia montereyensis crevice kelpfish 0 1 73 73 0.02Lepidogobius lepidus bay goby 0 1 73 73 0.02Porichthys myriaster specklefin midshipman 0 1 73 73 0.02Urolophus halleri round stingray 0 1 73 73 0.02Gibbonsia elegans spotted kelpfish 6 0 0 6 0.00Seriphus politus queenfish 3 0 0 3 0.00Umbrina roncador yellowfin croaker 3 0 0 3 0.00Hyperprosopon argenteum walleye surfperch 2 0 0 2 0.00Paralabrax nebulifer barred sand bass 2 0 0 2 0.00Cheilotrema saturnum black croaker 1 0 0 1 0.00Heterostichus rostratus giant kelpfish 1 0 0 1 0.00Hexagrammos decagrammus kelp greenling 1 0 0 1 0.00Paralabrax clathratus kelp bass 1 0 0 1 0.00
Survey totals 665 6868 498,222 498,887Number of species 19 18 18 27
Species Abundance

B-42
Table B-6
Historical Entrainment Data for Ormond (1979-1980)
Species Daily Larval Entrainment
(number entrained x105)
Rank % of Total
Target Species Northern anchovy 22.07 1 41.8 White croaker 17.84 2 33.8 Queenfish 4.33 3 8.2 Kelp bass 0.03 19 0.1 Barred sand bass 0.05 20 0.1 Pacific pompano 0.03 22 0.1 Black croaker 0.01 37 <0.1 Yellowfin croaker <0.01 42 <0.1 Sargo <0.01 47 <0.1 Total target species 44.39 84.1
Non-target Species Pices larvae. Unid 5.5 4 5.5 Bay goby 1.63 5 3.1 Pices yolk sac larvae 1.12 6 2.1 Cheekspot goby 1.03 7 2.0 Goby type D 0.35 8 0.7 Goby 0.27 9 0.5 California halibut/fantail sole
0.15 10 0.3
Other 0.92 1.7 TOTAL 52.75 100

B-43
Table B-7
Estimated Impact of Ormond Station Operation on Fish Resources
% Contribution to Total Losses
Species Egg- 10mm
10mm-30mm
30mm-90mm
> 90mm Probability of survival
Northern anchovy 4.73 77.22 16.30 1.75 99.64
White croaker 49.30 17.49 5.60 27.62 99.48
Queenfish 8.29 3.10 2.99 85.62 95.90
Kelp bass 10.63 6.42 79.39 3.56 99.60
Shiner surfperch NA NA 24.55 75.44 96.21
White surfperch NA NA 0.49 99.51 95.77
Data Taken from 1983 CDS for Ormond

B-44
Table B-8
Historical Entrainment Data for Mandalay (taken at Haynes Generating Station 1979-1980)
Species Base Daily Entrainment
(LADWP) Daily Larval Entrainment
Mandalay
% Total
Target Species Engraulid sp. Complex1
16.30 5.36 8.60
White croaker 10.71 3.52 5.70 Queenfish 3.67 1.21 1.90 Total Target Species 30.68 10.09 16.20 Other Species Atherinid sp. Complex2 0.88 0.29 0.50 Gobiid sp. Complex3 72.02 23.67 38.1 Blennies 82.60 27.14 43.7 Diamond turbot 0.17 0.06 0.10 Other miscellaneous 2.77 0.89 1.40 Total larvae 189.12 62.14 100.00 1includes northern anchovy, deepbody anchovy, and slough anchovy 2includes California grunion, topsmelt, and jacksmelt 3 includes cheekspot, arrow, and shadow gobies

B-45
Table B-9
Estimated Impact of Mandalay Station Operation on Fish Resources
% Contribution to Total Losses
Species Egg to 10mm
10mm-30mm
30mm-90mm
> 90mm
Probability of survival
Northern anchovy 3.24 50 45 0.26 99.89
White croaker 95.49 2.29 1.56 0.65 99.97
Queenfish 19.98 61.20 13.44 5.38 99.56
Kelp bass NA NA NA 99.99 99.99
Shiner surfperch NA NA 98.57 95.22 93.87
White surfperch NA NA 99.99 99.91 99.91
Data Taken from 1982 CDS for Mandalay
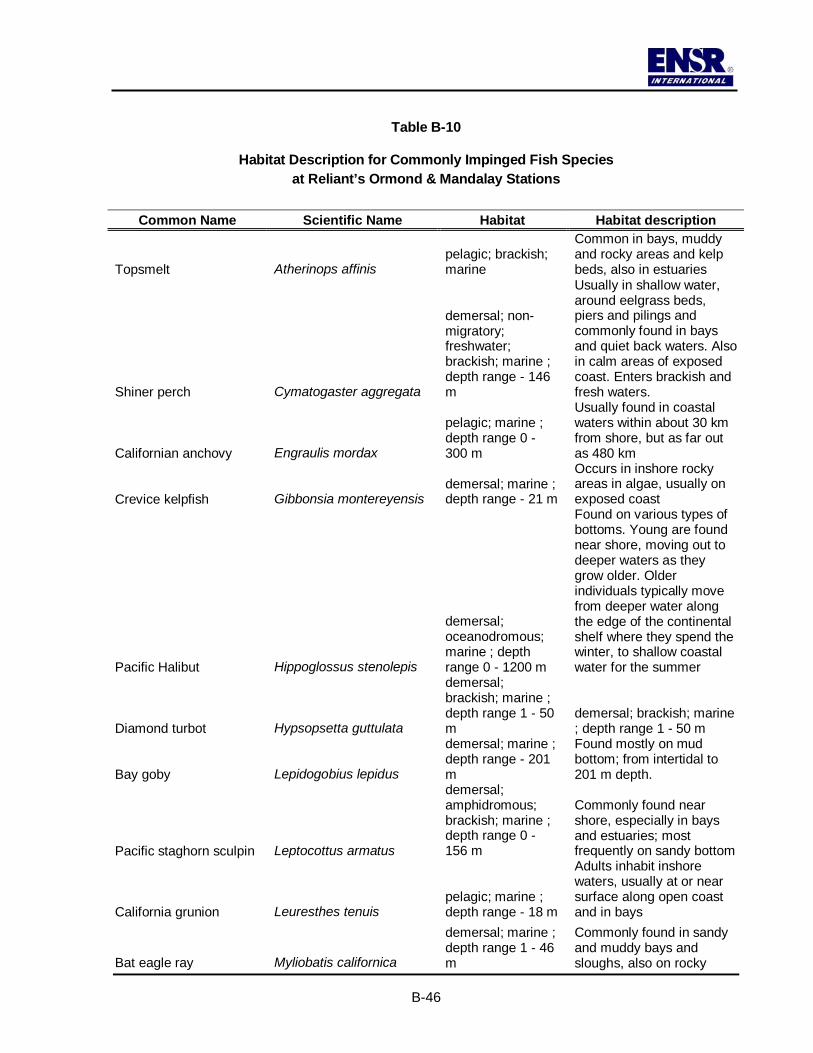
B-46
Table B-10
Habitat Description for Commonly Impinged Fish Species at Reliant’s Ormond & Mandalay Stations
Common Name Scientific Name Habitat Habitat description
Topsmelt Atherinops affinis pelagic; brackish; marine
Common in bays, muddy and rocky areas and kelp beds, also in estuaries
Shiner perch Cymatogaster aggregata
demersal; non-migratory; freshwater; brackish; marine ; depth range - 146 m
Usually in shallow water, around eelgrass beds, piers and pilings and commonly found in bays and quiet back waters. Also in calm areas of exposed coast. Enters brackish and fresh waters.
Californian anchovy Engraulis mordax
pelagic; marine ; depth range 0 - 300 m
Usually found in coastal waters within about 30 km from shore, but as far out as 480 km
Crevice kelpfish Gibbonsia montereyensis demersal; marine ; depth range - 21 m
Occurs in inshore rocky areas in algae, usually on exposed coast
Pacific Halibut Hippoglossus stenolepis
demersal; oceanodromous; marine ; depth range 0 - 1200 m
Found on various types of bottoms. Young are found near shore, moving out to deeper waters as they grow older. Older individuals typically move from deeper water along the edge of the continental shelf where they spend the winter, to shallow coastal water for the summer
Diamond turbot Hypsopsetta guttulata
demersal; brackish; marine ; depth range 1 - 50 m
demersal; brackish; marine ; depth range 1 - 50 m
Bay goby Lepidogobius lepidus
demersal; marine ; depth range - 201 m
Found mostly on mud bottom; from intertidal to 201 m depth.
Pacific staghorn sculpin Leptocottus armatus
demersal; amphidromous; brackish; marine ; depth range 0 - 156 m
Commonly found near shore, especially in bays and estuaries; most frequently on sandy bottom
California grunion Leuresthes tenuis pelagic; marine ; depth range - 18 m
Adults inhabit inshore waters, usually at or near surface along open coast and in bays
Bat eagle ray Myliobatis californica
demersal; marine ; depth range 1 - 46 m
Commonly found in sandy and muddy bays and sloughs, also on rocky

B-47
Common Name Scientific Name Habitat Habitat description bottom and in kelp beds
California flounder Paralichthys californicus
demersal; oceanodromous; brackish; marine ; depth range 0 - 183 m
Lives mostly on sandy bottoms. Common beyond surf line, also in bays and estuaries. Occurs from near shore to 183 m depth.
Pacific pompano Peprilus simillimus
benthopelagic; marine ; depth range 9 - 91 m
Commonly found on sand bottom of exposed coasts. Usually occurs in shallow water near shore
White seaperch Phanerodon furcatus demersal; marine ; depth range - 43 m
Often occurs near piers, docks, in bays and sandy areas, but usually in quiet water and offshore areas near rocks.
Specklefin midshipman Porichthys myriaster
demersal; marine ; depth range 0 - 126 m
Inhabits rocky areas and soft bottom, common in bays. Ranges from the intertidal zone to 126 m depth
South American pilchard Sardinops sagax
pelagic; oceanodromous; marine ; depth range 0 - 200 m Neritic. A coastal species.
Bay pipefish Syngnathus leptorhynchus demersal; brackish; marine
Common in eelgrass of bays and estuaries, sometimes taken in shallow offshore waters
Pacific jack mackerel Trachurus symmetricus
pelagic; oceanodromous; marine ; depth range 0 - 400 m
Often found offshore, up to 500 miles from the coast. Young frequently occur in school near kelp and under piers
Haller's round ray Urolophus halleri demersal; marine ; depth range - 91 m
Occurs in sand or mud bottom off beaches and in bays and sloughs, sometimes around rocky reefs

B-48
Figure B-1
Correlation between Impingement Data Sets for Ormond SCE (1979-1980) and Proteus (1997-2004)
For 14 Target Species
y = 0.9296xR2 = 0.8056
0.00
10.00
20.00
30.00
40.00
50.00
60.00
0 10 20 30 40 50 60
Proteus
SCE
.
Figure B-2
Correlation between Impingement Data Sets for Mandalay SCE (1979-1980) and Proteus (2001-2004)
For 14 Target Species
y = 0.6715xR2 = 0.9325
0.00
10.00
20.00
30.00
40.00
50.00
60.00
70.00
0.00 20.00 40.00 60.00 80.00 100.00 120.00
Proteus
SCE
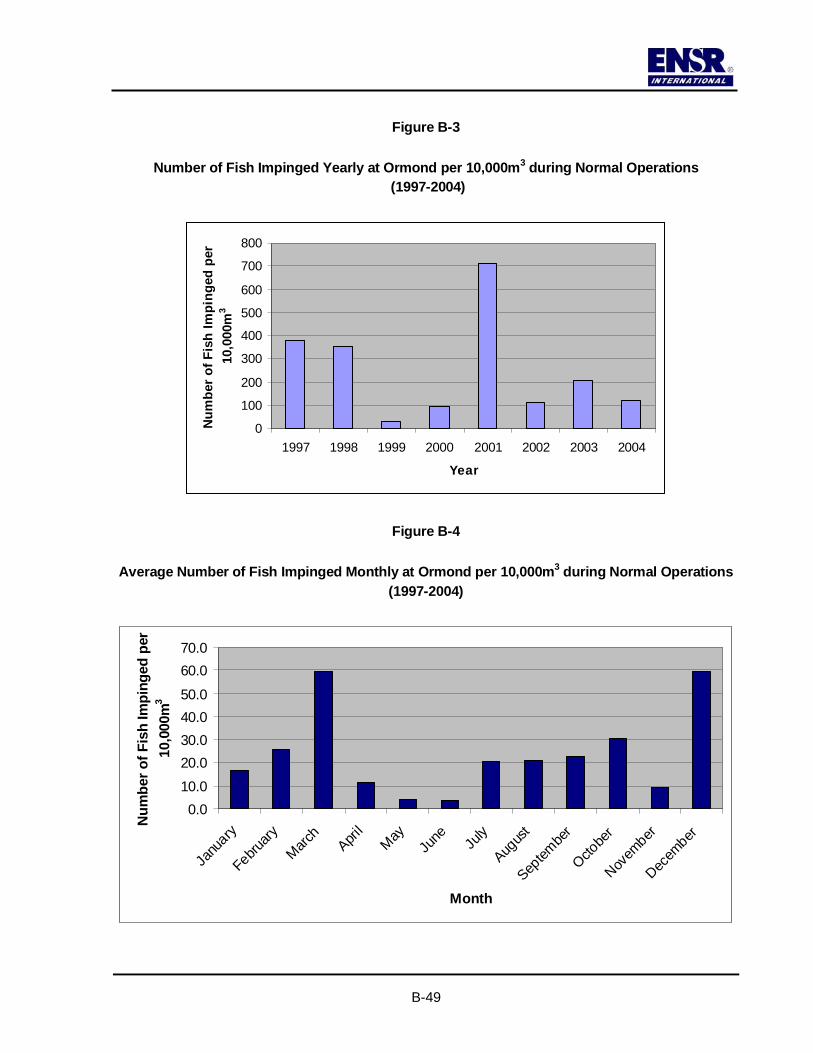
B-49
Figure B-3
Number of Fish Impinged Yearly at Ormond per 10,000m3 during Normal Operations (1997-2004)
0
100
200
300
400
500
600
700
800
1997 1998 1999 2000 2001 2002 2003 2004
Year
Num
ber o
f Fis
h Im
ping
ed p
er
10,0
00m
3
Figure B-4
Average Number of Fish Impinged Monthly at Ormond per 10,000m3 during Normal Operations (1997-2004)
0.010.020.030.040.050.0
60.070.0
Janu
ary
February
March
April
MayJu
ne July
Augus
t
Septem
ber
Octobe
r
Novem
ber
Decem
ber
Month
Num
ber o
f Fis
h Im
ping
ed p
er
10,0
00m
3

B-50
Figure B-5
Number of Fish Impinged Monthly at Mandalay per 10,000m3 during Normal Operations (2001-2004)
0
1020
3040
5060
70
2001 2002 2003 2004
Year
Num
ber o
f Fis
h Im
ping
ed p
er
10,0
00m
3
Figure B-6
Number of Fish Impinged Yearly at Mandalay per 10,000m3 during Normal Operations (2001-2004)
0
10
20
30
40
50
Janu
ary
Februa
ryMarc
hApri
lMay Ju
ne July
Augus
t
Septem
ber
Octobe
r
Novembe
r
Decembe
r
Month
Num
ber o
f Fis
h Im
ping
ed p
er
10,0
00m
3

APPENDIX C
EPA COST ESTIMATE

APPENDIX D
SAMPLING PLAN
D-1 October, 2005
APPENDIX D- SAMPLING PLAN
Southern California Edison (SCE) and Reliant Energy Incorporated (Reliant) have been collecting data on impingement and entrainment at the Ormond Beach Generating Station (Ormond) for approximately the past 30 years. This data collection effort has been completed in support of Ormond’s original 316(b) demonstration as well as per Ormond’s current National Pollutant Discharge Elimination System (NPDES) permit conditions. SCE evaluated impingement in the 1970s and early 1980s, and since 1997, SCE and then Reliant assessed impingement at Ormond on an approximately monthly basis. Entrainment was also assessed in the 1970s and early 1980s. The conclusion of both the entrainment and impingement assessments is that operation of the cooling water intake structure (CWIS) does not substantially affect the local fish populations. Although the entrainment data are somewhat dated, Reliant believes that these data represent a comprehensive assessment of the impacts of operation of the Ormond facility. Therefore, we believe these data are suitable for inclusion in the Impingement Mortality and Entrainment Characterization Study (IMECS). Reliant plants to undertake an additional one year of sampling to supplement and validate historical data.
40 CFR § 125.94(b)(1)(iv) specifies that the PIC should include:
"A sampling plan for any new field studies you propose to conduct in order to ensure that you have sufficient data to develop a scientifically valid estimate of impingement mortality and entrainment at your site. The sampling plan must document all methods and quality assurance/quality control procedures for sampling and data analysis. The sampling and data analysis methods you propose must be appropriate for a quantitative survey and include consideration of the methods used in other studies performed in the source waterbody. The sampling plan must include a description of the study area (including the area of influence of the cooling water intake structure(s)), and provide a taxonomic identification of the sampled or evaluated biological assemblages (including all life stages of fish and shellfish)."
40 CFR § 125.94(b)(3) describes the requirements of the IMECS as follows:
"You must submit to the Director an Impingement Mortality and/or Entrainment Characterization Study whose purpose is to provide information to support the development of a calculation baseline for evaluating impingement mortality and entrainment and to characterize current impingement mortality and entrainment. The Impingement Mortality and/or Entrainment Characterization Study must include the following, in sufficient detail to support development of the other elements of the CDS:
(i) Taxonomic identifications of all life stages of fish, shellfish, and any species protected under Federal, State, or Tribal Law (including threatened or endangered species) that are in the

D-2 October, 2005
vicinity of the cooling water intake structure(s) and are susceptible to impingement and entrainment;
(ii) A characterization of all life stages of fish, shellfish, and any species protected under Federal, State, or Tribal Law (including threatened or endangered species) identified pursuant to paragraph (b)(3)(i) of this section, including a description of the abundance and temporal and spatial characteristics in the vicinity of the cooling water intake structure(s), based on sufficient data to characterize annual, seasonal, and diel variations in impingement mortality and entrainment (e.g., related to climate and weather differences, spawning, feeding and water column migration). These may include historical data that are representative of the current operation of your facility and of biological conditions at the site;
(iii) Documentation of the current impingement mortality and entrainment of all life stages of fish, shellfish, and any species protected under Federal, State, or Tribal Law (including threatened or endangered species) identified pursuant to paragraph (b)(3)(i) of this section and an estimate of impingement mortality and entrainment to be used as the calculation baseline. The documentation may include historical data that are representative of the current operation of your facility and of biological conditions at the site. Impingement mortality and entrainment samples to support the calculations required in paragraphs (b)(4)(i)(C) and (b)(5)(iii) of this section must be collected during periods of representative operational flows for the cooling water intake structure and the flows associated with the samples must be documented."
The Final Rule Preamble states that this information must be provided in sufficient detail to support development of the other elements of the CDS and notes that while the taxonomic identification in item 40 CFR § 125.94(b)(3)i will need to be fairly comprehensive, the quantitative data required in items § 125.94(b)(3)ii and § 125.94(b)(3)iii may be more focused on species of concern, and/or species for which data are available.
This Sampling Plan presents Reliant’s efforts to collect additional data to update and validate the historical impingement and entrainment assessment and comply with the requirements of the regulations.. Section 2.0 and 3.0 of Reliant’s Proposal for Information Collection (PIC) for 316(b) compliance (of which this Appendix is a part) describes the CWIS and its zone of influence and Section 4.0 describes the historical data and provides the rationale for the selection of sampling methods and data analyses presented here.
Reliant plans to collect data on the existing impingement mortality and entrainment rates at the Ormond facility. Sections E.1 and E.2 provide our approach to collect data sufficient to determine rates of impingement mortality and entrainment, respectively. Section E.3 provides more specific information on the field and laboratory protocols for each type of sampling.

D-3 October, 2005
D.1 Impingement
As required by its NPDES permit, Ormond currently quantifies impingement during normal operation approximately monthly, as plant operations allow. Impingement during heat treatments is evaluated for every heat treatment episode. The methodology for the collection of the samples as well as the characterization of the species and the treatment of the data are presented below.
D.1.1 Historical and Current Impingement Sampling
Monthly sampling to characterize impingement during normal operations was done both initially and more recently. The current sampling is contingent upon the facility operating normally. Sampling dates are randomly selected during a month, although at present, impingement sampling only occurs when the facility is generating electricity. If the facility is not running during a day scheduled for the impingement sampling to occur, the sampling event is moved to the next feasible date the facility is operating. The days that Ormond operates are dependent upon electrical demand and maintenance outages; as compared to when the original impingement sampling was completed, currently the station does not operate continuously throughout the year. Also, the number of seawater circulation pumps in operation ranges from one to four and, consequently, the rate of seawater intake by the station vary daily, monthly, and seasonally.
For each impingement sampling event, fish, macroinvertebrates, and plants impinged on the intake screens during the sampling period have been collected, characterized to species, counted, and weighed. At the beginning of a 24-hour count, the screens are cleared to remove accumulated materials. At the end of the 24-hour period, organisms that have accumulated on the screen and in the collection basket are separated from debris and sorted by species. The standard lengths of bony teleost fish (subclass Osteichthyes) and the total lengths of all cartilaginous fish (subclass Chondrichthyes) are recorded. Lengths of the first 200 individuals for each species are recorded. Abundance and biomass for all fish and invertebrates of each species are recorded in kilograms.
Impingement sampling is also conducted during all heat treatments. A heat treatment is an operational procedure to eliminate fouling organisms, predominantly mussels and barnacles, from the seawater cooling system. Unchecked growth of these organisms reduces the operational efficiency of the station. During a heat treatment, the temperature of the seawater within the seawater cooling system is elevated to a range of 38˚- 40.5˚C. This temperature rise is accomplished by recirculating warm discharge water back into the station, increasing the seawater temperature within the forebay. By adjusting the position of the gates that control seawater flow within the seawater cooling system, the mix of recirculating seawater and incoming seawater can be controlled to achieve the desired heat treatment temperature while still allowing

D-4 October, 2005
the plant to function. The elevated seawater temperature results in the mortality of marine organisms within the system. These organisms are impinged upon the removable screens, removed from the system, and deposited in containers where they are counted. The duration of the heat treatment sampling is typically three to six hours and coincides with the heat treatment period. The necessary duration of the heat treatment is inversely proportional to the seawater temperature.
D.1.2 Quantification of Impingement Losses
Impingement is primarily dependent upon the flow of seawater into Ormond’s seawater cooling system. Currently, seawater flow varies according to the number of seawater circulation pumps in operation, the tides, and the level of biofouling.
Historical studies calculated annual impingement rates by extrapolating from the daily impingement rates. Monthly impingement rates were estimated by multiplying the measured 24-hour impingement counts by the ratio of the total cooling water flow for the month and dividing by the cooling water flow during the 24-hour count. Annual impingement for normal operations is the sum of the extrapolated monthly impingement values. Raw data are available to allow for alternative methods of estimation for comparison to newly collected data.
Total annual impingement loss is a combination of losses during normal operations and heat treatments for the year.
The following formula was used to estimate impingement:
hanasa
ho NNF
FF+⎥
⎦
⎤⎢⎣
⎡ −
Where: Ia = Estimated total impingement during interval, of species “a” Fo = Operational Flow during interval Fh = Operational Flow during heat treatment Fsa = Flow during sample day(s) (24-Hour fish counts) during interval Nna = Number of fish “a” taken during 24-Hour sampling during interval Nha = Number of fish “a” taken in heat treatments during interval
Flow data for the Ormond Beach Generating Station were calculated based on the number of seawater circulation pumps in operation each day. Data on seawater circulation operation were supplied by Reliant.
D-5 October, 2005
Nominal flows are:
Flow Number of Seawater Circulation Pumps gpm mgd
1 119,000 171.4 2 238,000 342.7 3 357,000 514.1 4 476,000 685.4
gpm = gallons per minute mgd = million gallons per day
Earlier estimates of fish impingement were based on a simple multiplier that assumed that the seawater rate of flow through the power plant remained constant during fish counts and the intervening periods of normal operations (SCE, 1983). This assumption was somewhat conservative although basically valid since the plant operated as a base-load facility and its pumps were going nearly all of the time. In recent years, efforts to reduce operational expenses and conserve energy have resulted in operating procedures where seawater circulation pumps are routinely shut down when not needed. Seawater flow varies from day to day and month to month. Flow is the determining factor in impingement, so the original formula to estimate impingement has been modified from one that uses operational days to one that uses actual flow.
Data from the fish count records are entered into an on-line database management system. This database system enables personnel to enter data and download results via the internet. Queries are performed to provide a wide variety of information on the fish counts.
D.1.3 Impingement Sampling Plan
Reliant plans to conduct the same type of sampling of impingement rates as has been conducted over the past eight years at Ormond. Sampling will occur monthly unless Ormond is not generating electricity for an entire month. Sampling dates will be determined randomly. However, when the facility is not operating during a pre-determined date, impingement sampling will be completed on the next day the facility is operating normally. If, based on advance notice, the facility will be generating electricity prior to the pre-selected sampling date and not on the identified sampling day or for the subsequent week or more, the sampling will be advanced to capitalize on the earlier opportunity. The objective of the scheduling of the sampling will be to collect as many months of data as possible. Sampling during all heat treatments will be continued. Running of the cooling water pumps for the sole purpose of sampling will not be pursued in general, although Reliant may elect to do so where extended shutdown is anticipated during a critical sampling period.

D-6 October, 2005
The days that Ormond station operates are dependent upon electrical demand and maintenance outages. Currently the station does not operate continuously throughout the year. Also, in some cases only one of the two circulation pumps per unit is in operation or only one of the units is in operation and, consequently, the rate of water intake by the station varies daily, monthly, and seasonally. Number of units, pumps and screens in operation will be noted.
Specimens collected will be identified to lowest practical taxonomic level, counted, measured and weight as described below in Section E.3.3. Samples will be visually assessed at the time of sampling to determine if the sample appears to have been affected by an episodic event (e.g., impingement of significantly larger than normal numbers of fish). Historical data as well as data collected during the current sampling program will be used to establish a reference. If the sampling team believes that a sample may have been affected by an unavoidable episodic impingement event, another day or night sample may be collected in the next 24 – 48 hours and analyzed for verification purposes.
Impingement data will be summarized and expressed on a per survey, per flow volume, and estimated monthly and annual basis. Diel and seasonal trends will be evaluated. Raw data will be available as an Access® or comparable database.
D.1.4 Data Sufficiency
Reliant believes that the historical samples and analyses are of acceptable quality for inclusion in the IMECS. In particular, the relatively extensive data set available from past studies, combined with data that will be collected in the next year will provide a sufficient record of the rate of impingement mortality to support the analysis and selection of appropriate technologies and/or operational or restoration measures. Together these data will be sufficient to support the regulatory requirements of the IMECS and Reliant's anticipated compliance approach. Should additional data be deemed useful to support pre- versus post-implementation comparisons after approval of the CDS by LARWQCB, such additional sampling will be incorporated into the verification monitoring program.
Calculation baseline will be determined using existing and new data in combination with existing and historical data on standing stocks of ambient fish populations near the Ormond CWIS, plant operation data, and other information available in the scientific or "gray" literature regarding potential reductions in impingement mortality for selected technologies and operational measures.

D-7 October, 2005
D.2 Entrainment
The rate of entrainment and the effect of entrainment on local fish populations was assessed during the late 1970s and early 1980s but has not subsequently been reevaluated. Reliant plans to supplement the previous data with one year of site-specific entrainment sampling data.
D.2.1 Historical Entrainment Sampling
During the late 1970s and early 1980s, SCE and the Los Angeles Department of Water and Power (LADWP) undertook a comprehensive system-wide effort to assess entrainment losses for their stations along the Southern California Bight. Ormond was selected as representative of SCE’s offshore, soft bottom intake structures. Entrainment samples were collected by pumping a measured volume of water from within the riser cap of the intake structure. Samples were collected on a monthly basis; four replicate samples were collected at each of six periods throughout the 24-hour sampling period. The six periods included two day, two night, and two crepuscular (sunset and sunrise) samples.
D.2.2 Quantification of Entrainment Losses
SCE determined mean larval entrainment densities for each month based on larval abundance and intake flow volume. Periodicity of the abundance was assessed and was related to sampling times and day length. The significance of entrainment losses was estimated based on a comparison of the calculated entrainment loss against the assumed population of each species within the project area. These losses were evaluated for each life stage for each species where data were available to complete the analyses to yield an overall estimate of impacts to each species under consideration.
D.2.3 Entrainment Sampling Plan
Reliant plans to sample for entrainment once a month throughout the year. Sampling will be completed using a 333 µm plankton net with a 0.5 m diameter mouth deployed in the cooling water intake flow in the forebay in front of the traveling screens. The net will be equipped with an impeller to allow estimation of the filtered volume. The target filtered volume will be 100 m3. The actual sampled volume as well as the plant cooling water flow rate will be recorded. Samples will be collected beginning at each of four periods: sunrise, mid-day, sunset, and midnight in order to evaluate diel variation.
Samples will be visually assessed at the time of sampling to determine if the sample appears to have been affected by an episodic event (e.g., entrainment of significantly larger than normal numbers of ichthyoplankton). Historical data as well as data collected during the current sampling program will be used to establish a reference. If the sampling team believes that a sample may have been affected by

D-8 October, 2005
an unavoidable episodic entrainment event, a second day or night sample may be collected within the next 24 to 48 hours and analyzed for verification purposes.
Samples will be collected on a randomly selected weekday each month. Reliant will make the same determined effort as described in Section E.1.3 to rearrange sampling to ensure at least one sample will be collected during each month. This extra sampling effort may include rescheduling events, collecting a second daily sampling early in the following month, and/or pursuing the day-time and night-time sampling events on different days. Running of the cooling water pumps for the sole purpose of sampling will not be pursued in general, although Reliant may elect to do so where extended shutdown is anticipated during a critical sampling period.
Each sample will be preserved, stored, and analyzed separately in the lab (Section E.3.3). Fish eggs and larvae will be identified to lowest distinguishable taxonomic category and counted. When a species is especially abundant, subsamples will be obtained by a plankton splitter. Specimens will be measured for definition of length frequencies. Common and scientific names will be those established by the American Fisheries Society. Counts will be expressed relative to 10,000 m3 of water.
Entrainment data will be summarized and expressed on a per survey, per flow volume, and estimated annual basis. Diel and seasonal trends will be evaluated. Raw data will be available as an Access® or comparable database.
D.2.4 Data Sufficiency
Ormond was one of the base cases that SCE evaluated for system-wide entrainment studies. The data were collected by withdrawing by pump a measured volume of water from within the riser at the originating end of the intake pipe. Samples were collected, preserved, stored, sorted, and evaluated using standard ichthyoplankton methods. Where possible, species were segregated and life stages for each species were identified. Where the taxonomy was in question, the samples were identified to the lowest taxonomic level possible. Reliant believes that the samples and analyses are of high quality and sufficient for inclusion in the IMECS.
Samples will be collected on a randomly selected day each month. Given the relatively limited nature of available data, Reliant will make the same determined effort as described in section E.1.3 to rearrange sampling to ensure at least one sample will be collect during each month. This extra sampling effort may include rescheduling events, collecting a second daily sampling early in the following month, and/or pursuing the day-time and night-time sampling events on different days. Running of the cooling water pumps for the sole purpose of sampling will not be pursued.

D-9 October, 2005
D.3 Quality Assurance/Quality Control
The sampling program will be completed in accordance with the Quality Assurance/Quality Control (QA/QC) procedures described below. This QA/QC program will ensure that accurate, consistent and traceable data are collected for the duration of the project.
Elements of the QA/QC Plan can roughly be broken into five categories:
• Roles and responsibilities; • Mobilization for field work; • Sample Collection; • Sample Processing; • Data Management; and • Sample Tracking
D.3.1 Roles and Responsibilities
The Project Manager will be responsible for the overall performance of the project including budget, schedule and quality control. The Project Manager will serve as the primary point of contact with Reliant Corporate and Station personnel. The Project Manager will assign a Sampling Team and designate a Field Manager for the sampling effort. It will be the responsibility of the Field Manager to ensure that all needed equipment and supplies are readied for each sampling event and that the gear is in proper operating condition. The Field Manager will develop a checklist of primary and backup equipment, supplies, datasheets, tools, field repair kits, safety equipment, and other necessary items for each type of sampling activity.
D.3.2 Mobilization
Sampling will be conducted in accordance with the schedule contained in the approved PIC. A matrix will be developed showing target dates for conducting each component of the program. The matrix will include the time(s) of day sampling is to be performed.
Designated Reliant contacts will be notified one week prior to each sampling event, with confirmation provided 24 to 48 hours in advance if weather conditions remain favorable.
Twenty-four hours prior to each sampling event, this gear will be assembled and verified against the checklist for primary and backup equipment, supplies, datasheets, and other required gear. The Field Manager will inspect each piece of equipment to ensure that it is in good condition and fully functional. Any damaged equipment will be repaired or replaced prior to deployment. Sample containers will be

D-10 October, 2005
inspected to ensure that they are clean, in good physical condition, and that lids fit tightly. To the extent practical, backup gear, replacement parts, and spare batteries will be included in the gear assembled for each sampling event. Primary and backup electronic equipment will be calibrated, as applicable, in accordance with manufacturer’s recommendations.
The Sampling team assigned by the Project Manager will review field safety issues and protocols prior to embarking on each trip and sampling personnel will participate in an on-site safety briefing as may be required by the station. It is the responsibility of the Field Manager or his/her designee to ensure that all assembled equipment is transported to the project site and properly stored and handled for the duration of the trip.
Upon return from each sampling event, the Field Manager will ensure that all gear is cleaned, inspected, stored, repaired when necessary, and otherwise readied for the next event. Post-sampling equipment calibrations will be performed and documented, as appropriate. A maintenance report describing problems encountered and corrective action taken will be completed for damaged or malfunctioning equipment. Supplies will be restocked, as necessary. A copy of the post-sampling calibration and maintenance report will be provided to the Project Manager to assist in his/her assessment of the reliability of reported field data.
D.3.3 Sample Collection
The Field Manager will be responsible for ensuring that all field activities are conducted in conformance with the established QA/QC program and safety procedures.
D.3.3.1 Recording Data
Recorded data represent the results of long hours spent in the field and are the first step in a lengthy analytical process. All field and laboratory personnel will adhere to the basic rules for recording information as described below:
• Legible writing with no erasures, write-overs, or cross-outs; • Correction of errors with a single strike-out line followed by the recorder’s initials and
date; and • Cross-outs on incomplete pages with an initialed and dated diagonal line.
D.3.3.2 Datasheets
All data will be entered on pre-printed, standardized, datasheets at the time of sampling. Generic information, such as date, type of sampling, field team members, weather conditions, and tidal stage will be included at the top of the form. Site-specific conditions, such as time of collection, gear type,
D-11 October, 2005
water depth, physical parameters, and sample ID, will be recorded at the beginning of sample collection. Upon completion of sample collection, any unusual conditions that might have affected the quality of the sample will be documented. An explanation will be provided for any missing data. The datasheet will then be checked for accuracy by a second member of the field team prior to obtaining additional samples or moving to the next station.
D.3.3.3 Container Labeling
Biological samples will be placed in appropriate containers. A label will be affixed to each sampling container. The label will be filled in with the date, station ID, sample type, sample number, replicate number, and sampler’s initials. A waterproof internal label with the same information will be placed inside the container with the sample, and the lid tightly secured. The internal label will be composed of an appropriate material and ink to withstand any preservative used in the collection.
D.3.3.4 Sample Containers
Containers used to temporarily store live specimens or used to transfer preserved specimens from the field to the lab will be made of appropriate materials. Nalgene or comparable plastic bottles will be used for storing field samples.
D.3.3.5 Physical Data
A suite of standard water quality measurements (DO, salinity, temperature, pH, etc.) will be taken at each sampling station. Meters will be field calibrated, as applicable, prior to data collection. Surface, mid-depth, and bottom conditions will be recorded where water depths permit. In depths of six feet or less, only mid-depth measurements will be taken.
D.3.3.6 Safety Precautions
Appropriate safety gear will be worn and utilized for all field activities in accordance with established safety plans. Any field chemical transfers will be made using secondary containment to prevent spills in the boat or adjacent waters. Gloves and eyewear will be worn at all times when handling chemicals.
D.3.3.7 Field Sampling
All biological sampling will be conducted in accordance with the QA/QC program described herein. Field sampling procedures for entrainment and impingement mortality sampling are described below.

D-12 October, 2005
Entrainment sampling
Sampling will be completed using a 333-µm plankton net with a 0.5 m diameter mouth deployed in the forebay in front of the removable screens. The net will be equipped with an impeller to allow estimation of the filtered volume. The target filtered volume will be 100 m3. Duplicate samples will be collected at each time frame. Upon retrieval of the net, the cod end will be inspected to ensure that it can be safely detached without losing any of the sample. The net will be rinsed to transfer organisms that may be attached to the net into the cod end. The cod end will then be removed and the contents carefully poured into the sample container. Following this initial step, the cod end will be inverted over the sample container and gently rinsed with a squirt bottle containing filtered seawater to ensure that all contents have been transferred. Collections will initially be preserved in 10% formalin solution with rose Bengal stain. Containers that will hold preserved specimens will be prepared in advance by adding formalin to the sample container at the lab. An appropriate amount of seawater will be added to the container in the field prior to adding the collected sample. After 48 hours all liquid will be discarded and 40-percent isopropyl alcohol or 70-percent ethanol added to the collection container for permanent preservation. Samples will be analyzed in the laboratory as described in Section E.3.3.
Impingement sampling
Reliant will continue the same type of sampling of impingement rates as has been conducted over the past four years as outlined in Section E.1.1. Sampling will occur monthly unless Ormond in not generating electricity for an entire month. Sampling dates will be determined randomly. When the facility is not operating during a pre-determined date, the next day the facility’s operating normally impingement sampling will be completed. If, based on advance notice, the facility will be generating electricity prior to the preselected sampling date and not on the identified sampling day or for the subsequent week or more, the sampling will be advanced to capitalize on the earlier opportunity. The objective of the scheduling of the sampling will be to collect as many months of data as possible.
For each impingement sampling event, fish and invertebrates impinged on the intake screens during the sampling period will be collected, identified to the lowest practical taxonomic level, counted, and measured (total length and fork length) as described in Section E.3.3. The condition (live, freshly dead, or dead) of each specimen collected will also be determined.
Representative specimens of difficult to identify species will be identified to the lowest practicable taxon and preserved for more thorough identification at the lab. A reference collection will be developed and will contain sufficient material to represent each major life stage and/or size class. For fish greater than 150 mm that are being preserved, an incision about 30 mm in length will be made along the abdominal body wall on the right side of the fish to ensure penetration of fixative into the body cavity. Fish will remain in buffered formalin for several days to ensure adequate fixation of tissues. After the fish have been thoroughly fixed, the buffered formalin will be removed and the specimens soaked in fresh water for 48 hours with at least one change of water. After 48 hours all water will be discarded

D-13 October, 2005
and 40-percent isopropyl alcohol or 70-percent ethanol added to the collection container for permanent preservation.
All biological sampling will be conducted in accordance with the QA/QC Plan and applicable conditions of regulatory sampling permits issued for project.
D.3.3.8 Deviations from QA/QC Plan
Examples of failures in sampling methods and/or deviations from sampling requirements include but are not limited to such things as sample container spillage or breakage, gear malfunction, equipment failure, and unusual site conditions that prevent sampling. Failures or deviations from the QA/QC Plan will be fully documented on the field datasheet and reported to the Project Manager. The Project Manager will determine if the deviation from established protocol compromises the validity of the resulting data. The Project Manager will decide whether to accept or reject data associated with the sampling event based on his/her best professional judgment and will determine whether the absence of specific data will significantly affect analytical objectives of the project. In cases where missing data are likely to impact the ability of the project team to draw reliable inferences regarding plant effects, the Project Manager will require that sampling be repeated.
Modifications to the sampling program and/or methods may be made as appropriate based on the review of data as it becomes available. Reliant will provide written notification to LARWQCB of any significant deviations from the sampling program described herein.
D.3.4 Sample Processing and Analysis
Entrainment Sample and Processing Analysis
At the lab, field samples will be logged in, sorted by date and type, and stored in a safe, secure location for processing. Entrainment samples may require subsampling when large numbers of organisms have been collected. In those cases, the raw sample will be split with a Folsom plankton splitter after most of the debris and vegetative matter has been removed. Care will be taken to assure that no organisms are inadvertently removed with the discarded matter. Splitting may be required multiple times until a target number of specimens is reached. The number of times each sample is split will be recorded to allow for extrapolation of data from the split sample to the original sample composition.
Whole or split samples will be transferred to petri dishes for examination under a dissecting microscope. All organisms will be identified to the lowest practicable taxon. Measurements appropriate for the life stage will be recorded as well as physical characteristics relevant to life stage (oil drop present, size of oil drop, pigmentation, ocular development, presence of byssal threads, etc).

D-14 October, 2005
Appropriate reference literature and electronic databases will be made available to assist in taxonomic determinations. A random subset of all identified organisms will be reviewed by a second qualified taxonomist to ensure consistency in identifications. Should there be disagreement between the two taxonomists, supporting confirmation from outside experts will be sought. Samples of all problematic taxa will be delivered to independent experts for identification/verification.
Additionally, a reference collection of specimens will be maintained for the life of the project and made available for examination by outside parties. The reference collection will contain sufficient material to represent each major life stage and/or size class. In addition to the preserved specimens, a representative photo record of both larval and juvenile/adult fishes will be established and maintained in an electronic database. Availability of photographs and key taxonomic characters of species will ensure accuracy and consistency in identifications throughout the life of the project.
All data generated during the processing of samples will be recorded on standardized lab bench sheets. Prior to processing each sample, pertinent information on the container labels will be transferred to the bench sheet to ensure proper sample tracking. Numbers of individuals for each life history stage of each species processed will be recorded on the bench sheet. If performed, sub-sampling information will also be entered on the form.
Each processed sample will be labeled with a discrete sample number and the name of the processing taxonomist and stored for QA purposes. Reexamination of a representative number of previously identified samples will be made by a different taxonomist to verify previous identifications and numerical information. Greater than 5% discrepancy between initial and QA analyses will require reexamination of all samples analyzed since the last QA check. Following each QA analysis specimens not being retained for the reference collection will be properly disposed of.
Impingement Sample Processing and Analysis
Length measurements of impinged fish will be made using a measuring board consisting of a linear metric scale secured to a flat wooden or plastic base with a fixed head piece. Fish will be measured by positioning the body on the right side, head facing the observer’s left, and fish mouth closed. Total length will be measured as the distance from the anterior-most portion of the head or jaws to the extreme tip of the caudal fin. If the caudal fin is bi-lobed, the lobes will be squeezed together and measured to the posterior-most tip of the combined lobes. Fork length will be measured from the tip of the jaw or tip of the snout with closed mouth to the center of the fork in the tail. Length measurements will be collected for the first 25 individuals of a species from each sampling unit, consistent with EPA's Rapid Bioassessment Protocols for Use in Streams and Wadeable Rivers: Periphyton, Benthic Macroinvertebrates, and Fish, Second Edition. The 25 individuals will be randomly selected for measurement from the total number of individuals for each species. The condition of measured specimens (live, freshly dead or dead) will be noted. Total number of individuals impinged within several pre-determined size classes, based on visual classification. The specimens collected will be

D-15 October, 2005
weighed as a batch for each species identified; where more than 25 individuals have been collected for a given species, a subsample will be weighed to obtain an average weight of specimens impinged.
D.3.5 Data Management
Field datasheets and lab bench sheets will be placed in labeled folders for input into an electronic database maintained by the identification lab. Prior to processing the data, the Field Manager or assignee will review the forms for completeness and accuracy. Each form will have a signature and date block to track data processing. After the data have been entered into the database, the data forms will be signed, dated, and returned to the folder for verification. Printouts of entered data will be verified against corresponding field datasheets and lab bench sheets to ensure that all information has been accurately transferred. For large datasets entered (e.g., more than 100 entries), a subset of 20 percent of the data entries selected at random will be checked. If errors are detected in more than 10 percent of the subset, then corrections will be made and another subset will be checked, Missing information will be added and wrong information corrected. The forms will then be initialed and dated by the verifying party. Following data verification the original data forms will be segregated by sampling date and type and archived for the life of the project.
D.3.6 Sample Tracking
Proper sample handling and custody procedures are required to ensure the integrity of samples from sample collection through data analysis. A number of forms will be used for chain-of-custody documentation. Upon arrival at the laboratory, all samples will be received and logged in using a Sample Receipt Log, which will include the following information:
• Project Name; • Field Team Leader; • Date of Collection; • Time of Collection; • Site Identification; • Type of Sample; • Replicate Number; • Preservative Used; • Name of collector(s); • Name of Recipient; and • Time/Date of Receipt.
The Project Manager or assignee will develop a master list of all samples, which will be used to track the progress of the field sampling program. Appropriate blocks for each sample will be checked off as each sample is collected, processed, analyzed, and the data entered into the computer. Each month,

D-16 October, 2005
the Project Manager will review the master list and evaluate whether sample collection and processing is progressing in conformance with established schedules. Missing information will be reconciled and appropriate corrective measures taken, where warranted.
All failures associated with sample receipt procedures will be immediately reported to the Project Manager. These include but are not limited to things such as lost samples, deviations from QA/QC requirements, incomplete documentation, possible tampering of samples, and broken or spilled samples. The Project Manager will determine if these issues have compromised the validity of the resulting data or will impede analytical objectives. The Project Manager will decide how best to address identified problems. Possible courses of action include, document and proceed, redo the entire sampling event, or selectively analyze the samples. The effect(s) of all identified problems on project objectives and any related corrective measures will be documented in QA reports furnished to Reliant.