ozone regulation under the clean air act darcy j. anderson az dept. of environmental quality
TRANSCRIPT
Ozone Regulation under the Clean Air Act
Darcy J. AndersonAZ Dept. of Environmental Quality

2
Presentation Outline
• 8-Hour Ozone Standard – Background / Timeline
• 8-Hour Ozone Standard – Designation Process
• Arizona Designation Process – Examples
• Potential Impacts of 8-Hour Ozone Designations on Tribes
• Next Steps in 8-Hour Ozone Process
3
NAAQS for Ozone
• 1-hr standard 0.12 ppm (parts per million)
• 8-hr standard 0.08 ppm
4
The 8-Hr Rolling Average
• Average of 8 consecutive hours • EPA ozone standard requires that 4th highest
8-hr average be ≤ 0.084ppm– Actual standard is 0.080ppm, but anything ≤ 0.084
is truncated to 0.080
• Small-group activity on this today at 1:45
5
• July 1997: EPA issued revised 8-hour health-based standard for ozone. – Studies show that long-term, low exposure to
ozone as harmful to human health as short-term, high exposure.
– New standard more protective for longer exposure
8-Hour Ozone Standard – Background / Timeline

6
8-Hour Ozone Standard – Background / Timeline
• 2000: EPA issues guidance documents• February 2001:
– U.S. Supreme Court upheld 8-hour ozone standard
– Directed EPA to develop implementation approach
7
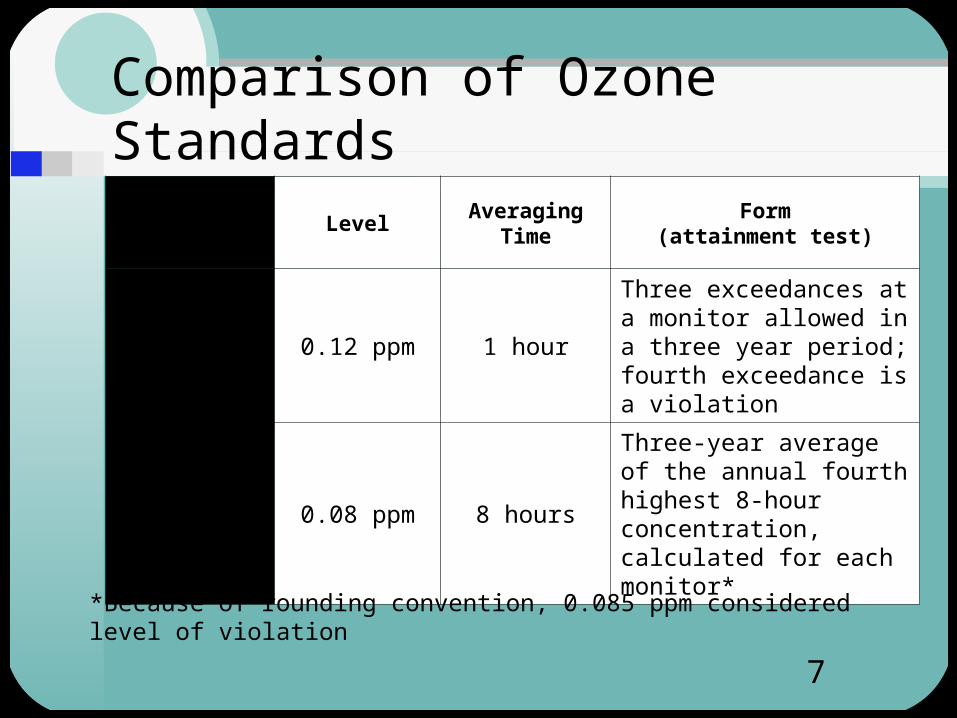
Comparison of Ozone Standards
Standard Level Averaging TimeForm
(attainment test)
One-Hour 0.12 ppm 1 hour
Three exceedances at a monitor allowed in a three year period; fourth exceedance is a violation
Eight-Hour 0.08 ppm 8 hours
Three-year average of the annual fourth highest 8-hour concentration, calculated for each monitor*
*Because of rounding convention, 0.085 ppm considered level of violation
8
8-Hour Ozone Standard - Designation Process
• November 2002: lawsuit settlement– EPA & environmental groups agree
on schedule for EPA to promulgate 8-hour ozone designations

9
8-Hour Ozone Standard - Designation Process (cont.)
• February 27, 2003: EPA memorandum on 8-hour ozone designations – Extended deadline for states to
submit recommendations for designating areas
– New deadline July 15, 2003
10
8-Hour Ozone Standard - Designation Process (cont.)
• June 2003: EPA proposes rule for implementing 8-hour NAAQS
• Final rule for implementing 8-hour NAAQS expected early 2004
11
8-Hour Ozone Standard - Designation Process (cont.)
• July 15, 2003: State recommendations for area designations submitted to EPA
• Tribes could also submit recommendations by this date
• Options – Attainment / unclassifiable– Nonattainment

12
8-Hour Ozone Standard - Designation Process(cont.)
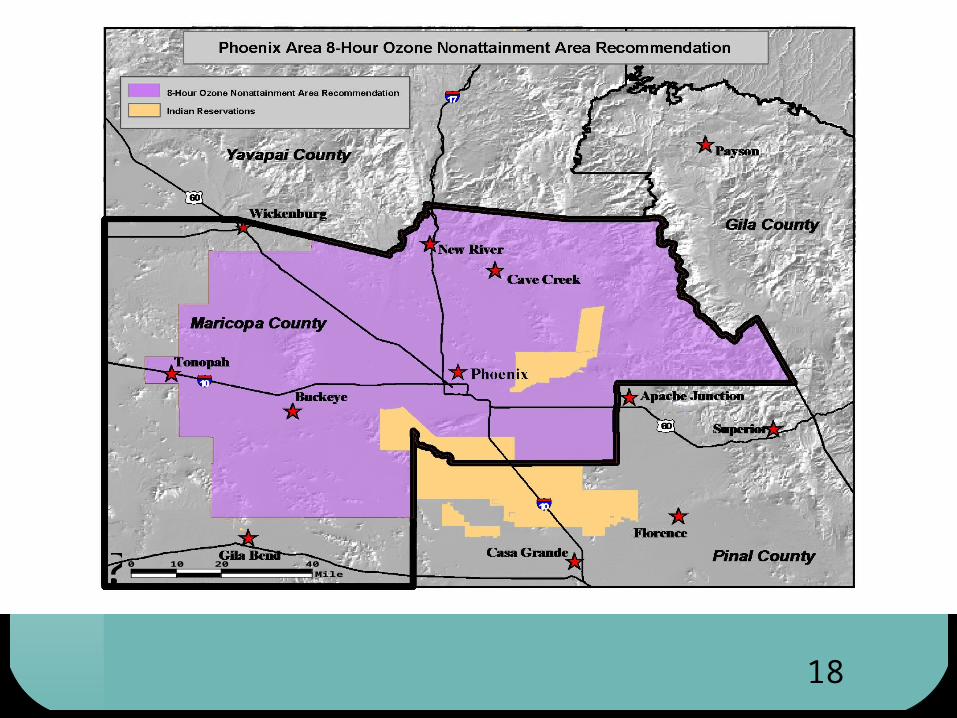
• July 2003: Governor’s recommendation for AZ submitted to EPA– Recommended all areas of state attainment /
unclassifiable for 8-hour standard except Phoenix metro area
– No state jurisdiction / recommendation for Indian reservations
– Some Arizona tribes submitted their recommendations
13
Arizona Designation Process: Examples
• Monitoring data – exceedances, violations
• Location of emission sources
• Meteorology, geography, and jurisdictional boundaries
• Population
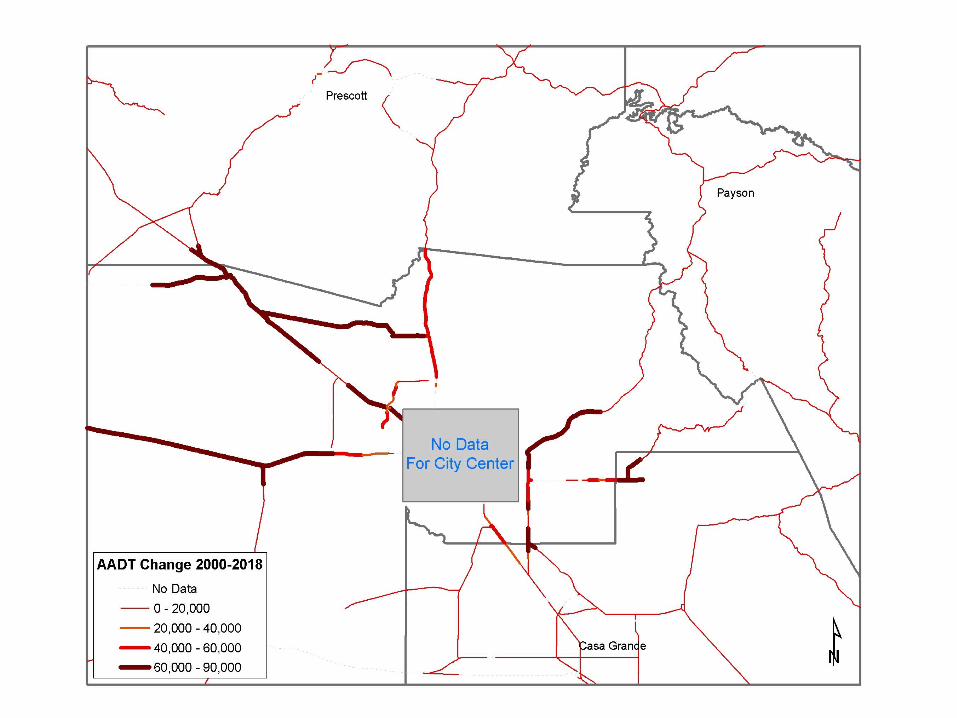
• Traffic and commuting patterns

Annual Fourth Highest 8-Hour Ozone Concentration in Parts per Billion (PPB) Monitor Site Abbreviation 1995 1996 1997 1998 1999 2000 2001 2002
Maricopa CountyBlue Point BP 83 89 87 87 80 86Cave Creek CC 83 86Central Phoenix CP 85 76 77 79 78 76 75 76Falcon Field FF 81 83 82 75 81 84Fountain Hills FH 88 86 86 85 83 86Glendale GL 80 72 76 70 81 81 78 83Humboldt Mountain HM 81 90 86 82 85 90Lake Pleasant LP 82 81 82 73Maryvale MA 78 86 77 80 73 84Mesa ME 92 90 84 80 83 75 74 72Mt. Ord MO 84 88 87 90 77North Phoenix NP 92 95 91 89 84 86 86 85Palo Verde PAVE 71 77 80 80 80 74 78Emergency Management EM 85 81 86 70 63Super Site PXSS 87 79 79 76 79 76Pinnacle Peak PP 91 91 82 86 83 86 85 84Rio Verde RV 85 79 86 86 83 85Roosevelt RO 84Salt River Pima SRPI 92 92 82 87 82South Phoenix SP 84 91 75 80 75 83 76 81South Scottsdale SS 89 87 76 78 72 80 79 77Surprise SU 71 79Tempe TE 78 79 80Vehicle Emissions VE 92 80West Chandler WC 77 74 69 74 78 83West Phoenix WP 84 81 78 86 91 81 75 84
Gila CountyRye RY 56 65 80Tonto N.M. TONO 87
Pinal CountyApache Junction AJ 91 85 82 82 80 82 78 80Casa Grande CG 71 79 72 68 78 75 74 78Queen Valley QUAZ 79 83
Yavapai CountyHillside HISD 85 76 83 84 83 76 89Values in blue indicate an exceedance of the 8-hour ozone standard
15
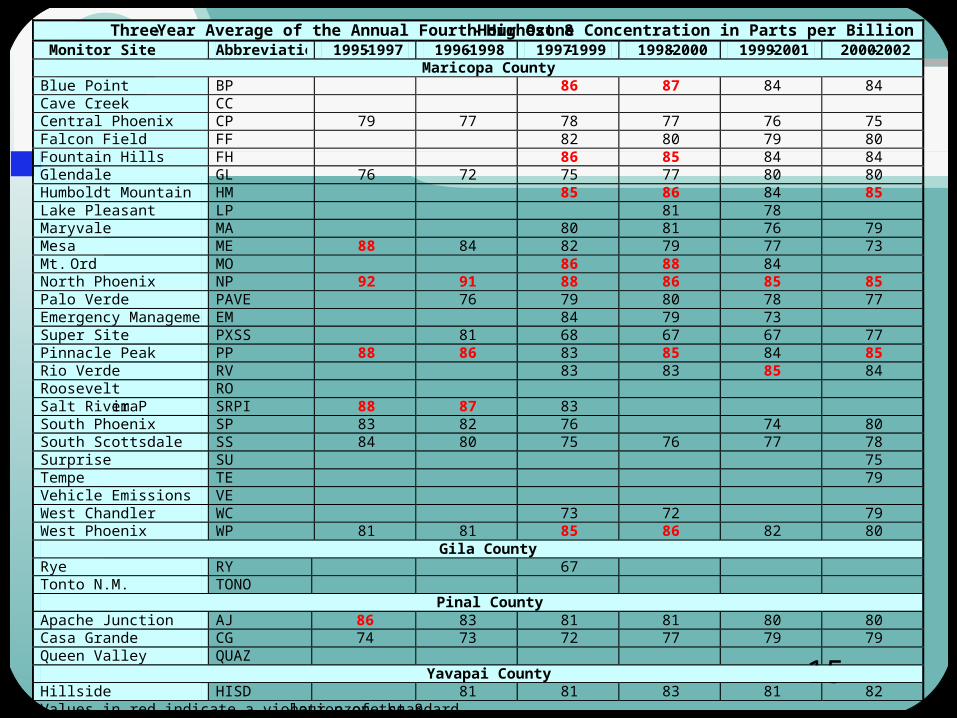
Three-Year Average of the Annual Fourth Highest 8 -Hour Ozone Concentration in Parts per Billion (PPB) Monitor Site Abbreviation 1995-1997 1996-1998 1997-1999 1998-2000 1999-2001 2000-2002
Maricopa County Blue Point BP 86 87 84 84 Cave Creek CC Central Phoenix CP 79 77 78 77 76 75 Falcon Field FF 82 80 79 80 Fountain Hills FH 86 85 84 84 Glendale GL 76 72 75 77 80 80 Humboldt Mountain HM 85 86 84 85 Lake Pleasant LP 81 78 Maryvale MA 80 81 76 79 Mesa ME 88 84 82 79 77 73 Mt. Ord MO 86 88 84 North Phoenix NP 92 91 88 86 85 85 Palo Verde PAVE 76 79 80 78 77 Emergency Management EM 84 79 73 Super Site PXSS 81 68 67 67 77 Pinnacle Peak PP 88 86 83 85 84 85 Rio Verde RV 83 83 85 84 Roosevelt RO Salt River Pima SRPI 88 87 83 South Phoenix SP 83 82 76 74 80 South Scottsdale SS 84 80 75 76 77 78 Surprise SU 75 Tempe TE 79 Vehicle Emissions VE West Chandler WC 73 72 79 West Phoenix WP 81 81 85 86 82 80
Gila County Rye RY 67 Tonto N.M. TONO
Pinal County Apache Junction AJ 86 83 81 81 80 80 Casa Grande CG 74 73 72 77 79 79 Queen Valley QUAZ
Yavapai County Hillside HISD 81 81 83 81 82 Values in red indicate a violation of the 8-hour ozone standard
16
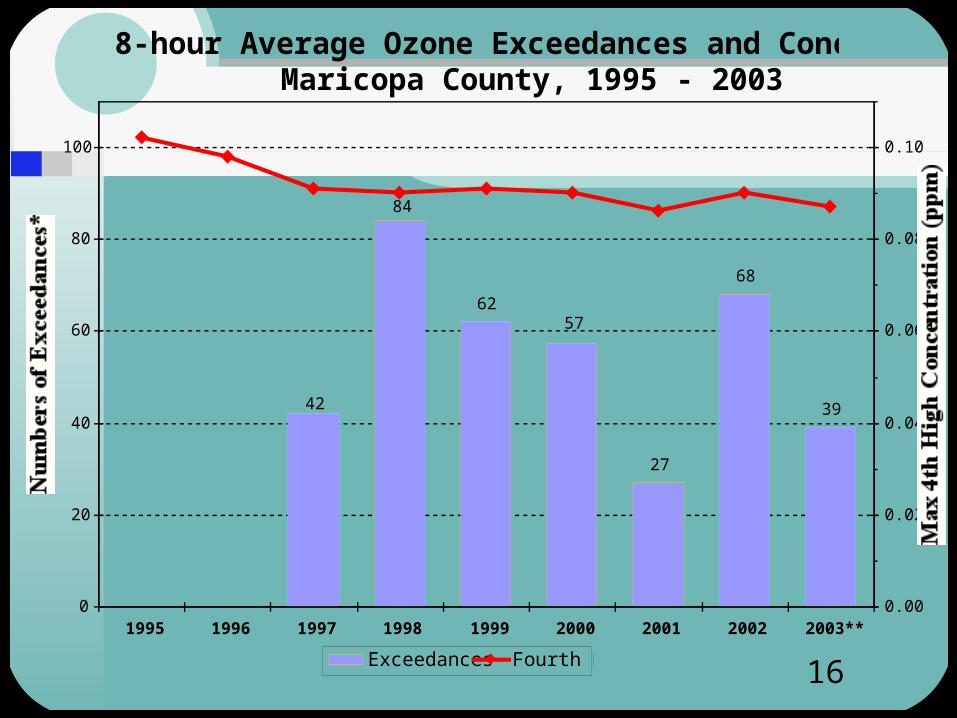
8-hour Average Ozone Exceedances and Concentrations Maricopa County, 1995 - 2003
62
27
68
39
57
42
84
0
20
40
60
80
100
1995 1996 1997 1998 1999 2000 2001 2002 2003**
Numbers of Exceedances*
0.00
0.02
0.04
0.06
0.08
0.10
Max 4th High Concentration (ppm)
Exceedances Fourth Hi
17
18
0 20 4010Miles?

19
20

21
Potential Impacts of 8-Hour Ozone Designations on Tribes
• Boundary / background / transport • Tribes can provide valuable ozone data
for urban nonattainment areas• Tribes can conduct additional ozone
and NOx monitoring to assist with model verification
• Public information / outreach (API)• Ozone mapping – AIRNOW
22
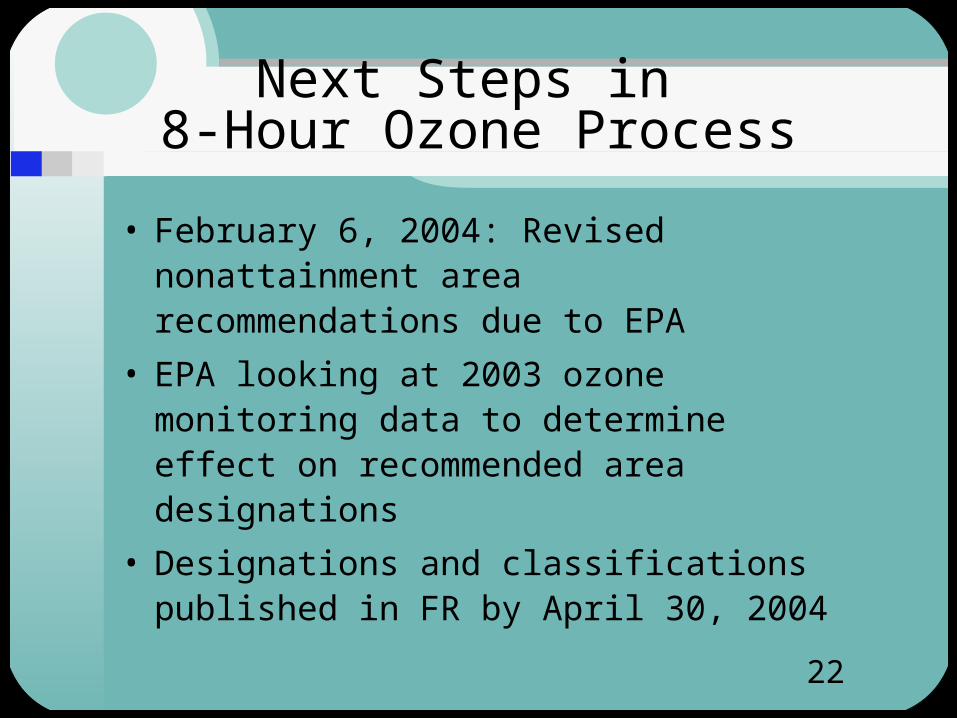
Next Steps in 8-Hour Ozone Process
• February 6, 2004: Revised nonattainment area recommendations due to EPA
• EPA looking at 2003 ozone monitoring data to determine effect on recommended area designations
• Designations and classifications published in FR by April 30, 2004
23
Next Steps: Ozone Implementation Plan
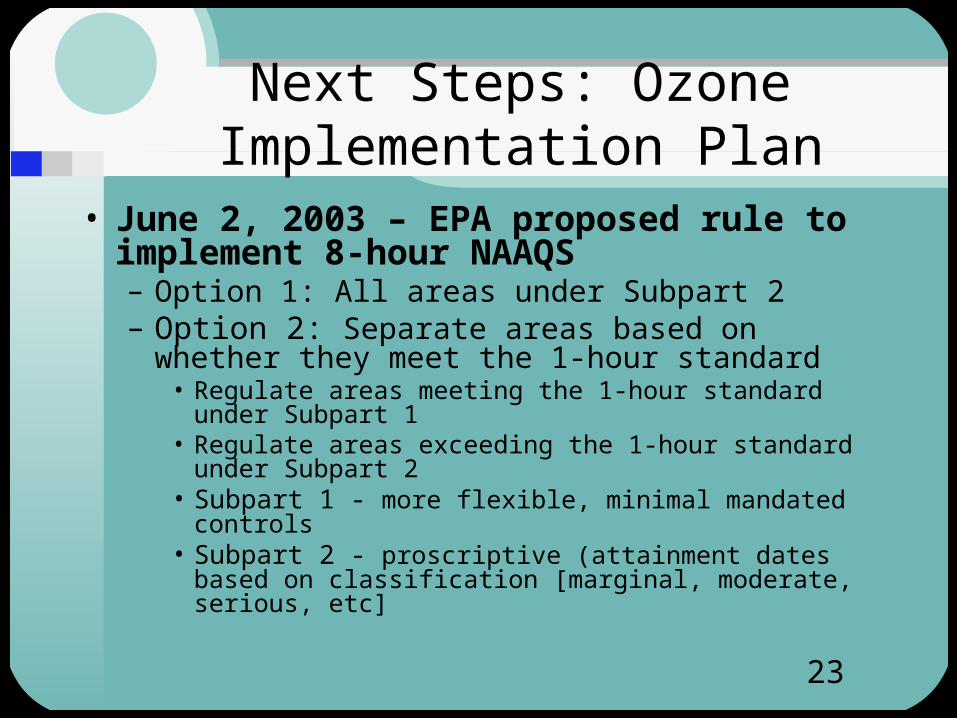
• June 2, 2003 – EPA proposed rule to implement 8-hour NAAQS– Option 1: All areas under Subpart 2– Option 2: Separate areas based on whether they
meet the 1-hour standard • Regulate areas meeting the 1-hour standard under
Subpart 1 • Regulate areas exceeding the 1-hour standard under
Subpart 2• Subpart 1 - more flexible, minimal mandated controls• Subpart 2 - proscriptive (attainment dates based on
classification [marginal, moderate, serious, etc]
24
Next Steps: Ozone Implementation Plan (cont.)
– Anticipate implementation of new standard for Phoenix area either under subpart 1 or marginal under subpart 2• Subpart 1 option - Attainment demonstration
due 2007; attainment required 2009
• Subpart 2 option – Attainment required 2007
• New control measures may be necessary to meet proposed attainment date
25
Next Steps in 8-Hour OzoneProcess: NOx Waiver
•What is a NOx waiver?
•Draft rule proposes NOx waiver under CAA Section 182(f) apply to any area designated nonattainment for 8-hour standard
•Requires new analysis to obtain waiver under 8-hour guidance

26
NOx Waiver (cont.)
• NSR & RACT requirements for major stationary VOC sources also apply to major NOx sources
• Unless NOx waiver provision implemented

27
For More Detail
• Refer to full text outline in manual • Outline follows PowerPoint slide
pages