p 3 actuaries you can understand 1 review of economic assumptions november 8, 2006 p
TRANSCRIPT

1P3 Actuaries you can
understand
Review of Economic Assumptions
November 8, 2006
P

2P3 Actuaries you can
understand
Syllabus
• Assumptions– Economic Model– Inflation and Investment Return
• Expectations• Other 37 Act Systems• Recommendations

3P3 Actuaries you can
understand
Assumptions
• Best guess of what will happen in the future

4P3 Actuaries you can
understand
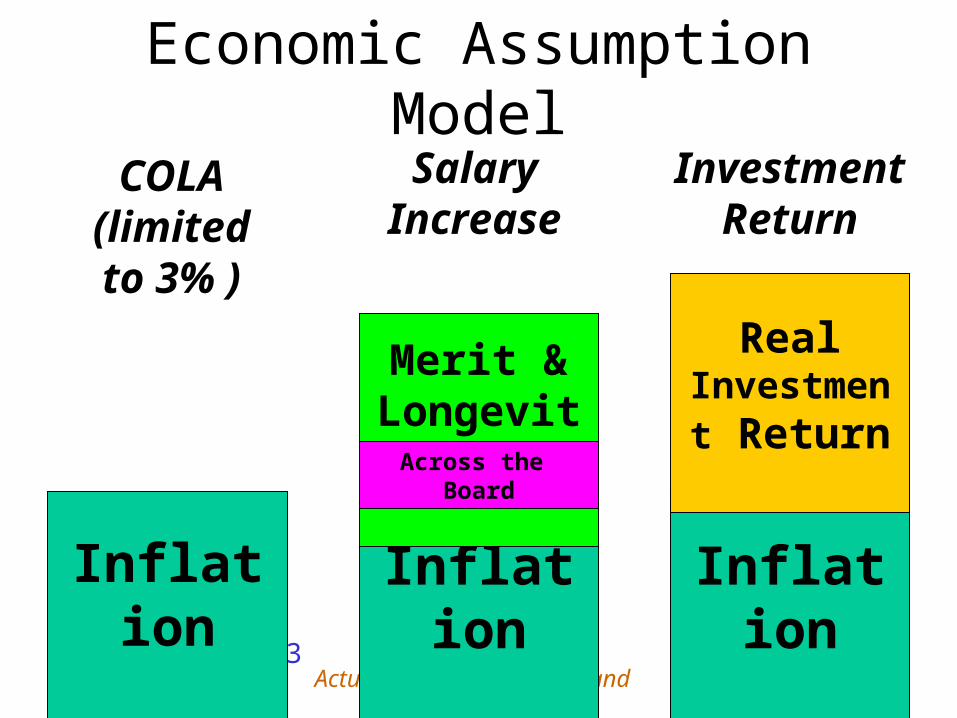
Economic Assumptions
• Describe impact on money
• InflationSalary IncreasesReturn on InvestmentsCost-of-Living Adjustments

5P3 Actuaries you can
understand
Demographic Assumptions
• Describe member movement from one category to another
• TerminationDisabilityRetirementDeath
6P3 Actuaries you can
understand
Economic Assumption Model
Inflation Inflation Inflation
Merit & Longevity
Real Investment
Return
COLA (limited to 3% )
Salary Increase
Investment Return
Across the Board
7P3 Actuaries you can
understand
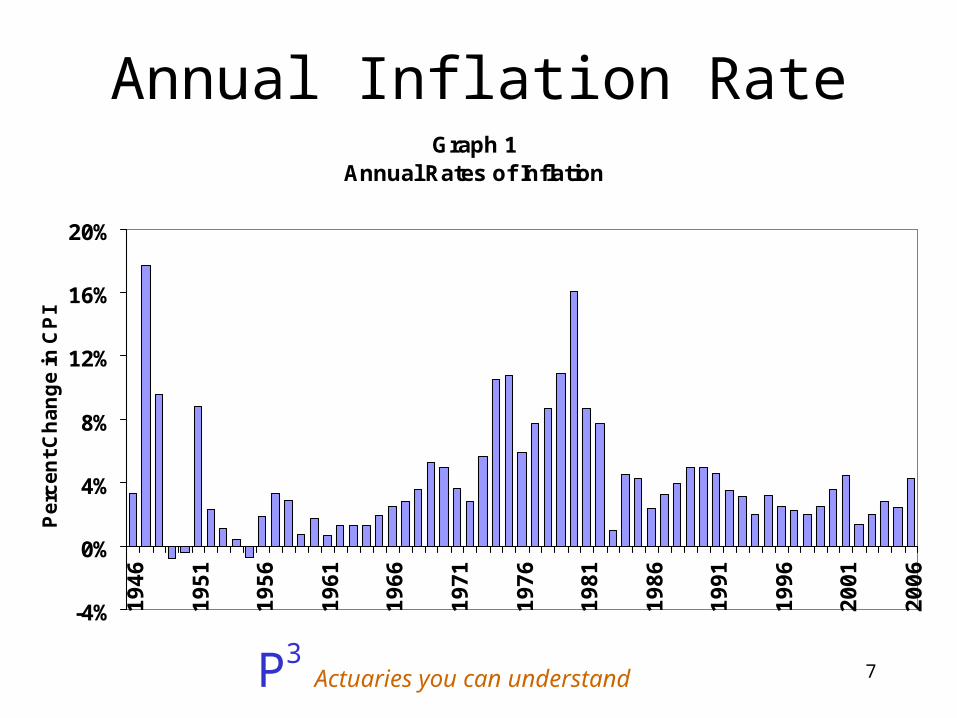
Annual Inflation RateGraph 1
Annual Rates of Inflation
-4%
0%
4%
8%
12%
16%
20%
19
46
19
51
19
56
19
61
19
66
19
71
19
76
19
81
19
86
19
91
19
96
20
01
20
06
Pe
rce
nt
Ch
an
ge
in C
PI
8P3 Actuaries you can
understand
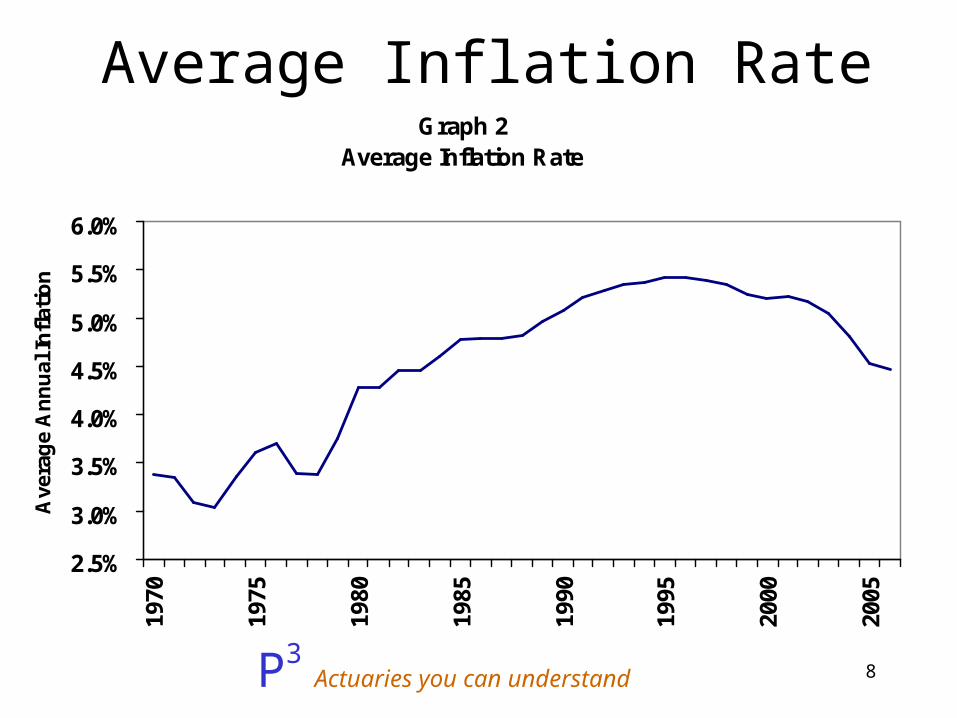
Average Inflation RateGraph 2
Average Inflation Rate
2.5%
3.0%
3.5%
4.0%
4.5%
5.0%
5.5%
6.0%
1970
1975
1980
1985
1990
1995
2000
2005
Ave
rag
e A
nn
ual
Infl
atio
n
9P3 Actuaries you can
understand
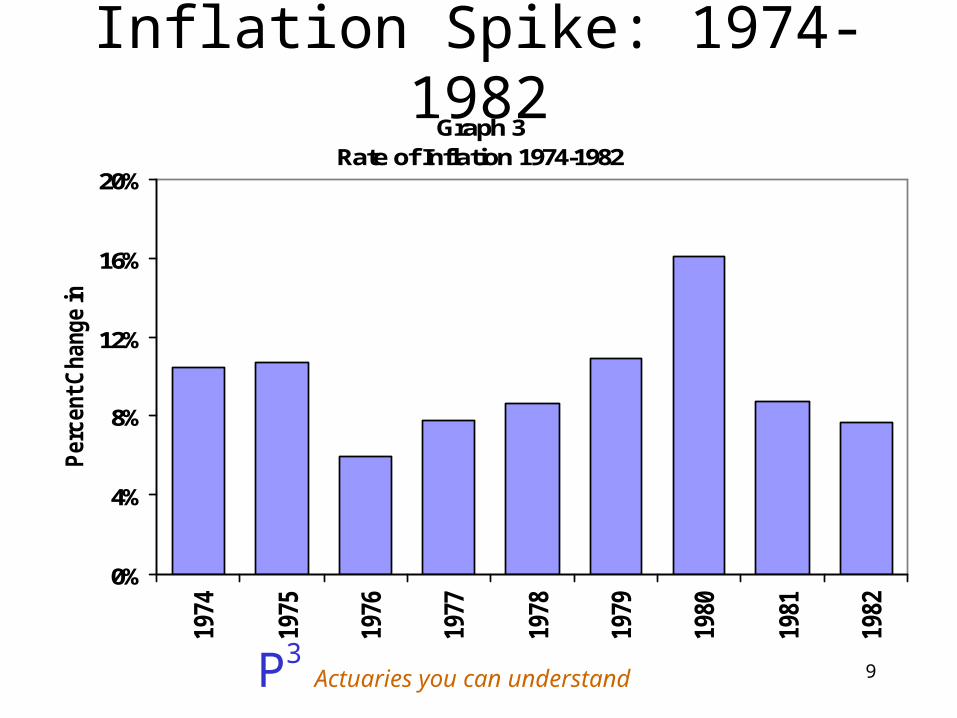
Inflation Spike: 1974-1982Graph 3
Rate of Inflation 1974-1982
0%
4%
8%
12%
16%
20%19
74
1975
1976
1977
1978
1979
1980
1981
1982
Perc
ent C
hange in
CP
I
10P3 Actuaries you can
understand
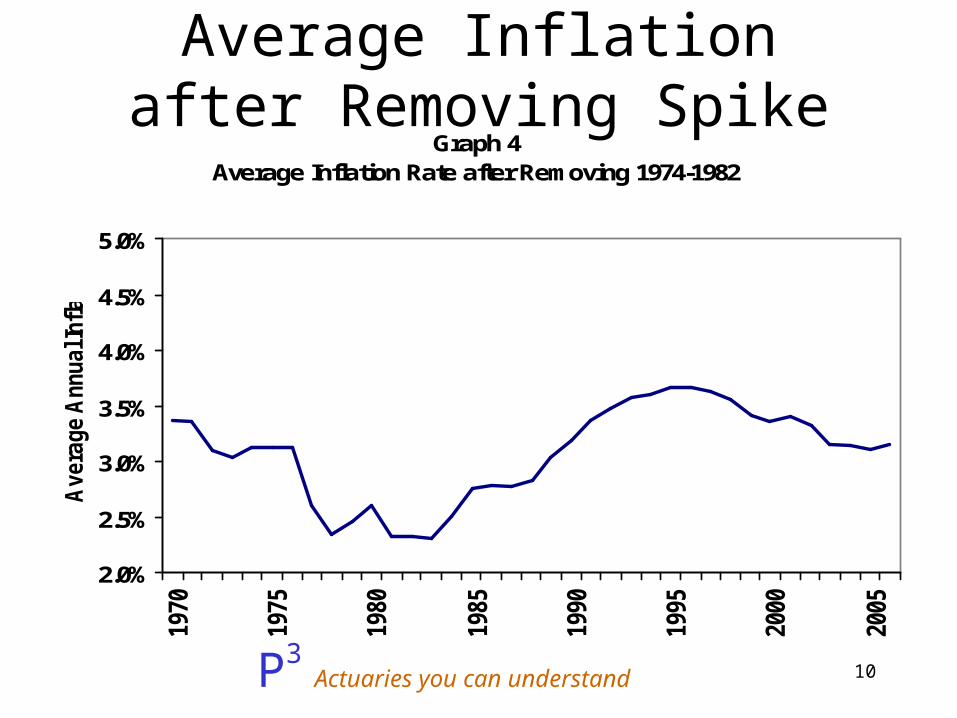
Average Inflation after Removing Spike
Graph 4Average Inflation Rate after Removing 1974-1982
2.0%
2.5%
3.0%
3.5%
4.0%
4.5%
5.0%
1970
1975
1980
1985
1990
1995
2000
2005
Avera
ge A
nnual I
nflation
11P3 Actuaries you can
understand
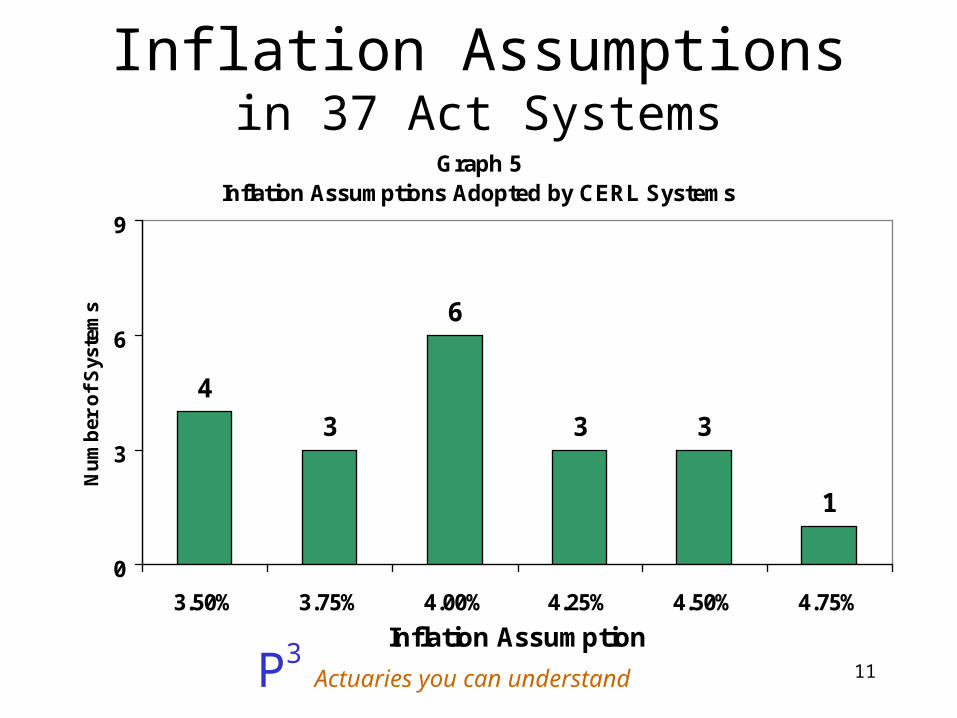
Inflation Assumptionsin 37 Act Systems
Graph 5Inflation Assumptions Adopted by CERL Systems
4
3
6
3 3
1
0
3
6
9
3.50% 3.75% 4.00% 4.25% 4.50% 4.75%
Inflation Assumption
Nu
mb
er o
f S
yste
ms
12P3 Actuaries you can
understand
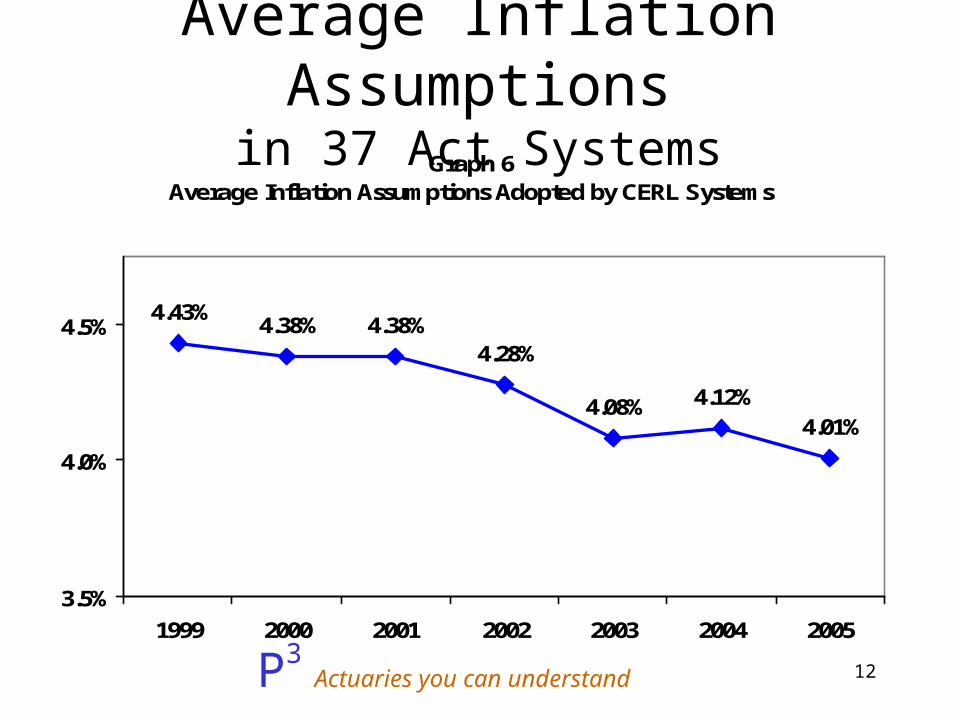
Average Inflation Assumptionsin 37 Act Systems
Graph 6Average Inflation Assumptions Adopted by CERL Systems
4.43%4.38% 4.38%
4.28%
4.08% 4.12%4.01%
3.5%
4.0%
4.5%
1999 2000 2001 2002 2003 2004 2005
13P3 Actuaries you can
understand
Inflation Assumption
• Current4.00%
• Reasonable Range 3.00% - 4.50%
• Recommendation: 4.00%
14P3 Actuaries you can
understand
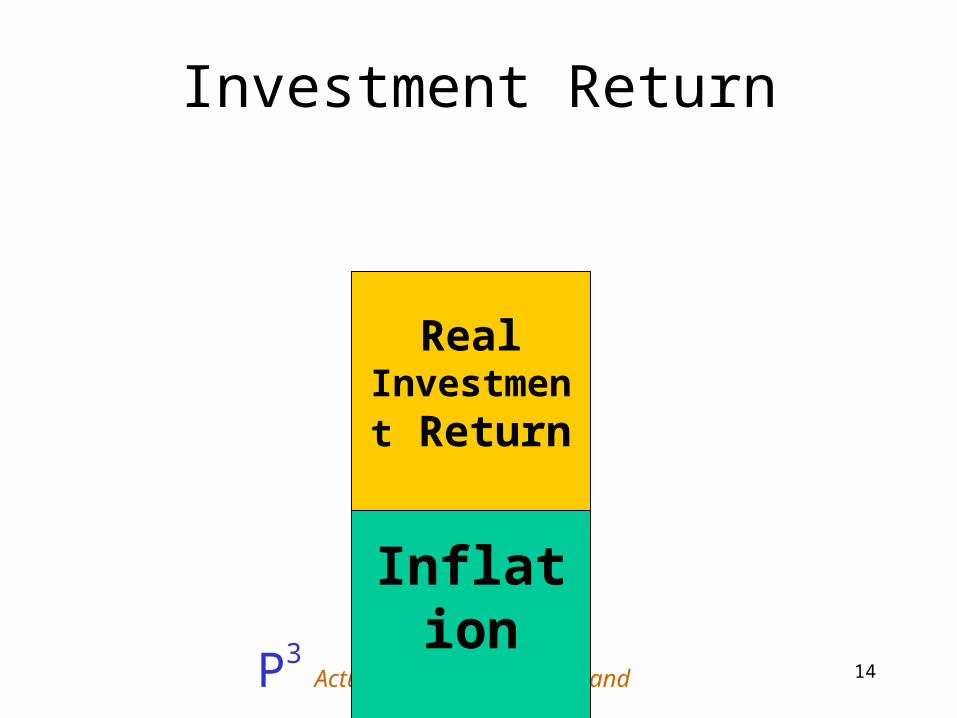
Investment Return
Inflation
Real Investment
Return
15P3 Actuaries you can
understand
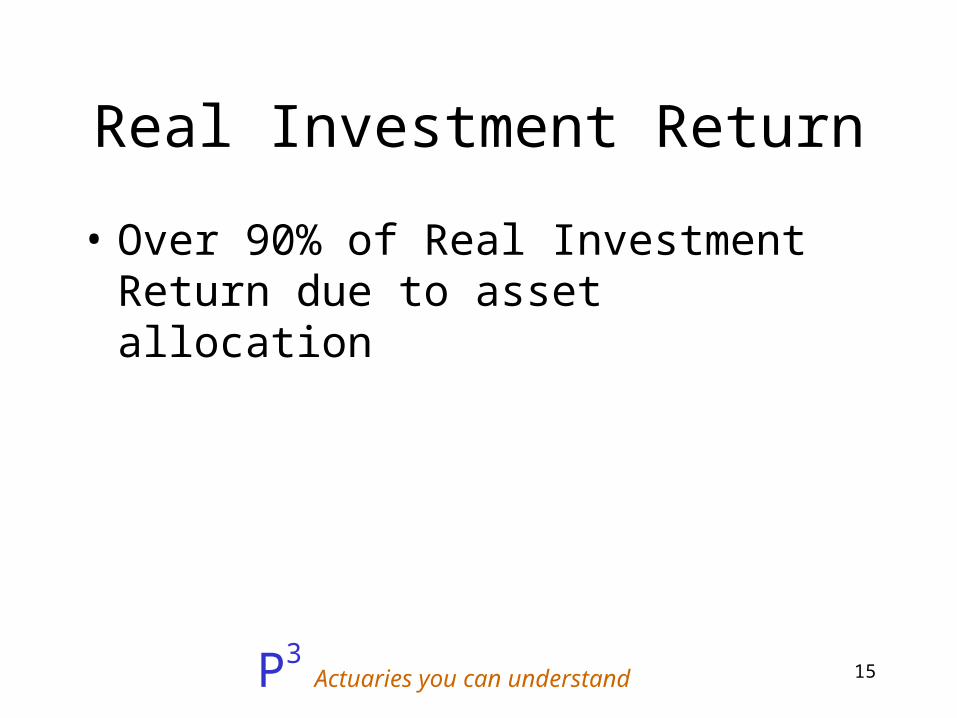
Real Investment Return
• Over 90% of Real Investment Return due to asset allocation
16P3 Actuaries you can
understand
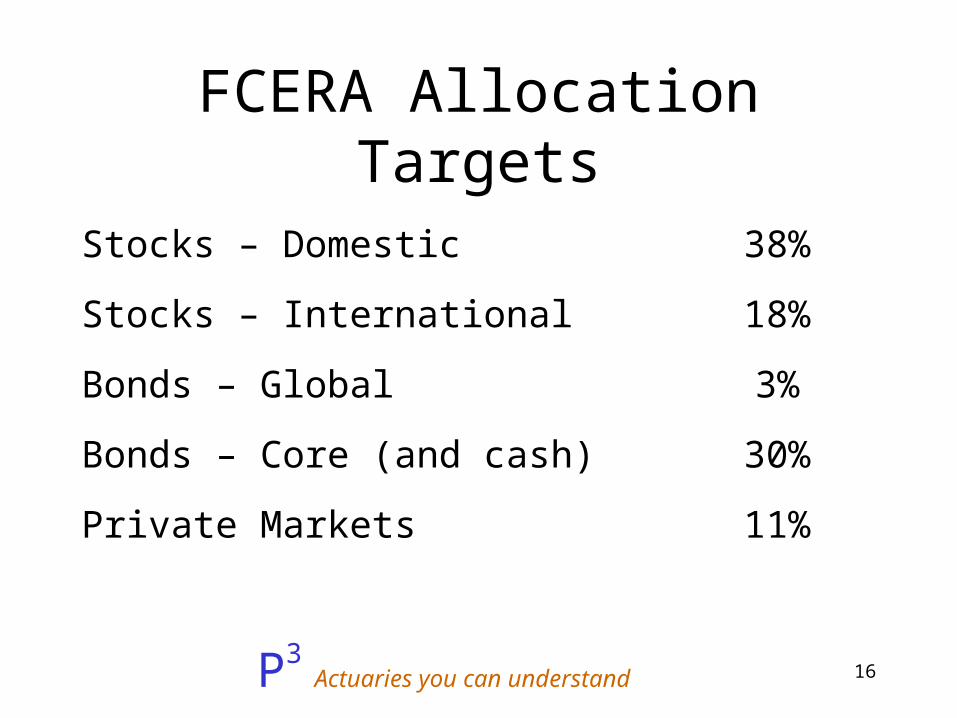
FCERA Allocation Targets
Stocks – Domestic 38%
Stocks – International 18%
Bonds – Global 3%
Bonds – Core (and cash) 30%
Private Markets 11%
17P3 Actuaries you can
understand
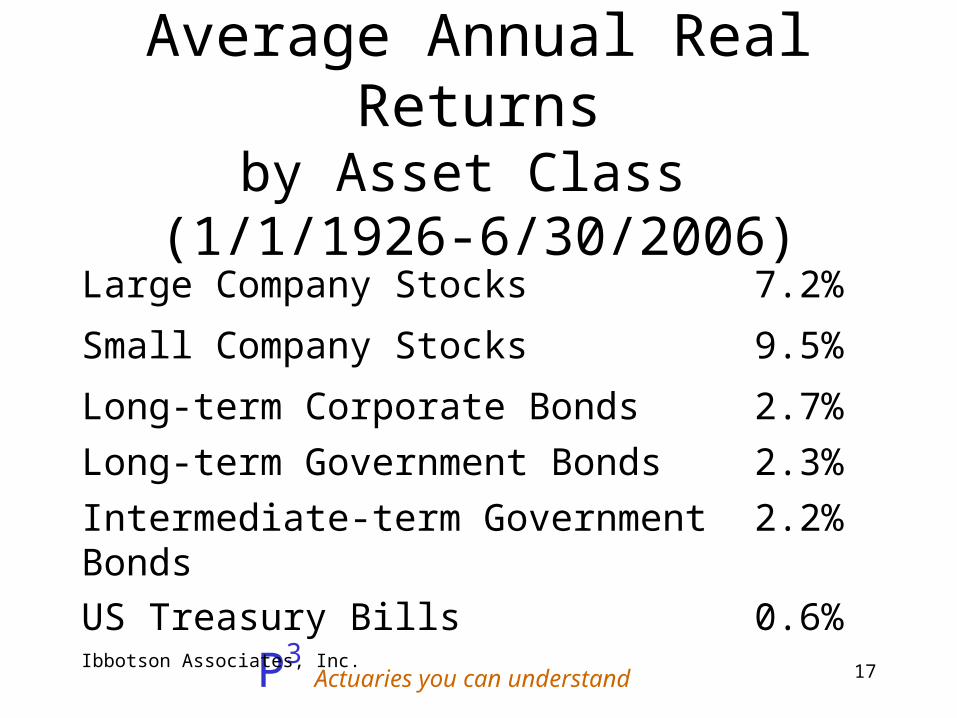
Average Annual Real Returnsby Asset Class
(1/1/1926-6/30/2006)
Large Company Stocks 7.2%
Small Company Stocks 9.5%
Long-term Corporate Bonds 2.7%
Long-term Government Bonds 2.3%
Intermediate-term Government Bonds 2.2%
US Treasury Bills 0.6%Ibbotson Associates, Inc.

18P3 Actuaries you can
understand
Real Investment Return in 37 Act Systems
1
3
1
3
4
3
4
1
0
3
6
3.25% 3.66% 3.75% 3.90% 4.00% 4.16% 4.25% 4.50%
Real Investment Return Assumption
Num
ber
of S
yste
ms

19P3 Actuaries you can
understand
Average Real Investment Assumption
3.90%
3.98%3.96%
3.80%3.81%3.82%
3.73%
3.50%
3.75%
4.00%
1999 2000 2001 2002 2003 2004 2005
20P3 Actuaries you can
understand
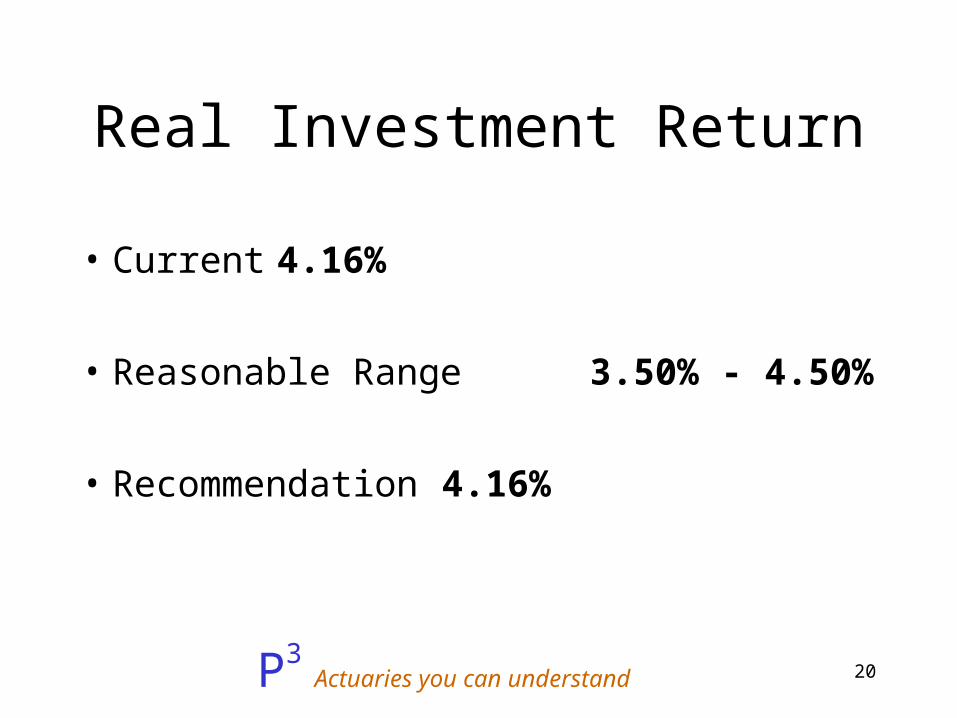
Real Investment Return
• Current 4.16%
• Reasonable Range 3.50% - 4.50%
• Recommendation 4.16%
21P3 Actuaries you can
understand
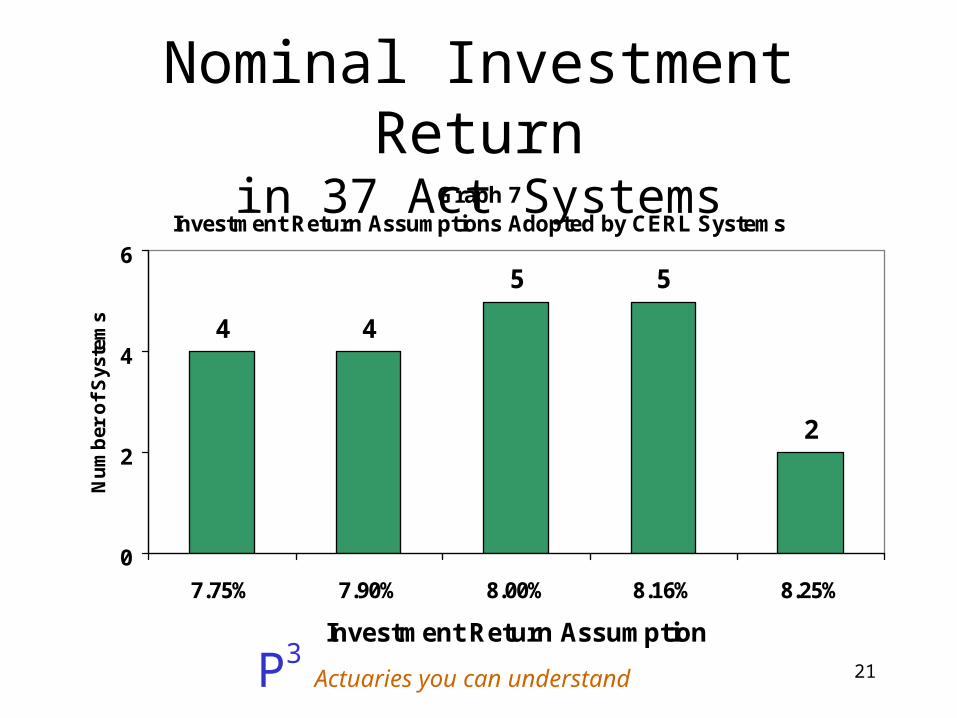
Nominal Investment Returnin 37 Act Systems
Graph 7Investment Return Assumptions Adopted by CERL Systems
4 4
5 5
2
0
2
4
6
7.75% 7.90% 8.00% 8.16% 8.25%
Investment Return Assumption
Nu
mb
er o
f S
yste
ms
22P3 Actuaries you can
understand
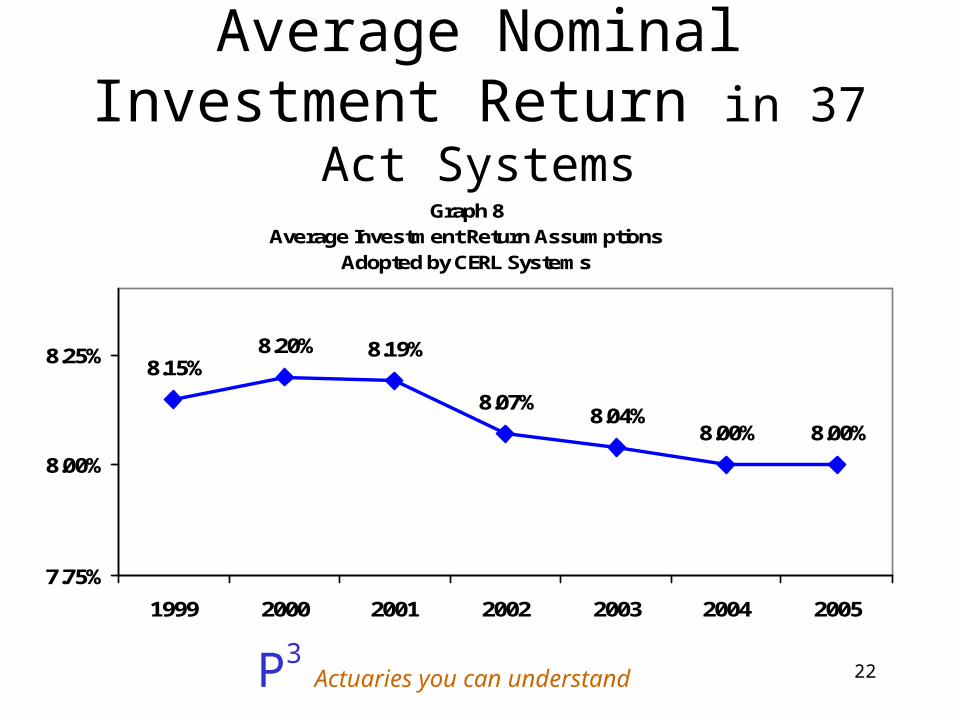
Average Nominal Investment Return in 37 Act Systems
Graph 8Average Investment Return Assumptions
Adopted by CERL Systems
8.15%8.20% 8.19%
8.07%8.04%
8.00% 8.00%
7.75%
8.00%
8.25%
1999 2000 2001 2002 2003 2004 2005
23P3 Actuaries you can
understand
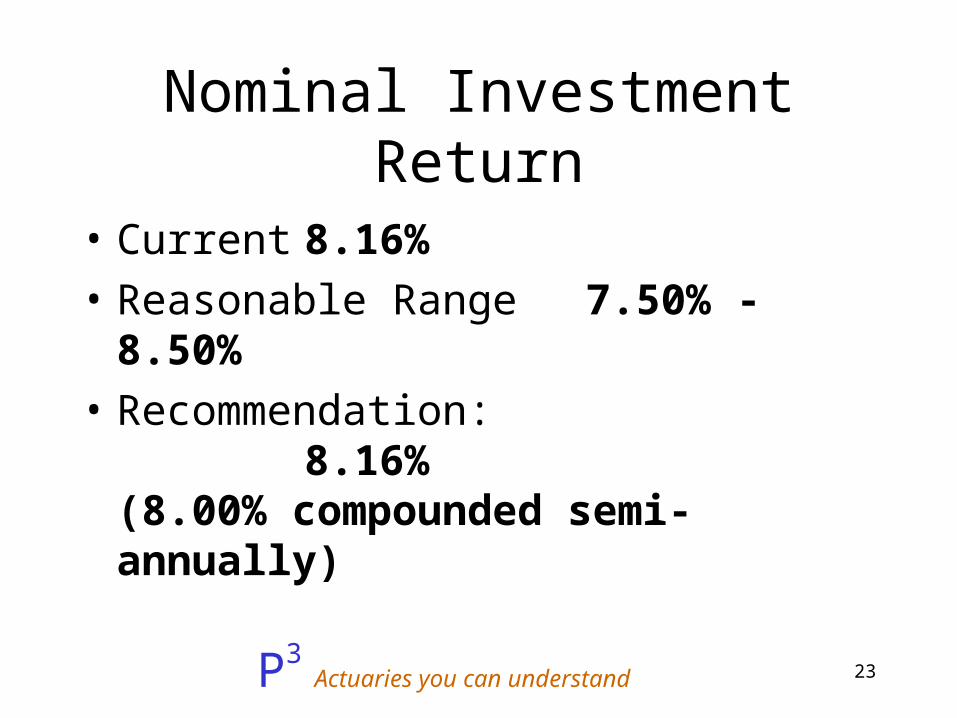
Nominal Investment Return
• Current8.16%
• Reasonable Range 7.50% - 8.50%
• Recommendation: 8.16%(8.00% compounded semi-annually)

24P3 Actuaries you can
understand
Questions