pa standards: 4.1.7.a – describe the relationships between the biotic and abiotic components of an...
TRANSCRIPT
PA Standards:4.1.7.A – Describe the relationships between the biotic and abiotic components of an ecosystem
Describe symbiotic and predator/prey relationships
73. Chapter 1 – Populations & CommunitiesEcosystem – All living and nonliving things that interact in a particular area
Living things include bacteria, plants, and animals
Nonliving things include sunlight, chemicals, soil, water, air, and man-made items

Ecosystem ExampleWhat is living?
What is nonliving?
Name the interactions.

74. A single ecosystem may contain many “habitats” Habitat – where an organism lives and finds
what it needs to survive
Example: A pond ecosystem includes several habitats – the muddy bottom, the water, the bank, etc.

75. Parts of an Ecosystem:Biotic Factors – name given to
all the LIVING parts; the interaction is often “eat or be eaten”!
Abiotic Factors – name given to all the NONLIVING parts; these supply the conditions for survival (shelter, oxygen, water, climate, etc.)

76. Organisms are grouped by “species”Species – all those organisms that
are physically similar (look alike) and can reproduce fertile offspring

Not all animals that can mate are the same species! Ex: horse + donkey
The offspring is a mule that can’t reproduce (infertile).
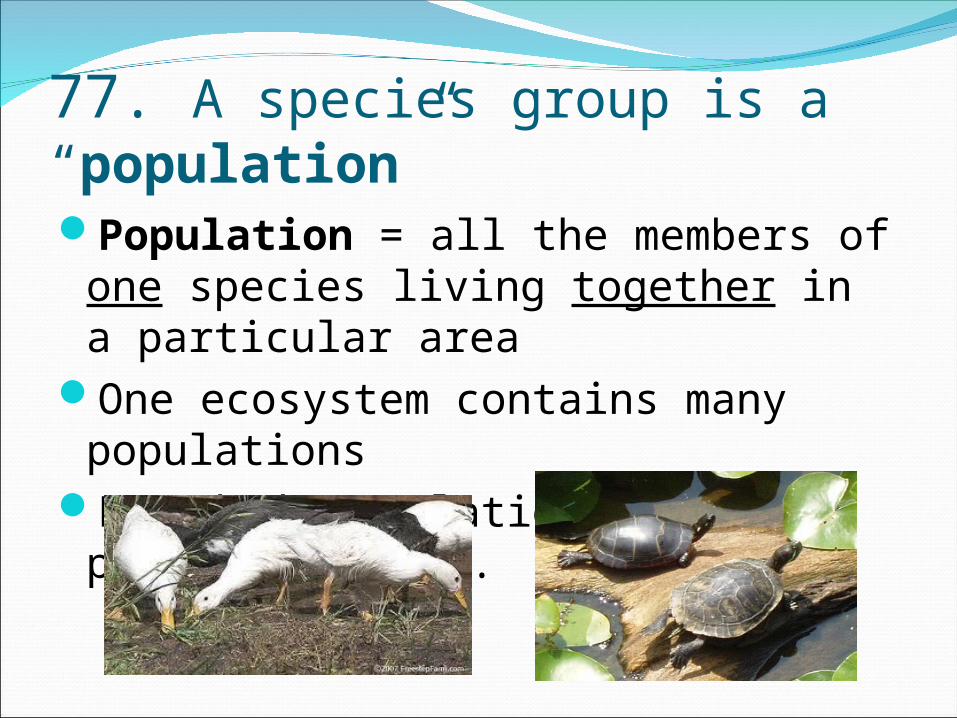
77. A species group is a “population” Population = all the members of
one species living together in a particular area
One ecosystem contains many populations
Ex: duck population, turtle population, etc.

78. A group of populations is a “community”Community = all the different populations
that live together in an area

79. In a community living things affect one another & their surroundings
Ecology – the study of how living things interact with each other and the environment; this work is carried out by an “ecologist”
American folk singer Pete Seeger recorded this song about environmental interactions
http://www.youtube.com/watch?v=UyGYXjyrvhY

80. “Population Density” is the number of individuals found in a specific area (or how tightly packed)
It is calculated by dividing:
# of individuals Area they inhabit
Example: The population density of this classroom might have been designed to be 1 student per meter2

81. Ways to Find Total Population Size
1) Counting: a. by direct observation (seeing the animals with your own eyes) b. by indirect observation (seeing only the animals’ tracks or nests)
2) Sampling: count only the animals in a small area, then estimate the rest
3) Mark & Recapture: captured animals are marked, then released; when a new sample is captured, the fraction of those w/marks can be used to calculate total population

Example of Sampling:Bacteria are grown on the surface of agar (kind
of gelatin) in petri dishes; these microscopic cells form colonies that show up as small spots on the agar. Often too numerous to count, the scientist will count only a sample of colonies(maybe ¼ the dish) and estimate the rest.
40 colonies x 4 =160 on the wholedish

Example of Mark & Recapture:You use nets to catch 100 blue birds.You put metal bands on the legs of all 100
and release them.One month later you use nets again to catch
blue birds. In this new group you find that ½ already have bands on their legs.
This indicates that in the original group of 100 birds, you really only caught ½ of the population in your nets.
Total population is then actually 200 birds.

82. What can Change Population Size?
1) Births: When birth rate > death rate, population increases
2) Deaths: When death rate > birth rate, population decreases
3) Immigration: individuals move in
4) Emigration: individuals move out

83. What Controls Population Size?Limiting factors are environmental
conditions that can stop population growth.These include: food, space, and weather.Carrying capacity is the largest population
that an environment can support given its limiting factors.
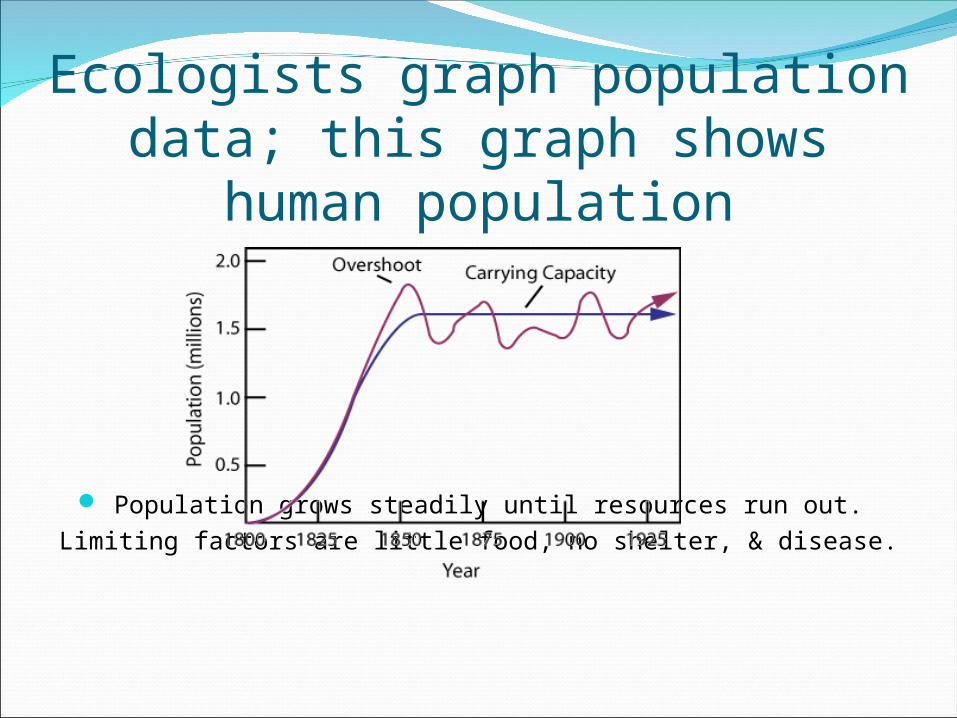
Ecologists graph population data; this graph shows human population
Population grows steadily until resources run out.Limiting factors are little food, no shelter, & disease.