pacheco union elementary school district 2017/18 … union elementary school district 2017/18...
TRANSCRIPT

Pacheco Union Elementary School District2017/18 Adopted Budget Documents
1. Power Point Presentation
2. Narrative - General Fund
3. Narrative - Other Funds
4. MYP and Subsequent Year Adjustment Detail
5. Reserve Report
6. Enrollment and Staffing Projection
7. 2016/17 General Fund Projected Cashflow
8. 2017/18 General Fund Projected Cashflow
9. LCFF Summary
10. Budget Summary Analysis, 2017/18 Adopted
11. SACS Reports
CS 5/31/2017 PUESD Adopted Budget Document List

1
1
Pacheco UnionElementary SchoolDistrict
2017/18 Adopted Budget and Projections
June 13, 2017
2
Assumptions
Local Control Funding Formula Gap Funding at the following percentages as recommended by School Services of California for the May Revised Budget: 2017/18 - 43.97% 2018/19 - 39.03% 2019/20 - 41.51%
No one-time discretionary funding; uncertainty due to May Revised projected payment in May 2019
Ongoing mandated block grant funding estimated at $16,252
Negotiations pending for all bargaining units LCFF guidelines for K-3 CSR; district at 24:1 K-3 student
to teacher ratio for current and subsequent years

2
3
More Assumptions Board-approved program reductions as of 2017/18. Special Ed program – 3 combined SDC/RSP teachers, 2
additional 6-hour behavioral intervention aides. CDS Contract expense estimated at $32,500. Special Ed students served by NPS, Great Partnership, and
SCOE based on prior year levels. One TK class at Prairie in 2017/18 and future years Step increases estimated at 1.7% for certificated and 1.9% for
classified employees. SCOE Business Contract as currently configured. Nursing Contract with RSA for two days of service per week. Psychologist at 0.6 FTE K-2 STEM grant concluded as of 2016/17 Title I and II funding reduced 22%
4
Transportation – Emissions Requirements
The district currently has three buses that meet the state’s emissions requirements.
Only two of these buses, however, are large enough to meet the needs of the district’s three regular routes.
The state has established a deadline of January 1, 2018 for emissions compliance for 100% of school buses that run more than 1,000 miles per year.
To meet this requirement, the district will need to acquire one additional full-sized bus.
The district’s application to the North Coast Unified Air Quality Management District for funding was waitlisted; no funds likely available from this source.
The current budget projects the purchase of a new bus in 2017/18, paid for in five annual installments of $35,000.

3
55
Enrollment and ADA Estimates
October Enrollment Estimates (including county office) 2017/18 – 628 2018/19 – 631 2019/20 – 632
District ADA Estimates (including NPS and County Office) 2017/18 – 596.70 2018/19 – 599.53 2019/20 – 600.48
District’s LCFF funding for 17/18 is based on prior year P2 ADA of 598.74.
Unduplicated Student Enrollment Percentage projected at 57.6%
66
Staffing Estimates
Projected Certificated Staff, with approved reductions 2017/18 2017/18 – 33.8 2018/19 – 33.8 2019/20 – 33.8
Projected Classified FTE, with approved reductions 2017/18: 2017/18 – 29.1 2018/19 – 29.1 2019/20 – 29.1
6.0 FTE Administrative, classified management and confidential FTE

4
7
2017/18 Adopted Budget MYP General Fund
2017/18 2018/19 2019/20
BEGINNING BALANCE 1,437,493 1,567,690 1,683,150
TOTAL REVENUES 6,431,481 6,386,478 6,511,319
TOTAL EXPENDITURES 6,301,284 6,271,018 6,390,749
NET CHANGE IN FUND BALANCE 130,197 115,460 120,570
ENDING BALANCE 1,567,690 1,683,150 1,803,720
Unrestricted Reserve as % of Expenditures 19.95% 21.89% 23.36%
8
2017/18 Adopted Budget, Unrestricted and Restricted
2017/18 Budget
Unrestricted Restricted Total
BEGINNING BALANCE 1,216,546 220,947 1,437,493
TOTAL REVENUES, TRANSFERS IN 5,139,393 1,292,088 6,431,481
TOTAL EXPENSES, TRSFRS OUT 5,023,806 1,277,478 6,301,284
NET CHANGE IN FUND BALANCE 115,587 14,610 130,197
ENDING BALANCE 1,332,133 235,557 1,567,690
Components of Fund Balance AmountCash/Stores/Prepaids 75,036 Board Assigned Funds 1,004,997
Restricted Funds 235,557 Economic Uncertainties - 4% 252,100
Total 1,567,690

5
9
Ending Balances, Board Assigned and Restricted
Components of Restricted Fund Balance Amount
Medi-Cal Billing 14,154
Prop 39 Clean Energy 144,479
Restricted Lottery - Instructional Materials 76,924
Total 235,557
Board Assignments Amount
Donations 10,101
Transportation Equipment 150,000
Facility Repairs and Upgrades 200,000
Non-Facility Capital Equipment 100,000
Special Education Contingency 50,000
Staff and Program Retention 494,896
Total 1,004,997
10
Cumulative Impact of STRS and PERS Rate Increases
Fiscal Year STRS Rate PERS RateEstimated Cost
of Increase
Cumulative Cost of
Increase
2014-15 8.88% 11.77% 17,004 17,004
2015-16 10.73% 11.85% 42,711 59,715
2016-17 12.58% 13.88% 58,655 118,370
2017-18 14.43% 15.53% 55,425 173,795
2018-19 16.28% 18.10% 62,939 236,734
2019-20 18.13% 20.80% 64,001 300,735
2020-21 19.10% 23.80% 46,412 347,147

6
11
Final Notes These projections have incorporated the
reductions for 2017/18 recently outlined and approved by the district board.
As indicated, the reductions addressed the deficits previously projected.
Due to continued ADA growth and a more generous May Revise, the district now anticipates some surplus ongoing revenue
The district will have some decisions to make in the coming year; it will also need to follow events closely in case unexpected changes impact district revenues or expenditures.

Pacheco USD 2017/18 Adopted Budget Narrative, Page 1 of 5
PACHECO UNION ELEMENTARY SCHOOL DISTRICT 2017-2018 PROPOSED BUDGET RECOMMENDED FOR BOARD
ADOPTION JUNE 13, 2017
Introduction School districts are required to adopt their budget for the 2017/18 school year by June 30, 2018. In the General Fund SACS Form 01, the 2016/17 Estimated Actuals represents the most current budget projections for the current year. The 2017/18 Budget reflects revenues and expenses anticipated for the upcoming school year based on the May Revised Budget and current estimates of district revenues and expenses. The last column on Form 01 shows the percentage change between 2016/17 and 2017/18. ESTIMATED ACTUALS The Estimated Actuals for 2016/17 reflects updated information after Second Interim. The following adjustments were made to the 16/17 budget: Total Changes in Revenue + $ 44,492 Total Changes in Expenditures + $ 39,509 The revenue changes primarily reflect adjustments to LCFF and Special Ed funding based on the district’s 2016/17 P2 ADA The expenditure increase primarily reflects adjustments related to early retirement incentive agreements subsequent to Second Interim. 2017/18 ASSUMPTIONS - MAY REVISED BUDGET The Governor’s May Revised Budget adjusted the LCFF Gap Funding percentages from those in the January budget. The May percentages as recommended by School Services of California are as follows:
2017/18: 43.97% 2018/19: 39.03% 2019/20: 41.51% The May Revised Budget also included one-time discretionary funding, but payment of such is not projected until May 2019. Because of the length of time until scheduled payment, School Services has recommended that districts not include it in their 2017/18 budgets.

Pacheco USD 17/18 Adopted Budget Narrative, Page 2 of 5
The STRS contribution rate increases are projected as scheduled. For 2017/18, the employer rate will be 14.43%. The 2016/17 PERS rate will be 15.531%. STAFFING ASSUMPTIONS Staffing assumptions for the projection include the following for certificated employees, including hourly employees and personnel contracted from other agencies:
2017/18: 33.8 FTE 2018/19: 33.8 FTE 2019/20: 33.8 FTE The subsequent staffing assumptions are based on projected enrollments increases and the programs that have been outlined in the district’s Local Control Accountability Plan and anticipated in the currently projected classroom configurations. It is assumed that the district will maintain an average class size for grades K-3 no greater than 24:1. CSEA 2016/17 FTE is expected to be 29.1 FTE. ENROLLMENT AND ADA ASSUMPTIONS Enrollment for 2017/18 has been projected to be 628 students, including students in county facilities, which is 11 more than the October 2016 CBEDS enrollment. The projected enrollments for subsequent years are as follows:
2018/19: 631 2019/20: 632 The district reported 642 students at Pacheco and Prairie Schools in May 2017; the above projections assume only one transitional kindergarten class instead of the current two classes. ADA is estimated for these years at a historical average of 94.5% of enrollment. Funded ADA, including county office and NPS, is expected to be as follows: 2017/18: 598.74 (based on prior year) 2018/19: 599.53 2019/20: 600.48 OTHER ASSUMPTIONS Other assumptions in the 2017/18 Adopted Budget include the following:
1. Title I and II funding reduced by 22% based on anticipated federal budget cuts.

Pacheco USD 17/18 Adopted Budget Narrative, Page 3 of 5
2. All expenditure reductions implemented as previously approved by the district board.
3. Certificated administration at 3.0 FTE, including Superintendent/Principal, Principal, and Vice-Principal.
4. No Forest Reserve funding; MAA reimbursements projected only upon actual receipt.
5. Negotiations pending for 2017/18 for all bargaining units. 6. Step increases of approximately 1.7% for certificated employees and 1.9%
for classified employees for subsequent years of the projection. 7. No expenditures for Prop. 39 program funds pending future district plans. 8. No major adopted instructional material adoptions pending future district
plans. 9. SCOE Business Services Contract as currently agreed by the district.
MULTI-YEAR PROJECTION AND CASH FLOW The district’s multi-year projection shows surpluses in all years of the projection. The projected changes to ending balances are as follows: 2016/17: $ 130,197 ($115,587 unrestricted) 2017/18: $ 115,460 (unrestricted) 2018/19: $ 120,570 (unrestricted) The district’s cash flow projections for 2016/17 and 2017/18 show sufficient cash for all months. COMPARISON OF BUDGET YEAR TO ESTIMATED ACTUALS
GENERAL FUND
Summary of Revenue & Expenses Total Changes in Revenues from 16/17 to 17/18 -$ 392,311 Total Change in Expenses and Transfers Out from 16/17 to 17/18 -$ 575,400 REVENUE
LOCAL CONTROL FUNDING FORMULA The 17/18 Adopted LCFF Income is projected to be $5,249,028; the prior year income is $5,098,668. This is an increase of $150,360, due primarily to the increase in LCFF Gap funding.

Pacheco USD 17/18 Adopted Budget Narrative, Page 4 of 5
FEDERAL REVENUE The Federal Revenue projection for 17/18 is $283,734, $542,751 less than the prior year. This difference is due primarily to the conclusion of the K-2 STEM Curiosity Grant and the anticipated 22% reduction in Title I and Title II funding.
STATE REVENUE State Revenue is projected to be $212,038 in 17/18, which is $121,758 less than the estimate for the prior year. This decrease is due to elimination of one-time discretionary funds.
LOCAL REVENUE
Local Revenue is projected to be $536,681 in 17/18, which is $28,162 less than the prior year. This decrease is primarily due to elimination of one-time receipts in 2016/17, including inter-district reimbursements of professional development expenses.
OTHER SOURCES Other Sources are projected to be $150,000 in 17/18. This pertains to an anticpated purchase of a new bus in 2017/18 to comply with state emission requirements; the amount represents an offset to account for the total cost of the bus, which is currently projected to be funded via lease payments over a five-year period. EXPENDITURES
CERTIFICATED SALARIES Certificated salaries are projected to be $2,350,996 in 17/18, which is a decrease of $213,842 from the prior year. This decrease primarily reflects the program reductions as approved by the district board, adjustments to the special ed program, and savings from certificated retirements in 2016/17.
CLASSIFIED SALARIES Classified salaries are projected to be $1,039,064 in 17/18, which is $17,271 more than the prior year. This increase is primarily due to the projected addition of two six-hour behavioral instructional aides in 2017/18 based on the anticipated needs of the special ed program, offset partially by the reductions in other programs as approved by the board.
EMPLOYEE BENEFITS Employee benefits are projected to be $1,121,093 which is $9,955 more than the prior year. This mostly reflects the increases in the STRS and PERS rates, offsetting the certificated personnel reductions as noted above.
BOOKS AND SUPPLIES

Pacheco USD 17/18 Adopted Budget Narrative, Page 5 of 5
Books and supplies are projected to be $252,422 in 17/18, which is $22,173 less than the prior year. This decrease is partially due to board-approved reductions and some one-time expenses for adopted instructional materials.
CONTRACTED SERVICES AND OTHER OPERATING EXPENSES Services and other operating expenses are projected to be $1,227,353 in 17/18, which is $539,599 less than the prior year. $459,251 of this amount pertains to the conclusion of the K-2 STEM Curiosity grant, and $30,000 pertains to board-approved program reductions. The remaining decrease primarily reflects one-time professional development expenses expended through the Educator Effectiveness Grant.
CAPITAL EXPENDITURES $150,000 in capital expenditures have been projected to account for the new bus purchase as described above.
OTHER OUTGO Other outgo is projected to be $50,000 which is $35,000 more than the prior year. This represents the projected annual lease payment for the new bus noted above.
DIRECT SUPPORT/INDIRECT COSTS
No direct support/indirect program support costs are projected for 17/18.
TRANSFERS OUT Transfers out are projected to be $10,356, which is $12,012 less than 2016/17. This pertains to the general fund’s projected contributions to the cafeteria fund; one-time equipment purchases contributed to the increased cafeteria fund transfer in 2016/17. ENDING BALANCE The projected 2017/18 ending balance includes the following: Revolving Cash $ 1,600 Prepaid Expenditures $ 73,436 Restricted Reserve $ 235,557 4% Economic Uncertainties $ 252,100 Board Assigned $1,004,997
Unassignated $ 0 Total $1,332,133

Pacheco USD 17/18 Adopted Budget Other Funds Narrative, Page 1 of 2
PACHECO UNION ELEMENTARY SCHOOL DISTRICT 2017-2018 ADOPTED BUDGET
JUNE 13, 2017
ALL OTHER FUNDS 6113 CAFETERIA FUND This fund is used for collecting and recording the various income sources in the cafeteria program such as state and federal reimbursement and local meal charges. All cafeteria-related salaries and benefits and other expenses are paid directly from this fund. The beginning balance is projected at $5,464. The Proposed Budget projects a contribution of $10,356 from the General Fund for equipment replacement and cafeteria custodial expense over $10,000 (as specified in the EESD contract). The estimated ending balance is $5,464, which represents the projected stores inventory balance of $3,464 plus an additional reserve of $2,000. The current operational structure for the Pacheco Cafeteria, with management services contracted with the Enterprise Elementary School District, is expected to continue in 2017/18. 6121 BUILDING FUND This fund is used to record receipts and expenditures of the district’s GO Bond Project Fund. The projected beginning balance of this fund is $68,048. Budgeted expenses included for 17/18 are $3,500 for performance audit services and $66,048 for construction expense on the upcoming Pacheco fencing project. Interest income is estimated at $1,500. No projected ending balance is projected. 6125 CAPITAL FACILITIES FUND This fund is used primarily to account separately for funds received from fees levied on the developers or other agencies as a condition of approving a development. It is required that districts collecting developer fees deposit them in a Capital Facilities Fund. The district’s share of redevelopment agency revenues is also kept in this fund. The beginning balance includes $258,816 in RDA funds, $403,976 in collected developer fees, and $171,142 in additional funds set aside for the COP obligation. In 2017/18 $17,395 in facility consulting expenses and other fees are projected. Additional expenses to contribute to the Pacheco fencing project are likely but not yet projected pending final project approvals. $29,600 in RDA revenues are also projected, along with $500 in interest revenues. The ending balances for this fund are projected to be $288,416 in RDA funds, $387,081 in developer fee proceeds, and $171,142 in additional COP escrow designated funds. 6135 COUNTY SCHOOLS FACILITY FUND This fund is used to record receipts and expenditures of certain state facility funds and their corresponding expenditures. $14,616 in residual funds from the district’s new construction project grants are projected in the beginning balance. $80 in interest is projected, and the ending balance is projected to be $14,686

Unrestricted Restricted Total Unrestricted Restricted Total Unrestricted Restricted Total
REVENUESLCFF 8010 - 8099 5,249,028 0 5,249,028 5,354,025 0 5,354,025 5,478,866 0 5,478,866Federal Revenues 8100 - 8299 0 283,734 283,734 0 283,734 283,734 0 283,734 283,734Other State Revenues 8300 - 8599 100,352 111,686 212,038 100,352 111,686 212,038 100,352 111,686 212,038Other Local Revenues 8600 - 8799 193,223 343,458 536,681 193,223 343,458 536,681 193,223 343,458 536,681Other Sources and Uses 8930 - 8979 150,000 0 150,000 0 0 0 0 0 0Contributions 8980 - 8999 (553,210) 553,210 0 (544,812) 544,812 0 (551,122) 551,122 0TOTAL REVENUES 5,139,393 1,292,088 6,431,481 5,102,788 1,283,690 6,386,478 5,221,319 1,290,000 6,511,319
EXPENDITURESCertificated Salaries 1000 - 1999 1,995,845 355,151 2,350,996 2,023,535 360,037 2,383,572 2,051,225 364,923 2,416,148Classified Salaries 2000 - 2999 845,503 193,561 1,039,064 857,498 193,834 1,051,332 869,493 194,107 1,063,600Employee Benefits 3000 - 3999 949,115 271,977 1,221,092 1,020,952 273,030 1,293,982 1,094,688 274,181 1,368,869
Subtotal Salaries & Benefits 3,790,463 820,689 4,611,152 3,901,985 826,901 4,728,886 4,015,406 833,211 4,848,617Books and Supplies 4000 - 4999 193,492 58,930 252,422 193,492 58,930 252,422 193,492 58,930 252,422Services, Other Operating Expenses 5000 - 5999 859,985 367,369 1,227,354 861,985 367,369 1,229,354 861,985 367,369 1,229,354Capital Outlay 6000 - 6599 150,000 0 150,000 0 0 0 0 0 0Other Outgo, LTD 7100, 7400 50,000 0 50,000 50,000 0 50,000 50,000 0 50,000Direct Support / Indirect Costs 7300 - 7399 (30,490) 30,490 0 (30,490) 30,490 0 (30,490) 30,490 0Interfund Transfers Out 7610-7614,7616-7619 10,356 0 10,356 10,356 0 10,356 10,356 0 10,356TOTAL EXPENDITURES 5,023,806 1,277,478 6,301,284 4,987,328 1,283,690 6,271,018 5,100,749 1,290,000 6,390,749
NET INCREASE/DECREASE IN FUND BALANCE 115,587 14,610 130,197 115,460 0 115,460 120,570 0 120,570
BEGINNING BALANCE 1,216,546 220,947 1,437,493 1,332,133 235,557 1,567,690 1,447,593 235,557 1,683,150ENDING BALANCE 1,332,133 235,557 1,567,690 1,447,593 235,557 1,683,150 1,568,164 235,557 1,803,721
Components of Ending Fund Balance NonSpendable-Rev Cash/Prepaids/Stores 75,036 75,036 75,036 75,036 75,036 75,036Legally Restricted 235,557 235,557 235,557 235,557 235,557 235,557Assigned-Economic Uncertainty 252,100 252,100 250,941 250,941 255,730 255,730Other Assignments 1,004,997 1,004,997 1,121,617 1,121,617 1,237,398 1,237,398Unassigned/Unappropriated - 0 - 0 - 0Total 1,332,133 235,557 1,567,690 1,447,593 235,557 1,683,150 1,568,164 235,557 1,803,721
Estimated Funded ADA (incl NPS, County Office) 598.74 599.53 600.48
Estimated P-2 Actual ADA (incl NPS, County Ofc) 596.7 599.53 600.48
Estimated CBEDS Enrollment (including county office) 628 631 632Ratio CBEDS to Actual P-2 ADA 95% 95% 95%
Unrestricted Balance as % of Expend 19.95% 21.89% 23.36%
Pacheco Union Elementary School DistrictMULTI-YEAR PROJECTION
2017/18 Adopted Budget
2019/20 PROJECTION2018/19 PROJECTION2017/18 Adopted Budget
61 MYP 17-18 Adopted Page 1 5/31/2017

Pacheco Union Elementary School DistrictEstimated Revenue Detail2017/18 Adopted Budget
Object Description Unrest Rest Unrest Rest Unrest Rest
80xx Revenue Limit (LCFF) 5,249,028 5,354,025 5,478,866
8181 Federal Spec Ed 111,379 111,379 111,379 8260 Forest Reserve - 8290 MAA - 8290 Title I 114,899 114,899 114,899 8290 Federal Title II A 23,578 23,578 23,578 8290 STEM Grant - - - 8290 Medi-Cal LEA Billing 5,000 5,000 5,000 8290 Federal REAP 28,878 28,878 28,878
Total Federal - 283,734 - 283,734 - 283,734 8550 Mandated Costs (one-time funds) - 8550 Mandated Block Grant 16,252 16,252 16,252 8560 Unrestricted Lottery 84,100 84,100 84,100 8560 Restricted Lottery 24,500 24,500 24,500 8590 STRS on Behalf 87,186 87,186 87,186 8590 Educator Effectiveness - 8590 Prop 39 - Energy Efficiency -
Total State 100,352 111,686 100,352 111,686 100,352 111,686
8660 Interest 6,500 6,500 0 6,500 08677 Interagency Revenue - Curiosity Grant - - - - - 8677 Interagency Revenue - Cascade Psych 20,914 20,914 20,914 8677 Interagency Revenue - CKH - 8677 Literacy Grant - - - 8677 Special Ed Interdistrict 5,000 - 5,000 - 5,000 8677 TCDE Sub Reimb - - - - - 8677 SCOE State Presch Maint Contr 5,299 5,299 - 5,299 - 8699 Donations 5,478 5,478 - 5,478 - 8699 Parent Club 8,125 8,125 - 8,125 - 8699 Misc 3,907 3,907 - 3,907 - 8699 Rotary Music Grant - - 8699 Preschool 85,000 85,000 - 85,000 - 8699 Daycare 55,000 55,000 - 55,000 - 8650 Rent 3,000 3,000 - 3,000 - 8792 NPS, Excel Reimb 66,500 - 66,500 - 66,500 8792 Spec Ed AB602 funds 271,958 - 271,958 - 271,958
Total Local 193,223 343,458 193,223 343,458 193,223 343,458
Total Income 5,542,603 738,878 5,647,600 738,878 5,772,441 738,878
2018-19 2019-202017-18

Pacheco Union Elementary School DistrictEstimated Expenditure Changes2017/18 Adopted Budget
2018/19 Changes Unrestricted Restricted Total
Certificated SalariesStep and Column and Sal Sched Adj 1.72% 27,690 4,886 32,576
00
Subtotal 27,690 4,886 32,576
Classified SalariesEstimated CSEA Step & Column 1.91% 11,995 273 12,268
00
Subtotal 11,995 273 12,268
Employee Benefits
Step Increases, Cert 5,537 977 6,514Step Increases, Classified 3,361 76 3,437
STRS rate increase 42,095 42,095PERS rate increase 20,844 20,844
0Subtotal 71,837 1,053 72,890
Books & Supplies000
Subtotal 0 0 0
Services & Other Operating Exp's00
Adjust Business Svc Contract 2,000 2,000Add additional Supp/Conc 0 0Less Educator Effectiveness One-Time 0
Subtotal 2,000 0 2,000
Capital Outlay
Eliminate Bus Purchase (150,000) (150,000)
Subtotal (150,000) 0 (150,000)
Other Outgo, LTD
000
Subtotal 0 0 0
Transfers Out0
One-Time Cafeteria Repairs 0
Subtotal 0 0 0

Pacheco Union Elementary School DistrictEstimated Expenditure Changes2017/18 Adopted Budget
2019/20 Changes Unrestricted Restricted Total
Certificated SalariesStep and Column and Sal Sched Adj 1.72% 27,690 4,886 32,576
000
Subtotal 27,690 4,886 32,576
Classified SalariesEstimated CSEA Step & Column 1.91% 11,995 273 12,268
000
Subtotal 11,995 273 12,268
Employee BenefitsStep Increases, Cert 6,050 1,067 7,117Step Increases, Classified 3,685 84 3,769STRS rate increase 42,095 42,095PERS rate increase 21,907 21,907
0
Subtotal 73,736 1,151 74,887
Books & Supplies0
0 00
Subtotal 0 0 0
Services & Other Operating Exp's0
Additional Supp/Conc Grant per LCFF 0 0Adjust Business Svc Contract 0
Subtotal 0 0 0
Capital Outlay0
0 0 0
Subtotal 0 0 0
Other Outgo, LTD
000
Subtotal 0 0 0Transfers Out
00
Subtotal 0 0 0

Retirement rate increases
STRS Rate Increase
Creditable Certificated Salaries 2,275,392$
Annual Increased GF Cost
Cumm Increase from 8.25%
Current Rate 8.25%Proposed Rates 2014-15 8.88% 14,335$ 14,335$
2015-16 10.73% 42,095$ 56,430$ 2016-17 12.58% 42,095$ 98,524$ 2017-18 14.43% 42,095$ 140,619$ 2018-19 16.28% 42,095$ 182,714$ 2019-20 18.13% 42,095$ 224,809$ 2020-21 19.10% 22,071$ 246,880$
PERS Rate Increase
Creditable Classified Salaries 811,358$
Annual Increased GF Cost
Cumm Increase from 13-14 rate
Current Rate 11.44%Proposed Rates 2014-15 11.77% 2,669$ 2,669$
2015-16 11.847% 617$ 3,286$ 2016-17 13.89% 16,560$ 19,846$ 2017-18 15.53% 13,331$ 33,176$ 2018-19 18.10% 20,844$ 54,020$ 2019-20 20.80% 21,907$ 75,927$ 2020-21 23.80% 24,341$ 100,268$
Combined Rate Increase Impact
Rate Increase
from Current Rates
Annual Increased GF Cost
Cumm Increase from 13-14 rate
2014-15 0.96% 17,004$ 17,004$ 2015-16 2.89% 42,711$ 59,716$ 2016-17 6.78% 58,655$ 118,370$ 2017-18 10.27% 55,425$ 173,796$ 2018-19 14.69% 62,939$ 236,734$ 2019-20 19.24% 64,001$ 300,736$ 2020-21 23.21% 46,412$ 347,148$

Pacheco USD 17/18 Adopted Budget Other Funds Narrative, Page 2 of 2
6140 SPECIAL RESERVE FUND This fund was established to keep a separate account for major purchases of equipment or building/site repairs. The beginning balance in this fund is $4,052, interest income estimated at $50, leaving an ending balance of $4,102. 6151 BOND INTEREST AND REDEMPTION FUND This fund is used to record tax receipts and debt service expenditures for the district’s GO Bond obligation. Though the revenues and expenditures are recorded in the district’s financial statements, the debt service obligation will be funded entirely with tax receipts and will not encroach on the district’s other funds. The beginning balance of this fund is projected to be $283,369. Debt service expenses of $261,925 and revenues of $258,367 are projected for 17/18, leaving an ending balance of $279,811.

District: Pacheco Union Elementary
CDS #: 45‐70094 2017/18 Adopted Budget
Balances Above Minimum Reserve Requirements
Combined Assigned and Unassigned/unappropriated Fund Balances
Objects 9780/9789/9790
Form Fund 2017‐18 2018‐19 2019‐20
01 General Fund $1,257,097.00 $1,372,258.00 $1,493,128.00
17 Special Reserve Fund for Other Than Capital Outlay Projects $0.00 $0.00 $0.00
Total Assigned and Unassigned Ending Fund Balances $1,257,097.00 $1,372,258.00 $1,493,128.00
District Standard Reserve Level 4% 4% 4%
Less District Minimum Reserve for Economic Uncertainties $252,100.00 $250,941.00 $255,730.00
Remaining Balance to Substantiate Need $1,004,997.00 $1,121,317.00 $1,237,398.00
Reasons for Fund Balances Above the Minimum Reserve for Economic Uncertainties
Form Fund Description of Need 2017‐18 2018‐19 2019‐20
01 General Fund Transportation Equipment $150,000.00 $150,000.00 $150,000.00
01 General Fund Facility Repairs and Upgrades $200,000.00 $200,000.00 $200,000.00
01 General Fund Donated Funds for Specific Purposes $10,101.00 $10,101.00 $10,101.00
01 General Fund Non‐Facility Capital Equipment $100,000.00 $100,000.00 $100,000.00
01 General Fund Special Education Contingency $50,000.00 $50,000.00 $50,000.00
01 General Fund Staff and Program Retention Contingency Fund $494,896.00 $611,216.00 $727,297.00
Insert Lines above as needed
Total of Substantiated Needs $1,004,997.00 $1,121,317.00 $1,237,398.00
Remaining Unsubstantiated Balance $0.00 $0.00 $0.00
Reasons for Assigned and Unassigned Ending Fund Balances Above the Minimum Recommended Reserves
for economic uncertainties for each fiscal year identified in the budget.
EC 42127 (a)(2)(B) public review and discussion at its public budget hearing.
Education Code Section 42127 (d)(1) requires a county superintendent to either conditionally
approve or disapprove a school district budget if the district does not provide for
Education Code Section 42127(a)(2)(B) requires a statement of the reasons that substantiates the need for
assigned and unassigned ending fund balances above the minimum reserve standard

Projected
Enrollment
2016/17 FTE
Avg
Class
Size
Projected
Enrollment
2017/18 FTE
Avg
Class
Size
Projected
Enrollment
2018/19 FTE
Avg
Class
Size
Projected
Enrollment
2019/20 FTE
Avg
Class
Size
TK/K 102 5.00 20.40 82 4.00 20.50 82 4.00 20.50 82 4.00 20.50
1 66 3.00 22.00 66 3.00 22.00 66 3.00 22.00 66 3.00 22.00
2 65 3.00 21.67 66 3.00 22.00 66 3.00 22.00 66 3.00 22.00
3 76 3.00 25.33 65 3.00 21.67 66 3.00 22.00 66 3.00 22.00
4 86 3.00 28.67 76 3.00 25.33 65 2.00 32.50 66 2.00 33.00
5 65 2.00 32.50 84 3.00 28.00 74 3.00 24.67 63 2.00 31.50
6 60 2.00 30.00 62 2.00 31.00 81 3.00 27.00 71 3.00 23.67
7 56 2.00 28.00 58 2.00 29.00 60 2.00 30.00 79 3.00 26.33
8 58 2.00 29.00 55 1.80 30.56 57 1.80 31.67 59 1.80 32.78
Speech 1.00 1.00 1.00 1.00
SDC 11 2.00
Literacy 1.0 Prairie 1.00 1.00 1.00 1.00
RSP 2.00
SDC/RSP 11 3.00 11 3.00 11 3.00
Intervention ‐ 5th Grade 0.37 0.37 0.37 0.37
ELL Supplemental Instruction ‐ Prairie 0.33 0.33 0.33 0.33
GATE PSA Hourly 0.73 PSA Hourly 0.40 PSA Hourly 0.40 PSA Hourly 0.40
Art/Music 0.60 Contract 1.10 0.60 Contract 1.10 0.60 Contract 1.10 0.60 Contract 1.10
PE 1.00 1.00 1.00 1.00
Counselor 0.60 ‐ ‐ ‐
Psych (0.4 Pa, 0.4 Cas) 0.80 0.80 0.80 0.80
Total 645 35.93 625 33.80 628 33.80 629 33.80
P2 ADA ‐ Estimate 584.4 590.625 593.46 594.405
P2 ADA % of CBEDS Enrollment 94.50% 94.50% 94.50% 94.50%
CSEA Staffing FTE 29.7 27.6 27.6 27.6
K‐3 Average 22.07 K‐3 Average 21.46 K‐3 Average 21.54 K‐3 Average 21.54
4‐8 Average 29.55 4‐8 Average 28.39 4‐8 Average 28.56 4‐8 Average 28.64
Total average K‐8 25.36 Total average K‐8 24.76 Total average K‐8 24.88 Total average K‐8 24.92
2019/20
Pacheco UESD
Enrollment & Staffing Projection
For Pacheco USD 17/18 Adopted2018/192016/17 2017/18
5/31/2017 PUSD Enrollment Staffing Projection 1718 Adopted

Object Budget July August September October November December January February
January
A. BEGINNING CASH 9110 974,793 1,153,362 930,036 703,007 696,546 464,747 1,660,106 1,595,228
B. RECEIPTS
Revenue Limit Sources
Principal Apportionment 8010-8019 2,079,480 102,275 102,275 184,095 184,095 184,095 184,095 184,095 227,876
Property Taxes 8020-8079 2,327,866 50,621 105,065 15,097 3,583 7,082 1,210,993 76,978 1,502
EPA 8012 692,275 0 0 177,570 0 0 177,571 0 0
Miscellaneous Funds 8080-8099 (953) 0 0 0 0 0 0 (560) 0
Federal Revenue 8100-8299 826,485 120,509 0 40,341 (23,110) 8,342 16,982 (675) 96,890
Other State Revenue 8300-8599 333,796 0 0 0 3,124 16,128 59,778 73,903 0
Other Local Revenue 8600-8799 564,843 11,069 11,172 20,132 45,787 67,206 38,270 84,979 52,437
Interfund Transfers In 8910-8929 0 0 0 0 0 0 0 0
All Other Financing Sources 8930-8979 0 0 0 0 0 0 0 0
0 0 0 0 0 0 0 0TOTAL RECEIPTS 6,823,792 284,474 218,511 437,235 213,479 282,853 1,687,689 418,720 378,705
C. DISBURSEMENTS
Certificated Salaries 1000-1999 2,564,838 26,851 201,630 240,880 225,877 250,291 220,166 196,164 230,258
Classified Salaries 2000-2999 1,021,793 29,578 81,437 97,046 86,530 85,857 86,823 84,652 87,363
Employee Benefits 3000-3999 1,211,138 27,541 95,935 107,123 90,290 94,125 91,645 94,059 95,496
Books, Supplies and Services 4000-5999 2,041,547 93,590 145,831 206,311 104,192 196,050 124,464 106,014 101,181
Capital Outlay 6000-6999 0 0 0 0 0 0 0 0 0
Other Outgo 7000-7499 15,000 0 0 0 0 0 0 5,000 0
Interfund Transfers Out 7600-7629 22,368 0 0 0 0 0 0 0 0
All Other Financing Uses 7630-7699 0 0 0 0 0 0 0 0
0 0 0 0 0 0 0 0TOTAL DISBURSEMENTS 6,876,684 177,560 524,832 651,361 506,889 626,322 523,098 485,889 514,298
D. PRIOR YEAR TRANSACTIONS Beg BalanceAssets
Cash Not in Treasury 9111-9199 3,886 0 0 0 0 0 0 0 0Accts Receivable 9200-9299 625,730 44,714 120,696 1,866 286,918 111,658 30,743 4,675 15,899Due From Other Funds 9310 20,000 0 0 0 0 0 0 20,000 0Stores Inventory 9320 0 0 0 0 0 0 0 0 0Prepaid Exp. 9330 81,970 81,970 0 0 0 0 0 0 0Other Assets 9340 0 0 0 0 0 0 0 0
Total Assets 731,586 126,684 120,696 1,866 286,918 111,658 30,743 24,675 15,899
Accounts Payable 9500-9599 (208,098) (54,520) (37,701) (14,770) 31 12 25 (14,995) (44,650)Due to Other Funds 9610 (7,387) 0 0 0 0 0 0 (7,387) 0Current Loans 9640 0 0 0 0 0 0 0 0Deferred Revenues 9650 (509) (509) 0 0 0 0 0 0 0
Total Liabilities (215,995) (55,029) (37,701) (14,770) 31 12 25 (22,383) (44,650)
515,591 71,655 82,995 (12,904) 286,949 111,670 30,768 2,292 (28,751)
E.178,569 (223,326) (227,029) (6,461) (231,799) 1,195,358 (64,877) (164,345)
F. ENDING CASH (A + E) 1,153,362 930,036 703,007 696,546 464,747 1,660,106 1,595,228 1,430,883
G. ENDING FUND BALANCE
Pacheco Union ElementaryCashflow Worksheet
2016/17 Estimated Actuals
NET INCREASE/DECREASE (B - C + D)
ACTUALS THROUGH THE MONTH OF (Enter Month Name):
Other Receipts/Non-Revenue
Other Disbursements/ Non Expenditures
Liabilities
TOTAL PRIOR YEAR TRANSACTIONS

Object
January
A. BEGINNING CASH 9110
B. RECEIPTS
Revenue Limit Sources
Principal Apportionment 8010-8019
Property Taxes 8020-8079
EPA 8012
Miscellaneous Funds 8080-8099
Federal Revenue 8100-8299
Other State Revenue 8300-8599
Other Local Revenue 8600-8799
Interfund Transfers In 8910-8929
All Other Financing Sources 8930-8979
TOTAL RECEIPTS
C. DISBURSEMENTS
Certificated Salaries 1000-1999
Classified Salaries 2000-2999
Employee Benefits 3000-3999
Books, Supplies and Services 4000-5999
Capital Outlay 6000-6999
Other Outgo 7000-7499
Interfund Transfers Out 7600-7629
All Other Financing Uses 7630-7699
TOTAL DISBURSEMENTS
D. PRIOR YEAR TRANSACTIONSAssets
Cash Not in Treasury 9111-9199Accts Receivable 9200-9299Due From Other Funds 9310Stores Inventory 9320Prepaid Exp. 9330Other Assets 9340
Total Assets
Accounts Payable 9500-9599Due to Other Funds 9610Current Loans 9640Deferred Revenues 9650
Total Liabilities
E.
F. ENDING CASH (A + E)
G. ENDING FUND BALANCE
Pacheco Union ElementaryCashflow Worksheet
2016/17 Estimated Actuals
NET INCREASE/DECREASE (B - C + D)
ACTUALS THROUGH THE MONTH OF (Enter Month Name):
Other Receipts/Non-Revenue
Other Disbursements/ Non Expenditures
Liabilities
TOTAL PRIOR YEAR TRANSACTIONS
March April May JuneAccruals /
Adjustments TOTAL
1,430,883 1,212,571 1,807,640 1,508,459
157,914 192,467 187,153 126,534 62,511 2,079,480
2,278 887,537 (46,269) 13,399 0 2,327,866
222,291 0 0 114,843 0 692,275
0 2 (730) 335 0 (953)
47,910 0 28,887 146,045 344,363 826,485
2,682 17,978 0 100,308 59,895 333,796
18,077 52,575 40,151 48,026 74,963 564,843
0 0 0 0 0 0
0 0 0 0 0 0
0 0 0 0 0 0451,152 1,150,558 209,193 549,490 541,732 6,823,792
229,489 245,056 229,479 268,696 0 2,564,838
90,314 85,768 97,110 109,315 0 1,021,793
101,051 94,892 84,167 234,815 0 1,211,138
213,503 84,243 97,203 348,965 220,000 2,041,547
0 0 0 0 0 0
0 0 0 0 10,000 15,000
0 0 0 0 22,368 22,368
0 0 0 0 0 0
0 0 0 0 0 0634,358 509,958 507,958 961,791 252,368 6,876,684
0 0 0 0 3,886 3,8860 0 0 8,561 0 625,7300 0 0 0 0 20,0000 0 0 0 0 00 0 (0) 0 0 81,9700 0 0 0 0 00 0 (0) 8,561 3,886 731,586
(35,107) (45,532) (415) 39,523 0 (208,098)0 0 0 0 0 (7,387)0 0 0 0 0 00 0 0 0 0 (509)
(35,107) (45,532) (415) 39,523 0 (215,995)
(35,107) (45,532) (415) 48,084 3,887 515,591
(218,312) 595,068 (299,181) (364,217) 293,251 462,699
1,212,571 1,807,640 1,508,459 1,144,242
1,437,492

Object Budget July August September October November December January February
A. BEGINNING CASH 9110 1,144,242 1,220,275 1,038,731 857,556 867,022 693,043 1,928,486 1,878,164
B. RECEIPTS
Revenue Limit Sources
Principal Apportionment 8010-8019 2,229,840 111,492 111,492 200,686 200,686 200,686 200,686 200,686 200,686
Property Taxes 8020-8079 2,362,423 51,372 106,624 15,321 3,636 7,187 1,228,970 78,121 1,525
EPA 8012 656,765 0 0 164,191 0 0 164,191 0 0
Miscellaneous Funds 8080-8099 0 0 0 0 0 0 0 0 0
Federal Revenue 8100-8299 283,734 70,921 0 23,741 (13,600) 4,910 9,994 (397) 57,021
Other State Revenue 8300-8599 212,038 0 0 0 2,418 12,485 46,277 57,211 0
Other Local Revenue 8600-8799 536,681 12,126 12,239 22,055 50,162 73,627 41,927 93,097 57,446
Interfund Transfers In 8910-8929 0 0 0 0 0 0 0 0
All Other Financing Sources 8930-8979 150,000 0 0 0 0 0 150,000 0 0
0 0 0 0 0 0 0 0TOTAL RECEIPTS 6,431,481 245,912 230,355 425,995 243,302 298,895 1,842,044 428,718 316,678
C. DISBURSEMENTS
Certificated Salaries 1000-1999 2,350,996 24,613 184,819 220,797 207,045 229,423 201,810 179,809 211,060
Classified Salaries 2000-2999 1,039,064 30,078 82,813 98,686 87,993 87,308 88,291 86,083 88,840
Employee Benefits 3000-3999 1,221,093 27,768 96,724 108,004 91,032 94,898 92,398 94,832 96,281
Books, Supplies and Services 4000-5999 1,479,775 76,030 118,469 167,602 84,643 159,265 101,111 86,123 82,197
Capital Outlay 6000-6999 150,000 0 0 0 0 0 150,000 0 0
Other Outgo 7000-7499 50,000 0 0 0 15,000 0 0 0 0
Interfund Transfers Out 7600-7629 10,356 0 0 0 0 0 0 0 0
All Other Financing Uses 7630-7699 0 0 0 0 0 0 0 0
0 0 0 0 0 0 0 0TOTAL DISBURSEMENTS 6,301,284 158,488 482,825 595,089 485,712 570,895 633,610 446,847 478,378
D. PRIOR YEAR TRANSACTIONS Beg BalanceAssets
Cash Not in Treasury 9111-9199 3,886 0 0 0 0 0 0 0 0Accts Receivable 9200-9299 541,732 39,249 105,943 1,638 251,848 98,010 26,985 4,104 13,956Due From Other Funds 9310 0 0 0 0 0 0 0 0 0Stores Inventory 9320 0 0 0 0 0 0 0 0Prepaid Exp. 9330 0 0 0 0 0 0 0 0 0Other Assets 9340 0 0 0 0 0 0 0 0
Total Assets 545,618 39,249 105,943 1,638 251,848 98,010 26,985 4,104 13,956
Accounts Payable 9500-9599 (230,000) (50,640) (35,018) (13,718) 28 11 23 (13,928) (41,473)Due to Other Funds 9610 (22,368) 0 0 0 0 0 0 (22,368) 0Current Loans 9640 0 0 0 0 0 0 0 0Deferred Revenues 9650 0 0 0 0 0 0 0 0
Total Liabilities (252,368) (50,640) (35,018) (13,718) 28 11 23 (36,296) (41,473)
293,250 (11,391) 70,925 (12,081) 251,877 98,021 27,008 (32,192) (27,517)
E.76,032 (181,544) (181,175) 9,466 (173,979) 1,235,443 (50,322) (189,217)
F. ENDING CASH (A + E) 1,220,275 1,038,731 857,556 867,022 693,043 1,928,486 1,878,164 1,688,947
G. ENDING FUND BALANCE
Pacheco Union ElementaryCashflow Worksheet
2017/18 Adopted Budget
NET INCREASE/DECREASE (B - C + D)
ACTUALS THROUGH THE MONTH OF (Enter Month Name):
Other Receipts/Non-Revenue
Other Disbursements/ Non Expenditures
Liabilities
TOTAL PRIOR YEAR TRANSACTIONS

Object
A. BEGINNING CASH 9110
B. RECEIPTS
Revenue Limit Sources
Principal Apportionment 8010-8019
Property Taxes 8020-8079
EPA 8012
Miscellaneous Funds 8080-8099
Federal Revenue 8100-8299
Other State Revenue 8300-8599
Other Local Revenue 8600-8799
Interfund Transfers In 8910-8929
All Other Financing Sources 8930-8979
TOTAL RECEIPTS
C. DISBURSEMENTS
Certificated Salaries 1000-1999
Classified Salaries 2000-2999
Employee Benefits 3000-3999
Books, Supplies and Services 4000-5999
Capital Outlay 6000-6999
Other Outgo 7000-7499
Interfund Transfers Out 7600-7629
All Other Financing Uses 7630-7699
TOTAL DISBURSEMENTS
D. PRIOR YEAR TRANSACTIONSAssets
Cash Not in Treasury 9111-9199Accts Receivable 9200-9299Due From Other Funds 9310Stores Inventory 9320Prepaid Exp. 9330Other Assets 9340
Total Assets
Accounts Payable 9500-9599Due to Other Funds 9610Current Loans 9640Deferred Revenues 9650
Total Liabilities
E.
F. ENDING CASH (A + E)
G. ENDING FUND BALANCE
Pacheco Union ElementaryCashflow Worksheet
2017/18 Adopted Budget
NET INCREASE/DECREASE (B - C + D)
ACTUALS THROUGH THE MONTH OF (Enter Month Name):
Other Receipts/Non-Revenue
Other Disbursements/ Non Expenditures
Liabilities
TOTAL PRIOR YEAR TRANSACTIONS
March April May JuneAccruals /
Adjustments TOTAL
1,688,947 1,496,081 2,150,752 1,892,163
200,686 200,686 200,686 135,684 64,998 2,229,840
2,312 900,712 (46,955) 13,598 0 2,362,423
164,191 0 0 164,191 0 656,765
0 0 0 0 0 0
28,195 0 17,000 54,104 31,845 283,734
2,076 13,918 0 21,963 55,690 212,038
19,804 57,597 43,987 (6,182) 58,796 536,681
0 0 0 0 0 0
0 0 0 0 0 150,000
0 0 0 0 0 0417,265 1,172,913 214,718 383,358 211,329 6,431,481
210,355 224,624 210,346 246,294 0 2,350,996
91,841 87,218 98,751 111,163 0 1,039,064
101,881 95,672 84,859 236,745 0 1,221,093
173,444 68,436 78,965 43,490 240,000 1,479,775
0 0 0 0 0 150,000
0 0 0 35,000 0 50,000
0 0 0 0 10,356 10,356
0 0 0 0 0 0
0 0 0 0 0 0577,522 475,950 472,921 672,691 250,356 6,301,284
0 0 0 0 3,886 3,8860 0 0 0 0 541,7320 0 0 0 0 00 0 0 0 0 00 0 0 0 0 00 0 0 0 0 00 0 0 0 3,886 545,618
(32,609) (42,292) (385) 0 0 (230,000)0 0 0 0 0 (22,368)0 0 0 0 0 00 0 0 0 0 0
(32,609) (42,292) (385) 0 0 (252,368)
(32,609) (42,292) (385) 0 3,886 293,250
(192,866) 654,671 (258,589) (289,333) (35,141) 423,447
1,496,081 2,150,752 1,892,163 1,602,830
1,567,689

TargetFloorApplied Formula: Target or FloorRemaining Need after Gap (informational only)
Current Year Gap FundingMiscellaneous AdjustmentsEconomic Recovery TargetAdditional State AidTotal Phase-In Entitlement
8011 - State Aid8011 - Fair Share 8311 & 8590 - CategoricalsEPA (for LCFF Calculation purposes)
Local Revenue Sources: 8021 to 8089 - Property Taxes 8096 - In-Lieu of Property TaxesProperty Taxes net of in-lieuTOTAL FUNDING
Basid Aid Status
Less: Excess Taxes
Less: EPA in Excess to LCFF Funding
Total Phase-In Entitlement8012 - EPA Receipts (for budget & cashflow)
Unduplicated Pupil Population Agency Unduplicated Pupil Count COE Unduplicated Pupil Count Total Unduplicated pupil Count Rolling %, Supplemental Grant Rolling %, Concentration Grant
FUNDED ADA Adjusted Base Grant ADA Grades TK-3 Grades 4-6 Grades 7-8 Grades 9-12 Total Adjusted Base Grant ADA
Necessary Small School ADA Grades TK-3 Grades 4-6 Grades 7-8 Grades 9-12 Total Necessary Small School ADATotal Funded ADA
ACTUAL ADA (Current Year Only) Grades TK-3 Grades 4-6 Grades 7-8 Grades 9-12Total Actual ADAFunded Difference (Funded ADA less Actual ADA)
Current year estimated supplemental and concen
Current year Minimum Proportionality Percentag
LCFF Calculator Universal Assumptions
Summary of Funding
2014‐15 2015‐16 2016‐17 2017‐18 2018‐19 2019‐20 2020‐21 2021‐22
4,955,211$ 5,123,842$ 5,336,922$ 5,416,795$ 5,509,616$ 5,643,894$ 5,784,214$ 5,784,903$
3,701,648 4,150,850 4,848,709 5,117,370 5,255,015 5,361,747 5,478,864 5,613,432
FLOOR FLOOR FLOOR FLOOR FLOOR FLOOR FLOOR FLOOR
875,486 461,611 219,549 167,768 155,230 165,028 170,782 171,471
378,077 511,381 268,664 131,657 99,371 117,119 134,568 ‐
‐ ‐ ‐ ‐ ‐ ‐ ‐ ‐
‐ ‐ ‐ ‐ ‐ ‐ ‐ ‐
‐ ‐ ‐ ‐ ‐ ‐ ‐ ‐
4,079,725$ 4,662,231$ 5,117,373$ 5,249,027$ 5,354,386$ 5,478,866$ 5,613,432$ 5,613,432$
TRUE TRUE TRUE
Components of LCFF By Object Code2014‐15 2015‐16 2016‐17 2017‐18 2018‐19 2019‐20 2020‐21 2021‐22
1,439,958$ 1,779,091$ 2,098,185$ 2,229,839$ 2,331,214$ 2,450,903$ 2,585,469$ 2,585,469$
‐ ‐ ‐ ‐ ‐ ‐ ‐ ‐
‐ ‐ ‐ ‐ ‐ ‐ ‐ ‐
755,774 699,255 692,275 656,765 624,301 629,092 629,092 629,092
1,883,993 2,184,403 2,327,866 2,362,423 2,398,871 2,398,871 2,398,871 2,398,871
‐ (518) (953) ‐ ‐ ‐ ‐ ‐
1,883,993 2,183,885 2,326,913 2,362,423 2,398,871 2,398,871 2,398,871 2,398,871
4,079,725$ 4,662,231$ 5,117,373$ 5,249,027$ 5,354,386$ 5,478,866$ 5,613,432$ 5,613,432$
Non‐Basic Aid Non‐Basic Aid Non‐Basic Aid Non‐Basic Aid Non‐Basic Aid Non‐Basic Aid Non‐Basic Aid Non‐Basic Aid
‐$ ‐$ ‐$ ‐$ ‐$ ‐$ ‐$ ‐$
‐$ ‐$ ‐$ ‐$ ‐$ ‐$ ‐$ ‐$
4,079,725$ 4,662,231$ 5,117,373$ 5,249,027$ 5,354,386$ 5,478,866$ 5,613,432$ 5,613,432$
754,939$ 737,436$ 657,722$ 656,765$ 624,301$ 629,092$ 629,092$ 629,092$
Summary of Student Population
2014‐15 2015‐16 2016‐17 2017‐18 2018‐19 2019‐20 2020‐21 2021‐22
331.00 354.00 356.00 361.00 363.00 364.00 364.00 364.00
2.00 4.00 2.00 1.00 1.00 1.00 1.00 1.00
333.00 358.00 358.00 362.00 364.00 365.00 365.00 365.00
58.0500% 58.4700% 58.2800% 58.3000% 57.7800% 57.6900% 57.7300% 57.7500%
58.0500% 58.4700% 58.2800% 58.3000% 57.7800% 57.6900% 57.7300% 57.7500%
Prior Year Current Year Current Year Prior Year Current Year Current Year Current Year Current Year
264.42 285.98 281.97 281.97 269.37 269.37 269.37 269.37
174.15 181.71 204.72 204.72 214.65 195.75 195.75 195.75
121.37 104.07 112.05 112.05 115.51 135.36 135.36 135.36
‐ ‐ ‐ ‐ ‐ ‐ ‐ ‐
559.94 571.76 598.74 598.74 599.53 600.48 600.48 600.48
Current year Current year Current year Current year Current year Current year Current year Current year
‐ ‐ ‐ ‐ ‐ ‐ ‐ ‐
‐ ‐ ‐ ‐ ‐ ‐ ‐ ‐
‐ ‐ ‐ ‐ ‐ ‐ ‐ ‐
‐ ‐ ‐ ‐ ‐ ‐ ‐ ‐
‐ ‐ ‐ ‐ ‐ ‐ ‐ ‐
559.94 571.76 598.74 598.74 599.53 600.48 600.48 600.48
273.76 285.98 281.97 268.43 269.37 269.37 269.37 269.37
176.72 181.71 204.72 216.54 214.65 195.75 195.75 195.75
108.35 104.07 112.05 111.73 115.51 135.36 135.36 135.36
‐ ‐ ‐ ‐ ‐ ‐ ‐ ‐
558.83 571.76 598.74 596.70 599.53 600.48 600.48 600.48
1.11 ‐ ‐ 2.04 ‐ ‐ ‐ ‐
2014‐15 2015‐16 2016‐17 2017‐18 2018‐19 2019‐20 2020‐21 2021‐22
193,352$ 396,282$ 511,328$ 502,575$ 552,211$ 579,394$ 603,869$ 603,869$
5.29% 9.82% 11.69% 11.13% 12.08% 12.41% 12.64% 12.64%
5/31/20175:56 PM SummaryLCFF Calculator v18.1a
released May 14, 2017

Budget Summary AnalysisBudget07a
Model OB18-01 1718 Adopted Budget Fiscal Year 2017/18
Pacheco UESD General Fund
$1,437,493 $2,407.86 Beginning Fund Balance
$1,567,690 $2,625.95
Fund Balance Difference
Ending Fund Balance
Nonspendable Assets
Stabilization Arrangements
Restricted
Reserve for Economic Uncertainties
Other Assignments
Other Committed
Other Assigned
Total Amount
Dollars
per ADA
75,036
0
235,557
252,100
1,004,997
0
$218.09 $130,197
- Total Uses
+ Total Resources
Ending Fund Balance Components Amount
$6,431,481 $10,773.00
$6,301,284 $10,554.91
0
4.79%
Nonspendable Assets
15.03%
Restricted
64.11%
Other Assignments
16.08%
Economic Uncertainties
Ending Fund Balance Components
Selection Group by Org, Fiscal Year, Budget Model, Filtered by (Organization = 61, Restricted? = Y, Fnd = 01), ADA = 597
Page 1 of 4
Generated for CHUCK STROM (CSTROM), May 31 2017 4:07PM061 - Pacheco Union Elementary School District

Budget Summary AnalysisBudget07a
Model OB18-01 1718 Adopted Budget Fiscal Year 2017/18
Pacheco UESD General Fund
Dollars
per ADA
5,249,028
283,734
212,038
536,681
$150,000
Total Revenue
LCFF Sources
Federal Revenue
Other State Revenue
Other Local Revenue
Transfer In & Others
Total Amount
$6,281,481
Total Resources $6,431,481
475.27
898.96
8,792.34
355.17
$251.26
$10,773.00
$10,521.74
Revenue by Object:
81.61%
LCFF Sources
4.41%
Federal Revenue
3.30%
State Revenue
8.34%
Local Revenue
2.33%
Transfer-In
Total Revenue Summary
(as % of Total Revenue)
Selection Group by Org, Fiscal Year, Budget Model, Filtered by (Organization = 61, Restricted? = Y, Fnd = 01), ADA = 597
Page 2 of 4
Generated for CHUCK STROM (CSTROM), May 31 2017 4:07PM061 - Pacheco Union Elementary School District

Budget Summary AnalysisBudget07a
Model OB18-01 1718 Adopted Budget Fiscal Year 2017/18
Pacheco UESD General Fund
32.94%
Certi ficated Non-Mgt.
16.05%
Classi fied Non-Mgt.
4.90%
Management Salaries
19.41%
Employee Benefi ts
4.01%
Books and Suppl ies
19.51%
Services and Operating
2.38%
Capital Outlay
0.79%
Other Outgo
Total Expenditure Summary
(as % of Total Expenditure)
Dollars
per ADA
Cert. Non-Mgt. Salaries
Class. Non-Mgt. Salaries
Management Salaries
Employee Benefits
Services and Operating
Total Amount
Total Uses
Transfer out and Other:
Total Expenditure
Capital Outlay
Other Outgo
2,072,283
1,009,618
308,159
1,221,093
252,422 Books and Supplies
1,227,353
150,000
$10,356
3,471.16
1,691.15
516.18
2,045.38
422.82
2,055.87
251.26
83.75
$17.35
$6,290,928 $10,537.57
$6,301,284 $10,554.91
50,000
Expenditure by Object:
Selection Group by Org, Fiscal Year, Budget Model, Filtered by (Organization = 61, Restricted? = Y, Fnd = 01), ADA = 597
Page 3 of 4
Generated for CHUCK STROM (CSTROM), May 31 2017 4:07PM061 - Pacheco Union Elementary School District

Budget Summary AnalysisBudget07a
Model OB18-01 1718 Adopted Budget Fiscal Year 2017/18
Pacheco UESD General Fund
Instruction
Instruction Related Services
Pupil Services
Ancillary Services
Enterprise
General Administration*
Plant Services
Community Services
Expenditure by Function:
Other Outgo
Board and Supt. Administration
Other General Administration
Centralized Data Processing
Total Amount
Dollars
per ADA
66.62
143.89
51.06
66.92
0.00
736.53
6,407.03
1,214.12
541.59
101.10
976.33
986.26
* General Administration Expenditure Breakdown:
Total $10,554.91
60.70%
Instruction
11.50%
Instruction Related
9.34%
Pupi l Services
0.63%
Anci l lary Services
0.63%
Community Services
6.98%
General Administration
9.25%
Plant Services
0.96%
Other Outgo
Total Expenditure by Function Summary(as % of Total Expenditure)
$6,301,284
3,824,995
724,829
588,797
39,775
39,953
0
439,708
582,871
60,356
85,901
323,327
30,480
Selection Group by Org, Fiscal Year, Budget Model, Filtered by (Organization = 61, Restricted? = Y, Fnd = 01), ADA = 597
Page 4 of 4
Generated for CHUCK STROM (CSTROM), May 31 2017 4:07PM061 - Pacheco Union Elementary School District

Pacheco Union ElementaryShasta County
July 1 BudgetTABLE OF CONTENTS 45 70094 0000000
Form TC
California Dept of EducationSACS Financial Reporting Software - 2017.1.0File: tc (Rev 03/03/2014) Page 1 of 2 Printed: 5/31/2017 6:05 PM
G = General Ledger Data; S = Supplemental Data
Data Supplied For:Form Description 2016-17
EstimatedActuals
2017-18Budget
01 General Fund/County School Service Fund GS GS09 Charter Schools Special Revenue Fund10 Special Education Pass-Through Fund11 Adult Education Fund12 Child Development Fund13 Cafeteria Special Revenue Fund G G14 Deferred Maintenance Fund15 Pupil Transportation Equipment Fund17 Special Reserve Fund for Other Than Capital Outlay Projects18 School Bus Emissions Reduction Fund19 Foundation Special Revenue Fund20 Special Reserve Fund for Postemployment Benefits21 Building Fund G G25 Capital Facilities Fund G G30 State School Building Lease-Purchase Fund35 County School Facilities Fund G G40 Special Reserve Fund for Capital Outlay Projects G G49 Capital Project Fund for Blended Component Units51 Bond Interest and Redemption Fund G G52 Debt Service Fund for Blended Component Units53 Tax Override Fund56 Debt Service Fund57 Foundation Permanent Fund61 Cafeteria Enterprise Fund62 Charter Schools Enterprise Fund63 Other Enterprise Fund66 Warehouse Revolving Fund67 Self-Insurance Fund71 Retiree Benefit Fund73 Foundation Private-Purpose Trust Fund76 Warrant/Pass-Through Fund95 Student Body Fund76A Changes in Assets and Liabilities (Warrant/Pass-Through)95A Changes in Assets and Liabilities (Student Body)A Average Daily Attendance S SASSET Schedule of Capital Assets SCASH Cashflow WorksheetCB Budget Certification SCC Workers' Compensation Certification SCEA Current Expense Formula/Minimum Classroom Comp. - Actuals GSCEB Current Expense Formula/Minimum Classroom Comp. - Budget GSCHG Change Order FormDEBT Schedule of Long-Term Liabilities SICR Indirect Cost Rate Worksheet GSL Lottery Report GSMYP Multiyear Projections - General Fund GS

Pacheco Union ElementaryShasta County
July 1 BudgetTABLE OF CONTENTS 45 70094 0000000
Form TC
California Dept of EducationSACS Financial Reporting Software - 2017.1.0File: tc (Rev 03/03/2014) Page 2 of 2 Printed: 5/31/2017 6:05 PM
G = General Ledger Data; S = Supplemental Data
Data Supplied For:Form Description 2016-17
EstimatedActuals
2017-18Budget
NCMOE No Child Left Behind Maintenance of Effort GSSEA Special Education Revenue AllocationsSEAS Special Education Revenue Allocations Setup (SELPA Selection)SIAA Summary of Interfund Activities - Actuals GSIAB Summary of Interfund Activities - Budget G01CS Criteria and Standards Review GS GS

Pacheco Union ElementaryShasta County
July 1 BudgetGeneral Fund
Unrestricted and RestrictedExpenditures by Object
45 70094 0000000Form 01
California Dept of EducationSACS Financial Reporting Software - 2017.1.0File: fund-a (Rev 04/10/2017) Page 1 Printed: 5/31/2017 6:06 PM
2016-17 Estimated Actuals 2017-18 Budget
Description Resource CodesObjectCodes
Unrestricted(A)
Restricted(B)
Total Fundcol. A + B
(C)Unrestricted
(D)Restricted
(E)
Total Fundcol. D + E
(F)
% DiffColumnC & F
A. REVENUES
1) LCFF Sources 8010-8099 5,098,668.00 0.00 5,098,668.00 5,249,028.00 0.00 5,249,028.00 2.9%
2) Federal Revenue 8100-8299 0.00 826,485.00 826,485.00 0.00 283,734.00 283,734.00 -65.7%
3) Other State Revenue 8300-8599 222,110.00 111,686.00 333,796.00 100,352.00 111,686.00 212,038.00 -36.5%
4) Other Local Revenue 8600-8799 223,223.00 341,620.00 564,843.00 193,223.00 343,458.00 536,681.00 -5.0%
5) TOTAL, REVENUES 5,544,001.00 1,279,791.00 6,823,792.00 5,542,603.00 738,878.00 6,281,481.00 -7.9%
B. EXPENDITURES
1) Certificated Salaries 1000-1999 2,105,955.00 458,883.00 2,564,838.00 1,995,845.00 355,151.00 2,350,996.00 -8.3%
2) Classified Salaries 2000-2999 877,792.00 144,001.00 1,021,793.00 845,503.00 193,561.00 1,039,064.00 1.7%
3) Employee Benefits 3000-3999 952,433.00 258,705.00 1,211,138.00 949,115.00 271,978.00 1,221,093.00 0.8%
4) Books and Supplies 4000-4999 215,665.00 58,930.00 274,595.00 193,492.00 58,930.00 252,422.00 -8.1%
5) Services and Other Operating Expenditures 5000-5999 902,843.00 864,109.00 1,766,952.00 859,985.00 367,368.00 1,227,353.00 -30.5%
6) Capital Outlay 6000-6999 0.00 0.00 0.00 150,000.00 0.00 150,000.00 New
7) Other Outgo (excluding Transfers of Indirect 7100-7299 Costs) 7400-7499 15,000.00 0.00 15,000.00 50,000.00 0.00 50,000.00 233.3%
8) Other Outgo - Transfers of Indirect Costs 7300-7399 (38,190.00) 38,190.00 0.00 (30,490.00) 30,490.00 0.00 0.0%
9) TOTAL, EXPENDITURES 5,031,498.00 1,822,818.00 6,854,316.00 5,013,450.00 1,277,478.00 6,290,928.00 -8.2%
C. EXCESS (DEFICIENCY) OF REVENUES OVER EXPENDITURES BEFORE OTHER FINANCING SOURCES AND USES (A5 - B9) 512,503.00 (543,027.00) (30,524.00) 529,153.00 (538,600.00) (9,447.00) -69.1%
D. OTHER FINANCING SOURCES/USES 1) Interfund Transfers a) Transfers In 8900-8929 0.00 0.00 0.00 0.00 0.00 0.00 0.0%
b) Transfers Out 7600-7629 22,368.00 0.00 22,368.00 10,356.00 0.00 10,356.00 -53.7%
2) Other Sources/Uses a) Sources 8930-8979 0.00 0.00 0.00 150,000.00 0.00 150,000.00 New
b) Uses 7630-7699 0.00 0.00 0.00 0.00 0.00 0.00 0.0%
3) Contributions 8980-8999 (520,706.00) 520,706.00 0.00 (553,210.00) 553,210.00 0.00 0.0%
4) TOTAL, OTHER FINANCING SOURCES/USES (543,074.00) 520,706.00 (22,368.00) (413,566.00) 553,210.00 139,644.00 -724.3%

Pacheco Union ElementaryShasta County
July 1 BudgetGeneral Fund
Unrestricted and RestrictedExpenditures by Object
45 70094 0000000Form 01
California Dept of EducationSACS Financial Reporting Software - 2017.1.0File: fund-a (Rev 04/10/2017) Page 2 Printed: 5/31/2017 6:06 PM
2016-17 Estimated Actuals 2017-18 Budget
Description Resource CodesObjectCodes
Unrestricted(A)
Restricted(B)
Total Fundcol. A + B
(C)Unrestricted
(D)Restricted
(E)
Total Fundcol. D + E
(F)
% DiffColumnC & F
E. NET INCREASE (DECREASE) IN FUND BALANCE (C + D4) (30,571.00) (22,321.00) (52,892.00) 115,587.00 14,610.00 130,197.00 -346.2%
F. FUND BALANCE, RESERVES 1) Beginning Fund Balance a) As of July 1 - Unaudited 9791 1,247,117.00 243,268.00 1,490,385.00 1,216,546.00 220,947.00 1,437,493.00 -3.5%
b) Audit Adjustments 9793 0.00 0.00 0.00 0.00 0.00 0.00 0.0%
c) As of July 1 - Audited (F1a + F1b) 1,247,117.00 243,268.00 1,490,385.00 1,216,546.00 220,947.00 1,437,493.00 -3.5%
d) Other Restatements 9795 0.00 0.00 0.00 0.00 0.00 0.00 0.0%
e) Adjusted Beginning Balance (F1c + F1d) 1,247,117.00 243,268.00 1,490,385.00 1,216,546.00 220,947.00 1,437,493.00 -3.5%
2) Ending Balance, June 30 (E + F1e) 1,216,546.00 220,947.00 1,437,493.00 1,332,133.00 235,557.00 1,567,690.00 9.1%
Components of Ending Fund Balance a) Nonspendable Revolving Cash 9711 1,600.00 0.00 1,600.00 1,600.00 0.00 1,600.00 0.0%
Stores 9712 0.00 0.00 0.00 0.00 0.00 0.00 0.0%
Prepaid Expenditures 9713 73,436.00 0.00 73,436.00 73,436.00 0.00 73,436.00 0.0%
All Others 9719 0.00 0.00 0.00 0.00 0.00 0.00 0.0%
b) Restricted 9740 0.00 220,947.00 220,947.00 0.00 235,557.00 235,557.00 6.6%
c) Committed Stabilization Arrangements 9750 0.00 0.00 0.00 0.00 0.00 0.00 0.0%
Other Commitments 9760 0.00 0.00 0.00 0.00 0.00 0.00 0.0%
d) Assigned
Other Assignments 9780 866,310.00 0.00 866,310.00 1,004,997.00 0.00 1,004,997.00 16.0%
e) Unassigned/unappropriated
Reserve for Economic Uncertainties 9789 275,200.00 0.00 275,200.00 252,100.00 0.00 252,100.00 -8.4%
Unassigned/Unappropriated Amount 9790 0.00 0.00 0.00 0.00 0.00 0.00 0.0%

Pacheco Union ElementaryShasta County
July 1 BudgetGeneral Fund
Unrestricted and RestrictedExpenditures by Object
45 70094 0000000Form 01
California Dept of EducationSACS Financial Reporting Software - 2017.1.0File: fund-a (Rev 04/10/2017) Page 3 Printed: 5/31/2017 6:06 PM
2016-17 Estimated Actuals 2017-18 Budget
Description Resource CodesObjectCodes
Unrestricted(A)
Restricted(B)
Total Fundcol. A + B
(C)Unrestricted
(D)Restricted
(E)
Total Fundcol. D + E
(F)
% DiffColumnC & F
G. ASSETS
1) Cash a) in County Treasury 9110 0.00 0.00 0.00
1) Fair Value Adjustment to Cash in County Treasury 9111 0.00 0.00 0.00
b) in Banks 9120 0.00 0.00 0.00
c) in Revolving Fund 9130 0.00 0.00 0.00
d) with Fiscal Agent 9135 0.00 0.00 0.00
e) collections awaiting deposit 9140 0.00 0.00 0.00
2) Investments 9150 0.00 0.00 0.00
3) Accounts Receivable 9200 0.00 0.00 0.00
4) Due from Grantor Government 9290 0.00 0.00 0.00
5) Due from Other Funds 9310 0.00 0.00 0.00
6) Stores 9320 0.00 0.00 0.00
7) Prepaid Expenditures 9330 0.00 0.00 0.00
8) Other Current Assets 9340 0.00 0.00 0.00
9) TOTAL, ASSETS 0.00 0.00 0.00
H. DEFERRED OUTFLOWS OF RESOURCES
1) Deferred Outflows of Resources 9490 0.00 0.00 0.00
2) TOTAL, DEFERRED OUTFLOWS 0.00 0.00 0.00
I. LIABILITIES
1) Accounts Payable 9500 0.00 0.00 0.00
2) Due to Grantor Governments 9590 0.00 0.00 0.00
3) Due to Other Funds 9610 0.00 0.00 0.00
4) Current Loans 9640 0.00 0.00 0.00
5) Unearned Revenue 9650 0.00 0.00 0.00
6) TOTAL, LIABILITIES 0.00 0.00 0.00
J. DEFERRED INFLOWS OF RESOURCES
1) Deferred Inflows of Resources 9690 0.00 0.00 0.00
2) TOTAL, DEFERRED INFLOWS 0.00 0.00 0.00
K. FUND EQUITY
Ending Fund Balance, June 30 (G9 + H2) - (I6 + J2) 0.00 0.00 0.00

Pacheco Union ElementaryShasta County
July 1 BudgetGeneral Fund
Unrestricted and RestrictedExpenditures by Object
45 70094 0000000Form 01
California Dept of EducationSACS Financial Reporting Software - 2017.1.0File: fund-a (Rev 04/10/2017) Page 4 Printed: 5/31/2017 6:06 PM
2016-17 Estimated Actuals 2017-18 Budget
Description Resource CodesObjectCodes
Unrestricted(A)
Restricted(B)
Total Fundcol. A + B
(C)Unrestricted
(D)Restricted
(E)
Total Fundcol. D + E
(F)
% DiffColumnC & F
LCFF SOURCES Principal Apportionment State Aid - Current Year 8011 2,098,185.00 0.00 2,098,185.00 2,229,839.00 0.00 2,229,839.00 6.3%
Education Protection Account State Aid - Current Year 8012 692,275.00 0.00 692,275.00 656,765.00 0.00 656,765.00 -5.1%
State Aid - Prior Years 8019 (18,705.00) 0.00 (18,705.00) 0.00 0.00 0.00 -100.0%
Tax Relief Subventions Homeowners' Exemptions 8021 35,589.00 0.00 35,589.00 36,301.00 0.00 36,301.00 2.0%
Timber Yield Tax 8022 0.00 0.00 0.00 0.00 0.00 0.00 0.0%
Other Subventions/In-Lieu Taxes 8029 0.00 0.00 0.00 0.00 0.00 0.00 0.0%
County & District Taxes Secured Roll Taxes 8041 2,146,733.00 0.00 2,146,733.00 2,189,668.00 0.00 2,189,668.00 2.0%
Unsecured Roll Taxes 8042 122,242.00 0.00 122,242.00 124,687.00 0.00 124,687.00 2.0%
Prior Years' Taxes 8043 660.00 0.00 660.00 673.00 0.00 673.00 2.0%
Supplemental Taxes 8044 10,846.00 0.00 10,846.00 11,063.00 0.00 11,063.00 2.0%
Education Revenue Augmentation Fund (ERAF) 8045 (88,208.00) 0.00 (88,208.00) (89,972.00) 0.00 (89,972.00) 2.0%
Community Redevelopment Funds (SB 617/699/1992) 8047 100,004.00 0.00 100,004.00 90,004.00 0.00 90,004.00 -10.0%
Penalties and Interest from Delinquent Taxes 8048 0.00 0.00 0.00 0.00 0.00 0.00 0.0%
Miscellaneous Funds (EC 41604) Royalties and Bonuses 8081 0.00 0.00 0.00 0.00 0.00 0.00 0.0%
Other In-Lieu Taxes 8082 0.00 0.00 0.00 0.00 0.00 0.00 0.0%
Less: Non-LCFF (50%) Adjustment 8089 0.00 0.00 0.00 0.00 0.00 0.00 0.0%
Subtotal, LCFF Sources 5,099,621.00 0.00 5,099,621.00 5,249,028.00 0.00 5,249,028.00 2.9% LCFF Transfers
Unrestricted LCFF Transfers - Current Year 0000 8091 0.00 0.00 0.00 0.00 0.0%
All Other LCFF Transfers - Current Year All Other 8091 0.00 0.00 0.00 0.00 0.00 0.00 0.0%
Transfers to Charter Schools in Lieu of Property Taxes 8096 (953.00) 0.00 (953.00) 0.00 0.00 0.00 -100.0%
Property Taxes Transfers 8097 0.00 0.00 0.00 0.00 0.00 0.00 0.0%
LCFF/Revenue Limit Transfers - Prior Years 8099 0.00 0.00 0.00 0.00 0.00 0.00 0.0%
TOTAL, LCFF SOURCES 5,098,668.00 0.00 5,098,668.00 5,249,028.00 0.00 5,249,028.00 2.9%
FEDERAL REVENUE
Maintenance and Operations 8110 0.00 0.00 0.00 0.00 0.00 0.00 0.0%
Special Education Entitlement 8181 0.00 117,298.00 117,298.00 0.00 111,379.00 111,379.00 -5.0%
Special Education Discretionary Grants 8182 0.00 0.00 0.00 0.00 0.00 0.00 0.0%
Child Nutrition Programs 8220 0.00 0.00 0.00 0.00 0.00 0.00 0.0%
Donated Food Commodities 8221 0.00 0.00 0.00 0.00 0.00 0.00 0.0%
Forest Reserve Funds 8260 0.00 0.00 0.00 0.00 0.00 0.00 0.0%
Flood Control Funds 8270 0.00 0.00 0.00 0.00 0.00 0.00 0.0%
Wildlife Reserve Funds 8280 0.00 0.00 0.00 0.00 0.00 0.00 0.0%
FEMA 8281 0.00 0.00 0.00 0.00 0.00 0.00 0.0%
Interagency Contracts Between LEAs 8285 0.00 0.00 0.00 0.00 0.00 0.00 0.0%
Pass-Through Revenues from Federal Sources 8287 0.00 0.00 0.00 0.00 0.00 0.00 0.0%
Title I, Part A, Basic 3010 8290 133,975.00 133,975.00 114,899.00 114,899.00 -14.2%
Title I, Part D, Local Delinquent Programs 3025 8290 0.00 0.00 0.00 0.00 0.0%
Title II, Part A, Educator Quality 4035 8290 30,229.00 30,229.00 23,578.00 23,578.00 -22.0%
Title III, Part A, Immigrant Education Program 4201 8290 0.00 0.00 0.00 0.00 0.0%

Pacheco Union ElementaryShasta County
July 1 BudgetGeneral Fund
Unrestricted and RestrictedExpenditures by Object
45 70094 0000000Form 01
California Dept of EducationSACS Financial Reporting Software - 2017.1.0File: fund-a (Rev 04/10/2017) Page 5 Printed: 5/31/2017 6:06 PM
2016-17 Estimated Actuals 2017-18 Budget
Description Resource CodesObjectCodes
Unrestricted(A)
Restricted(B)
Total Fundcol. A + B
(C)Unrestricted
(D)Restricted
(E)
Total Fundcol. D + E
(F)
% DiffColumnC & F
Title III, Part A, English Learner Program 4203 8290 0.00 0.00 0.00 0.00 0.0%
Title V, Part B, Public Charter Schools Grant Program (PCSGP) (NCLB) 4610 8290 0.00 0.00 0.00 0.00 0.0%
Other NCLB / Every Student Succeeds Act3199, 4036-4126,
5510 8290 492,795.00 492,795.00 0.00 0.00 -100.0%
Career and Technical Education 3500-3599 8290 0.00 0.00 0.00 0.00 0.0%
All Other Federal Revenue All Other 8290 0.00 52,188.00 52,188.00 0.00 33,878.00 33,878.00 -35.1%
TOTAL, FEDERAL REVENUE 0.00 826,485.00 826,485.00 0.00 283,734.00 283,734.00 -65.7%
OTHER STATE REVENUE
Other State Apportionments
ROC/P Entitlement Prior Years 6360 8319 0.00 0.00 0.00 0.00 0.0%
Special Education Master Plan Current Year 6500 8311 0.00 0.00 0.00 0.00 0.0%
Prior Years 6500 8319 0.00 0.00 0.00 0.00 0.0%
All Other State Apportionments - Current Year All Other 8311 0.00 0.00 0.00 0.00 0.00 0.00 0.0%
All Other State Apportionments - Prior Years All Other 8319 0.00 0.00 0.00 0.00 0.00 0.00 0.0%
Child Nutrition Programs 8520 0.00 0.00 0.00 0.00 0.00 0.00 0.0%
Mandated Costs Reimbursements 8550 138,010.00 0.00 138,010.00 16,252.00 0.00 16,252.00 -88.2%
Lottery - Unrestricted and Instructional Materials 8560 84,100.00 24,500.00 108,600.00 84,100.00 24,500.00 108,600.00 0.0%
Tax Relief Subventions Restricted Levies - Other
Homeowners' Exemptions 8575 0.00 0.00 0.00 0.00 0.00 0.00 0.0%
Other Subventions/In-Lieu Taxes 8576 0.00 0.00 0.00 0.00 0.00 0.00 0.0%
Pass-Through Revenues from State Sources 8587 0.00 0.00 0.00 0.00 0.00 0.00 0.0%
After School Education and Safety (ASES) 6010 8590 0.00 0.00 0.00 0.00 0.0%
Charter School Facility Grant 6030 8590 0.00 0.00 0.00 0.00 0.0%
Drug/Alcohol/Tobacco Funds 6650, 6690 8590 0.00 0.00 0.00 0.00 0.0%
California Clean Energy Jobs Act 6230 8590 0.00 0.00 0.00 0.00 0.0%
Career Technical Education Incentive Grant Program 6387 8590 0.00 0.00 0.00 0.00 0.0%
American Indian Early Childhood Education 7210 8590 0.00 0.00 0.00 0.00 0.0%
Specialized Secondary 7370 8590 0.00 0.00 0.00 0.00 0.0%
Quality Education Investment Act 7400 8590 0.00 0.00 0.00 0.00 0.0%
Common Core State Standards Implementation 7405 8590 0.00 0.00 0.00 0.00 0.0%
All Other State Revenue All Other 8590 0.00 87,186.00 87,186.00 0.00 87,186.00 87,186.00 0.0%
TOTAL, OTHER STATE REVENUE 222,110.00 111,686.00 333,796.00 100,352.00 111,686.00 212,038.00 -36.5%

Pacheco Union ElementaryShasta County
July 1 BudgetGeneral Fund
Unrestricted and RestrictedExpenditures by Object
45 70094 0000000Form 01
California Dept of EducationSACS Financial Reporting Software - 2017.1.0File: fund-a (Rev 04/10/2017) Page 6 Printed: 5/31/2017 6:06 PM
2016-17 Estimated Actuals 2017-18 Budget
Description Resource CodesObjectCodes
Unrestricted(A)
Restricted(B)
Total Fundcol. A + B
(C)Unrestricted
(D)Restricted
(E)
Total Fundcol. D + E
(F)
% DiffColumnC & F
OTHER LOCAL REVENUE
Other Local Revenue County and District Taxes
Other Restricted Levies Secured Roll 8615 0.00 0.00 0.00 0.00 0.00 0.00 0.0%
Unsecured Roll 8616 0.00 0.00 0.00 0.00 0.00 0.00 0.0%
Prior Years' Taxes 8617 0.00 0.00 0.00 0.00 0.00 0.00 0.0%
Supplemental Taxes 8618 0.00 0.00 0.00 0.00 0.00 0.00 0.0%
Non-Ad Valorem Taxes Parcel Taxes 8621 0.00 0.00 0.00 0.00 0.00 0.00 0.0%
Other 8622 0.00 0.00 0.00 0.00 0.00 0.00 0.0%
Community Redevelopment Funds Not Subject to LCFF Deduction 8625 0.00 0.00 0.00 0.00 0.00 0.00 0.0%
Penalties and Interest from Delinquent Non-LCFF Taxes 8629 0.00 0.00 0.00 0.00 0.00 0.00 0.0%
Sales Sale of Equipment/Supplies 8631 0.00 0.00 0.00 0.00 0.00 0.00 0.0%
Sale of Publications 8632 0.00 0.00 0.00 0.00 0.00 0.00 0.0%
Food Service Sales 8634 0.00 0.00 0.00 0.00 0.00 0.00 0.0%
All Other Sales 8639 500.00 0.00 500.00 500.00 0.00 500.00 0.0%
Leases and Rentals 8650 3,000.00 0.00 3,000.00 3,000.00 0.00 3,000.00 0.0%
Interest 8660 6,500.00 0.00 6,500.00 6,500.00 0.00 6,500.00 0.0%
Net Increase (Decrease) in the Fair Value of Investments 8662 0.00 0.00 0.00 0.00 0.00 0.00 0.0%
Fees and Contracts Adult Education Fees 8671 0.00 0.00 0.00 0.00 0.00 0.00 0.0%
Non-Resident Students 8672 0.00 0.00 0.00 0.00 0.00 0.00 0.0%
Transportation Fees From Individuals 8675 0.00 0.00 0.00 0.00 0.00 0.00 0.0%
Interagency Services 8677 53,713.00 5,000.00 58,713.00 26,213.00 5,000.00 31,213.00 -46.8%
Mitigation/Developer Fees 8681 0.00 0.00 0.00 0.00 0.00 0.00 0.0%
All Other Fees and Contracts 8689 0.00 0.00 0.00 0.00 0.00 0.00 0.0%
Other Local Revenue Plus: Misc Funds Non-LCFF (50%) Adjustment 8691 0.00 0.00 0.00 0.00 0.00 0.00 0.0%
Pass-Through Revenues From Local Sources 8697 0.00 0.00 0.00 0.00 0.00 0.00 0.0%
All Other Local Revenue 8699 159,510.00 0.00 159,510.00 157,010.00 0.00 157,010.00 -1.6%
Tuition 8710 0.00 0.00 0.00 0.00 0.00 0.00 0.0%
All Other Transfers In 8781-8783 0.00 0.00 0.00 0.00 0.00 0.00 0.0%
Transfers of Apportionments Special Education SELPA Transfers From Districts or Charter Schools 6500 8791 0.00 0.00 0.00 0.00 0.0%
From County Offices 6500 8792 336,620.00 336,620.00 338,458.00 338,458.00 0.5%
From JPAs 6500 8793 0.00 0.00 0.00 0.00 0.0%
ROC/P Transfers From Districts or Charter Schools 6360 8791 0.00 0.00 0.00 0.00 0.0%
From County Offices 6360 8792 0.00 0.00 0.00 0.00 0.0%
From JPAs 6360 8793 0.00 0.00 0.00 0.00 0.0%
Other Transfers of Apportionments From Districts or Charter Schools All Other 8791 0.00 0.00 0.00 0.00 0.00 0.00 0.0%
From County Offices All Other 8792 0.00 0.00 0.00 0.00 0.00 0.00 0.0%
From JPAs All Other 8793 0.00 0.00 0.00 0.00 0.00 0.00 0.0%
All Other Transfers In from All Others 8799 0.00 0.00 0.00 0.00 0.00 0.00 0.0%
TOTAL, OTHER LOCAL REVENUE 223,223.00 341,620.00 564,843.00 193,223.00 343,458.00 536,681.00 -5.0%
TOTAL, REVENUES 5,544,001.00 1,279,791.00 6,823,792.00 5,542,603.00 738,878.00 6,281,481.00 -7.9%

Pacheco Union ElementaryShasta County
July 1 BudgetGeneral Fund
Unrestricted and RestrictedExpenditures by Object
45 70094 0000000Form 01
California Dept of EducationSACS Financial Reporting Software - 2017.1.0File: fund-a (Rev 04/10/2017) Page 7 Printed: 5/31/2017 6:06 PM
2016-17 Estimated Actuals 2017-18 Budget
Description Resource CodesObjectCodes
Unrestricted(A)
Restricted(B)
Total Fundcol. A + B
(C)Unrestricted
(D)Restricted
(E)
Total Fundcol. D + E
(F)
% DiffColumnC & F
CERTIFICATED SALARIES
Certificated Teachers' Salaries 1100 1,710,727.00 425,225.00 2,135,952.00 1,674,107.00 344,906.00 2,019,013.00 -5.5%
Certificated Pupil Support Salaries 1200 96,923.00 0.00 96,923.00 52,220.00 0.00 52,220.00 -46.1%
Certificated Supervisors' and Administrators' Salaries 1300 297,255.00 10,123.00 307,378.00 268,468.00 10,245.00 278,713.00 -9.3%
Other Certificated Salaries 1900 1,050.00 23,535.00 24,585.00 1,050.00 0.00 1,050.00 -95.7%
TOTAL, CERTIFICATED SALARIES 2,105,955.00 458,883.00 2,564,838.00 1,995,845.00 355,151.00 2,350,996.00 -8.3%
CLASSIFIED SALARIES
Classified Instructional Salaries 2100 154,351.00 100,355.00 254,706.00 131,688.00 149,878.00 281,566.00 10.5%
Classified Support Salaries 2200 270,278.00 43,646.00 313,924.00 266,841.00 43,683.00 310,524.00 -1.1%
Classified Supervisors' and Administrators' Salaries 2300 29,556.00 0.00 29,556.00 29,446.00 0.00 29,446.00 -0.4%
Clerical, Technical and Office Salaries 2400 238,635.00 0.00 238,635.00 240,894.00 0.00 240,894.00 0.9%
Other Classified Salaries 2900 184,972.00 0.00 184,972.00 176,634.00 0.00 176,634.00 -4.5%
TOTAL, CLASSIFIED SALARIES 877,792.00 144,001.00 1,021,793.00 845,503.00 193,561.00 1,039,064.00 1.7%
EMPLOYEE BENEFITS
STRS 3101-3102 245,192.00 141,089.00 386,281.00 277,726.00 137,818.00 415,544.00 7.6%
PERS 3201-3202 110,674.00 12,967.00 123,641.00 105,090.00 20,839.00 125,929.00 1.9%
OASDI/Medicare/Alternative 3301-3302 94,457.00 18,017.00 112,474.00 88,811.00 19,097.00 107,908.00 -4.1%
Health and Welfare Benefits 3401-3402 384,223.00 73,603.00 457,826.00 390,387.00 81,835.00 472,222.00 3.1%
Unemployment Insurance 3501-3502 2,406.00 283.00 2,689.00 2,338.00 253.00 2,591.00 -3.6%
Workers' Compensation 3601-3602 62,981.00 12,746.00 75,727.00 62,763.00 12,136.00 74,899.00 -1.1%
OPEB, Allocated 3701-3702 22,000.00 0.00 22,000.00 22,000.00 0.00 22,000.00 0.0%
OPEB, Active Employees 3751-3752 0.00 0.00 0.00 0.00 0.00 0.00 0.0%
Other Employee Benefits 3901-3902 30,500.00 0.00 30,500.00 0.00 0.00 0.00 -100.0%
TOTAL, EMPLOYEE BENEFITS 952,433.00 258,705.00 1,211,138.00 949,115.00 271,978.00 1,221,093.00 0.8%
BOOKS AND SUPPLIES
Approved Textbooks and Core Curricula Materials 4100 21,873.00 0.00 21,873.00 10,000.00 0.00 10,000.00 -54.3%
Books and Other Reference Materials 4200 1,200.00 0.00 1,200.00 1,200.00 0.00 1,200.00 0.0%
Materials and Supplies 4300 166,221.00 58,930.00 225,151.00 162,721.00 58,930.00 221,651.00 -1.6%
Noncapitalized Equipment 4400 26,371.00 0.00 26,371.00 19,571.00 0.00 19,571.00 -25.8%
Food 4700 0.00 0.00 0.00 0.00 0.00 0.00 0.0%
TOTAL, BOOKS AND SUPPLIES 215,665.00 58,930.00 274,595.00 193,492.00 58,930.00 252,422.00 -8.1%
SERVICES AND OTHER OPERATING EXPENDITURES
Subagreements for Services 5100 94,356.00 491,809.00 586,165.00 94,356.00 209,158.00 303,514.00 -48.2%
Travel and Conferences 5200 24,500.00 67,646.00 92,146.00 7,100.00 33,568.00 40,668.00 -55.9%
Dues and Memberships 5300 10,002.00 0.00 10,002.00 10,002.00 0.00 10,002.00 0.0%
Insurance 5400 - 5450 50,578.00 0.00 50,578.00 50,578.00 0.00 50,578.00 0.0%
Operations and Housekeeping Services 5500 134,750.00 12,000.00 146,750.00 134,750.00 12,000.00 146,750.00 0.0%
Rentals, Leases, Repairs, and Noncapitalized Improvements 5600 102,400.00 34,680.00 137,080.00 102,400.00 34,680.00 137,080.00 0.0%
Transfers of Direct Costs 5710 1,726.00 (1,726.00) 0.00 5,138.00 (5,138.00) 0.00 0.0%
Transfers of Direct Costs - Interfund 5750 0.00 0.00 0.00 0.00 0.00 0.00 0.0%
Professional/Consulting Services and Operating Expenditures 5800 472,831.00 258,350.00 731,181.00 443,961.00 81,750.00 525,711.00 -28.1%
Communications 5900 11,700.00 1,350.00 13,050.00 11,700.00 1,350.00 13,050.00 0.0%
TOTAL, SERVICES AND OTHER OPERATING EXPENDITURES 902,843.00 864,109.00 1,766,952.00 859,985.00 367,368.00 1,227,353.00 -30.5%

Pacheco Union ElementaryShasta County
July 1 BudgetGeneral Fund
Unrestricted and RestrictedExpenditures by Object
45 70094 0000000Form 01
California Dept of EducationSACS Financial Reporting Software - 2017.1.0File: fund-a (Rev 04/10/2017) Page 8 Printed: 5/31/2017 6:06 PM
2016-17 Estimated Actuals 2017-18 Budget
Description Resource CodesObjectCodes
Unrestricted(A)
Restricted(B)
Total Fundcol. A + B
(C)Unrestricted
(D)Restricted
(E)
Total Fundcol. D + E
(F)
% DiffColumnC & F
CAPITAL OUTLAY
Land 6100 0.00 0.00 0.00 0.00 0.00 0.00 0.0%
Land Improvements 6170 0.00 0.00 0.00 0.00 0.00 0.00 0.0%
Buildings and Improvements of Buildings 6200 0.00 0.00 0.00 0.00 0.00 0.00 0.0%
Books and Media for New School Libraries or Major Expansion of School Libraries 6300 0.00 0.00 0.00 0.00 0.00 0.00 0.0%
Equipment 6400 0.00 0.00 0.00 150,000.00 0.00 150,000.00 New
Equipment Replacement 6500 0.00 0.00 0.00 0.00 0.00 0.00 0.0%
TOTAL, CAPITAL OUTLAY 0.00 0.00 0.00 150,000.00 0.00 150,000.00 New
OTHER OUTGO (excluding Transfers of Indirect Costs)
Tuition Tuition for Instruction Under Interdistrict Attendance Agreements 7110 0.00 0.00 0.00 0.00 0.00 0.00 0.0%
State Special Schools 7130 0.00 0.00 0.00 0.00 0.00 0.00 0.0%
Tuition, Excess Costs, and/or Deficit Payments Payments to Districts or Charter Schools 7141 0.00 0.00 0.00 0.00 0.00 0.00 0.0%
Payments to County Offices 7142 0.00 0.00 0.00 0.00 0.00 0.00 0.0%
Payments to JPAs 7143 0.00 0.00 0.00 0.00 0.00 0.00 0.0%
Transfers of Pass-Through Revenues To Districts or Charter Schools 7211 0.00 0.00 0.00 0.00 0.00 0.00 0.0%
To County Offices 7212 0.00 0.00 0.00 0.00 0.00 0.00 0.0%
To JPAs 7213 0.00 0.00 0.00 0.00 0.00 0.00 0.0%
Special Education SELPA Transfers of Apportionments To Districts or Charter Schools 6500 7221 0.00 0.00 0.00 0.00 0.0%
To County Offices 6500 7222 0.00 0.00 0.00 0.00 0.0%
To JPAs 6500 7223 0.00 0.00 0.00 0.00 0.0%
ROC/P Transfers of Apportionments To Districts or Charter Schools 6360 7221 0.00 0.00 0.00 0.00 0.0%
To County Offices 6360 7222 0.00 0.00 0.00 0.00 0.0%
To JPAs 6360 7223 0.00 0.00 0.00 0.00 0.0%
Other Transfers of Apportionments All Other 7221-7223 0.00 0.00 0.00 0.00 0.00 0.00 0.0%
All Other Transfers 7281-7283 0.00 0.00 0.00 0.00 0.00 0.00 0.0%
All Other Transfers Out to All Others 7299 0.00 0.00 0.00 0.00 0.00 0.00 0.0%
Debt Service Debt Service - Interest 7438 0.00 0.00 0.00 0.00 0.00 0.00 0.0%
Other Debt Service - Principal 7439 15,000.00 0.00 15,000.00 50,000.00 0.00 50,000.00 233.3%
TOTAL, OTHER OUTGO (excluding Transfers of Indirect Costs) 15,000.00 0.00 15,000.00 50,000.00 0.00 50,000.00 233.3%
OTHER OUTGO - TRANSFERS OF INDIRECT COSTS
Transfers of Indirect Costs 7310 (38,190.00) 38,190.00 0.00 (30,490.00) 30,490.00 0.00 0.0%
Transfers of Indirect Costs - Interfund 7350 0.00 0.00 0.00 0.00 0.00 0.00 0.0%
TOTAL, OTHER OUTGO - TRANSFERS OF INDIRECT COSTS (38,190.00) 38,190.00 0.00 (30,490.00) 30,490.00 0.00 0.0%
TOTAL, EXPENDITURES 5,031,498.00 1,822,818.00 6,854,316.00 5,013,450.00 1,277,478.00 6,290,928.00 -8.2%

Pacheco Union ElementaryShasta County
July 1 BudgetGeneral Fund
Unrestricted and RestrictedExpenditures by Object
45 70094 0000000Form 01
California Dept of EducationSACS Financial Reporting Software - 2017.1.0File: fund-a (Rev 04/10/2017) Page 9 Printed: 5/31/2017 6:06 PM
2016-17 Estimated Actuals 2017-18 Budget
Description Resource CodesObjectCodes
Unrestricted(A)
Restricted(B)
Total Fundcol. A + B
(C)Unrestricted
(D)Restricted
(E)
Total Fundcol. D + E
(F)
% DiffColumnC & F
INTERFUND TRANSFERS
INTERFUND TRANSFERS IN
From: Special Reserve Fund 8912 0.00 0.00 0.00 0.00 0.00 0.00 0.0%
From: Bond Interest and Redemption Fund 8914 0.00 0.00 0.00 0.00 0.00 0.00 0.0%
Other Authorized Interfund Transfers In 8919 0.00 0.00 0.00 0.00 0.00 0.00 0.0%
(a) TOTAL, INTERFUND TRANSFERS IN 0.00 0.00 0.00 0.00 0.00 0.00 0.0%
INTERFUND TRANSFERS OUT
To: Child Development Fund 7611 0.00 0.00 0.00 0.00 0.00 0.00 0.0%
To: Special Reserve Fund 7612 0.00 0.00 0.00 0.00 0.00 0.00 0.0%
To: State School Building Fund/ County School Facilities Fund 7613 0.00 0.00 0.00 0.00 0.00 0.00 0.0%
To: Cafeteria Fund 7616 22,368.00 0.00 22,368.00 10,356.00 0.00 10,356.00 -53.7%
Other Authorized Interfund Transfers Out 7619 0.00 0.00 0.00 0.00 0.00 0.00 0.0%
(b) TOTAL, INTERFUND TRANSFERS OUT 22,368.00 0.00 22,368.00 10,356.00 0.00 10,356.00 -53.7%
OTHER SOURCES/USES
SOURCES
State Apportionments Emergency Apportionments 8931 0.00 0.00 0.00 0.00 0.00 0.00 0.0%
Proceeds
Proceeds from Sale/Lease- Purchase of Land/Buildings 8953 0.00 0.00 0.00 0.00 0.00 0.00 0.0%
Other Sources
Transfers from Funds of Lapsed/Reorganized LEAs 8965 0.00 0.00 0.00 0.00 0.00 0.00 0.0%
Long-Term Debt Proceeds Proceeds from Certificates of Participation 8971 0.00 0.00 0.00 0.00 0.00 0.00 0.0%
Proceeds from Capital Leases 8972 0.00 0.00 0.00 150,000.00 0.00 150,000.00 New
Proceeds from Lease Revenue Bonds 8973 0.00 0.00 0.00 0.00 0.00 0.00 0.0%
All Other Financing Sources 8979 0.00 0.00 0.00 0.00 0.00 0.00 0.0%
(c) TOTAL, SOURCES 0.00 0.00 0.00 150,000.00 0.00 150,000.00 New
USES
Transfers of Funds from Lapsed/Reorganized LEAs 7651 0.00 0.00 0.00 0.00 0.00 0.00 0.0%
All Other Financing Uses 7699 0.00 0.00 0.00 0.00 0.00 0.00 0.0%
(d) TOTAL, USES 0.00 0.00 0.00 0.00 0.00 0.00 0.0%
CONTRIBUTIONS
Contributions from Unrestricted Revenues 8980 (520,706.00) 520,706.00 0.00 (553,210.00) 553,210.00 0.00 0.0%
Contributions from Restricted Revenues 8990 0.00 0.00 0.00 0.00 0.00 0.00 0.0%
(e) TOTAL, CONTRIBUTIONS (520,706.00) 520,706.00 0.00 (553,210.00) 553,210.00 0.00 0.0%
TOTAL, OTHER FINANCING SOURCES/USES (a - b + c - d + e) (543,074.00) 520,706.00 (22,368.00) (413,566.00) 553,210.00 139,644.00 -724.3%

Pacheco Union ElementaryShasta County
July 1 BudgetGeneral Fund
Unrestricted and RestrictedExpenditures by Function
45 70094 0000000Form 01
California Dept of EducationSACS Financial Reporting Software - 2017.1.0File: fund-a (Rev 04/02/2015) Page 1 Printed: 5/31/2017 6:06 PM
2016-17 Estimated Actuals 2017-18 Budget
Description Function CodesObjectCodes
Unrestricted(A)
Restricted(B)
Total Fundcol. A + B
(C)Unrestricted
(D)Restricted
(E)
Total Fundcol. D + E
(F)
% DiffColumnC & F
A. REVENUES
1) LCFF Sources 8010-8099 5,098,668.00 0.00 5,098,668.00 5,249,028.00 0.00 5,249,028.00 2.9%
2) Federal Revenue 8100-8299 0.00 826,485.00 826,485.00 0.00 283,734.00 283,734.00 -65.7%
3) Other State Revenue 8300-8599 222,110.00 111,686.00 333,796.00 100,352.00 111,686.00 212,038.00 -36.5%
4) Other Local Revenue 8600-8799 223,223.00 341,620.00 564,843.00 193,223.00 343,458.00 536,681.00 -5.0%
5) TOTAL, REVENUES 5,544,001.00 1,279,791.00 6,823,792.00 5,542,603.00 738,878.00 6,281,481.00 -7.9%
B. EXPENDITURES (Objects 1000-7999)
1) Instruction 1000-1999 2,868,313.00 1,084,973.00 3,953,286.00 2,786,838.00 1,038,157.00 3,824,995.00 -3.2%
2) Instruction - Related Services 2000-2999 687,256.00 538,822.00 1,226,078.00 676,708.00 48,121.00 724,829.00 -40.9%
3) Pupil Services 3000-3999 511,421.00 7,322.00 518,743.00 581,475.00 7,322.00 588,797.00 13.5%
4) Ancillary Services 4000-4999 41,921.00 185.00 42,106.00 39,590.00 185.00 39,775.00 -5.5%
5) Community Services 5000-5999 37,007.00 0.00 37,007.00 39,953.00 0.00 39,953.00 8.0%
6) Enterprise 6000-6999 0.00 0.00 0.00 0.00 0.00 0.00 0.0%
7) General Administration 7000-7999 433,006.00 39,643.00 472,649.00 407,765.00 31,943.00 439,708.00 -7.0%
8) Plant Services 8000-8999 437,574.00 151,873.00 589,447.00 431,121.00 151,750.00 582,871.00 -1.1%
9) Other Outgo 9000-9999Except
7600-7699 15,000.00 0.00 15,000.00 50,000.00 0.00 50,000.00 233.3%
10) TOTAL, EXPENDITURES 5,031,498.00 1,822,818.00 6,854,316.00 5,013,450.00 1,277,478.00 6,290,928.00 -8.2%
C. EXCESS (DEFICIENCY) OF REVENUES OVER EXPENDITURES BEFORE OTHER FINANCING SOURCES AND USES (A5 - B10) 512,503.00 (543,027.00) (30,524.00) 529,153.00 (538,600.00) (9,447.00) -69.1%
D. OTHER FINANCING SOURCES/USES 1) Interfund Transfers a) Transfers In 8900-8929 0.00 0.00 0.00 0.00 0.00 0.00 0.0%
b) Transfers Out 7600-7629 22,368.00 0.00 22,368.00 10,356.00 0.00 10,356.00 -53.7%
2) Other Sources/Uses a) Sources 8930-8979 0.00 0.00 0.00 150,000.00 0.00 150,000.00 New
b) Uses 7630-7699 0.00 0.00 0.00 0.00 0.00 0.00 0.0%
3) Contributions 8980-8999 (520,706.00) 520,706.00 0.00 (553,210.00) 553,210.00 0.00 0.0%
4) TOTAL, OTHER FINANCING SOURCES/USES (543,074.00) 520,706.00 (22,368.00) (413,566.00) 553,210.00 139,644.00 -724.3%

Pacheco Union ElementaryShasta County
July 1 BudgetGeneral Fund
Unrestricted and RestrictedExpenditures by Function
45 70094 0000000Form 01
California Dept of EducationSACS Financial Reporting Software - 2017.1.0File: fund-a (Rev 04/02/2015) Page 2 Printed: 5/31/2017 6:06 PM
2016-17 Estimated Actuals 2017-18 Budget
Description Function CodesObjectCodes
Unrestricted(A)
Restricted(B)
Total Fundcol. A + B
(C)Unrestricted
(D)Restricted
(E)
Total Fundcol. D + E
(F)
% DiffColumnC & F
E. NET INCREASE (DECREASE) IN FUND BALANCE (C + D4) (30,571.00) (22,321.00) (52,892.00) 115,587.00 14,610.00 130,197.00 -346.2%
F. FUND BALANCE, RESERVES 1) Beginning Fund Balance a) As of July 1 - Unaudited 9791 1,247,117.00 243,268.00 1,490,385.00 1,216,546.00 220,947.00 1,437,493.00 -3.5%
b) Audit Adjustments 9793 0.00 0.00 0.00 0.00 0.00 0.00 0.0%
c) As of July 1 - Audited (F1a + F1b) 1,247,117.00 243,268.00 1,490,385.00 1,216,546.00 220,947.00 1,437,493.00 -3.5%
d) Other Restatements 9795 0.00 0.00 0.00 0.00 0.00 0.00 0.0%
e) Adjusted Beginning Balance (F1c + F1d) 1,247,117.00 243,268.00 1,490,385.00 1,216,546.00 220,947.00 1,437,493.00 -3.5%
2) Ending Balance, June 30 (E + F1e) 1,216,546.00 220,947.00 1,437,493.00 1,332,133.00 235,557.00 1,567,690.00 9.1%
Components of Ending Fund Balance a) Nonspendable Revolving Cash 9711 1,600.00 0.00 1,600.00 1,600.00 0.00 1,600.00 0.0%
Stores 9712 0.00 0.00 0.00 0.00 0.00 0.00 0.0%
Prepaid Expenditures 9713 73,436.00 0.00 73,436.00 73,436.00 0.00 73,436.00 0.0%
All Others 9719 0.00 0.00 0.00 0.00 0.00 0.00 0.0%
b) Restricted 9740 0.00 220,947.00 220,947.00 0.00 235,557.00 235,557.00 6.6%
c) Committed Stabilization Arrangements 9750 0.00 0.00 0.00 0.00 0.00 0.00 0.0%
Other Commitments (by Resource/Object) 9760 0.00 0.00 0.00 0.00 0.00 0.00 0.0%
d) Assigned
Other Assignments (by Resource/Object) 9780 866,310.00 0.00 866,310.00 1,004,997.00 0.00 1,004,997.00 16.0%
e) Unassigned/unappropriated
Reserve for Economic Uncertainties 9789 275,200.00 0.00 275,200.00 252,100.00 0.00 252,100.00 -8.4%
Unassigned/Unappropriated Amount 9790 0.00 0.00 0.00 0.00 0.00 0.00 0.0%

Pacheco Union ElementaryShasta County
July 1 BudgetGeneral Fund
Exhibit: Restricted Balance Detail45 70094 0000000
Form 01
California Dept of EducationSACS Financial Reporting Software - 2017.1.0File: fund-a (Rev 04/06/2011) Page 1 Printed: 5/31/2017 6:06 PM
2016-17 2017-18Resource Description Estimated Actuals Budget
5640 Medi-Cal Billing Option 14,044.00 14,154.00
6230 California Clean Energy Jobs Act 144,479.00 144,479.00
6300 Lottery: Instructional Materials 62,424.00 76,924.00
Total, Restricted Balance 220,947.00 235,557.00

Pacheco Union ElementaryShasta County
July 1 BudgetCafeteria Special Revenue Fund
Expenditures by Object45 70094 0000000
Form 13
California Dept of EducationSACS Financial Reporting Software - 2017.1.0File: fund-b (Rev 04/07/2017 Page 1 Printed: 5/31/2017 6:07 PM
Description Resource Codes Object Codes2016-17
Estimated Actuals2017-18Budget
PercentDifference
A. REVENUES
1) LCFF Sources 8010-8099 0.00 0.00 0.0%
2) Federal Revenue 8100-8299 0.00 0.00 0.0%
3) Other State Revenue 8300-8599 0.00 0.00 0.0%
4) Other Local Revenue 8600-8799 121,761.00 128,402.00 5.5%
5) TOTAL, REVENUES 121,761.00 128,402.00 5.5%
B. EXPENDITURES
1) Certificated Salaries 1000-1999 0.00 0.00 0.0%
2) Classified Salaries 2000-2999 87,710.00 91,394.00 4.2%
3) Employee Benefits 3000-3999 39,045.00 42,190.00 8.1%
4) Books and Supplies 4000-4999 7,700.00 0.00 -100.0%
5) Services and Other Operating Expenditures 5000-5999 9,674.00 5,174.00 -46.5%
6) Capital Outlay 6000-6999 0.00 0.00 0.0%
7) Other Outgo (excluding Transfers of Indirect 7100-7299, Costs) 7400-7499 0.00 0.00 0.0%
8) Other Outgo - Transfers of Indirect Costs 7300-7399 0.00 0.00 0.0%
9) TOTAL, EXPENDITURES 144,129.00 138,758.00 -3.7%
C. EXCESS (DEFICIENCY) OF REVENUES OVER EXPENDITURES BEFORE OTHER FINANCING SOURCES AND USES (A5 - B9) (22,368.00) (10,356.00) -53.7%
D. OTHER FINANCING SOURCES/USES 1) Interfund Transfers a) Transfers In 8900-8929 22,368.00 10,356.00 -53.7%
b) Transfers Out 7600-7629 0.00 0.00 0.0%
2) Other Sources/Uses a) Sources 8930-8979 0.00 0.00 0.0%
b) Uses 7630-7699 0.00 0.00 0.0%
3) Contributions 8980-8999 0.00 0.00 0.0%
4) TOTAL, OTHER FINANCING SOURCES/USES 22,368.00 10,356.00 -53.7%

Pacheco Union ElementaryShasta County
July 1 BudgetCafeteria Special Revenue Fund
Expenditures by Object45 70094 0000000
Form 13
California Dept of EducationSACS Financial Reporting Software - 2017.1.0File: fund-b (Rev 04/07/2017 Page 2 Printed: 5/31/2017 6:07 PM
Description Resource Codes Object Codes2016-17
Estimated Actuals2017-18Budget
PercentDifference
E. NET INCREASE (DECREASE) IN FUND BALANCE (C + D4) 0.00 0.00 0.0%
F. FUND BALANCE, RESERVES 1) Beginning Fund Balance a) As of July 1 - Unaudited 9791 5,464.00 5,464.00 0.0%
b) Audit Adjustments 9793 0.00 0.00 0.0%
c) As of July 1 - Audited (F1a + F1b) 5,464.00 5,464.00 0.0%
d) Other Restatements 9795 0.00 0.00 0.0%
e) Adjusted Beginning Balance (F1c + F1d) 5,464.00 5,464.00 0.0%
2) Ending Balance, June 30 (E + F1e) 5,464.00 5,464.00 0.0% Components of Ending Fund Balance a) Nonspendable Revolving Cash 9711 0.00 0.00 0.0%
Stores 9712 3,464.00 3,464.00 0.0%
Prepaid Expenditures 9713 0.00 0.00 0.0%
All Others 9719 0.00 0.00 0.0%
b) Restricted 9740 2,000.00 2,000.00 0.0%
c) Committed Stabilization Arrangements 9750 0.00 0.00 0.0%
Other Commitments 9760 0.00 0.00 0.0%
d) Assigned Other Assignments 9780 0.00 0.00 0.0%
e) Unassigned/Unappropriated Reserve for Economic Uncertainties 9789 0.00 0.00 0.0%
Unassigned/Unappropriated Amount 9790 0.00 0.00 0.0%

Pacheco Union ElementaryShasta County
July 1 BudgetCafeteria Special Revenue Fund
Expenditures by Object45 70094 0000000
Form 13
California Dept of EducationSACS Financial Reporting Software - 2017.1.0File: fund-b (Rev 04/07/2017 Page 3 Printed: 5/31/2017 6:07 PM
Description Resource Codes Object Codes2016-17
Estimated Actuals2017-18Budget
PercentDifference
G. ASSETS 1) Cash a) in County Treasury 9110 0.00
1) Fair Value Adjustment to Cash in County Treasury 9111 0.00
b) in Banks 9120 0.00
c) in Revolving Fund 9130 0.00
d) with Fiscal Agent 9135 0.00
e) collections awaiting deposit 9140 0.00
2) Investments 9150 0.00
3) Accounts Receivable 9200 0.00
4) Due from Grantor Government 9290 0.00
5) Due from Other Funds 9310 0.00
6) Stores 9320 0.00
7) Prepaid Expenditures 9330 0.00
8) Other Current Assets 9340 0.00
9) TOTAL, ASSETS 0.00
H. DEFERRED OUTFLOWS OF RESOURCES
1) Deferred Outflows of Resources 9490 0.00
2) TOTAL, DEFERRED OUTFLOWS 0.00
I. LIABILITIES
1) Accounts Payable 9500 0.00
2) Due to Grantor Governments 9590 0.00
3) Due to Other Funds 9610 0.00
4) Current Loans 9640
5) Unearned Revenue 9650 0.00
6) TOTAL, LIABILITIES 0.00
J. DEFERRED INFLOWS OF RESOURCES
1) Deferred Inflows of Resources 9690 0.00
2) TOTAL, DEFERRED INFLOWS 0.00
K. FUND EQUITY
Ending Fund Balance, June 30 (G9 + H2) - (I6 + J2) 0.00

Pacheco Union ElementaryShasta County
July 1 BudgetCafeteria Special Revenue Fund
Expenditures by Object45 70094 0000000
Form 13
California Dept of EducationSACS Financial Reporting Software - 2017.1.0File: fund-b (Rev 04/07/2017 Page 4 Printed: 5/31/2017 6:07 PM
Description Resource Codes Object Codes2016-17
Estimated Actuals2017-18Budget
PercentDifference
FEDERAL REVENUE
Child Nutrition Programs 8220 0.00 0.00 0.0%
Donated Food Commodities 8221 0.00 0.00 0.0%
All Other Federal Revenue 8290 0.00 0.00 0.0%
TOTAL, FEDERAL REVENUE 0.00 0.00 0.0%
OTHER STATE REVENUE
Child Nutrition Programs 8520 0.00 0.00 0.0%
All Other State Revenue 8590 0.00 0.00 0.0%
TOTAL, OTHER STATE REVENUE 0.00 0.00 0.0%
OTHER LOCAL REVENUE
Other Local Revenue
Sales Sale of Equipment/Supplies 8631 0.00 0.00 0.0%
Food Service Sales 8634 0.00 0.00 0.0%
Leases and Rentals 8650 0.00 0.00 0.0%
Interest 8660 0.00 0.00 0.0%
Net Increase (Decrease) in the Fair Value of Investments 8662 0.00 0.00 0.0%
Fees and Contracts
Interagency Services 8677 121,761.00 128,402.00 5.5%
Other Local Revenue
All Other Local Revenue 8699 0.00 0.00 0.0%
TOTAL, OTHER LOCAL REVENUE 121,761.00 128,402.00 5.5%
TOTAL, REVENUES 121,761.00 128,402.00 5.5%

Pacheco Union ElementaryShasta County
July 1 BudgetCafeteria Special Revenue Fund
Expenditures by Object45 70094 0000000
Form 13
California Dept of EducationSACS Financial Reporting Software - 2017.1.0File: fund-b (Rev 04/07/2017 Page 5 Printed: 5/31/2017 6:07 PM
Description Resource Codes Object Codes2016-17
Estimated Actuals2017-18Budget
PercentDifference
CERTIFICATED SALARIES
Certificated Supervisors' and Administrators' Salaries 1300 0.00 0.00 0.0%
Other Certificated Salaries 1900 0.00 0.00 0.0%
TOTAL, CERTIFICATED SALARIES 0.00 0.00 0.0%
CLASSIFIED SALARIES
Classified Support Salaries 2200 87,710.00 91,394.00 4.2%
Classified Supervisors' and Administrators' Salaries 2300 0.00 0.00 0.0%
Clerical, Technical and Office Salaries 2400 0.00 0.00 0.0%
Other Classified Salaries 2900 0.00 0.00 0.0%
TOTAL, CLASSIFIED SALARIES 87,710.00 91,394.00 4.2%
EMPLOYEE BENEFITS
STRS 3101-3102 0.00 0.00 0.0%
PERS 3201-3202 10,332.00 11,219.00 8.6%
OASDI/Medicare/Alternative 3301-3302 6,422.00 6,324.00 -1.5%
Health and Welfare Benefits 3401-3402 20,296.00 22,583.00 11.3%
Unemployment Insurance 3501-3502 42.00 41.00 -2.4%
Workers' Compensation 3601-3602 1,953.00 2,023.00 3.6%
OPEB, Allocated 3701-3702 0.00 0.00 0.0%
OPEB, Active Employees 3751-3752 0.00 0.00 0.0%
Other Employee Benefits 3901-3902 0.00 0.00 0.0%
TOTAL, EMPLOYEE BENEFITS 39,045.00 42,190.00 8.1%
BOOKS AND SUPPLIES
Books and Other Reference Materials 4200 0.00 0.00 0.0%
Materials and Supplies 4300 0.00 0.00 0.0%
Noncapitalized Equipment 4400 7,700.00 0.00 -100.0%
Food 4700 0.00 0.00 0.0%
TOTAL, BOOKS AND SUPPLIES 7,700.00 0.00 -100.0%

Pacheco Union ElementaryShasta County
July 1 BudgetCafeteria Special Revenue Fund
Expenditures by Object45 70094 0000000
Form 13
California Dept of EducationSACS Financial Reporting Software - 2017.1.0File: fund-b (Rev 04/07/2017 Page 6 Printed: 5/31/2017 6:07 PM
Description Resource Codes Object Codes2016-17
Estimated Actuals2017-18Budget
PercentDifference
SERVICES AND OTHER OPERATING EXPENDITURES
Subagreements for Services 5100 0.00 0.00 0.0%
Travel and Conferences 5200 0.00 0.00 0.0%
Dues and Memberships 5300 0.00 0.00 0.0%
Insurance 5400-5450 0.00 0.00 0.0%
Operations and Housekeeping Services 5500 0.00 0.00 0.0%
Rentals, Leases, Repairs, and Noncapitalized Improvements 5600 7,000.00 2,500.00 -64.3%
Transfers of Direct Costs 5710 0.00 0.00 0.0%
Transfers of Direct Costs - Interfund 5750 0.00 0.00 0.0%
Professional/Consulting Services and Operating Expenditures 5800 2,674.00 2,674.00 0.0%
Communications 5900 0.00 0.00 0.0%
TOTAL, SERVICES AND OTHER OPERATING EXPENDITURES 9,674.00 5,174.00 -46.5%
CAPITAL OUTLAY
Buildings and Improvements of Buildings 6200 0.00 0.00 0.0%
Equipment 6400 0.00 0.00 0.0%
Equipment Replacement 6500 0.00 0.00 0.0%
TOTAL, CAPITAL OUTLAY 0.00 0.00 0.0%
OTHER OUTGO (excluding Transfers of Indirect Costs)
Debt Service
Debt Service - Interest 7438 0.00 0.00 0.0%
Other Debt Service - Principal 7439 0.00 0.00 0.0%
TOTAL, OTHER OUTGO (excluding Transfers of Indirect Costs) 0.00 0.00 0.0%
OTHER OUTGO - TRANSFERS OF INDIRECT COSTS
Transfers of Indirect Costs - Interfund 7350 0.00 0.00 0.0%
TOTAL, OTHER OUTGO - TRANSFERS OF INDIRECT COSTS 0.00 0.00 0.0%
TOTAL, EXPENDITURES 144,129.00 138,758.00 -3.7%

Pacheco Union ElementaryShasta County
July 1 BudgetCafeteria Special Revenue Fund
Expenditures by Object45 70094 0000000
Form 13
California Dept of EducationSACS Financial Reporting Software - 2017.1.0File: fund-b (Rev 04/07/2017 Page 7 Printed: 5/31/2017 6:07 PM
Description Resource Codes Object Codes2016-17
Estimated Actuals2017-18Budget
PercentDifference
INTERFUND TRANSFERS
INTERFUND TRANSFERS IN
From: General Fund 8916 22,368.00 10,356.00 -53.7%
Other Authorized Interfund Transfers In 8919 0.00 0.00 0.0%
(a) TOTAL, INTERFUND TRANSFERS IN 22,368.00 10,356.00 -53.7%
INTERFUND TRANSFERS OUT
Other Authorized Interfund Transfers Out 7619 0.00 0.00 0.0%
(b) TOTAL, INTERFUND TRANSFERS OUT 0.00 0.00 0.0%
OTHER SOURCES/USES
SOURCES
Other Sources
Transfers from Funds of Lapsed/Reorganized LEAs 8965 0.00 0.00 0.0%
Long-Term Debt Proceeds
Proceeds from Capital Leases 8972 0.00 0.00 0.0%
All Other Financing Sources 8979 0.00 0.00 0.0%
(c) TOTAL, SOURCES 0.00 0.00 0.0%
USES
Transfers of Funds from Lapsed/Reorganized LEAs 7651 0.00 0.00 0.0%
All Other Financing Uses 7699 0.00 0.00 0.0%
(d) TOTAL, USES 0.00 0.00 0.0%
CONTRIBUTIONS
Contributions from Unrestricted Revenues 8980 0.00 0.00 0.0%
Contributions from Restricted Revenues 8990 0.00 0.00 0.0%
(e) TOTAL, CONTRIBUTIONS 0.00 0.00 0.0%
TOTAL, OTHER FINANCING SOURCES/USES (a - b + c - d + e) 22,368.00 10,356.00 -53.7%

Pacheco Union ElementaryShasta County
July 1 BudgetCafeteria Special Revenue Fund
Expenditures by Function45 70094 0000000
Form 13
California Dept of EducationSACS Financial Reporting Software - 2017.1.0File: fund-b (Rev 03/08/2016) Page 1 Printed: 5/31/2017 6:07 PM
Description Function Codes Object Codes2016-17
Estimated Actuals2017-18Budget
PercentDifference
A. REVENUES
1) LCFF Sources 8010-8099 0.00 0.00 0.0%
2) Federal Revenue 8100-8299 0.00 0.00 0.0%
3) Other State Revenue 8300-8599 0.00 0.00 0.0%
4) Other Local Revenue 8600-8799 121,761.00 128,402.00 5.5%
5) TOTAL, REVENUES 121,761.00 128,402.00 5.5%
B. EXPENDITURES (Objects 1000-7999)
1) Instruction 1000-1999 0.00 0.00 0.0%
2) Instruction - Related Services 2000-2999 0.00 0.00 0.0%
3) Pupil Services 3000-3999 129,127.00 123,576.00 -4.3%
4) Ancillary Services 4000-4999 0.00 0.00 0.0%
5) Community Services 5000-5999 0.00 0.00 0.0%
6) Enterprise 6000-6999 0.00 0.00 0.0%
7) General Administration 7000-7999 0.00 0.00 0.0%
8) Plant Services 8000-8999 15,002.00 15,182.00 1.2%
9) Other Outgo 9000-9999Except
7600-7699 0.00 0.00 0.0%
10) TOTAL, EXPENDITURES 144,129.00 138,758.00 -3.7%
C. EXCESS (DEFICIENCY) OF REVENUES OVER EXPENDITURES BEFORE OTHER FINANCING SOURCES AND USES (A5 - B10) (22,368.00) (10,356.00) -53.7%
D. OTHER FINANCING SOURCES/USES 1) Interfund Transfers a) Transfers In 8900-8929 22,368.00 10,356.00 -53.7%
b) Transfers Out 7600-7629 0.00 0.00 0.0%
2) Other Sources/Uses a) Sources 8930-8979 0.00 0.00 0.0%
b) Uses 7630-7699 0.00 0.00 0.0%
3) Contributions 8980-8999 0.00 0.00 0.0%
4) TOTAL, OTHER FINANCING SOURCES/USES 22,368.00 10,356.00 -53.7%
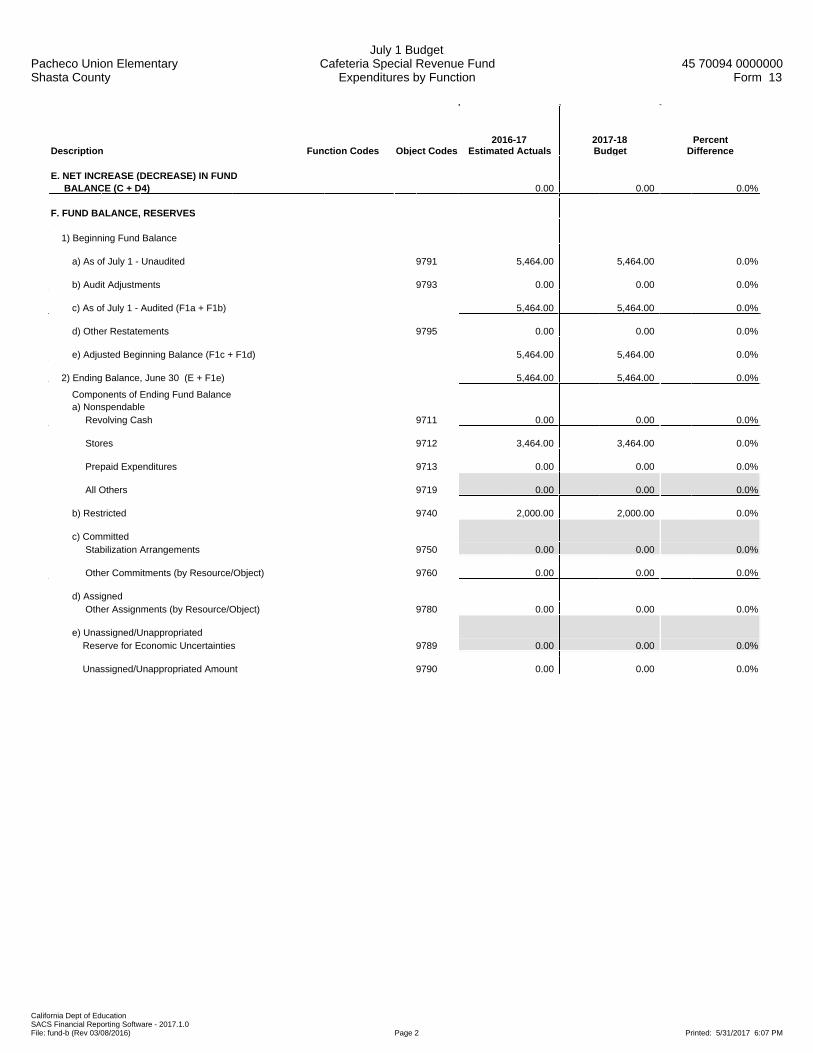
Pacheco Union ElementaryShasta County
July 1 BudgetCafeteria Special Revenue Fund
Expenditures by Function45 70094 0000000
Form 13
California Dept of EducationSACS Financial Reporting Software - 2017.1.0File: fund-b (Rev 03/08/2016) Page 2 Printed: 5/31/2017 6:07 PM
Description Function Codes Object Codes2016-17
Estimated Actuals2017-18Budget
PercentDifference
E. NET INCREASE (DECREASE) IN FUND BALANCE (C + D4) 0.00 0.00 0.0%
F. FUND BALANCE, RESERVES 1) Beginning Fund Balance
a) As of July 1 - Unaudited 9791 5,464.00 5,464.00 0.0%
b) Audit Adjustments 9793 0.00 0.00 0.0%
c) As of July 1 - Audited (F1a + F1b) 5,464.00 5,464.00 0.0%
d) Other Restatements 9795 0.00 0.00 0.0%
e) Adjusted Beginning Balance (F1c + F1d) 5,464.00 5,464.00 0.0%
2) Ending Balance, June 30 (E + F1e) 5,464.00 5,464.00 0.0%
Components of Ending Fund Balance a) Nonspendable Revolving Cash 9711 0.00 0.00 0.0%
Stores 9712 3,464.00 3,464.00 0.0%
Prepaid Expenditures 9713 0.00 0.00 0.0%
All Others 9719 0.00 0.00 0.0%
b) Restricted 9740 2,000.00 2,000.00 0.0%
c) Committed Stabilization Arrangements 9750 0.00 0.00 0.0%
Other Commitments (by Resource/Object) 9760 0.00 0.00 0.0%
d) Assigned Other Assignments (by Resource/Object) 9780 0.00 0.00 0.0%
e) Unassigned/Unappropriated Reserve for Economic Uncertainties 9789 0.00 0.00 0.0%
Unassigned/Unappropriated Amount 9790 0.00 0.00 0.0%

Pacheco Union ElementaryShasta County
July 1 BudgetCafeteria Special Revenue FundExhibit: Restricted Balance Detail
45 70094 0000000Form 13
California Dept of EducationSACS Financial Reporting Software - 2017.1.0File: fund-b (Rev 11/14/2012) Page 1 Printed: 5/31/2017 6:07 PM
2016-17 2017-18Resource Description Estimated Actuals Budget
9010 Other Restricted Local 2,000.00 2,000.00
Total, Restricted Balance 2,000.00 2,000.00

Pacheco Union ElementaryShasta County
July 1 BudgetBuilding Fund
Expenditures by Object45 70094 0000000
Form 21
California Dept of EducationSACS Financial Reporting Software - 2017.1.0File: fund-d (Rev 02/02/2016) Page 1 Printed: 5/31/2017 6:07 PM
Description Resource Codes Object Codes2016-17
Estimated Actuals2017-18Budget
PercentDifference
A. REVENUES
1) LCFF Sources 8010-8099 0.00 0.00 0.0%
2) Federal Revenue 8100-8299 0.00 0.00 0.0%
3) Other State Revenue 8300-8599 0.00 0.00 0.0%
4) Other Local Revenue 8600-8799 1,500.00 1,500.00 0.0%
5) TOTAL, REVENUES 1,500.00 1,500.00 0.0%
B. EXPENDITURES
1) Certificated Salaries 1000-1999 0.00 0.00 0.0%
2) Classified Salaries 2000-2999 0.00 0.00 0.0%
3) Employee Benefits 3000-3999 0.00 0.00 0.0%
4) Books and Supplies 4000-4999 0.00 0.00 0.0%
5) Services and Other Operating Expenditures 5000-5999 3,500.00 3,500.00 0.0%
6) Capital Outlay 6000-6999 200,000.00 66,048.00 -67.0%
7) Other Outgo (excluding Transfers of Indirect 7100-7299, Costs) 7400-7499 0.00 0.00 0.0%
8) Other Outgo - Transfers of Indirect Costs 7300-7399 0.00 0.00 0.0%
9) TOTAL, EXPENDITURES 203,500.00 69,548.00 -65.8%
C. EXCESS (DEFICIENCY) OF REVENUES OVER EXPENDITURES BEFORE OTHER FINANCING SOURCES AND USES (A5 - B9) (202,000.00) (68,048.00) -66.3%
D. OTHER FINANCING SOURCES/USES 1) Interfund Transfers a) Transfers In 8900-8929 0.00 0.00 0.0%
b) Transfers Out 7600-7629 0.00 0.00 0.0%
2) Other Sources/Uses a) Sources 8930-8979 0.00 0.00 0.0%
b) Uses 7630-7699 0.00 0.00 0.0%
3) Contributions 8980-8999 0.00 0.00 0.0%
4) TOTAL, OTHER FINANCING SOURCES/USES 0.00 0.00 0.0%

Pacheco Union ElementaryShasta County
July 1 BudgetBuilding Fund
Expenditures by Object45 70094 0000000
Form 21
California Dept of EducationSACS Financial Reporting Software - 2017.1.0File: fund-d (Rev 02/02/2016) Page 2 Printed: 5/31/2017 6:07 PM
Description Resource Codes Object Codes2016-17
Estimated Actuals2017-18Budget
PercentDifference
E. NET INCREASE (DECREASE) IN FUND BALANCE (C + D4) (202,000.00) (68,048.00) -66.3%
F. FUND BALANCE, RESERVES 1) Beginning Fund Balance a) As of July 1 - Unaudited 9791 270,048.00 68,048.00 -74.8%
b) Audit Adjustments 9793 0.00 0.00 0.0%
c) As of July 1 - Audited (F1a + F1b) 270,048.00 68,048.00 -74.8%
d) Other Restatements 9795 0.00 0.00 0.0%
e) Adjusted Beginning Balance (F1c + F1d) 270,048.00 68,048.00 -74.8%
2) Ending Balance, June 30 (E + F1e) 68,048.00 0.00 -100.0% Components of Ending Fund Balance a) Nonspendable Revolving Cash 9711 0.00 0.00 0.0%
Stores 9712 0.00 0.00 0.0%
Prepaid Expenditures 9713 0.00 0.00 0.0%
All Others 9719 0.00 0.00 0.0%
b) Restricted 9740 0.00 0.00 0.0%
c) Committed Stabilization Arrangements 9750 0.00 0.00 0.0%
Other Commitments 9760 0.00 0.00 0.0%
d) Assigned Other Assignments 9780 68,048.00 0.00 -100.0%
e) Unassigned/Unappropriated Reserve for Economic Uncertainties 9789 0.00 0.00 0.0%
Unassigned/Unappropriated Amount 9790 0.00 0.00 0.0%

Pacheco Union ElementaryShasta County
July 1 BudgetBuilding Fund
Expenditures by Object45 70094 0000000
Form 21
California Dept of EducationSACS Financial Reporting Software - 2017.1.0File: fund-d (Rev 02/02/2016) Page 3 Printed: 5/31/2017 6:07 PM
Description Resource Codes Object Codes2016-17
Estimated Actuals2017-18Budget
PercentDifference
G. ASSETS 1) Cash a) in County Treasury 9110 0.00
1) Fair Value Adjustment to Cash in County Treasury 9111 0.00
b) in Banks 9120 0.00
c) in Revolving Fund 9130 0.00
d) with Fiscal Agent 9135 0.00
e) collections awaiting deposit 9140 0.00
2) Investments 9150 0.00
3) Accounts Receivable 9200 0.00
4) Due from Grantor Government 9290 0.00
5) Due from Other Funds 9310 0.00
6) Stores 9320 0.00
7) Prepaid Expenditures 9330 0.00
8) Other Current Assets 9340 0.00
9) TOTAL, ASSETS 0.00
H. DEFERRED OUTFLOWS OF RESOURCES
1) Deferred Outflows of Resources 9490 0.00
2) TOTAL, DEFERRED OUTFLOWS 0.00
I. LIABILITIES
1) Accounts Payable 9500 0.00
2) Due to Grantor Governments 9590 0.00
3) Due to Other Funds 9610 0.00
4) Current Loans 9640 0.00
5) Unearned Revenue 9650 0.00
6) TOTAL, LIABILITIES 0.00
J. DEFERRED INFLOWS OF RESOURCES
1) Deferred Inflows of Resources 9690 0.00
2) TOTAL, DEFERRED INFLOWS 0.00
K. FUND EQUITY
Ending Fund Balance, June 30 (G9 + H2) - (I6 + J2) 0.00

Pacheco Union ElementaryShasta County
July 1 BudgetBuilding Fund
Expenditures by Object45 70094 0000000
Form 21
California Dept of EducationSACS Financial Reporting Software - 2017.1.0File: fund-d (Rev 02/02/2016) Page 4 Printed: 5/31/2017 6:07 PM
Description Resource Codes Object Codes2016-17
Estimated Actuals2017-18Budget
PercentDifference
FEDERAL REVENUE
FEMA 8281 0.00 0.00 0.0%
All Other Federal Revenue 8290 0.00 0.00 0.0%
TOTAL, FEDERAL REVENUE 0.00 0.00 0.0%
OTHER STATE REVENUE
Tax Relief Subventions Restricted Levies - Other
Homeowners' Exemptions 8575 0.00 0.00 0.0%
Other Subventions/In-Lieu Taxes 8576 0.00 0.00 0.0%
All Other State Revenue 8590 0.00 0.00 0.0%
TOTAL, OTHER STATE REVENUE 0.00 0.00 0.0%
OTHER LOCAL REVENUE
Other Local Revenue County and District Taxes
Other Restricted Levies Secured Roll 8615 0.00 0.00 0.0%
Unsecured Roll 8616 0.00 0.00 0.0%
Prior Years' Taxes 8617 0.00 0.00 0.0%
Supplemental Taxes 8618 0.00 0.00 0.0%
Non-Ad Valorem Taxes Parcel Taxes 8621 0.00 0.00 0.0%
Other 8622 0.00 0.00 0.0%
Community Redevelopment Funds Not Subject to LCFF Deduction 8625 0.00 0.00 0.0%
Penalties and Interest from Delinquent Non-LCFF Taxes 8629 0.00 0.00 0.0%
Sales Sale of Equipment/Supplies 8631 0.00 0.00 0.0%
Leases and Rentals 8650 0.00 0.00 0.0%
Interest 8660 1,500.00 1,500.00 0.0%
Net Increase (Decrease) in the Fair Value of Investments 8662 0.00 0.00 0.0%
Other Local Revenue
All Other Local Revenue 8699 0.00 0.00 0.0%
All Other Transfers In from All Others 8799 0.00 0.00 0.0%
TOTAL, OTHER LOCAL REVENUE 1,500.00 1,500.00 0.0%
TOTAL, REVENUES 1,500.00 1,500.00 0.0%

Pacheco Union ElementaryShasta County
July 1 BudgetBuilding Fund
Expenditures by Object45 70094 0000000
Form 21
California Dept of EducationSACS Financial Reporting Software - 2017.1.0File: fund-d (Rev 02/02/2016) Page 5 Printed: 5/31/2017 6:07 PM
Description Resource Codes Object Codes2016-17
Estimated Actuals2017-18Budget
PercentDifference
CLASSIFIED SALARIES
Classified Support Salaries 2200 0.00 0.00 0.0%
Classified Supervisors' and Administrators' Salaries 2300 0.00 0.00 0.0%
Clerical, Technical and Office Salaries 2400 0.00 0.00 0.0%
Other Classified Salaries 2900 0.00 0.00 0.0%
TOTAL, CLASSIFIED SALARIES 0.00 0.00 0.0%
EMPLOYEE BENEFITS
STRS 3101-3102 0.00 0.00 0.0%
PERS 3201-3202 0.00 0.00 0.0%
OASDI/Medicare/Alternative 3301-3302 0.00 0.00 0.0%
Health and Welfare Benefits 3401-3402 0.00 0.00 0.0%
Unemployment Insurance 3501-3502 0.00 0.00 0.0%
Workers' Compensation 3601-3602 0.00 0.00 0.0%
OPEB, Allocated 3701-3702 0.00 0.00 0.0%
OPEB, Active Employees 3751-3752 0.00 0.00 0.0%
Other Employee Benefits 3901-3902 0.00 0.00 0.0%
TOTAL, EMPLOYEE BENEFITS 0.00 0.00 0.0%
BOOKS AND SUPPLIES
Books and Other Reference Materials 4200 0.00 0.00 0.0%
Materials and Supplies 4300 0.00 0.00 0.0%
Noncapitalized Equipment 4400 0.00 0.00 0.0%
TOTAL, BOOKS AND SUPPLIES 0.00 0.00 0.0%
SERVICES AND OTHER OPERATING EXPENDITURES
Subagreements for Services 5100 0.00 0.00 0.0%
Travel and Conferences 5200 0.00 0.00 0.0%
Insurance 5400-5450 0.00 0.00 0.0%
Operations and Housekeeping Services 5500 0.00 0.00 0.0%
Rentals, Leases, Repairs, and Noncapitalized Improvements 5600 0.00 0.00 0.0%
Transfers of Direct Costs 5710 0.00 0.00 0.0%
Transfers of Direct Costs - Interfund 5750 0.00 0.00 0.0%

Pacheco Union ElementaryShasta County
July 1 BudgetBuilding Fund
Expenditures by Object45 70094 0000000
Form 21
California Dept of EducationSACS Financial Reporting Software - 2017.1.0File: fund-d (Rev 02/02/2016) Page 6 Printed: 5/31/2017 6:07 PM
Description Resource Codes Object Codes2016-17
Estimated Actuals2017-18Budget
PercentDifference
Professional/Consulting Services and Operating Expenditures 5800 3,500.00 3,500.00 0.0%
Communications 5900 0.00 0.00 0.0%
TOTAL, SERVICES AND OTHER OPERATING EXPENDITURES 3,500.00 3,500.00 0.0%
CAPITAL OUTLAY
Land 6100 0.00 0.00 0.0%
Land Improvements 6170 100,000.00 66,048.00 -34.0%
Buildings and Improvements of Buildings 6200 100,000.00 0.00 -100.0%
Books and Media for New School Libraries
or Major Expansion of School Libraries 6300 0.00 0.00 0.0%
Equipment 6400 0.00 0.00 0.0%
Equipment Replacement 6500 0.00 0.00 0.0%
TOTAL, CAPITAL OUTLAY 200,000.00 66,048.00 -67.0%
OTHER OUTGO (excluding Transfers of Indirect Costs)
Other Transfers Out
All Other Transfers Out to All Others 7299 0.00 0.00 0.0%
Debt Service
Repayment of State School Building Fund Aid - Proceeds from Bonds 7435 0.00 0.00 0.0%
Debt Service - Interest 7438 0.00 0.00 0.0%
Other Debt Service - Principal 7439 0.00 0.00 0.0%
TOTAL, OTHER OUTGO (excluding Transfers of Indirect Costs) 0.00 0.00 0.0%
TOTAL, EXPENDITURES 203,500.00 69,548.00 -65.8%

Pacheco Union ElementaryShasta County
July 1 BudgetBuilding Fund
Expenditures by Object45 70094 0000000
Form 21
California Dept of EducationSACS Financial Reporting Software - 2017.1.0File: fund-d (Rev 02/02/2016) Page 7 Printed: 5/31/2017 6:07 PM
Description Resource Codes Object Codes2016-17
Estimated Actuals2017-18Budget
PercentDifference
INTERFUND TRANSFERS
INTERFUND TRANSFERS IN
Other Authorized Interfund Transfers In 8919 0.00 0.00 0.0%
(a) TOTAL, INTERFUND TRANSFERS IN 0.00 0.00 0.0%
INTERFUND TRANSFERS OUT
To: State School Building Fund/ County School Facilities Fund 7613 0.00 0.00 0.0%
Other Authorized Interfund Transfers Out 7619 0.00 0.00 0.0%
(b) TOTAL, INTERFUND TRANSFERS OUT 0.00 0.00 0.0%

Pacheco Union ElementaryShasta County
July 1 BudgetBuilding Fund
Expenditures by Object45 70094 0000000
Form 21
California Dept of EducationSACS Financial Reporting Software - 2017.1.0File: fund-d (Rev 02/02/2016) Page 8 Printed: 5/31/2017 6:07 PM
Description Resource Codes Object Codes2016-17
Estimated Actuals2017-18Budget
PercentDifference
OTHER SOURCES/USES
SOURCES
Proceeds Proceeds from Sale of Bonds 8951 0.00 0.00 0.0%
Proceeds from Sale/Lease- Purchase of Land/Buildings 8953 0.00 0.00 0.0%
Other Sources County School Bldg Aid 8961 0.00 0.00 0.0%
Transfers from Funds of Lapsed/Reorganized LEAs 8965 0.00 0.00 0.0%
Long-Term Debt Proceeds
Proceeds from Certificates of Participation 8971 0.00 0.00 0.0%
Proceeds from Capital Leases 8972 0.00 0.00 0.0%
Proceeds from Lease Revenue Bonds 8973 0.00 0.00 0.0%
All Other Financing Sources 8979 0.00 0.00 0.0%
(c) TOTAL, SOURCES 0.00 0.00 0.0%
USES
Transfers of Funds from Lapsed/Reorganized LEAs 7651 0.00 0.00 0.0%
All Other Financing Uses 7699 0.00 0.00 0.0%
(d) TOTAL, USES 0.00 0.00 0.0%
CONTRIBUTIONS
Contributions from Unrestricted Revenues 8980 0.00 0.00 0.0%
Contributions from Restricted Revenues 8990 0.00 0.00 0.0%
(e) TOTAL, CONTRIBUTIONS 0.00 0.00 0.0%
TOTAL, OTHER FINANCING SOURCES/USES (a - b + c - d + e) 0.00 0.00 0.0%

Pacheco Union ElementaryShasta County
July 1 BudgetBuilding Fund
Expenditures by Function45 70094 0000000
Form 21
California Dept of EducationSACS Financial Reporting Software - 2017.1.0File: fund-d (Rev 02/02/2016) Page 1 Printed: 5/31/2017 6:07 PM
Description Function Codes Object Codes2016-17
Estimated Actuals2017-18Budget
PercentDifference
A. REVENUES
1) LCFF Sources 8010-8099 0.00 0.00 0.0%
2) Federal Revenue 8100-8299 0.00 0.00 0.0%
3) Other State Revenue 8300-8599 0.00 0.00 0.0%
4) Other Local Revenue 8600-8799 1,500.00 1,500.00 0.0%
5) TOTAL, REVENUES 1,500.00 1,500.00 0.0%
B. EXPENDITURES (Objects 1000-7999)
1) Instruction 1000-1999 0.00 0.00 0.0%
2) Instruction - Related Services 2000-2999 0.00 0.00 0.0%
3) Pupil Services 3000-3999 0.00 0.00 0.0%
4) Ancillary Services 4000-4999 0.00 0.00 0.0%
5) Community Services 5000-5999 0.00 0.00 0.0%
6) Enterprise 6000-6999 0.00 0.00 0.0%
7) General Administration 7000-7999 0.00 0.00 0.0%
8) Plant Services 8000-8999 200,000.00 66,048.00 -67.0%
9) Other Outgo 9000-9999Except
7600-7699 3,500.00 3,500.00 0.0%
10) TOTAL, EXPENDITURES 203,500.00 69,548.00 -65.8%
C. EXCESS (DEFICIENCY) OF REVENUES OVER EXPENDITURES BEFORE OTHER FINANCING SOURCES AND USES (A5 - B10) (202,000.00) (68,048.00) -66.3%
D. OTHER FINANCING SOURCES/USES 1) Interfund Transfers a) Transfers In 8900-8929 0.00 0.00 0.0%
b) Transfers Out 7600-7629 0.00 0.00 0.0%
2) Other Sources/Uses a) Sources 8930-8979 0.00 0.00 0.0%
b) Uses 7630-7699 0.00 0.00 0.0%
3) Contributions 8980-8999 0.00 0.00 0.0%
4) TOTAL, OTHER FINANCING SOURCES/USES 0.00 0.00 0.0%

Pacheco Union ElementaryShasta County
July 1 BudgetBuilding Fund
Expenditures by Function45 70094 0000000
Form 21
California Dept of EducationSACS Financial Reporting Software - 2017.1.0File: fund-d (Rev 02/02/2016) Page 2 Printed: 5/31/2017 6:07 PM
Description Function Codes Object Codes2016-17
Estimated Actuals2017-18Budget
PercentDifference
E. NET INCREASE (DECREASE) IN FUND BALANCE (C + D4) (202,000.00) (68,048.00) -66.3%
F. FUND BALANCE, RESERVES 1) Beginning Fund Balance
a) As of July 1 - Unaudited 9791 270,048.00 68,048.00 -74.8%
b) Audit Adjustments 9793 0.00 0.00 0.0%
c) As of July 1 - Audited (F1a + F1b) 270,048.00 68,048.00 -74.8%
d) Other Restatements 9795 0.00 0.00 0.0%
e) Adjusted Beginning Balance (F1c + F1d) 270,048.00 68,048.00 -74.8%
2) Ending Balance, June 30 (E + F1e) 68,048.00 0.00 -100.0% Components of Ending Fund Balance a) Nonspendable Revolving Cash 9711 0.00 0.00 0.0%
Stores 9712 0.00 0.00 0.0%
Prepaid Expenditures 9713 0.00 0.00 0.0%
All Others 9719 0.00 0.00 0.0%
b) Restricted 9740 0.00 0.00 0.0%
c) Committed Stabilization Arrangements 9750 0.00 0.00 0.0%
Other Commitments (by Resource/Object) 9760 0.00 0.00 0.0%
d) Assigned Other Assignments (by Resource/Object) 9780 68,048.00 0.00 -100.0%
e) Unassigned/Unappropriated Reserve for Economic Uncertainties 9789 0.00 0.00 0.0%
Unassigned/Unappropriated Amount 9790 0.00 0.00 0.0%

Pacheco Union ElementaryShasta County
July 1 BudgetBuilding Fund
Exhibit: Restricted Balance Detail45 70094 0000000
Form 21
California Dept of EducationSACS Financial Reporting Software - 2017.1.0File: fund-d (Rev 04/06/2011) Page 1 Printed: 5/31/2017 6:07 PM
2016-17 2017-18Resource Description Estimated Actuals Budget
Total, Restricted Balance 0.00 0.00

Pacheco Union ElementaryShasta County
July 1 BudgetCapital Facilities FundExpenditures by Object
45 70094 0000000Form 25
California Dept of EducationSACS Financial Reporting Software - 2017.1.0File: fund-d (Rev 02/02/2016) Page 1 Printed: 5/31/2017 6:08 PM
Description Resource Codes Object Codes2016-17
Estimated Actuals2017-18Budget
PercentDifference
A. REVENUES
1) LCFF Sources 8010-8099 0.00 0.00 0.0%
2) Federal Revenue 8100-8299 0.00 0.00 0.0%
3) Other State Revenue 8300-8599 0.00 0.00 0.0%
4) Other Local Revenue 8600-8799 209,288.00 30,100.00 -85.6%
5) TOTAL, REVENUES 209,288.00 30,100.00 -85.6%
B. EXPENDITURES
1) Certificated Salaries 1000-1999 10,000.00 0.00 -100.0%
2) Classified Salaries 2000-2999 0.00 0.00 0.0%
3) Employee Benefits 3000-3999 361.00 0.00 -100.0%
4) Books and Supplies 4000-4999 0.00 0.00 0.0%
5) Services and Other Operating Expenditures 5000-5999 18,115.00 17,395.00 -4.0%
6) Capital Outlay 6000-6999 0.00 0.00 0.0%
7) Other Outgo (excluding Transfers of Indirect 7100-7299, Costs) 7400-7499 0.00 0.00 0.0%
8) Other Outgo - Transfers of Indirect Costs 7300-7399 0.00 0.00 0.0%
9) TOTAL, EXPENDITURES 28,476.00 17,395.00 -38.9%
C. EXCESS (DEFICIENCY) OF REVENUES OVER EXPENDITURES BEFORE OTHER FINANCING SOURCES AND USES (A5 - B9) 180,812.00 12,705.00 -93.0%
D. OTHER FINANCING SOURCES/USES 1) Interfund Transfers a) Transfers In 8900-8929 0.00 0.00 0.0%
b) Transfers Out 7600-7629 0.00 0.00 0.0%
2) Other Sources/Uses a) Sources 8930-8979 0.00 0.00 0.0%
b) Uses 7630-7699 0.00 0.00 0.0%
3) Contributions 8980-8999 0.00 0.00 0.0%
4) TOTAL, OTHER FINANCING SOURCES/USES 0.00 0.00 0.0%

Pacheco Union ElementaryShasta County
July 1 BudgetCapital Facilities FundExpenditures by Object
45 70094 0000000Form 25
California Dept of EducationSACS Financial Reporting Software - 2017.1.0File: fund-d (Rev 02/02/2016) Page 2 Printed: 5/31/2017 6:08 PM
Description Resource Codes Object Codes2016-17
Estimated Actuals2017-18Budget
PercentDifference
E. NET INCREASE (DECREASE) IN FUND BALANCE (C + D4) 180,812.00 12,705.00 -93.0%
F. FUND BALANCE, RESERVES 1) Beginning Fund Balance a) As of July 1 - Unaudited 9791 653,122.00 833,934.00 27.7%
b) Audit Adjustments 9793 0.00 0.00 0.0%
c) As of July 1 - Audited (F1a + F1b) 653,122.00 833,934.00 27.7%
d) Other Restatements 9795 0.00 0.00 0.0%
e) Adjusted Beginning Balance (F1c + F1d) 653,122.00 833,934.00 27.7%
2) Ending Balance, June 30 (E + F1e) 833,934.00 846,639.00 1.5% Components of Ending Fund Balance a) Nonspendable Revolving Cash 9711 0.00 0.00 0.0%
Stores 9712 0.00 0.00 0.0%
Prepaid Expenditures 9713 0.00 0.00 0.0%
All Others 9719 0.00 0.00 0.0%
b) Restricted 9740 0.00 0.00 0.0%
c) Committed Stabilization Arrangements 9750 0.00 0.00 0.0%
Other Commitments 9760 0.00 0.00 0.0%
d) Assigned Other Assignments 9780 833,934.00 846,639.00 1.5%
e) Unassigned/Unappropriated Reserve for Economic Uncertainties 9789 0.00 0.00 0.0%
Unassigned/Unappropriated Amount 9790 0.00 0.00 0.0%

Pacheco Union ElementaryShasta County
July 1 BudgetCapital Facilities FundExpenditures by Object
45 70094 0000000Form 25
California Dept of EducationSACS Financial Reporting Software - 2017.1.0File: fund-d (Rev 02/02/2016) Page 3 Printed: 5/31/2017 6:08 PM
Description Resource Codes Object Codes2016-17
Estimated Actuals2017-18Budget
PercentDifference
G. ASSETS 1) Cash a) in County Treasury 9110 0.00
1) Fair Value Adjustment to Cash in County Treasury 9111 0.00
b) in Banks 9120 0.00
c) in Revolving Fund 9130 0.00
d) with Fiscal Agent 9135 0.00
e) collections awaiting deposit 9140 0.00
2) Investments 9150 0.00
3) Accounts Receivable 9200 0.00
4) Due from Grantor Government 9290 0.00
5) Due from Other Funds 9310 0.00
6) Stores 9320 0.00
7) Prepaid Expenditures 9330 0.00
8) Other Current Assets 9340 0.00
9) TOTAL, ASSETS 0.00
H. DEFERRED OUTFLOWS OF RESOURCES
1) Deferred Outflows of Resources 9490 0.00
2) TOTAL, DEFERRED OUTFLOWS 0.00
I. LIABILITIES
1) Accounts Payable 9500 0.00
2) Due to Grantor Governments 9590 0.00
3) Due to Other Funds 9610 0.00
4) Current Loans 9640 0.00
5) Unearned Revenue 9650 0.00
6) TOTAL, LIABILITIES 0.00
J. DEFERRED INFLOWS OF RESOURCES
1) Deferred Inflows of Resources 9690 0.00
2) TOTAL, DEFERRED INFLOWS 0.00
K. FUND EQUITY
Ending Fund Balance, June 30 (G9 + H2) - (I6 + J2) 0.00

Pacheco Union ElementaryShasta County
July 1 BudgetCapital Facilities FundExpenditures by Object
45 70094 0000000Form 25
California Dept of EducationSACS Financial Reporting Software - 2017.1.0File: fund-d (Rev 02/02/2016) Page 4 Printed: 5/31/2017 6:08 PM
Description Resource Codes Object Codes2016-17
Estimated Actuals2017-18Budget
PercentDifference
OTHER STATE REVENUE
Tax Relief Subventions Restricted Levies - Other
Homeowners' Exemptions 8575 0.00 0.00 0.0%
Other Subventions/In-Lieu Taxes 8576 0.00 0.00 0.0%
All Other State Revenue 8590 0.00 0.00 0.0%
TOTAL, OTHER STATE REVENUE 0.00 0.00 0.0%
OTHER LOCAL REVENUE
Other Local Revenue County and District Taxes
Other Restricted Levies Secured Roll 8615 0.00 0.00 0.0%
Unsecured Roll 8616 0.00 0.00 0.0%
Prior Years' Taxes 8617 0.00 0.00 0.0%
Supplemental Taxes 8618 0.00 0.00 0.0%
Non-Ad Valorem Taxes Parcel Taxes 8621 0.00 0.00 0.0%
Other 8622 0.00 0.00 0.0%
Community Redevelopment Funds Not Subject to LCFF Deduction 8625 29,600.00 29,600.00 0.0%
Penalties and Interest from Delinquent Non-LCFF Taxes 8629 0.00 0.00 0.0%
Sales Sale of Equipment/Supplies 8631 0.00 0.00 0.0%
Interest 8660 500.00 500.00 0.0%
Net Increase (Decrease) in the Fair Value of Investments 8662 0.00 0.00 0.0%
Fees and Contracts
Mitigation/Developer Fees 8681 179,188.00 0.00 -100.0%
Other Local Revenue
All Other Local Revenue 8699 0.00 0.00 0.0%
All Other Transfers In from All Others 8799 0.00 0.00 0.0%
TOTAL, OTHER LOCAL REVENUE 209,288.00 30,100.00 -85.6%
TOTAL, REVENUES 209,288.00 30,100.00 -85.6%

Pacheco Union ElementaryShasta County
July 1 BudgetCapital Facilities FundExpenditures by Object
45 70094 0000000Form 25
California Dept of EducationSACS Financial Reporting Software - 2017.1.0File: fund-d (Rev 02/02/2016) Page 5 Printed: 5/31/2017 6:08 PM
Description Resource Codes Object Codes2016-17
Estimated Actuals2017-18Budget
PercentDifference
CERTIFICATED SALARIES
Other Certificated Salaries 1900 10,000.00 0.00 -100.0%
TOTAL, CERTIFICATED SALARIES 10,000.00 0.00 -100.0%
CLASSIFIED SALARIES
Classified Support Salaries 2200 0.00 0.00 0.0%
Classified Supervisors' and Administrators' Salaries 2300 0.00 0.00 0.0%
Clerical, Technical and Office Salaries 2400 0.00 0.00 0.0%
Other Classified Salaries 2900 0.00 0.00 0.0%
TOTAL, CLASSIFIED SALARIES 0.00 0.00 0.0%
EMPLOYEE BENEFITS
STRS 3101-3102 0.00 0.00 0.0%
PERS 3201-3202 0.00 0.00 0.0%
OASDI/Medicare/Alternative 3301-3302 145.00 0.00 -100.0%
Health and Welfare Benefits 3401-3402 0.00 0.00 0.0%
Unemployment Insurance 3501-3502 5.00 0.00 -100.0%
Workers' Compensation 3601-3602 211.00 0.00 -100.0%
OPEB, Allocated 3701-3702 0.00 0.00 0.0%
OPEB, Active Employees 3751-3752 0.00 0.00 0.0%
Other Employee Benefits 3901-3902 0.00 0.00 0.0%
TOTAL, EMPLOYEE BENEFITS 361.00 0.00 -100.0%
BOOKS AND SUPPLIES
Approved Textbooks and Core Curricula Materials 4100 0.00 0.00 0.0%
Books and Other Reference Materials 4200 0.00 0.00 0.0%
Materials and Supplies 4300 0.00 0.00 0.0%
Noncapitalized Equipment 4400 0.00 0.00 0.0%
TOTAL, BOOKS AND SUPPLIES 0.00 0.00 0.0%

Pacheco Union ElementaryShasta County
July 1 BudgetCapital Facilities FundExpenditures by Object
45 70094 0000000Form 25
California Dept of EducationSACS Financial Reporting Software - 2017.1.0File: fund-d (Rev 02/02/2016) Page 6 Printed: 5/31/2017 6:08 PM
Description Resource Codes Object Codes2016-17
Estimated Actuals2017-18Budget
PercentDifference
SERVICES AND OTHER OPERATING EXPENDITURES
Subagreements for Services 5100 0.00 0.00 0.0%
Travel and Conferences 5200 0.00 0.00 0.0%
Insurance 5400-5450 0.00 0.00 0.0%
Operations and Housekeeping Services 5500 0.00 0.00 0.0%
Rentals, Leases, Repairs, and Noncapitalized Improvements 5600 0.00 0.00 0.0%
Transfers of Direct Costs 5710 0.00 0.00 0.0%
Transfers of Direct Costs - Interfund 5750 0.00 0.00 0.0%
Professional/Consulting Services and Operating Expenditures 5800 18,115.00 17,395.00 -4.0%
Communications 5900 0.00 0.00 0.0%
TOTAL, SERVICES AND OTHER OPERATING EXPENDITURES 18,115.00 17,395.00 -4.0%
CAPITAL OUTLAY
Land 6100 0.00 0.00 0.0%
Land Improvements 6170 0.00 0.00 0.0%
Buildings and Improvements of Buildings 6200 0.00 0.00 0.0%
Books and Media for New School Libraries
or Major Expansion of School Libraries 6300 0.00 0.00 0.0%
Equipment 6400 0.00 0.00 0.0%
Equipment Replacement 6500 0.00 0.00 0.0%
TOTAL, CAPITAL OUTLAY 0.00 0.00 0.0%
OTHER OUTGO (excluding Transfers of Indirect Costs)
Other Transfers Out
All Other Transfers Out to All Others 7299 0.00 0.00 0.0%
Debt Service
Debt Service - Interest 7438 0.00 0.00 0.0%
Other Debt Service - Principal 7439 0.00 0.00 0.0%
TOTAL, OTHER OUTGO (excluding Transfers of Indirect Costs) 0.00 0.00 0.0%
TOTAL, EXPENDITURES 28,476.00 17,395.00 -38.9%

Pacheco Union ElementaryShasta County
July 1 BudgetCapital Facilities FundExpenditures by Object
45 70094 0000000Form 25
California Dept of EducationSACS Financial Reporting Software - 2017.1.0File: fund-d (Rev 02/02/2016) Page 7 Printed: 5/31/2017 6:08 PM
Description Resource Codes Object Codes2016-17
Estimated Actuals2017-18Budget
PercentDifference
INTERFUND TRANSFERS
INTERFUND TRANSFERS IN
Other Authorized Interfund Transfers In 8919 0.00 0.00 0.0%
(a) TOTAL, INTERFUND TRANSFERS IN 0.00 0.00 0.0%
INTERFUND TRANSFERS OUT
To: State School Building Fund/ County School Facilities Fund 7613 0.00 0.00 0.0%
Other Authorized Interfund Transfers Out 7619 0.00 0.00 0.0%
(b) TOTAL, INTERFUND TRANSFERS OUT 0.00 0.00 0.0%
OTHER SOURCES/USES
SOURCES
Proceeds
Proceeds from Sale/Lease- Purchase of Land/Buildings 8953 0.00 0.00 0.0%
Other Sources
Transfers from Funds of Lapsed/Reorganized LEAs 8965 0.00 0.00 0.0%
Long-Term Debt Proceeds
Proceeds from Certificates of Participation 8971 0.00 0.00 0.0%
Proceeds from Capital Leases 8972 0.00 0.00 0.0%
Proceeds from Lease Revenue Bonds 8973 0.00 0.00 0.0%
All Other Financing Sources 8979 0.00 0.00 0.0%
(c) TOTAL, SOURCES 0.00 0.00 0.0%
USES
Transfers of Funds from Lapsed/Reorganized LEAs 7651 0.00 0.00 0.0%
All Other Financing Uses 7699 0.00 0.00 0.0%
(d) TOTAL, USES 0.00 0.00 0.0%
CONTRIBUTIONS
Contributions from Unrestricted Revenues 8980 0.00 0.00 0.0%
Contributions from Restricted Revenues 8990 0.00 0.00 0.0%
(e) TOTAL, CONTRIBUTIONS 0.00 0.00 0.0%
TOTAL, OTHER FINANCING SOURCES/USES (a - b + c - d + e) 0.00 0.00 0.0%

Pacheco Union ElementaryShasta County
July 1 BudgetCapital Facilities Fund
Expenditures by Function45 70094 0000000
Form 25
California Dept of EducationSACS Financial Reporting Software - 2017.1.0File: fund-d (Rev 02/02/2016) Page 1 Printed: 5/31/2017 6:08 PM
Description Function Codes Object Codes2016-17
Estimated Actuals2017-18Budget
PercentDifference
A. REVENUES
1) LCFF Sources 8010-8099 0.00 0.00 0.0%
2) Federal Revenue 8100-8299 0.00 0.00 0.0%
3) Other State Revenue 8300-8599 0.00 0.00 0.0%
4) Other Local Revenue 8600-8799 209,288.00 30,100.00 -85.6%
5) TOTAL, REVENUES 209,288.00 30,100.00 -85.6%
B. EXPENDITURES (Objects 1000-7999)
1) Instruction 1000-1999 0.00 0.00 0.0%
2) Instruction - Related Services 2000-2999 0.00 0.00 0.0%
3) Pupil Services 3000-3999 0.00 0.00 0.0%
4) Ancillary Services 4000-4999 0.00 0.00 0.0%
5) Community Services 5000-5999 0.00 0.00 0.0%
6) Enterprise 6000-6999 0.00 0.00 0.0%
7) General Administration 7000-7999 23,301.00 12,220.00 -47.6%
8) Plant Services 8000-8999 0.00 0.00 0.0%
9) Other Outgo 9000-9999Except
7600-7699 5,175.00 5,175.00 0.0%
10) TOTAL, EXPENDITURES 28,476.00 17,395.00 -38.9%
C. EXCESS (DEFICIENCY) OF REVENUES OVER EXPENDITURES BEFORE OTHER FINANCING SOURCES AND USES (A5 - B10) 180,812.00 12,705.00 -93.0%
D. OTHER FINANCING SOURCES/USES 1) Interfund Transfers a) Transfers In 8900-8929 0.00 0.00 0.0%
b) Transfers Out 7600-7629 0.00 0.00 0.0%
2) Other Sources/Uses a) Sources 8930-8979 0.00 0.00 0.0%
b) Uses 7630-7699 0.00 0.00 0.0%
3) Contributions 8980-8999 0.00 0.00 0.0%
4) TOTAL, OTHER FINANCING SOURCES/USES 0.00 0.00 0.0%

Pacheco Union ElementaryShasta County
July 1 BudgetCapital Facilities Fund
Expenditures by Function45 70094 0000000
Form 25
California Dept of EducationSACS Financial Reporting Software - 2017.1.0File: fund-d (Rev 02/02/2016) Page 2 Printed: 5/31/2017 6:08 PM
Description Function Codes Object Codes2016-17
Estimated Actuals2017-18Budget
PercentDifference
E. NET INCREASE (DECREASE) IN FUND BALANCE (C + D4) 180,812.00 12,705.00 -93.0%
F. FUND BALANCE, RESERVES 1) Beginning Fund Balance
a) As of July 1 - Unaudited 9791 653,122.00 833,934.00 27.7%
b) Audit Adjustments 9793 0.00 0.00 0.0%
c) As of July 1 - Audited (F1a + F1b) 653,122.00 833,934.00 27.7%
d) Other Restatements 9795 0.00 0.00 0.0%
e) Adjusted Beginning Balance (F1c + F1d) 653,122.00 833,934.00 27.7%
2) Ending Balance, June 30 (E + F1e) 833,934.00 846,639.00 1.5% Components of Ending Fund Balance a) Nonspendable Revolving Cash 9711 0.00 0.00 0.0%
Stores 9712 0.00 0.00 0.0%
Prepaid Expenditures 9713 0.00 0.00 0.0%
All Others 9719 0.00 0.00 0.0%
b) Restricted 9740 0.00 0.00 0.0%
c) Committed Stabilization Arrangements 9750 0.00 0.00 0.0%
Other Commitments (by Resource/Object) 9760 0.00 0.00 0.0%
d) Assigned Other Assignments (by Resource/Object) 9780 833,934.00 846,639.00 1.5%
e) Unassigned/Unappropriated Reserve for Economic Uncertainties 9789 0.00 0.00 0.0%
Unassigned/Unappropriated Amount 9790 0.00 0.00 0.0%

Pacheco Union ElementaryShasta County
July 1 BudgetCapital Facilities Fund
Exhibit: Restricted Balance Detail45 70094 0000000
Form 25
California Dept of EducationSACS Financial Reporting Software - 2017.1.0File: fund-d (Rev 04/06/2011) Page 1 Printed: 5/31/2017 6:08 PM
2016-17 2017-18Resource Description Estimated Actuals Budget
Total, Restricted Balance 0.00 0.00

Pacheco Union ElementaryShasta County
July 1 BudgetCounty School Facilities Fund
Expenditures by Object45 70094 0000000
Form 35
California Dept of EducationSACS Financial Reporting Software - 2017.1.0File: fund-d (Rev 02/02/2016) Page 1 Printed: 5/31/2017 6:09 PM
Description Resource Codes Object Codes2016-17
Estimated Actuals2017-18Budget
PercentDifference
A. REVENUES
1) LCFF Sources 8010-8099 0.00 0.00 0.0%
2) Federal Revenue 8100-8299 0.00 0.00 0.0%
3) Other State Revenue 8300-8599 0.00 0.00 0.0%
4) Other Local Revenue 8600-8799 80.00 80.00 0.0%
5) TOTAL, REVENUES 80.00 80.00 0.0%
B. EXPENDITURES
1) Certificated Salaries 1000-1999 0.00 0.00 0.0%
2) Classified Salaries 2000-2999 0.00 0.00 0.0%
3) Employee Benefits 3000-3999 0.00 0.00 0.0%
4) Books and Supplies 4000-4999 0.00 0.00 0.0%
5) Services and Other Operating Expenditures 5000-5999 0.00 0.00 0.0%
6) Capital Outlay 6000-6999 0.00 0.00 0.0%
7) Other Outgo (excluding Transfers of Indirect 7100-7299, Costs) 7400-7499 0.00 0.00 0.0%
8) Other Outgo - Transfers of Indirect Costs 7300-7399 0.00 0.00 0.0%
9) TOTAL, EXPENDITURES 0.00 0.00 0.0%
C. EXCESS (DEFICIENCY) OF REVENUES OVER EXPENDITURES BEFORE OTHER FINANCING SOURCES AND USES (A5 - B9) 80.00 80.00 0.0%
D. OTHER FINANCING SOURCES/USES 1) Interfund Transfers a) Transfers In 8900-8929 0.00 0.00 0.0%
b) Transfers Out 7600-7629 0.00 0.00 0.0%
2) Other Sources/Uses a) Sources 8930-8979 0.00 0.00 0.0%
b) Uses 7630-7699 0.00 0.00 0.0%
3) Contributions 8980-8999 0.00 0.00 0.0%
4) TOTAL, OTHER FINANCING SOURCES/USES 0.00 0.00 0.0%
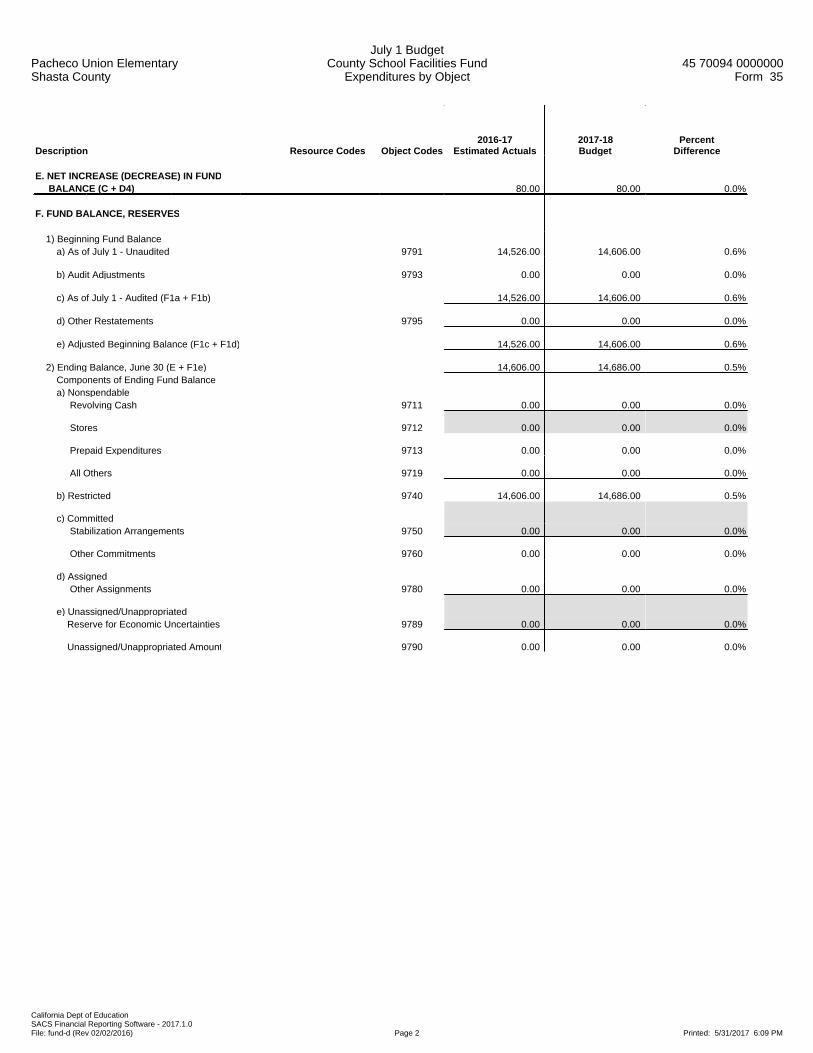
Pacheco Union ElementaryShasta County
July 1 BudgetCounty School Facilities Fund
Expenditures by Object45 70094 0000000
Form 35
California Dept of EducationSACS Financial Reporting Software - 2017.1.0File: fund-d (Rev 02/02/2016) Page 2 Printed: 5/31/2017 6:09 PM
Description Resource Codes Object Codes2016-17
Estimated Actuals2017-18Budget
PercentDifference
E. NET INCREASE (DECREASE) IN FUND BALANCE (C + D4) 80.00 80.00 0.0%
F. FUND BALANCE, RESERVES 1) Beginning Fund Balance a) As of July 1 - Unaudited 9791 14,526.00 14,606.00 0.6%
b) Audit Adjustments 9793 0.00 0.00 0.0%
c) As of July 1 - Audited (F1a + F1b) 14,526.00 14,606.00 0.6%
d) Other Restatements 9795 0.00 0.00 0.0%
e) Adjusted Beginning Balance (F1c + F1d) 14,526.00 14,606.00 0.6%
2) Ending Balance, June 30 (E + F1e) 14,606.00 14,686.00 0.5% Components of Ending Fund Balance a) Nonspendable Revolving Cash 9711 0.00 0.00 0.0%
Stores 9712 0.00 0.00 0.0%
Prepaid Expenditures 9713 0.00 0.00 0.0%
All Others 9719 0.00 0.00 0.0%
b) Restricted 9740 14,606.00 14,686.00 0.5%
c) Committed Stabilization Arrangements 9750 0.00 0.00 0.0%
Other Commitments 9760 0.00 0.00 0.0%
d) Assigned Other Assignments 9780 0.00 0.00 0.0%
e) Unassigned/Unappropriated Reserve for Economic Uncertainties 9789 0.00 0.00 0.0%
Unassigned/Unappropriated Amount 9790 0.00 0.00 0.0%

Pacheco Union ElementaryShasta County
July 1 BudgetCounty School Facilities Fund
Expenditures by Object45 70094 0000000
Form 35
California Dept of EducationSACS Financial Reporting Software - 2017.1.0File: fund-d (Rev 02/02/2016) Page 3 Printed: 5/31/2017 6:09 PM
Description Resource Codes Object Codes2016-17
Estimated Actuals2017-18Budget
PercentDifference
G. ASSETS 1) Cash a) in County Treasury 9110 0.00
1) Fair Value Adjustment to Cash in County Treasury 9111 0.00
b) in Banks 9120 0.00
c) in Revolving Fund 9130 0.00
d) with Fiscal Agent 9135 0.00
e) collections awaiting deposit 9140 0.00
2) Investments 9150 0.00
3) Accounts Receivable 9200 0.00
4) Due from Grantor Government 9290 0.00
5) Due from Other Funds 9310 0.00
6) Stores 9320 0.00
7) Prepaid Expenditures 9330 0.00
8) Other Current Assets 9340 0.00
9) TOTAL, ASSETS 0.00
H. DEFERRED OUTFLOWS OF RESOURCES
1) Deferred Outflows of Resources 9490 0.00
2) TOTAL, DEFERRED OUTFLOWS 0.00
I. LIABILITIES
1) Accounts Payable 9500 0.00
2) Due to Grantor Governments 9590 0.00
3) Due to Other Funds 9610 0.00
4) Current Loans 9640 0.00
5) Unearned Revenue 9650 0.00
6) TOTAL, LIABILITIES 0.00
J. DEFERRED INFLOWS OF RESOURCES
1) Deferred Inflows of Resources 9690 0.00
2) TOTAL, DEFERRED INFLOWS 0.00
K. FUND EQUITY
Ending Fund Balance, June 30 (G9 + H2) - (I6 + J2) 0.00

Pacheco Union ElementaryShasta County
July 1 BudgetCounty School Facilities Fund
Expenditures by Object45 70094 0000000
Form 35
California Dept of EducationSACS Financial Reporting Software - 2017.1.0File: fund-d (Rev 02/02/2016) Page 4 Printed: 5/31/2017 6:09 PM
Description Resource Codes Object Codes2016-17
Estimated Actuals2017-18Budget
PercentDifference
FEDERAL REVENUE
All Other Federal Revenue 8290 0.00 0.00 0.0%
TOTAL, FEDERAL REVENUE 0.00 0.00 0.0%
OTHER STATE REVENUE
School Facilities Apportionments 8545 0.00 0.00 0.0%
Pass-Through Revenues from State Sources 8587 0.00 0.00 0.0%
All Other State Revenue 8590 0.00 0.00 0.0%
TOTAL, OTHER STATE REVENUE 0.00 0.00 0.0%
OTHER LOCAL REVENUE
Sales Sale of Equipment/Supplies 8631 0.00 0.00 0.0%
Leases and Rentals 8650 0.00 0.00 0.0%
Interest 8660 80.00 80.00 0.0%
Net Increase (Decrease) in the Fair Value of Investments 8662 0.00 0.00 0.0%
Other Local Revenue
All Other Local Revenue 8699 0.00 0.00 0.0%
All Other Transfers In from All Others 8799 0.00 0.00 0.0%
TOTAL, OTHER LOCAL REVENUE 80.00 80.00 0.0%
TOTAL, REVENUES 80.00 80.00 0.0%

Pacheco Union ElementaryShasta County
July 1 BudgetCounty School Facilities Fund
Expenditures by Object45 70094 0000000
Form 35
California Dept of EducationSACS Financial Reporting Software - 2017.1.0File: fund-d (Rev 02/02/2016) Page 5 Printed: 5/31/2017 6:09 PM
Description Resource Codes Object Codes2016-17
Estimated Actuals2017-18Budget
PercentDifference
CLASSIFIED SALARIES
Classified Support Salaries 2200 0.00 0.00 0.0%
Classified Supervisors' and Administrators' Salaries 2300 0.00 0.00 0.0%
Clerical, Technical and Office Salaries 2400 0.00 0.00 0.0%
Other Classified Salaries 2900 0.00 0.00 0.0%
TOTAL, CLASSIFIED SALARIES 0.00 0.00 0.0%
EMPLOYEE BENEFITS
STRS 3101-3102 0.00 0.00 0.0%
PERS 3201-3202 0.00 0.00 0.0%
OASDI/Medicare/Alternative 3301-3302 0.00 0.00 0.0%
Health and Welfare Benefits 3401-3402 0.00 0.00 0.0%
Unemployment Insurance 3501-3502 0.00 0.00 0.0%
Workers' Compensation 3601-3602 0.00 0.00 0.0%
OPEB, Allocated 3701-3702 0.00 0.00 0.0%
OPEB, Active Employees 3751-3752 0.00 0.00 0.0%
Other Employee Benefits 3901-3902 0.00 0.00 0.0%
TOTAL, EMPLOYEE BENEFITS 0.00 0.00 0.0%
BOOKS AND SUPPLIES
Books and Other Reference Materials 4200 0.00 0.00 0.0%
Materials and Supplies 4300 0.00 0.00 0.0%
Noncapitalized Equipment 4400 0.00 0.00 0.0%
TOTAL, BOOKS AND SUPPLIES 0.00 0.00 0.0%

Pacheco Union ElementaryShasta County
July 1 BudgetCounty School Facilities Fund
Expenditures by Object45 70094 0000000
Form 35
California Dept of EducationSACS Financial Reporting Software - 2017.1.0File: fund-d (Rev 02/02/2016) Page 6 Printed: 5/31/2017 6:09 PM
Description Resource Codes Object Codes2016-17
Estimated Actuals2017-18Budget
PercentDifference
SERVICES AND OTHER OPERATING EXPENDITURES
Subagreements for Services 5100 0.00 0.00 0.0%
Travel and Conferences 5200 0.00 0.00 0.0%
Insurance 5400-5450 0.00 0.00 0.0%
Operations and Housekeeping Services 5500 0.00 0.00 0.0%
Rentals, Leases, Repairs, and Noncapitalized Improvements 5600 0.00 0.00 0.0%
Transfers of Direct Costs 5710 0.00 0.00 0.0%
Transfers of Direct Costs - Interfund 5750 0.00 0.00 0.0%
Professional/Consulting Services and Operating Expenditures 5800 0.00 0.00 0.0%
Communications 5900 0.00 0.00 0.0%
TOTAL, SERVICES AND OTHER OPERATING EXPENDITURES 0.00 0.00 0.0%
CAPITAL OUTLAY
Land 6100 0.00 0.00 0.0%
Land Improvements 6170 0.00 0.00 0.0%
Buildings and Improvements of Buildings 6200 0.00 0.00 0.0%
Books and Media for New School Libraries
or Major Expansion of School Libraries 6300 0.00 0.00 0.0%
Equipment 6400 0.00 0.00 0.0%
Equipment Replacement 6500 0.00 0.00 0.0%
TOTAL, CAPITAL OUTLAY 0.00 0.00 0.0%
OTHER OUTGO (excluding Transfers of Indirect Costs)
Other Transfers Out
Transfers of Pass-Through Revenues To Districts or Charter Schools 7211 0.00 0.00 0.0%
To County Offices 7212 0.00 0.00 0.0%
To JPAs 7213 0.00 0.00 0.0%
All Other Transfers Out to All Others 7299 0.00 0.00 0.0%
Debt Service
Debt Service - Interest 7438 0.00 0.00 0.0%
Other Debt Service - Principal 7439 0.00 0.00 0.0%
TOTAL, OTHER OUTGO (excluding Transfers of Indirect Costs) 0.00 0.00 0.0%
TOTAL, EXPENDITURES 0.00 0.00 0.0%

Pacheco Union ElementaryShasta County
July 1 BudgetCounty School Facilities Fund
Expenditures by Object45 70094 0000000
Form 35
California Dept of EducationSACS Financial Reporting Software - 2017.1.0File: fund-d (Rev 02/02/2016) Page 7 Printed: 5/31/2017 6:09 PM
Description Resource Codes Object Codes2016-17
Estimated Actuals2017-18Budget
PercentDifference
INTERFUND TRANSFERS
INTERFUND TRANSFERS IN
To: State School Building Fund/ County School Facilities Fund From: All Other Funds 8913 0.00 0.00 0.0%
Other Authorized Interfund Transfers In 8919 0.00 0.00 0.0%
(a) TOTAL, INTERFUND TRANSFERS IN 0.00 0.00 0.0%
INTERFUND TRANSFERS OUT
To: State School Building Fund/ County School Facilities Fund 7613 0.00 0.00 0.0%
Other Authorized Interfund Transfers Out 7619 0.00 0.00 0.0%
(b) TOTAL, INTERFUND TRANSFERS OUT 0.00 0.00 0.0%

Pacheco Union ElementaryShasta County
July 1 BudgetCounty School Facilities Fund
Expenditures by Object45 70094 0000000
Form 35
California Dept of EducationSACS Financial Reporting Software - 2017.1.0File: fund-d (Rev 02/02/2016) Page 8 Printed: 5/31/2017 6:09 PM
Description Resource Codes Object Codes2016-17
Estimated Actuals2017-18Budget
PercentDifference
OTHER SOURCES/USES
SOURCES
Proceeds
Proceeds from Sale/Lease- Purchase of Land/Buildings 8953 0.00 0.00 0.0%
Other Sources
Transfers from Funds of Lapsed/Reorganized LEAs 8965 0.00 0.00 0.0%
Long-Term Debt Proceeds
Proceeds from Certificates of Participation 8971 0.00 0.00 0.0%
Proceeds from Capital Leases 8972 0.00 0.00 0.0%
Proceeds from Lease Revenue Bonds 8973 0.00 0.00 0.0%
All Other Financing Sources 8979 0.00 0.00 0.0%
(c) TOTAL, SOURCES 0.00 0.00 0.0%
USES
Transfers of Funds from Lapsed/Reorganized LEAs 7651 0.00 0.00 0.0%
(d) TOTAL, USES 0.00 0.00 0.0%
CONTRIBUTIONS
Contributions from Unrestricted Revenues 8980 0.00 0.00 0.0%
Contributions from Restricted Revenues 8990 0.00 0.00 0.0%
(e) TOTAL, CONTRIBUTIONS 0.00 0.00 0.0%
TOTAL, OTHER FINANCING SOURCES/USES (a - b + c - d + e) 0.00 0.00 0.0%

Pacheco Union ElementaryShasta County
July 1 BudgetCounty School Facilities Fund
Expenditures by Function45 70094 0000000
Form 35
California Dept of EducationSACS Financial Reporting Software - 2017.1.0File: fund-d (Rev 02/02/2016) Page 1 Printed: 5/31/2017 6:09 PM
Description Function Codes Object Codes2016-17
Estimated Actuals2017-18Budget
PercentDifference
A. REVENUES
1) LCFF Sources 8010-8099 0.00 0.00 0.0%
2) Federal Revenue 8100-8299 0.00 0.00 0.0%
3) Other State Revenue 8300-8599 0.00 0.00 0.0%
4) Other Local Revenue 8600-8799 80.00 80.00 0.0%
5) TOTAL, REVENUES 80.00 80.00 0.0%
B. EXPENDITURES (Objects 1000-7999)
1) Instruction 1000-1999 0.00 0.00 0.0%
2) Instruction - Related Services 2000-2999 0.00 0.00 0.0%
3) Pupil Services 3000-3999 0.00 0.00 0.0%
4) Ancillary Services 4000-4999 0.00 0.00 0.0%
5) Community Services 5000-5999 0.00 0.00 0.0%
6) Enterprise 6000-6999 0.00 0.00 0.0%
7) General Administration 7000-7999 0.00 0.00 0.0%
8) Plant Services 8000-8999 0.00 0.00 0.0%
9) Other Outgo 9000-9999Except
7600-7699 0.00 0.00 0.0%
10) TOTAL, EXPENDITURES 0.00 0.00 0.0%
C. EXCESS (DEFICIENCY) OF REVENUES OVER EXPENDITURES BEFORE OTHER FINANCING SOURCES AND USES (A5 - B10) 80.00 80.00 0.0%
D. OTHER FINANCING SOURCES/USES 1) Interfund Transfers a) Transfers In 8900-8929 0.00 0.00 0.0%
b) Transfers Out 7600-7629 0.00 0.00 0.0%
2) Other Sources/Uses a) Sources 8930-8979 0.00 0.00 0.0%
b) Uses 7630-7699 0.00 0.00 0.0%
3) Contributions 8980-8999 0.00 0.00 0.0%
4) TOTAL, OTHER FINANCING SOURCES/USES 0.00 0.00 0.0%

Pacheco Union ElementaryShasta County
July 1 BudgetCounty School Facilities Fund
Expenditures by Function45 70094 0000000
Form 35
California Dept of EducationSACS Financial Reporting Software - 2017.1.0File: fund-d (Rev 02/02/2016) Page 2 Printed: 5/31/2017 6:09 PM
Description Function Codes Object Codes2016-17
Estimated Actuals2017-18Budget
PercentDifference
E. NET INCREASE (DECREASE) IN FUND BALANCE (C + D4) 80.00 80.00 0.0%
F. FUND BALANCE, RESERVES 1) Beginning Fund Balance
a) As of July 1 - Unaudited 9791 14,526.00 14,606.00 0.6%
b) Audit Adjustments 9793 0.00 0.00 0.0%
c) As of July 1 - Audited (F1a + F1b) 14,526.00 14,606.00 0.6%
d) Other Restatements 9795 0.00 0.00 0.0%
e) Adjusted Beginning Balance (F1c + F1d) 14,526.00 14,606.00 0.6%
2) Ending Balance, June 30 (E + F1e) 14,606.00 14,686.00 0.5% Components of Ending Fund Balance a) Nonspendable Revolving Cash 9711 0.00 0.00 0.0%
Stores 9712 0.00 0.00 0.0%
Prepaid Expenditures 9713 0.00 0.00 0.0%
All Others 9719 0.00 0.00 0.0%
b) Restricted 9740 14,606.00 14,686.00 0.5%
c) Committed Stabilization Arrangements 9750 0.00 0.00 0.0%
Other Commitments (by Resource/Object) 9760 0.00 0.00 0.0%
d) Assigned Other Assignments (by Resource/Object) 9780 0.00 0.00 0.0%
e) Unassigned/Unappropriated Reserve for Economic Uncertainties 9789 0.00 0.00 0.0%
Unassigned/Unappropriated Amount 9790 0.00 0.00 0.0%

Pacheco Union ElementaryShasta County
July 1 BudgetCounty School Facilities Fund
Exhibit: Restricted Balance Detail45 70094 0000000
Form 35
California Dept of EducationSACS Financial Reporting Software - 2017.1.0File: fund-d (Rev 04/06/2011) Page 1 Printed: 5/31/2017 6:09 PM
2016-17 2017-18Resource Description Estimated Actuals Budget
7710 State School Facilities Projects 14,606.00 14,686.00
Total, Restricted Balance 14,606.00 14,686.00

Pacheco Union ElementaryShasta County
July 1 BudgetSpecial Reserve Fund for Capital Outlay Projects
Expenditures by Object45 70094 0000000
Form 40
California Dept of EducationSACS Financial Reporting Software - 2017.1.0File: fund-d (Rev 02/02/2016) Page 1 Printed: 5/31/2017 6:11 PM
Description Resource Codes Object Codes2016-17
Estimated Actuals2017-18Budget
PercentDifference
A. REVENUES
1) LCFF Sources 8010-8099 0.00 0.00 0.0%
2) Federal Revenue 8100-8299 0.00 0.00 0.0%
3) Other State Revenue 8300-8599 0.00 0.00 0.0%
4) Other Local Revenue 8600-8799 50.00 50.00 0.0%
5) TOTAL, REVENUES 50.00 50.00 0.0%
B. EXPENDITURES
1) Certificated Salaries 1000-1999 0.00 0.00 0.0%
2) Classified Salaries 2000-2999 0.00 0.00 0.0%
3) Employee Benefits 3000-3999 0.00 0.00 0.0%
4) Books and Supplies 4000-4999 0.00 0.00 0.0%
5) Services and Other Operating Expenditures 5000-5999 0.00 0.00 0.0%
6) Capital Outlay 6000-6999 0.00 0.00 0.0%
7) Other Outgo (excluding Transfers of Indirect 7100-7299, Costs) 7400-7499 0.00 0.00 0.0%
8) Other Outgo - Transfers of Indirect Costs 7300-7399 0.00 0.00 0.0%
9) TOTAL, EXPENDITURES 0.00 0.00 0.0%
C. EXCESS (DEFICIENCY) OF REVENUES OVER EXPENDITURES BEFORE OTHER FINANCING SOURCES AND USES (A5 - B9) 50.00 50.00 0.0%
D. OTHER FINANCING SOURCES/USES 1) Interfund Transfers a) Transfers In 8900-8929 0.00 0.00 0.0%
b) Transfers Out 7600-7629 0.00 0.00 0.0%
2) Other Sources/Uses a) Sources 8930-8979 0.00 0.00 0.0%
b) Uses 7630-7699 0.00 0.00 0.0%
3) Contributions 8980-8999 0.00 0.00 0.0%
4) TOTAL, OTHER FINANCING SOURCES/USES 0.00 0.00 0.0%

Pacheco Union ElementaryShasta County
July 1 BudgetSpecial Reserve Fund for Capital Outlay Projects
Expenditures by Object45 70094 0000000
Form 40
California Dept of EducationSACS Financial Reporting Software - 2017.1.0File: fund-d (Rev 02/02/2016) Page 2 Printed: 5/31/2017 6:11 PM
Description Resource Codes Object Codes2016-17
Estimated Actuals2017-18Budget
PercentDifference
E. NET INCREASE (DECREASE) IN FUND BALANCE (C + D4) 50.00 50.00 0.0%
F. FUND BALANCE, RESERVES 1) Beginning Fund Balance a) As of July 1 - Unaudited 9791 4,002.00 4,052.00 1.2%
b) Audit Adjustments 9793 0.00 0.00 0.0%
c) As of July 1 - Audited (F1a + F1b) 4,002.00 4,052.00 1.2%
d) Other Restatements 9795 0.00 0.00 0.0%
e) Adjusted Beginning Balance (F1c + F1d) 4,002.00 4,052.00 1.2%
2) Ending Balance, June 30 (E + F1e) 4,052.00 4,102.00 1.2% Components of Ending Fund Balance a) Nonspendable Revolving Cash 9711 0.00 0.00 0.0%
Stores 9712 0.00 0.00 0.0%
Prepaid Expenditures 9713 0.00 0.00 0.0%
All Others 9719 0.00 0.00 0.0%
b) Restricted 9740 0.00 0.00 0.0%
c) Committed Stabilization Arrangements 9750 0.00 0.00 0.0%
Other Commitments 9760 0.00 0.00 0.0%
d) Assigned Other Assignments 9780 4,052.00 4,102.00 1.2%
e) Unassigned/Unappropriated Reserve for Economic Uncertainties 9789 0.00 0.00 0.0%
Unassigned/Unappropriated Amount 9790 0.00 0.00 0.0%

Pacheco Union ElementaryShasta County
July 1 BudgetSpecial Reserve Fund for Capital Outlay Projects
Expenditures by Object45 70094 0000000
Form 40
California Dept of EducationSACS Financial Reporting Software - 2017.1.0File: fund-d (Rev 02/02/2016) Page 3 Printed: 5/31/2017 6:11 PM
Description Resource Codes Object Codes2016-17
Estimated Actuals2017-18Budget
PercentDifference
G. ASSETS 1) Cash a) in County Treasury 9110 0.00
1) Fair Value Adjustment to Cash in County Treasury 9111 0.00
b) in Banks 9120 0.00
c) in Revolving Fund 9130 0.00
d) with Fiscal Agent 9135 0.00
e) collections awaiting deposit 9140 0.00
2) Investments 9150 0.00
3) Accounts Receivable 9200 0.00
4) Due from Grantor Government 9290 0.00
5) Due from Other Funds 9310 0.00
6) Stores 9320 0.00
7) Prepaid Expenditures 9330 0.00
8) Other Current Assets 9340 0.00
9) TOTAL, ASSETS 0.00
H. DEFERRED OUTFLOWS OF RESOURCES
1) Deferred Outflows of Resources 9490 0.00
2) TOTAL, DEFERRED OUTFLOWS 0.00
I. LIABILITIES
1) Accounts Payable 9500 0.00
2) Due to Grantor Governments 9590 0.00
3) Due to Other Funds 9610 0.00
4) Current Loans 9640 0.00
5) Unearned Revenue 9650 0.00
6) TOTAL, LIABILITIES 0.00
J. DEFERRED INFLOWS OF RESOURCES
1) Deferred Inflows of Resources 9690 0.00
2) TOTAL, DEFERRED INFLOWS 0.00
K. FUND EQUITY
Ending Fund Balance, June 30 (G9 + H2) - (I6 + J2) 0.00

Pacheco Union ElementaryShasta County
July 1 BudgetSpecial Reserve Fund for Capital Outlay Projects
Expenditures by Object45 70094 0000000
Form 40
California Dept of EducationSACS Financial Reporting Software - 2017.1.0File: fund-d (Rev 02/02/2016) Page 4 Printed: 5/31/2017 6:11 PM
Description Resource Codes Object Codes2016-17
Estimated Actuals2017-18Budget
PercentDifference
FEDERAL REVENUE
FEMA 8281 0.00 0.00 0.0%
All Other Federal Revenue 8290 0.00 0.00 0.0%
TOTAL, FEDERAL REVENUE 0.00 0.00 0.0%
OTHER STATE REVENUE
Pass-Through Revenues from State Sources 8587 0.00 0.00 0.0%
California Clean Energy Jobs Act 6230 8590 0.00 0.00 0.0%
All Other State Revenue All Other 8590 0.00 0.00 0.0%
TOTAL, OTHER STATE REVENUE 0.00 0.00 0.0%
OTHER LOCAL REVENUE
Other Local Revenue
Community Redevelopment Funds Not Subject to LCFF Deduction 8625 0.00 0.00 0.0%
Sales Sale of Equipment/Supplies 8631 0.00 0.00 0.0%
Leases and Rentals 8650 0.00 0.00 0.0%
Interest 8660 50.00 50.00 0.0%
Net Increase (Decrease) in the Fair Value of Investments 8662 0.00 0.00 0.0%
Other Local Revenue
All Other Local Revenue 8699 0.00 0.00 0.0%
All Other Transfers In from All Others 8799 0.00 0.00 0.0%
TOTAL, OTHER LOCAL REVENUE 50.00 50.00 0.0%
TOTAL, REVENUES 50.00 50.00 0.0%

Pacheco Union ElementaryShasta County
July 1 BudgetSpecial Reserve Fund for Capital Outlay Projects
Expenditures by Object45 70094 0000000
Form 40
California Dept of EducationSACS Financial Reporting Software - 2017.1.0File: fund-d (Rev 02/02/2016) Page 5 Printed: 5/31/2017 6:11 PM
Description Resource Codes Object Codes2016-17
Estimated Actuals2017-18Budget
PercentDifference
CLASSIFIED SALARIES
Classified Support Salaries 2200 0.00 0.00 0.0%
Classified Supervisors' and Administrators' Salaries 2300 0.00 0.00 0.0%
Clerical, Technical and Office Salaries 2400 0.00 0.00 0.0%
Other Classified Salaries 2900 0.00 0.00 0.0%
TOTAL, CLASSIFIED SALARIES 0.00 0.00 0.0%
EMPLOYEE BENEFITS
STRS 3101-3102 0.00 0.00 0.0%
PERS 3201-3202 0.00 0.00 0.0%
OASDI/Medicare/Alternative 3301-3302 0.00 0.00 0.0%
Health and Welfare Benefits 3401-3402 0.00 0.00 0.0%
Unemployment Insurance 3501-3502 0.00 0.00 0.0%
Workers' Compensation 3601-3602 0.00 0.00 0.0%
OPEB, Allocated 3701-3702 0.00 0.00 0.0%
OPEB, Active Employees 3751-3752 0.00 0.00 0.0%
Other Employee Benefits 3901-3902 0.00 0.00 0.0%
TOTAL, EMPLOYEE BENEFITS 0.00 0.00 0.0%
BOOKS AND SUPPLIES
Books and Other Reference Materials 4200 0.00 0.00 0.0%
Materials and Supplies 4300 0.00 0.00 0.0%
Noncapitalized Equipment 4400 0.00 0.00 0.0%
TOTAL, BOOKS AND SUPPLIES 0.00 0.00 0.0%

Pacheco Union ElementaryShasta County
July 1 BudgetSpecial Reserve Fund for Capital Outlay Projects
Expenditures by Object45 70094 0000000
Form 40
California Dept of EducationSACS Financial Reporting Software - 2017.1.0File: fund-d (Rev 02/02/2016) Page 6 Printed: 5/31/2017 6:11 PM
Description Resource Codes Object Codes2016-17
Estimated Actuals2017-18Budget
PercentDifference
SERVICES AND OTHER OPERATING EXPENDITURES
Subagreements for Services 5100 0.00 0.00 0.0%
Travel and Conferences 5200 0.00 0.00 0.0%
Insurance 5400-5450 0.00 0.00 0.0%
Operations and Housekeeping Services 5500 0.00 0.00 0.0%
Rentals, Leases, Repairs, and Noncapitalized Improvements 5600 0.00 0.00 0.0%
Transfers of Direct Costs 5710 0.00 0.00 0.0%
Transfers of Direct Costs - Interfund 5750 0.00 0.00 0.0%
Professional/Consulting Services and Operating Expenditures 5800 0.00 0.00 0.0%
Communications 5900 0.00 0.00 0.0%
TOTAL, SERVICES AND OTHER OPERATING EXPENDITURES 0.00 0.00 0.0%
CAPITAL OUTLAY
Land 6100 0.00 0.00 0.0%
Land Improvements 6170 0.00 0.00 0.0%
Buildings and Improvements of Buildings 6200 0.00 0.00 0.0%
Books and Media for New School Libraries
or Major Expansion of School Libraries 6300 0.00 0.00 0.0%
Equipment 6400 0.00 0.00 0.0%
Equipment Replacement 6500 0.00 0.00 0.0%
TOTAL, CAPITAL OUTLAY 0.00 0.00 0.0%
OTHER OUTGO (excluding Transfers of Indirect Costs)
Other Transfers Out
Transfers of Pass-Through Revenues To Districts or Charter Schools 7211 0.00 0.00 0.0%
To County Offices 7212 0.00 0.00 0.0%
To JPAs 7213 0.00 0.00 0.0%
All Other Transfers Out to All Others 7299 0.00 0.00 0.0%
Debt Service
Debt Service - Interest 7438 0.00 0.00 0.0%
Other Debt Service - Principal 7439 0.00 0.00 0.0%
TOTAL, OTHER OUTGO (excluding Transfers of Indirect Costs) 0.00 0.00 0.0%
TOTAL, EXPENDITURES 0.00 0.00 0.0%

Pacheco Union ElementaryShasta County
July 1 BudgetSpecial Reserve Fund for Capital Outlay Projects
Expenditures by Object45 70094 0000000
Form 40
California Dept of EducationSACS Financial Reporting Software - 2017.1.0File: fund-d (Rev 02/02/2016) Page 7 Printed: 5/31/2017 6:11 PM
Description Resource Codes Object Codes2016-17
Estimated Actuals2017-18Budget
PercentDifference
INTERFUND TRANSFERS
INTERFUND TRANSFERS IN
From: General Fund/CSSF 8912 0.00 0.00 0.0%
Other Authorized Interfund Transfers In 8919 0.00 0.00 0.0%
(a) TOTAL, INTERFUND TRANSFERS IN 0.00 0.00 0.0%
INTERFUND TRANSFERS OUT
To: General Fund/CSSF 7612 0.00 0.00 0.0%
To: State School Building Fund/ County School Facilities Fund 7613 0.00 0.00 0.0%
Other Authorized Interfund Transfers Out 7619 0.00 0.00 0.0%
(b) TOTAL, INTERFUND TRANSFERS OUT 0.00 0.00 0.0%

Pacheco Union ElementaryShasta County
July 1 BudgetSpecial Reserve Fund for Capital Outlay Projects
Expenditures by Object45 70094 0000000
Form 40
California Dept of EducationSACS Financial Reporting Software - 2017.1.0File: fund-d (Rev 02/02/2016) Page 8 Printed: 5/31/2017 6:11 PM
Description Resource Codes Object Codes2016-17
Estimated Actuals2017-18Budget
PercentDifference
OTHER SOURCES/USES
SOURCES
Proceeds
Proceeds from Sale/Lease- Purchase of Land/Buildings 8953 0.00 0.00 0.0%
Other Sources
Transfers from Funds of Lapsed/Reorganized LEAs 8965 0.00 0.00 0.0%
Long-Term Debt Proceeds
Proceeds from Certificates of Participation 8971 0.00 0.00 0.0%
Proceeds from Capital Leases 8972 0.00 0.00 0.0%
Proceeds from Lease Revenue Bonds 8973 0.00 0.00 0.0%
All Other Financing Sources 8979 0.00 0.00 0.0%
(c) TOTAL, SOURCES 0.00 0.00 0.0%
USES
Transfers of Funds from Lapsed/Reorganized LEAs 7651 0.00 0.00 0.0%
All Other Financing Uses 7699 0.00 0.00 0.0%
(d) TOTAL, USES 0.00 0.00 0.0%
CONTRIBUTIONS
Contributions from Unrestricted Revenues 8980 0.00 0.00 0.0%
Contributions from Restricted Revenues 8990 0.00 0.00 0.0%
(e) TOTAL, CONTRIBUTIONS 0.00 0.00 0.0%
TOTAL, OTHER FINANCING SOURCES/USES (a - b + c - d + e) 0.00 0.00 0.0%

Pacheco Union ElementaryShasta County
July 1 BudgetSpecial Reserve Fund for Capital Outlay Projects
Expenditures by Function45 70094 0000000
Form 40
California Dept of EducationSACS Financial Reporting Software - 2017.1.0File: fund-d (Rev 02/02/2016) Page 1 Printed: 5/31/2017 6:11 PM
Description Function Codes Object Codes2016-17
Estimated Actuals2017-18Budget
PercentDifference
A. REVENUES
1) LCFF Sources 8010-8099 0.00 0.00 0.0%
2) Federal Revenue 8100-8299 0.00 0.00 0.0%
3) Other State Revenue 8300-8599 0.00 0.00 0.0%
4) Other Local Revenue 8600-8799 50.00 50.00 0.0%
5) TOTAL, REVENUES 50.00 50.00 0.0%
B. EXPENDITURES (Objects 1000-7999)
1) Instruction 1000-1999 0.00 0.00 0.0%
2) Instruction - Related Services 2000-2999 0.00 0.00 0.0%
3) Pupil Services 3000-3999 0.00 0.00 0.0%
4) Ancillary Services 4000-4999 0.00 0.00 0.0%
5) Community Services 5000-5999 0.00 0.00 0.0%
6) Enterprise 6000-6999 0.00 0.00 0.0%
7) General Administration 7000-7999 0.00 0.00 0.0%
8) Plant Services 8000-8999 0.00 0.00 0.0%
9) Other Outgo 9000-9999Except
7600-7699 0.00 0.00 0.0%
10) TOTAL, EXPENDITURES 0.00 0.00 0.0%
C. EXCESS (DEFICIENCY) OF REVENUES OVER EXPENDITURES BEFORE OTHER FINANCING SOURCES AND USES (A5 - B10) 50.00 50.00 0.0%
D. OTHER FINANCING SOURCES/USES 1) Interfund Transfers a) Transfers In 8900-8929 0.00 0.00 0.0%
b) Transfers Out 7600-7629 0.00 0.00 0.0%
2) Other Sources/Uses a) Sources 8930-8979 0.00 0.00 0.0%
b) Uses 7630-7699 0.00 0.00 0.0%
3) Contributions 8980-8999 0.00 0.00 0.0%
4) TOTAL, OTHER FINANCING SOURCES/USES 0.00 0.00 0.0%

Pacheco Union ElementaryShasta County
July 1 BudgetSpecial Reserve Fund for Capital Outlay Projects
Expenditures by Function45 70094 0000000
Form 40
California Dept of EducationSACS Financial Reporting Software - 2017.1.0File: fund-d (Rev 02/02/2016) Page 2 Printed: 5/31/2017 6:11 PM
Description Function Codes Object Codes2016-17
Estimated Actuals2017-18Budget
PercentDifference
E. NET INCREASE (DECREASE) IN FUND BALANCE (C + D4) 50.00 50.00 0.0%
F. FUND BALANCE, RESERVES 1) Beginning Fund Balance
a) As of July 1 - Unaudited 9791 4,002.00 4,052.00 1.2%
b) Audit Adjustments 9793 0.00 0.00 0.0%
c) As of July 1 - Audited (F1a + F1b) 4,002.00 4,052.00 1.2%
d) Other Restatements 9795 0.00 0.00 0.0%
e) Adjusted Beginning Balance (F1c + F1d) 4,002.00 4,052.00 1.2%
2) Ending Balance, June 30 (E + F1e) 4,052.00 4,102.00 1.2% Components of Ending Fund Balance a) Nonspendable Revolving Cash 9711 0.00 0.00 0.0%
Stores 9712 0.00 0.00 0.0%
Prepaid Expenditures 9713 0.00 0.00 0.0%
All Others 9719 0.00 0.00 0.0%
b) Restricted 9740 0.00 0.00 0.0%
c) Committed Stabilization Arrangements 9750 0.00 0.00 0.0%
Other Commitments (by Resource/Object) 9760 0.00 0.00 0.0%
d) Assigned Other Assignments (by Resource/Object) 9780 4,052.00 4,102.00 1.2%
e) Unassigned/Unappropriated Reserve for Economic Uncertainties 9789 0.00 0.00 0.0%
Unassigned/Unappropriated Amount 9790 0.00 0.00 0.0%

Pacheco Union ElementaryShasta County
July 1 BudgetSpecial Reserve Fund for Capital Outlay Projects
Exhibit: Restricted Balance Detail45 70094 0000000
Form 40
California Dept of EducationSACS Financial Reporting Software - 2017.1.0File: fund-d (Rev 04/06/2011) Page 1 Printed: 5/31/2017 6:11 PM
2016-17 2017-18Resource Description Estimated Actuals Budget
Total, Restricted Balance 0.00 0.00

Pacheco Union ElementaryShasta County
July 1 BudgetBond Interest and Redemption Fund
Expenditures by Object45 70094 0000000
Form 51
California Dept of EducationSACS Financial Reporting Software - 2017.1.0File: fund-d (Rev 02/02/2016) Page 1 Printed: 5/31/2017 6:11 PM
Description Resource Codes Object Codes2016-17
Estimated Actuals2017-18Budget
PercentDifference
A. REVENUES
1) LCFF Sources 8010-8099 0.00 0.00 0.0%
2) Federal Revenue 8100-8299 0.00 0.00 0.0%
3) Other State Revenue 8300-8599 5,785.00 5,785.00 0.0%
4) Other Local Revenue 8600-8799 252,582.00 252,582.00 0.0%
5) TOTAL, REVENUES 258,367.00 258,367.00 0.0%
B. EXPENDITURES
1) Certificated Salaries 1000-1999 0.00 0.00 0.0%
2) Classified Salaries 2000-2999 0.00 0.00 0.0%
3) Employee Benefits 3000-3999 0.00 0.00 0.0%
4) Books and Supplies 4000-4999 0.00 0.00 0.0%
5) Services and Other Operating Expenditures 5000-5999 0.00 0.00 0.0%
6) Capital Outlay 6000-6999 0.00 0.00 0.0%
7) Other Outgo (excluding Transfers of Indirect 7100-7299, Costs) 7400-7499 257,202.00 261,925.00 1.8%
8) Other Outgo - Transfers of Indirect Costs 7300-7399 0.00 0.00 0.0%
9) TOTAL, EXPENDITURES 257,202.00 261,925.00 1.8%
C. EXCESS (DEFICIENCY) OF REVENUES OVER EXPENDITURES BEFORE OTHER FINANCING SOURCES AND USES (A5 - B9) 1,165.00 (3,558.00) -405.4%
D. OTHER FINANCING SOURCES/USES 1) Interfund Transfers a) Transfers In 8900-8929 0.00 0.00 0.0%
b) Transfers Out 7600-7629 0.00 0.00 0.0%
2) Other Sources/Uses a) Sources 8930-8979 0.00 0.00 0.0%
b) Uses 7630-7699 0.00 0.00 0.0%
3) Contributions 8980-8999 0.00 0.00 0.0%
4) TOTAL, OTHER FINANCING SOURCES/USES 0.00 0.00 0.0%

Pacheco Union ElementaryShasta County
July 1 BudgetBond Interest and Redemption Fund
Expenditures by Object45 70094 0000000
Form 51
California Dept of EducationSACS Financial Reporting Software - 2017.1.0File: fund-d (Rev 02/02/2016) Page 2 Printed: 5/31/2017 6:11 PM
Description Resource Codes Object Codes2016-17
Estimated Actuals2017-18Budget
PercentDifference
E. NET INCREASE (DECREASE) IN FUND BALANCE (C + D4) 1,165.00 (3,558.00) -405.4%
F. FUND BALANCE, RESERVES 1) Beginning Fund Balance a) As of July 1 - Unaudited 9791 282,204.00 283,369.00 0.4%
b) Audit Adjustments 9793 0.00 0.00 0.0%
c) As of July 1 - Audited (F1a + F1b) 282,204.00 283,369.00 0.4%
d) Other Restatements 9795 0.00 0.00 0.0%
e) Adjusted Beginning Balance (F1c + F1d) 282,204.00 283,369.00 0.4%
2) Ending Balance, June 30 (E + F1e) 283,369.00 279,811.00 -1.3% Components of Ending Fund Balance a) Nonspendable Revolving Cash 9711 0.00 0.00 0.0%
Stores 9712 0.00 0.00 0.0%
Prepaid Expenditures 9713 0.00 0.00 0.0%
All Others 9719 0.00 0.00 0.0%
b) Restricted 9740 0.00 0.00 0.0%
c) Committed Stabilization Arrangements 9750 0.00 0.00 0.0%
Other Commitments 9760 0.00 0.00 0.0%
d) Assigned Other Assignments 9780 283,369.00 279,811.00 -1.3%
e) Unassigned/Unappropriated Reserve for Economic Uncertainties 9789 0.00 0.00 0.0%
Unassigned/Unappropriated Amount 9790 0.00 0.00 0.0%

Pacheco Union ElementaryShasta County
July 1 BudgetBond Interest and Redemption Fund
Expenditures by Object45 70094 0000000
Form 51
California Dept of EducationSACS Financial Reporting Software - 2017.1.0File: fund-d (Rev 02/02/2016) Page 3 Printed: 5/31/2017 6:11 PM
Description Resource Codes Object Codes2016-17
Estimated Actuals2017-18Budget
PercentDifference
G. ASSETS 1) Cash a) in County Treasury 9110 0.00
1) Fair Value Adjustment to Cash in County Treasury 9111 0.00
b) in Banks 9120 0.00
c) in Revolving Fund 9130 0.00
d) with Fiscal Agent 9135 0.00
e) collections awaiting deposit 9140 0.00
2) Investments 9150 0.00
3) Accounts Receivable 9200 0.00
4) Due from Grantor Government 9290 0.00
5) Due from Other Funds 9310 0.00
6) Stores 9320 0.00
7) Prepaid Expenditures 9330 0.00
8) Other Current Assets 9340 0.00
9) TOTAL, ASSETS 0.00
H. DEFERRED OUTFLOWS OF RESOURCES
1) Deferred Outflows of Resources 9490 0.00
2) TOTAL, DEFERRED OUTFLOWS 0.00
I. LIABILITIES
1) Accounts Payable 9500 0.00
2) Due to Grantor Governments 9590 0.00
3) Due to Other Funds 9610 0.00
4) Current Loans 9640 0.00
5) Unearned Revenue 9650 0.00
6) TOTAL, LIABILITIES 0.00
J. DEFERRED INFLOWS OF RESOURCES
1) Deferred Inflows of Resources 9690 0.00
2) TOTAL, DEFERRED INFLOWS 0.00
K. FUND EQUITY
Ending Fund Balance, June 30 (G9 + H2) - (I6 + J2) 0.00

Pacheco Union ElementaryShasta County
July 1 BudgetBond Interest and Redemption Fund
Expenditures by Object45 70094 0000000
Form 51
California Dept of EducationSACS Financial Reporting Software - 2017.1.0File: fund-d (Rev 02/02/2016) Page 4 Printed: 5/31/2017 6:11 PM
Description Resource Codes Object Codes2016-17
Estimated Actuals2017-18Budget
PercentDifference
FEDERAL REVENUE
All Other Federal Revenue 8290 0.00 0.00 0.0%
TOTAL, FEDERAL REVENUE 0.00 0.00 0.0%
OTHER STATE REVENUE
Tax Relief Subventions Voted Indebtedness Levies
Homeowners' Exemptions 8571 5,785.00 5,785.00 0.0%
Other Subventions/In-Lieu Taxes 8572 0.00 0.00 0.0%
TOTAL, OTHER STATE REVENUE 5,785.00 5,785.00 0.0%
OTHER LOCAL REVENUE
Other Local Revenue County and District Taxes Voted Indebtedness Levies Secured Roll 8611 225,000.00 225,000.00 0.0%
Unsecured Roll 8612 23,827.00 23,827.00 0.0%
Prior Years' Taxes 8613 53.00 53.00 0.0%
Supplemental Taxes 8614 2,802.00 2,802.00 0.0%
Penalties and Interest from Delinquent Non-LCFF Taxes 8629 0.00 0.00 0.0%
Interest 8660 900.00 900.00 0.0%
Net Increase (Decrease) in the Fair Value of Investments 8662 0.00 0.00 0.0%
Other Local Revenue
All Other Local Revenue 8699 0.00 0.00 0.0%
All Other Transfers In from All Others 8799 0.00 0.00 0.0%
TOTAL, OTHER LOCAL REVENUE 252,582.00 252,582.00 0.0%
TOTAL, REVENUES 258,367.00 258,367.00 0.0%

Pacheco Union ElementaryShasta County
July 1 BudgetBond Interest and Redemption Fund
Expenditures by Object45 70094 0000000
Form 51
California Dept of EducationSACS Financial Reporting Software - 2017.1.0File: fund-d (Rev 02/02/2016) Page 5 Printed: 5/31/2017 6:11 PM
Description Resource Codes Object Codes2016-17
Estimated Actuals2017-18Budget
PercentDifference
OTHER OUTGO (excluding Transfers of Indirect Costs)
Debt Service
Bond Redemptions 7433 130,000.00 138,813.00 6.8%
Bond Interest and Other Service Charges 7434 127,202.00 123,112.00 -3.2%
Debt Service - Interest 7438 0.00 0.00 0.0%
Other Debt Service - Principal 7439 0.00 0.00 0.0%
TOTAL, OTHER OUTGO (excluding Transfers of Indirect Costs) 257,202.00 261,925.00 1.8%
TOTAL, EXPENDITURES 257,202.00 261,925.00 1.8%

Pacheco Union ElementaryShasta County
July 1 BudgetBond Interest and Redemption Fund
Expenditures by Object45 70094 0000000
Form 51
California Dept of EducationSACS Financial Reporting Software - 2017.1.0File: fund-d (Rev 02/02/2016) Page 6 Printed: 5/31/2017 6:11 PM
Description Resource Codes Object Codes2016-17
Estimated Actuals2017-18Budget
PercentDifference
INTERFUND TRANSFERS
INTERFUND TRANSFERS IN
Other Authorized Interfund Transfers In 8919 0.00 0.00 0.0%
(a) TOTAL, INTERFUND TRANSFERS IN 0.00 0.00 0.0%
INTERFUND TRANSFERS OUT
To: General Fund 7614 0.00 0.00 0.0%
Other Authorized Interfund Transfers Out 7619 0.00 0.00 0.0%
(b) TOTAL, INTERFUND TRANSFERS OUT 0.00 0.00 0.0%
OTHER SOURCES/USES
SOURCES
Other Sources
Transfers from Funds of Lapsed/Reorganized LEAs 8965 0.00 0.00 0.0%
All Other Financing Sources 8979 0.00 0.00 0.0%
(c) TOTAL, SOURCES 0.00 0.00 0.0%
USES
Transfers of Funds from Lapsed/Reorganized LEAs 7651 0.00 0.00 0.0%
All Other Financing Uses 7699 0.00 0.00 0.0%
(d) TOTAL, USES 0.00 0.00 0.0%
CONTRIBUTIONS
Contributions from Unrestricted Revenues 8980 0.00 0.00 0.0%
Contributions from Restricted Revenues 8990 0.00 0.00 0.0%
(e) TOTAL, CONTRIBUTIONS 0.00 0.00 0.0%
TOTAL, OTHER FINANCING SOURCES/USES (a - b + c - d + e) 0.00 0.00 0.0%

Pacheco Union ElementaryShasta County
July 1 BudgetBond Interest and Redemption Fund
Expenditures by Function45 70094 0000000
Form 51
California Dept of EducationSACS Financial Reporting Software - 2017.1.0File: fund-d (Rev 02/02/2016) Page 1 Printed: 5/31/2017 6:11 PM
Description Function Codes Object Codes2016-17
Estimated Actuals2017-18Budget
PercentDifference
A. REVENUES
1) LCFF Sources 8010-8099 0.00 0.00 0.0%
2) Federal Revenue 8100-8299 0.00 0.00 0.0%
3) Other State Revenue 8300-8599 5,785.00 5,785.00 0.0%
4) Other Local Revenue 8600-8799 252,582.00 252,582.00 0.0%
5) TOTAL, REVENUES 258,367.00 258,367.00 0.0%
B. EXPENDITURES (Objects 1000-7999)
1) Instruction 1000-1999 0.00 0.00 0.0%
2) Instruction - Related Services 2000-2999 0.00 0.00 0.0%
3) Pupil Services 3000-3999 0.00 0.00 0.0%
4) Ancillary Services 4000-4999 0.00 0.00 0.0%
5) Community Services 5000-5999 0.00 0.00 0.0%
6) Enterprise 6000-6999 0.00 0.00 0.0%
7) General Administration 7000-7999 0.00 0.00 0.0%
8) Plant Services 8000-8999 0.00 0.00 0.0%
9) Other Outgo 9000-9999Except
7600-7699 257,202.00 261,925.00 1.8%
10) TOTAL, EXPENDITURES 257,202.00 261,925.00 1.8%
C. EXCESS (DEFICIENCY) OF REVENUES OVER EXPENDITURES BEFORE OTHER FINANCING SOURCES AND USES (A5 - B10) 1,165.00 (3,558.00) -405.4%
D. OTHER FINANCING SOURCES/USES 1) Interfund Transfers a) Transfers In 8900-8929 0.00 0.00 0.0%
b) Transfers Out 7600-7629 0.00 0.00 0.0%
2) Other Sources/Uses a) Sources 8930-8979 0.00 0.00 0.0%
b) Uses 7630-7699 0.00 0.00 0.0%
3) Contributions 8980-8999 0.00 0.00 0.0%
4) TOTAL, OTHER FINANCING SOURCES/USES 0.00 0.00 0.0%

Pacheco Union ElementaryShasta County
July 1 BudgetBond Interest and Redemption Fund
Expenditures by Function45 70094 0000000
Form 51
California Dept of EducationSACS Financial Reporting Software - 2017.1.0File: fund-d (Rev 02/02/2016) Page 2 Printed: 5/31/2017 6:11 PM
Description Function Codes Object Codes2016-17
Estimated Actuals2017-18Budget
PercentDifference
E. NET INCREASE (DECREASE) IN FUND BALANCE (C + D4) 1,165.00 (3,558.00) -405.4%
F. FUND BALANCE, RESERVES 1) Beginning Fund Balance
a) As of July 1 - Unaudited 9791 282,204.00 283,369.00 0.4%
b) Audit Adjustments 9793 0.00 0.00 0.0%
c) As of July 1 - Audited (F1a + F1b) 282,204.00 283,369.00 0.4%
d) Other Restatements 9795 0.00 0.00 0.0%
e) Adjusted Beginning Balance (F1c + F1d) 282,204.00 283,369.00 0.4%
2) Ending Balance, June 30 (E + F1e) 283,369.00 279,811.00 -1.3% Components of Ending Fund Balance a) Nonspendable Revolving Cash 9711 0.00 0.00 0.0%
Stores 9712 0.00 0.00 0.0%
Prepaid Expenditures 9713 0.00 0.00 0.0%
All Others 9719 0.00 0.00 0.0%
b) Restricted 9740 0.00 0.00 0.0%
c) Committed Stabilization Arrangements 9750 0.00 0.00 0.0%
Other Commitments (by Resource/Object) 9760 0.00 0.00 0.0%
d) Assigned Other Assignments (by Resource/Object) 9780 283,369.00 279,811.00 -1.3%
e) Unassigned/Unappropriated Reserve for Economic Uncertainties 9789 0.00 0.00 0.0%
Unassigned/Unappropriated Amount 9790 0.00 0.00 0.0%

Pacheco Union ElementaryShasta County
July 1 BudgetBond Interest and Redemption Fund
Exhibit: Restricted Balance Detail45 70094 0000000
Form 51
California Dept of EducationSACS Financial Reporting Software - 2017.1.0File: fund-d (Rev 04/06/2011) Page 1 Printed: 5/31/2017 6:11 PM
2016-17 2017-18Resource Description Estimated Actuals Budget
Total, Restricted Balance 0.00 0.00

Pacheco Union ElementaryShasta County
2017-18 July 1 BudgetAVERAGE DAILY ATTENDANCE 45 70094 0000000
Form A
California Dept of EducationSACS Financial Reporting Software - 2017.1.0File: ada (Rev 03/10/2017) Page 1 of 1 Printed: 5/31/2017 6:12 PM
2016-17 Estimated Actuals 2017-18 Budget2017-18 Budget
Description P-2 ADA Annual ADA Funded ADAEstimated P-2
ADAEstimated
Annual ADAEstimated
Funded ADA
A. DISTRICT 1. Total District Regular ADA Includes Opportunity Classes, Home & Hospital, Special Day Class, Continuation Education, Special Education NPS/LCI and Extended Year, and Community Day School (includes Necessary Small School ADA) 595.64 595.64 595.64 593.60 593.60 595.64 2. Total Basic Aid Choice/Court Ordered Voluntary Pupil Transfer Regular ADA Includes Opportunity Classes, Home & Hospital, Special Day Class, Continuation Education, Special Education NPS/LCI and Extended Year, and Community Day School (ADA not included in Line A1 above) 3. Total Basic Aid Open Enrollment Regular ADA Includes Opportunity Classes, Home & Hospital, Special Day Class, Continuation Education, Special Education NPS/LCI and Extended Year, and Community Day School (ADA not included in Line A1 above) 4. Total, District Regular ADA (Sum of Lines A1 through A3) 595.64 595.64 595.64 593.60 593.60 595.64 5. District Funded County Program ADA a. County Community Schools b. Special Education-Special Day Class 3.10 3.10 3.10 3.10 3.10 3.10 c. Special Education-NPS/LCI d. Special Education Extended Year e. Other County Operated Programs: Opportunity Schools and Full Day Opportunity Classes, Specialized Secondary Schools, Technical, Agricultural, and Natura Resource Conservation Schools f. County School Tuition Fund (Out of State Tuition) [EC 2000 and 46380] g. Total, District Funded County Program ADA (Sum of Lines A5a through A5f) 3.10 3.10 3.10 3.10 3.10 3.10 6. TOTAL DISTRICT ADA (Sum of Line A4 and Line A5g) 598.74 598.74 598.74 596.70 596.70 598.74 7. Adults in Correctional Facilities 8. Charter School ADA (Enter Charter School ADA using Tab C. Charter School ADA)

Pacheco Union ElementaryShasta County
July 1 Budget2016-17 Estimated ActualsSchedule of Capital Assets
45 70094 0000000Form ASSET
California Dept of EducationSACS Financial Reporting Software - 2017.1.0File: asset (Rev 01/27/2009) Page 1 of 1 Printed: 5/31/2017 6:13 PM
Unaudited Balance July 1
AuditAdjustments/Restatements
AuditedBalance July 1 Increases Decreases
Ending BalanceJune 30
Governmental Activities:
Capital assets not being depreciated: Land 289,352.00 289,352.00 289,352.00 Work in Progress 21,947.71 4,836.28 26,783.99 69,654.38 96,438.37
Total capital assets not being depreciated 311,299.71 4,836.28 316,135.99 69,654.38 0.00 385,790.37
Capital assets being depreciated: Land Improvements 1,827,036.83 1,827,036.83 1,827,036.83 Buildings 11,003,746.07 11,003,746.07 11,003,746.07 Equipment 801,537.40 801,537.40 801,537.40
Total capital assets being depreciated 13,632,320.30 0.00 13,632,320.30 0.00 0.00 13,632,320.30
Accumulated Depreciation for: Land Improvements (681,305.72) (681,305.72) (87,817.04) (769,122.76)
Buildings (4,412,698.08) (4,412,698.08) (325,409.96) (4,738,108.04) Equipment (649,694.46) (649,694.46) (46,568.34) (696,262.80) Total accumulated depreciation (5,743,698.26) 0.00 (5,743,698.26) (459,795.34) 0.00 (6,203,493.60)
Total capital assets being depreciated, net 7,888,622.04 0.00 7,888,622.04 (459,795.34) 0.00 7,428,826.70
Governmental activity capital assets, net 8,199,921.75 4,836.28 8,204,758.03 (390,140.96) 0.00 7,814,617.07
Business-Type Activities:
Capital assets not being depreciated:
Land 0.00 0.00
Work in Progress 0.00 0.00
Total capital assets not being depreciated 0.00 0.00 0.00 0.00 0.00 0.00
Capital assets being depreciated:
Land Improvements 0.00 0.00
Buildings 0.00 0.00
Equipment 0.00 0.00
Total capital assets being depreciated 0.00 0.00 0.00 0.00 0.00 0.00 Accumulated Depreciation for: Land Improvements 0.00 0.00 Buildings 0.00 0.00 Equipment 0.00 0.00 Total accumulated depreciation 0.00 0.00 0.00 0.00 0.00 0.00 Total capital assets being depreciated, net 0.00 0.00 0.00 0.00 0.00 0.00
Business-type activity capital assets, net 0.00 0.00 0.00 0.00 0.00 0.00

Pacheco Union ElementaryShasta County
July 1 BudgetFINANCIAL REPORTS
2017-18 BudgetSchool District Certification
45 70094 0000000Form CB
California Dept of EducationSACS Financial Reporting Software - 2017.1.0File: cb (Rev 04/03/2017) Page 1 of 4 Printed: 5/31/2017 6:14 PM
ANNUAL BUDGET REPORT:July 1, 2017 Budget Adoption
Insert "X" in applicable boxes:
X This budget was developed using the state-adopted Criteria and Standards. It includes the expenditures necessary to implement the Local Control and Accountability Plan (LCAP) or annual update to the LCAP that will be effective for the budget year. The budget was filed and adopted subsequent to a public hearing by thegoverning board of the school district pursuant to Education Code sections 33129, 42127, 52060, 52061, and52062.
X If the budget includes a combined assigned and unassigned ending fund balance above the minimumrecommended reserve for economic uncertainties, at its public hearing, the school district complied withthe requirements of subparagraphs (B) and (C) of paragraph (2) of subdivision (a) of Education Code Section 42127.
Budget available for inspection at: Public Hearing:
Place: Pacheco Elementary School Place: Pacheco Elementary SchoolDate: June 01, 2017 Date: June 06, 2017
Time: 05:30 PMAdoption Date: June 13, 2017
Signed:Clerk/Secretary of the Governing Board
(Original signature required)
Contact person for additional information on the budget reports:
Name: Chuck Strom Telephone: (530) 225-0301
Title: Accounting Manager E-mail: [email protected]
Criteria and Standards Review Summary
The following summary is automatically completed based on data provided in the Criteria and Standards Review(Form 01CS). Criteria and standards that are "Not Met," and supplemental information and additional fiscalindicators that are "Yes," may indicate areas of potential concern for fiscal solvency purposes and should becarefully reviewed.
CRITERIA AND STANDARDS MetNotMet
1 Average Daily Attendance Budgeted (funded) ADA has not been overestimated by more than thestandard for the prior fiscal year, or two or more of the previous threefiscal years.
X

Pacheco Union ElementaryShasta County
July 1 BudgetFINANCIAL REPORTS
2017-18 BudgetSchool District Certification
45 70094 0000000Form CB
California Dept of EducationSACS Financial Reporting Software - 2017.1.0File: cb (Rev 04/03/2017) Page 2 of 4 Printed: 5/31/2017 6:14 PM
CRITERIA AND STANDARDS (continued) MetNotMet
2 Enrollment Enrollment has not been overestimated by more than the standardfor the prior fiscal year, or two or more of the previous three fiscalyears.
X
3 ADA to Enrollment Projected second period (P-2) ADA to enrollment ratio is consistent withhistorical ratios for the budget and two subsequent fiscal years. X
4 Local Control FundingFormula (LCFF) Revenue
Projected change in LCFF revenue is within the standard for thebudget and two subsequent fiscal years. X
5 Salaries and Benefits Projected ratios of total unrestricted salaries and benefits to totalunrestricted general fund expenditures are consistent with historicalratios for the budget and two subsequent fiscal years.
X
6a Other Revenues Projected operating revenues (e.g., federal, other state, and otherlocal) are within the standard for the budget and two subsequentfiscal years.
X
6b Other Expenditures Projected operating expenditures (e.g., books and supplies, andservices and other operating) are within the standard for the budgetand two subsequent fiscal years.
X
7 Ongoing and MajorMaintenance Account
If applicable, required contribution to the ongoing and majormaintenance account (i.e., restricted maintenance account) isincluded in the budget.
n/a
8 Deficit Spending Unrestricted deficit spending, if any, has not exceeded the standardfor two or more of the last three fiscal years. X
9 Fund Balance Unrestricted general fund beginning balance has not beenoverestimated by more than the standard for two or more of the lastthree fiscal years.
X
10 Reserves Projected available reserves (e.g., reserve for economicuncertainties, unassigned/unappropriated amounts) meet minimumrequirements for the budget and two subsequent fiscal years.
X
SUPPLEMENTAL INFORMATION No YesS1 Contingent Liabilities Are there known or contingent liabilities (e.g., financial or program
audits, litigation, state compliance reviews) that may impact thebudget?
X
S2 Using One-time Revenuesto Fund OngoingExpenditures
Are there ongoing general fund expenditures in excess of onepercent of the total general fund expenditures that are funded withone-time resources?
X
S3 Using Ongoing Revenuesto Fund One-timeExpenditures
Are there large non-recurring general fund expenditures that arefunded with ongoing general fund revenues? X
S4 Contingent Revenues Are any projected revenues for the budget or two subsequent fiscalyears contingent on reauthorization by the local government, speciallegislation, or other definitive act (e.g., parcel taxes, forest reserves)? X
S5 Contributions Have contributions from unrestricted to restricted resources, ortransfers to or from the general fund to cover operating deficits,changed by more than the standard for the budget or twosubsequent fiscal years?
X

Pacheco Union ElementaryShasta County
July 1 BudgetFINANCIAL REPORTS
2017-18 BudgetSchool District Certification
45 70094 0000000Form CB
California Dept of EducationSACS Financial Reporting Software - 2017.1.0File: cb (Rev 04/03/2017) Page 3 of 4 Printed: 5/31/2017 6:14 PM
SUPPLEMENTAL INFORMATION (continued) No YesS6 Long-term Commitments Does the district have long-term (multiyear) commitments or debt
agreements? X
• If yes, have annual payments for the budget or two subsequentfiscal years increased over prior year's (2016-17) annualpayment?
X
S7a Postemployment BenefitsOther than Pensions
Does the district provide postemployment benefits other thanpensions (OPEB)? X
• If yes, are they lifetime benefits? X• If yes, do benefits continue beyond age 65? X• If yes, are benefits funded by pay-as-you-go? X
S7b Other Self-insuranceBenefits
Does the district provide other self-insurance benefits (e.g., workers'compensation)? X
S8 Status of Labor Are salary and benefit negotiations still open for:
Agreements • Certificated? (Section S8A, Line 1) X• Classified? (Section S8B, Line 1) X• Management/supervisor/confidential? (Section S8C, Line 1) X
S9 Local Control andAccountability Plan (LCAP)
• Did or will the school district's governing board adopt an LCAP orapprove an update to the LCAP effective for the budget year? X
• Approval date for adoption of the LCAP or approval of an updateto the LCAP: Jun 13, 2017Jun 13, 2017
S10 LCAP Expenditures Does the school district's budget include the expenditures necessaryto implement the LCAP or annual update to the LCAP as describedin the Local Control and Accountability Plan and Annual UpdateTemplate, Section 3: Actions, Services, and Expenditures?
X
ADDITIONAL FISCAL INDICATORS No YesA1 Negative Cash Flow Do cash flow projections show that the district will end the budget
year with a negative cash balance in the general fund? X
A2 Independent PositionControl
Is personnel position control independent from the payroll system?X
A3 Declining Enrollment Is enrollment decreasing in both the prior fiscal year and budgetyear? X
A4 New Charter SchoolsImpacting DistrictEnrollment
Are any new charter schools operating in district boundaries that areimpacting the district's enrollment, either in the prior fiscal year orbudget year?
X
A5 Salary Increases ExceedCOLA
Has the district entered into a bargaining agreement where any of thebudget or subsequent fiscal years of the agreement would result insalary increases that are expected to exceed the projected statefunded cost-of-living adjustment?
X

Pacheco Union ElementaryShasta County
July 1 BudgetFINANCIAL REPORTS
2017-18 BudgetSchool District Certification
45 70094 0000000Form CB
California Dept of EducationSACS Financial Reporting Software - 2017.1.0File: cb (Rev 04/03/2017) Page 4 of 4 Printed: 5/31/2017 6:14 PM
ADDITIONAL FISCAL INDICATORS (continued) No YesA6 Uncapped Health Benefits Does the district provide uncapped (100% employer paid) health
benefits for current or retired employees? X
A7 Independent FinancialSystem
Is the district’s financial system independent from the county officesystem? X
A8 Fiscal Distress Reports Does the district have any reports that indicate fiscal distress? If yes,provide copies to the COE, pursuant to EC 42127.6(a). X
A9 Change of CBO orSuperintendent
Have there been personnel changes in the superintendent or chiefbusiness official (CBO) positions within the last 12 months? X

Pacheco Union ElementaryShasta County
July 1 Budget2017-18 Budget
Workers' Compensation Certification45 70094 0000000
Form CC
California Dept of EducationSACS Financial Reporting Software - 2017.1.0File: cc (Rev 02/14/2017) Page 1 of 1 Printed: 5/31/2017 6:14 PM
ANNUAL CERTIFICATION REGARDING SELF-INSURED WORKERS' COMPENSATION CLAIMS
Pursuant to EC Section 42141, if a school district, either individually or as a member of a joint powers agency, is self-insured for workers' compensation claims, the superintendent of the school district annually shall provide informationto the governing board of the school district regarding the estimated accrued but unfunded cost of those claims. The governing board annually shall certify to the county superintendent of schools the amount of money, if any, that it hasdecided to reserve in its budget for the cost of those claims.
To the County Superintendent of Schools:
( ) Our district is self-insured for workers' compensation claims as defined in Education Code Section 42141(a):
Total liabilities actuarially determined: $Less: Amount of total liabilities reserved in budget: $Estimated accrued but unfunded liabilities: $ 0.00
( X ) This school district is self-insured for workers' compensation claimsthrough a JPA, and offers the following information:Self insured through the NVSIG JPA. NVSIG participates in POPS which transfers risk to reinsurersCatastrophic protection up to $150m per occurence, freequency up to $1 million per occurrence.
( ) This school district is not self-insured for workers' compensation claims.
Signed Date of Meeting: Jun 13, 2017Clerk/Secretary of the Governing Board
(Original signature required)
For additional information on this certification, please contact:
Name: Chuck Strom
Title: Accounting Manager
Telephone: (530) 225-0301
E-mail: [email protected]

Pacheco Union ElementaryShasta County
July 1 Budget2016-17 Estimated Actuals
GENERAL FUNDCurrent Expense Formula/Minimum Classroom Compensation
45 70094 0000000Form CEA
California Dept of EducationSACS Financial Reporting Software - 2017.1.0File: cea (Rev 06/20/2016) Page 1 of 1 Printed: 5/31/2017 6:15 PM
PART I - CURRENTEXPENSE FORMULA
Total Expensefor Year
(1)EDPNo.
Reductions(See Note 1)
(2)EDPNo.
Current Expenseof Education(Col 1 - Col 2)
(3)EDPNo.
Reductions(Extracted)
(See Note 2)(4a)
Reductions(Overrides)*(See Note 2)
(4b)EDPNo.
Current Expense-Part II
(Col 3 - Col 4)(5)
EDPNo.
1000 - CertificatedSalaries 2,564,838.00 301 18,000.00 303 2,546,838.00 305 57,755.00 57,755.00 307 2,489,083.00 309
2000 - Classified Salaries 1,021,793.00 311 0.00 313 1,021,793.00 315 133,473.00 235,587.00 317 786,206.00 319
3000 - Employee Benefits 1,211,138.00 321 24,914.00 323 1,186,224.00 325 54,399.00 81,940.00 327 1,104,284.00 329
4000 - Books, SuppliesEquip Replace. (6500) 274,595.00 331 0.00 333 274,595.00 335 52,500.00 62,299.00 337 212,296.00 339
5000 - Services. . . &7300 - Indirect Costs 1,766,952.00 341 22,400.00 343 1,744,552.00 345 730,288.00 968,004.00 347 776,548.00 349
TOTAL 6,774,002.00 365 TOTAL 5,368,417.00 369
Note 1 - In Column 2, report expenditures for the following programs: Nonagency (Goals 7100-7199), Community Services (Goal 8100), Food Services (Function 3700), Fringe Benefits for Retired Persons (Objects 3701-3702), and Facilities Acquisition & Construction (Function 8500).
Note 2 - In Column 4, report expenditures for: Transportation (Function 3600), Lottery Expenditures (Resource 1100), Special Education Students in Nonpublic Schools (Function 1180), and other federal or state categorical aid in which funds were granted for expenditures in a program not incurring any teacher salary expenditures or requiring disbursement of the funds without regard to the requirements of EC Section 41372
* If an amount (even zero) is entered in any row of Column 4b or in Line 13b, the form uses only the values in Column 4b and Line 13b rather than the values in Column 4a and Line 13a.
PART II: MINIMUM CLASSROOM COMPENSATION (Instruction, Functions 1000-1999) ObjectEDPNo.
1. Teacher Salaries as Per EC 41011. . . . . . . . . . . . . . . . . . . . . . . . . . . . . . . . . . . . . . . . . . . . . . . . . . . . . . . . . . . . . . . . . . . . . . . 1100 2,124,547.00 3752. Salaries of Instructional Aides Per EC 41011. . . . . . . . . . . . . . . . . . . . . . . . . . . . . . . . . . . . . . . . . . . . . . . . . . . . . . . . . . . . . . . 2100 252,591.00 3803. STRS. . . . . . . . . . . . . . . . . . . . . . . . . . . . . . . . . . . . . . . . . . . . . . . . . . . . . . . . . . . . . . . . . . . . . . . . . . . . . . . . . . . . . . . . . . . . . . 3101 & 3102 331,839.00 3824. PERS. . . . . . . . . . . . . . . . . . . . . . . . . . . . . . . . . . . . . . . . . . . . . . . . . . . . . . . . . . . . . . . . . . . . . . . . . . . . . . . . . . . . . . . . . . . . . . 3201 & 3202 26,419.00 3835. OASDI - Regular, Medicare and Alternative. . . . . . . . . . . . . . . . . . . . . . . . . . . . . . . . . . . . . . . . . . . . . . . . . . . . . . . . . . . . . . . . 3301 & 3302 57,455.00 3846. Health & Welfare Benefits (EC 41372) (Include Health, Dental, Vision, Pharmaceutical, and Annuity Plans). . . . . . . . . . . . . . . . . . . . . . . . . . . . . . . . . . . . . . . . . . . . . . . . . . . . . . . . . . . . . . . . . . . . . . . . . . . . . . . . . . . . . . . 3401 & 3402 307,547.00 3857. Unemployment Insurance. . . . . . . . . . . . . . . . . . . . . . . . . . . . . . . . . . . . . . . . . . . . . . . . . . . . . . . . . . . . . . . . . . . . . . . . . . . . . . 3501 & 3502 2,184.00 3908. Workers' Compensation Insurance. . . . . . . . . . . . . . . . . . . . . . . . . . . . . . . . . . . . . . . . . . . . . . . . . . . . . . . . . . . . . . . . . . . . . . . 3601 & 3602 52,935.00 3929. OPEB, Active Employees (EC 41372). . . . . . . . . . . . . . . . . . . . . . . . . . . . . . . . . . . . . . . . . . . . . . . . . . . . . . . . . . . . . . . . . . . . 3751 & 3752 0.0010. Other Benefits (EC 22310). . . . . . . . . . . . . . . . . . . . . . . . . . . . . . . . . . . . . . . . . . . . . . . . . . . . . . . . . . . . . . . . . . . . . . . . . . . . . 3901 & 3902 30,000.00 39311. SUBTOTAL Salaries and Benefits (Sum Lines 1 - 10). . . . . . . . . . . . . . . . . . . . . . . . . . . . . . . . . . . . . . . . . . . . . . . . . . . . . . . . . . . . . . . . . . . . . . . . . . . . . . 3,185,517.00 39512. Less: Teacher and Instructional Aide Salaries and Benefits deducted in Column 2. . . . . . . . . . . . . . . . . . . . . . . . . . . . . . . . . . . . . . . . . . . . . . . . . . . . . . . . . . . . . . . . . . . . . . . . . . . . . . . . . . . . . . . . . . . . . . . . 0.0013a. Less: Teacher and Instructional Aide Salaries and Benefits (other than Lottery) deducted in Column 4a (Extracted). . . . . . . . . . . . . . . . . . . . . . . . . . . . . . . . . . . . . . . . . . . . . . . . . . . . . . . . . . . . . . . . . . . . . . 0.00 396 b. Less: Teacher and Instructional Aide Salaries and Benefits (other than Lottery) deducted in Column 4b (Overrides)*. . . . . . . . . . . . . . . . . . . . . . . . . . . . . . . . . . . . . . . . . . . . . . . . . . . . . . . . . . . . . . . . . . . . . 19,603.00 39614. TOTAL SALARIES AND BENEFITS. . . . . . . . . . . . . . . . . . . . . . . . . . . . . . . . . . . . . . . . . . . . . . . . . . . . . . . . . . . . . . . . . . . . . . . . . . . . . . . . . . . . . . . . . . . . 3,165,914.00 39715. Percent of Current Cost of Education Expended for Classroom Compensation (EDP 397 divided by EDP 369) Line 15 must equal or exceed 60% for elementary, 55% for unified and 50% for high school districts to avoid penalty under provisions of EC 41372. . . . . . . . . . . . . . . . . . . . . . . . . . . . . . . . . . . . . . . . . . . . . . . . . . . . . . . . . . . . . . . . . 58.97%16. District is exempt from EC 41372 because it meets the provisions of EC 41374. (If exempt, enter 'X') . . . . . . . . . . . . . . . . . . . . . . . . . . . . . . . . . . . . . . . . . . . . . . . . . . . . . . . . . . . . . . . . . . . . . . . . . . . . . . . . . . . . . . . . . . . .
PART III: DEFICIENCY AMOUNT
A deficiency amount (Line 5) is only applicable to districts not meeting the minimum classroom compensation percentage required under EC 41372 and not exempt under thprovisions of EC 41374.A deficiency amount (Line 5) is only applicable to districts not meeting the minimum classroom compensation percentage required under EC 41372 and not exempt under thprovisions of EC 41374.1. Minimum percentage required (60% elementary, 55% unified, 50% high) . . . . . . . . . . . . . . . . . . . . . . . . . . . . . . . . . . . . . . . . . . . . . . . . . . . . . . . . . . . . . . 60.00%2. Percentage spent by this district (Part II, Line 15) . . . . . . . . . . . . . . . . . . . . . . . . . . . . . . . . . . . . . . . . . . . . . . . . . . . . . . . . . . . . . . . . . . . . . . . . . . . . . . . . . 58.97%3. Percentage below the minimum (Part III, Line 1 minus Line 2) . . . . . . . . . . . . . . . . . . . . . . . . . . . . . . . . . . . . . . . . . . . . . . . . . . . . . . . . . . . . . . . . . . . . . . . 1.03%4. District's Current Expense of Education after reductions in columns 4a or 4b (Part I, EDP 369). . . . . . . . . . . . . . . . . . . . . . . . . . . . . . . . . . . . . . . . . . . . . . 5,368,417.005. Deficiency Amount (Part III, Line 3 times Line 4) . . . . . . . . . . . . . . . . . . . . . . . . . . . . . . . . . . . . . . . . . . . . . . . . . . . . . . . . . . . . . . . . . . . . . . . . . . . . . . . . . 55,294.70
PART IV: Explanation for adjustments entered in Part I, Column 4b (required)Adjustments on separate worksheet.Adjustments on separate worksheet.

Pacheco Union ElementaryShasta County
July 1 Budget2017-18 Budget
GENERAL FUNDCurrent Expense Formula/Minimum Classroom Compensation
45 70094 0000000Form CEB
California Dept of EducationSACS Financial Reporting Software - 2017.1.0File: ceb (Rev 06/20/2016) Page 1 of 1 Printed: 5/31/2017 6:16 PM
PART I - CURRENTEXPENSE FORMULA
Total Expensefor Year
(1)EDPNo.
Reductions(See Note 1)
(2)EDPNo.
Current Expenseof Education(Col 1 - Col 2)
(3)EDPNo.
Reductions(Extracted)
(See Note 2)(4a)
Reductions(Overrides)*(See Note 2)
(4b)EDPNo.
Current Expense-Part II
(Col 3 - Col 4)(5)
EDPNo.
1000 - CertificatedSalaries 2,350,996.00 301 18,000.00 303 2,332,996.00 305 34,220.00 34,220.00 307 2,298,776.00 309
2000 - Classified Salaries 1,039,064.00 311 0.00 313 1,039,064.00 315 134,521.00 242,589.00 317 796,475.00 319
3000 - Employee Benefits 1,221,093.00 321 24,914.00 323 1,196,179.00 325 55,470.00 84,994.00 327 1,111,185.00 329
4000 - Books, SuppliesEquip Replace. (6500) 252,422.00 331 0.00 333 252,422.00 335 52,500.00 62,299.00 337 190,123.00 339
5000 - Services. . . &7300 - Indirect Costs 1,227,353.00 341 5,000.00 343 1,222,353.00 345 263,337.00 501,053.00 347 721,300.00 349
TOTAL 6,043,014.00 365 TOTAL 5,117,859.00 369
Note 1 - In Column 2, report expenditures for the following programs: Nonagency (Goals 7100-7199), Community Services (Goal 8100), Food Services (Function 3700), Fringe Benefits for Retired Persons (Objects 3701-3702), and Facilities Acquisition & Construction (Function 8500).
Note 2 - In Column 4, report expenditures for: Transportation (Function 3600), Lottery Expenditures (Resource 1100), Special Education Students in Nonpublic Schools (Function 1180), and other federal or state categorical aid in which funds were granted for expenditures in a program not incurring any teacher salary expenditures or requiring disbursement of the funds without regard to the requirements of EC Section 41372
* If an amount (even zero) is entered in any row of Column 4b or in Line 13b, the form uses only the values in Column 4b and Line 13b rather than the values in Column 4a and Line 13a.
PART II: MINIMUM CLASSROOM COMPENSATION (Instruction, Functions 1000-1999) ObjectEDPNo.
1. Teacher Salaries as Per EC 41011. . . . . . . . . . . . . . . . . . . . . . . . . . . . . . . . . . . . . . . . . . . . . . . . . . . . . . . . . . . . . . . . . . . . . . . 1100 2,008,923.00 3752. Salaries of Instructional Aides Per EC 41011. . . . . . . . . . . . . . . . . . . . . . . . . . . . . . . . . . . . . . . . . . . . . . . . . . . . . . . . . . . . . . . 2100 281,566.00 3803. STRS. . . . . . . . . . . . . . . . . . . . . . . . . . . . . . . . . . . . . . . . . . . . . . . . . . . . . . . . . . . . . . . . . . . . . . . . . . . . . . . . . . . . . . . . . . . . . . 3101 & 3102 356,568.00 3824. PERS. . . . . . . . . . . . . . . . . . . . . . . . . . . . . . . . . . . . . . . . . . . . . . . . . . . . . . . . . . . . . . . . . . . . . . . . . . . . . . . . . . . . . . . . . . . . . . 3201 & 3202 34,416.00 3835. OASDI - Regular, Medicare and Alternative. . . . . . . . . . . . . . . . . . . . . . . . . . . . . . . . . . . . . . . . . . . . . . . . . . . . . . . . . . . . . . . . 3301 & 3302 58,321.00 3846. Health & Welfare Benefits (EC 41372) (Include Health, Dental, Vision, Pharmaceutical, and Annuity Plans). . . . . . . . . . . . . . . . . . . . . . . . . . . . . . . . . . . . . . . . . . . . . . . . . . . . . . . . . . . . . . . . . . . . . . . . . . . . . . . . . . . . . . . 3401 & 3402 327,023.00 3857. Unemployment Insurance. . . . . . . . . . . . . . . . . . . . . . . . . . . . . . . . . . . . . . . . . . . . . . . . . . . . . . . . . . . . . . . . . . . . . . . . . . . . . . 3501 & 3502 2,139.00 3908. Workers' Compensation Insurance. . . . . . . . . . . . . . . . . . . . . . . . . . . . . . . . . . . . . . . . . . . . . . . . . . . . . . . . . . . . . . . . . . . . . . . 3601 & 3602 53,514.00 3929. OPEB, Active Employees (EC 41372). . . . . . . . . . . . . . . . . . . . . . . . . . . . . . . . . . . . . . . . . . . . . . . . . . . . . . . . . . . . . . . . . . . . 3751 & 3752 0.0010. Other Benefits (EC 22310). . . . . . . . . . . . . . . . . . . . . . . . . . . . . . . . . . . . . . . . . . . . . . . . . . . . . . . . . . . . . . . . . . . . . . . . . . . . . 3901 & 3902 0.00 39311. SUBTOTAL Salaries and Benefits (Sum Lines 1 - 10). . . . . . . . . . . . . . . . . . . . . . . . . . . . . . . . . . . . . . . . . . . . . . . . . . . . . . . . . . . . . . . . . . . . . . . . . . . . . . 3,122,470.00 39512. Less: Teacher and Instructional Aide Salaries and Benefits deducted in Column 2. . . . . . . . . . . . . . . . . . . . . . . . . . . . . . . . . . . . . . . . . . . . . . . . . . . . . . . . . . . . . . . . . . . . . . . . . . . . . . . . . . . . . . . . . . . . . . . . 0.0013a. Less: Teacher and Instructional Aide Salaries and Benefits (other than Lottery) deducted in Column 4a (Extracted). . . . . . . . . . . . . . . . . . . . . . . . . . . . . . . . . . . . . . . . . . . . . . . . . . . . . . . . . . . . . . . . . . . . . . 0.00 396 b. Less: Teacher and Instructional Aide Salaries and Benefits (other than Lottery) deducted in Column 4b (Overrides)*. . . . . . . . . . . . . . . . . . . . . . . . . . . . . . . . . . . . . . . . . . . . . . . . . . . . . . . . . . . . . . . . . . . . . 21,114.00 39614. TOTAL SALARIES AND BENEFITS. . . . . . . . . . . . . . . . . . . . . . . . . . . . . . . . . . . . . . . . . . . . . . . . . . . . . . . . . . . . . . . . . . . . . . . . . . . . . . . . . . . . . . . . . . . . 3,101,356.00 39715. Percent of Current Cost of Education Expended for Classroom Compensation (EDP 397 divided by EDP 369) Line 15 must equal or exceed 60% for elementary, 55% for unified and 50% for high school districts to avoid penalty under provisions of EC 41372. . . . . . . . . . . . . . . . . . . . . . . . . . . . . . . . . . . . . . . . . . . . . . . . . . . . . . . . . . . . . . . . . 60.60%16. District is exempt from EC 41372 because it meets the provisions of EC 41374. (If exempt, enter 'X') . . . . . . . . . . . . . . . . . . . . . . . . . . . . . . . . . . . . . . . . . . . . . . . . . . . . . . . . . . . . . . . . . . . . . . . . . . . . . . . . . . . . . . . . . . . .
PART III: DEFICIENCY AMOUNT
A deficiency amount (Line 5) is only applicable to districts not meeting the minimum classroom compensation percentage required under EC 41372 and not exempt under thprovisions of EC 41374.A deficiency amount (Line 5) is only applicable to districts not meeting the minimum classroom compensation percentage required under EC 41372 and not exempt under thprovisions of EC 41374.1. Minimum percentage required (60% elementary, 55% unified, 50% high) . . . . . . . . . . . . . . . . . . . . . . . . . . . . . . . . . . . . . . . . . . . . . . . . . . . . . . . . . . . . . . 60.00%2. Percentage spent by this district (Part II, Line 15) . . . . . . . . . . . . . . . . . . . . . . . . . . . . . . . . . . . . . . . . . . . . . . . . . . . . . . . . . . . . . . . . . . . . . . . . . . . . . . . . . 60.60%3. Percentage below the minimum (Part III, Line 1 minus Line 2) . . . . . . . . . . . . . . . . . . . . . . . . . . . . . . . . . . . . . . . . . . . . . . . . . . . . . . . . . . . . . . . . . . . . . . . 0.00%4. District's Current Expense of Education after reductions in columns 4a or 4b (Part I, EDP 369). . . . . . . . . . . . . . . . . . . . . . . . . . . . . . . . . . . . . . . . . . . . . . 5,117,859.005. Deficiency Amount (Part III, Line 3 times Line 4) . . . . . . . . . . . . . . . . . . . . . . . . . . . . . . . . . . . . . . . . . . . . . . . . . . . . . . . . . . . . . . . . . . . . . . . . . . . . . . . . . 0.00
PART IV: Explanation for adjustments entered in Part I, Column 4b (required)Adjustments on separate worksheet.Adjustments on separate worksheet.

Pacheco Union ElementaryShasta County
July 1 Budget2016-17 Estimated Actuals
Schedule of Long-Term Liabilities45 70094 0000000
Form DEBT
California Dept of EducationSACS Financial Reporting Software - 2017.1.0File: debt (Rev 06/22/2015) Page 1 of 1 Printed: 5/31/2017 6:17 PM
Unaudited Balance July 1
AuditAdjustments/Restatements
AuditedBalance July 1 Increases Decreases
Ending BalanceJune 30
Amounts Due WithinOne Year
Governmental Activities:
General Obligation Bonds Payable 4,246,191.00 78,794.00 4,324,985.00 143,313.00 4,181,672.00 138,813.00 State School Building Loans Payable 0.00 0.00 Certificates of Participation Payable 1,520,710.00 71,383.00 1,592,093.00 1,592,093.00 Capital Leases Payable 0.00 0.00 Lease Revenue Bonds Payable 0.00 0.00 Other General Long-Term Debt 10,000.00 10,000.00 40,000.00 15,000.00 35,000.00 15,000.00 Net Pension Liability 2,819,584.00 890,211.00 3,709,795.00 3,709,795.00 Net OPEB Obligation 0.00 0.00 Compensated Absences Payable 46,329.21 46,329.21 5,438.00 51,767.21
Governmental activities long-term liabilities 8,642,814.21 1,040,388.00 9,683,202.21 45,438.00 158,313.00 9,570,327.21 153,813.00
Business-Type Activities:
General Obligation Bonds Payable 0.00 0.00 State School Building Loans Payable 0.00 0.00 Certificates of Participation Payable 0.00 0.00 Capital Leases Payable 0.00 0.00 Lease Revenue Bonds Payable 0.00 0.00 Other General Long-Term Debt 0.00 0.00 Net Pension Liability 0.00 0.00 Net OPEB Obligation 0.00 0.00 Compensated Absences Payable 0.00 0.00
Business-type activities long-term liabilities 0.00 0.00 0.00 0.00 0.00 0.00 0.00

Pacheco Union ElementaryShasta County
July 1 Budget2016-17 Estimated Actuals
Indirect Cost Rate Worksheet45 70094 0000000
Form ICR
California Dept of EducationSACS Financial Reporting Software - 2017.1.0File: icr (Rev 02/21/2017) Page 1 of 3 Printed: 5/31/2017 6:18 PM
Part I - General Administrative Share of Plant Services Costs
California's indirect cost plan allows that the general administrative costs in the indirect cost pool may include that portion of plant services costs (maintenance and operations costs and facilities rents and leases costs) attributable to the general administrative offices. The calculation of the plant services costs attributed to general administration and included in the pool is standardized and automated using the percentage of salaries and benefits relating to general administration as proxy for the percentage of square footage occupied by general administration.
A. Salaries and Benefits - Other General Administration and Centralized Data Processing 1. Salaries and benefits paid through payroll (Funds 01, 09, and 62, objects 1000-3999 except 3701-3702) (Functions 7200-7700, goals 0000 and 9000) 45,069.00 2. Contracted general administrative positions not paid through payroll a. Enter the costs, if any, of general administrative positions performing services ON SITE but paid through a contract, rather than through payroll, in functions 7200-7700, goals 0000 and 9000, Object 5800. b. If an amount is entered on Line A2a, provide the title, duties, and approximate FTE of each general administrative position paid through a contract. Retain supporting documentation in case of audit.
B. Salaries and Benefits - All Other Activities 1. Salaries and benefits paid through payroll (Funds 01, 09, and 62, objects 1000-3999 except 3701-3702) (Functions 1000-6999, 7100-7180, & 8100-8400; Functions 7200-7700, all goals except 0000 & 9000) 4,730,700.00 C. Percentage of Plant Services Costs Attributable to General Administration (Line A1 plus Line A2a, divided by Line B1; zero if negative) (See Part III, Lines A5 and A6) 0.95%
Part II - Adjustments for Employment Separation Costs
When an employee separates from service, the local educational agency (LEA) may incur costs associated with the separation in addition to the employee's regular salary and benefits for the final pay period. These additional costs can be categorized as "normal" or "abnormal or mass" separation costs.
Normal separation costs include items such as pay for accumulated unused leave or routine severance pay authorized by governing board policy. Normal separation costs are not allowable as direct costs to federal programs, but are allowable as indirect costs. State programs may have similar restrictions. Where federal or state program guidelines required that the LEA charge an employee's normal separation costs to an unrestricted resource rather than to the restricted program in which the employee worked, the LEA may identify and enter these costs on Line A for inclusion in the indirect cost pool.
Abnormal or mass separation costs are those costs resulting from actions taken by an LEA to influence employees to terminate their employment earlier than they normally would have. Abnormal or mass separation costs include retirement incentives such as a Golden Handshake or severance packages negotiated to effect termination. Abnormal or mass separation costs may not be charged to federal programs as either direct costs or indirect costs. Where an LEA paid abnormal or mass separation costs on behalf of positions in general administrative functions included in the indirect cost pool, the LEA must identify and enter these costs on Line B for exclusion from the pool.
A. Normal Separation Costs (optional) Enter any normal separation costs paid on behalf of employees of restricted state or federal programs that were charged to an unrestricted resource (0000-1999) in funds 01, 09, and 62 with functions 1000-6999 or 8100-8400 rather than to the restricted program. These costs will be moved in Part III from base costs to the indirect cost pool. Retain supporting documentation.
B. Abnormal or Mass Separation Costs (required) Enter any abnormal or mass separation costs paid on behalf of general administrative positions charged to unrestricted resources (0000-1999) in funds 01, 09, and 62 with functions 7200-7700. These costs will be moved in Part III from the indirect cost pool to base costs. If none, enter zero. 0.00

Pacheco Union ElementaryShasta County
July 1 Budget2016-17 Estimated Actuals
Indirect Cost Rate Worksheet45 70094 0000000
Form ICR
California Dept of EducationSACS Financial Reporting Software - 2017.1.0File: icr (Rev 02/21/2017) Page 2 of 3 Printed: 5/31/2017 6:18 PM
Part III - Indirect Cost Rate Calculation (Funds 01, 09, and 62, unless indicated otherwise)
A. Indirect Costs 1. Other General Administration, less portion charged to restricted resources or specific goals (Functions 7200-7600, objects 1000-5999, minus Line B9) 292,220.00 2. Centralized Data Processing, less portion charged to restricted resources or specific goals (Function 7700, objects 1000-5999, minus Line B10) 30,480.00 3. External Financial Audit - Single Audit (Function 7190, resources 0000-1999, goals 0000 and 9000, objects 5000-5999)
29,483.00 4. Staff Relations and Negotiations (Function 7120, resources 0000-1999, goals 0000 and 9000, objects 1000-5999) 122.00 5. Plant Maintenance and Operations (portion relating to general administrative offices only) (Functions 8100-8400, objects 1000-5999 except 5100, times Part I, Line C) 5,599.75 6. Facilities Rents and Leases (portion relating to general administrative offices only) (Function 8700, resources 0000-1999, objects 1000-5999 except 5100, times Part I, Line C) 0.00 7. Adjustment for Employment Separation Costs a. Plus: Normal Separation Costs (Part II, Line A) 0.00 b. Less: Abnormal or Mass Separation Costs (Part II, Line B) 0.00 8. Total Indirect Costs (Lines A1 through A7a, minus Line A7b) 357,904.75 9. Carry-Forward Adjustment (Part IV, Line F) 18,090.25 10. Total Adjusted Indirect Costs (Line A8 plus Line A9) 375,995.00
B. Base Costs 1. Instruction (Functions 1000-1999, objects 1000-5999 except 5100) 3,720,754.00 2. Instruction-Related Services (Functions 2000-2999, objects 1000-5999 except 5100) 933,427.00 3. Pupil Services (Functions 3000-3999, objects 1000-5999 except 5100) 457,761.00 4. Ancillary Services (Functions 4000-4999, objects 1000-5999 except 5100) 42,106.00 5. Community Services (Functions 5000-5999, objects 1000-5999 except 5100) 37,007.00 6. Enterprise (Function 6000, objects 1000-5999 except 5100) 0.00 7. Board and Superintendent (Functions 7100-7180, objects 1000-5999, minus Part III, Line A4) 120,343.00 8. External Financial Audit - Single Audit and Other (Functions 7190-7191, objects 5000-5999, minus Part III, Line A3) 0.00 9. Other General Administration (portion charged to restricted resources or specific goals only) (Functions 7200-7600, resources 2000-9999, objects 1000-5999; Functions 7200-7600, resources 0000-1999, all goals except 0000 and 9000, objects 1000-5999) 1.00 10. Centralized Data Processing (portion charged to restricted resources or specific goals only) (Function 7700, resources 2000-9999, objects 1000-5999; Function 7700, resources 0000-1999, all goals except 0000 and 9000, objects 1000-5999) 0.00 11. Plant Maintenance and Operations (all except portion relating to general administrative offices) (Functions 8100-8400, objects 1000-5999 except 5100, minus Part III, Line A5) 583,847.25 12. Facilities Rents and Leases (all except portion relating to general administrative offices) (Function 8700, objects 1000-5999 except 5100, minus Part III, Line A6) 0.00 13. Adjustment for Employment Separation Costs a. Less: Normal Separation Costs (Part II, Line A) 0.00 b. Plus: Abnormal or Mass Separation Costs (Part II, Line B) 0.00 14. Adult Education (Fund 11, functions 1000-6999, 8100-8400, and 8700, objects 1000-5999 except 5100) 0.00 15. Child Development (Fund 12, functions 1000-6999, 8100-8400, and 8700, objects 1000-5999 except 5100) 0.00 16. Cafeteria (Funds 13 and 61, functions 1000-6999, 8100-8400, and 8700, objects 1000-5999 except 5100) 144,129.00 17. Foundation (Funds 19 and 57, functions 1000-6999, 8100-8400, and 8700, objects 1000-5999 except 5100) 0.00 18. Total Base Costs (Lines B1 through B12 and Lines B13b through B17, minus Line B13a) 6,039,375.25
C. Straight Indirect Cost Percentage Before Carry-Forward Adjustment (For information only - not for use when claiming/recovering indirect costs) (Line A8 divided by Line B18) 5.93%
D. Preliminary Proposed Indirect Cost Rate (For final approved fixed-with-carry-forward rate for use in 2018-19 see www.cde.ca.gov/fg/ac/ic) (Line A10 divided by Line B18) 6.23%

Pacheco Union ElementaryShasta County
July 1 Budget2016-17 Estimated Actuals
Indirect Cost Rate Worksheet45 70094 0000000
Form ICR
California Dept of EducationSACS Financial Reporting Software - 2017.1.0File: icr (Rev 02/21/2017) Page 3 of 3 Printed: 5/31/2017 6:18 PM
Part IV - Carry-forward Adjustment
The carry-forward adjustment is an after-the-fact adjustment for the difference between indirect costs recoverable using the indirect cost rate approved for use in a given year, and the actual indirect costs incurred in that year. The carry-forward adjustment eliminates the need for LEAs to file amended federal reports when their actual indirect costs vary from the estimated indirect costs on which the approved rate was based.
Where the ratio of indirect costs incurred in the current year is less than the estimated ratio of indirect costs on which the approved rate for use in the current year was based, the carry-forward adjustment is limited by using either the approved rate times current year base costs, or the highest rate actually used to recover costs from any program times current year base costs, if the highest rate used was less than the approved rate. Rates used to recover costs from programs are displayed in Exhibit A.
A. Indirect costs incurred in the current year (Part III, Line A8) 357,904.75
B. Carry-forward adjustment from prior year(s)
1. Carry-forward adjustment from the second prior year (92,804.05)
2. Carry-forward adjustment amount deferred from prior year(s), if any 0.00
C. Carry-forward adjustment for under- or over-recovery in the current year
1. Under-recovery: Part III, Line A8, plus carry-forward adjustment from prior years, minus (approved indirect cost rate (4.09%) times Part III, Line B18); zero if negative 18,090.25
2. Over-recovery: Part III, Line A8, plus carry-forward adjustment from prior years, minus the lesser of (approved indirect cost rate (4.09%) times Part III, Line B18) or (the highest rate used to recover costs from any program (4.08%) times Part III, Line B18); zero if positive 0.00
D. Preliminary carry-forward adjustment (Line C1 or C2) 18,090.25
E. Optional allocation of negative carry-forward adjustment over more than one year
Where a negative carry-forward adjustment causes the proposed approved rate to fall below zero or would reduce the rate at which the LEA could recover indirect costs to such an extent that it would cause the LEA significant fiscal harm, the LEA may request that the carry-forward adjustment be allocated over more than one year. Where allocation of a negative carry-forward adjustment over more than one year does not resolve a negative rate, the CDE will work with the LEA on a case-by-case basis to establish an approved rate.
Option 1. Preliminary proposed approved rate (Part III, Line D) if entire negative carry-forward adjustment is applied to the current year calculation: not applicable
Option 2. Preliminary proposed approved rate (Part III, Line D) if one-half of negative carry-forward adjustment is applied to the current year calculation and the remainder is deferred to one or more future years: not applicable
Option 3. Preliminary proposed approved rate (Part III, Line D) if one-third of negative carry-forward adjustment is applied to the current year calculation and the remainder is deferred to one or more future years: not applicable
LEA request for Option 1, Option 2, or Option 3
1
F. Carry-forward adjustment used in Part III, Line A9 (Line D minus amount deferred if Option 2 or Option 3 is selected) 18,090.25

Pacheco Union ElementaryShasta County
July 1 Budget2016-17 Estimated Actuals
Exhibit A: Indirect Cost Rates Charged to Programs45 70094 0000000
Form ICR
California Dept of EducationSACS Financial Reporting Software - 2017.1.0File: icr (Rev 03/16/2012) Page 1 of 1 Printed: 5/31/2017 6:18 PM
Approved indirect cost rate: 4.09%Highest rate used in any program: 4.08%
Fund Resource
Eligible Expenditures(Objects 1000-5999
except Object 5100)Indirect Costs Charged
(Objects 7310 and 7350)RateUsed
01 3010 128,875.00 5,100.00 3.96%01 3310 112,698.00 4,600.00 4.08%01 4035 29,129.00 1,100.00 3.78%01 4050 202,444.00 7,700.00 3.80%01 5640 4,700.00 190.00 4.04%01 6500 481,795.00 19,500.00 4.05%

Pacheco Union ElementaryShasta County
July 1 Budget2016-17 Estimated Actuals
LOTTERY REPORTRevenues, Expenditures andEnding Balances - All Funds
45 70094 0000000Form L
California Dept of EducationSACS Financial Reporting Software - 2017.1.0File: lot (Rev 02/24/2016) Page 1 of 1 Printed: 5/31/2017 6:19 PM
Description Object Codes
Lottery:Unrestricted
(Resource 1100)
Transferred toOther
Resources forExpenditure
Lottery:Instructional
Materials(Resource 6300)* Totals
A. AMOUNT AVAILABLE FOR THIS FISCAL YEAR 1. Adjusted Beginning Fund Balance 9791-9795 77,840.00 47,924.00 125,764.00 2. State Lottery Revenue 8560 84,100.00 24,500.00 108,600.00 3. Other Local Revenue 8600-8799 0.00 0.00 0.00
4. Transfers from Funds of Lapsed/Reorganized Districts 8965 0.00 0.00 0.00 5. Contributions from Unrestricted Resources (Total must be zero) 8980 0.00 0.00 6. Total Available (Sum Lines A1 through A5) 161,940.00 0.00 72,424.00 234,364.00
B. EXPENDITURES AND OTHER FINANCING USES 1. Certificated Salaries 1000-1999 34,220.00 34,220.00 2. Classified Salaries 2000-2999 0.00 0.00 3. Employee Benefits 3000-3999 5,536.00 5,536.00 4. Books and Supplies 4000-4999 23,000.00 10,000.00 33,000.00
5. a. Services and Other Operating Expenditures (Resource 1100) 5000-5999 25,259.00 25,259.00
b. Services and Other Operating Expenditures (Resource 6300)
5000-5999, except5100, 5710, 5800
c. Duplicating Costs for Instructional Materials (Resource 6300) 5100, 5710, 5800 6. Capital Outlay 6000-6999 0.00 0.00 7. Tuition 7100-7199 0.00 0.00 8. Interagency Transfers Out a. To Other Districts, County Offices, and Charter Schools
7211,7212,7221,7222,7281,7282 0.00 0.00
b. To JPAs and All Others 7213,7223,7283,7299 0.00 0.00
9. Transfers of Indirect Costs 7300-7399 10. Debt Service 7400-7499 0.00 0.00 11. All Other Financing Uses 7630-7699 0.00 0.00 12. Total Expenditures and Other Financing Uses (Sum Lines B1 through B11 ) 88,015.00 0.00 10,000.00 98,015.00
C. ENDING BALANCE (Must equal Line A6 minus Line B12) 979Z 73,925.00 0.00 62,424.00 136,349.00D. COMMENTS:
Data from this report will be used to prepare a report to the Legislature as required by Control Section 24.60 of the Budget A
*Pursuant to Government Code Section 8880.4(a)(2)(B) and the definition in Education Code Section 60010(h), Resource 6300 funds are to be used for purchase of instructional materials only. Any amounts in the shaded cells of this column should be reviewed for appropriatene

Pacheco Union ElementaryShasta County
July 1 BudgetGeneral Fund
Multiyear ProjectionsUnrestricted
45 70094 0000000Form MYP
California Dept of EducationSACS Financial Reporting Software - 2017.1.0File: myp (Rev 03/30/2015) Page 1 Printed: 5/31/2017 6:19 PM
DescriptionObjectCodes
2017-18Budget
(Form 01)(A)
%Change
(Cols. C-A/A)(B)
2018-19Projection
(C)
%Change
(Cols. E-C/C)(D)
2019-20Projection
(E)
(Enter projections for subsequent years 1 and 2 in Columns C and E; current year - Column A - is extracted)A. REVENUES AND OTHER FINANCING SOURCES 1. LCFF/Revenue Limit Sources 8010-8099 5,249,028.00 2.00% 5,354,025.00 2.33% 5,478,866.00 2. Federal Revenues 8100-8299 0.00 0.00% 0.00 0.00% 0.00 3. Other State Revenues 8300-8599 100,352.00 0.00% 100,352.00 0.00% 100,352.00 4. Other Local Revenues 8600-8799 193,223.00 0.00% 193,223.00 0.00% 193,223.00 5. Other Financing Sources a. Transfers In 8900-8929 0.00 0.00% 0.00 0.00% 0.00 b. Other Sources 8930-8979 150,000.00 -100.00% 0.00 0.00% 0.00 c. Contributions 8980-8999 (553,210.00) -1.52% (544,812.00) 1.16% (551,122.00) 6. Total (Sum lines A1 thru A5c) 5,139,393.00 -0.71% 5,102,788.00 2.32% 5,221,319.00
B. EXPENDITURES AND OTHER FINANCING USES 1. Certificated Salaries a. Base Salaries 1,995,845.00 2,023,535.00 b. Step & Column Adjustment 27,690.00 27,690.00 c. Cost-of-Living Adjustment d. Other Adjustments e. Total Certificated Salaries (Sum lines B1a thru B1d) 1000-1999 1,995,845.00 1.39% 2,023,535.00 1.37% 2,051,225.00 2. Classified Salaries a. Base Salaries 845,503.00 857,498.00 b. Step & Column Adjustment 11,995.00 11,995.00 c. Cost-of-Living Adjustment d. Other Adjustments e. Total Classified Salaries (Sum lines B2a thru B2d) 2000-2999 845,503.00 1.42% 857,498.00 1.40% 869,493.00 3. Employee Benefits 3000-3999 949,115.00 7.57% 1,020,952.00 7.22% 1,094,688.00 4. Books and Supplies 4000-4999 193,492.00 0.00% 193,492.00 0.00% 193,492.00 5. Services and Other Operating Expenditures 5000-5999 859,985.00 0.23% 861,985.00 0.00% 861,985.00 6. Capital Outlay 6000-6999 150,000.00 -100.00% 0.00 0.00% 0.00 7. Other Outgo (excluding Transfers of Indirect Costs) 7100-7299, 7400-7499 50,000.00 0.00% 50,000.00 0.00% 50,000.00 8. Other Outgo - Transfers of Indirect Costs 7300-7399 (30,490.00) 0.00% (30,490.00) 0.00% (30,490.00) 9. Other Financing Uses a. Transfers Out 7600-7629 10,356.00 0.00% 10,356.00 0.00% 10,356.00 b. Other Uses 7630-7699 0.00 0.00% 0.00 0.00% 0.0010. Other Adjustments (Explain in Section F below) 0.00 0.0011. Total (Sum lines B1 thru B10) 5,023,806.00 -0.73% 4,987,328.00 2.27% 5,100,749.00C. NET INCREASE (DECREASE) IN FUND BALANCE (Line A6 minus line B11) 115,587.00 115,460.00 120,570.00
D. FUND BALANCE 1. Net Beginning Fund Balance (Form 01, line F1e) 1,216,546.00 1,332,133.00 1,447,593.00 2. Ending Fund Balance (Sum lines C and D1) 1,332,133.00 1,447,593.00 1,568,163.00
3. Components of Ending Fund Balance a. Nonspendable 9710-9719 75,036.00 75,036.00 75,036.00 b. Restricted 9740 c. Committed 1. Stabilization Arrangements 9750 0.00 0.00 0.00 2. Other Commitments 9760 0.00 0.00 0.00 d. Assigned 9780 1,004,997.00 1,121,616.00 1,237,397.00 e. Unassigned/Unappropriated 1. Reserve for Economic Uncertainties 9789 252,100.00 250,941.00 255,730.00 2. Unassigned/Unappropriated 9790 0.00 0.00 0.00 f. Total Components of Ending Fund Balance (Line D3f must agree with line D2) 1,332,133.00 1,447,593.00 1,568,163.00

Pacheco Union ElementaryShasta County
July 1 BudgetGeneral Fund
Multiyear ProjectionsUnrestricted
45 70094 0000000Form MYP
California Dept of EducationSACS Financial Reporting Software - 2017.1.0File: myp (Rev 03/30/2015) Page 2 Printed: 5/31/2017 6:19 PM
DescriptionObjectCodes
2017-18Budget
(Form 01)(A)
%Change
(Cols. C-A/A)(B)
2018-19Projection
(C)
%Change
(Cols. E-C/C)(D)
2019-20Projection
(E)E. AVAILABLE RESERVES 1. General Fund a. Stabilization Arrangements 9750 0.00 0.00 0.00 b. Reserve for Economic Uncertainties 9789 252,100.00 250,941.00 255,730.00 c. Unassigned/Unappropriated 9790 0.00 0.00 0.00(Enter reserve projections for subsequent years 1 and 2 in Columns C and E; current year - Column A - is extracted.) 2. Special Reserve Fund - Noncapital Outlay (Fund 17) a. Stabilization Arrangements 9750 b. Reserve for Economic Uncertainties 9789 c. Unassigned/Unappropriated 9790 3. Total Available Reserves (Sum lines E1a thru E2c) 252,100.00 250,941.00 255,730.00
F. ASSUMPTIONSPlease provide below or on a separate attachment, the assumptions used to determine the projections for the first and second subsequent fiscal years. Further, please include an explanation for any significant expenditure adjustments projected in lines B1d, B2d, and B10. For additional information, please refer to the Budget Assumptions section of the SACS Financial Reporting Software User Guide.
Assumptions on separate worksheet.Assumptions on separate worksheet.

Pacheco Union ElementaryShasta County
July 1 BudgetGeneral Fund
Multiyear ProjectionsRestricted
45 70094 0000000Form MYP
California Dept of EducationSACS Financial Reporting Software - 2017.1.0File: myp (Rev 03/30/2015) Page 1 Printed: 5/31/2017 6:19 PM
DescriptionObjectCodes
2017-18Budget
(Form 01)(A)
%Change
(Cols. C-A/A)(B)
2018-19Projection
(C)
%Change
(Cols. E-C/C)(D)
2019-20Projection
(E)
(Enter projections for subsequent years 1 and 2 in Columns C and E; current year - Column A - is extracted)A. REVENUES AND OTHER FINANCING SOURCES 1. LCFF/Revenue Limit Sources 8010-8099 0.00 0.00% 0.00 0.00% 0.00 2. Federal Revenues 8100-8299 283,734.00 0.00% 283,734.00 0.00% 283,734.00 3. Other State Revenues 8300-8599 111,686.00 0.00% 111,686.00 0.00% 111,686.00 4. Other Local Revenues 8600-8799 343,458.00 0.00% 343,458.00 0.00% 343,458.00 5. Other Financing Sources a. Transfers In 8900-8929 0.00 0.00% 0.00 0.00% 0.00 b. Other Sources 8930-8979 0.00 0.00% 0.00 0.00% 0.00 c. Contributions 8980-8999 553,210.00 -1.52% 544,812.00 1.16% 551,122.00 6. Total (Sum lines A1 thru A5c) 1,292,088.00 -0.65% 1,283,690.00 0.49% 1,290,000.00
B. EXPENDITURES AND OTHER FINANCING USES 1. Certificated Salaries a. Base Salaries 355,151.00 360,037.00 b. Step & Column Adjustment 4,886.00 4,886.00 c. Cost-of-Living Adjustment d. Other Adjustments e. Total Certificated Salaries (Sum lines B1a thru B1d) 1000-1999 355,151.00 1.38% 360,037.00 1.36% 364,923.00 2. Classified Salaries a. Base Salaries 193,561.00 193,834.00 b. Step & Column Adjustment 273.00 273.00 c. Cost-of-Living Adjustment d. Other Adjustments e. Total Classified Salaries (Sum lines B2a thru B2d) 2000-2999 193,561.00 0.14% 193,834.00 0.14% 194,107.00 3. Employee Benefits 3000-3999 271,978.00 0.39% 273,030.00 0.42% 274,181.00 4. Books and Supplies 4000-4999 58,930.00 0.00% 58,930.00 0.00% 58,930.00 5. Services and Other Operating Expenditures 5000-5999 367,368.00 0.00% 367,369.00 0.00% 367,369.00 6. Capital Outlay 6000-6999 0.00 0.00% 0.00 0.00% 0.00 7. Other Outgo (excluding Transfers of Indirect Costs) 7100-7299, 7400-7499 0.00 0.00% 0.00 0.00% 0.00 8. Other Outgo - Transfers of Indirect Costs 7300-7399 30,490.00 0.00% 30,490.00 0.00% 30,490.00 9. Other Financing Uses a. Transfers Out 7600-7629 0.00 0.00% 0.00 0.00% 0.00 b. Other Uses 7630-7699 0.00 0.00% 0.00 0.00% 0.0010. Other Adjustments (Explain in Section F below) 0.00 0.0011. Total (Sum lines B1 thru B10) 1,277,478.00 0.49% 1,283,690.00 0.49% 1,290,000.00C. NET INCREASE (DECREASE) IN FUND BALANCE (Line A6 minus line B11) 14,610.00 0.00 0.00
D. FUND BALANCE 1. Net Beginning Fund Balance (Form 01, line F1e) 220,947.00 235,557.00 235,557.00 2. Ending Fund Balance (Sum lines C and D1) 235,557.00 235,557.00 235,557.00 3. Components of Ending Fund Balance a. Nonspendable 9710-9719 0.00 0.00 0.00 b. Restricted 9740 235,557.00 235,557.00 235,557.00 c. Committed 1. Stabilization Arrangements 9750 2. Other Commitments 9760 d. Assigned 9780 e. Unassigned/Unappropriated 1. Reserve for Economic Uncertainties 9789 2. Unassigned/Unappropriated 9790 0.00 0.00 0.00 f. Total Components of Ending Fund Balance (Line D3f must agree with line D2) 235,557.00 235,557.00 235,557.00

Pacheco Union ElementaryShasta County
July 1 BudgetGeneral Fund
Multiyear ProjectionsRestricted
45 70094 0000000Form MYP
California Dept of EducationSACS Financial Reporting Software - 2017.1.0File: myp (Rev 03/30/2015) Page 2 Printed: 5/31/2017 6:19 PM
DescriptionObjectCodes
2017-18Budget
(Form 01)(A)
%Change
(Cols. C-A/A)(B)
2018-19Projection
(C)
%Change
(Cols. E-C/C)(D)
2019-20Projection
(E)
E. AVAILABLE RESERVES 1. General Fund a. Stabilization Arrangements 9750 b. Reserve for Economic Uncertainties 9789 c. Unassigned/Unappropriated 9790(Enter reserve projections for subsequent years 1 and 2 in Columns C and E; current year - Column A - is extracted.) 2. Special Reserve Fund - Noncapital Outlay (Fund 17) a. Stabilization Arrangements 9750 b. Reserve for Economic Uncertainties 9789 c. Unassigned/Unappropriated 9790 3. Total Available Reserves (Sum lines E1a thru E2c)F. ASSUMPTIONSPlease provide below or on a separate attachment, the assumptions used to determine the projections for the first andsecond subsequent fiscal years. Further, please include an explanation for any significant expenditure adjustmentsprojected in lines B1d, B2d, and B10. For additional information, please refer to the Budget Assumptions section of the SACS Financial Reporting Software User Guide.
Assumptions on separate worksheet.Assumptions on separate worksheet.

Pacheco Union ElementaryShasta County
July 1 BudgetGeneral Fund
Multiyear ProjectionsUnrestricted/Restricted
45 70094 0000000Form MYP
California Dept of EducationSACS Financial Reporting Software - 2017.1.0File: myp (Rev 03/09/2016) Page 1 Printed: 5/31/2017 6:19 PM
DescriptionObjectCodes
2017-18Budget
(Form 01)(A)
%Change
(Cols. C-A/A)(B)
2018-19Projection
(C)
%Change
(Cols. E-C/C)(D)
2019-20Projection
(E)(Enter projections for subsequent years 1 and 2 in Columns C and E; current year - Column A - is extracted)A. REVENUES AND OTHER FINANCING SOURCES 1. LCFF/Revenue Limit Sources 8010-8099 5,249,028.00 2.00% 5,354,025.00 2.33% 5,478,866.00 2. Federal Revenues 8100-8299 283,734.00 0.00% 283,734.00 0.00% 283,734.00 3. Other State Revenues 8300-8599 212,038.00 0.00% 212,038.00 0.00% 212,038.00 4. Other Local Revenues 8600-8799 536,681.00 0.00% 536,681.00 0.00% 536,681.00 5. Other Financing Sources a. Transfers In 8900-8929 0.00 0.00% 0.00 0.00% 0.00 b. Other Sources 8930-8979 150,000.00 -100.00% 0.00 0.00% 0.00 c. Contributions 8980-8999 0.00 0.00% 0.00 0.00% 0.00
6. Total (Sum lines A1 thru A5c) 6,431,481.00 -0.70% 6,386,478.00 1.95% 6,511,319.00
B. EXPENDITURES AND OTHER FINANCING USES
1. Certificated Salaries
a. Base Salaries 2,350,996.00 2,383,572.00
b. Step & Column Adjustment 32,576.00 32,576.00
c. Cost-of-Living Adjustment 0.00 0.00
d. Other Adjustments 0.00 0.00
e. Total Certificated Salaries (Sum lines B1a thru B1d) 1000-1999 2,350,996.00 1.39% 2,383,572.00 1.37% 2,416,148.00
2. Classified Salaries
a. Base Salaries 1,039,064.00 1,051,332.00
b. Step & Column Adjustment 12,268.00 12,268.00
c. Cost-of-Living Adjustment 0.00 0.00
d. Other Adjustments 0.00 0.00
e. Total Classified Salaries (Sum lines B2a thru B2d) 2000-2999 1,039,064.00 1.18% 1,051,332.00 1.17% 1,063,600.00
3. Employee Benefits 3000-3999 1,221,093.00 5.97% 1,293,982.00 5.79% 1,368,869.00
4. Books and Supplies 4000-4999 252,422.00 0.00% 252,422.00 0.00% 252,422.00
5. Services and Other Operating Expenditures 5000-5999 1,227,353.00 0.16% 1,229,354.00 0.00% 1,229,354.00
6. Capital Outlay 6000-6999 150,000.00 -100.00% 0.00 0.00% 0.00
7. Other Outgo (excluding Transfers of Indirect Costs) 7100-7299, 7400-7499 50,000.00 0.00% 50,000.00 0.00% 50,000.00
8. Other Outgo - Transfers of Indirect Costs 7300-7399 0.00 0.00% 0.00 0.00% 0.00 9. Other Financing Uses a. Transfers Out 7600-7629 10,356.00 0.00% 10,356.00 0.00% 10,356.00
b. Other Uses 7630-7699 0.00 0.00% 0.00 0.00% 0.00
10. Other Adjustments 0.00 0.00
11. Total (Sum lines B1 thru B10) 6,301,284.00 -0.48% 6,271,018.00 1.91% 6,390,749.00
C. NET INCREASE (DECREASE) IN FUND BALANCE
(Line A6 minus line B11) 130,197.00 115,460.00 120,570.00
D. FUND BALANCE
1. Net Beginning Fund Balance (Form 01, line F1e) 1,437,493.00 1,567,690.00 1,683,150.00 2. Ending Fund Balance (Sum lines C and D1) 1,567,690.00 1,683,150.00 1,803,720.00 3. Components of Ending Fund Balance
a. Nonspendable 9710-9719 75,036.00 75,036.00 75,036.00 b. Restricted 9740 235,557.00 235,557.00 235,557.00 c. Committed 1. Stabilization Arrangements 9750 0.00 0.00 0.00 2. Other Commitments 9760 0.00 0.00 0.00 d. Assigned 9780 1,004,997.00 1,121,616.00 1,237,397.00
e. Unassigned/Unappropriated 1. Reserve for Economic Uncertainties 9789 252,100.00 250,941.00 255,730.00 2. Unassigned/Unappropriated 9790 0.00 0.00 0.00 f. Total Components of Ending Fund Balance
(Line D3f must agree with line D2) 1,567,690.00 1,683,150.00 1,803,720.00

Pacheco Union ElementaryShasta County
July 1 BudgetGeneral Fund
Multiyear ProjectionsUnrestricted/Restricted
45 70094 0000000Form MYP
California Dept of EducationSACS Financial Reporting Software - 2017.1.0File: myp (Rev 03/09/2016) Page 2 Printed: 5/31/2017 6:19 PM
DescriptionObjectCodes
2017-18Budget
(Form 01)(A)
%Change
(Cols. C-A/A)(B)
2018-19Projection
(C)
%Change
(Cols. E-C/C)(D)
2019-20Projection
(E)
E. AVAILABLE RESERVES
1. General Fund a. Stabilization Arrangements 9750 0.00 0.00 0.00
b. Reserve for Economic Uncertainties 9789 252,100.00 250,941.00 255,730.00
c. Unassigned/Unappropriated 9790 0.00 0.00 0.00
d. Negative Restricted Ending Balances
(Negative resources 2000-9999) 979Z 0.00 0.00
2. Special Reserve Fund - Noncapital Outlay (Fund 17) a. Stabilization Arrangements 9750 0.00 0.00 0.00
b. Reserve for Economic Uncertainties 9789 0.00 0.00 0.00
c. Unassigned/Unappropriated 9790 0.00 0.00 0.00 3. Total Available Reserves - by Amount (Sum lines E1a thru E2c) 252,100.00 250,941.00 255,730.00
4. Total Available Reserves - by Percent (Line E3 divided by Line F3c) 4.00% 4.00% 4.00%
F. RECOMMENDED RESERVES
1. Special Education Pass-through Exclusions
For districts that serve as the administrative unit (AU) of a
special education local plan area (SELPA):
a. Do you choose to exclude from the reserve calculation
the pass-through funds distributed to SELPA members? No
b. If you are the SELPA AU and are excluding special
education pass-through funds: 1. Enter the name(s) of the SELPA(s):
2. Special education pass-through funds
(Column A: Fund 10, resources 3300-3499 and 6500-6540,
objects 7211-7213 and 7221-7223; enter projections for subsequent years 1 and 2 in Columns C and E) 0.00 0.00 0.00
2. District ADA
Used to determine the reserve standard percentage level on line F3d
(Col. A: Form A, Estimated P-2 ADA column, Lines A4 and C4; enter projections) 593.60 596.43 597.38
3. Calculating the Reserves a. Expenditures and Other Financing Uses (Line B11) 6,301,284.00 6,271,018.00 6,390,749.00
b. Plus: Special Education Pass-through Funds (Line F1b2, if Line F1a is No) 0.00 0.00 0.00
c. Total Expenditures and Other Financing Uses (Line F3a plus line F3b) 6,301,284.00 6,271,018.00 6,390,749.00
d. Reserve Standard Percentage Level
(Refer to Form 01CS, Criterion 10 for calculation details) 4% 4% 4%
e. Reserve Standard - By Percent (Line F3c times F3d) 252,051.36 250,840.72 255,629.96
f. Reserve Standard - By Amount
(Refer to Form 01CS, Criterion 10 for calculation details) 66,000.00 66,000.00 66,000.00
g. Reserve Standard (Greater of Line F3e or F3f) 252,051.36 250,840.72 255,629.96
h. Available Reserves (Line E3) Meet Reserve Standard (Line F3g) YES YES YES

Pacheco Union ElementaryShasta County
July 1 Budget2016-17 Estimated Actuals
No Child Left Behind Maintenance of Effort Expenditures45 70094 0000000
Form NCMOE
California Dept of EducationSACS Financial Reporting Software - 2017.1.0File: ncmoe (Rev 03/18/2015) Page 1 Printed: 5/31/2017 6:20 PM
Funds 01, 09, and 62
Section I - Expenditures Goals Functions Objects
2016-17Expenditures
A. Total state, federal, and local expenditures (all resources) All All 1000-7999 6,876,684.00
B. Less all federal expenditures not allowed for MOE(Resources 3000-5999, except 3385) All All 1000-7999 826,375.00
C. Less state and local expenditures not allowed for MOE:(All resources, except federal as identified in Line B)1. Community Services All 5000-5999 1000-7999 37,007.00
2. Capital OutlayAll except7100-7199
All except5000-5999 6000-6999 0.00
3. Debt Service All 9100
5400-5450,5800, 7430-
7439 15,000.00
4. Other Transfers Out All 9200 7200-7299 0.00
5. Interfund Transfers Out All 9300 7600-7629 22,368.00
9100 7699
6. All Other Financing Uses All 9200 7651 0.00
7. Nonagency 7100-7199
All except5000-5999,9000-9999 1000-7999 43,314.00
8. Tuition (Revenue, in lieu of expenditures, to approximatecosts of services for which tuition is received)
All All 8710 0.00
9. Supplemental expenditures made as a result of aPresidentially declared disaster
Manually entered. Must not includeexpenditures in lines B, C1-C8, D1, or
D2.
10. Total state and local expenditures not allowed for MOE calculation(Sum lines C1 through C9) 117,689.00
1000-7143,
D. Plus additional MOE expenditures: 7300-7439
1. Expenditures to cover deficits for food services(Funds 13 and 61) (If negative, then zero) All All
minus8000-8699 22,368.00
2. Expenditures to cover deficits for student body activitiesManually entered. Must not include
expenditures in lines A or D1.
E. Total expenditures subject to MOE(Line A minus lines B and C10, plus lines D1 and D2) 5,954,988.00

Pacheco Union ElementaryShasta County
July 1 Budget2016-17 Estimated Actuals
No Child Left Behind Maintenance of Effort Expenditures45 70094 0000000
Form NCMOE
California Dept of EducationSACS Financial Reporting Software - 2017.1.0File: ncmoe (Rev 03/18/2015) Page 2 Printed: 5/31/2017 6:20 PM
Section II - Expenditures Per ADA
2016-17Annual ADA/
Exps. Per ADA
A. Average Daily Attendance(Form A, Annual ADA column, sum of lines A6 and C9)
598.74
B. Expenditures per ADA (Line I.E divided by Line II.A) 9,945.87
Section III - MOE Calculation (For data collection only. Finaldetermination will be done by CDE) Total Per ADA
A. Base expenditures (Preloaded expenditures from prior year official CDEMOE calculation). (Note: If the prior year MOE was not met, CDE hasadjusted the prior year base to 90 percent of the preceding prior yearamount rather than the actual prior year expenditure amount.)
5,844,843.59 10,265.641. Adjustment to base expenditure and expenditure per ADA amounts for
LEAs failing prior year MOE calculation (From Section IV) 0.00 0.00
2. Total adjusted base expenditure amounts (Line A plus Line A.1) 5,844,843.59 10,265.64
B. Required effort (Line A.2 times 90%) 5,260,359.23 9,239.08
C. Current year expenditures (Line I.E and Line II.B) 5,954,988.00 9,945.87
D. MOE deficiency amount, if any (Line B minus Line C)(If negative, then zero) 0.00 0.00
E. MOE determination(If one or both of the amounts in line D are zero, the MOE requirement MOE Metis met; if both amounts are positive, the MOE requirement is not met. Ifeither column in Line A.2 or Line C equals zero, the MOE calculation isincomplete.)
F. MOE deficiency percentage, if MOE not met; otherwise, zero(Line D divided by Line B)(Funding under NCLB covered programs in FY 2018-19 maybe reduced by the lower of the two percentages) 0.00% 0.00%

Pacheco Union ElementaryShasta County
July 1 Budget2016-17 Estimated Actuals
No Child Left Behind Maintenance of Effort Expenditures45 70094 0000000
Form NCMOE
California Dept of EducationSACS Financial Reporting Software - 2017.1.0File: ncmoe (Rev 03/18/2015) Page 3 Printed: 5/31/2017 6:20 PM
SECTION IV - Detail of Adjustments to Base Expenditures (used in Section III, Line A.1)
Description of AdjustmentsTotal
ExpendituresExpenditures
Per ADA
Total adjustments to base expenditures 0.00 0.00

Pacheco Union ElementaryShasta County
July 1 Budget2016-17 Estimated Actuals
SUMMARY OF INTERFUND ACTIVITIESFOR ALL FUNDS
45 70094 0000000Form SIAA
California Dept of EducationSACS Financial Reporting Software - 2017.1.0File: siaa (Rev 05/16/2016) Page 1 of 2 Printed: 5/31/2017 6:20 PM
Direct Costs - Interfund Indirect Costs - Interfund Interfund Interfund Due From Due To
DescriptionTransfers In
5750Transfers Out
5750Transfers In
7350Transfers Out
7350Transfers In8900-8929
Transfers Out7600-7629
Other Funds9310
Other Funds9610
01 GENERAL FUND Expenditure Detail 0.00 0.00 0.00 0.00 Other Sources/Uses Detail 0.00 22,368.00 Fund Reconciliation 0.00 0.0009 CHARTER SCHOOLS SPECIAL REVENUE FUND Expenditure Detail 0.00 0.00 0.00 0.00 Other Sources/Uses Detail 0.00 0.00 Fund Reconciliation 0.00 0.0010 SPECIAL EDUCATION PASS-THROUGH FUND Expenditure Detail Other Sources/Uses Detail Fund Reconciliation 0.00 0.0011 ADULT EDUCATION FUND Expenditure Detail 0.00 0.00 0.00 0.00 Other Sources/Uses Detail 0.00 0.00 Fund Reconciliation 0.00 0.0012 CHILD DEVELOPMENT FUND Expenditure Detail 0.00 0.00 0.00 0.00 Other Sources/Uses Detail 0.00 0.00 Fund Reconciliation 0.00 0.0013 CAFETERIA SPECIAL REVENUE FUND Expenditure Detail 0.00 0.00 0.00 0.00 Other Sources/Uses Detail 22,368.00 0.00 Fund Reconciliation 0.00 0.0014 DEFERRED MAINTENANCE FUND Expenditure Detail 0.00 0.00 Other Sources/Uses Detail 0.00 0.00 Fund Reconciliation 0.00 0.0015 PUPIL TRANSPORTATION EQUIPMENT FUND Expenditure Detail 0.00 0.00 Other Sources/Uses Detail 0.00 0.00 Fund Reconciliation 0.00 0.0017 SPECIAL RESERVE FUND FOR OTHER THAN CAPITAL OUTLAY
Expenditure Detail Other Sources/Uses Detail 0.00 0.00 Fund Reconciliation 0.00 0.0018 SCHOOL BUS EMISSIONS REDUCTION FUND Expenditure Detail 0.00 0.00 Other Sources/Uses Detail 0.00 0.00 Fund Reconciliation 0.00 0.0019 FOUNDATION SPECIAL REVENUE FUND Expenditure Detail 0.00 0.00 0.00 0.00 Other Sources/Uses Detail 0.00 Fund Reconciliation 0.00 0.0020 SPECIAL RESERVE FUND FOR POSTEMPLOYMENT BENEFITS
Expenditure Detail Other Sources/Uses Detail 0.00 0.00 Fund Reconciliation 0.00 0.0021 BUILDING FUND Expenditure Detail 0.00 0.00 Other Sources/Uses Detail 0.00 0.00 Fund Reconciliation 0.00 0.0025 CAPITAL FACILITIES FUND Expenditure Detail 0.00 0.00 Other Sources/Uses Detail 0.00 0.00 Fund Reconciliation 0.00 0.0030 STATE SCHOOL BUILDING LEASE/PURCHASE FUND Expenditure Detail 0.00 0.00 Other Sources/Uses Detail 0.00 0.00 Fund Reconciliation 0.00 0.0035 COUNTY SCHOOL FACILITIES FUND Expenditure Detail 0.00 0.00 Other Sources/Uses Detail 0.00 0.00 Fund Reconciliation 0.00 0.0040 SPECIAL RESERVE FUND FOR CAPITAL OUTLAY PROJECTS
Expenditure Detail 0.00 0.00 Other Sources/Uses Detail 0.00 0.00 Fund Reconciliation 0.00 0.0049 CAP PROJ FUND FOR BLENDED COMPONENT UNITS Expenditure Detail 0.00 0.00 Other Sources/Uses Detail 0.00 0.00 Fund Reconciliation 0.00 0.0051 BOND INTEREST AND REDEMPTION FUND Expenditure Detail Other Sources/Uses Detail 0.00 0.00 Fund Reconciliation 0.00 0.0052 DEBT SVC FUND FOR BLENDED COMPONENT UNITS Expenditure Detail Other Sources/Uses Detail 0.00 0.00 Fund Reconciliation 0.00 0.0053 TAX OVERRIDE FUND Expenditure Detail Other Sources/Uses Detail 0.00 0.00 Fund Reconciliation 0.00 0.0056 DEBT SERVICE FUND Expenditure Detail Other Sources/Uses Detail 0.00 0.00 Fund Reconciliation 0.00 0.0057 FOUNDATION PERMANENT FUND Expenditure Detail 0.00 0.00 0.00 0.00 Other Sources/Uses Detail 0.00 Fund Reconciliation 0.00 0.0061 CAFETERIA ENTERPRISE FUND Expenditure Detail 0.00 0.00 0.00 0.00 Other Sources/Uses Detail 0.00 0.00 Fund Reconciliation 0.00 0.00

Pacheco Union ElementaryShasta County
July 1 Budget2016-17 Estimated Actuals
SUMMARY OF INTERFUND ACTIVITIESFOR ALL FUNDS
45 70094 0000000Form SIAA
California Dept of EducationSACS Financial Reporting Software - 2017.1.0File: siaa (Rev 05/16/2016) Page 2 of 2 Printed: 5/31/2017 6:20 PM
Direct Costs - Interfund Indirect Costs - Interfund Interfund Interfund Due From Due To
DescriptionTransfers In
5750Transfers Out
5750Transfers In
7350Transfers Out
7350Transfers In8900-8929
Transfers Out7600-7629
Other Funds9310
Other Funds9610
62 CHARTER SCHOOLS ENTERPRISE FUND Expenditure Detail 0.00 0.00 0.00 0.00 Other Sources/Uses Detail 0.00 0.00 Fund Reconciliation 0.00 0.0063 OTHER ENTERPRISE FUND Expenditure Detail 0.00 0.00 Other Sources/Uses Detail 0.00 0.00 Fund Reconciliation 0.00 0.0066 WAREHOUSE REVOLVING FUND Expenditure Detail 0.00 0.00 Other Sources/Uses Detail 0.00 0.00 Fund Reconciliation 0.00 0.0067 SELF-INSURANCE FUND Expenditure Detail 0.00 0.00 Other Sources/Uses Detail 0.00 0.00 Fund Reconciliation 0.00 0.0071 RETIREE BENEFIT FUND Expenditure Detail Other Sources/Uses Detail 0.00 Fund Reconciliation 0.00 0.0073 FOUNDATION PRIVATE-PURPOSE TRUST FUND Expenditure Detail 0.00 0.00 Other Sources/Uses Detail 0.00 Fund Reconciliation 0.00 0.0076 WARRANT/PASS-THROUGH FUND Expenditure Detail Other Sources/Uses Detail Fund Reconciliation 0.00 0.0095 STUDENT BODY FUND Expenditure Detail Other Sources/Uses Detail Fund Reconciliation 0.00 0.00 TOTALS 0.00 0.00 0.00 0.00 22,368.00 22,368.00 0.00 0.00

Pacheco Union ElementaryShasta County
July 1 Budget2017-18 Budget
SUMMARY OF INTERFUND ACTIVITIESFOR ALL FUNDS
45 70094 0000000Form SIAB
California Dept of EducationSACS Financial Reporting Software - 2017.1.0File: siab (Rev 05/16/2016) Page 1 of 2 Printed: 5/31/2017 6:21 PM
Direct Costs - Interfund Indirect Costs - Interfund Interfund Interfund Due From Due To
DescriptionTransfers In
5750Transfers Out
5750Transfers In
7350Transfers Out
7350Transfers In8900-8929
Transfers Out7600-7629
Other Funds9310
Other Funds9610
01 GENERAL FUND Expenditure Detail 0.00 0.00 0.00 0.00 Other Sources/Uses Detail 0.00 10,356.00 Fund Reconciliation09 CHARTER SCHOOLS SPECIAL REVENUE FUND Expenditure Detail 0.00 0.00 0.00 0.00 Other Sources/Uses Detail 0.00 0.00 Fund Reconciliation10 SPECIAL EDUCATION PASS-THROUGH FUND Expenditure Detail Other Sources/Uses Detail Fund Reconciliation11 ADULT EDUCATION FUND Expenditure Detail 0.00 0.00 0.00 0.00 Other Sources/Uses Detail 0.00 0.00 Fund Reconciliation12 CHILD DEVELOPMENT FUND Expenditure Detail 0.00 0.00 0.00 0.00 Other Sources/Uses Detail 0.00 0.00 Fund Reconciliation13 CAFETERIA SPECIAL REVENUE FUND Expenditure Detail 0.00 0.00 0.00 0.00 Other Sources/Uses Detail 10,356.00 0.00 Fund Reconciliation14 DEFERRED MAINTENANCE FUND Expenditure Detail 0.00 0.00 Other Sources/Uses Detail 0.00 0.00 Fund Reconciliation15 PUPIL TRANSPORTATION EQUIPMENT FUND Expenditure Detail 0.00 0.00 Other Sources/Uses Detail 0.00 0.00 Fund Reconciliation17 SPECIAL RESERVE FUND FOR OTHER THAN CAPITAL OUTLAY
Expenditure Detail Other Sources/Uses Detail 0.00 0.00 Fund Reconciliation18 SCHOOL BUS EMISSIONS REDUCTION FUND Expenditure Detail 0.00 0.00 Other Sources/Uses Detail 0.00 0.00 Fund Reconciliation19 FOUNDATION SPECIAL REVENUE FUND Expenditure Detail 0.00 0.00 0.00 0.00 Other Sources/Uses Detail 0.00 Fund Reconciliation20 SPECIAL RESERVE FUND FOR POSTEMPLOYMENT BENEFITS
Expenditure Detail Other Sources/Uses Detail 0.00 0.00 Fund Reconciliation21 BUILDING FUND Expenditure Detail 0.00 0.00 Other Sources/Uses Detail 0.00 0.00 Fund Reconciliation25 CAPITAL FACILITIES FUND Expenditure Detail 0.00 0.00 Other Sources/Uses Detail 0.00 0.00 Fund Reconciliation30 STATE SCHOOL BUILDING LEASE/PURCHASE FUND Expenditure Detail 0.00 0.00 Other Sources/Uses Detail 0.00 0.00 Fund Reconciliation35 COUNTY SCHOOL FACILITIES FUND Expenditure Detail 0.00 0.00 Other Sources/Uses Detail 0.00 0.00 Fund Reconciliation40 SPECIAL RESERVE FUND FOR CAPITAL OUTLAY PROJECTS
Expenditure Detail 0.00 0.00 Other Sources/Uses Detail 0.00 0.00 Fund Reconciliation49 CAP PROJ FUND FOR BLENDED COMPONENT UNITS Expenditure Detail 0.00 0.00 Other Sources/Uses Detail 0.00 0.00 Fund Reconciliation51 BOND INTEREST AND REDEMPTION FUND Expenditure Detail Other Sources/Uses Detail 0.00 0.00 Fund Reconciliation52 DEBT SVC FUND FOR BLENDED COMPONENT UNITS Expenditure Detail Other Sources/Uses Detail 0.00 0.00 Fund Reconciliation53 TAX OVERRIDE FUND Expenditure Detail Other Sources/Uses Detail 0.00 0.00 Fund Reconciliation56 DEBT SERVICE FUND Expenditure Detail Other Sources/Uses Detail 0.00 0.00 Fund Reconciliation57 FOUNDATION PERMANENT FUND Expenditure Detail 0.00 0.00 0.00 0.00 Other Sources/Uses Detail 0.00 Fund Reconciliation61 CAFETERIA ENTERPRISE FUND Expenditure Detail 0.00 0.00 0.00 0.00 Other Sources/Uses Detail 0.00 0.00 Fund Reconciliation

Pacheco Union ElementaryShasta County
July 1 Budget2017-18 Budget
SUMMARY OF INTERFUND ACTIVITIESFOR ALL FUNDS
45 70094 0000000Form SIAB
California Dept of EducationSACS Financial Reporting Software - 2017.1.0File: siab (Rev 05/16/2016) Page 2 of 2 Printed: 5/31/2017 6:21 PM
Direct Costs - Interfund Indirect Costs - Interfund Interfund Interfund Due From Due To
DescriptionTransfers In
5750Transfers Out
5750Transfers In
7350Transfers Out
7350Transfers In8900-8929
Transfers Out7600-7629
Other Funds9310
Other Funds9610
62 CHARTER SCHOOLS ENTERPRISE FUND Expenditure Detail 0.00 0.00 0.00 0.00 Other Sources/Uses Detail 0.00 0.00 Fund Reconciliation63 OTHER ENTERPRISE FUND Expenditure Detail 0.00 0.00 Other Sources/Uses Detail 0.00 0.00 Fund Reconciliation66 WAREHOUSE REVOLVING FUND Expenditure Detail 0.00 0.00 Other Sources/Uses Detail 0.00 0.00 Fund Reconciliation67 SELF-INSURANCE FUND Expenditure Detail 0.00 0.00 Other Sources/Uses Detail 0.00 0.00 Fund Reconciliation71 RETIREE BENEFIT FUND Expenditure Detail Other Sources/Uses Detail 0.00 Fund Reconciliation73 FOUNDATION PRIVATE-PURPOSE TRUST FUND Expenditure Detail 0.00 0.00 Other Sources/Uses Detail 0.00 Fund Reconciliation76 WARRANT/PASS-THROUGH FUND Expenditure Detail Other Sources/Uses Detail Fund Reconciliation95 STUDENT BODY FUND Expenditure Detail Other Sources/Uses Detail Fund Reconciliation TOTALS 0.00 0.00 0.00 0.00 10,356.00 10,356.00

Pacheco Union ElementaryShasta County
2017-18 July 1 BudgetGeneral Fund
School District Criteria and Standards Review45 70094 0000000
Form 01CS
California Dept of EducationSACS Financial Reporting Software - 2017.1.0File: cs-a (Rev 04/10/2017) Page 1 of 27 Printed: 5/31/2017 6:22 PM
Provide methodology and assumptions used to estimate ADA, enrollment, revenues, expenditures, reserves and fund balance, and multiyear commitments (including cost-of-living adjustments).
Deviations from the standards must be explained and may affect the approval of the budget.
CRITERIA AND STANDARDS
1. CRITERION: Average Daily Attendance
STANDARD: Funded average daily attendance (ADA) has not been overestimated in 1) the first prior fiscal year OR in 2) two or more of the previous three fiscal years by more than the following percentage levels:
Percentage Level District ADA3.0% 0 to 3002.0% 301 to 1,0001.0% 1,001 and over
District ADA (Form A, Estimated P-2 ADA column, lines A4 and C4): 594
District's ADA Standard Percentage Level: 2.0%
1A. Calculating the District's ADA Variances
DATA ENTRY: For the Third, Second, and First Prior Years, enter Estimated Funded ADA in the Original Budget Funded ADA column; enter district regular ADA and charter school ADAcorresponding to financial data reported in the General Fund, only, for the Third, Second, and First Prior Years. All other data are extracted.
*Please note for FY 2014-15 original budget: Line C4 in Form A reflects total charter school ADA corresponding to financial data reported in funds 01, 09, and 62. Please adjust charter schoolADA or explain accordingly.
Original Budget Estimated/Unaudited Actuals ADA Variance LevelFunded ADA Funded ADA
(If Budget is greater Fiscal Year (Form A, Lines A4 and C4)* (Form A, Lines A4 and C4) than Actuals, else N/A) Status
Third Prior Year (2014-15) District Regular 566 555 Charter School
Total ADA 566 555 1.9% MetSecond Prior Year (2015-16)
District Regular 566 567 Charter School
Total ADA 566 567 N/A MetFirst Prior Year (2016-17)
District Regular 571 596 Charter School 0
Total ADA 571 596 N/A MetBudget Year (2017-18)
District Regular 596 Charter School 0
Total ADA 596
1B. Comparison of District ADA to the Standard
DATA ENTRY: Enter an explanation if the standard is not met.
1a. STANDARD MET - Funded ADA has not been overestimated by more than the standard percentage level for the first prior year.
Explanation:
(required if NOT met)
1b. STANDARD MET - Funded ADA has not been overestimated by more than the standard percentage level for two or more of the previous three years.
Explanation:
(required if NOT met)

Pacheco Union ElementaryShasta County
2017-18 July 1 BudgetGeneral Fund
School District Criteria and Standards Review45 70094 0000000
Form 01CS
California Dept of EducationSACS Financial Reporting Software - 2017.1.0File: cs-a (Rev 04/10/2017) Page 2 of 27 Printed: 5/31/2017 6:22 PM
2. CRITERION: Enrollment
STANDARD: Projected enrollment has not been overestimated in 1) the first prior fiscal year OR in 2) two or more of the previous three fiscal years by more than the following percentage levels:
Percentage Level District ADA3.0% 0 to 3002.0% 301 to 1,0001.0% 1,001 and over
District ADA (Form A, Estimated P-2 ADA column, lines A4 and C4): 594
District's Enrollment Standard Percentage Level: 2.0%
2A. Calculating the District's Enrollment Variances
DATA ENTRY: Enter data in the Enrollment, Budget, column for all fiscal years and in the Enrollment, CBEDS Actual column for the First Prior Year; all other data are extracted or calculated.CBEDS Actual enrollment data preloaded in the District Regular lines will include both District Regular and Charter School enrollment. Districts will need to adjust the District Regular enrollmentlines and the Charter School enrollment lines accordingly. Enter district regular enrollment and charter school enrollment corresponding to financial data reported in the General Fund, only, for allfiscal years.
Enrollment Variance LevelEnrollment (If Budget is greater
Fiscal Year Budget CBEDS Actual than Actual, else N/A) StatusThird Prior Year (2014-15)
District Regular 592 575 Charter School
Total Enrollment 592 575 2.9% Not MetSecond Prior Year (2015-16)
District Regular 595 598 Charter School
Total Enrollment 595 598 N/A MetFirst Prior Year (2016-17)
District Regular 601 617 Charter School
Total Enrollment 601 617 N/A MetBudget Year (2017-18)
District Regular 628 Charter School
Total Enrollment 628
2B. Comparison of District Enrollment to the Standard
DATA ENTRY: Enter an explanation if the standard is not met.
1a. STANDARD MET - Enrollment has not been overestimated by more than the standard percentage level for the first prior year.
Explanation:
(required if NOT met)
1b. STANDARD MET - Enrollment has not been overestimated by more than the standard percentage level for two or more of the previous three years.
Explanation:
(required if NOT met)

Pacheco Union ElementaryShasta County
2017-18 July 1 BudgetGeneral Fund
School District Criteria and Standards Review45 70094 0000000
Form 01CS
California Dept of EducationSACS Financial Reporting Software - 2017.1.0File: cs-a (Rev 04/10/2017) Page 3 of 27 Printed: 5/31/2017 6:22 PM
3. CRITERION: ADA to Enrollment
STANDARD: Projected second period (P-2) average daily attendance (ADA) to enrollment ratio for any of the budget year or two subsequent fiscal yearshas not increased from the historical average ratio from the three prior fiscal years by more than one half of one percent (0.5%).
3A. Calculating the District's ADA to Enrollment Standard
DATA ENTRY: All data are extracted or calculated. Data should reflect district regular and charter school ADA/enrollment corresponding to financial data reported in the General Fund, only, forall fiscal years.
P-2 ADA Enrollment Estimated/Unaudited Actuals CBEDS Actual Historical Ratio
Fiscal Year (Form A, Lines A4 and C4) (Criterion 2, Item 2A) of ADA to EnrollmentThird Prior Year (2014-15)
District Regular 554 575 Charter School 0
Total ADA/Enrollment 554 575 96.3%Second Prior Year (2015-16)
District Regular 568 598 Charter School
Total ADA/Enrollment 568 598 95.0%First Prior Year (2016-17)
District Regular 596 617 Charter School 0
Total ADA/Enrollment 596 617 96.6%Historical Average Ratio: 96.0%
District's ADA to Enrollment Standard (historical average ratio plus 0.5%): 96.5%
3B. Calculating the District's Projected Ratio of ADA to Enrollment
DATA ENTRY: Enter data in the Estimated P-2 ADA column for the two subsequent years. Enter data in the Enrollment column for the two subsequent years. Data should reflect district regularand charter school ADA/enrollment corresponding to financial data reported in the General Fund only, for all fiscal years. All other data are extracted or calculated.
Estimated P-2 ADA EnrollmentBudget Budget/Projected
Fiscal Year (Form A, Lines A4 and C4) (Criterion 2, Item 2A) Ratio of ADA to Enrollment StatusBudget Year (2017-18)
District Regular 594 628 Charter School 0
Total ADA/Enrollment 594 628 94.6% Met1st Subsequent Year (2018-19)
District Regular 596 631 Charter School
Total ADA/Enrollment 596 631 94.5% Met2nd Subsequent Year (2019-20)
District Regular 597 632 Charter School
Total ADA/Enrollment 597 632 94.5% Met
3C. Comparison of District ADA to Enrollment Ratio to the Standard
DATA ENTRY: Enter an explanation if the standard is not met.
1a. STANDARD MET - Projected P-2 ADA to enrollment ratio has not exceeded the standard for the budget and two subsequent fiscal years.
Explanation:
(required if NOT met)

Pacheco Union ElementaryShasta County
2017-18 July 1 BudgetGeneral Fund
School District Criteria and Standards Review45 70094 0000000
Form 01CS
California Dept of EducationSACS Financial Reporting Software - 2017.1.0File: cs-a (Rev 04/10/2017) Page 4 of 27 Printed: 5/31/2017 6:22 PM
4. CRITERION: LCFF Revenue
STANDARD: Projected local control funding formula (LCFF) revenue for any of the budget year or two subsequent fiscal years has not changed from theprior fiscal year by more than the change in population, plus the district's gap funding or cost-of-living adjustment (COLA)¹ and its economic recoverytarget payment, plus or minus one percent.
For basic aid districts, projected LCFF revenue has not changed from the prior fiscal year by more than the percent change in property tax revenues plusor minus one percent.
For districts funded by necessary small school formulas, projected LCFF revenue has not changed from the prior fiscal year amount by more than thedistrict's gap funding or COLA¹ and its economic recovery target payment, plus or minus one percent.
¹Districts that are already at or above their LCFF target funding as described in Education Code Section 42238.03(d) receive no gap funding. These districts have a COLA applied totheir LCFF target, but their year-over-year revenue increase might be less than the statutory COLA due to certain local factors and components of the funding formula.
4A. District's LCFF Revenue Standard
Indicate which standard applies:
LCFF Revenue
Basic Aid
Necessary Small School
The District must select which LCFF revenue standard applies.LCFF Revenue Standard selected: LCFF Revenue
4A1. Calculating the District's LCFF Revenue Standard
DATA ENTRY: Enter LCFF Target amounts for the budget and two subsequent fiscal years.Enter data in Step 1a for the two subsequent fiscal years. All other data is extracted or calculated.Enter data for Steps 2a through 2d. All other data is calculated.
Projected LCFF Revenue
Has the District reached its LCFFIf Yes, then COLA amount in Line 2b2 is used in Line 2e Total calculation.If No, then Gap Funding in Line 2c is used in Line 2e Total calculation.
target funding level? No
Budget Year 1st Subsequent Year 2nd Subsequent Year(2017-18) (2018-19) (2019-20)
LCFF Target (Reference Only) 5,416,795.00 5,509,616.00 5,643,894.00
Prior Year Budget Year 1st Subsequent Year 2nd Subsequent YearStep 1 - Change in Population (2016-17) (2017-18) (2018-19) (2019-20)
a. ADA (Funded)
(Form A, lines A6 and C4) 598.74 598.74 599.53 600.48b. Prior Year ADA (Funded) 598.74 598.74 599.53
c. Difference (Step 1a minus Step 1b) 0.00 0.79 0.95d. Percent Change Due to Population
(Step 1c divided by Step 1b) 0.00% 0.13% 0.16%
Step 2 - Change in Funding Level
a. Prior Year LCFF Funding 5,117,373.00 5,249,027.00 5,354,386.00b1. COLA percentage (if district is at target) Not Applicable
b2. COLA amount (proxy for purposes of thiscriterion) Not Applicable 0.00 0.00 0.00
c. Gap Funding (if district is not at target) 131,657.00 99,371.00 117,119.00d. Economic Recovery Target Funding
(current year increment) 0.00 0.00 0.00e. Total (Lines 2b2 or 2c, as applicable, plus Line 2d) 131,657.00 99,371.00 117,119.00f. Percent Change Due to Funding Level
(Step 2e divided by Step 2a) 2.57% 1.89% 2.19%
Step 3 - Total Change in Population and Funding Level(Step 1d plus Step 2f) 2.57% 2.02% 2.35%
LCFF Revenue Standard (Step 3, plus/minus 1%): 1.57% to 3.57% 1.02% to 3.02% 1.35% to 3.35%

Pacheco Union ElementaryShasta County
2017-18 July 1 BudgetGeneral Fund
School District Criteria and Standards Review45 70094 0000000
Form 01CS
California Dept of EducationSACS Financial Reporting Software - 2017.1.0File: cs-a (Rev 04/10/2017) Page 5 of 27 Printed: 5/31/2017 6:22 PM
4A2. Alternate LCFF Revenue Standard - Basic Aid
DATA ENTRY: If applicable to your district, input data in the 1st and 2nd Subsequent Year columns for projected local property taxes; all other data are extracted or calculated.
Basic Aid District Projected LCFF Revenue
Prior Year Budget Year 1st Subsequent Year 2nd Subsequent Year(2016-17) (2017-18) (2018-19) (2019-20)
Projected Local Property Taxes(Form 01, Objects 8021 - 8089) 2,327,866.00 2,362,424.00 2,398,871.00 2,398,871.00
Percent Change from Previous Year N/A N/A N/ABasic Aid Standard
(percent change from
previous year, plus/minus 1%): N/A N/A N/A
4A3. Alternate LCFF Revenue Standard - Necessary Small School
DATA ENTRY: All data are extracted or calculated.
Necessary Small School District Projected LCFF Revenue
Budget Year 1st Subsequent Year 2nd Subsequent Year(2017-18) (2018-19) (2019-20)
Necessary Small School Standard(Gap Funding or COLA, plus Economic Recovery Target Payment, Step 2f,
plus/minus 1%): N/A N/A N/A
4B. Calculating the District's Projected Change in LCFF Revenue
DATA ENTRY: Enter data in the 1st and 2nd Subsequent Year columns for LCFF Revenue; all other data are extracted or calculated.
Prior Year Budget Year 1st Subsequent Year 2nd Subsequent Year(2016-17) (2017-18) (2018-19) (2019-20)
LCFF Revenue
(Fund 01, Objects 8011, 8012, 8020-8089) 5,118,326.00 5,249,028.00 5,354,386.00 5,478,866.00District's Projected Change in LCFF Revenue: 2.55% 2.01% 2.32%
LCFF Revenue Standard: 1.57% to 3.57% 1.02% to 3.02% 1.35% to 3.35%Status: Met Met Met
4C. Comparison of District LCFF Revenue to the Standard
DATA ENTRY: Enter an explanation if the standard is not met.
1a. STANDARD MET - Projected change in LCFF revenue has met the standard for the budget and two subsequent fiscal years.
Explanation:
(required if NOT met)

Pacheco Union ElementaryShasta County
2017-18 July 1 BudgetGeneral Fund
School District Criteria and Standards Review45 70094 0000000
Form 01CS
California Dept of EducationSACS Financial Reporting Software - 2017.1.0File: cs-a (Rev 04/10/2017) Page 6 of 27 Printed: 5/31/2017 6:22 PM
5. CRITERION: Salaries and Benefits
STANDARD: Projected ratio of total unrestricted salaries and benefits to total unrestricted general fund expenditures for any of the budget year or twosubsequent fiscal years has not changed from the historical average ratio from the three prior fiscal years by more than the greater of three percent or thedistrict's required reserves percentage.
5A. Calculating the District's Historical Average Ratio of Unrestricted Salaries and Benefits to Total Unrestricted General Fund Expenditures
DATA ENTRY: All data are extracted or calculated.
Estimated/Unaudited Actuals - Unrestricted(Resources 0000-1999) Ratio
Salaries and Benefits Total Expenditures of Unrestricted Salaries and BenefitsFiscal Year (Form 01, Objects 1000-3999) (Form 01, Objects 1000-7499) to Total Unrestricted Expenditures
Third Prior Year (2014-15) 3,453,694.89 4,382,679.13 78.8%Second Prior Year (2015-16) 3,675,136.92 4,932,933.05 74.5%First Prior Year (2016-17) 3,936,180.00 5,031,498.00 78.2%
Historical Average Ratio: 77.2%
Budget Year 1st Subsequent Year 2nd Subsequent Year(2017-18) (2018-19) (2019-20)
District's Reserve Standard Percentage(Criterion 10B, Line 4): 4.0% 4.0% 4.0%
District's Salaries and Benefits Standard(historical average ratio, plus/minus the greater
of 3% or the district's reserve standard percentage): 73.2% to 81.2% 73.2% to 81.2% 73.2% to 81.2%
5B. Calculating the District's Projected Ratio of Unrestricted Salaries and Benefits to Total Unrestricted General Fund Expenditures
DATA ENTRY: If Form MYP exists, Unrestricted Salaries and Benefits, and Total Unrestricted Expenditures data for the 1st and 2nd Subsequent Years will be extracted; if not, enter data for the two subsequent years. All other data are extracted or calculated.
Budget - Unrestricted(Resources 0000-1999)
Salaries and Benefits Total Expenditures Ratio
(Form 01, Objects 1000-3999) (Form 01, Objects 1000-7499) of Unrestricted Salaries and BenefitsFiscal Year (Form MYP, Lines B1-B3) (Form MYP, Lines B1-B8, B10) to Total Unrestricted Expenditures Status
Budget Year (2017-18) 3,790,463.00 5,013,450.00 75.6% Met
1st Subsequent Year (2018-19) 3,901,985.00 4,976,972.00 78.4% Met2nd Subsequent Year (2019-20) 4,015,406.00 5,090,393.00 78.9% Met
5C. Comparison of District Salaries and Benefits Ratio to the Standard
DATA ENTRY: Enter an explanation if the standard is not met.
1a. STANDARD MET - Ratio of total unrestricted salaries and benefits to total unrestricted expenditures has met the standard for the budget and two subsequent fiscal years.
Explanation:
(required if NOT met)

Pacheco Union ElementaryShasta County
2017-18 July 1 BudgetGeneral Fund
School District Criteria and Standards Review45 70094 0000000
Form 01CS
California Dept of EducationSACS Financial Reporting Software - 2017.1.0File: cs-a (Rev 04/10/2017) Page 7 of 27 Printed: 5/31/2017 6:22 PM
6. CRITERION: Other Revenues and Expenditures
STANDARD: Projected operating revenues (including federal, other state, and other local) or expenditures (including books and supplies,and services and other operating), for any of the budget year or two subsequent fiscal years, have not changed from the prior fiscal year amount by morethan the percentage change in population and the funded cost-of-living adjustment (COLA) plus or minus ten percent.
For each major object category, changes that exceed the percentage change in population and the funded COLA plus or minus five percent must beexplained.
6A. Calculating the District's Other Revenues and Expenditures Standard Percentage Ranges
DATA ENTRY: All data are extracted or calculated.Budget Year 1st Subsequent Year 2nd Subsequent Year
(2017-18) (2018-19) (2019-20)1. District's Change in Population and Funding Level
(Criterion 4A1, Step 3): 2.57% 2.02% 2.35%2. District's Other Revenues and Expenditures
Standard Percentage Range (Line 1, plus/minus 10%): -7.43% to 12.57% -7.98% to 12.02% -7.65% to 12.35%3. District's Other Revenues and Expenditures
Explanation Percentage Range (Line 1, plus/minus 5%): -2.43% to 7.57% -2.98% to 7.02% -2.65% to 7.35%
6B. Calculating the District's Change by Major Object Category and Comparison to the Explanation Percentage Range (Section 6A, Line 3)
DATA ENTRY: If Form MYP exists, the 1st and 2nd Subsequent Year data for each revenue and expenditure section will be extracted; if not, enter data for the two subsequent years. All other data are extracted or calculated.
Explanations must be entered for each category if the percent change for any year exceeds the district's explanation percentage range.
Percent Change Change Is OutsideObject Range / Fiscal Year Amount Over Previous Year Explanation Range
Federal Revenue (Fund 01, Objects 8100-8299) (Form MYP, Line A2)First Prior Year (2016-17) 826,485.00Budget Year (2017-18) 283,734.00 -65.67% Yes1st Subsequent Year (2018-19) 283,734.00 0.00% No2nd Subsequent Year (2019-20) 283,734.00 0.00% No
Explanation:(required if Yes)
Conclusion of Curiosity Grant Resource 4035 after 2016/17; estimated reductions of Title I and Title II funding by 22% in 2017/18.
Other State Revenue (Fund 01, Objects 8300-8599) (Form MYP, Line A3)First Prior Year (2016-17) 333,796.00Budget Year (2017-18) 212,038.00 -36.48% Yes1st Subsequent Year (2018-19) 212,038.00 0.00% No2nd Subsequent Year (2019-20) 212,038.00 0.00% No
Explanation:(required if Yes)
One-time mandated cost revenue in 2016/17 not projected in subsequent years.
Other Local Revenue (Fund 01, Objects 8600-8799) (Form MYP, Line A4)First Prior Year (2016-17) 564,843.00Budget Year (2017-18) 536,681.00 -4.99% Yes1st Subsequent Year (2018-19) 536,681.00 0.00% No2nd Subsequent Year (2019-20) 536,681.00 0.00% No
Explanation:(required if Yes)
One-time interagency revenues in 16/17 not projected for subsequent years.
Books and Supplies (Fund 01, Objects 4000-4999) (Form MYP, Line B4)First Prior Year (2016-17) 274,595.00Budget Year (2017-18) 252,422.00 -8.07% Yes1st Subsequent Year (2018-19) 252,422.00 0.00% No2nd Subsequent Year (2019-20) 252,422.00 0.00% No
Explanation:(required if Yes)
Reduced expenses for adopted materials in subsequent years - major adoptions completed in 16/17. Reduced budget for music equipment.

Pacheco Union ElementaryShasta County
2017-18 July 1 BudgetGeneral Fund
School District Criteria and Standards Review45 70094 0000000
Form 01CS
California Dept of EducationSACS Financial Reporting Software - 2017.1.0File: cs-a (Rev 04/10/2017) Page 8 of 27 Printed: 5/31/2017 6:22 PM
Services and Other Operating Expenditures (Fund 01, Objects 5000-5999) (Form MYP, Line B5)First Prior Year (2016-17) 1,766,952.00Budget Year (2017-18) 1,227,353.00 -30.54% Yes1st Subsequent Year (2018-19) 1,229,354.00 0.16% No2nd Subsequent Year (2019-20) 1,229,354.00 0.00% No
Explanation:(required if Yes)
Reduced expenses due to completion of Curiosity Grant in 2016/17, program reduction in counseling contract expense, reduced professionaldevelopment due to completion of CKH training in 2016/17.
6C. Calculating the District's Change in Total Operating Revenues and Expenditures (Section 6A, Line 2)
DATA ENTRY: All data are extracted or calculated.
Percent ChangeObject Range / Fiscal Year Amount Over Previous Year Status
Total Federal, Other State, and Other Local Revenue (Criterion 6B)First Prior Year (2016-17) 1,725,124.00Budget Year (2017-18) 1,032,453.00 -40.15% Not Met1st Subsequent Year (2018-19) 1,032,453.00 0.00% Met2nd Subsequent Year (2019-20) 1,032,453.00 0.00% Met
Total Books and Supplies, and Services and Other Operating Expenditures (Criterion 6B)First Prior Year (2016-17) 2,041,547.00Budget Year (2017-18) 1,479,775.00 -27.52% Not Met1st Subsequent Year (2018-19) 1,481,776.00 0.14% Met2nd Subsequent Year (2019-20) 1,481,776.00 0.00% Met
6D. Comparison of District Total Operating Revenues and Expenditures to the Standard Percentage Range
DATA ENTRY: Explanations are linked from Section 6B if the status in Section 6C is not met; no entry is allowed below.
1a. STANDARD NOT MET - Projected total operating revenues have changed by more than the standard in one or more of the budget or two subsequent fiscal years. Reasons for theprojected change, descriptions of the methods and assumptions used in the projections, and what changes, if any, will be made to bring the projected operating revenues within thestandard must be entered in Section 6A above and will also display in the explanation box below.
Explanation:
Federal Revenue
(linked from 6B
if NOT met)
Conclusion of Curiosity Grant Resource 4035 after 2016/17; estimated reductions of Title I and Title II funding by 22% in 2017/18.
Explanation:Other State Revenue
(linked from 6B if NOT met)
One-time mandated cost revenue in 2016/17 not projected in subsequent years.
Explanation:Other Local Revenue
(linked from 6B if NOT met)
One-time interagency revenues in 16/17 not projected for subsequent years.
1b. STANDARD NOT MET - Projected total operating expenditures have changed by more than the standard in one or more of the budget or two subsequent fiscal years. Reasons for theprojected change, descriptions of the methods and assumptions used in the projections, and what changes, if any, will be made to bring the projected operating expenditures within thestandard must be entered in Section 6A above and will also display in the explanation box below.
Explanation:Books and Supplies
(linked from 6B if NOT met)
Reduced expenses for adopted materials in subsequent years - major adoptions completed in 16/17. Reduced budget for music equipment.
Explanation:Services and Other Exps
(linked from 6B if NOT met)
Reduced expenses due to completion of Curiosity Grant in 2016/17, program reduction in counseling contract expense, reduced professionaldevelopment due to completion of CKH training in 2016/17.

Pacheco Union ElementaryShasta County
2017-18 July 1 BudgetGeneral Fund
School District Criteria and Standards Review45 70094 0000000
Form 01CS
California Dept of EducationSACS Financial Reporting Software - 2017.1.0File: cs-a (Rev 04/10/2017) Page 9 of 27 Printed: 5/31/2017 6:22 PM
7. CRITERION: Facilities Maintenance
STANDARD: Confirm that the annual contribution for facilities maintenance funding is not less than the amount required pursuant to Education CodeSection 17070.75, if applicable, and that the district is providing adequately to preserve the functionality of its facilities for their normal life in accordancewith Education Code sections 52060(d)(1) and 17002(d)(1).
Determining the District's Compliance with the Contribution Requirement for EC Section 17070.75 as amended by AB 104 (Chapter 13, Statutes of 2015), effective2017-18 to 2019-20 - Ongoing and Major Maintenance/Restricted Maintenance Account (OMMA/RMA)
NOTE: AB 104 (Chapter 13, Statutes of 2015) requires the district to deposit into the account, for the 2017-18 to 2019-20 fiscal years, a minimum amount that is the greater of the followingamounts:
A. The lesser of three percent of the total general fund expenditures and other financing uses for that fiscal year or the amount that the district deposited into the account for the 2014-15fiscal year; or
B. Two percent of the total general fund expenditures and other financing uses for that fiscal year.
DATA ENTRY: Click the appropriate Yes or No button for special education local plan area (SELPA) administrative units (AUs); all other data are extracted or calculated. If standard is not met,enter an X in the appropriate box and enter an explanation, if applicable.
1. a. For districts that are the AU of a SELPA, do you choose to exclude revenues that are passed through to participating members of the SELPA from the OMMA/RMA required minimum contribution calculation?
b. Pass-through revenues and apportionments that may be excluded from the OMMA/RMA calculation per EC Section 17070.75(b)(2)(D) (Fund 10, resources 3300-3499 and 6500-6540, objects 7211-7213 and 7221-7223) 0.00
2. Ongoing and Major Maintenance/Restricted Maintenance Account
a. Budgeted Expenditures and Other Financing Uses (Form 01, objects 1000-7999) 6,301,284.00 3% of Total Current Yearb. Plus: Pass-through Revenues General Fund Expenditures and Apportionments and Other Financing Uses Amount Deposited¹ Lesser of: (Line 1b, if line 1a is No) (Line 2c times 3%) for 2014-15 Fiscal Year 3% or 2014-15 amountc. Net Budgeted Expenditures and Other Financing Uses 6,301,284.00 189,038.52 185,643.57 185,643.57
d. Required Minimum Contribution 2% of Total Current Year General Required Minimum Fund Expenditures and Other Contribution/
Financing Uses Greater of: Lesser of 3% or(Line 2c times 2%) 2014-15 amount or 2%
126,025.68 185,643.57
Budgeted Contribution ¹to the Ongoing and Major
Maintenance Account Status
e. OMMA/RMA Contribution 151,750.00 Not Met
¹ Fund 01, Resource 8150, Objects 8900-8999
If standard is not met, enter an X in the box that best describes why the minimum required contribution was not made:
Not applicable (district does not participate in the Leroy F. Greene School Facilities Act of 1998)X Exempt (due to district's small size [EC Section 17070.75 (b)(2)(E)])
Other (explanation must be provided)
Explanation:
(required if NOT met
and Other is marked)

Pacheco Union ElementaryShasta County
2017-18 July 1 BudgetGeneral Fund
School District Criteria and Standards Review45 70094 0000000
Form 01CS
California Dept of EducationSACS Financial Reporting Software - 2017.1.0File: cs-a (Rev 04/10/2017) Page 10 of 27 Printed: 5/31/2017 6:22 PM
8. CRITERION: Deficit Spending
STANDARD: Unrestricted deficit spending (total unrestricted expenditures and other financing uses is greater than total unrestricted revenues and otherfinancing sources) as a percentage of total unrestricted expenditures and other financing uses, has not exceeded one-third of the district's availablereserves¹ as a percentage of total expenditures and other financing uses² in two out of three prior fiscal years.
8A. Calculating the District's Deficit Spending Standard Percentage Levels
DATA ENTRY: All data are extracted or calculated.Third Prior Year Second Prior Year First Prior Year
(2014-15) (2015-16) (2016-17)1. District's Available Reserve Amounts (resources 0000-1999)
a. Reserve for Economic Uncertainties (Funds 01 and 17, Object 9789) 230,131.00 271,689.00 275,200.00b. Unassigned/Unappropriated (Funds 01 and 17, Object 9790) 0.00 0.00 0.00c. Negative General Fund Ending Balances in Restricted Resources (Fund 01, Object 979Z, if negative, for each of resources 2000-9999) 0.00 0.00 0.00d. Available Reserves (Lines 1a through 1c) 230,131.00 271,689.00 275,200.00
2. Expenditures and Other Financing Usesa. District's Total Expenditures and Other Financing Uses (Fund 01, objects 1000-7999) 5,756,265.38 6,792,203.93 6,876,684.00b. Plus: Special Education Pass-through Funds (Fund 10, resources 3300-3499 and 6500-6540, objects 7211-7213 and 7221-7223) 0.00c. Total Expenditures and Other Financing Uses (Line 2a plus Line 2b) 5,756,265.38 6,792,203.93 6,876,684.00
3. District's Available Reserve Percentage(Line 1d divided by Line 2c) 4.0% 4.0% 4.0%
District's Deficit Spending Standard Percentage Levels(Line 3 times 1/3): 1.3% 1.3% 1.3%
¹Available reserves are the unrestricted amounts in the Reserve for Economic Uncertaintiesand the Unassigned/Unappropriated accounts in the General Fund and the Special ReserveFund for Other Than Capital Outlay Projects. Available reserves will be reduced by any negativeending balances in restricted resources in the General Fund.
²A school district that is the Administrative Unit of a Special Education Local Plan Area (SELPA)may exclude from its expenditures the distribution of funds to its participating members.
8B. Calculating the District's Deficit Spending Percentages
DATA ENTRY: All data are extracted or calculated.
Net Change in Total Unrestricted Expenditures Deficit Spending LevelUnrestricted Fund Balance and Other Financing Uses (If Net Change in Unrestricted Fund
Fiscal Year (Form 01, Section E) (Form 01, Objects 1000-7999) Balance is negative, else N/A) StatusThird Prior Year (2014-15) (221,979.24) 4,396,606.23 5.0% Not MetSecond Prior Year (2015-16) (151,817.21) 4,940,320.51 3.1% Not MetFirst Prior Year (2016-17) (30,571.00) 5,053,866.00 0.6% MetBudget Year (2017-18) (Information only) 115,587.00 5,023,806.00
8C. Comparison of District Deficit Spending to the Standard
DATA ENTRY: Enter an explanation if the standard is not met.
1a. STANDARD NOT MET - Unrestricted deficit spending has exceeded the standard percentage levels for two or more of the previous three fiscal years. Provide reasons for the deficitspending, a description of the methods and assumptions used in balancing the unrestricted budgets, and what change, if any, will be made to ensure that the subsequent budgets arebalanced within the standard.
Explanation:
(required if NOT met)
District has addressed its deficit spending, as indicated in the current budget and projections.

Pacheco Union ElementaryShasta County
2017-18 July 1 BudgetGeneral Fund
School District Criteria and Standards Review45 70094 0000000
Form 01CS
California Dept of EducationSACS Financial Reporting Software - 2017.1.0File: cs-a (Rev 04/10/2017) Page 11 of 27 Printed: 5/31/2017 6:22 PM
9. CRITERION: Fund Balance
STANDARD: Budgeted beginning unrestricted general fund balance has not been overestimated for two out of three prior fiscal years by more than thefollowing percentage levels:
Percentage Level ¹ District ADA 1.7% 0 to 3001.3% 301 to 1,0001.0% 1,001 to 30,0000.7% 30,001 to 400,0000.3% 400,001 and over
¹ Percentage levels equate to a rate of deficit spending which would eliminate recommended reserves foreconomic uncertainties over a three year period.
District Estimated P-2 ADA (Form A, Lines A6 and C4): 597
District's Fund Balance Standard Percentage Level: 1.3%
9A. Calculating the District's Unrestricted General Fund Beginning Balance Percentages
DATA ENTRY: Enter data in the Original Budget column for the First, Second, and Third Prior Years; all other data are extracted or calculated.
Unrestricted General Fund Beginning Balance ² Beginning Fund Balance(Form 01, Line F1e, Unrestricted Column) Variance Level
Fiscal Year Original Budget Estimated/Unaudited Actuals (If overestimated, else N/A) StatusThird Prior Year (2014-15) 1,662,740.00 1,618,229.35 2.7% Not MetSecond Prior Year (2015-16) 1,217,845.00 1,398,935.01 N/A MetFirst Prior Year (2016-17) 1,149,356.00 1,247,117.00 N/A MetBudget Year (2017-18) (Information only) 1,216,546.00
² Adjusted beginning balance, including audit adjustments and other restatements (objects 9791-9795)
9B. Comparison of District Unrestricted Beginning Fund Balance to the Standard
DATA ENTRY: Enter an explanation if the standard is not met.
1a. STANDARD MET - Unrestricted general fund beginning fund balance has not been overestimated by more than the standard percentage level for two or more of the previous threeyears.
Explanation:
(required if NOT met)

Pacheco Union ElementaryShasta County
2017-18 July 1 BudgetGeneral Fund
School District Criteria and Standards Review45 70094 0000000
Form 01CS
California Dept of EducationSACS Financial Reporting Software - 2017.1.0File: cs-a (Rev 04/10/2017) Page 12 of 27 Printed: 5/31/2017 6:22 PM
10. CRITERION: Reserves
STANDARD: Available reserves¹ for any of the budget year or two subsequent fiscal years are not less than the following percentages or amounts² asapplied to total expenditures and other financing uses³:
DATA ENTRY: Budget Year data are extracted. If Form MYP exists, 1st and 2nd Subsequent Year data will be extracted. If not, enter district regular ADAand charter school ADA corresponding to financial data reported in the General Fund, only, for the two subsequent years.
Percentage Level District ADA 5% or $66,000 (greater of) 0 to 3004% or $66,000 (greater of) 301 to 1,000
3% 1,001 to 30,0002% 30,001 to 400,0001% 400,001 and over
¹ Available reserves are the unrestricted amounts in the Reserve for Economic Uncertainties and theUnassigned/Unappropriated accounts in the General Fund and the Special Reserve Fund for Other ThanCapital Outlay Projects. Available reserves will be reduced by any negative ending balances in restrictedresources in the General Fund.
² Dollar amounts to be adjusted annually by the prior year statutory cost-of-living adjustment (EducationCode Section 42238), rounded to the nearest thousand.
³ A school district that is the Administrative Unit (AU) of a Special Education Local Plan Area (SELPA) mayexclude from its expenditures the distribution of funds to its participating members.
Budget Year 1st Subsequent Year 2nd Subsequent Year(2017-18) (2018-19) (2019-20)
District Estimated P-2 ADA (Budget Year, Form A, Lines A4 and C4. 594 596 597Subsequent Years, Form MYP, Line F2, if available.)
District's Reserve Standard Percentage Level: 4% 4% 4%
10A. Calculating the District's Special Education Pass-through Exclusions (only for districts that serve as the AU of a SELPA)
DATA ENTRY: For SELPA AUs, if Form MYP exists, all data will be extracted including the Yes/No button selection. If not, click the appropriate Yes or No button for item 1 and, if Yes, enter data for item 2a and for the two subsequent years in item 2b; Budget Year data are extracted.
For districts that serve as the AU of a SELPA (Form MYP, Lines F1a, F1b1, and F1b2):
1. Do you choose to exclude from the reserve calculation the pass-through funds distributed to SELPA members? No2. If you are the SELPA AU and are excluding special education pass-through funds:
a. Enter the name(s) of the SELPA(s):
Budget Year 1st Subsequent Year 2nd Subsequent Year(2017-18) (2018-19) (2019-20)
b. Special Education Pass-through Funds (Fund 10, resources 3300-3499 and 6500-6540, objects 7211-7213 and 7221-7223) 0.00 0.00 0.00
10B. Calculating the District's Reserve Standard
DATA ENTRY: If Form MYP exists, 1st and 2nd Subsequent Year data for lines 1 and 2 will be extracted; if not, enter data for the two subsequent years. All other data are extracted or calculated.
Budget Year 1st Subsequent Year 2nd Subsequent Year(2017-18) (2018-19) (2019-20)
1. Expenditures and Other Financing Uses(Fund 01, objects 1000-7999) (Form MYP, Line B11) 6,301,284.00 6,271,018.00 6,390,749.00
2. Plus: Special Education Pass-through(Criterion 10A, Line 2b, if Criterion 10A, Line 1 is No) 0.00 0.00 0.00
3. Total Expenditures and Other Financing Uses(Line B1 plus Line B2) 6,301,284.00 6,271,018.00 6,390,749.00
4. Reserve Standard Percentage Level 4% 4% 4%5. Reserve Standard - by Percent
(Line B3 times Line B4) 252,051.36 250,840.72 255,629.966. Reserve Standard - by Amount
($66,000 for districts with 0 to 1,000 ADA, else 0) 66,000.00 66,000.00 66,000.007. District's Reserve Standard
(Greater of Line B5 or Line B6) 252,051.36 250,840.72 255,629.96

Pacheco Union ElementaryShasta County
2017-18 July 1 BudgetGeneral Fund
School District Criteria and Standards Review45 70094 0000000
Form 01CS
California Dept of EducationSACS Financial Reporting Software - 2017.1.0File: cs-a (Rev 04/10/2017) Page 13 of 27 Printed: 5/31/2017 6:22 PM
10C. Calculating the District's Budgeted Reserve Amount
DATA ENTRY: If Form MYP exists, 1st and 2nd Subsequent Year data for lines 1 through 7 will be extracted; if not, enter data for the two subsequent years. All other data are extracted or calculated.
Reserve Amounts(Unrestricted resources 0000-1999 except Line 4):
Budget Year(2017-18)
1st Subsequent Year(2018-19)
2nd Subsequent Year(2019-20)
1. General Fund - Stabilization Arrangements(Fund 01, Object 9750) (Form MYP, Line E1a) 0.00 0.00 0.00
2. General Fund - Reserve for Economic Uncertainties(Fund 01, Object 9789) (Form MYP, Line E1b) 252,100.00 250,941.00 255,730.00
3. General Fund - Unassigned/Unappropriated Amount(Fund 01, Object 9790) (Form MYP, Line E1c) 0.00 0.00 0.00
4. General Fund - Negative Ending Balances in Restricted Resources(Fund 01, Object 979Z, if negative, for each of resources 2000-9999)(Form MYP, Line E1d) 0.00 0.00 0.00
5. Special Reserve Fund - Stabilization Arrangements(Fund 17, Object 9750) (Form MYP, Line E2a) 0.00
6. Special Reserve Fund - Reserve for Economic Uncertainties(Fund 17, Object 9789) (Form MYP, Line E2b) 0.00
7. Special Reserve Fund - Unassigned/Unappropriated Amount(Fund 17, Object 9790) (Form MYP, Line E2c) 0.00
8. District's Budgeted Reserve Amount(Lines C1 thru C7) 252,100.00 250,941.00 255,730.00
9. District's Budgeted Reserve Percentage (Information only)(Line 8 divided by Section 10B, Line 3) 4.00% 4.00% 4.00%
District's Reserve Standard (Section 10B, Line 7): 252,051.36 250,840.72 255,629.96
Status: Met Met Met
10D. Comparison of District Reserve Amount to the Standard
DATA ENTRY: Enter an explanation if the standard is not met.
1a. STANDARD MET - Projected available reserves have met the standard for the budget and two subsequent fiscal years.
Explanation:
(required if NOT met)

Pacheco Union ElementaryShasta County
2017-18 July 1 BudgetGeneral Fund
School District Criteria and Standards Review45 70094 0000000
Form 01CS
California Dept of EducationSACS Financial Reporting Software - 2017.1.0File: cs-a (Rev 04/10/2017) Page 14 of 27 Printed: 5/31/2017 6:22 PM
SUPPLEMENTAL INFORMATION
DATA ENTRY: Click the appropriate Yes or No button for items S1 through S4. Enter an explanation for each Yes answer.
S1. Contingent Liabilities
1a. Does your district have any known or contingent liabilities (e.g., financial or program audits, litigation,state compliance reviews) that may impact the budget? No
1b. If Yes, identify the liabilities and how they may impact the budget:
S2. Use of One-time Revenues for Ongoing Expenditures
1a. Does your district have ongoing general fund expenditures in the budget in excess of one percent ofthe total general fund expenditures that are funded with one-time resources? No
1b. If Yes, identify the expenditures and explain how the one-time resources will be replaced to continue funding the ongoing expenditures in the following fiscal years:
S3. Use of Ongoing Revenues for One-time Expenditures
1a. Does your district have large non-recurring general fund expenditures that are funded with ongoing
general fund revenues? No
1b. If Yes, identify the expenditures:
S4. Contingent Revenues
1a. Does your district have projected revenues for the budget year or either of the two subsequent fiscal yearscontingent on reauthorization by the local government, special legislation, or other definitive act (e.g., parcel taxes, forest reserves)? No
1b. If Yes, identify any of these revenues that are dedicated for ongoing expenses and explain how the revenues will be replaced or expenditures reduced:

Pacheco Union ElementaryShasta County
2017-18 July 1 BudgetGeneral Fund
School District Criteria and Standards Review45 70094 0000000
Form 01CS
California Dept of EducationSACS Financial Reporting Software - 2017.1.0File: cs-a (Rev 04/10/2017) Page 15 of 27 Printed: 5/31/2017 6:22 PM
S5. Contributions
Identify projected contributions from unrestricted resources in the general fund to restricted resources in the general fund for the budget year and two subsequent fiscal years. Providean explanation if contributions have changed from the prior fiscal year amounts by more than $20,000 and more than ten percent. Explanation should include whether contributions areongoing or one-time in nature.
Identify projected transfers to or from the general fund to cover operating deficits in either the general fund or any other fund for the budget year and two subsequent fiscal years.Provide an explanation if transfers have changed from the prior fiscal year amounts by more than $20,000 and more than ten percent. Explanation should include whether transfers areongoing or one-time in nature.
Estimate the impact of any capital projects on the general fund operational budget.
District's Contributions and Transfers Standard:-10.0% to +10.0%
or -$20,000 to +$20,000
S5A. Identification of the District's Projected Contributions, Transfers, and Capital Projects that may Impact the General Fund
DATA ENTRY: For Contributions, enter data in the Projection column for the 1st and 2nd Subsequent Years. Contributions for the First Prior Year and Budget Year will be extracted. ForTransfers In and Transfers Out, enter data in the First Prior Year. If Form MYP exists, the data will be extracted for the Budget Year, and 1st and 2nd Subsequent Years. If Form MYP does notexist, enter data in the Budget Year, 1st and 2nd subsequent Years. Click the appropriate button for item 1d; all other data will be calculated.
Description / Fiscal Year Projection Amount of Change Percent Change Status
1a. Contributions, Unrestricted General Fund (Fund 01, Resources 0000-1999, Object 8980)First Prior Year (2016-17) (520,706.00)Budget Year (2017-18) (553,210.00) 32,504.00 6.2% Met1st Subsequent Year (2018-19) (544,812.00) (8,398.00) -1.5% Met2nd Subsequent Year (2019-20) (551,024.00) 6,212.00 1.1% Met
1b. Transfers In, General Fund *First Prior Year (2016-17) 0.00Budget Year (2017-18) 0.00 0.00 0.0% Met1st Subsequent Year (2018-19) 0.00 0.00 0.0% Met2nd Subsequent Year (2019-20) 0.00 0.00 0.0% Met
1c. Transfers Out, General Fund *First Prior Year (2016-17) 22,368.00Budget Year (2017-18) 10,356.00 (12,012.00) -53.7% Met1st Subsequent Year (2018-19) 10,356.00 0.00 0.0% Met2nd Subsequent Year (2019-20) 10,356.00 0.00 0.0% Met
1d. Impact of Capital ProjectsDo you have any capital projects that may impact the general fund operational budget? No
* Include transfers used to cover operating deficits in either the general fund or any other fund.
S5B. Status of the District's Projected Contributions, Transfers, and Capital Projects
DATA ENTRY: Enter an explanation if Not Met for items 1a-1c or if Yes for item 1d.
1a. MET - Projected contributions have not changed by more than the standard for the budget and two subsequent fiscal years.
Explanation:(required if NOT met)
1b. MET - Projected transfers in have not changed by more than the standard for the budget and two subsequent fiscal years.
Explanation:(required if NOT met)

Pacheco Union ElementaryShasta County
2017-18 July 1 BudgetGeneral Fund
School District Criteria and Standards Review45 70094 0000000
Form 01CS
California Dept of EducationSACS Financial Reporting Software - 2017.1.0File: cs-a (Rev 04/10/2017) Page 16 of 27 Printed: 5/31/2017 6:22 PM
1c. MET - Projected transfers out have not changed by more than the standard for the budget and two subsequent fiscal years.
Explanation:(required if NOT met)
1d. NO - There are no capital projects that may impact the general fund operational budget.
Project Information:(required if YES)

Pacheco Union ElementaryShasta County
2017-18 July 1 BudgetGeneral Fund
School District Criteria and Standards Review45 70094 0000000
Form 01CS
California Dept of EducationSACS Financial Reporting Software - 2017.1.0File: cs-a (Rev 04/10/2017) Page 17 of 27 Printed: 5/31/2017 6:22 PM
S6. Long-term Commitments
Identify all existing and new multiyear commitments¹ and their annual required payments for the budget year and two subsequent fiscal years.
Explain how any increase in annual payments will be funded. Also explain how any decrease to funding sources used to pay long-term commitments will be replaced.
¹ Include multiyear commitments, multiyear debt agreements, and new programs or contracts that result in long-term obligations.
S6A. Identification of the District's Long-term Commitments
DATA ENTRY: Click the appropriate button in item 1 and enter data in all columns of item 2 for applicable long-term commitments; there are no extractions in this section.
1. Does your district have long-term (multiyear) commitments?(If No, skip item 2 and Sections S6B and S6C) Yes
2. If Yes to item 1, list all new and existing multiyear commitments and required annual debt service amounts. Do not include long-term commitments for postemployment benefits otherthan pensions (OPEB); OPEB is disclosed in item S7A.
# of Years SACS Fund and Object Codes Used For: Principal BalanceType of Commitment Remaining Funding Sources (Revenues) Debt Service (Expenditures) as of July 1, 2017
Capital LeasesCertificates of Participation 21 25,21 fd 8625 25 fd, obj 7438,7439 1,592,093General Obligation Bonds 21 51, 8600s 51 fd 7433,7434 4,181,672Supp Early Retirement Program 3 01, LCFF sources 01,7439 35,000State School Building LoansCompensated Absences 1 01, LCFF sources 01 fd, 2000s, 3000s 51,767
Other Long-term Commitments (do not include OPEB):
TOTAL: 5,860,532
Prior Year Budget Year 1st Subsequent Year 2nd Subsequent Year(2016-17) (2017-18) (2018-19) (2019-20)
Annual Payment Annual Payment Annual Payment Annual PaymentType of Commitment (continued) (P & I) (P & I) (P & I) (P & I)
Capital LeasesCertificates of ParticipationGeneral Obligation Bonds 256,524 261,925 271,925 281,426Supp Early Retirement Program 15,000 15,000 10,000 10,000State School Building LoansCompensated Absences
Other Long-term Commitments (continued):
Total Annual Payments: 271,524 276,925 281,925 291,426Has total annual payment increased over prior year (2016-17)? Yes Yes Yes

Pacheco Union ElementaryShasta County
2017-18 July 1 BudgetGeneral Fund
School District Criteria and Standards Review45 70094 0000000
Form 01CS
California Dept of EducationSACS Financial Reporting Software - 2017.1.0File: cs-a (Rev 04/10/2017) Page 18 of 27 Printed: 5/31/2017 6:22 PM
S6B. Comparison of the District's Annual Payments to Prior Year Annual Payment
DATA ENTRY: Enter an explanation if Yes.
1a. Yes - Annual payments for long-term commitments have increased in one or more of the budget or two subsequent fiscal years. Explain how the increase in annual payments will befunded.
Explanation:(required if Yes
to increase in totalannual payments)
Bond payments funded through voter-approved tax levies; supplemental retirement incentive funded through LCFF sources.
S6C. Identification of Decreases to Funding Sources Used to Pay Long-term Commitments
DATA ENTRY: Click the appropriate Yes or No button in item 1; if Yes, an explanation is required in item 2.
1. Will funding sources used to pay long-term commitments decrease or expire prior to the end of the commitment period, or are they one-time sources?
No
2.
No - Funding sources will not decrease or expire prior to the end of the commitment period, and one-time funds are not being used for long-term commitment annual payments.
Explanation:(required if Yes)

Pacheco Union ElementaryShasta County
2017-18 July 1 BudgetGeneral Fund
School District Criteria and Standards Review45 70094 0000000
Form 01CS
California Dept of EducationSACS Financial Reporting Software - 2017.1.0File: cs-a (Rev 04/10/2017) Page 19 of 27 Printed: 5/31/2017 6:22 PM
S7. Unfunded Liabilities
Estimate the unfunded liability for postemployment benefits other than pensions (OPEB) based on an actuarial valuation, if required, or other method; identify or estimate the annualrequired contribution; and indicate how the obligation is funded (pay-as-you-go, amortized over a specific period, etc.).
Estimate the unfunded liability for self-insurance programs such as workers' compensation based on an actuarial valuation, if required, or other method; identify or estimate the requiredcontribution; and indicate how the obligation is funded (level of risk retained, funding approach, etc.).
S7A. Identification of the District's Estimated Unfunded Liability for Postemployment Benefits Other than Pensions (OPEB)
DATA ENTRY: Click the appropriate button in item 1 and enter data in all other applicable items; there are no extractions in this section except the budget year data on line 5b.
1. Does your district provide postemployment benefits otherthan pensions (OPEB)? (If No, skip items 2-5) Yes
2. For the district's OPEB:a. Are they lifetime benefits? No
b. Do benefits continue past age 65? No
c. Describe any other characteristics of the district's OPEB program including eligibility criteria and amounts, if any, that retirees are required to contribute toward their own benefits:
3. a. Are OPEB financed on a pay-as-you-go, actuarial cost, or other method? Pay-as-you-go
b. Indicate any accumulated amounts earmarked for OPEB in a self-insurance or Self-Insurance Fund Governmental Fund governmental fund 0 0
4. OPEB Liabilitiesa. OPEB actuarial accrued liability (AAL) 166,916.00b. OPEB unfunded actuarial accrued liability (UAAL) 166,916.00c. Are AAL and UAAL based on the district's estimate or an actuarial valuation? Actuariald. If based on an actuarial valuation, indicate the date of the OPEB valuation Mar 01, 2014
Budget Year 1st Subsequent Year 2nd Subsequent Year5. OPEB Contributions (2017-18) (2018-19) (2019-20)
a. OPEB annual required contribution (ARC) per actuarial valuation or Alternative Measurement Method 17,426.00 17,220.00 10,778.00b. OPEB amount contributed (for this purpose, include premiums paid to a self-insurance fund) (funds 01-70, objects 3701-3752) 22,000.00 22,000.00 22,000.00c. Cost of OPEB benefits (equivalent of "pay-as-you-go" amount) 22,000.00 22,000.00 22,000.00d. Number of retirees receiving OPEB benefits 10 10 10

Pacheco Union ElementaryShasta County
2017-18 July 1 BudgetGeneral Fund
School District Criteria and Standards Review45 70094 0000000
Form 01CS
California Dept of EducationSACS Financial Reporting Software - 2017.1.0File: cs-a (Rev 04/10/2017) Page 20 of 27 Printed: 5/31/2017 6:22 PM
S7B. Identification of the District's Unfunded Liability for Self-Insurance Programs
DATA ENTRY: Click the appropriate button in item 1 and enter data in all other applicable items; there are no extractions in this section.
1. Does your district operate any self-insurance programs such as workers' compensation,employee health and welfare, or property and liability? (Do not include OPEB, which iscovered in Section S7A) (If No, skip items 2-4)
No
2. Describe each self-insurance program operated by the district, including details for each such as level of risk retained, funding approach, basis for valuation (district's estimate oractuarial), and date of the valuation:
3. Self-Insurance Liabilitiesa. Accrued liability for self-insurance programsb. Unfunded liability for self-insurance programs
Budget Year 1st Subsequent Year 2nd Subsequent Year4. Self-Insurance Contributions (2017-18) (2018-19) (2019-20)
a. Required contribution (funding) for self-insurance programsb. Amount contributed (funded) for self-insurance programs

Pacheco Union ElementaryShasta County
2017-18 July 1 BudgetGeneral Fund
School District Criteria and Standards Review45 70094 0000000
Form 01CS
California Dept of EducationSACS Financial Reporting Software - 2017.1.0File: cs-a (Rev 04/10/2017) Page 21 of 27 Printed: 5/31/2017 6:22 PM
S8. Status of Labor Agreements
Analyze the status of employee labor agreements. Identify new labor agreements, as well as new commitments provided as part of previously ratified multiyear agreements; and includeall contracts, including all administrator contracts (and including all compensation). For new agreements, indicate the date of the required board meeting. Compare the increase in newcommitments to the projected increase in ongoing revenues, and explain how these commitments will be funded in future fiscal years.
If salary and benefit negotiations are not finalized at budget adoption, upon settlement with certificated or classified staff:The school district must determine the cost of the settlement, including salaries, benefits, and any other agreements that change costs, and provide thecounty office of education (COE) with an analysis of the cost of the settlement and its impact on the operating budget.
The county superintendent shall review the analysis relative to the criteria and standards, and may provide written comments to the president of the districtgoverning board and superintendent.
S8A. Cost Analysis of District's Labor Agreements - Certificated (Non-management) Employees
DATA ENTRY: Enter all applicable data items; there are no extractions in this section.
Prior Year (2nd Interim) Budget Year 1st Subsequent Year 2nd Subsequent Year(2016-17) (2017-18) (2018-19) (2019-20)
Number of certificated (non-management)full-time-equivalent (FTE) positions 35.3 33.2 33.2 33.2
Certificated (Non-management) Salary and Benefit Negotiations1. Are salary and benefit negotiations settled for the budget year? No
If Yes, and the corresponding public disclosure documentshave been filed with the COE, complete questions 2 and 3.
If Yes, and the corresponding public disclosure documentshave not been filed with the COE, complete questions 2-5.
If No, identify the unsettled negotiations including any prior year unsettled negotiations and then complete questions 6 and 7.
Negotiations Settled2a. Per Government Code Section 3547.5(a), date of public disclosure board meeting:
2b. Per Government Code Section 3547.5(b), was the agreement certifiedby the district superintendent and chief business official?
If Yes, date of Superintendent and CBO certification:
3. Per Government Code Section 3547.5(c), was a budget revision adoptedto meet the costs of the agreement?
If Yes, date of budget revision board adoption:
4. Period covered by the agreement: Begin Date: End Date:
5. Salary settlement: Budget Year 1st Subsequent Year 2nd Subsequent Year(2017-18) (2018-19) (2019-20)
Is the cost of salary settlement included in the budget and multiyear projections (MYPs)?
One Year AgreementTotal cost of salary settlement
% change in salary schedule from prior yearor
Multiyear AgreementTotal cost of salary settlement
% change in salary schedule from prior year(may enter text, such as "Reopener")
Identify the source of funding that will be used to support multiyear salary commitments:

Pacheco Union ElementaryShasta County
2017-18 July 1 BudgetGeneral Fund
School District Criteria and Standards Review45 70094 0000000
Form 01CS
California Dept of EducationSACS Financial Reporting Software - 2017.1.0File: cs-a (Rev 04/10/2017) Page 22 of 27 Printed: 5/31/2017 6:22 PM
Negotiations Not Settled6. Cost of a one percent increase in salary and statutory benefits 22,789
Budget Year 1st Subsequent Year 2nd Subsequent Year(2017-18) (2018-19) (2019-20)
7. Amount included for any tentative salary schedule increases 0 0 0
Budget Year 1st Subsequent Year 2nd Subsequent YearCertificated (Non-management) Health and Welfare (H&W) Benefits (2017-18) (2018-19) (2019-20)
1. Are costs of H&W benefit changes included in the budget and MYPs? Yes Yes Yes2. Total cost of H&W benefits 440,885 462,929 486,0763. Percent of H&W cost paid by employer 68.6% 65.3% 62.2%4. Percent projected change in H&W cost over prior year 2.7% -4.8% -4.8%
Certificated (Non-management) Prior Year SettlementsAre any new costs from prior year settlements included in the budget? No
If Yes, amount of new costs included in the budget and MYPsIf Yes, explain the nature of the new costs:
Budget Year 1st Subsequent Year 2nd Subsequent YearCertificated (Non-management) Step and Column Adjustments (2017-18) (2018-19) (2019-20)
1. Are step & column adjustments included in the budget and MYPs? Yes Yes Yes2. Cost of step & column adjustments 40,165 39,091 39,694
3. Percent change in step & column over prior year 18.4% -2.7% 1.5%
Budget Year 1st Subsequent Year 2nd Subsequent YearCertificated (Non-management) Attrition (layoffs and retirements) (2017-18) (2018-19) (2019-20)
1. Are savings from attrition included in the budget and MYPs? Yes Yes Yes
2. Are additional H&W benefits for those laid-off or retired employeesincluded in the budget and MYPs?
Yes Yes Yes
Certificated (Non-management) - OtherList other significant contract changes and the cost impact of each change (i.e., class size, hours of employment, leave of absence, bonuses, etc.):

Pacheco Union ElementaryShasta County
2017-18 July 1 BudgetGeneral Fund
School District Criteria and Standards Review45 70094 0000000
Form 01CS
California Dept of EducationSACS Financial Reporting Software - 2017.1.0File: cs-a (Rev 04/10/2017) Page 23 of 27 Printed: 5/31/2017 6:22 PM
S8B. Cost Analysis of District's Labor Agreements - Classified (Non-management) Employees
DATA ENTRY: Enter all applicable data items; there are no extractions in this section.
Prior Year (2nd Interim) Budget Year 1st Subsequent Year 2nd Subsequent Year(2016-17) (2017-18) (2018-19) (2019-20)
Number of classified (non-management)FTE positions 29.7 29.1 29.1 29.1
Classified (Non-management) Salary and Benefit Negotiations1. Are salary and benefit negotiations settled for the budget year? No
If Yes, and the corresponding public disclosure documentshave been filed with the COE, complete questions 2 and 3.
If Yes, and the corresponding public disclosure documentshave not been filed with the COE, complete questions 2-5.
If No, identify the unsettled negotiations including any prior year unsettled negotiations and then complete questions 6 and 7.
Negotiations Settled2a. Per Government Code Section 3547.5(a), date of public disclosure
board meeting:
2b. Per Government Code Section 3547.5(b), was the agreement certifiedby the district superintendent and chief business official?
If Yes, date of Superintendent and CBO certification:
3. Per Government Code Section 3547.5(c), was a budget revision adoptedto meet the costs of the agreement?
If Yes, date of budget revision board adoption:
4. Period covered by the agreement: Begin Date: End Date:
5. Salary settlement: Budget Year 1st Subsequent Year 2nd Subsequent Year(2017-18) (2018-19) (2019-20)
Is the cost of salary settlement included in the budget and multiyear projections (MYPs)?
One Year AgreementTotal cost of salary settlement
% change in salary schedule from prior yearor
Multiyear AgreementTotal cost of salary settlement
% change in salary schedule from prior year(may enter text, such as "Reopener")
Identify the source of funding that will be used to support multiyear salary commitments:
Negotiations Not Settled
6. Cost of a one percent increase in salary and statutory benefits 10,243
Budget Year 1st Subsequent Year 2nd Subsequent Year(2017-18) (2018-19) (2019-20)
7. Amount included for any tentative salary schedule increases 0 0 0

Pacheco Union ElementaryShasta County
2017-18 July 1 BudgetGeneral Fund
School District Criteria and Standards Review45 70094 0000000
Form 01CS
California Dept of EducationSACS Financial Reporting Software - 2017.1.0File: cs-a (Rev 04/10/2017) Page 24 of 27 Printed: 5/31/2017 6:22 PM
Budget Year 1st Subsequent Year 2nd Subsequent YearClassified (Non-management) Health and Welfare (H&W) Benefits (2017-18) (2018-19) (2019-20)
1. Are costs of H&W benefit changes included in the budget and MYPs? Yes Yes Yes
2. Total cost of H&W benefits 210,152 220,659 231,692
3. Percent of H&W cost paid by employer 63.7% 60.7% 57.8%
4. Percent projected change in H&W cost over prior year 5.4% -4.8% -4.8%
Classified (Non-management) Prior Year SettlementsAre any new costs from prior year settlements included in the budget? No
If Yes, amount of new costs included in the budget and MYPsIf Yes, explain the nature of the new costs:
Budget Year 1st Subsequent Year 2nd Subsequent YearClassified (Non-management) Step and Column Adjustments (2017-18) (2018-19) (2019-20)
1. Are step & column adjustments included in the budget and MYPs? Yes Yes Yes2. Cost of step & column adjustments 17,924 17,586 18,233
3. Percent change in step & column over prior year 1.5% -0.4% 2.1%
Budget Year 1st Subsequent Year 2nd Subsequent YearClassified (Non-management) Attrition (layoffs and retirements) (2017-18) (2018-19) (2019-20)
1. Are savings from attrition included in the budget and MYPs? Yes No No
2. Are additional H&W benefits for those laid-off or retired employeesincluded in the budget and MYPs? No No No
Classified (Non-management) - OtherList other significant contract changes and the cost impact of each change (i.e., hours of employment, leave of absence, bonuses, etc.):

Pacheco Union ElementaryShasta County
2017-18 July 1 BudgetGeneral Fund
School District Criteria and Standards Review45 70094 0000000
Form 01CS
California Dept of EducationSACS Financial Reporting Software - 2017.1.0File: cs-a (Rev 04/10/2017) Page 25 of 27 Printed: 5/31/2017 6:22 PM
S8C. Cost Analysis of District's Labor Agreements - Management/Supervisor/Confidential Employees
DATA ENTRY: Enter all applicable data items; there are no extractions in this section.
Prior Year (2nd Interim) Budget Year 1st Subsequent Year 2nd Subsequent Year(2016-17) (2017-18) (2018-19) (2019-20)
Number of management, supervisor, andconfidential FTE positions 6.2 6.0 6.0 6.0
Management/Supervisor/Confidential Salary and Benefit Negotiations
1. Are salary and benefit negotiations settled for the budget year? No
If Yes, complete question 2.
If No, identify the unsettled negotiations including any prior year unsettled negotiations and then complete questions 3 and 4.
If n/a, skip the remainder of Section S8C.Negotiations Settled
2. Salary settlement: Budget Year 1st Subsequent Year 2nd Subsequent Year(2017-18) (2018-19) (2019-20)
Is the cost of salary settlement included in the budget and multiyear projections (MYPs)?
Total cost of salary settlement
% change in salary schedule from prior year(may enter text, such as "Reopener")
Negotiations Not Settled3. Cost of a one percent increase in salary and statutory benefits 5,338
Budget Year 1st Subsequent Year 2nd Subsequent Year(2017-18) (2018-19) (2019-20)
4. Amount included for any tentative salary schedule increases 0 0 0
Management/Supervisor/Confidential Budget Year 1st Subsequent Year 2nd Subsequent YearHealth and Welfare (H&W) Benefits (2017-18) (2018-19) (2019-20)
1. Are costs of H&W benefit changes included in the budget and MYPs? Yes Yes Yes2. Total cost of H&W benefits 101,479 106,553 111,8813. Percent of H&W cost paid by employer 57.8% 55.0% 52.4%4. Percent projected change in H&W cost over prior year -2.4% -4.8% -4.8%
Management/Supervisor/Confidential Budget Year 1st Subsequent Year 2nd Subsequent YearStep and Column Adjustments (2017-18) (2018-19) (2019-20)
1. Are step & column adjustments included in the budget and MYPs? Yes Yes Yes2. Cost of step and column adjustments 0 0 03. Percent change in step & column over prior year -100.0% 0.0% 0.0%
Management/Supervisor/Confidential Budget Year 1st Subsequent Year 2nd Subsequent YearOther Benefits (mileage, bonuses, etc.) (2017-18) (2018-19) (2019-20)
1. Are costs of other benefits included in the budget and MYPs? Yes Yes Yes2. Total cost of other benefits 0 0 03. Percent change in cost of other benefits over prior year 0.0% 0.0% 0.0%

Pacheco Union ElementaryShasta County
2017-18 July 1 BudgetGeneral Fund
School District Criteria and Standards Review45 70094 0000000
Form 01CS
California Dept of EducationSACS Financial Reporting Software - 2017.1.0File: cs-a (Rev 04/10/2017) Page 26 of 27 Printed: 5/31/2017 6:22 PM
S9. Local Control and Accountability Plan (LCAP)
Confirm that the school district's governing board has adopted an LCAP or an update to the LCAP effective for the budget year.
DATA ENTRY: Click the appropriate Yes or No button in item 1, and enter the date in item 2.
1. Did or will the school district's governing board adopt an LCAP or approve an update to the LCAP effective for the budget year? Yes
2. Approval date for adoption of the LCAP or approval of an update to the LCAP. Jun 13, 2017
S10. LCAP Expenditures
Confirm that the school district's budget includes the expenditures necessary to implement the LCAP or annual update to the LCAP.
DATA ENTRY: Click the appropriate Yes or No button.
Does the school district's budget include the expenditures necessary to implement the LCAP or annual update to the LCAP as describedin the Local Control and Accountability Plan and Annual Update Template, Section 3: Actions, Services and Expenditures? Yes

Pacheco Union ElementaryShasta County
2017-18 July 1 BudgetGeneral Fund
School District Criteria and Standards Review45 70094 0000000
Form 01CS
California Dept of EducationSACS Financial Reporting Software - 2017.1.0File: cs-a (Rev 04/10/2017) Page 27 of 27 Printed: 5/31/2017 6:22 PM
ADDITIONAL FISCAL INDICATORS
The following fiscal indicators are designed to provide additional data for reviewing agencies. A "Yes" answer to any single indicator does not necessarily suggest a cause for concern, but mayalert the reviewing agency to the need for additional review.
DATA ENTRY: Click the appropriate Yes or No button for items A1 through A9 except item A3, which is automatically completed based on data in Criterion 2.
A1. Do cash flow projections show that the district will end the budget year with anegative cash balance in the general fund? No
A2. Is the system of personnel position control independent from the payroll system?No
A3. Is enrollment decreasing in both the prior fiscal year and budget year? (Data from theenrollment budget column and actual column of Criterion 2A are used to determine Yes or No) No
A4. Are new charter schools operating in district boundaries that impact the district'senrollment, either in the prior fiscal year or budget year? No
A5. Has the district entered into a bargaining agreement where any of the budgetor subsequent years of the agreement would result in salary increases that Noare expected to exceed the projected state funded cost-of-living adjustment?
A6. Does the district provide uncapped (100% employer paid) health benefits for current orretired employees? No
A7. Is the district's financial system independent of the county office system?No
A8. Does the district have any reports that indicate fiscal distress pursuant to EducationCode Section 42127.6(a)? (If Yes, provide copies to the county office of education) No
A9. Have there been personnel changes in the superintendent or chief businessofficial positions within the last 12 months? Yes
When providing comments for additional fiscal indicators, please include the item number applicable to each comment.
Comments:(optional)
A9. New superintendent for 2017/18.
End of School District Budget Criteria and Standards Review