pacific states marine fisheries commission
TRANSCRIPT

Pacific States Marine Fisheries Commission
in partnership with the
State of California
Department of Fish and Wildlife
California Coastal Salmonid Monitoring Program Annual Report prepared in partial fulfillment
of CDFW Fisheries Restoration Grant Program
Grantee Agreement Number: P1310501
Results of regional spawning ground surveys and estimates of total
salmonid redd construction in the South Fork Eel River, Humboldt
County California, 2015.
Prepared by
Brian Starks1, Allan Renger
2
April 27, 2016
1 Pacific States Marine Fisheries Commission 2 Corresponding author. California Department of Fish and Wildlife, [email protected]

i
ABSTRACT
During year six (2015/2016) of the South Fork Eel River Adult Salmonid Redd Abundance
Monitoring Project, 190 spawning ground surveys were conducted over 40 spatially balanced,
randomly selected reaches in the South Fork Eel River watershed from November 18th, 2015 to
March 3rd, 2016. Each reach was surveyed an average of 4.5 times, and the average interval
between surveys over all reaches was 26 days. Over the 2015/2016 survey season crews
observed 26 live coho salmon, 45 live Chinook salmon, 29 live steelhead, and 23 unidentified
salmonids. Crews encountered five coho salmon carcasses, 14 Chinook carcasses, two steelhead
carcasses, and five unidentified salmonid carcasses. A total of 339 redds were observed, 11 of
which were assigned a species in the field. The remaining 328 redds were assigned a species
using a k-Nearest Neighbors algorithm. The number of redds observed in sample reaches was
expanded to estimate the number of redds constructed across the entire South Fork Eel River
sample frame. Redd abundance estimates for the 2015/2016 spawning season in the South Fork
Eel River, including 95% confidence intervals, were 416 (117, 715) coho salmon redds, 418 (76,
892) Chinook salmon redds, and 1125 (686, 1563) steelhead redds. Improved and updated
estimates of total redd abundance are presented for survey years 2010-2014.

ii
CONTENTS
1 INTRODUCTION 1
1.1 Background 1
1.2 Study Area 1
2 METHODS 4
2.1 Sample Frame 4
2.2 Sample Reach Selection 8
2.3 Reach Survey Protocol 8
2.4 Estimation of Total Redd Abundance within Survey Frame 8
2.4.1 Assigning Species to Redds 9
2.4.2 Estimation of Within-Reach Abundance 9
2.4.3 Estimation of Total Redd Abundance 10
3 RESULTS 12
3.1 Sample Frame Changes and Status 12
3.2 Survey Statistics 12
3.3 Fish Observations 12
3.4 Redd Observations 13
3.5 Total Redd Abundance 13
4 DISCUSSION 18
5 ACKNOWLEDGEMENTS 20
6 LITERATURE CITED 21

iii
LIST OF FIGURES
Figure 1 Map of the South Fork Eel River Watershed………………………………………….3
Figure 2 Map of the lower South Fork Eel River coho-specific spawner survey frame. Reaches
surveyed during the 2015/2016 spawner survey season are red; associated subreaches
are purple. Unsurveyed sample frame reaches are blue; associated sub-reaches are
orange. Each reach is labelled with its numeric location code………………………..5
Figure 3 Map of the middle South Fork Eel River coho-specific spawner survey frame.
Reaches surveyed during the 2015/2016 spawner survey season are red; associated
subreaches are purple. Unsurveyed sample frame reaches are blue; associated sub-
reaches are orange. Each reach is labelled with its numeric location code…..…….…7
Figure 4 Map of the upper South Fork Eel River coho-specific spawner survey frame. Reaches
surveyed during the 2015/2016 spawner survey season are red; associated subreaches
are purple. Unsurveyed sample frame reaches are blue; associated sub-reaches are
orange. Each reach is labelled with its numeric location code………………………..6
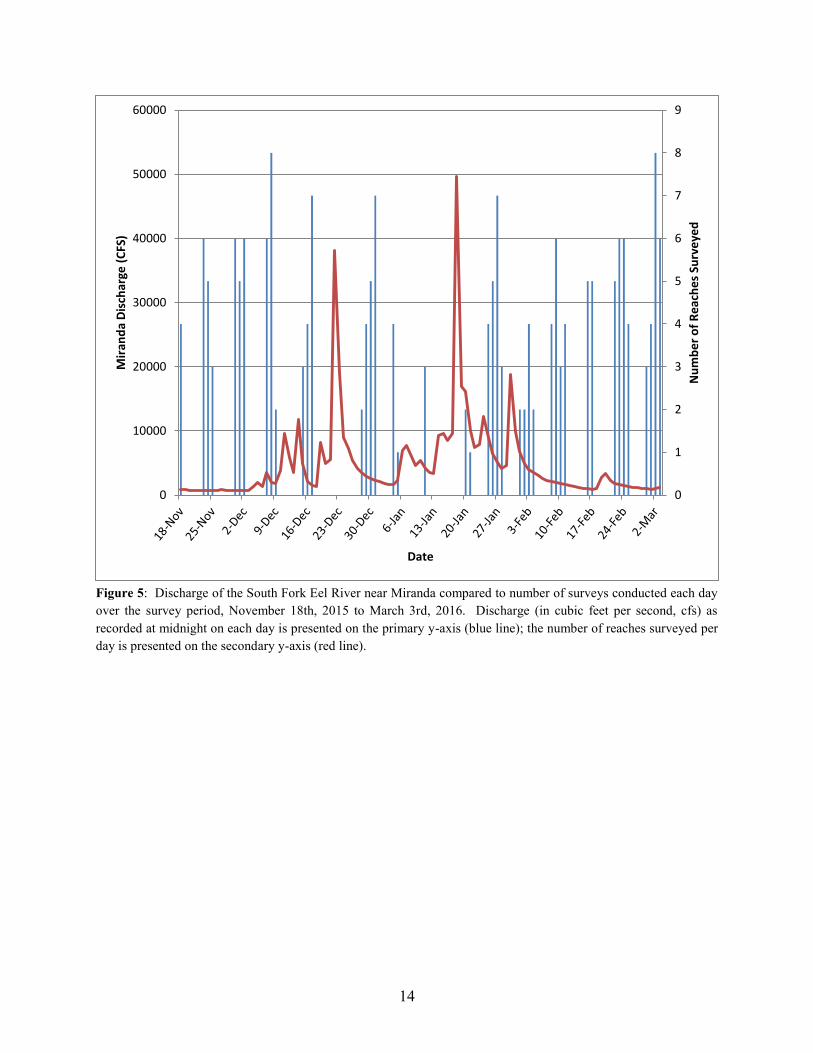
Figure 5 Discharge of the South Fork Eel River near Miranda compared to number of surveys
conducted each day over the survey period, November 18, 2015 to March 3, 2016.
Discharge (in cubic feet per second, cfs) as recorded at midnight on each day is
presented on the primary y-axis; the number of reaches surveyed per day is presented
on the secondary y-axis………………………………………………………………14
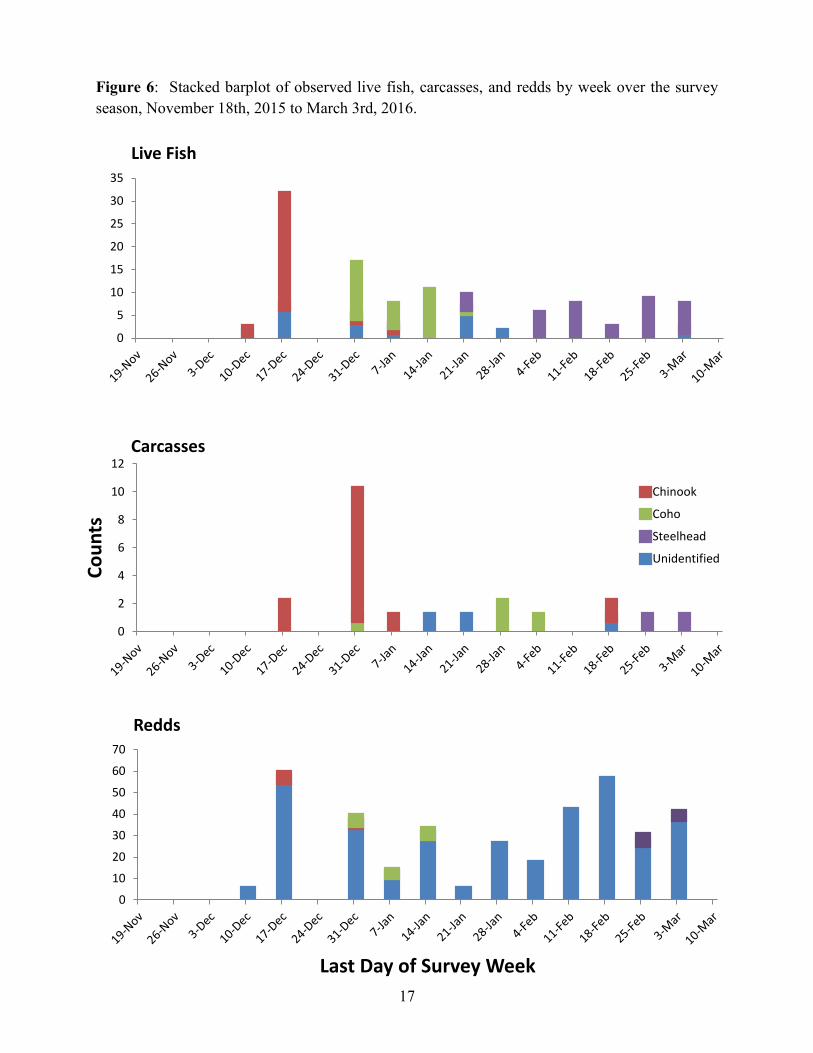
Figure 6 Stacked barplot of observed live fish, carcasses, and redds by week over the survey
season, November 18, 2015 to March 3, 2016……………………...……………….17
iv
LIST OF TABLES
Table 1 Survey statistics by reach. Reaches are listed by stream name and location code
(location codes listed in parentheses are subreaches). Mean indicates the average
interval between visits, Max is the maximum number of days between visits, and N is
the total number of visits……………………………………………………………..11
Table 2 Counts of observed live fish and redds by location code…………………………….15
Table 3 Counts of observed live fish, carcasses and redds by week over the survey season,
November 18, 2015 to March 3, 2016……………………………..………………...16
Table 4 Estimated total redd abundance by species with 95% confidence intervals…………18
Table 5 Summary of data and results collected over the six years of the South Fork Eel River
Adult Salmonid Abundance Monitoring Project. Estimated number of redds columns
include 95% confidence intervals……………………………………………………19
1
1 INTRODUCTION
1.1 BACKGROUND
Coho salmon (Oncorhynchus kisutch) in the Southern Oregon/Northern California Coast
(SONCC) Evolutionarily Significant Unit (ESU) were listed as threatened under the federal
Endangered Species Act in 1997 (62 FR 24588); and their listing was reaffirmed in 2005 (70 FR
37160). The SONNC coho salmon ESU was also listed as threatened under the California
Endangered Species Act in 2002 (CDFG 2002). Both the California Department of Fish and
Wildlife (CDFW) and the National Marine Fisheries Service (NMFS) have developed recovery
plans for coho salmon outlining recovery goals, prioritizing recovery actions, and offering
criteria that must be met in order to delist the species (CDFW 2004, NMFS 2014). Long-term
population monitoring is an essential component of these recovery plans, as metrics are needed
to assess recovery actions and track the species’ progress towards recovery.
The 2011, CDFW “Fish Bulletin 180 California Coastal Salmonid Monitoring Plan” (CMP)
established the approach for monitoring ESA/CESA listed anadromous salmonid population(s)
status and trend in California. In the CMP’s Northern California area, adult salmonid population
abundance will be monitored using extensive spawning ground surveys to estimate total redd
escapement within a survey area/sample frame. Each year spawning ground surveys are
conducted on a random and spatially balanced sample of survey reaches, drawn from a survey
frame encompassing all potential spawning habitat available to anadromous salmonid species
within the designated study area. Georeferenced live salmonids, salmonid carcasses, and redd
observation data are collected in each reach. The number of redds per salmonid species
identified by observation and data analysis within the sample reaches is then expanded to
estimate total redd escapement for the entire sample frame (Adams et al. 2011).
1.2 STUDY AREA
The South Fork Eel River flows through Humboldt and Mendocino counties and is a significant
tributary within California’s third largest watershed (see Figure 1). The South Fork Eel River’s
confluence with the Eel River is located approximately three miles north of the town of Weott,
CA and approximately 40 river miles upstream from the Eel River’s confluence with the Pacific
Ocean, near the town of Loleta, CA. The South Fork Eel River Basin is the second largest sub-
basin in the Eel River watershed and covers approximately 690 square miles, 19% of the Eel
River Basin. The South Fork Eel River is approximately 100 miles long and the basin contains a
total of 683 miles of perennial blue line streams according to the USGS 7.5 Minute U.S.
Geological Survey (USGS) Quadrangle maps (CDFW 2014). The predominant land uses
throughout the basin are timber harvest, livestock grazing, and dispersed rural development. In
1998, the South Fork Eel River was listed as an impaired water body by the federal

2
Environmental Protection Agency due to high levels of sedimentation and high water
temperature (CDFW 2014).
Historically, the South Fork Eel River was the most productive major tributary of the Eel River
Basin for anadromous salmonids, supporting runs of coho salmon, Chinook salmon (O.
tshawytscha), and steelhead/rainbow trout (O. mykiss). In 1947, a high of 25,289 returning adult
coho were counted at the Benbow Dam (Taylor, 1978). However, Pacific salmon runs in the
South Fork Eel River have markedly declined since the mid-twentieth century. In 1994, a status
review of the South Fork Eel River coho salmon estimated the returning population at
approximately 1,320 adults (Brown et al. 1994).
The South Fork Eel River coho salmon are considered a core population under the federal
SONCC Coho Recovery Plan and as such constitute an important demographic for long-term
SONCC coho salmon ESU monitoring needs (NMFS 2014). The South Fork Eel River Adult
Salmonid Redd Abundance Monitoring Project was initiated by the Pacific States Marine
Fisheries Commission (PSMFC), in partnership with CDFW, in 2010 as a long-term effort to
provide estimates of adult coho salmon redd abundance in the South Fork Eel River. This report
presents the results of the 2015/2016 spawning survey season, the sixth year of the project.
Previous annual reports for years 2010 through 2014 are available in the CDFW Document
Library: https://nrm.dfg.ca.gov/documents/.

3
Figure 1: Map South Fork Eel River Watershed.

4
2 METHODS
2.1 SAMPLE FRAME
A sample frame was established for the South Fork Eel River using five parameters: (1)
documented salmonid distributions, (2) stream gradient and stream size where salmonid
distributions are unknown, (3) fish passage barrier data, (4) expert knowledge of salmonid
distribution and migration barriers, and (5) field reconnaissance (Garwood and Ricker 2011).
These data were compiled within a Geographic Information System (GIS) to develop species-
specific (coho, Chinook and steelhead) spawning distributions (sample frames).
As the focus of this project is adult coho salmon, streams within the identified coho-specific
sample frame were segmented into one to three kilometer sections, called reaches, with start and
end points at identifiable landmarks (e.g. tributaries) and upstream extents at barriers to
anadromy, both known and model-derived. All reaches were assigned a numeric identification,
known as the location code, starting at the lower-most reach and moving upstream from north to
south (Figures 1-3). Reaches that are less than one kilometer long (sub-reaches) are surveyed
with the main reach that they flow into. All data collected in these sub-reaches are combined
with that of their associated main reach (Garwood and Ricker 2011).

5
Figure 2: Map of the lower South Fork Eel River coho-specific spawner survey frame. Reaches surveyed during the
2015/2016 spawner survey season are red; associated subreaches are purple. Unsurveyed sample frame reaches are
blue; associated sub-reaches are yellow. Each reach is labelled with its numeric location code.

6
Figure 3: Map of the middle South Fork Eel River coho-specific spawner survey frame. Reaches surveyed during
the 2015/2016 spawner survey season are red; associated subreaches are purple. Unsurveyed sample frame reaches
are blue; associated sub-reaches are yellow. Each reach is labelled with its numeric location code.

7
Figure 4: Map of the upper South Fork Eel River coho-specific spawner survey frame. Reaches surveyed during the
2015/2016 spawner survey season are red; associated subreaches are purple. Unsurveyed sample frame reaches are
blue; associated sub-reaches are yellow. Each reach is labelled with its numeric location code.

8
2.2 SAMPLE REACH SELECTION
Spawning ground surveys were conducted periodically on a spatially balanced, random sample
of 40 stream reaches drawn from the coho-specific sample frame of 207 potential reaches (Table
1). A General Randomized Tessellation Stratified (GRTS) routine (McDonald 2003) was used to
create a randomized reordering of the survey frame from which the 40 reaches were drawn.
Since much of the South Fork Eel River is under private ownership, a reach’s inclusion on the
list of 40 sample reaches is dependent on stream access permission from the relevant
landowners. If permission was denied or if the landowner did not respond in time for the start of
the spawning season, the reach was skipped for the year and the next stream was drawn from the
list.
2.3 REACH SURVEY PROTOCOL
Spawning ground surveys were conducted following the methods of ground survey and data
capture outlined in Gallagher et al. 2014 and Adams et al. 2011. The surveys were conducted
over the coho and Chinook spawning season (roughly mid-November to late February/early
March during an average rainfall year) by a two-person team, either by foot in smaller streams,
or by inflatable kayak in larger streams. Each reach is intended to be surveyed once every 7 to
14 days, or as weather, flow, and turbidity conditions allow.
Live fish and carcasses were identified to species and sex if possible and X-Y coordinates
acquired with a handheld GPS unit. Carcasses were assigned a condition code ranging from 1 to
5 based on freshness, measured to fork length when possible, and marked as “captured” using a
uniquely numbered jaw tag. If a carcass was recovered with a jaw tag on a subsequent survey it
was considered “re-captured”.
Redds were attributed a species if an identifiable fish was observed actively digging or guarding
the redd. If no fish was observed on the redd, its species was left as unidentified. The location
of all newly observed redds was geo-referenced by acquiring X-Y coordinates with a handheld
GPS unit, and marked with flagging labelled with that redd’s unique record number. All new
redds encountered were assigned an age of (1) new since last survey. On subsequent surveys,
encountered flags were matched with their associated redds, which were then re-assigned a new
age of (2) still visible and measurable, (3) visible, but not measurable, (4) not visible, or (5)
unknown due to poor visibility. If a new redd was unattended or an old redd was not previously
measured, physical measurements were taken, including length and width of pot and tailspill,
substrate size of pot and tailspill, and depth of the pot relative to the surrounding substrate.
2.4 ESTIMATION OF TOTAL REDD ABUNDANCE WITHIN SURVEY FRAME
The redd data collected over the course of the spawning season was expanded to estimate total
coho salmon redd abundance over the entire survey frame using the steps outlined in Ricker et al.

9
2014. In order to estimate total redd abundance; (1) all redds were assigned a species, (2)
within-reach redd abundance was estimated, and (3) within-reach redd abundance was expanded
to estimate total redd abundance across the entire survey frame.
2.4.1 ASSIGNING SPECIES TO REDDS
Only redds directly associated with a live fish, building or guarding them, were considered
unambiguously known to species. In order to assign a species to the redds labelled in the field as
“unidentified species,” a k-Nearest Neighbor (kNN) model was used to predict which species
(coho, Chinook, or steelhead) was most likely to have constructed the redd (Ricker et al. 2013).
Both known species redds and live fish observations were used as known elements in the training
set of data in the kNN model. The standardized z-scores of X and Y coordinates, and julian date
of observation were used as feature attributes and each redd was classified by the majority vote
of the three nearest neighbors (known redds and live fish) in Euclidean distance. Leave-one-out-
cross-validation (LOOCV) of the known redds in the survey was then used to evaluate the
performance of the kNN model. All calculations were performed using the program R with the
“class” package (Venables and Ripley 2002) and the “caret” package (Kuhn 2013). Only known
species fish and redds from the current survey year were chosen for use in the training data
available to make predictions.
The use of live fish in the prediction of species to field unidentified redds represents a change to
the implementation of the kNN model used in past years’ analysis. This change was
implemented to improve the accuracy of predictions, particularly where redd locations and
spawning period overlap for coho salmon and steelhead. Field observations indicate steelhead
are more rarely seen building or guarding their redds, but more regularly observed proximal to
the redd features, often associated with cover and/or deeper habitats. Due to few steelhead redds
being unambiguously assigned to species, both the LOOCV evaluations of model performance
and professional judgement indicated the model using only known redds in the training set was
erroneously predicting many of the later season, steelhead sized and appearance redd features as
coho salmon. The inclusion of known fish to the training set provided more observations and is
believed to be more accurate at predicting species of unknown redds.
2.4.2 ESTIMATION OF WITHIN-REACH ABUNDANCE
High stream discharge, and time between repeated surveys result in scour or flatten redds and
therefore obscure them from potential counting (Jones, 2012). To account for the unseen
fraction of redds deposited then subsequently obscured from view between repeated surveys, the
total number of redds constructed within a survey reach was estimated using a flag-based mark-
recapture model. The total count of individually observed and flagged redds for a given reach is
divided by the square root of the seasonally pooled redd survival rate. Redd survival is calculated
as the fraction of re-observed and still identifiable flagged redds (“recaptures” assigned age 2 or

10
3) to the total number of flagged redds available to for potential re-observation (“marked”).
Taking the square root of this fraction assumes the deposition of redds occurs at the midpoint
between survey intervals (see below) (Schwarz et al. 1993). Bootstrap resampling from an
assumed binomial distribution was used to represent the uncertainty of the pooled seasonal redd
survival term in the estimator of total number of redds within the reach. The variance of the
estimated total number of redds within a reach is calculated as the variance of the resultant
bootstrap distribution (Manly 1997, Ricker et al. 2014). Additional assumptions applied to this
model are:
1. Surveyors correctly identify all redds and no redds are missed during each survey.
2. Once a redd has been classified as “not visible” it does not become visible at a later
occasion.
3. All redd flags are re-observed, identifiable, and recorded.
4. All marked redds have the same probability of survival, regardless of species or age
and across all occasions.
5. New redds are constructed at the mid-point between survey intervals
2.4.3 ESTIMATION OF TOTAL REDD ABUNDANCE
A Simple Random Sample estimator is used to expand the number of redds in the sample reaches
to an estimated total over the entire sample frame. The estimated total is calculated as the
product of the total number of reaches in the sample frame and the mean number of redds of the
sample reaches. The total variance is the sum of the within reach variance of the sample reaches
and the between sample reach variance (Adams et al. 2011).

11
Table 1: Survey frequency by reach. Reaches are listed by stream name and location code (location codes listed in
parentheses are subreaches). Mean indicates the average interval between visits, Max is the maximum number of
days between visits, and N is the total number of visits.
Location Code Stream Name Mean Max N
101 (1325) South Fork Eel River 13.5 14 3
103 (1340) South Fork Eel River 22.67 41 4
107 (1359) South Fork Eel River 18 26 4
110 (1369) South Fork Eel River 27.5 29 3
127 (172) Bull Creek 24.25 64 5
143 Squaw Creek 14 37 8
205 Canoe Creek 31.33 52 4
340 (345) Fish Creek 18.8 30 6
416 Redwood Creek 42 75 3
421 Redwood Creek 32 61 4
426 Redwood Creek 13.71 21 8
453 (457) Somerville Creek 19.4 34 6
520 Little Sproul Creek 16.5 24 7
521 Little Sproul Creek 16.5 24 7
565 Cox Creek 13 17 8
584 East Branch South Fork Eel River 32.67 59 4
587 East Branch South Fork Eel River 32.67 59 4
748 Indian Creek 30.33 40 4
753 Indian Creek 42.5 56 3
754 (779) Indian Creek 20.5 28 5
780 Sebbas Creek 20.5 35 5
800 Anderson Creek 29.33 49 4
827 Standley Creek 40.5 55 3
828 Standley Creek 40.5 55 3
941.1 Hollow Tree Creek 45 75 3
941.3 Hollow Tree Creek 45 75 3
950.1 Hollow Tree Creek 45.5 62 3
950.2 Hollow Tree Creek 45.5 62 3
957 Hollow Tree Creek 15.17 32 7
981 Redwood Creek 11.5 16 5
991 Bond Creek 22.25 47 5
1061 Rattlesnake Creek 24.5 54 5
1108 Grapewine Creek 14.14 25 8
1127 (1156)
1132 (1196)
1248 (1254)
1275
1277
1316
1327
Ten Mile Creek
Ten Mile Creek
Cahto Creek
Fox Creek
Elder Creek
Redwood Creek
Kenny Creek
49
17.5
17.8
15.75
15.75
15.2
21
84
22
27
27
27
21
28
3
3
6
5
5
6
5
All Reaches 25.83 190

12
3 RESULTS
3.1 SAMPLE FRAME CHANGES AND STATUS
Field reconnaissance of the South Fork Eel River sampling frame is now considered complete
and appropriate updates transferred to the state-wide CMP Geo database in Sacramento and the
luLocation table of the CMP Aquatic Survey’s Survey Management Switchboard. Sample frame
updates included changes to reach lengths, start stop locations, and total number of reaches.
Reach additions resulted from the splitting of reaches on Hollow Tree Creek (Location Codes
943, 950) into multiple shorter reaches that better fit field protocols and reach length criteria for
the CMP. Primary main reaches in the South Fork Eel headwaters region above Dutch Charlie
Creek were removed from the sample frame for the 2011-12 survey season then added back in
for the 2012 and future years after physical access for survey crews was deemed available and
reasonable using boating survey methods. The lower most reach in Rattlesnake Creek above the
canyon (Location Code 160) was removed in 2011 due to inaccessibility and surveyor safety
concerns. There were additional instances of shortening reaches at the terminus at the upstream
extents of distribution. Smaller sub-reaches were added and or subtracted, but the manipulation
of sub-reaches did not change the total number of main reaches in the sample frame. The 2015
South Fork Eel coho salmon sampling frame is considered finalized and will remain static for the
continuation of the project into future years. The finalized coho salmon sample frame consists of
204 main survey reaches (Figures 1, 2, and 3). Given this progress, the adoption of a fixed,
rotating panel revisit design will be proposed to the CMP Science Team Sample Frame group for
adoption and implementation.
3.2 SURVEY STATISTICS
Survey crews conducted a total of 190 spawning ground surveys from November 18th, 2015 to
March 3rd, 2016 over the 40 randomly selected stream reaches within the South Fork Eel River
watershed. Each reach was visited between three and eight times over the survey season
(average number of visits per reach was 5). The average interval between surveys over all
reaches was 26 days (Table 1). Figure 4 presents the discharge measured at the South Fork Eel
River USGS gauging station near Miranda, CA relative to the number of surveys completed per
day over the survey season.
3.3 FISH OBSERVATIONS
A total of 26 coho salmon, 45 Chinook salmon, 29 steelhead, and 23 unidentified salmonids were
observed over the survey period. Five coho salmon carcasses, 14 Chinook salmon carcasses, two
steelhead carcasses and five unidentified carcasses were counted. Peak coho observations
occurred from the week ending on December 31st, 2015 to the week ending on January 14
th,
2016. Peak Chinook observations occurred from the week ending on December 10th
, 2015 to the

13
week ending on December 31st, 2015 (Figure 5). Table 2 summarizes live fish observations by
location code. Table 3 summarizes observations of live fish and carcasses by survey week.
In addition to coho, Chinook, and steelhead, one Pacific lamprey (Lampetra tridentate) was
observed in Indian Creek, location code 754, on February 24th
, 2016. Lamprey data is not
included in Table 2 or in Table 3.
3.4 REDD OBSERVATIONS
Surveyors identified five known coho salmon redds, three known Chinook redds, and three
known steelhead redds (Tables 2 and 3, Figure 5). Cross validation of the eleven known redds
resulted in the kNN model correctly assigning all known redds to the respective species. Three
hundred thirty-three redds were not field identified to species and kNN predictions of species
likely to have constructed them were made.
3.5 TOTAL REDD ABUNDANCE
Sufficient flag marking and re-observation data was available to apply the with-reach estimation
model in four sample reaches where known or predicted coho salmon redds were observed.
Aggregate counts of individual known and predicted redds by species were used in the remaining
six reaches where no reach level expansion was available. The total redd abundance estimate
for coho salmon for the 2015/2016 South Fork Eel River spawning season, with 95% confidence
intervals, is 416 (109, 722). The total redd abundance estimates for Chinook salmon and
steelhead is 433 (77, 917) and 1141 (698, 1585), respectively (Table 4).
Due to both the improvement of the kNN model’s performance by incorporating live fish into
the training set of known elements, and the adjustments to the total number of reaches in the
coho salmon sampling frame, new estimates of total redd abundance were produced for all past
survey seasons, updating previously reported figures (Table 5).
14
Figure 5: Discharge of the South Fork Eel River near Miranda compared to number of surveys conducted each day
over the survey period, November 18th, 2015 to March 3rd, 2016. Discharge (in cubic feet per second, cfs) as
recorded at midnight on each day is presented on the primary y-axis (blue line); the number of reaches surveyed per
day is presented on the secondary y-axis (red line).
0
1
2
3
4
5
6
7
8
9
0
10000
20000
30000
40000
50000
60000
Nu
mb
er
of
Re
ach
es
Surv
eye
d
Mir
and
a D
isch
arge
(C
FS)
Date

15
Table 2: Counts of observed live fish and redds by location code.
Location
Code
Live
Chinook
Known
Chinook
Redds
Live
Coho
Known
Coho
Redds
Live
Steelhead
Known
Steelhead
Redds
Live
Unidentified
Unidentified
Redds
101
103
107
110
127
143
205
340
416
421
426
453
520
521
565
584
587
748
753
754
780
800
827
828
941.1
941.3
950.1
950.2
957
981
991
1061
1108
1127
1132
1248
1275
1277
1316
1327
0
0
0
0
0
21
1
0
0
0
0
0
0
0
0
0
0
0
0
19
0
0
0
0
0
0
0
0
0
0
0
0
0
1
0
0
0
0
3
0
0
0
0
0
0
2
1
0
0
0
0
0
0
0
0
0
0
0
0
0
0
0
0
0
0
0
0
0
0
0
0
0
0
0
0
0
0
0
0
0
0
0
0
3
0
0
0
0
0
0
0
0
0
3
0
0
0
0
0
1
1
0
0
0
0
0
0
0
7
10
0
0
0
0
0
0
0
0
1
0
0
0
0
2
0
0
0
0
0
0
0
0
0
1
0
0
0
0
0
0
0
0
0
0
0
0
0
0
2
0
0
0
0
0
0
0
0
0
0
0
3
0
4
0
0
0
0
0
0
0
7
0
0
0
0
0
0
0
0
2
0
2
2
0
0
2
2
1
0
0
0
2
0
0
0
1
0
0
0
1
0
0
0
0
0
0
0
0
0
0
1
0
0
0
0
0
0
0
0
0
0
0
1
0
0
0
0
0
0
0
0
1
0
0
0
0
0
0
0
0
0
2
0
1
0
0
0
0
0
0
2
0
0
1
0
0
0
0
0
4
1
4
0
0
0
2
0
0
2
1
0
0
0
0
2
0
0
0
1
0
0
8
2
4
1
9
0
6
0
0
26
12
0
18
9
29
2
1
5
51
7
5
2
1
4
2
10
13
45
9
8
2
13
1
2
15
0
1
1
5
Total 45 3 26 5 29 3 23 329

16
Table 3: Counts of observed live fish, carcasses and redds by week over the survey season, November 18th, 2015 to March 3rd, 2016.
Last
Day of
Week
Live
Chinook Live Coho
Live
Steelhead
Live
Unidentified
Chinook
carcasses
Coho
carcasses
Steelhead
carcasses
Unidentified
carcasses
Known
Chinook
Redds
Known
Coho
Redds
Known
Steelhead
Redds
Unidentified
Redds
19-Nov
26-Nov
3-Dec
10-Dec
17-Dec
24-Dec
31-Dec
7-Jan
14-Jan
21-Jan
28-Jan
4-Feb
11-Feb
18-Feb
25-Feb
3-Mar
0
0
0
1
37
0
6
1
0
0
0
0
0
0
0
0
0
0
0
0
0
0
11
4
10
1
0
0
0
0
0
0
0
0
0
0
0
0
0
0
0
2
0
5
7
2
8
5
0
0
0
1
7
0
4
2
0
6
1
0
0
0
0
2
0
0
0
0
2
0
9
1
0
0
0
0
0
1
0
0
0
0
0
0
0
0
1
0
0
0
2
1
0
0
0
0
0
0
0
0
0
0
0
0
0
0
0
0
0
0
1
1
0
0
0
0
0
0
2
0
1
1
0
0
0
1
0
0
0
0
0
0
2
0
1
0
0
0
0
0
0
0
0
0
0
0
0
0
0
0
2
1
2
0
0
0
0
0
0
0
0
0
0
0
0
0
0
0
0
0
0
0
0
0
2
1
0
0
0
4
54
0
32
11
28
4
25
16
41
53
24
37
Total: 45 26 29 23 13 4 2 5 3 5 3 329
17
Figure 6: Stacked barplot of observed live fish, carcasses, and redds by week over the survey
season, November 18th, 2015 to March 3rd, 2016.
0
10
20
30
40
50
60
70
Last Day of Survey Week
Redds
0
2
4
6
8
10
12
Co
un
ts
Carcasses
Chinook
Coho
Steelhead
Unidentified
0
5
10
15
20
25
30
35
Live Fish

18
Table 4: Estimated total redd abundance by species with 95% confidence intervals.
Chinook Coho Steelhead
Estimated
number of redds 418 416 1125
95% Confidence
Intervals 76, 892 117, 715 686, 1563
4 DISCUSSION
The South Fork Eel River Adult Salmonid Redd Abundance Monitoring Project was initiated in
2010 as a long-term effort to provide estimates of adult coho salmon redd abundance in the
South Fork Eel River over time. As the primary focus of this project is coho salmon, spawning
ground surveys are conducted only over the spatial extent and time period deemed ideal for coho
data capture. Estimates of total redd construction for Chinook salmon and steelhead presented
herein are likely underestimates because the spatial extent of Chinook salmon and steelhead
spawning habitats are greater than the spatial extent of the coho salmon sampling frame, and
because the duration of the steelhead spawning run extends beyond the coho spawning run. The
estimates of total redd abundance for Chinook salmon and steelhead presented in this report are
representative only of those occurring within the coho-specific sampling frame and within the
observation period, November 18th, 2015 to March 3rd, 2016.
The first significant rain event of the season in the Eel River watershed occurred in mid-
December. Heavy precipitation continued through January in the sample area causing the Eel
River to reach near flood stage on multiple occasions. This heavy and consistent rainfall
increased flows and turbidity such that surveys in the South Fork Eel River watershed were
significantly impacted. Stream conditions prevented crews from surveying December 17
through December 28 as well as January 11 through January 20, 2016. Between the two larger
storm events, persistent rainfall prevented consistent surveys in many reaches due to unsafe high
flows and/or lack of instream visibility.
The South Fork Eel River is a large and complex system. As such, survey intervals and the
number of visits per reach are more influenced by the unique discharge and turbidity
characteristics of the individual reaches than by conditions basin wide. For example, Hollow
Tree Creek and Indian Creek have low turbidity rates during storm events and tend to present a
flashy behavior with quick rise and fall of stream flows, making it easier to conduct surveys
within three to five days after a significant rain event. Bull Creek and East Branch South Fork
Eel River are very high turbidity streams and can take weeks before conditions are clear enough
to survey. Consequently, some reaches within the sample frame will be more heavily sampled
during a season. Each reach was visited between three to eight times over the survey season
(average number of visits per reach was 5), and the maximum number of days between visits
ranged from 14 to 75 (the average survey interval was 26).

19
Due to significant gaps in the survey that occurred due to weather and flow the South Fork Eel
2015/2016 redd abundance estimate is likely an underestimate of actual coho and Chinook redd
abundance for this spawning year. Frequent and significant flow events prevented repeat survey
recapture of previously observed redds throughout the sampled reaches due to redds becoming
obscured between surveys, and the lack of redd recapture and live fish observations reduced
within-reach redd abundance estimates. Monitoring during the peak of steelhead spawning was
less hampered by persistent high flow and allowed for regular interval surveys, fish and redd
observation, and redd recapture.
Data obtained from operation of a salmonid life cycle monitoring station (LCM) in a sub-basin
of the South Fork Eel River would provide a ratio of redd abundance to adult salmonid spawning
escapement within the South Fork Eel watershed. An effort is underway to establish a S.F. Eel
LCM in the Sproul Creek sub-basin. Until a South Fork Eel River LCM derived, or other
appropriate index of annual redd/adult ratio is available, redd estimates developed from South
Fork Eel surveys 2010/2011, 2011/2012, 2012/2013, 2013/2014, 2014/2015, 2015/2016, and,
should be evaluated together with the achieved annual survey frequency and flow conditions
that occurred in those years. Table 5 summarizes survey statistics and redd estimates for the last
six years of the project.
Table 5: Summary of the prior six years of South Fork Eel River Coho Population Monitoring
Project redd estimates and 95% confidence intervals. *The estimated number of salmonids redds
for survey years 2010-2011 through 2014-2015 have been adjusted following new data analysis
techniques. The estimates presented in this table are the most current and should be used for
future analysis.
Survey Year
Number
of
reaches
surveyed
Total
Number
of
Surveys
Average
Survey
Interval
Average
number of
surveys
per reach
Estimated
number of
coho redds
Estimated
number of
Chinook redds
Estimated
number of
steelhead
redds
2010-2011* 31 151 21 5 1284
(159, 2543)
1829
(679, 2980)
288
(35, 255)
2011-2012* 40 204 22 5 1873
(1253, 2493)
68
(15, 148)
379
(58, 818)
2012-2013* 40 229 16 6 1340
(658, 2022)
855
(293, 1418)
761
(471, 1051)
2013-2014* 39 247 27 6 939
(304, 1574)
223
(40, 423)
1055
(359, 1751)
2014-2015* 40 248 19 6 2069
(1342, 2795)
781
(310, 1253)
967
(541, 1393)
2015-2016 40 190 26 5 416
(117, 715)
418
(76, 892)
1125
(686, 1563)
20
5 ACKNOWLEDGEMENTS
Funding for the 2015/2016 PSMFC South Fork Eel River Coho Spawning Ground Survey was
provided by the CDFW Fisheries Restoration Grant Program: Grantee Agreement Number
P1310501.
We would like to thank our project partners: the California Department of Fish and Wildlife, the
California Conservation Corps Veterans Program, and the AmeriCorps Watershed Stewards
Project. Additional thanks to Sharon Powers (PSMFC) for GIS support and maps, and to and
Scott Monday (CDFW) for report editing. Thank you to the project field technicians: Brian
Starks, David Lam, Tyler Brown, Jon Guczek, Sarah Emeterio, Ryan Bernstein, Amidia
Frederick, Isaac Mikus, Alejandra Camacho, Blake Batten, Emily Maloney, Mimi Caddell, Brian
Dohman, and Brittany Edmondson.
This project was possible thanks to the many willing landowners who granted the project team
their land and stream access permission throughout the South Fork Eel River watershed.
21
6 LITERATURE CITED
Adams, P.B., L.B. Boydstun, S.P. Gallagher, M.K. Lacy, T. McDonald, and K.E. Shaffer. 2011.
Fish Bulletin 180 California Coastal Salmonid Population Monitoring Strategy, Design,
and Methods. California Department of Fish and Game.
Brown, L.R., P.B. Moyle, R.M. Yoshiyama. 1994. Historical Decline and Current Status of
Coho Salmon in California. North American Journal of Fisheries Management. 14(2):
237-261.
California Department of Fish and Game. 2002. Status review of California coho salmon north
of San Francisco. Report to the California Department of Fish and Game Commission.
April, 2002.
California Department of Fish and Game. 2004. Recovery strategy for California coho salmon.
Report to the California Fish and Game Commission. February, 2004.
California Department of Fish and Wildlife. 2014. South Fork Eel River Watershed Assessment.
Coastal Watershed Planning and Assessment Program. California Department of Fish and
Wildlife.
Federal Register Notice: 62 FR 24588, May 6, 1997
Federal Register Notice: 70 FR 37160, June 28, 2005
Gallagher, S.P., W. Holloway, M. Knechtle, and E. Mackey. 2014. Coastal Northern California
Salmonid Spawning Survey Protocol. California Department of Fish and Wildlife. Fort
Bragg, CA.
Garwood, J., and S. Ricker. 2011. Spawner survey frame development for monitoring adult
salmonid populations in California. California Department of Fish and Game. Annual
Report. Arcata, CA.
Jones, E.C. 2012. Environmental stochasticity and the reliability of redd count data: a simulation
study of redd construction, redd loss, and survey frequency in a small coastal stream in
northern California. Thesis, Humboldt State University, 85 p.
Kuhn, M. Contributions from J. Wing, S. Weston, A. Williams, C. Keefer, A. Engelhardt, and T.
Cooper. 2013. Caret: Classification and Regression Training. R package version 5.17-7.
http://CRAN.R-project.org/package=caret

22
Manly, B. F. J. 1997. Randomization, Bootstrap and Monte Carlo Methods in Biology. Second
Edition. New York: Chapman and Hall.
McDonald, T. 2003. GRTS for the average Joe: A GRTS sampler for Windows. WEST Inc.,
Cheyenne, WY.
National Marine Fisheries Service. 2014. Final Recovery Plan for the Southern Oregon/Northern
California Coast Evolutionarily Significant Unit of Coho Salmon (Oncorhynchus
kisutch). National Marine Fisheries Service. Arcata, CA.
Ricker, S.J.,Ferreira, S.P. Gallagher, D. McCanne, and S.A. Hayes. 2013. Methods for
Classifying Anadromous Salmonid Redds to Species. Coastal Salmonid Population
Monitoring Technical Report. California Department of Fish and Wildlife, Arcata,
Californis. 24p.
Ricker, S., K. Lindke, and A. Renger. 2014. Results of regional spawning ground surveys and
estimates of total salmonid redd construction in South Fork Eel River, Humboldt County
California, 2010. California Department of Fish and Wildlife.
Schwarz, C.J. et al. 1993. Estimating salmon spawning escapement using capture-
recapture methods . Canadian Journal of Fisheries and Aquatic Sciences 50 (6),
1181-1197, 72.
Taylor, S.N. 1978. The status of salmon populations in California coastal rivers. California
Department of Fish and Game. Anadromous Fisheries Branch. April, 1978.
Venables, W.N., and B.D. Ripley. 2002. Modern Applied Statistics with S. Fourth Edition.
Springer, NY. ISBN 0-387-95457-0.