packaging waste prevention and m the quantity and …
TRANSCRIPT

PACKAGING WASTE PREVENTION AND
MINIMISATION THE QUANTITY AND VALUE OF
SAVINGS BY REPAK MEMBERS
Prepared for:
Repak Limited
By:
Dr. Pat McCloughan
Managing Director
PMCA Economic Consulting
7 August 2017

PMCA Economic Consulting
Table of Contents
List of Exhibits ........................................................................................................................................... a
Executive Summary .................................................................................................................................... i
Glossary of Terms..................................................................................................................................... iii
Acknowledgements and Disclaimer ......................................................................................................... iv
1 Introduction ................................................................................................................... 1
1.1 Purpose of the Report ................................................................................................................... 1
1.2 Background ................................................................................................................................... 1
1.3 Methodology ................................................................................................................................. 2
2 Estimated Tonnes of Packaging Waste Prevented ........................................................... 3
3 Estimated Monetary Procurement Savings ...................................................................... 7
4 Estimated Monetary Supply Chain Savings .................................................................... 10
5 Estimated Overall Monetary Savings and Conclusions ................................................... 14
5.1 Estimated Overall Savings ........................................................................................................... 14
5.2 Conclusions ................................................................................................................................. 16

PMCA Economic Consulting Page a
List of Exhibits
Tables
Table 3.1: Estimated Procurement Savings from Packaging Purchases Prevented by Repak Members (2006-2016) ................................................................................................................................................... 7
Table 4.1: Estimated Supply Chain Savings from Packaging Related Costs Prevented by Repak Members (2006-2016) ................................................................................................................................................. 11
Table 5.1: Estimated Total Savings from Packaging Purchases and Costs Prevented by Repak Members (2006-2016) ................................................................................................................................................. 14
Figures
Figure 1.1: Waste Management Hierarchy – ‘Today’ and ‘Tomorrow’ ...................................................... 2
Figure 2.1: Index of Packaging Placed by Repak Members and the Retail Sales Index (2005-2016) ........ 3
Figure 2.2: Estimated Annual Packaging Waste Prevented by Repak Members (2005-2016) .................. 4
Figure 2.3: Estimated Annual Packaging Waste Prevented by Repak Members with Fitted Trend Line (2005-2016) ................................................................................................................................................... 5
Figure 2.4: Estimated Annual and Cumulative Packaging Waste Prevented by Repak Members (2005-2016) ............................................................................................................................................................. 6
Figure 3.1: Estimated Annual Procurement Savings from Packaging Purchases Prevented by Repak Members with Fitted Trend Line (2005-2016)............................................................................................. 8
Figure 3.2: Estimated Annual and Cumulative Procurement Savings from Packaging Purchases Prevented by Repak Members (2005-2016) ................................................................................................ 9
Figure 4.1: Estimated Annual Supply Chain Savings from Packaging Related Costs Prevented by Repak Members with Fitted Trend Line (2005-2016)........................................................................................... 12
Figure 4.2: Estimated Annual and Cumulative Supply Chain Savings from Packaging Related Costs Prevented by Repak Members (2005-2016) .............................................................................................. 13
Figure 5.1: Estimated Procurement and Supply Chain Savings from Packaging Purchases and Costs Prevented by Repak Members (2006-2016) .............................................................................................. 15
Figure 5.2: Estimated Annual Total and Cumulative Total Savings from Packaging Purchases and Costs Prevented by Repak Members (2006-2016) .............................................................................................. 16

Executive Summary
PMCA Economic Consulting Page i
Executive Summary
This report by Dr. Pat McCloughan of PMCA Economic Consulting estimates the monetary savings from the packaging waste prevention activities of Repak’s member firms. After estimating the tonnes of packaging waste prevented by Repak members, the report proceeds to estimate the associated procurement savings and the supply chain savings from 2005 to 2016. The study updates the earlier report by PMCA for Repak published in 2012, which considered the period 2005-2011 (the base year in both studies is 2005).
Repak is the approved compliance scheme operator for packaging in Ireland and assists businesses in meeting their legislative obligations in respect of packaging and package waste prevention (paper, glass, plastics etc.). Day-to-day, it coordinates the funding of packaging recycling and works with its members to optimise packaging placed on the market in Ireland.
The waste management hierarchy emphasises prevention as the preferred option for dealing with all types of waste and currently occupies a central place in European and Irish waste policy.
Prevention of waste is not only beneficial for the environment but is also good for the economy because it means lower costs for businesses, thereby improving their operating performance (other things being equal) and in turn helping to sustain and create employment – the main economic policy priority.
The analysis presented in this report suggests that Repak’s members are responsible for significant monetary savings arising from their packaging waste prevention activities. Member activities have been supported by packaging waste prevention and minimisation initiatives developed by Repak, including the organisation’s Prevent and Save website and the provision of packaging technology expertise dedicated to working with Repak members in optimising the volume of packaging placed in Ireland.
Making use of data from Repak, the Central Statistics Office, the Environmental Protection Agency and other sources, the main findings of the study are as follows:
Tonnes prevented – 857,000 tonnes cumulatively 2006-2016 and 121,700 in 2016 alone;
Procurement savings – more than €365m cumulatively during the period and €52m in 2016;
Supply chain savings – €187.5m cumulatively and €26m in 2016;
Total savings – €553m cumulatively and €78m in 2016;
The €78m in total savings in 2016 represents almost €37,000 per Repak member and 18% average annual growth compared with the corresponding figure a decade earlier.
The two graphs presented overleaf illustrate the substantial total cost savings estimated to result from the packaging waste prevention activities of Repak’s member firms. The details are given in the main body of the report.
(Note that since the PMCA report of 2012, recovery through waste-to-energy as a waste management option now makes up the majority of packaging waste not recycled in Ireland. The introduction of recovery through waste-to-energy has had an increased influence on the supply chain cost estimates and this is reflected in the estimates presented in Section 4 of this report. On the other hand, disposal of packaging waste through landfill is estimated at 9% of all packaging waste generated based on the latest available EPA data for 2015, with the remaining 91% made up of 68% recycling and 23% recovery. Thus landfill’s impact on supply chain costs is lower compared with the previous PMCA report of 2012.)

Executive Summary
PMCA Economic Consulting Page ii
Estimated Annual and Cumulative Savings from Packaging Purchases and Costs Prevented by Repak Members (2006-2016)
Source: Repak, CSO and EPA data; PMCA analysis. Note: Total savings are the sum of procurement and supply chain savings. Details in the main body of the report.
€9,773,325
€20,381,978
€17,277,630
€31,297,485
€33,191,461
€36,561,749€35,627,547
€39,364,357
€42,369,829
€47,545,446
€51,863,601
€11,588,897
€9,673,359
€16,668,689 €17,178,485 €17,718,076 €17,908,459
€19,786,795€21,242,351
€23,901,605
€26,072,387
0
10,000,000
20,000,000
30,000,000
40,000,000
50,000,000
60,000,000
2006 2007 2008 2009 2010 2011 2012 2013 2014 2015 2016
€
Annual Procurement and Supply Chain Savings
Procurement Savings Supply Chain Savings
€15,555,711€31,970,874 €26,950,989
€47,966,174 €50,369,946 €54,279,826 €53,536,007 €59,151,152 €63,612,180€71,447,051 €77,935,988
€47,526,585
€74,477,575
€122,443,748
€172,813,694
€227,093,520
€280,629,526
€339,780,678
€403,392,858
€474,839,910
€552,775,898
0
100,000,000
200,000,000
300,000,000
400,000,000
500,000,000
600,000,000
2006 2007 2008 2009 2010 2011 2012 2013 2014 2015 2016
€
Annual and Cumulative Total Savings
Annual Total Savings Cumulative Total Savings

Glossary of Key Terms
PMCA Economic Consulting Page iii
Glossary of Terms
CAGR Compound annual growth rate.
CSO Central Statistics Office.
DCCAE Department of Communications, Climate Action and Environment.
EPA Environmental Protection Agency.
EU European Union.
EU28 The twenty-eight Member States of the European Union (EU).
HDPE High density polyethylene.
LDPE Low density polyethylene.
Major producer Businesses involved in the production, distribution and retailing of products containing packaging who annually place more than 10 tonnes of packaging (other than packaging for reuse or export) on the Irish market and have an annual turnover of more than €1 million.
NWPP National Waste Prevention Programme.
Packaging Any material used to contain and protect goods or to aid in their handling, delivery or presentation. Packaging is made from such materials as cardboard, paper, glass, plastic, steel, aluminium, wood, and composite materials such as those used in milk and juice cartons. The European legislative framework covers all types of packaging, including the outer box that holds a larger batch of smaller packaged products.
PET Polyethylene terephthalate.
PMCA PMCA Economic Consulting.
PP Polypropylene.
PS Polystyrene.
PVC Polyvinyl chloride.
Repak Repak Limited.
RSI Retail Sales Index (produced by the Central Statistics Office, CSO). The volume version of the index (excluding motor trades) is used in this report.

Acknowledgements and Disclaimer
PMCA Economic Consulting Page iv
Acknowledgements and Disclaimer
Acknowledgements
Dr. Pat McCloughan would like to thank the following people at Repak for their help and assistance in the preparation of this report: Mr. Seamus Clancy (Chief Executive), Mr. Colm Munnelly (Membership Manager) and Mr. Brian Walsh (Packaging Technology Executive). Thanks are also due to staff at the Central Statistics Office and the Environmental Protection Agency.
Disclaimer
This report is the sole responsibility of PMCA Economic Consulting. By virtue of preparing the report or otherwise in connection with this study, PMCA will not assume any responsibility or have any liability to any third parties.

Section 1 Introduction
PMCA Economic Consulting Page 1
1 Introduction
1.1 Purpose of the Report
This report is prepared for Repak Limited (hereinafter Repak) by Dr. Pat McCloughan, Managing Director of PMCA Economic Consulting (PMCA). It provides independent estimation of the monetary savings associated with the packaging waste prevention activities of Repak’s members during the period 2005-2016. The study updates the previous packaging waste prevention report by PMCA for Repak completed in 2012, which covered the earlier period 2005-2011; the present study pertains to the longer period since 2005 and spans an economic cycle from boom, (major) recession and recovery in the country.
1.2 Background
Packaging is an important and necessary part of our everyday lives – it allows goods to be transported safely and serves to inform consumers about products. However, the packaging that comes with the products we buy has environmental implications, and excessive packaging or packaging that is more than necessary can damage the environment and impose extra costs on the economy.
Repak is a government-approved environmental compliance scheme operator whose aims include the prevention and minimisation of packaging waste in Ireland as well as the funding of packaging recycling. Under European and Irish legislation, certain businesses – known as ‘major producers’ – are obliged to comply with the law, and the conditions for compliance apply to businesses in manufacturing, distribution and retailing with turnover greater than €1m and who place more than 10 tonnes of packaging/packaged goods in the country annually. Such obligated businesses have a choice of two compliance routes – they can self-comply and register with a local authority or they can become a member of Repak. The membership fees associated with joining Repak are used to fund packaging recycling and help Ireland to meet its packaging waste recovery and recycling targets. Repak is the predominant choice of compliance route for obligated businesses and the organisation has played a leading role in ensuring that Ireland has successfully achieved all of its recovery and recycling targets since the legislation came into effect in 1997.
According to the latest available comparative data from Eurostat (the official statistics agency of the EU), Ireland achieved packaging recycled per capita of 144 kg in 2014, which was more than one-third higher than that for the EU28 (107 kg), while packaging recovered per head was 195 kg in Ireland compared with 129 kg in the EU28, meaning the differential in favour of Ireland was more than 50% in that year.
In the same year, the Eurostat data also show that Ireland’s overall recovery and recycling rates for all packaging waste were 93% and 68% respectively, higher than the corresponding rates of 79% and 65% for the EU28. Furthermore, Ireland has also exceeded all of its recycling targets for specific materials, namely glass (87% versus the target rate of 60% by weight at the end of 2011), paper and board (79% v 60%), metals (81% v 50%), plastics (35% v 22.5%) and wood (85% v 15%).1
Repak membership fees are designed to incentivise obligated businesses to use less and lighter packaging. It also has initiatives aimed at packaging waste prevention, including the Repak Prevent and Save website and advice to members on packaging optimisation through its packaging technology expertise.
1 Data received from the Environmental Protection Agency in July 2017 show overall recovery and recycling rates
of 91% and 68% for Ireland in 2015, and specific materials recycling rates of 88% glass, 34% plastic, 80% paper and board, 75% metals and 85% wood (2015 data for the other EU members are not yet available from Eurostat).

Section 1 Introduction
PMCA Economic Consulting Page 2
The initiatives and positive outcomes associated with Repak and its members (which have also benefitted from involvement by the EPA) are noteworthy in the context of the waste management hierarchy, which has formed a central part of Ireland’s waste management policy and emphasises the principle of prevention over all other forms of waste management. The long-term goal of waste policy is to invert the pyramid, ensuring that desirable waste management activities exceeds the least desirable (landfill).
Since the PMCA report of 2012, disposal of packaging waste through landfill has fallen, while recovery through waste-to-energy as a waste management option now makes up the majority of packaging waste not recycled in Ireland. The introduction of recovery through waste-to-energy has had an increased influence on the supply chain cost estimates presented in Section 4 of this report.
Figure 1.1: Waste Management Hierarchy – ‘Today’ and ‘Tomorrow’
Source: National waste management policy.
1.3 Methodology
This study seeks to estimate the monetary savings arising from Repak members’ initiatives to prevent and minimise packaging in Ireland. The analysis proceeds in three stages, using data from the EPA and the Central Statistics Office (CSO) as well as Repak:
Estimation of the tonnage of packaging waste prevented annually due to the prevention and minimisation initiatives of Repak members (Section 2);
Estimation of the monetary procurement savings and supply chain savings associated with the tonnes prevented (Sections 3 and 4 respectively); and
The estimated overall monetary savings (Section 5).
Further details of the methods as well as the results are outlined in the respective sections of the report.
Prevention - most desirable
Re-use
Recycling
Recovery
Disposal/Landfill - least desirable

Section 2 Estimated Tonnes of Packaging Waste Prevented
PMCA Economic Consulting Page 3
2 Estimated Tonnes of Packaging Waste Prevented
The basis of the quantified monetary savings from the packaging waste prevention activities of Repak members (presented in Sections 3 and 4) are the estimates of tonnes of packaging waste prevented by Repak members presented in this section. Examples of Repak members’ activities include removal of cardboard packaging, light-weighting of plastic and glass, replacement by lighter, more flexible and/or less packaging and the use of steel trollies (see http://www.preventandsave.ie/ for more information).
We estimate packaging waste prevented by constructing a ‘counterfactual’ relating to what would have happened had Repak members not engaged in packaging optimisation activities. To do this, we employ the CSO’s Retail Sales Index (volume and excluding motor trades) and calculate the trend in packaging tonnes placed on the market by Repak members according to the RSI before deriving the estimates of packaging waste prevented as the difference between the actual and estimated counterfactual tonnes.
Before that, Figure 2.1 compares the trend in packaging tonnes placed by Repak members with the RSI during 2005-2016 (with the base year 2005 set equal to 100). It is evident from the graph that the volume of packaging placed by Repak members grew less rapidly compared with the volume of retail sales in Ireland during the sub-period before the economic crisis (2005-2007) and that, during 2007-2013, the volume of packaging placed by Repak members contracted by more than the volume of retail sales, with both series then showing strong recovery after 2013.
Figure 2.1: Index of Packaging Placed by Repak Members and the Retail Sales Index (2005-2016)
Source: Repak and CSO data; PMCA analysis.
100.0
106.7
114.4
111.5
104.1103.0
100.3 100.1100.9
104.6
111.0
115.8
100.0
102.9
106.4
104.7
91.8
89.9
85.9 86.185.4
87.9
92.3
95.4
80
85
90
95
100
105
110
115
120
2005 2006 2007 2008 2009 2010 2011 2012 2013 2014 2015 2016
20
05
=10
0
Retail Sales Index Index of Tonnes Placed by Repak Members
Section 2 Estimated Tonnes of Packaging Waste Prevented
PMCA Economic Consulting Page 4
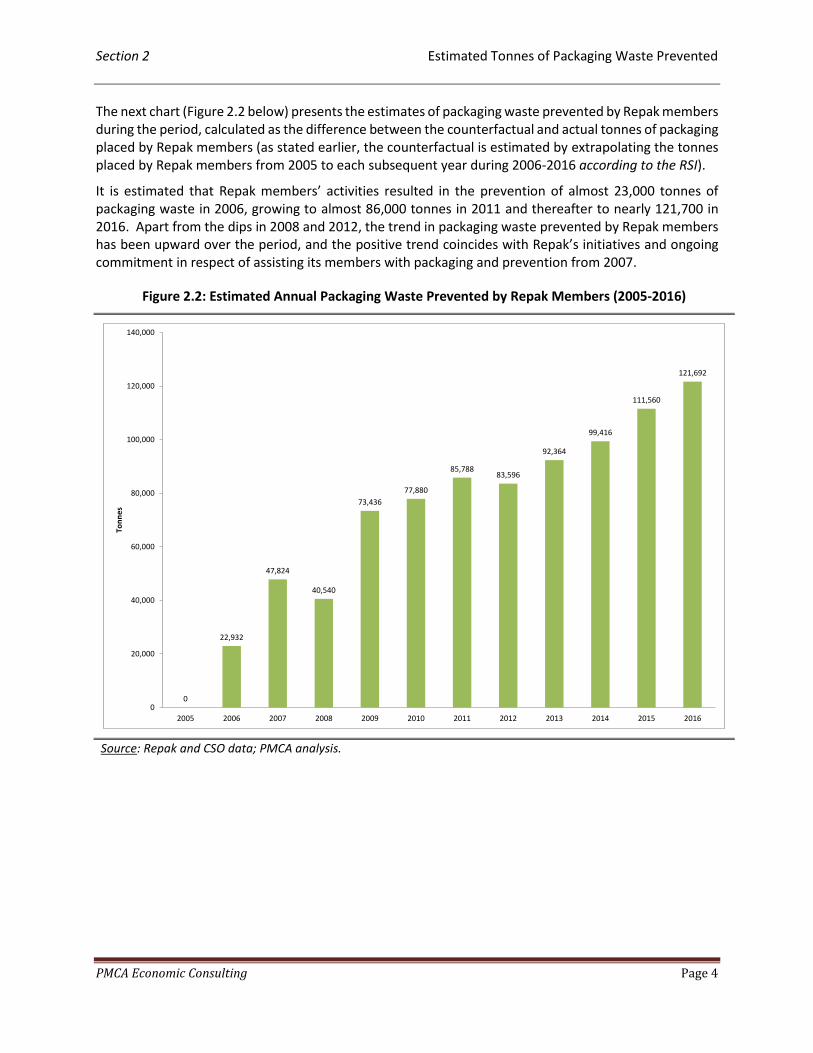
The next chart (Figure 2.2 below) presents the estimates of packaging waste prevented by Repak members during the period, calculated as the difference between the counterfactual and actual tonnes of packaging placed by Repak members (as stated earlier, the counterfactual is estimated by extrapolating the tonnes placed by Repak members from 2005 to each subsequent year during 2006-2016 according to the RSI).
It is estimated that Repak members’ activities resulted in the prevention of almost 23,000 tonnes of packaging waste in 2006, growing to almost 86,000 tonnes in 2011 and thereafter to nearly 121,700 in 2016. Apart from the dips in 2008 and 2012, the trend in packaging waste prevented by Repak members has been upward over the period, and the positive trend coincides with Repak’s initiatives and ongoing commitment in respect of assisting its members with packaging and prevention from 2007.
Figure 2.2: Estimated Annual Packaging Waste Prevented by Repak Members (2005-2016)
Source: Repak and CSO data; PMCA analysis.
0
22,932
47,824
40,540
73,436
77,880
85,78883,596
92,364
99,416
111,560
121,692
0
20,000
40,000
60,000
80,000
100,000
120,000
140,000
2005 2006 2007 2008 2009 2010 2011 2012 2013 2014 2015 2016
Ton
ne
s

Section 2 Estimated Tonnes of Packaging Waste Prevented
PMCA Economic Consulting Page 5
Figure 2.3 superimposes a statistical trend line on the estimated tonnes of packaging waste prevented by Repak members and implies that, on average during the period, each successive year saw an additional approximately 9,800 tonnes on average being prevented in Ireland.
Figure 2.3: Estimated Annual Packaging Waste Prevented by Repak Members with Fitted Trend Line (2005-2016)
Source: Repak and CSO data; PMCA analysis.
Another way of expressing the packaging waste prevention activities of Repak members is to consider the estimated tonnes of packaging waste prevented per Repak member. It is estimated that tonnes prevented per Repak member grew from 10.6 in 2006 to 57.6 in 2016, representing average annual growth of 18% calculated on a compound annual growth rate (CAGR) basis, which is strong by any economic comparison.
The analysis suggests that Repak and its members have worked together productively in preventing packaging waste being placed on the market in Ireland: Repak has provided the initiatives, including the Prevent and Save website and the dedicated packaging technology expertise; and its members have successfully applied the initiatives to curtail the volume of packaging placed in the country.
0
22,932
47,824
40,540
73,436
77,880
85,78883,596
92,364
99,416
111,560
121,692y = 9,772.44x + 7,898.17
R² = 0.93
0
20,000
40,000
60,000
80,000
100,000
120,000
140,000
2005 2006 2007 2008 2009 2010 2011 2012 2013 2014 2015 2016
Ton
ne
s

Section 2 Estimated Tonnes of Packaging Waste Prevented
PMCA Economic Consulting Page 6
Figure 2.4 shows both the estimated annual and cumulative tonnes of packaging waste prevented by Repak members. Over the whole period 2005-2016, Repak members have been responsible for preventing an estimated 857,000 tonnes cumulatively. In the previous PMCA study for Repak published in 2012, it was estimated that the cumulative tonnes prevented were 384,400 in 2011 – that figure (shown in the chart below) more than doubled in 2016.
Figure 2.4: Estimated Annual and Cumulative Packaging Waste Prevented by Repak Members (2005-2016)
Source: Repak and CSO data; PMCA analysis.
The economic significance of the packaging waste prevention achieved by Repak’s members, and assisted through Repak’s initiatives, is that it has facilitated Repak members to reduce their costs. Other things being equal, the reduction in costs associated with packaging optimisation has served to support the operating performance of Repak members, in turn putting them in a better position to maintain and create employment.
In the next two sections, we proceed to estimate the monetary cost savings from the tonnes prevented in respect of (a) procurement savings and (b) supply chain savings.2
2 The CSO has changed its methodology for compiling the RSI. To ensure continuity with the previous PMCA report,
we employ the RSI series (all retail businesses, excluding motor trades) published by the CSO (2005-2016) in its archived tables (with 2005=100 as in the 2012 PMCA report). The CSO data are as shown in Figure 2.1 (p. 3).
022,932
47,824 40,540
73,436 77,880 85,788 83,596 92,364 99,416111,560 121,692
70,756
111,296
184,732
262,612
348,400
431,996
524,360
623,776
735,336
857,028
0
100,000
200,000
300,000
400,000
500,000
600,000
700,000
800,000
900,000
2005 2006 2007 2008 2009 2010 2011 2012 2013 2014 2015 2016
Ton
ne
s
Annual Tonnes Prevented Cumulative Tonnes Prevented

Section 3 Estimated Monetary Procurement Savings
PMCA Economic Consulting Page 7
3 Estimated Monetary Procurement Savings
Procurement savings refer to the costs avoided by Repak members through not having to purchase packaging materials. The analysis presented below suggests that procurement savings achieved by Repak members are significant and that they have grown strongly over time.
Using latest available data (2016) on the percentage shares accounted for by specific types of packaging and information on the approximate cost per tonne (€) of procuring each specific packaging type, together with the estimated tonnes of all packaging waste prevented from the previous section of the report, we can estimate the monetary procurement savings associated with each specific type of packaging and in turn total procurement savings per year during 2005-2016.
For instance, of the tonnes of packaging placed on the market by Repak members in 2016, cardboard accounted for 18.52%, implying an estimated 22,537 tonnes of cardboard were prevented from being placed in that year. At about €142 to acquire a tonne of cardboard, this translates into estimated procurement cost savings by Repak members of €3.2m in 2016. This exercise is repeated for the other types of packaging material for each year to give the estimated annual and cumulative procurement savings associated with activities that have prevented the purchase of packaging by Repak members.
Table 3.1 shows the estimated procurement savings among Repak members for each type of packaging material at each year during 2006-2016. According to the analysis, procurement savings grew from €9.8m in 2006 to more than €36.5m in 2011 and to almost €52m in 2016. Procurement savings per Repak member increased from €4,514 in 2006 to €24,568 in 2016, representing average annual growth of 18% on a CAGR basis.3
Table 3.1: Estimated Procurement Savings from Packaging Purchases Prevented by Repak Members (2006-2016)
Source: Repak and CSO data; PMCA analysis. Note: PET is short for polyethylene terephthalate, HDPE for high density polyethylene, PVC for polyvinyl chloride, LDPE for low density polyethylene, PP for polypropylene and PS for polystyrene. The year 2005 is not shown because it is the base year in the estimation analysis (it is included in the graphs overleaf for illustration purposes).
3 There are differences in the estimated procurement savings for 2006-2011 between this report and the 2012
PMCA report, due to using 2016 figures for the percentage shares of specific materials and procurement costs.
Packaging Type 2006 2007 2008 2009 2010 2011 2012 2013 2014 2015 2016 Total
Steel €202,432 €422,166 €357,867 €648,256 €687,486 €757,294 €737,944 €815,343 €877,595 €984,796 €1,074,237 €7,565,415
Aluminium €1,007,705 €2,101,540 €1,781,457 €3,227,013 €3,422,296 €3,769,799 €3,673,476 €4,058,770 €4,368,657 €4,902,303 €5,347,539 €37,660,555
Wood €128,475 €267,932 €227,123 €411,422 €436,319 €480,623 €468,343 €517,465 €556,974 €625,010 €681,774 €4,801,460
Tetra €3,582 €7,470 €6,332 €11,471 €12,165 €13,400 €13,058 €14,427 €15,529 €17,426 €19,008 €133,868
Paper €593,306 €1,237,322 €1,048,867 €1,899,966 €2,014,943 €2,219,541 €2,162,829 €2,389,678 €2,572,131 €2,886,325 €3,148,466 €22,173,373
Cardboard €603,075 €1,257,695 €1,066,137 €1,931,249 €2,048,119 €2,256,087 €2,198,441 €2,429,025 €2,614,482 €2,933,850 €3,200,306 €22,538,467
Glass €292,734 €610,488 €517,505 €937,433 €994,162 €1,095,110 €1,067,128 €1,179,054 €1,269,075 €1,424,097 €1,553,436 €10,940,220
PET €774,093 €1,614,347 €1,368,468 €2,478,906 €2,628,917 €2,895,860 €2,821,867 €3,117,839 €3,355,886 €3,765,819 €4,107,837 €28,929,839
HDPE €1,138,523 €2,374,355 €2,012,721 €3,645,933 €3,866,568 €4,259,183 €4,150,355 €4,585,666 €4,935,783 €5,538,705 €6,041,739 €42,549,530
PVC €60,311 €125,777 €106,620 €193,137 €204,824 €225,622 €219,857 €242,917 €261,464 €293,403 €320,050 €2,253,984
LDPE €4,699,180 €9,799,998 €8,307,376 €15,048,358 €15,959,014 €17,579,505 €17,130,325 €18,927,046 €20,372,128 €22,860,652 €24,936,894 €175,620,476
PP €151,351 €315,638 €267,564 €484,678 €514,008 €566,201 €551,734 €609,602 €656,146 €736,296 €803,168 €5,656,385
PS €80,033 €166,906 €141,485 €256,292 €271,801 €299,400 €291,750 €322,350 €346,962 €389,344 €424,705 €2,991,028
Other plastic €38,526 €80,344 €68,107 €123,372 €130,838 €144,124 €140,441 €155,172 €167,019 €187,421 €204,443 €1,439,807
Total €9,773,325 €20,381,978 €17,277,630 €31,297,485 €33,191,461 €36,561,749 €35,627,547 €39,364,357 €42,369,829 €47,545,446 €51,863,601 €365,254,408
Total per Repak Member €4,514 €9,320 €7,561 €13,178 €14,166 €15,890 €16,358 €18,665 €20,282 €22,980 €24,568 18%
Estimated Procurement Savings

Section 3 Estimated Monetary Procurement Savings
PMCA Economic Consulting Page 8
According to the graph presented in Figure 3.1, each successive year between 2005 and 2016 was associated with an estimated additional €4.2m in procurement savings on average being realised by Repak members. This figure is based on the estimated slope coefficient of the line-of-best fit shown in the graph below (in some years, the estimated procurement savings exceeded those predicted by the fitted line, while in other years the reverse pattern is observed – either way, the rate of change in the upward trend in procurement savings achieved by Repak members is appreciably high).
Figure 3.1: Estimated Annual Procurement Savings from Packaging Purchases Prevented by Repak Members with Fitted Trend Line (2005-2016)
Source: Repak and CSO data; PMCA analysis.
0
9,773,325
20,381,978
17,277,630
31,297,485
33,191,461
36,561,74935,627,547
39,364,357
42,369,829
47,545,446
51,863,601
y = 4,164,887.30x + 3,366,099.91R² = 0.93
0
10,000,000
20,000,000
30,000,000
40,000,000
50,000,000
60,000,000
2005 2006 2007 2008 2009 2010 2011 2012 2013 2014 2015 2016
€

Section 3 Estimated Monetary Procurement Savings
PMCA Economic Consulting Page 9
Figure 3.2 illustrates the trend in both the estimated annual and cumulative procurement savings made by Repak members since 2005 and shows the significant extent in these savings arising from the prevention of packaging. At the end of 2016, it is estimated that procurement savings by Repak members cumulated to over €365m.
Figure 3.2: Estimated Annual and Cumulative Procurement Savings from Packaging Purchases Prevented by Repak Members (2005-2016)
Source: Repak and CSO data; PMCA analysis.
09,773,325
20,381,978 17,277,630
31,297,485 33,191,461 36,561,749 35,627,547 39,364,357 42,369,82947,545,446 51,863,601
30,155,303
47,432,933
78,730,418
111,921,879
148,483,628
184,111,175
223,475,532
265,845,361
313,390,807
365,254,408
0
50,000,000
100,000,000
150,000,000
200,000,000
250,000,000
300,000,000
350,000,000
400,000,000
2005 2006 2007 2008 2009 2010 2011 2012 2013 2014 2015 2016
€
Annual Procurement Savings Cumulative Procurement Savings

Section 4 Estimated Monetary Supply Chain Savings
PMCA Economic Consulting Page 10
4 Estimated Monetary Supply Chain Savings
Supply chain savings relate to savings attained by Repak members in logistics, production and Repak fees by avoiding the requirement for packaging.
The estimated supply chain savings are based on the following:
Repak fees avoided;
Supply chain costs avoided by Repak members (salaries, storage etc.);
Recycling revenue; and
Landfill expenses.
Repak charges fees to its members based on the amount and type of packaging placed on the market. More difficult to recycle materials are charged at higher rates than those easier to recycle. Repak fees comprise participation and material-specific fees and are applied across the packaging supply chain, reflecting the Producer Pays Principle. Repak’s charging model was developed over a decade ago and its fees have been frozen at 2008 levels since that time. Repak fees avoided have been estimated for each packaging material type for the purposes of this report.
In relation to supply chain costs avoided, it is estimated that salary costs are €66.67 per tonne per year and storage costs are €100 per tonne per year. In addition, baling/compacting costs plus lift costs (sundry costs) are estimated at €20 per tonne per annum. These are fixed costs across packaging types.
The Landfill Levy has increased rapidly over the years, from €15 per tonne in 2002 to €75 per tonne in 2016 (under the Landfill Levy Regulations 2015). We have used the latter figure in this report, together with a gate fee for landfill of €45, which has fallen over the years.
Recycling fees are known to be highly volatile, shaped as they are by international market conditions and the recycling of packaging materials placed on the Irish market is carried out overseas. The analysis presented here is based on international data (the recycling fees incorporate material prices paid by international recyclers (late 2016), which vary by specific material type) (recycling fees are also quoted in sterling and the analysis here reflects the euro-sterling exchange rate at the beginning of December 2016).
The data for landfill rates and recycling rates for each specific material type are from the EPA (National Waste Reports) and are current for most of the years during the period. In particular, the rates for 2006 are for that year etc. to 2012; those for 2013 are based on the EPA’s 2012 data; those for 2014 on the EPA’s 2014 data; and the rates for 2015 and 2016 are based on the latest available EPA data for 2015.
Since the PMCA report of 2012, recovery through waste-to-energy as a waste management option now makes up the majority of packaging waste not recycled in Ireland. The introduction of recovery through waste-to-energy has had an increased influence on the supply chain cost estimates and this is reflected in the estimates presented in this section of this report. On the other hand, disposal of packaging waste through landfill is estimated at 9% of all packaging waste generated based on the latest EPA data for 2015, with the remaining 91% made up of 68% recycling and 23% recovery. Thus landfill’s impact on supply chain costs is lower compared with the previous PMCA report of 2012.
According to the analysis presented in Table 4.1 overleaf, estimated supply chain savings arising from the packaging waste prevention activities of Repak members have grown from €5.8m in 2006 to €26m in 2016 or by almost €187.5m cumulatively over the period.

Section 4 Estimated Monetary Supply Chain Savings
PMCA Economic Consulting Page 11
It is also seen from the table of analysis below that estimated supply chain savings per Repak member grew from €2,671 in 2006 to €12,351 in 2016, representing average annual growth of 17%.4
Table 4.1: Estimated Supply Chain Savings from Packaging Related Costs Prevented by Repak Members (2006-2016)
Source: Repak, CSO and EPA data; PMCA analysis. Note: PET is short for polyethylene terephthalate, HDPE for high density polyethylene, PVC for polyvinyl chloride, LDPE for low density polyethylene, PP for polypropylene and PS for polystyrene. The year 2005 is not shown because it is the base year in the estimation analysis (it is included in the graphs overleaf for illustration purposes).
4 On comparison of the present results with those in the 2012 PMCA study, it is seen that there are variations
within specific material types during the common period to both studies (2006-2011). This reflects the changes in (updated) supply chain cost components and the inherent volatility in recycling rates for specific materials. The total supply chain cost savings at the bottom of the respective tables (here and in the earlier PMCA report) are broadly similar for the common period (2006-2011).
Packaging Type 2006 2007 2008 2009 2010 2011 2012 2013 2014 2015 2016 Total
Steel €231,686 €415,060 €366,155 €690,088 €744,648 €757,601 €689,905 €762,266 €820,465 €920,688 €1,004,306 €7,402,870
Aluminium €86,445 €177,612 €199,165 €104,832 €22,146 €31,571 -€213,973 -€236,416 -€254,466 -€285,550 -€311,484 -€680,117
Wood €599,189 €1,244,848 €1,054,845 €1,910,065 €2,024,109 €2,231,340 €2,252,529 €2,488,786 €2,670,901 €2,996,576 €3,268,730 €22,741,918
Tetra €8,158 €16,850 €14,219 €25,466 €26,720 €28,583 €28,748 €31,763 €33,914 €38,004 €41,455 €293,881
Paper €793,020 €1,602,099 €1,337,851 €2,331,809 €2,382,216 €2,356,486 €2,649,253 €2,927,121 €3,099,055 €3,462,166 €3,776,605 €26,717,683
Cardboard €806,077 €1,628,479 €1,359,880 €2,370,203 €2,421,441 €2,395,286 €2,692,875 €2,975,318 €3,150,082 €3,519,172 €3,838,789 €27,157,601
Glass €1,457,016 €2,800,270 €2,397,884 €4,291,754 €4,493,552 €4,841,371 €4,717,667 €5,212,482 €5,403,438 €6,022,950 €6,569,964 €48,208,346
PET €302,508 €625,202 €508,513 €878,776 €912,259 €949,974 €926,665 €1,023,858 €1,127,398 €1,281,252 €1,397,618 €9,934,023
HDPE €274,987 €563,649 €440,587 €724,651 €734,359 €713,722 €732,464 €809,289 €923,359 €1,061,344 €1,157,737 €8,136,149
PVC €18,402 €38,205 €31,734 €56,199 €59,001 €63,325 €60,431 €66,770 €72,331 €81,760 €89,185 €637,345
LDPE €1,129,089 €2,319,477 €1,832,902 €3,057,116 €3,119,813 €3,095,582 €3,128,546 €3,456,685 €3,903,075 €4,471,700 €4,877,827 €34,391,812
PP €44,523 €92,197 €75,676 €132,192 €137,918 €145,583 €140,615 €155,364 €169,835 €192,551 €210,039 €1,496,494
PS €18,402 €38,205 €31,734 €56,199 €59,001 €63,325 €60,431 €66,770 €72,331 €81,760 €89,185 €637,345
Other plastic €12,882 €26,744 €22,214 €39,339 €41,301 €44,327 €42,302 €46,739 €50,632 €57,232 €62,430 €446,141
Total €5,782,386 €11,588,897 €9,673,359 €16,668,689 €17,178,485 €17,718,076 €17,908,459 €19,786,795 €21,242,351 €23,901,605 €26,072,387 €187,521,490
Total per Repak Member €2,671 €5,299 €4,233 €7,018 €7,332 €7,700 €8,222 €9,382 €10,169 €11,552 €12,351 17%
Estimated Supply Chain Savings

Section 4 Estimated Monetary Supply Chain Savings
PMCA Economic Consulting Page 12
During 2005-2016, the line of best fit shown in Figure 4.1 shows that each successive year during the period was associated with an estimated average €2m increase in supply chain savings by Repak members.
Figure 4.1: Estimated Annual Supply Chain Savings from Packaging Related Costs Prevented by Repak Members with Fitted Trend Line (2005-2016)
Source: Repak, CSO and EPA data; PMCA analysis.
0
5,782,386
11,588,897
9,673,359
16,668,68917,178,485
17,718,076 17,908,459
19,786,795
21,242,351
23,901,605
26,072,387
y = 2,000,942.30x + 2,620,665.88R² = 0.91
0
5,000,000
10,000,000
15,000,000
20,000,000
25,000,000
30,000,000
2005 2006 2007 2008 2009 2010 2011 2012 2013 2014 2015 2016
€

Section 4 Estimated Monetary Supply Chain Savings
PMCA Economic Consulting Page 13
Figure 4.2 shows the significant extent of the supply chain savings – annually and cumulatively – estimated among Repak members during the period, reaching an estimated €187.5m cumulative total in 2016.
Figure 4.2: Estimated Annual and Cumulative Supply Chain Savings from Packaging Related Costs Prevented by Repak Members (2005-2016)
Source: Repak, CSO and EPA data; PMCA analysis.
05,782,386
11,588,897 9,673,359
16,668,689 17,178,485 17,718,076 17,908,459 19,786,795 21,242,35123,901,605 26,072,387
17,371,282
27,044,642
43,713,331
60,891,815
78,609,892
96,518,351
116,305,147
137,547,498
161,449,103
187,521,490
0
20,000,000
40,000,000
60,000,000
80,000,000
100,000,000
120,000,000
140,000,000
160,000,000
180,000,000
200,000,000
2005 2006 2007 2008 2009 2010 2011 2012 2013 2014 2015 2016
€
Annual Supply Chain Savings Cumulative Supply Chain Savings

Section 5 Estimated Overall Monetary Savings and Conclusions
PMCA Economic Consulting Page 14
5 Estimated Overall Monetary Savings and Conclusions
5.1 Estimated Overall Savings
Table 5.1 summarises both the estimated procurement and supply chain savings made by Repak members from their prevention of packaging waste placed on the market in Ireland during 2006-2016.
It is seen that most of the savings have come from procurement savings and that total savings among Repak members are estimated at €78m in 2016 or a cumulative total of €553m at 2016.
Per Repak member, annual total savings grew by on average 18% during the period, from €7,185 in 2006 to €37,000 at the end of the period – appreciably strong growth by any economic comparison.
Table 5.1: Estimated Total Savings from Packaging Purchases and Costs Prevented by Repak Members (2006-2016)
Source: Repak, CSO and EPA data; PMCA analysis. Note: 2005 not shown because it is the base year in the estimation analysis.
Procurement Supply Chain Annual Total
Cumulative
Total
Annual per
Repak
Member
2006 €9,773,325 €5,782,386 €15,555,711 €15,555,711 €7,185.09
2007 €20,381,978 €11,588,897 €31,970,874 €47,526,585 €14,618.60
2008 €17,277,630 €9,673,359 €26,950,989 €74,477,575 €11,794.74
2009 €31,297,485 €16,668,689 €47,966,174 €122,443,748 €20,196.28
2010 €33,191,461 €17,178,485 €50,369,946 €172,813,694 €21,498.06
2011 €36,561,749 €17,718,076 €54,279,826 €227,093,520 €23,589.67
2012 €35,627,547 €17,908,459 €53,536,007 €280,629,526 €24,580.35
2013 €39,364,357 €19,786,795 €59,151,152 €339,780,678 €28,047.01
2014 €42,369,829 €21,242,351 €63,612,180 €403,392,858 €30,451.02
2015 €47,545,446 €23,901,605 €71,447,051 €474,839,910 €34,532.17
2016 €51,863,601 €26,072,387 €77,935,988 €552,775,898 €36,918.99
CAGR 18% 16% 17% 18%
Estimated Savings (€)

Section 5 Estimated Overall Monetary Savings and Conclusions
PMCA Economic Consulting Page 15
Figure 5.1 illustrates the trends in the estimated procurement and supply chain savings emanating from the packaging waste prevention activities of Repak members since 2005 and suggests the significant savings resulting from prevention.
Figure 5.1: Estimated Procurement and Supply Chain Savings from Packaging Purchases and Costs Prevented by Repak Members (2006-2016)
Source: Repak, CSO and EPA data; PMCA analysis.
€9,773,325
€20,381,978
€17,277,630
€31,297,485
€33,191,461
€36,561,749€35,627,547
€39,364,357
€42,369,829
€47,545,446
€51,863,601
€11,588,897
€9,673,359
€16,668,689 €17,178,485 €17,718,076 €17,908,459
€19,786,795€21,242,351
€23,901,605
€26,072,387
0
10,000,000
20,000,000
30,000,000
40,000,000
50,000,000
60,000,000
2006 2007 2008 2009 2010 2011 2012 2013 2014 2015 2016
€
Annual Procurement and Supply Chain Savings
Procurement Savings Supply Chain Savings

Section 5 Estimated Overall Monetary Savings and Conclusions
PMCA Economic Consulting Page 16
Finally, Figure 5.2 shows the total savings (both procurement and supply chain savings) from packaging waste prevented by Repak members during the period and it is estimated that the total cumulative savings amounted to €553m in 2016.
Figure 5.2: Estimated Annual Total and Cumulative Total Savings from Packaging Purchases and Costs Prevented by Repak Members (2006-2016)
Source: Repak, CSO and EPA data; PMCA analysis.
5.2 Conclusions
PMCA’s estimates suggest the following findings:
Tonnes prevented – 857,000 tonnes cumulatively 2006-2016 and 121,700 in 2016 alone;
Procurement savings – more than €365m cumulatively during the period and €52m in 2016;
Supply chain savings – €187.5m cumulatively and €26m in 2016;
Total savings – €553m cumulatively and €78m in 2016;
The €78m in total savings in 2016 represents almost €37,000 per Repak member and 18% average annual growth compared with the corresponding figure a decade earlier. The estimated savings are beneficial for the Irish economy as well as for the environment because they serve to support Repak members’ operating performance and this in turn puts these firms in a better position to maintain and create jobs – the main economic policy priority.
€15,555,711€31,970,874 €26,950,989
€47,966,174 €50,369,946 €54,279,826 €53,536,007 €59,151,152 €63,612,180€71,447,051 €77,935,988
€47,526,585
€74,477,575
€122,443,748
€172,813,694
€227,093,520
€280,629,526
€339,780,678
€403,392,858
€474,839,910
€552,775,898
0
100,000,000
200,000,000
300,000,000
400,000,000
500,000,000
600,000,000
2006 2007 2008 2009 2010 2011 2012 2013 2014 2015 2016
€
Annual and Cumulative Total Savings
Annual Total Savings Cumulative Total Savings