pacs numbers: 03.75.nt, 42.50.nn, 67.10 - arxiv.org · pacs numbers: 03.75.nt, 42.50.nn, 67.10.ba...
TRANSCRIPT
Spatiotemporal coherence of non-equilibrium multimode photon condensates
Jakov Marelic, Lydia F. Zajiczek,∗ Henry J. Hesten, Kon H. Leung,
Edward Y. X. Ong, Florian Mintert, and Robert A. Nyman†
Physics Department, Blackett Laboratory, Imperial College London,Prince Consort Road, SW7 2AZ, United Kingdom
(Dated: Thursday 26th July, 2018)
We report on the observation of quantum coherence of Bose-Einstein condensed photons inan optically-pumped, dye-filled microcavity. We find that coherence is long-range in space andtime above condensation threshold, but short-range below threshold, compatible with thermal-equilibrium theory. Far above threshold, the condensate is no longer at thermal equilibrium andis fragmented over non-degenerate, spatially overlapping modes. A microscopic theory includingcavity loss, molecular structure and relaxation shows that this multimode condensation is similarto multimode lasing induced by imperfect gain clamping.
PACS numbers: 03.75.Nt, 42.50.Nn, 67.10.Ba
Quantum condensation and coherence are intimatelylinked for ensembles of identical particles. Condensation,defined by a macroscopically large fraction of all particlesbeing in a single state (usually the ground state [1, 2]) istypically associated with coherence as seen in the first-order correlation function, which is proportional to thevisibility of fringes of an interference measurement [3].
While observation of thermal equilibrium and macro-scopic occupancy of the ground state are sometimes con-sidered sufficient proof of Bose-Einstein condensation(BEC), the enhancement of coherence brought by BECmeans that interferometry is one of the most urgent mea-surements to be made with a condensate [4, 5]. Wherethermal equilibrium is not completely reached, coherenceis the defining characteristic of non-BEC quantum con-densation, e.g for semiconductor exciton-polaritons [6–9]and organic polaritons [10, 11]. In non-ideal Bose gases,such as ultracold atoms, interactions tend to reduce butnot destroy the coherence [12–14].
Photon condensates in dye-filled microcavities areweakly-interacting [15–18], inhomogeneous [19, 20], dis-sipative Bose gases close to thermal equilibrium at roomtemperature [21–25]. It is worth noting that the phys-ical system has some similarities to a dye laser, withthe decisive difference being that lasing is necessarilya non-equilibrium effect whereas photons can also un-dergo BEC in thermal equilibrium. Consequently BECimplies macroscopic occupation of the ground state in-dependently of the pump properties, whereas a laser ischaracterized by a large occupation of exactly the modethat is most strongly pumped [26].
Unique among physical realisations of BEC, in dye-microcavity photon BEC the particles thermalise onlywith a bath and not directly among themselves. Thisimplies that the establishment of phase coherence in thecondensation process is necessarily mediated via indirectinteractions through by the dye, i.e. a system whosefast relaxation renders all mediated interaction incoher-ent. Notably, coherence in photon condensates has not
yet been systematically measured.
Condensates with macroscopic occupation of two ormore states without phase relation are called frag-mented [27]. Whereas strong, attractive interactionsfavour fragmentation, repulsive interactions stabilise asingle condensate mode [2, 28, 29]. Nevertheless, frag-mentation has been observed using ultracold atoms inmultiple spin states [30], or separated spatial modes [31,32]. Fragmented, dissipative condensates with spatiallyseparated states have been seen in polaritons in semicon-ductors [33, 34], and organic solids [35]. It has been pro-posed that for driven, dissipative bosonic systems, mul-timode condensation is a general non-equilibrium phe-nomenon [36], when driving happens faster than dissi-pation (such as loss, thermal equilibration or spatial re-distribution).
Below threshold pump power, Pth, the coherencetime T and length L of the thermalised light are ex-pected to be of order h/kBT0 ' 0.15 ps and λdB =√hλ0c / 2πkBT0n2L ' 1.5µm where λ0 ' 590 nm is the
wavelength of the lowest-energy cavity mode, T0 = 300 Kthe temperature, c the speed of light in free space and nLthe refractive index of the solvent filling the cavity [37–39]. The coherence time is predicted to be much greaterabove threshold than below [25, 39], increasing further asthe number of particles in the condensate increases, andthe coherence length is expected to be at least as large asthe whole condensate [40]. Multimode condensation mayoccur and its effect on coherence is not predicted [20].
In this manuscript we present measurements of the co-herence properties of thermalised photons with both timedelays and position shifts between the two arms of an in-terferometer. We describe how the controls and outputsof our imaging interferometer correspond to the under-lying first-order correlation function, g(1)(r, r′, τ), as afunction of positions r and r′ and time delay τ . Wecharacterise the coherence time and length of the pho-ton condensate as a function of pump power. Below andjust above threshold, the measurements are compatible
arX
iv:1
510.
0556
2v3
[co
nd-m
at.q
uant
-gas
] 1
9 Fe
b 20
16

2
with thermal equilibrium theory. Far above threshold,the condensate fragments into multiple, spatially-distinctbut overlapping, non-degenerate modes accompanied bya decrease of both spatial and temporal coherence. Weinterpret multimode condensation as a non-equilibriumphenomenon similar to gain saturation in lasers.
Our experiment starts by pumping a fluorescent dyein a high-finesse microcavity [19, 22] in quasi-continuousconditions. The pump spot was elliptical with a minoraxis of typically 50–60 µm diameter, and we use the 8th
longitudinal mode of the cavity with a cutoff wavelengthof 590 nm. These parameters are known to produce nearthermal-equilibrium conditions [20]. The cavity photolu-minescence is imaged to infinity, then split. Half is splitagain and imaged onto an auxiliary camera and a spec-trometer whose spectral resolution, about 0.2 nm, is in-sufficient to resolve the bare cavity modes which are sep-arated by 0.05 nm. The other half is sent to an imagingMach-Zehnder interferometer, as shown in Fig. 1. Eachof the two arms of the interferometer has a delay line:one controlled by a piezo for the fine motion to scan overa fringe, the other controlled by a motor for coarse mo-tion. The horizontal axis, x, of the last adjustable mirrorin one arm is controlled by a motor, whose motion is con-verted to a shift in position of the image at the camera.Both outputs of the interferometer are sent onto a camerathrough a single imaging optic, imaged to two separatelocations on the sensor. There is a linear-polarising filterin front of the camera, which increases the visibility offringes.
The camera records a spatially resolved intensity dis-tribution. If one arm of the interferometer is blocked,this corresponds to the intensity I(r) emitted from thecavity, i.e. the spatial profile of the condensate pho-toluminescence. Since pumping and detection in thisexperiment are quasi-continuous, all processes are sta-tionary. Temporal resolution comes in terms of thepath delay of the interferometer. The detected in-terferometer signal depends on r, r′ and τ , wherer = (x, y) is the position on the camera, r′ = (x+ δx, y),with the displacement δx introduced by one arm ofthe interferometer and τ is the temporal delay corre-sponding to the path-length difference between the twoarms of the interferometer. The Michelson visibilityof fringes V is directly related to the coherence g(1):V (r, r′, τ) = 2
∣∣g(1)(r, r′, τ)∣∣√I(r)I(r′)/ [I(r) + I(r′)].
We scan the piezo-controlled delay, typically acquir-ing a set of 41 images, while maintaining all other pa-rameters fixed. The principal result of our data analy-sis (explained in detail in Supplementary Material) is afour-dimensional set of visibility data, V (x, y, δx, τ). Forany value of x and y we can extract a characteristic co-herence time T (or length L), with a fit, usually to aGaussian, in τ (or δx respectively). In Fig. 1 (bottom,from left to right) we see an image of the photon con-densate I(x, y), an image of the visibility of the same
Fine delay line (piezo)
Variable tilt (motor)
Camera
Light from cavity
Coarse delay line (motor)
FIG. 1. Top: Diagram of interferometer. The fine delay forscanning phase is controlled by a piezo actuator. Large-scaletime delays τ are controlled by a motor. The image passingthrough one arm of the interferometer is shifted by a mo-torised mirror mount. Bottom: various levels of abstractionof the data just above threshold pump power, with overlappedimages (r = r′). From left to right: a raw image at τ = 0, avisibility image (inferred from a set of 41 images at varyingfine delay times), a coherence-time image (inferred from a setof 29 visibility images for varying τ).
condensate V (x, y)δx=0,τ=0 and an image of its coher-ence time, T (x, y)δx=0. Since the images are overlapped(δx = 0), the visibility V is exactly equal to the coherenceg(1). Fig. 2 is generated by choosing a single pixel x0, y0
FIG. 2. Visibility for a specific pixel, far below (left) and justabove (right) threshold for condensation as delay and shiftare varied, V (τ, δx)x0,y0 . The coherence times (lengths) are0.2 ps (4.5 µm) for the thermal cloud and 10 ps (14 µm) forthe condensate.
and measuring the visibility V (τ, δx)x0,y0 as a function oflong-range delay and image shift. The results are shownjust above and far below threshold. Under inspection,the differences between V and g(1) were not noticeable,so we have presented V . Coherence time and length areinferred from a two-dimensional Gaussian fit to the data.
Far below threshold, the length and time scales of co-herence, 4.5 µm and 0.2 ps, are slightly longer than the

3
thermal scales. This overestimation in both space andtime is explained by finite spatial resolution of around3 µm (see Supplementary Material). Above thresholdthe measured length, 14 µm, of the condensate is com-parable to the size of the condensate itself, implying thatthe whole condensate shares one phase, as expected. Themeasured coherence time of 10 ps is also large, limited bycondensate emission frequency fluctuations on timescalesequal to the time between images, 200 ms. The con-densate emission frequency variations are dominated bythe variation of the cavity length at the limits of ourlocking scheme, which has a bandwidth of 20 Hz andresolution equivalent to about 0.05 nm in cavity cutoffwavelength [41].
Fig. 3 depicts the spectrum, image I(r) and visibilityimage V (r) for various pump powers above threshold.The condensate peak in the spectrum broadens with in-creasing pump power and breaks up into multiple peaks,i.e. the condensate splits into multiple non-degeneratemodes. Fig. 3 shows three peaks, but we have seen up tofive distinct peaks in some experimental runs where weused reduced pump spot sizes to lower the pump thresh-old.
FIG. 3. Normalised photoluminescence spectrum (left col-umn), normalised image (middle column) and visibility image(right column) for various pump powers (rows, as labelled onthe graph) above threshold Pth. The spectrum broadens andsplits into multiple modes, the condensate broadens in spaceand the visibility image fragments at higher powers. A smallpump spot (30 ± 10 µm) was used to reduce threshold pumppower.
Along with this non-degenerate multimode behaviour,the condensate broadens and the measured visibility de-velops a fragmented structure. With a poorer spec-trometer resolution, the spatial broadening could have
been taken as an indication of repulsive interactions [22].Since, however, there is no blue-shift in the spectrumapart from variations of the cavity length [41], Fig. 3 givesclear evidence of the condensation of non-interacting pho-tons in several modes, rather than quantum depletionreducing the condensate fraction.
We now ask: how does coherence vary across thresholdand in the multimode regime? Are the non-degeneratemodes coherent with each other, and is the multimodebehaviour a sign of the breakdown of thermal equilib-rium?
We define the spatial coherence length as the scale ofa Gaussian fit to the visibility, as a function of shift be-tween two images V (δx), and measure it for various pumppowers. V (δx) and a cut through the photoluminescenceintensity I(x) are shown in Fig. 4 (top), for two pumppowers, one far below and one just above threshold. InFig. 4 (middle), we compare experiments to a thermalequilibrium theory without dissipation (see Supplemen-tary Material). The theory is based on a series expansionof the correlation function [42, 43] which agrees with ex-act calculations [44]. There are no free parameters belowthreshold (solid lines), but the scaling of the horizontalaxis is imprecise above threshold (shown as dashed lines),as the number of photons varies non-linearly with pumppower [25].
Within the theory’s range of validity (P . Pth) thereis quantitative agreement with the experiment. Farbelow threshold, the coherence length is much shorterthan the characteristic size of photoluminescence, lim-ited only by imaging resolution. With increasing poweraround threshold, coherence length grows, as the widthof the emitted light decreases. At even higher pow-ers, when the system enters the multimode regime, theintensity increases but the coherence length decreasesto around 6 µm (approximately the harmonic oscillatorlength scale), indicating that the multiple modes are in-coherent. The condensate is only partially coherent, incontradiction to the dissipative, thermal-equilibrium pre-diction of Ref. [40].
In Fig. 4 (bottom), we show the coherence time. Farbelow threshold, the shortest measured coherence timeis limited by spatial resolution and marginal undersam-pling of the data [45]. Above threshold, an upper boundfor coherence time is set by the vibrations of the cav-ity [41]. Barely into the multimode regime, coherencetime decreases, suggesting no coherence between modes,in agreement with the spatial coherence data. Eventhough thermal-equilibrium theory (black lines, solid be-low threshold, dashed above) does not describe the co-herence time as accurately as spatial coherence and in-tensity, it captures qualitatively the increase of temporalcoherence as the threshold pump power is reached.
Condensate fragmentation cannot be explained bythermal-equilibrium processes. We therefore need toinvoke a microscopic model that takes into account

4
0.0 0.5 1.0 1.5 2.0 2.5Pump power / Threshold pump power
0
10
20
30
40
50
60
70
Sca
le (µm
)
Intensity, theory
Coherence, theory
Intensity, data
Coherence, data
80 40 0 40 80x or δx (µm)
0.0
0.2
0.4
0.6
0.8
1.0P=0.125 Pth
I(x)
V(δx )
80 40 0 40 80x or δx (µm)
0.0
0.2
0.4
0.6
0.8
1.0P=1.125 Pth
I(x)
V(δx )
0.0 0.2 0.4 0.6 0.8 1.0 1.2 1.4 1.6Pp / Pth
0.0
0.5
1.0
1.5
2.0
2.5
Cohere
nce
tim
e (
ps)
Intensity I
Coherence V
FIG. 4. Coherence length and time as a function of pumppower. Top: at pixel (x0, y0), for two powers P , visibility asa function of shift between images V (δx, P )x0,y0,τ=0 and in-tensity distribution I(x, P )y0 are shown, together with Gaus-sian fits. Middle: size of intensity distribution and visibilityobtained from the fits. Solid lines are thermal-equilibriumtheory with no adjustable parameters. Dashed lines are thesame theory where it is only approximately valid. Bottom: co-herence time, from Gaussian fits to V (τ, P )x0,y0,δx=0. Solidline (dashed line) is the prediction assuming thermal equi-librium below threshold (and its approximate continuationabove threshold).
spatially-inhomogeneous pumping, molecular relaxationvia the thermal bath of solvent vibrations, spontaneousemission and cavity loss [20]. In Fig. 5 we show the resultsof the model (see Supplementary Material for more de-tails). For computation efficiency, the model is restrictedto one dimension. With increasing pump power, conden-sation occurs first in the lowest mode, then subsequentlyin higher modes (left panel). When one mode reachesthreshold, it locally clamps the excited state populationof dye molecules, but sufficient gain remains at the edgesthat more modes can reach threshold. The multimoderegime is reached for the lowest pump powers for a pump
spot which is large enough to overlap with several spatialmodes of the bare resonator (right panel). It is possibleto extract approximate values for coherence length andtime from the same microscopic model, and we find goodqualitative agreement with Fig. 4 in all regimes, below,near and far-above threshold.
0.2 0.3 0.5 0.7 1 2 3P / Pth
10-1
101
103
105
107
Mode P
opula
tion
Ground
1st excited
2nd excited
3rd excited
1 2 3 4 5 6 7Pump Width / lHO
10-7
10-6
10-5
10-4
Thre
shold
/ a
rb. unit
s
Ground
1st excited
2nd excited
3rd excited
FIG. 5. A microscopic model of dye molecules, cavity modesand dissipation explains the multimode behaviour. Left: forincreasing pump power, first the ground state reaches thresh-old, then more excited modes. Right: threshold for differentmodes depends on the size of the pump spot, given in unitsof harmonic oscillator length lHO.
In conclusion, we have observed first-order coherenceof thermalised photons in a dye-filled microcavity, be-low and above condensation threshold. Spatiotemporalcorrelations are longer-range for the condensed than non-condensed state, and show increases in range even belowthreshold, in broad agreement with thermal-equilibriumtheory. Above threshold, multiple modes are seen whichis a signal of non-equilibrium, driven, dissipative pro-cesses [36]. There is no coherence between modes. Inthis case, a microscopic model shows that the fragmenta-tion can be explained using concepts from laser physics,i.e. imperfect gain clamping. By generating inhomoge-neous, nonlinear gain and loss processes it may be possi-ble to create equivalent states in other trapped conden-sates such as polaritons [9, 46] or atoms [47]. It would beintriguing to know if higher-order particle-particle corre-lations occur between modes even in the absence of phasecoherence, and how superfluidity manifests itself in mul-timode condensates.
During review of this manuscript we became awareof related work on phase coherence of photon con-densates [48]. We thank Jonathan Keeling and HenkStoof for inspiring discussions, and acknowledge fi-nancial support from the UK EPSRC (via fellowshipEP/J017027/1 and the Controlled Quantum DynamicsCDT EP/L016524/1), and the ERC (via ODYCQUENTgrant).
∗ Present address: Analytical Science Division, NationalPhysical Laboratory, Hampton Road, Teddington, Mid-

dlesex TW11 0LW, UK† Correspondence to [email protected]
[1] O. Penrose and L. Onsager, Phys. Rev. 104, 576 (1956).[2] L. P. Pitaevskii and S. Stringari, Bose-Einstein conden-
sation (Oxford University Press, Oxford, 2003), No. 116.[3] L. Mandel and E. Wolf, Optical coherence and quantum
optics (Cambridge University Press, Cambridge, 1995).[4] M. R. Andrews, C. G. Townsend, H.-J. Miesner, D. S.
Durfee, D. M. Kurn, and W. Ketterle, Science 275, 637(1997).
[5] I. Bloch, T. W. Hansch, and T. Esslinger, Nature 403,166 (2000).
[6] J. Kasprzak, M. Richard, S. Kundermann, A. Baas, P.Jeambrun, J. Keeling, M. FM Marchetti, et al., Nature443, 409 (2006).
[7] H. Deng, D. Press, S. Gotzinger, G. S. Solomon, R. Hey,K. H. Ploog, and Y. Yamamoto, Phys. Rev. Lett. 97,146402 (2006).
[8] H. Deng, G. S. Solomon, R. Hey, K. H. Ploog, and Y.Yamamoto, Phys. Rev. Lett. 99, 126403 (2007).
[9] R. Balili, V. Hartwell, D. Snoke, L. Pfeiffer, and K. West,Science 316, 1007 (2007).
[10] K. Daskalakis, S. Maier, R. Murray, and S. Kena-Cohen,Nature materials 13, 271 (2014).
[11] J. D. Plumhof, T. Stoferle, L. Mai, U. Scherf, and R. F.Mahrt, Nature materials 13, 247 (2014).
[12] Y. Castin and J. Dalibard, Phys. Rev. A 55, 4330 (1997).[13] M. Fattori, C. D’Errico, G. Roati, M. Zaccanti, M. Jona-
Lasinio, M. Modugno, M. Inguscio, and G. Modugno,Phys. Rev. Lett. 100, 080405 (2008).
[14] M. Gustavsson, E. Haller, M. J. Mark, J. G. Danzl, G.Rojas-Kopeinig, and H.-C. Nagerl, Phys. Rev. Lett. 100,080404 (2008).
[15] D. Snoke and S. Girvin, Journal of Low TemperaturePhysics 171, 1 (2013).
[16] R. A. Nyman and M. H. Szymanska, Phys. Rev. A 89,033844 (2014).
[17] A. Chiocchetta and I. Carusotto, Phys. Rev. A 90,023633 (2014).
[18] E. C. I. van der Wurff, A.-W. de Leeuw, R. A. Duine,and H. T. C. Stoof, Phys. Rev. Lett. 113, 135301 (2014).
[19] J. Marelic and R. A. Nyman, Phys. Rev. A 91, 033813(2015).
[20] J. Keeling and P. Kirton, Phys. Rev. A 93, 013829(2016).
[21] J. Klaers, F. Vewinger, and M. Weitz, Nature Physics 6,512 (2010).
[22] J. Klaers, J. Schmitt, F. Vewinger, and M. Weitz, Nature468, 545 (2010).
[23] J. Schmitt, T. Damm, D. Dung, F. Vewinger, J. Klaers,and M. Weitz, Phys. Rev. A 92, 011602 (2015).
[24] P. Kirton and J. Keeling, Phys. Rev. Lett. 111, 100404(2013).
[25] P. Kirton and J. Keeling, Phys. Rev. A 91, 033826(2015).
[26] B. Fischer and R. Weill, Opt. Express 20, 26704 (2012).[27] E. J. Mueller, T.-L. Ho, M. Ueda, and G. Baym, Phys.
Rev. A 74, 033612 (2006).[28] A. J. Leggett, Rev. Mod. Phys. 73, 307 (2001).[29] P. Nozieres, in Bose-Einstein Condensation, edited by
D. W. S. A. Griffin and S. Stringari (Cambridge Univer-sity Press, Cambridge, 1995).
[30] L. D. Sarlo, L. Shao, V. Corre, T. Zibold, D. Jacob, J.Dalibard, and F. Gerbier, New Journal of Physics 15,
113039 (2013).[31] Y. P. Chen, J. Hitchcock, D. Dries, M. Junker, C.
Welford, and R. G. Hulet, Phys. Rev. A 77, 033632(2008).
[32] S. Krinner, D. Stadler, J. Meineke, J.-P. Brantut, and T.Esslinger, Phys. Rev. Lett. 115, 045302 (2015).
[33] M. Richard, J. Kasprzak, R. Andre, R. Romestain, L. S.Dang, G. Malpuech, and A. Kavokin, Phys. Rev. B 72,201301 (2005).
[34] E. A. Cerda-Mendez, D. N. Krizhanovskii, M. Wouters,R. Bradley, K. Biermann, K. Guda, R. Hey, P. V. Santos,D. Sarkar, and M. S. Skolnick, Phys. Rev. Lett. 105,116402 (2010).
[35] K. S. Daskalakis, S. A. Maier, and S. Kena-Cohen, Phys.Rev. Lett. 115, 035301 (2015).
[36] D. Vorberg, W. Wustmann, R. Ketzmerick, and A.Eckardt, Phys. Rev. Lett. 111, 240405 (2013).
[37] V. Guarrera, P. Wurtz, A. Ewerbeck, A. Vogler, G.Barontini, and H. Ott, Phys. Rev. Lett. 107, 160403(2011).
[38] A.-W. de Leeuw, H. T. C. Stoof, and R. A. Duine, Phys.Rev. A 88, 033829 (2013).
[39] A.-W. de Leeuw, E. C. I. van der Wurff, R. A. Duine,and H. T. C. Stoof, Phys. Rev. A 90, 043627 (2014).
[40] A.-W. de Leeuw, H. T. C. Stoof, and R. A. Duine, Phys.Rev. A 89, 053627 (2014).
[41] These rapid cavity length fluctuations relate directly tothe mechanical stability of the cavity. We optimise themechanical stability through reinforcement screws, whoseprecise adjustment affects the maximum coherence timewe observe from one experimental data set to another.We interpret all coherence times above 2 ps as “large”.
[42] M. Naraschewski and R. J. Glauber, Phys. Rev. A 59,4595 (1999).
[43] M. Kohnen and R. A. Nyman, Phys. Rev. A 91, 033612(2015).
[44] S. M. Barnett, S. Franke-Arnold, A. S. Arnold, and C.Baxter, Journal of Physics B: Atomic, Molecular and Op-tical Physics 33, 4177 (2000).
[45] The spatiotemporal coherence measurements of Fig. 2below threshold do not suffer from undersampling andwe observe as low as 0.24 ps coherence time. Spatial res-olution still gives a lower limit.
[46] K. Winkler, O. Egorov, I. Savenko, X. Ma, E. Estrecho,T. Gao, S. Muller, M. Kamp, T. Liew, E. Ostrovskaya,et al., arXiv preprint arXiv:1509.08820 (2015).
[47] G. Barontini, R. Labouvie, F. Stubenrauch, A. Vogler,V. Guarrera, and H. Ott, Phys. Rev. Lett. 110, 035302(2013).
[48] J. Schmitt, T. Damm, D. Dung, C. Wahl, F. Vewinger,J. Klaers, and M. Weitz, Phys. Rev. Lett. 116, 033604(2016).

Spatiotemporal coherence of non-equilibrium multimode photon condensates:Supplementary material
Jakov Marelic, Lydia F. Zajiczek,∗ Henry J. Hesten, Kon H. Leung,Edward Y. X. Ong, Florian Mintert, and Robert A. Nyman†
Physics Department, Blackett Laboratory, Imperial College London,Prince Consort Road, SW7 2AZ, United Kingdom
(Dated: Thursday 18th February, 2016)
S1. DATA ACQUISITION AND ANALYSIS
Our experimental apparatus is almost identical to [S1].We pump a fluorescent dye in a high-finesse microcavityin quasi-continuous conditions, using 500 ns pulses, whichare much longer than any thermalisation or cavity losstime scales in the system. The pulse repetition rate isvaried so that the product of pump power and repetitionrate is kept constant, up to 2000 mW laser output power,where the repetition rate is 500 Hz. Our maximum laseroutput power is 2200 mW, and about 50% of this lightmakes it into the cavity (through modulators and thecavity mirror). The repetition rate variation means thatwe have acceptable signal-to-noise over a very large rangeof pump powers. Images are integrated over, typically,50–2000 ms. The pump spot was elliptical with an aspectratio not far from one, and a minor axis between 50 and60 µm diameter.
A. Acquisition
The interferometer signal is observed using a colourcamera. All colour values are converted to monochromeby summing red and green channels. For 590 nm (ourtypical working wavelength) the sensor of our camera(PointGrey Grasshopper GS3-U3-23S6C-C) is roughlyequally sensitive in both red and green channels. Bothoutput ports of the interferometer are directed to thesame sensor. Two areas of the sensor are assigned asin-phase (P ) and quadrature (Q). For each set of data,there is one image taken with one arm of the interferom-eter blocked, to allow us to align P and Q images.
To measure the visibility, we scan the voltage of thepiezo controlling one of the delay lines while maintainingall other parameters fixed, so that the fine-scale delaytime which we call τf varies over about 3 periods of oscil-lation of the light (6 fs). The piezo voltage is typically setto 41 values covering about 3 complete fringes. At eachτf we take an image. Coarse-scale delays, τ , up to 300 psare achieved with the motor on the other delay line, with
∗ Present address: Analytical Science Division, National PhysicalLaboratory, Hampton Road, Teddington, Middlesex TW11 0LW,UK† Correspondence to [email protected]
a precision of around 2 fs. The total delay is τf + τ , butwe treat τf and τ as independent, since they vary oververy different magnitudes, |τf | � |τ |. We overlap theimages vertically (in the y axis) but with a motorisedmirror mount induce a shift in the horizontal axis, δx.A full set of data for measuring the spatio-temporal co-herence consists of images in (x, y) for a variety of τf ,τ and δx. Thus we build a five-dimensional data setI(x, y, δx, τ, τf ). The notation includes the calibrationof imaging magnification, so all co-ordinates presentedare scaled to the intra-cavity co-ordinates.
A larger dataset is taken by varying control parametersof the photon condensate itself. In this manuscript, weonly vary pump power Pp. Whenever the pump power ischanged, the exposure and gain of the camera as well asthe spectrometer are adjusted automatically to maximisedynamic range.
We make the reasonable assumption that the coher-ence varies only slowly compared to the oscillations ofthe light. The microscopic description of dye-microcavityphoton condensates requires no processes faster thanabout 100 fs [S2–S6], which is much longer than the 2 fsoscillation period of the light, justifying this assumption.
B. Analysis
When analysing data, each pair of P and Q images isaligned and binned if needed. Images are aligned by min-imising the average-sum-square of differences betweenP and Q image values with respect to the shift of co-ordinates, taking only pixels which are present in bothimages after shifting. Knowing this optimised shift, wecan be sure that a given pixel in P corresponds to thesame pixel in Q.
The intensities are IP (x, y, δx, τ, τf ) andIQ(x, y, δx, τ, τf ) for in-phase and quadrature re-spectively. In the analysis of data sets where the controlparameters of the condensate (e.g. pump power Pp)vary, an array of values for each control parameteris constructed, e.g IP (x, y, δx, τ, τf , Pp). The full six-dimensional data consists of as many 25 000 images,taking up to 30 GB of memory. Often 4-by-4 pixel blocksare combined to reduce computational effort in analysis.The major challenge is to visualise this data. This dataset can be analysed and visualised in a number of ways,as shown in the main text, Fig. 1.

S2
1. Visibility estimator
Extraction of the visibility over the set of fine delaysis the most important processing we do on the data:IP and Q(x, y, δx, τ, τf , Pp) → V (x, y, δx, τ, Pp). Our es-timator for the visibility is based on a Fourier methodand is robust against amplitude noise and converts phaseand frequency noise to a reduction in visibility, unlike theMichelson visibility criterion. Amplitude noise is intrin-sic to the photon condensate [S7]. Frequency noise islargely due to cavity length fluctuations. The result is,for each Pp, a four-dimensional visibility V (x, y, δx, τ),which has been reduced over τf .
Even averaging over much longer than cavity lifetime,there are some parameters of our experiment which arenot well controlled, and so, close to threshold, there arelarge variations in photoluminescence intensity. Back-ground noise (from readout of the sensor or backgroundlight) may also affect the interferometer outputs. TheMichelson criterion of visibility (ratio of the differencesbetween and the sums of maxima and minima of sig-nal) is not robust against these kinds of noise. Phasenoise is also present. To negate the effect of intensityfluctuations, we use arc-tangent of the ratio of the twoquadratures:
Φ(x, y, δx, τ, τf ) = arctan
[IP (x, y, δx, τ, τf )
IQ(x, y, δx, τ, τf )
](S1)
In principle, it is important to subtract background signaland noise, but in practice we notice no effect of so doing.
The Michelson estimator for visibility is not robust be-cause it does not make use of all the data available, onlythe maxima and minima. Instead we use of an estimatorbased on the Fourier transform. Using the autocorre-lation of the arc-tangent data, we find the approximatefrequency of the interference pattern. We then calculatethe Fourier component of the arc-tangent signal at severalfrequencies more closely spaced than the Nyquist crite-rion, since the data typically only cover about 3 cycles.The Fourier component at angular frequency ωf is:
Φ(ωf ) =∑
j
Φ(j)eiωfτ(j)f (S2)
for a sample of arctan data and fine delay times
{Φ(j), τ(j)f }. The maximum amplitude gives the ampli-
tude of fringes. The fringe amplitude is then normalisedby half the sum of the data to give the visibility V , aswould be expected for a clear sinusoid with an offsetwhich gave Michelson visibility V .
We have tested the estimator using a model of noisein the system. We model the in-phase and quadraturesignals, IP and IQ as
IP =(A0 + A
) [cos(ωτf + φ
)]+ RP + C (S3)
IQ =(A0 + A
) [sin(ωτf + φ
)]+ RQ + C (S4)
Variables with tildes are random variables. Phase noiseφ and readout noises for each channel, RP and RQ aredrawn from Gaussian distributions. We define an un-derlying amplitude A0 and visibility V0, which controlthe offset C = A0V0/ (1− V0). The angular frequency inpiezo-controlled delay time units is ω. The total ampli-tude is the sum of the underlying amplitude and ampli-tude noise, A. Amplitude noise in photon condensates isknown to vary from normal to skewed with a long tail forlarge values, so we draw A from a scaled Poisson distri-bution.
We tested four types of estimators against this noisemodel: the Michelson criterion, a root-mean-square test,sinusoid-fitting and the Fourier-based method describedabove. The Michelson criterion is not robust againstnoise, and the root-mean-square method requires scan-ning over an exact integer number of fringe periods.Least-squares fitting a sine wave gave fits were not ro-bust, often picking local not global optima. Finally, theFourier-based method was found to be robust (especiallyagainst amplitude noise when using the arc-tangent data)and low-noise, although we find that it is slightly biased.For extreme values of underlying visibility (near zero orunity), the estimator is biased towards 0.5. The extentof the bias depends on the amplitude of the noises. Forexperimentally realistic parameters, from an underlyingvisibility of 1.0 our estimator gives about 0.8. If the de-tector is weakly saturated, then the maximum inferredvisibility may be further reduced. We do not correct forthis in our presented data, as we are not fully certainthat our noise model is complete, nor do we know theexact parameters that match our experiment. Also, theuncertainties in the inferred visibilities are about as largeas the correction required to compensate for the bias.
S2. UNCERTAINTIES
The data presented in the main body of the manuscriptare presented without error bars. There are two majorsources of uncertainty in our experiments: fluctuations ofthreshold, and of visibility. The fluctuations are slightlyfaster than the typical time to acquire a data set, 1–5hours.
A. Variability near threshold
In Fig. S1, we vary the pump power and measure theoutput light intensity averaged over a small region at thecenter of the image. The pump spot was smaller than usein the main text, to allow us to reach pump powers farabove threshold here. Camera exposure and gain are setautomatically for each power to avoid saturation. Pulserepetition rate was held constant at 500 Hz for this spe-cific data set. Exposure is at least 2 ms, i.e. at least one500 ns quasi-CW pump pulse is always detected. Belowthreshold, the signal to noise is less than unity. Above

S3
threshold, the intensity grows linearly with pump power.A bi-linear fit reveals that the pump power at thresholdis 260 mW. The measured threshold varies from one ex-perimental run to another. However, many points belowthreshold show a condensate. In the range 180-250 mW,there may be a condensate or not. We do not know thecause of this variability. It is not the variation of cavitycutoff wavelength (although that does fluctuate on 10-minute time scales). It may be related to polymerisationof the dye, which we know occasionally forms clumps re-quiring cleaning of the cavity. Although the data mightappear to show hysteresis (memory effects), the pumppower was varied in a random order.
FIG. S1. Threshold behaviour. A bilinear fit shows thresholdaround 260 mW, but many points in the range 180–250 mWshow condensation. This variability in threshold limits howreliably the experiment can operate close to threshold.
In the main manuscript, where power is varied, we re-ject data which are below threshold when they are ex-pected to be above it, and vice versa. We accept onlydata that follow an approximately monotonic increase inoutput intensity as a function of pump power.
B. Visibility variability
Standard-deviation errors are of limited use nearthreshold as there is no reason to believe that visibilitymeasurements for a given set of parameters are drawnfrom a normal distribution. They are as likely to bedrawn from a bimodal distribution, corresponding tobelow- and above-threshold behaviour. We have triedto ascertain the limiting uncertainties in visibility awayfrom threshold, by measuring a large sample of visibilitiesas a function of delay above threshold: see Fig. S2.
By oversampling, we can build sub-samples and eval-uate their standard deviations. The highest sub-sample-averaged visibility measured is about 0.7, although weknow that our estimator is low-biased for such large vis-ibilities. The largest shot-to-shot uncertainty in visibil-ity is 0.15. For lower average visibility, the uncertaintyin the visibility is lower. For example, we can measurenon-zero visibility of 0.04 with a signal-to-noise of unityin a single measurement. Our noise model produces a
FIG. S2. Limiting uncertainty in the visibility, significantlyabove threshold. Left: Visibility variation with delay for over-lapped images as a specific pixel. Grey dots are individualdata points. Points with error bars are averages over 13 pointscentred on the marker, with error bar being the standard de-viation of that sample. Right: Standard deviation of visibilityas a function of mean visibility. Maximum visibility inferredis 0.7. Our estimator is low-biased for the largest visibilities,and high-biased for the smallest visibility values.
similar pattern, i.e. maximum inferred visibility 0.7 andstandard deviation > 0.1, only with unrealistically largephase noise, of amplitude at least π/4 radians. We con-clude that there is intrinsic noise in the visibility whichdoes not come from our measurement apparatus or visi-bility estimator.
S3. THERMAL EQUILIBRIUM THEORY OFBOSE GAS COHERENCE
The theory in the main text Fig. 4 is derived assuminga non-interacting Bose gas at thermal equilibrium in asymmetric, two-dimensional, harmonic trapping poten-tial in the grand canonical ensemble [S8, S9]. We havealso made use of an extension of the theory from spatialto temporal correlations [S10] which assumes that dissi-pative processes play no role. The theory is based on aseries expansion in the fugacity. Fugacity is defined asζ = exp (µ/kBT ), where µ is the chemical potential. Thekth term in the expansion corresponds to occupancy ofup to k particles in any given mode. Far below thresh-old, very few terms are needed for the series to converge.Arbitrarily large phase-space density can be obtained fornegative chemical potential, i.e. ζ < 1, so the infinite se-ries will always converge. The finite series also convergesfor large numbers of terms, albeit with a small positivechemical potential (ζ − 1 � 1) for large particle num-bers. First-order correlations, normalised or otherwise,are calculated using equations (20)–(23) in Ref. [S10].
Coherence length is defined here as the size of aGaussian function which fits the visibility as a func-tion of shift V (r0, r0 + xδx, τ = 0), and not a fit to|g(1)(r0, r0 + xδx, τ = 0)| (the normalised first-order cor-relation function), which makes comparison to exper-imental data more robust against noise, especially inlow-intensity regions of the images. Intensity scale isa Gaussian fit to the number density of photons as a

S4
function of position. Number density can be extractedeasily from the theory since number density at positionr is equal to G(1)(r, r, τ = 0) (the un-normalised correla-tion function). Coherence time is the full-width at half-maximum of g(1)(r0, r0, τ). The correlation function inspace matches well to a Gaussian, but the density doesnot. The temporal correlation function does not matchany simple function (Gaussian, Lorentzian or symmet-ric double exponential decay), not least because, withoutdamping, there are revivals of correlations functions athalf-periods of the oscillations in the harmonic trappingpotential. Real temporal coherence data is fitted withGaussians.
0.8 1.0 1.2 1.4 1.602468
1012141618
Cohe
renc
e Le
ngth
(µm
)
15306010030050010001500
0.8 1.0 1.2 1.4 1.60
1020304050607080
Clou
d si
ze (µ
m)
15306010030050010001500
0.8 1.0 1.2 1.4 1.6N photons / Critical number
0
500
1000
1500
2000
2500
3000
Cohe
renc
e tim
e (fs
) 15306010030050010001500
FIG. S3. Demonstration that the series expansion used forthe theory in the main text converges even above threshold.The numbers in the legend refer to the number of terms usedin the series. In the main text, Fig. 4, 999 terms are used.
In Fig. S3 we show how well the finite series expansionconverges, for coherence length, intensity length scale andcoherence time. Far below threshold, the series convergesas expected. Above threshold, the spatial scales convergewhen the series has a number of terms of the same orderas the condensate population. The results qualitativelyagree with exact calculations [S9].
The temporal correlation functions converge only be-low threshold. There is qualitative agreement with thedissipative model of Kirton and Keeling [S2, S11], inthat coherence time does increase slightly with increasingnumber (comparable to the pumping rate) as thresholdis approached. Since the model used takes no accountof dissipation, it cannot predict anything but that thecoherence time of a pure condensate ought to be infinite.The maximum coherence time inferred here is > 2.5 ps,limited by the range over which g(1) is evaluated, avoid-ing the non-observed revivials.
While there are no adjustable parameters in the the-ory, the theoretical photon number does not directly cor-respond to the experimental pump power. Below thresh-old, photon number and pump power are experimentallyseen and theoretically expected [S11] to be linearly pro-portional. Likewise, far above threshold, but not so justabove threshold. We can therefore trust our calculationsonly below threshold, and above threshold our calcula-tions (assuming that the photon number remains pro-portional to the pump power) are plotted as dashed linesand are only a qualitative guide to what is expected. Thecalculations presented in the main text, Fig. 4, use 999terms of the expansion.
A. Finite spatial resolution
The effect of finite imaging resolution and numericalaperture on measured interference patterns can be takeninto account, starting from the known electric field at apoint, E(r). Finite resolution is imposed by convolvingwith a point-spread function F (R):
E(r, t) =
∫d2RE(r−R, t)F (R) (S5)
The overline indicates that finite resolution has been ap-plied. The effect of finite numerical aperture is equivalentto applying the Fourier transform, applying a cutoff (mul-tiplying by a top-hat function) and then inverse trans-forming, i.e. convolution with a cardinal sine, sin(x)/x.This function can then simply be absorbed in the defini-tion of the point-spread function, F .
The light at one output port of the interferometeris EP (r, r′, τ) = 1√
2
[E(r, t) + E(r′, t′)
], where as usual
τ = t− t′. The effects of finite resolution are applied be-fore the interference. The other output, Q, takes a minusinstead of a plus. Then the intensity is:
2IP (r, r′, τ) = 〈[E†(r, t) + E
†(r′, t′)
] [E(r, t) + E(r′, t′)
]〉
= 〈E†(r, t)E(r, t)〉+ 〈E†(r′, t′)E(r′, t′)〉+ 2Re
[〈E†(r, t)E(r′, t′)〉
](S6)
The first two terms are the intensities as seen with finiteresolution. The last term written more explicitly is:
〈E†(r, t)E(r′, t′)〉 = G(1)(r, r′, τ)
=
⟨∫d2RE†(r−R, t)F ∗(R)
∫d2R′E(r′ −R′, t′)F (R′)
⟩
=
∫∫d2Rd2R′F ∗(R)F (R′)
⟨E†(r−R, t)E(r′ −R′, t′)
⟩
=
∫∫d2Rd2R′ F ∗(R)F (R′)G(1)(r−R, r′ −R′, t− t′)
(S7)
It is possible to calculate the equilibrium first-ordercorrelation function G(1)(r, r′, τ) for a non-condensed

S5
Bose gas in a harmonic trap if we make the strong ap-proximations that there are no dissipative processes andthat thermal equilibrium is respected [S10]. Using thesymbols defined in Ref. [S10]: s is a co-ordinate x or
y, K(k)s (s, s′, t, t′) is the propagator, ζ the fugacity and
β = 1/kBT the inverse temperature we obtain:
G(1)(r, r′, τ) = (S8)∞∑
k=1
ζk∏
s=x,y
∫∫dS dS′ F ∗s (S)Fs(S
′)×
K(k)s (s− S, s′ − S′, t, [t′ − ik~β])
where we have also assumed that point-spread functionis separable: F (R) = Fx(X)Fy(Y ). This expression canbe evaluated numerically, either by direct integration orvia Fourier transforms. The finite-resolution correlationfunction is normalised:
g(1)(r, r′, τ) =G(1)(r, r′, τ)√
G(1)(r, r, 0)G(1)(r′, r′, 0)
(S9)
0.0 0.5 1.0 1.5 2.0 2.5 3.0 3.5 4.0 4.5δx (µm)
0.00.20.40.60.81.0
Visi
bilit
y pointfinite resolution
0.0 0.1 0.2 0.3 0.4 0.5 0.6τ (ps)
0.00.20.40.60.81.01.2
Visi
bilit
y pointfinite resolution
FIG. S4. Calculated effect of finite imaging resolu-tion on g(1) for the non-condensed photons, equivalent toP ' 5× 10⁻³Pth, using a 3 µm imaging resolution. The seriesexpansion used 5 terms, which was sufficient for convergenceso far below threshold.
The results are shown in Fig. S4 for a thermal cloudwith pump power far below threshold (P ' 5×10⁻³Pth).The point correlation functions show shorter range coher-ence than those integrated over a finite resolution (a ro-tationally symmetric, 3 µm Gaussian point-spread func-tion), and are consistent with the results seen at lowpump powers in the main text, Figs. 2, 4 and 5.
S4. NON-EQUILIBRIUM THEORY OF PHOTONTHERMALISATION AND CONDENSATION
Since the thermal-equilibrium theory clearly breaksdown in the multimode regime, we have implemented
the non-equilibrium model of Kirton and Keeling [S2,S11, S12]. To explain the multimode behaviour we areobliged to treat the spatial dependence of pumping. InRef. [S12] it is suggested that the multimode behaviourmight occur with inhomogeneous pumping, because ofimperfect clamping of the excited-state fraction of dyemolecules. To study the threshold for various modes,we evaluate Ref. [S12] equations (8) and (9). A crucialquantity in those equations is the absolute value of light-matter coupling, denoted by Γ.
The light-molecule coupling strength can be approxi-mately derived from measured quantities, noting that thetypical timescale for population variations is:
τtyp = NΓ0D(λ) = ρ1DΓ1D(λ) = ρ2DΓ2D(λ) (S10)
where N is the number of molecules, ΓdD and ρdDare the light-matter coupling and molecular den-sity in d dimensions and λ the wavelength of lightin vacuum. In three dimensions, the mean timebetween scattering events for photons moving atspeed c∗ from molecules at volume density ρ3D isτtyp = 1/ ρ3D c
∗σ(λ). Here σ(λ) is the scattering cross-section at wavelength λ. Equating the timescales wefind Γmax3D = σ(534 nm)c∗ = 5.1× 10⁻¹² m3/s. The vari-ation of light-matter coupling with wavelength is knownby interpolating experimental measurements enforcing aKennard-Stepanov relations [S12]. In lower dimensions,the density is scaled typically by the cavity physicallength and/or the harmonic oscillator length.
A. Multimode behaviour
The principal results are shown in the main text,Fig. 5, for the following parameters (symbols as used inRef. [S12]) in one dimension:• Pump spot size (left panel of main text Fig. 5): 2.2 lHO,
which is slightly smaller than the experiment (approx10 lHO), which compensates for the fact that we cannotefficiently perform the computations in two dimensions.
• Mode spacing: ~× 3× 10¹⁴ rad s−1 equal to that usedin the experiment.
• Number of modes: 15, sufficient to make the main re-sults converge.
• Cavity cutoff (lowest mode detuning from resonance):3× 10¹⁴ rad s−1 which is equivalent to 596 nm.
• Cavity decay rate: κ = 109 s−1
• Molecular density: ρ1D = 5.1 × 10¹² molecules/lHOwhich is equivalent to 1.7 mM solution concentration(similar to the experiments) if the extra dimension forconversion from 2D to 1D is taken to be the harmonicoscillator length, 6 µm. The length for conversion from3D to 2D is the physical space between the mirrors,(q − q0)λ∗/2 with q = 8 being the longitudinal modenumber and q0 ' 4 expresses how far the electric fieldpenetrates the surface of the dielectric mirrors.
S6
• Spontaneous emission lifetime: Γ↓ = 0.25 × 10⁹ s−1
which is the known value for Rhodamine 6G in ethyleneglycol.
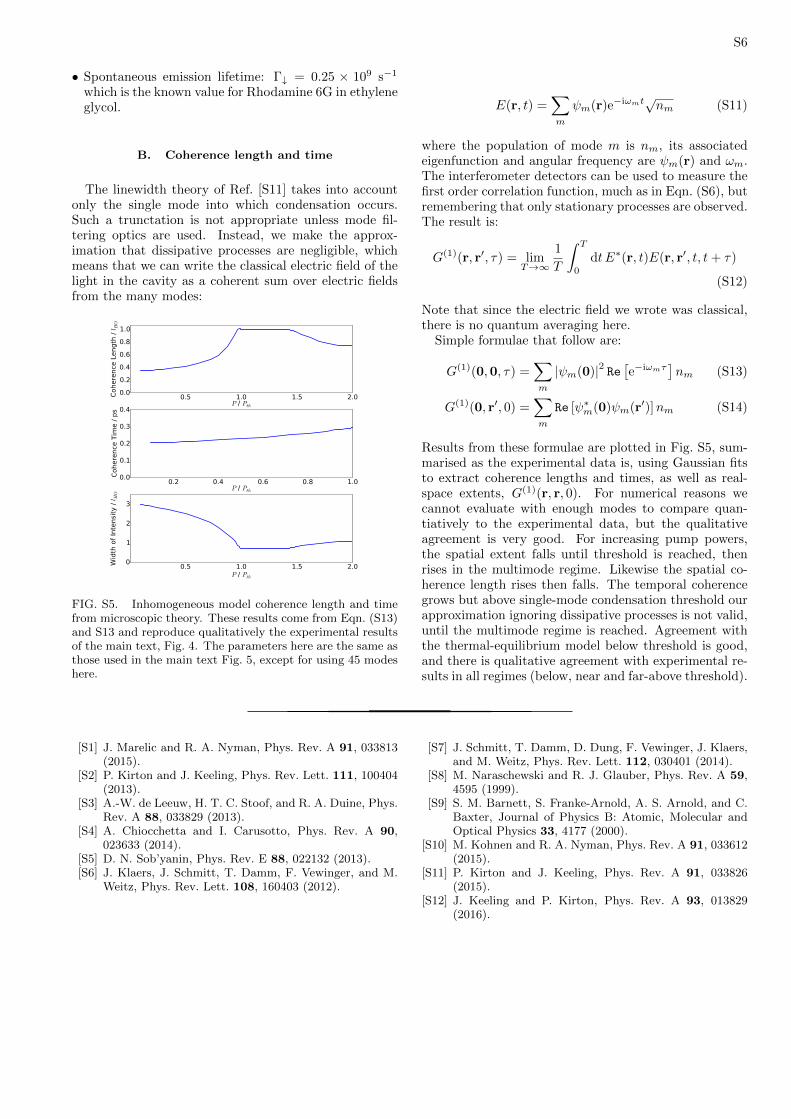
B. Coherence length and time
The linewidth theory of Ref. [S11] takes into accountonly the single mode into which condensation occurs.Such a trunctation is not appropriate unless mode fil-tering optics are used. Instead, we make the approx-imation that dissipative processes are negligible, whichmeans that we can write the classical electric field of thelight in the cavity as a coherent sum over electric fieldsfrom the many modes:
0.5 1.0 1.5 2.0P / Pth
0.0
0.2
0.4
0.6
0.8
1.0
Cohere
nce
Length
/ lHO
0.2 0.4 0.6 0.8 1.0P / Pth
0.0
0.1
0.2
0.3
0.4
Cohere
nce
Tim
e /
ps
0.5 1.0 1.5 2.0P / Pth
0
1
2
3
Wid
th o
f In
tensi
ty /
lHO
FIG. S5. Inhomogeneous model coherence length and timefrom microscopic theory. These results come from Eqn. (S13)and S13 and reproduce qualitatively the experimental resultsof the main text, Fig. 4. The parameters here are the same asthose used in the main text Fig. 5, except for using 45 modeshere.
E(r, t) =∑
m
ψm(r)e−iωmt√nm (S11)
where the population of mode m is nm, its associatedeigenfunction and angular frequency are ψm(r) and ωm.The interferometer detectors can be used to measure thefirst order correlation function, much as in Eqn. (S6), butremembering that only stationary processes are observed.The result is:
G(1)(r, r′, τ) = limT→∞
1
T
∫ T
0
dt E∗(r, t)E(r, r′, t, t+ τ)
(S12)
Note that since the electric field we wrote was classical,there is no quantum averaging here.
Simple formulae that follow are:
G(1)(0,0, τ) =∑
m
|ψm(0)|2 Re[e−iωmτ
]nm (S13)
G(1)(0, r′, 0) =∑
m
Re [ψ∗m(0)ψm(r′)]nm (S14)
Results from these formulae are plotted in Fig. S5, sum-marised as the experimental data is, using Gaussian fitsto extract coherence lengths and times, as well as real-space extents, G(1)(r, r, 0). For numerical reasons wecannot evaluate with enough modes to compare quan-tiatively to the experimental data, but the qualitativeagreement is very good. For increasing pump powers,the spatial extent falls until threshold is reached, thenrises in the multimode regime. Likewise the spatial co-herence length rises then falls. The temporal coherencegrows but above single-mode condensation threshold ourapproximation ignoring dissipative processes is not valid,until the multimode regime is reached. Agreement withthe thermal-equilibrium model below threshold is good,and there is qualitative agreement with experimental re-sults in all regimes (below, near and far-above threshold).
[S1] J. Marelic and R. A. Nyman, Phys. Rev. A 91, 033813(2015).
[S2] P. Kirton and J. Keeling, Phys. Rev. Lett. 111, 100404(2013).
[S3] A.-W. de Leeuw, H. T. C. Stoof, and R. A. Duine, Phys.Rev. A 88, 033829 (2013).
[S4] A. Chiocchetta and I. Carusotto, Phys. Rev. A 90,023633 (2014).
[S5] D. N. Sob’yanin, Phys. Rev. E 88, 022132 (2013).[S6] J. Klaers, J. Schmitt, T. Damm, F. Vewinger, and M.
Weitz, Phys. Rev. Lett. 108, 160403 (2012).
[S7] J. Schmitt, T. Damm, D. Dung, F. Vewinger, J. Klaers,and M. Weitz, Phys. Rev. Lett. 112, 030401 (2014).
[S8] M. Naraschewski and R. J. Glauber, Phys. Rev. A 59,4595 (1999).
[S9] S. M. Barnett, S. Franke-Arnold, A. S. Arnold, and C.Baxter, Journal of Physics B: Atomic, Molecular andOptical Physics 33, 4177 (2000).
[S10] M. Kohnen and R. A. Nyman, Phys. Rev. A 91, 033612(2015).
[S11] P. Kirton and J. Keeling, Phys. Rev. A 91, 033826(2015).
[S12] J. Keeling and P. Kirton, Phys. Rev. A 93, 013829(2016).