page 1 of 36 2 sha pe-select ive diff us ion of olefins in ... · fluence the diff usion pat hs of...
TRANSCRIPT
1
Shape-selective Diffusion of Olefins in 8-Ring Solid Acid
Microporous Zeolites
An Ghyselsabc, Samuel L.C. Moorsab, Karen Hemelsoeta, Kristof De Wispelaerea,
Michel Waroquiera, German Sastrecd, and Veronique Van Speybroeckac (Dated:
September 1, 2015)
Abstract
The diffusion of olefins through 8-ring solid acid microporous zeolites is investigated using molec-
ular dynamics simulations techniques and using a newly developed flexible force field. Within the
context of the Methanol to Olefin (MTO) process and the observed product distribution, knowl-
edge on the diffusion paths is essential to obtain molecular level control over the process conditions.
Eight-ring zeotype materials are favorably used for the MTO process as they give a selective product
distribution towards low carbon olefins. To investigate how composition, acidity and flexibility in-
fluence the diffusion paths of ethene and propene, a series of isostructural aluminosilicates (zeolites)
and silicoaluminophosphates (AlPOs and SAPOs) are investigated with and without randomly dis-
tributed acidic sites. Distinct variations in diffusion of ethene are observed in terms of temperature,
composition, acidity, and topology (AEI, CHA, AFX). In general, diffusion of ethene is an activated
process for which free energy barriers for individual rings may be determined. We observe ring
dependent diffusion behavior which can not solely be described in terms of the composition and
topology of the rings. A new descriptor had to be introduced namely the accessible window area
(AWA), inspired by implicit solvation models of proteins and small molecules. The AWA may be
determined throughout the molecular dynamics trajectories and correlates well with the number of
ring crossings at the molecular level and the free energy barriers for ring crossings from one cage to
the other. The overall observed diffusivity is determined by molecular characteristics of individual
rings for which AWA is a proper descriptor. Temperature-induced changes in framework dynamics
and diffusivity may be captured by following the new descriptor throughout the simulations.
a Center for Molecular Modeling, Ghent University, Technologiepark 903, 9052 Zwijnaarde, Belgium b These two authors contributed equally. c [email protected], [email protected], [email protected] d Instituto de Tecnologia Quimica UPV-CSIC, Universidad Politecnica de Valencia, Av. Los Naranjos s/n,
46022, Valencia, Spain
Page 1 of 36
ACS Paragon Plus Environment
The Journal of Physical Chemistry
123456789101112131415161718192021222324252627282930313233343536373839404142434445464748495051525354555657585960
2
I. INTRODUCTION
Zeolites are among the most widely investigated and topical of inorganic materials, finding
extensive use in a wide variety of applications, such as catalysis, separations, ion exchangers,
and adsorbents.1 These materials have a three-dimensional periodic framework that consists
of nanometersized channels and cages providing high porosity and large surface area. At
present 218 distinct framework types are described,2 of which only a small fraction is widely
used as industrial material.3 The exploitation of these materials as catalysts has gained
a new and green boost with the introduction of methanol and ethanol as base chemicals,
produced from alternative feedstocks, which have the additional advantage of being cheaper
and potentially renewable.4–8 In this area, the methanol-to-olefins (MTO) process is one of
the most important alternatives to the oil-based routes.9–11 It is now already commercialized
at large scale in various places worldwide.10 H-ZSM-5 and SAPO-34 are the archetypal
industrially applied catalysts for methanol conversion. H-ZSM-5 has the MFI topology and is
an aluminosilicate whereas SAPO-34 has the CHA topology and is a siliocoaluminophosphate
material. Both materials give a substantially different product distribution. SAPO-34 is very
selective towards ethene and propene, due to its particular topology exhibiting 8-rings, which
hinder the diffusion of larger species through the windows.12–14 In the search for optimal
catalysts for the MTO process, other potential candidates have been explored, which have a
tunable ethene/propene ratio and low deactivation rates.10 The overall reaction mechanism
is nowadays accepted to be based on a hydrocarbon pool (HP), which co-catalyzes the
reactions.15–17
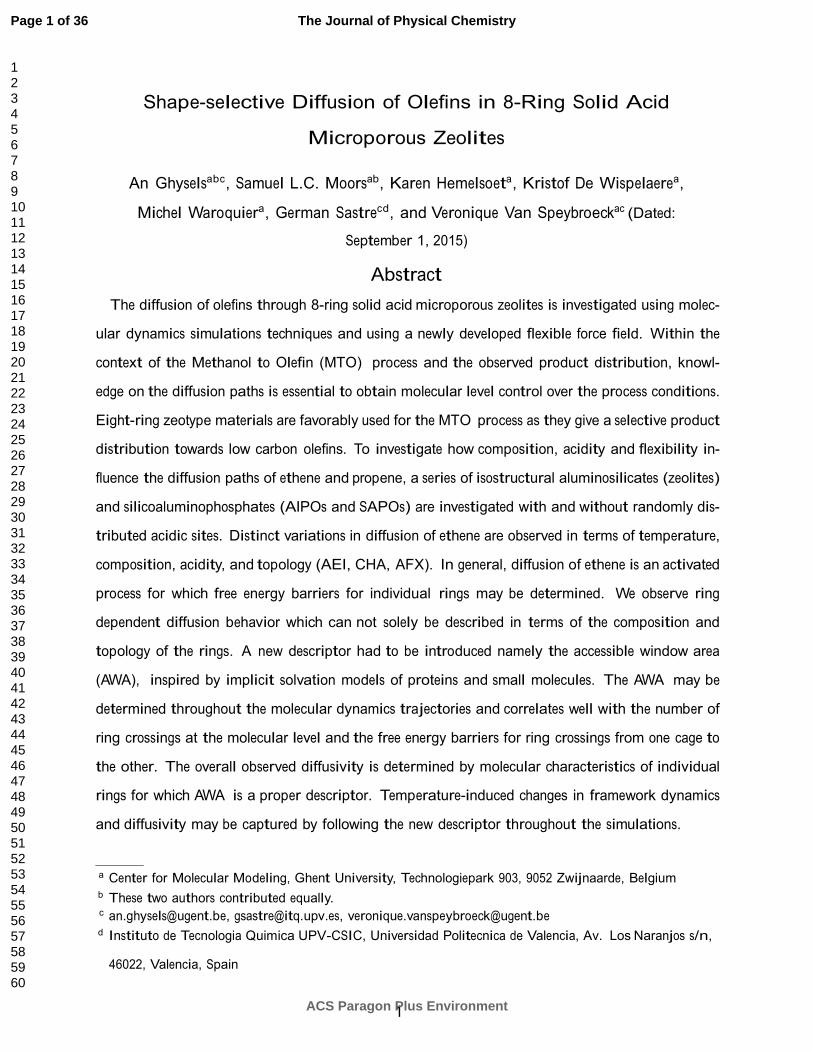
In this paper we have selected three classes of small ring zeotype materials, bearing the
AEI, CHA and AFX topology with 8-ring channels at largest, as displayed in Fig. 1. Those
topologies have received already some interest within the context of the MTO process and
may host bulky aromatic intermediates, which are essential for the conversion of methanol to
hydrocarbons.11 Indeed it is now well accepted that a hydrocarbon pool mechanism operates
in which an organic center is trapped in the zeolite pores and acts as co-catalyst.12,15–19 A
wealth of theoretical studies have appeared to explore potential reaction mechanisms in
various catalysts and to understand the material characteristics at the molecular level which
control the activity and product selectivity.11,20 Various experimental studies have pointed
towards the importance of diffusion of product species through the channel systems for
Page 2 of 36
ACS Paragon Plus Environment
The Journal of Physical Chemistry
123456789101112131415161718192021222324252627282930313233343536373839404142434445464748495051525354555657585960
3
-
-
the understanding of the product distribution. 14 21 24 The challenging study of molecular
, -
transport under confinement has recently regained a lot of attention.25 It is in this field that
theoretical modeling can also be of particular use, since the overall diffusion is influenced
by many different factors, such as nanoporous topology, loading, temperature, and chemical
composition. Due to this complexity, experimental observations are hard to interpret since
the aforementioned effects are closely entangled. Theoretical simulations allow assessing all
effects individually, and hence offer valuable opportunities for gaining insight into diffusion
phenomena. 26
Recently inspired by the renewed interest of diffusion in the MTO chemistry, vanous
molecular dynamics (MD) studies appeared in which the diffusion of small molecules such
as propane and propene was investigated in zeolites with MTO importance such as CHA,
MFI, BEA and FAU and small pore zeolites with AFX and AEI topology.27 29 In the study
of Sastre it was shown that diffusion of propane in isostructural 8-ring zeolites is an activated
process. 29
AEI CHA AFX
FIG. 1: (Top) Structures of SAP0-18 (AEI), SAP0-34 (CHA), and SAP0-56 (AFX),
loaded with ethene molecules. (Bottom left) Van der Waals representations of ethene and
propene in front and side orientations. (Bottom middle) An elliptically shaped 8-ring with
indicated dmin distance. The ring is too small for ethene to cross through. (Bottom right)
An 8-ring with more circular shape that is large enough for ethene to cross through. Atom
colors: C (blue), H (white), 0 (red), Al (pink), Si (yellow), P (taupe).
Theoretical studies of diffusion are usually tackled using simulations based on classical
force fields.30 32 Force field based approaches in combination with MD simulations are now
well established.26 Using MD, a large portion of the potential energy surface can be sampled.
Page 3 of 36
ACS Paragon Plus Environment
The Journal of Physical Chemistry
123456789101112131415161718192021222324252627282930313233343536373839404142434445464748495051525354555657585960
4
Temperature as well as the flexibility of the target molecules and frameworks can be included
explicitly. The basic idea of MD is to trace the trajectory of a guest molecule over time.
In the long time limit, the slope of the mean square displacement becomes (a multiple of )
the diffusion coefficient. This explicit derivation of diffusivities has been extensively studied
in literature, e.g. by Awati et al.33, Krishna et al.34, Smit and Maessen et al.26, Garcia
and Dubbeldam et al.35, O’Malley et al.32, Kiel et al.36–39 in various materials, for various
hydrocarbons. For processes where diffusion barriers are too high, MD runs may be too
slow to efficiently generate particle trajectories over the time-scale of the diffusion process.40
In such cases other techniques have been suggested to study diffusion, including transition-
state sampling, transition path sampling,41 or kinetic Monte Carlo. The interested reader
is further referred to the recent work of Abouelnasr and Smit.42 In the present paper, we
study the diffusion of both ethene and propene in small ring zeolites using MD techniques.
Most of the quantitative analysis will be performed on ethene, as for this molecule diffusion
is fast enough to obtain meaningful data using conventional MD simulations. In contrast,
for propene advanced sampling techniques would be necessary as mentioned above.
The emphasis of the current study particularly lies on the influence of the material’s
flexibility on the molecular diffusion paths. Indeed, for the studied cases the pore size
of the zeolite has the same order of magnitude as the kinetic diameter of the molecules.
The influence of framework flexibility on the diffusion properties has long been a matter of
debate.26 Traditionally, theoretical zeolite diffusion studies have used a rigid zeolite frame-
work to reduce the computational cost or to increase the simulation time needed to obtain
sufficient diffusion data. This rigid framework approach does not account for possible guest-
induced window deformations. Moreover, unphysical host-guest interactions encountered
with rigid frameworks may lead to unrealistic dynamics and aggregate formation of the
guest molecules.26,43 Recently, a number of MD simulation studies have been published that
compare the diffusion in rigid and flexible zeolite frameworks. While in some cases the in-
fluence of lattice vibrations was very small, in other studies the introduction of flexiblity
led to significantly altered diffusivities.33,35,44 Several researchers have cautioned on the ac-
curacy of the flexible model, showing that the diffusion coefficient is highly sensitive to the
force field.35,45 In comparing the rigid and flexible framework approaches, the influence of
the force field can be partly factored out by using a time-averaged zeolite structure in the
simulations. Krishna et al. used this approach to study methane diffusion in several 8-ring
Page 4 of 36
ACS Paragon Plus Environment
The Journal of Physical Chemistry
123456789101112131415161718192021222324252627282930313233343536373839404142434445464748495051525354555657585960
5
zeolites.34,46 They found very similar diffusion coefficients for the simulations with a rigid
and flexible zeolite, summarized the link between ring diameter and diffusion coefficient, and
confirmed an exponential trend. Awati et al.33 investigated the ring diameter distribution in
great detail, more specifically ring anharmonicity and ring shape (circular versus elliptical,
framed ‘dimensionality’ in Ref.33), and identified when diffusion through a flexible frame-
work may be equally well modeled by diffusion through a rigid time-averaged framework. In
an effort to maintain the efficiency of the rigid framework approximation while still including
some degree of flexibility, they proposed to perform MD on a set of rigid snapshots, which
were extracted from simulations of an empty framework. They also studied the diffusion of
methane in several 8-ring zeolites, and good agreement with a fully flexible structure was
obtained.33
For molecules that are smaller than the zeolite windows, framework deformation may
cause flattening of the windows from a circular to a more elliptical shape (Fig. 1), thus
resulting in decreased diffusion. In the studies of Krishna et al. and Awati et al. described
in the previous paragraph, the kinetic diameter of methane is much smaller than the 8-ring
dimensions. In such cases an averaged zeolite structure may indeed sufficiently capture ring
deformations to represent a fully flexible lattice.
For tight-fitting molecules however, the flexibility of the framework can be expected to
facilitate window crossings by temporary widening of the windows. The inverse could also
occur, when framework flexibility reduces adsorbate mobility if the widening slows down the
dynamics. In this work, the kinetic dimensions of ethene and propene are comparable to or
even larger than the 8-ring dimensions (see Fig. 1), which suggests that dynamic expansion
of the rings could affect the diffusion process. We have thus opted to model framework
flexibility explicitly with a flexible forcefield.
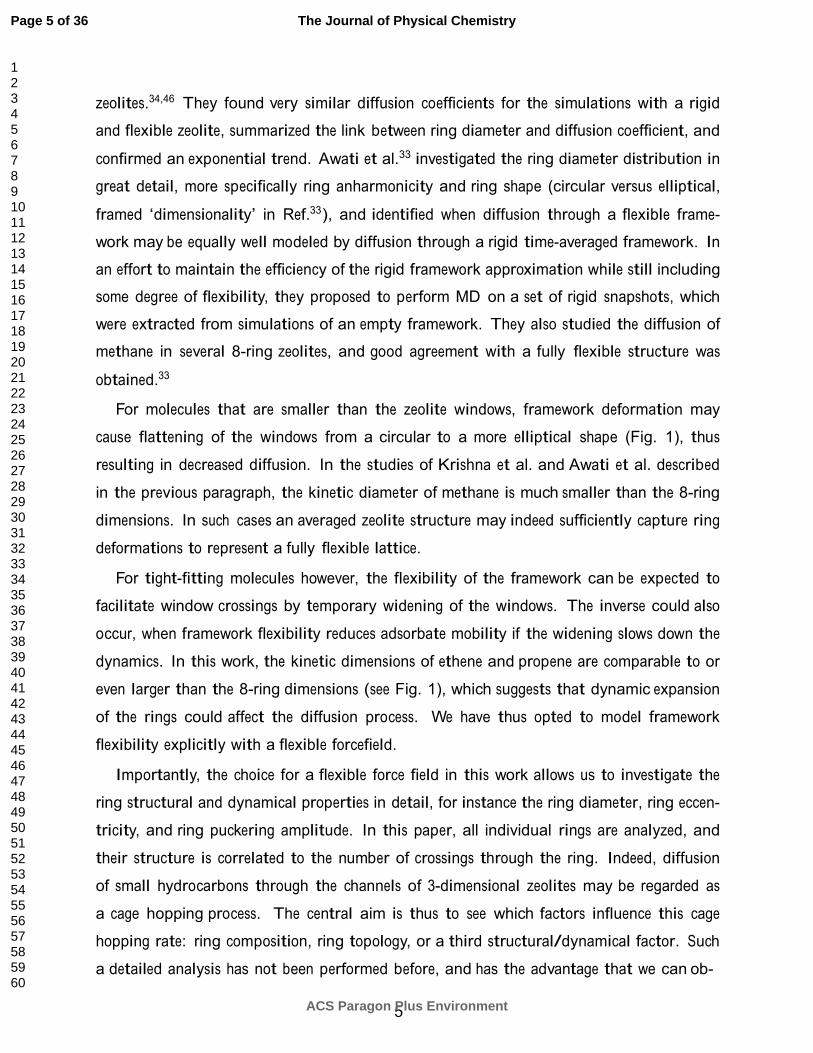
Importantly, the choice for a flexible force field in this work allows us to investigate the
ring structural and dynamical properties in detail, for instance the ring diameter, ring eccen-
tricity, and ring puckering amplitude. In this paper, all individual rings are analyzed, and
their structure is correlated to the number of crossings through the ring. Indeed, diffusion
of small hydrocarbons through the channels of 3-dimensional zeolites may be regarded as
a cage hopping process. The central aim is thus to see which factors influence this cage
hopping rate: ring composition, ring topology, or a third structural/dynamical factor. Such
a detailed analysis has not been performed before, and has the advantage that we can ob-
Page 5 of 36
ACS Paragon Plus Environment
The Journal of Physical Chemistry
123456789101112131415161718192021222324252627282930313233343536373839404142434445464748495051525354555657585960
6
serve statistically significant differences between individual rings. In total 54 systems have
been simulated using MD techniques. The influence of framework topology, composition and
acidity has been accounted for and the flexible forcefield introduced earlier by one of the
authors has been adapted to account for all of these factors. The number of ring crossings
have been studied at the level of individual rings and in terms of typical characteristics of
the ring. A new molecular descriptor is introduced which correlates the accessible window
area of the guest species with the number of ring crossings.
Page 6 of 36
ACS Paragon Plus Environment
The Journal of Physical Chemistry
123456789101112131415161718192021222324252627282930313233343536373839404142434445464748495051525354555657585960
7
II. METHODOLOGY
A. Zeolite frameworks
Diffusion of ethene and propene is investigated in three topologies using atomistic molec-
ular dynamics. The selected topologies are AEI, CHA, and AFX. These topologies have
8-rings as their largest windows. Two compositions are considered as a starting point: (1)
pure SiO2 and (2) pure AlPO4 structures. These pure materials (without acid sites) are listed
in Table I: (1) SSZ-39, SSZ-13, and SSZ-16, and (2) AlPO-18, AlPO-34, and AlPO-56. Acid
sites are introduced in these structures: (1) some Si are substituted by Al in the pure silica
materials (alumino-silicate or zeo materials), and (2) some Al are substituted by Si in the
AlPO4 structures (silico-alumino-phosphate or SAPO materials). Additionally, Si-islands
are introduced in SAPO materials by substitution of Al-O-P fragments by Si-O-Si. The
acid sites and Si-islands are introduced randomly with the program zeoTsites47,48 respecting
the overall Si/Al/P ratio as described in detail below. The resulting acidic materials (with
acid sites) are listed in Table I: (1) H-SSZ-39, H-SSZ-13, and H-SSZ-16 (zeo); (2) SAPO-18,
SAPO-34, and SAPO-56 (SAPO).
In the AEI topology, the corresponding zeo and SAPO materials are H-SSZ-39 and SAPO-
18. For H-SSZ-39 a Si/Al ratio of 5.0 (64 Al, 320 Si and 64 protons in the simulated unit
cell) is selected, close to that reported for zeolites employed in the MTO and methanol-to-
hydrocarbons (MTH) processes.10 For SAPO-18, a content around 9.5% Si (with respect
to Si+Al+P) is chosen as the experimental benchmark,49 with 50% of the Si substituted
through mechanism I (P → Si, H), and in our case this means 4 Si-islands made of 8 Si
atoms each, in a total of 32 Si, 184 Al, 168 P and 16 protons in the simulated unit cell.
Our model of CHA as SAPO material (SAPO-34) is taken from Dai et al.,23 who reported
a composition of 1.1 mmol/g, 6.0 mmol/g, and 4.1 mmol/g for Si, Al and P respectively in
the final solid. This is similar to work in the group of Olsbye14 where an (Al+P)/Si ratio of
11 was reported as optimum for MTO, showing that lower ratios contribute more actively
to catalyst deactivation. This ratio corresponds to approximately one acid site (proton) per
cage. Katada et al.50 reported a ratio of 10, also along the same values above. For these
samples it has been shown that most of the acid sites are isolated and hence no Si-islands
are formed. Regarding the alumino-silicate version (H-SSZ-13), the same argument of the
Page 7 of 36
ACS Paragon Plus Environment
The Journal of Physical Chemistry
123456789101112131415161718192021222324252627282930313233343536373839404142434445464748495051525354555657585960
8
deactivation is also invoked, with about one proton per cage as the optimum content, and
this gives a Si/Al ratio of about 11.14 With all this information, our unit cells contain 36
T-sites with the distribution 33 Si, 3 Al for H-SSZ-13 and 18 Al, 15 P, 3 Si for the SAPO-34.
For the AFX systems in zeo (H-SSZ-16) and SAPO (SAPO-56) materials, the following
chemical compositions are selected. For H-SSZ-16 a Si/Al ratio of 6 has been reported50 for
MTO and MTH processes. The Al distribution in the simulated unit cell (56 Al, 328 Si and
56 protons) is created with the requirements of Loewenstein and Dempsey rules commonly
applied in zeolites, and these conditions are also imposed to the AEI and CHA systems. For
SAPO-56, a content of tetrahedral atoms close to 11.5% Si, 55% Al, 33.5% P, reported by
Wilson et al.,51 is selected, also taking into account that 64% of the Si is isolated and 36%
of the Si is forming small silicon islands. The simulated SAPO-56 unit cells (188 Al, 48 Si,
148 P and 40 protons) contain 3 Si-islands made of 5 Si atoms each and 33 isolated Si.
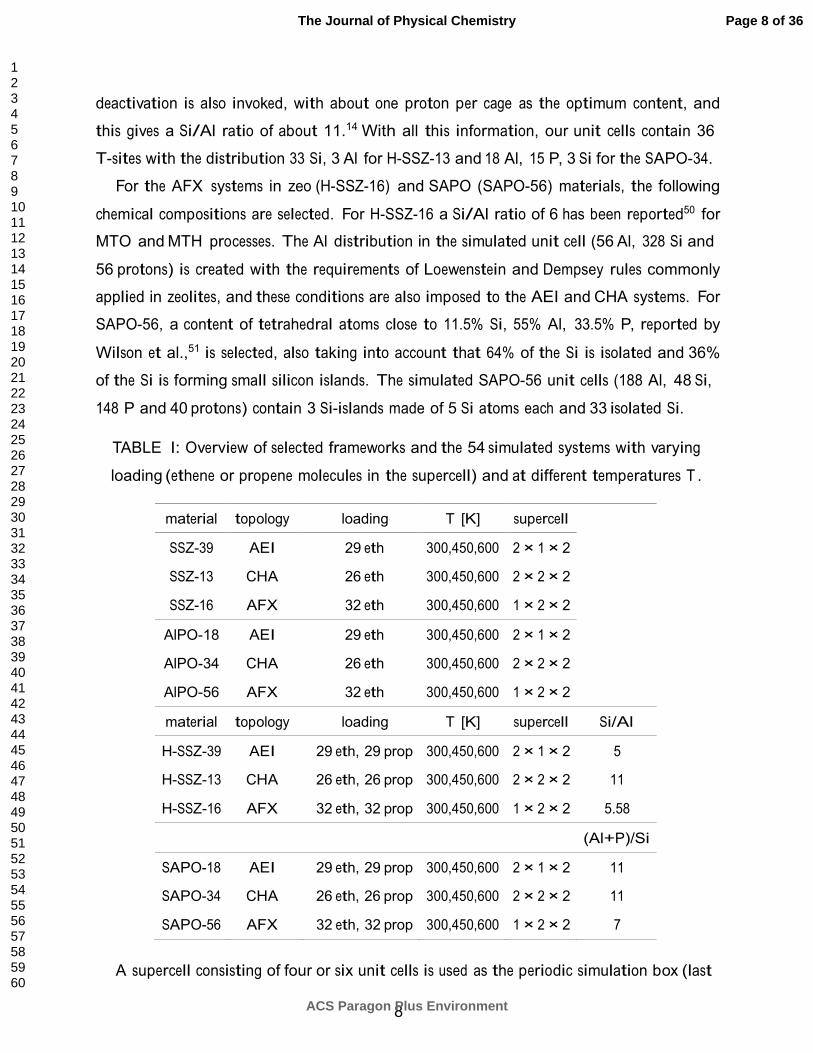
TABLE I: Overview of selected frameworks and the 54 simulated systems with varying
loading (ethene or propene molecules in the supercell) and at different temperatures T .
material topology loading T [K] supercell
SSZ-39 AEI 29 eth 300,450,600 2 × 1 × 2
SSZ-13 CHA 26 eth 300,450,600 2 × 2 × 2
SSZ-16 AFX 32 eth 300,450,600 1 × 2 × 2
AlPO-18 AEI 29 eth 300,450,600 2 × 1 × 2
AlPO-34 CHA 26 eth 300,450,600 2 × 2 × 2
AlPO-56 AFX 32 eth 300,450,600 1 × 2 × 2
material topology loading T [K] supercell Si/Al
H-SSZ-39 AEI 29 eth, 29 prop 300,450,600 2 × 1 × 2 5
H-SSZ-13 CHA 26 eth, 26 prop 300,450,600 2 × 2 × 2 11
H-SSZ-16 AFX 32 eth, 32 prop 300,450,600 1 × 2 × 2 5.58
(Al+P)/Si
SAPO-18 AEI 29 eth, 29 prop 300,450,600 2 × 1 × 2 11
SAPO-34 CHA 26 eth, 26 prop 300,450,600 2 × 2 × 2 11
SAPO-56 AFX 32 eth, 32 prop 300,450,600 1 × 2 × 2 7
A supercell consisting of four or six unit cells is used as the periodic simulation box (last
Page 8 of 36
ACS Paragon Plus Environment
The Journal of Physical Chemistry
123456789101112131415161718192021222324252627282930313233343536373839404142434445464748495051525354555657585960
9
column of Table I) with volumes of roughly 25000, 19000, and 25000 A3 for AEI, CHA, and
AFX respectively. Details about the Si substitution in SAPOs can be found in our previous
work,52–54 and sample CIF files of the unit cells employed in the calculations are given as
Supp. Inf.
B. Adsorbates
We focus on the diffusion of ethene and propene, which are the main products of the
methanol conversion. The onset of methanol conversion is expected not to be limited by
diffusion, but at later stages of the methanol conversion, the diffusion of the products may
strongly affect the reaction kinetics and shape selectivity of the MTO reaction.23 The load-
ings (see Table I and Fig. 1) are chosen to be about one to two adsorbates per cage. Initial
tests with lower loadings of just below one molecule per cage give similar results for the dif-
fusion coefficient as the higher loading simulations (within statistical errors of these shorter
trajectories of 20 ns). The simulations are therefore performed at high loadings, where more
statistics are available because of averaging over the molecules.
C. Force field
Most of the earlier MD work on zeolites has been performed using force fields for pure
silica zeolites given the large number and high quality of the force fields available.45,55,56
Also, the introduction of Al and protons as well as the specific bridging Si-O-Al oxygens,
differing from Si-O-Si oxygens, suggest that shell models might perform better. However,
MD have traditionally preferred rigid ion force fields which behave much better in the usual
MD algorithms in terms of energy conservation and computer time.26,57 In this study, we
present a new force field that can handle zeolites as well as alumino-silicates and silico-
alumino-phosphates in any (Si,Al,P) compositional range, with protons as charge compen-
sating cation, hence specifically designed for Brønsted acid zeotypes. To make the force
field compatible with zeolites, AlPOs and SAPOs, accuracy is somewhat sacrificed in favor
of generality. Here, we summarize the main traits of this new force field. A more detailed
description of the force field development and a list of new parameters are given in Supp.
Inf. (Table S3).
Page 9 of 36
ACS Paragon Plus Environment
The Journal of Physical Chemistry
123456789101112131415161718192021222324252627282930313233343536373839404142434445464748495051525354555657585960
10
The new force field starts with an approach similar to that employed in a previous
work58,59 where the nonbonding interactions between the zeolite framework atoms include
not only T-O (T=Si,Al,P) and O-O, as in many zeolite force fields, but also T-T terms.
Such terms are included with the Lennard-Jones functional rather than the Buckingham
functional. The obtained T-T parameters are small, which indicates that in practice we are
close to the common values of parameters found in similar force fields.30 Also in agreement
with previous force fields, the O-O parameters contribute more importantly, and this is
the expected result in zeolites where oxygen anions, with a larger size than the T cations,
dominate the interactions. Given the pivotal role of the oxygens, their charges have been
differentiated, taken into account their respective chemical local environment, and hence, we
have distinguished O1 for Si-O1(H1)-Al (Brønsted site) and O2 for Si-O2-Si and Al-O2-P.
In the case of O2, it has been found by calculations in quartz and berlinite that there is no
significant accuracy loss by equalizing the oxygens in Si-O-Si and Al-O-P.60 Also, employing
O2 in Si-O2-Al where O2 is not holding a proton (neighbour to Brønsted site) was found
a reasonable approximation and, more importantly, introduced a considerable simplicity in
a model that would have become complex if too many oxygen types had to be assigned
for each system. The corresponding oxygen charges are the only difference between these
oxygens as their O-O Lennard-Jones interactions do not distinguish between oxygen types.
Brønsted sites have been considered through a Coulomb subtracted Morse potential, simi-
larly as in a previous work in the groups of Catlow and Sauer.61 The current parametrization
gives very similar values; however in the current case there was no need to introduce a Buck-
ingham nor Lennard-Jones term between non-bonded O...H atoms as in the previous case.61
The OH term was tuned to give a reasonable OH distance around 0.96 A, typical for Brønsted
sites in zeolites.
Following our previous experience for the three-body terms we have introduced harmonic
terms for the following triads: O-Si-O, P-O-Al, Si-O-Al and Si-O-Si, while we have not
introduced an O-Al-O term. The values of the constants are similar to those found in other
force fields for zeolites. Taking into account that the current force field will be used for
dynamics at – among other – high temperatures, improving the harmonic approximation
could be a reasonable option, but we have sacrificed accuracy for simplicity, and this is
important given the large number of parameters to be determined.
The force field fitting as well as the lattice energy minimisations have been performed
Page 10 of 36
ACS Paragon Plus Environment
The Journal of Physical Chemistry
123456789101112131415161718192021222324252627282930313233343536373839404142434445464748495051525354555657585960
11
using GULP.62 The forcefield for hydrocarbons (ethene and propene) is taken from Oie et
al,63 which we have used previously in similar systems with good results.64 The structural
performance of the new force field in silica polymorphs shows an accuracy of cell parameters
within 1% and cell volumes within 2% (Supp. Info., Table S5).
D. Molecular dynamics
By varying the topology (AEI/CHA/AFX), the composition (with/without acidic sites,
zeo/SAPO), the adsorbates (ethene/propene) and the temperature (300/450/600 K), a total
of 54 systems are simulated with MD (overview Table I).
The DL POLY Classic65 (version 1.9) simulation package is used for MD simulations in
the NVT ensemble. The velocity Verlet integrator is used with a time step of 1 fs. Some
simulations used a shorter time step of 0.5 fs, i.e. for the materials with acid sites at 450 and
600 K. Snapshots of the positions are stored every 1000 time steps. Long-range interactions
are calculated with the smoothed particle mesh Ewald method with a cutoff radius between
11.7 and 12.0 A.
Taking into account that many zeolites show negative thermal expansion66,67 and that
this may affect the sizes of the 8-ring windows at the different temperatures simulated in this
study (300, 450 and 600 K), we have optimized the unit cells (without adsorbates) at different
temperatures employing the zero static internal stress approximation as implemented in
GULP,68 and using a coreshell force field which gives an accurate description of the thermal
expansion behavior.69 These cell parameters are used in the subsequent NVT MD runs.
Volume fluctuations and volume expansion induced by the adsorbates are neglected as the
same volume is used independently of the loading. Nevertheless, since the periodic box is a
supercell, some unit cell deformation is still possible.
First, an equilibration run of 380 000 time steps is performed with the velocity rescaling
thermostat. Next, a production run of 2 108 time steps is performed. The MD thus covers
200 ns for simulations with time step 1 fs and 100 ns for those with time step 0.5 fs. The
temperature is controlled with the Nose-Hoover thermostat with a coupling time constant
of 1 ps. This thermostat is known to disturb little the dynamics of the system, which is
essential when modeling diffusion. We verified the quality of the production run by tracing
the configurational energy and the instantaneous temperature, which both fluctuate around
Page 11 of 36
ACS Paragon Plus Environment
The Journal of Physical Chemistry
123456789101112131415161718192021222324252627282930313233343536373839404142434445464748495051525354555657585960
12
the mean, and by tracing the conserved energy quantity, which does not shift significantly
during the run.
E. Diffusion coefficients
The mean square displacement (MSD) of an adsorbate molecule during a time interval
τ (also called lag time) is a measure for the distance traveled by the molecule. The slope
of the MSD as a function of lag time determines the self-diffusion coefficient D. From a
single MD trajectory, many displacement vectors r‾i(t0 + τ ) − r‾i(t0) may be extracted that
represent the distance traveled by a molecule i over the time interval τ , starting from an
initial time t0. The MSD may thus be computed as
M SD(τ ) =
1
Nads
Nads 1
i Nτ
Nτ |r‾i(t0 + τ ) − r‾i(t0)|
2. (1) t0
In Eq. 1, the squared length of this displacement vector is averaged over many (Nτ ) such
time intervals, since the initial time t0 can freely vary along the trajectory, as long as the
total simulation time covers t0 + τ . In addition, averaging over the molecules improves the
statistics of the M SD(τ ) from a single trajectory, and thus also of the self-diffusion constant
D, defined according to the so-called Einstein relation,
M SD(t) = 6 D t + b (2)
where b is the offset at time zero. The line is fitted in the lag time range 100 to 3000 ps
using a least-sqaure fit. The MD trajectory is split into 20 non-overlapping blocks of equal
length. For each of the 20 blocks, an MSD curve is calculated by taking the average over
the Nads adsorbates, and a diffusion coefficient D is fit. The reported MSD curves and
corresponding D values in Section III are calculated as the average of these 20 MSD curves
and 20 D values, respectively, with error bars given by the corresponding standard error.
Further computational details are given in Supp. Inf.
F. Ring crossings and free energy profiles
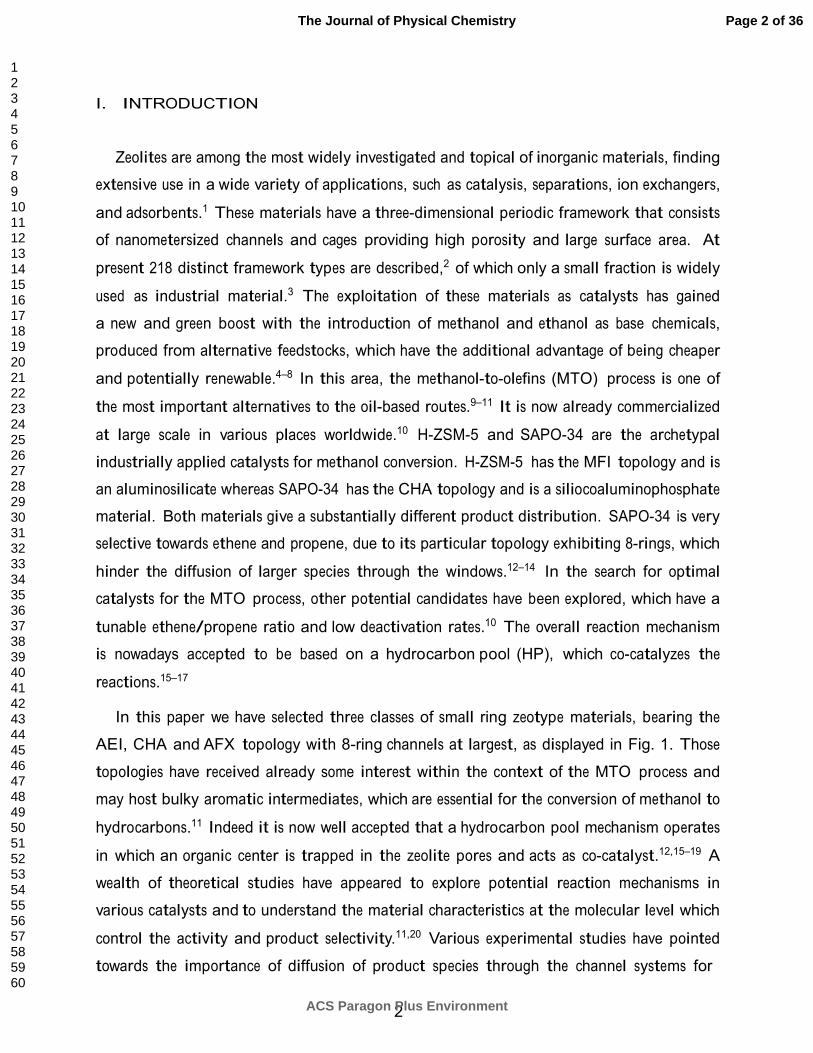
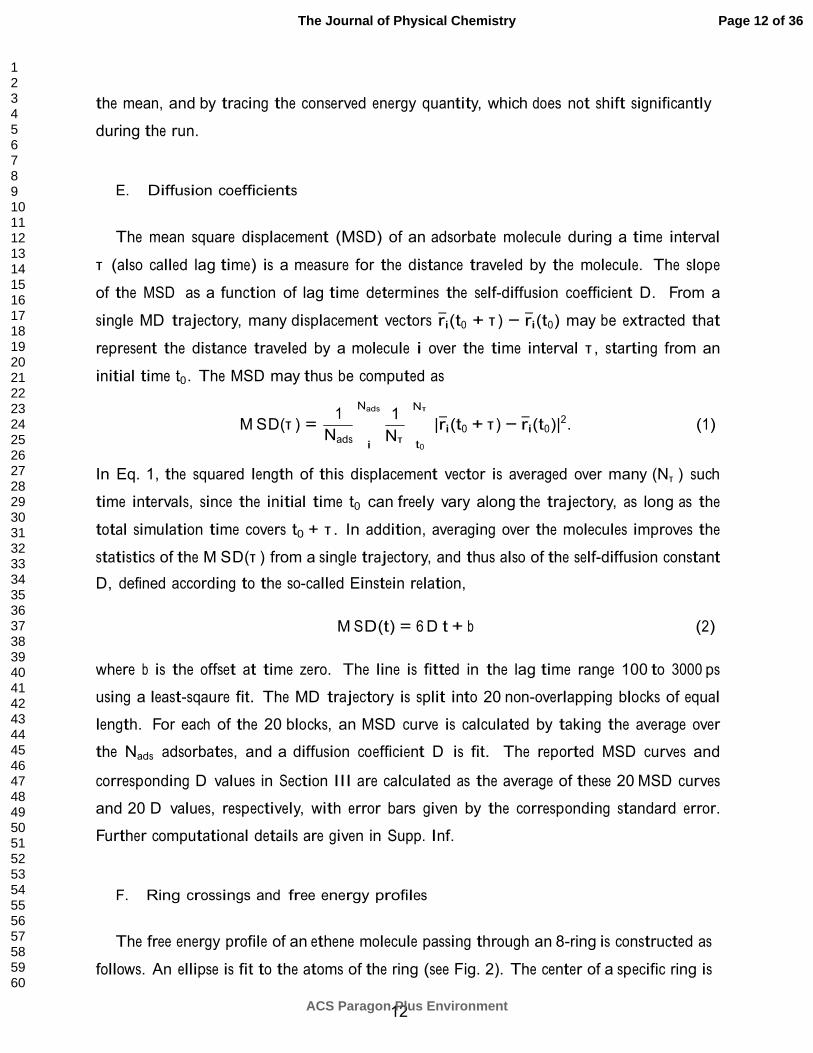
The free energy profile of an ethene molecule passing through an 8-ring is constructed as
follows. An ellipse is fit to the atoms of the ring (see Fig. 2). The center of a specific ring is
Page 12 of 36
ACS Paragon Plus Environment
The Journal of Physical Chemistry
123456789101112131415161718192021222324252627282930313233343536373839404142434445464748495051525354555657585960
13
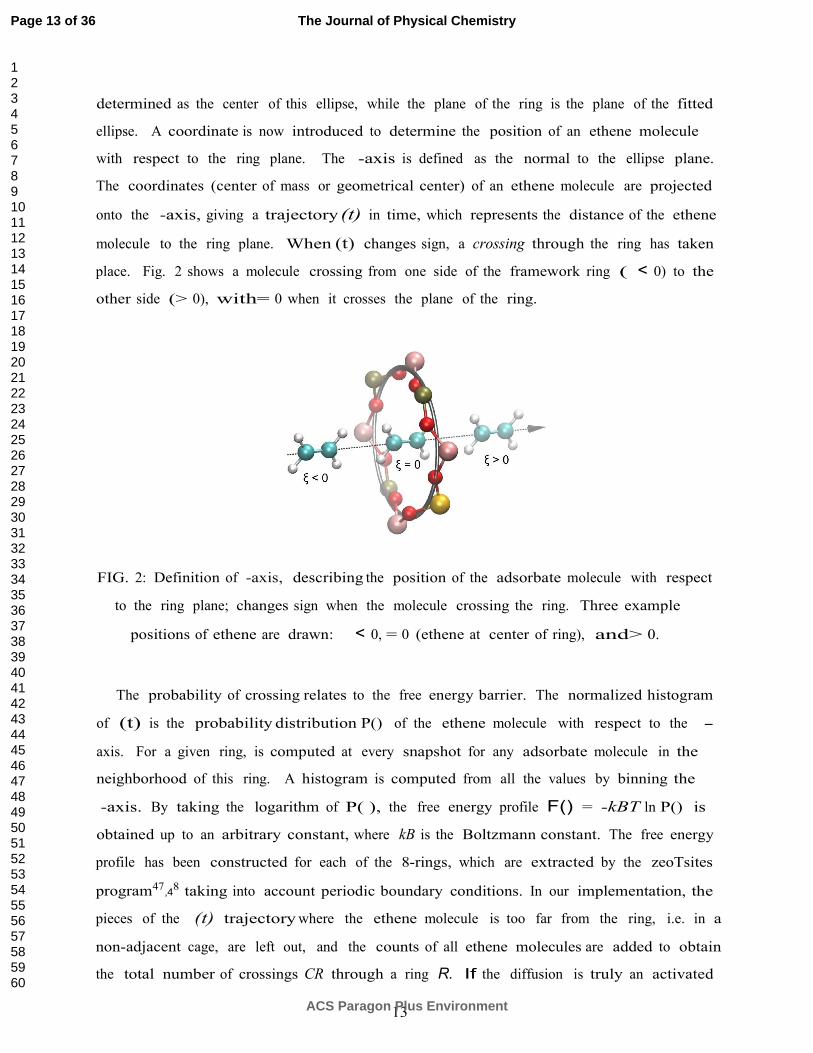
determined as the center of this ellipse, while the plane of the ring is the plane of the fitted
ellipse. A coordinate is now introduced to determine the position of an ethene molecule
with respect to the ring plane. The -axis is defined as the normal to the ellipse plane.
The coordinates (center of mass or geometrical center) of an ethene molecule are projected
onto the -axis, giving a trajectory (t) in time, which represents the distance of the ethene
molecule to the ring plane. When (t) changes sign, a crossing through the ring has taken
place. Fig. 2 shows a molecule crossing from one side of the framework ring ( < 0) to the
other side (> 0), with= 0 when it crosses the plane of the ring.
FIG. 2: Definition of -axis, describing the position of the adsorbate molecule with respect
to the ring plane; changes sign when the molecule crossing the ring. Three example
positions of ethene are drawn: < 0, = 0 (ethene at center of ring), and> 0.
The probability of crossing relates to the free energy barrier. The normalized histogram
of (t) is the probability distribution P() of the ethene molecule with respect to the -
axis. For a given ring, is computed at every snapshot for any adsorbate molecule in the
neighborhood of this ring. A histogram is computed from all the values by binning the
-axis. By taking the logarithm of P( ), the free energy profile F() = -kBT ln P() is
obtained up to an arbitrary constant, where kB is the Boltzmann constant. The free energy
profile has been constructed for each of the 8-rings, which are extracted by the zeoTsites
8
program47,4 taking into account periodic boundary conditions. In our implementation, the
pieces of the (t) trajectory where the ethene molecule is too far from the ring, i.e. in a
non-adjacent cage, are left out, and the counts of all ethene molecules are added to obtain
the total number of crossings CR through a ring R. If the diffusion is truly an activated
Page 13 of 36
ACS Paragon Plus Environment
The Journal of Physical Chemistry
123456789101112131415161718192021222324252627282930313233343536373839404142434445464748495051525354555657585960
14
process and MD sampling was sufficiently long, then CR should relate to the free energy
barrier between cage and window.
III. RESULTS AND DISCUSSION
A. Diffusion characteristics of ethene and propene
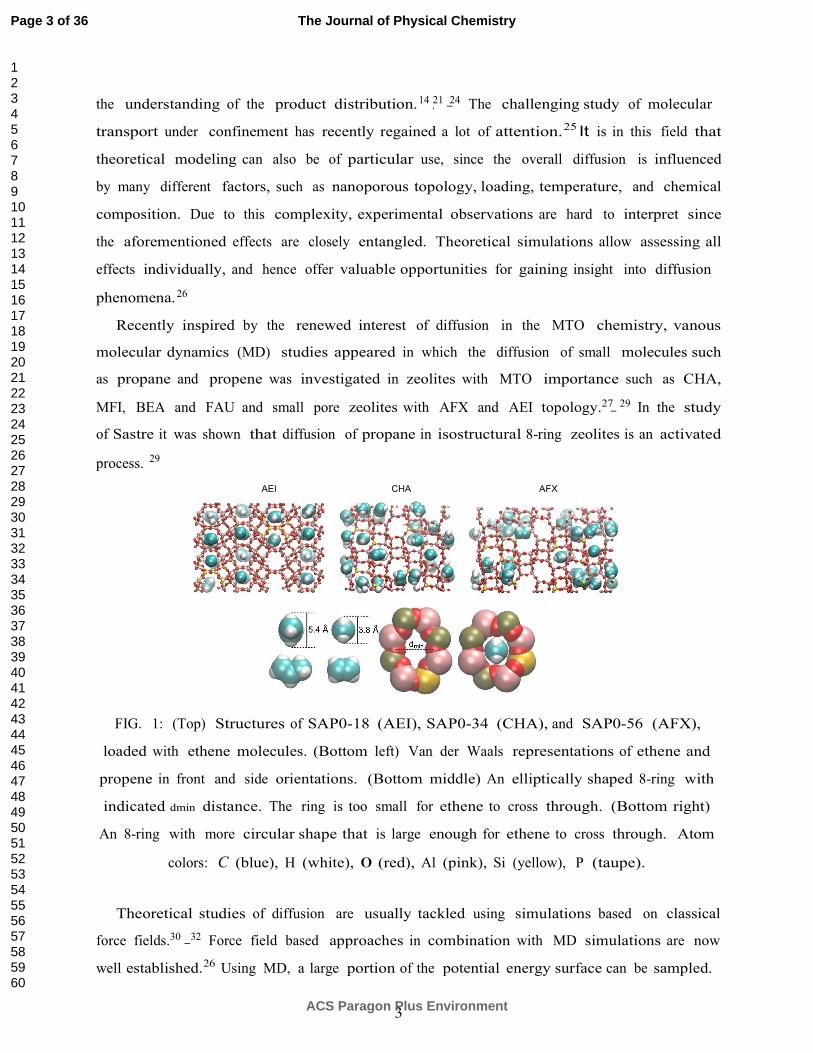
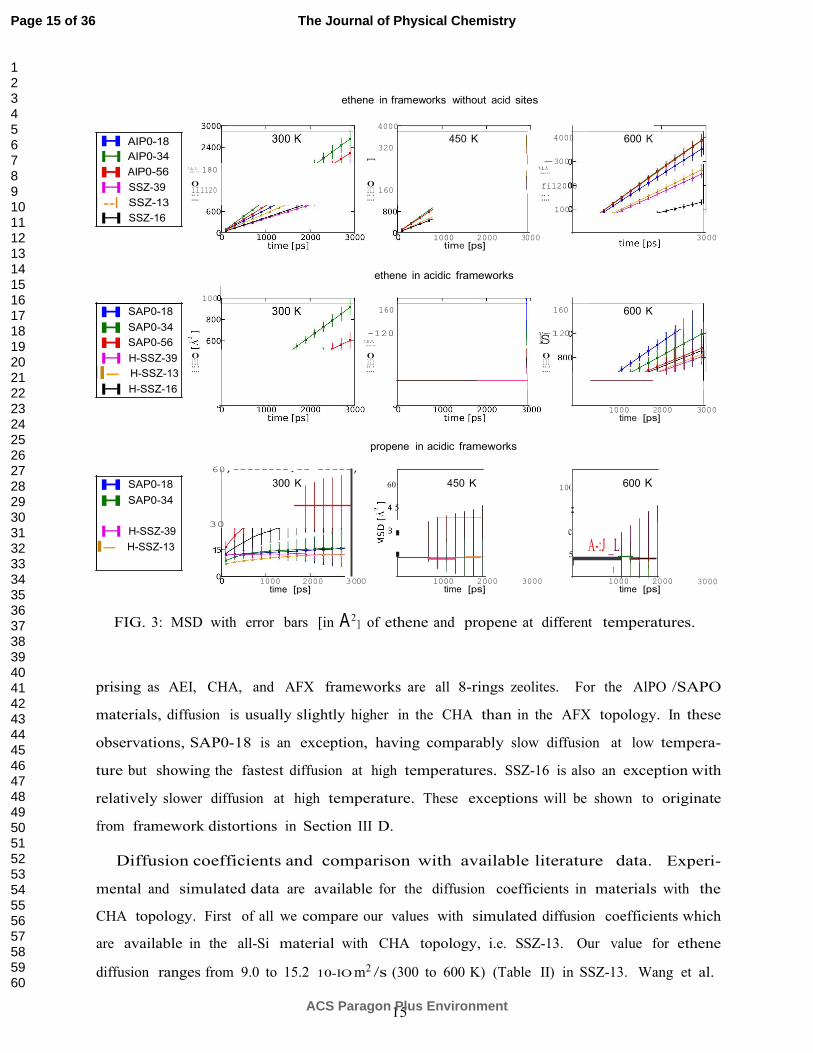
The mean square displacement of both ethene and propene in each of the investigated
materials and at three different temperatures (300, 450 and 600 K) is shown in Fig. 3. It is
immediately clear that ethene diffuses through each of the six materials, since a straight slope
of the MSD versus time is obtained. For propene this is not the case and in fact the error on
the MSD plots is too large to fit a reliable slope. For propene, diffusion itself becomes a rare
event at the time scale of the MD simulations and enhanced sampling techniques should be
used. Such study is beyond the scope of the present article. Propene accidently hops from
one cage to another but not frequently enough to deduce quantitative information (Figs. S2-
4 in Supp. Info.). Given this observation we will mainly focus the rest of the discussion
on ethene, where the diffusion has been sampled sufficiently to have statistically significant
conclusions.
Visualization of ethene trajectories further reveals that ethene diffuses by a jump process
between cages (Fig. S6 in Supp. Info.). The molecule spends most of the time in a cage and
occasionally crosses a ring to a neighboring cage. The number of observed ring crossings is
sufficiently large to deduce reliable quantitative diffusivities. The ethene diffusivities in each
of the materials are listed in Table II. Before discussing these in detail, it is interesting to
deduce some qualitative features about the differences in diffusivity in the various materials.
General trends in diffusivity for ethene. The effect of acid sites is dominant: ethene
diffusion decreases in all cases when acid sites are introduced. Diffusion is faster in non-
acidic materials (SSZ/AlPO) than in acidic materials (H-SSZ/SAPO). Furthermore, diffu-
sion increases in general with temperature, which indicates that the hopping process is an
activated process for which an empirical Arrhenius law may be fitted (vide infra). The differ-
ences induced by composition indicate in general that diffusion in silicoaluminophosphates
(AlPO/SAPO materials) is faster than in aluminosilicates (SSZ/H-SSZ materials). Within
the set of investigated materials the influence of topology is fairly limited, which is not sur-
Page 14 of 36
ACS Paragon Plus Environment
The Journal of Physical Chemistry
123456789101112131415161718192021222324252627282930313233343536373839404142434445464748495051525354555657585960
15
lll120 lll 160
Ns
: 5
ethene in frameworks without acid sites
H AIP0-18
H AIP0-34
4000
320
450 K 4000 600 K
-300
H AIP0-56
H SSZ-39
I --l SSZ-13
'::'::':. 180 '::'::':.
0 0 fil2000
::.: ::.: ::.:
H SSZ-16 100
1000 2000 3000 3000
time [ps]
ethene in acidic frameworks
H SAP0-18
H SAP0-34
H SAP0-56
100 160 160 600 K
-120 -120
':":::':.
H H-SSZ-39
II- H-SSZ-13
H H-SSZ-16
0 0 0 lll lll lll ::.: ::.: ::.:
1000 2000 3000
time [ps]
propene in acidic frameworks
H SAP0-18
H SAP0-34
60,--------.-- -----,
300 K 60 450 K
5
10( 600 K
:
H H-SSZ-39 30
I- H-SSZ-13 1
c
A-:J _L I
I
1000 2000
time [ps] 3000 1000 2000
time [ps] 3000 1000 2000
time [ps] 3000
FIG. 3: MSD with error bars [in A 2] of ethene and propene at different temperatures.
prising as AEI, CHA, and AFX frameworks are all 8-rings zeolites. For the AlPO /SAPO
materials, diffusion is usually slightly higher in the CHA than in the AFX topology. In these
observations, SAP0-18 is an exception, having comparably slow diffusion at low tempera-
ture but showing the fastest diffusion at high temperatures. SSZ-16 is also an exception with
relatively slower diffusion at high temperature. These exceptions will be shown to originate
from framework distortions in Section III D.
Diffusion coefficients and comparison with available literature data. Experi-
mental and simulated data are available for the diffusion coefficients in materials with the
CHA topology. First of all we compare our values with simulated diffusion coefficients which
are available in the all-Si material with CHA topology, i.e. SSZ-13. Our value for ethene
diffusion ranges from 9.0 to 15.2 10-lO m2 /s (300 to 600 K) (Table II) in SSZ-13. Wang et al.
Page 15 of 36
ACS Paragon Plus Environment
The Journal of Physical Chemistry
123456789101112131415161718192021222324252627282930313233343536373839404142434445464748495051525354555657585960
16
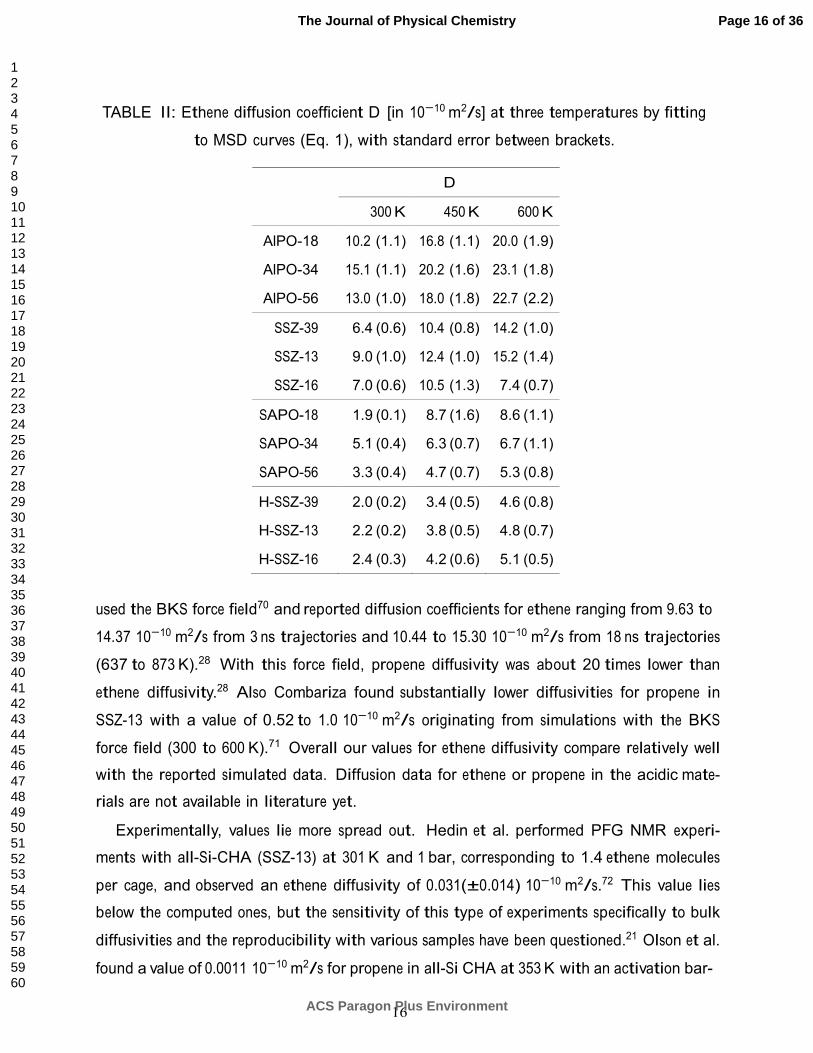
TABLE II: Ethene diffusion coefficient D [in 10−10 m2/s] at three temperatures by fitting
to MSD curves (Eq. 1), with standard error between brackets.
D
300 K 450 K 600 K
AlPO-18 10.2 (1.1) 16.8 (1.1) 20.0 (1.9)
AlPO-34 15.1 (1.1) 20.2 (1.6) 23.1 (1.8)
AlPO-56 13.0 (1.0) 18.0 (1.8) 22.7 (2.2)
SSZ-39 6.4 (0.6) 10.4 (0.8) 14.2 (1.0)
SSZ-13 9.0 (1.0) 12.4 (1.0) 15.2 (1.4)
SSZ-16 7.0 (0.6) 10.5 (1.3) 7.4 (0.7)
SAPO-18 1.9 (0.1) 8.7 (1.6) 8.6 (1.1)
SAPO-34 5.1 (0.4) 6.3 (0.7) 6.7 (1.1)
SAPO-56 3.3 (0.4) 4.7 (0.7) 5.3 (0.8)
H-SSZ-39 2.0 (0.2) 3.4 (0.5) 4.6 (0.8)
H-SSZ-13 2.2 (0.2) 3.8 (0.5) 4.8 (0.7)
H-SSZ-16 2.4 (0.3) 4.2 (0.6) 5.1 (0.5)
used the BKS force field70 and reported diffusion coefficients for ethene ranging from 9.63 to
14.37 10−10 m2/s from 3 ns trajectories and 10.44 to 15.30 10−10 m2/s from 18 ns trajectories
(637 to 873 K).28 With this force field, propene diffusivity was about 20 times lower than
ethene diffusivity.28 Also Combariza found substantially lower diffusivities for propene in
SSZ-13 with a value of 0.52 to 1.0 10−10 m2/s originating from simulations with the BKS
force field (300 to 600 K).71 Overall our values for ethene diffusivity compare relatively well
with the reported simulated data. Diffusion data for ethene or propene in the acidic mate-
rials are not available in literature yet.
Experimentally, values lie more spread out. Hedin et al. performed PFG NMR experi-
ments with all-Si-CHA (SSZ-13) at 301 K and 1 bar, corresponding to 1.4 ethene molecules
per cage, and observed an ethene diffusivity of 0.031(±0.014) 10−10 m2/s.72 This value lies
below the computed ones, but the sensitivity of this type of experiments specifically to bulk
diffusivities and the reproducibility with various samples have been questioned.21 Olson et al.
found a value of 0.0011 10−10 m2/s for propene in all-Si CHA at 353 K with an activation bar-
Page 16 of 36
ACS Paragon Plus Environment
The Journal of Physical Chemistry
123456789101112131415161718192021222324252627282930313233343536373839404142434445464748495051525354555657585960
17
rier of 10 kJ/mol from an adsorption experiment.73 They report that ethene diffuses about 28
times faster than propene at that temperature, and 80 times faster at 303 K.73 Ruthven and
Reyes used a similar adsorption experiment to derive various diffusion coefficients, among
which those of ethene and propene in the acidic material SAPO-34. From these experiments
it was derived that ethene and propene have diffusivities of 0.0015 and 0.0009 10−10 m2/s in
SAPO-34 at 323 K and activation barriers 82 and 97 kJ/mol, respectively.74 The SAPO-34
material has also been investigated experimentally by Dai et al.23 They derived PFG NMR
ethene diffusivities of 0.13 to 0.16 10−10 m2/s for loadings of 1 to 3 molecules/cage at 295 K,
which is one order of magnitude lower than in our simulations, and found an activation bar-
rier of 4.2 kJ/mol in the temperature range 303–353 K. In summary, the values vary largely
between simulations, experiments and experimental techniques. Rather than focussing on
quantitative reproduction of some observed measurements, the primary goal of this paper is
to reveal the molecular factors that control the diffusivity.
The increase in ethene diffusivity with temperature suggests that the diffusion is an
activated process. An Arrhenius plot may be fit to the D values at the three temperatures.
The values for the derived Arrhenius parameters are taken up in the Supp. Info. (Table S4,
Fig. S5). In general, preexponential factors are highest for the AlPO materials and non-
acidic zeolites, indicating lower intrinsic diffusivity for acidic materials. On the other hand,
the activation energies are higher for zeolites, meaning that diffusion in zeolites can be
enhanced more easily with temperature than in SAPOs, which explains the observed higher
diffusivities in the 300 to 600 K range. For the materials SAPO-18 and SSZ-16, it is not
possible to fit Arrhenius parameters reliably, because the observed variations in diffusivity
with temperature is caused by framework distortions, as will be explained later in Sec. III D.
Diffusion coefficients in relation to the material’s flexibility. Since our simula-
tions use a flexible framework, and 8-rings are tight-fitting windows for the hydrocarbon
diffusion, it is tested whether the diffusivities correlate to the flexibility of the material. A
material’s overall flexibility is here assessed by the root mean square fluctuation (RMSF) per
T-atom, i.e. the square root of the time-averaged squared deviations of the framework atom
positions with respect to the time-averaged structure, as displayed in Figs. S7 and S8 in the
Supp. Inf. For a given material, flexibility and diffusivity go hand in hand: an increase in
temperature is systematically accompanied by an increase in both flexibility and diffusion
coefficient. However, at a given temperature, trends in flexibility between the materials do
Page 17 of 36
ACS Paragon Plus Environment
The Journal of Physical Chemistry
123456789101112131415161718192021222324252627282930313233343536373839404142434445464748495051525354555657585960
18
not follow trends in diffusion coefficients. A flexibility parameter like RMSF per T-atom
cannot differentiate in diffusivity between materials. This observation lies in line with stud-
ies in literature that investigate the effect of a rigid framework.33,35,44 As mentioned in the
introduction, there is no general rule that predicts the effect of a flexible framework simu-
lation on the diffusion compared to a rigid framework simulation: including flexibility may
enhance or lower diffusivities depending on the considered framework-adsorbate system.
It should be stressed that diffusivities and flexibility are global material-adsorbate pa-
rameters. The diffusivities and overall flexibility as described here are global parameters
which incorporate very diverse contributions from the individual rings. To understand the
molecular origin for the diffusion behavior, it is important to perform a detailed analysis of
the individual 8-rings. It will become clear in the next sections that individual rings can
have significantly different free energy barriers for ring crossing.
B. Ring character and free energy barriers/crossings
In a previous paper by one of the authors it was found that AFX and AEI topologies re-
spond structurally to adsorption of propane molecules.29 At low temperature, the materials
loose some symmetry due to ring deformations. At higher loading and at higher tempera-
tures, the average structure is again more symmetric. This flexible response of the material
has a large effect on the diffusion even if the deformations seem small, because the 8-rings
are tight-fitting for diffusion of ethene and propene (Fig. 1). A flexibility parameter like
RMSF per T-atom is too global to differentiate in diffusivity between materials. Therefore
a detailed analysis is here presented of the individual ring properties.
The purpose of the analysis is to asses which factors affect the number of crossing
molecules through a given 8-ring R. First of all the various 8-rings encountered in each
of the materials are classified according to two factors, namely the ring topology and ring
composition as schematically shown in Fig. 4. We will refer to the combination of ring
topology and ring composition as the ring character.
The first factor is the local ring topology (Fig. 4), i.e. which two cages are connected by
the ring, and which other adjoining rings are attached to the ring. A schematic view of ring
topology is presented in Fig. 4. In CHA materials, all cages are identical, and all 8-rings are
topologically equivalent. In AEI materials, all cages are identical as well, but not all 8-rings
Page 18 of 36
ACS Paragon Plus Environment
The Journal of Physical Chemistry
123456789101112131415161718192021222324252627282930313233343536373839404142434445464748495051525354555657585960
19
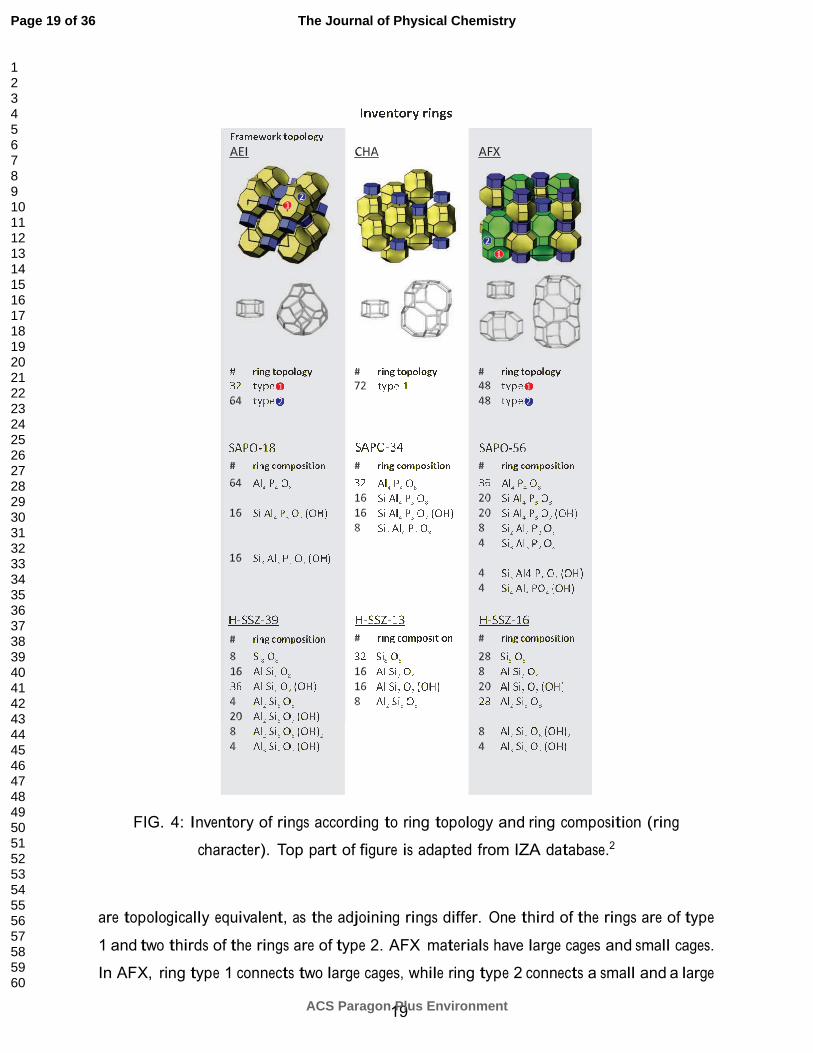
FIG. 4: Inventory of rings according to ring topology and ring composition (ring
character). Top part of figure is adapted from IZA database.2
are topologically equivalent, as the adjoining rings differ. One third of the rings are of type
1 and two thirds of the rings are of type 2. AFX materials have large cages and small cages.
In AFX, ring type 1 connects two large cages, while ring type 2 connects a small and a large
Page 19 of 36
ACS Paragon Plus Environment
The Journal of Physical Chemistry
123456789101112131415161718192021222324252627282930313233343536373839404142434445464748495051525354555657585960
20
cage.
The second factor is rzng composition. The acid sites are distributed over the frame-
work, and some rings may contain protons and/ or acidic sites, creating an inhomogeneous
composition distribution of the rings. It was already observed in the MSD (Fig. 3) that
the presence of an acidic proton decreases the overall diffusivity of ethene. This might be
ascribed to the reduction of available space, or specific interactions with the adsorbates or
other structural variations in the ring. Indeed, the chemical variety may cause deviations
from the pure-silica Si-0 bond lengths and 0-Si-0 angles, leading to structural distortions.
Crossing through a specific ring is thus expected to depend on the ring composition. An
inventory of ring compositions is also given in Fig. 4.
10
8-
t=; t=;
:::"5 :::"5 6
g g 4- i:( i:(
dAl
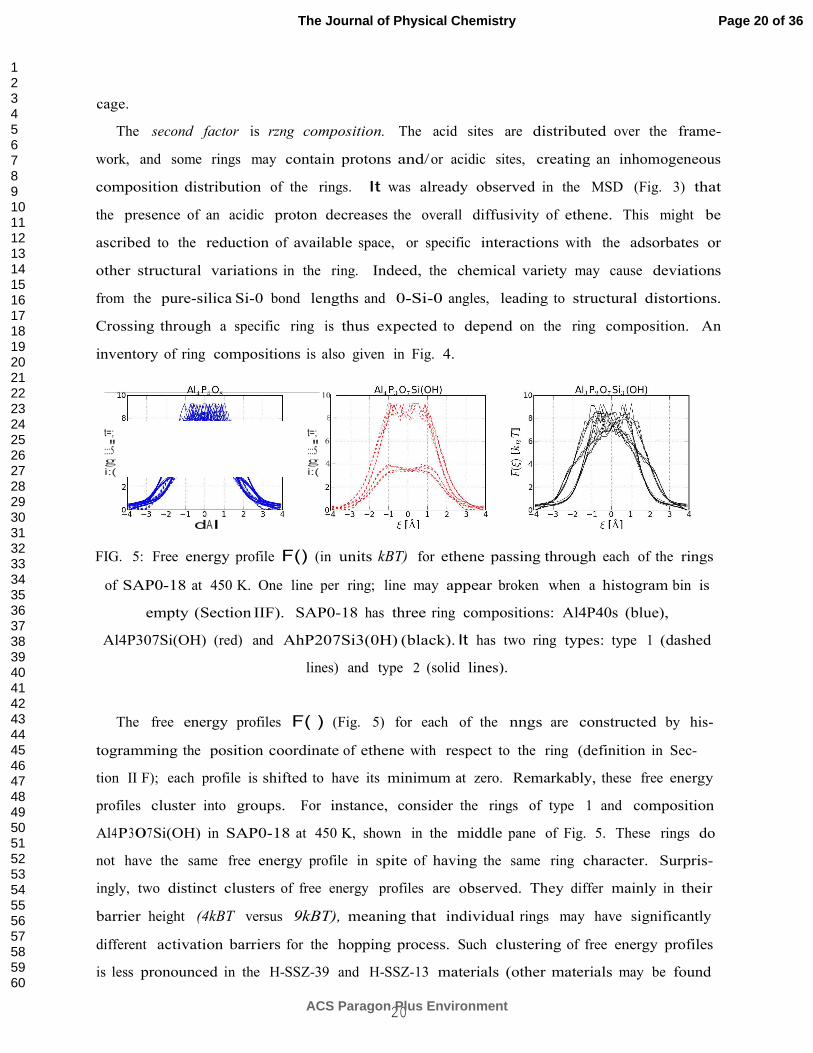
FIG. 5: Free energy profile F() (in units kBT) for ethene passing through each of the rings
of SAP0-18 at 450 K. One line per ring; line may appear broken when a histogram bin is
empty (Section IIF). SAP0-18 has three ring compositions: Al4P40s (blue),
Al4P307Si(OH) (red) and AhP207Si3(0H) (black). It has two ring types: type 1 (dashed
lines) and type 2 (solid lines).
The free energy profiles F( ) (Fig. 5) for each of the nngs are constructed by his-
togramming the position coordinate of ethene with respect to the ring (definition in Sec-
tion II F); each profile is shifted to have its minimum at zero. Remarkably, these free energy
profiles cluster into groups. For instance, consider the rings of type 1 and composition
Al4P307Si(OH) in SAP0-18 at 450 K, shown in the middle pane of Fig. 5. These rings do
not have the same free energy profile in spite of having the same ring character. Surpris-
ingly, two distinct clusters of free energy profiles are observed. They differ mainly in their
barrier height (4kBT versus 9kBT), meaning that individual rings may have significantly
different activation barriers for the hopping process. Such clustering of free energy profiles
is less pronounced in the H-SSZ-39 and H-SSZ-13 materials (other materials may be found
Page 20 of 36
ACS Paragon Plus Environment
The Journal of Physical Chemistry
123456789101112131415161718192021222324252627282930313233343536373839404142434445464748495051525354555657585960
21
c
300K
450K Vl 600K
0 0 N
c
10
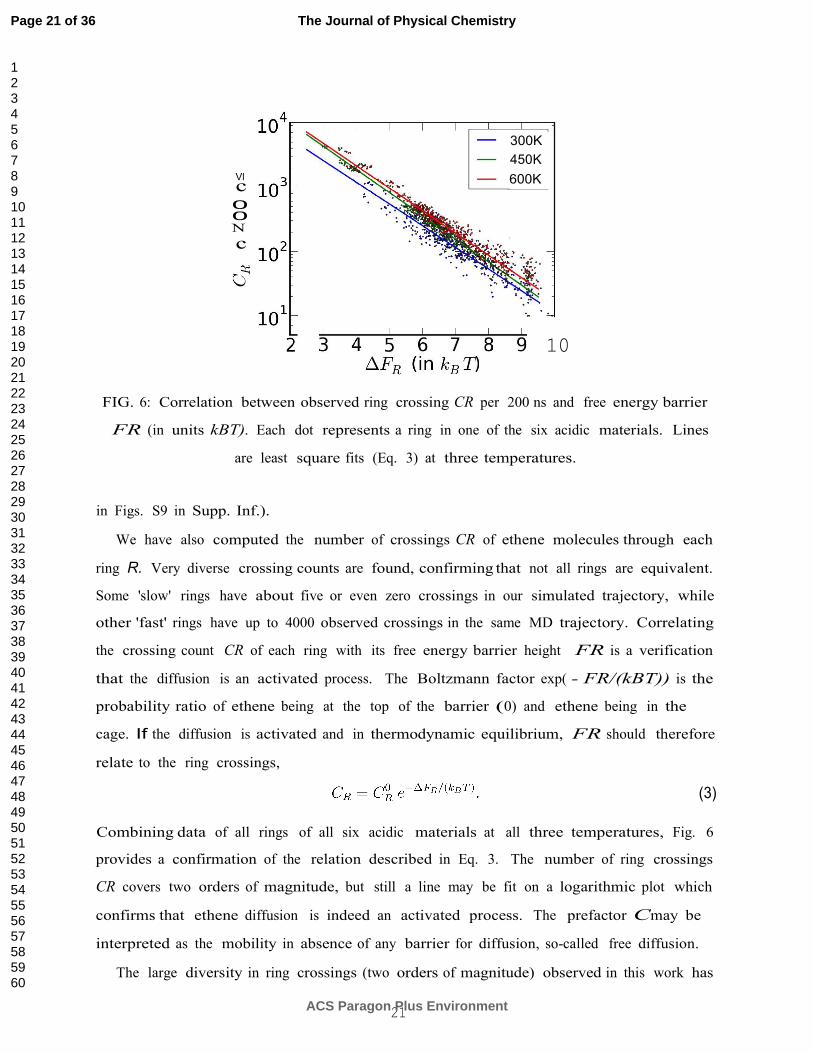
FIG. 6: Correlation between observed ring crossing CR per 200 ns and free energy barrier
FR (in units kBT). Each dot represents a ring in one of the six acidic materials. Lines
are least square fits (Eq. 3) at three temperatures.
in Figs. S9 in Supp. Inf.).
We have also computed the number of crossings CR of ethene molecules through each
ring R. Very diverse crossing counts are found, confirming that not all rings are equivalent.
Some 'slow' rings have about five or even zero crossings in our simulated trajectory, while
other 'fast' rings have up to 4000 observed crossings in the same MD trajectory. Correlating
the crossing count CR of each ring with its free energy barrier height FR is a verification
that the diffusion is an activated process. The Boltzmann factor exp( - FR/(kBT)) is the
probability ratio of ethene being at the top of the barrier (0) and ethene being in the
cage. If the diffusion is activated and in thermodynamic equilibrium, FR should therefore
relate to the ring crossings,
(3)
Combining data of all rings of all six acidic materials at all three temperatures, Fig. 6
provides a confirmation of the relation described in Eq. 3. The number of ring crossings
CR covers two orders of magnitude, but still a line may be fit on a logarithmic plot which
confirms that ethene diffusion is indeed an activated process. The prefactor Cmay be
interpreted as the mobility in absence of any barrier for diffusion, so-called free diffusion.
The large diversity in ring crossings (two orders of magnitude) observed in this work has
Page 21 of 36
ACS Paragon Plus Environment
The Journal of Physical Chemistry
123456789101112131415161718192021222324252627282930313233343536373839404142434445464748495051525354555657585960
22
'
;
eu
I 1250 I
I Ul 1000 I I Ol I e
c I I
750 I /
/ /
g 500 �c
/
··A-·-
250 (..."-<,
B .,.. ----··"# 8 - -.•t....---
.0 0.2'···0.4 0.6 0.8 1.0 1.2 1.4 1.6
<AWA> (A2
)
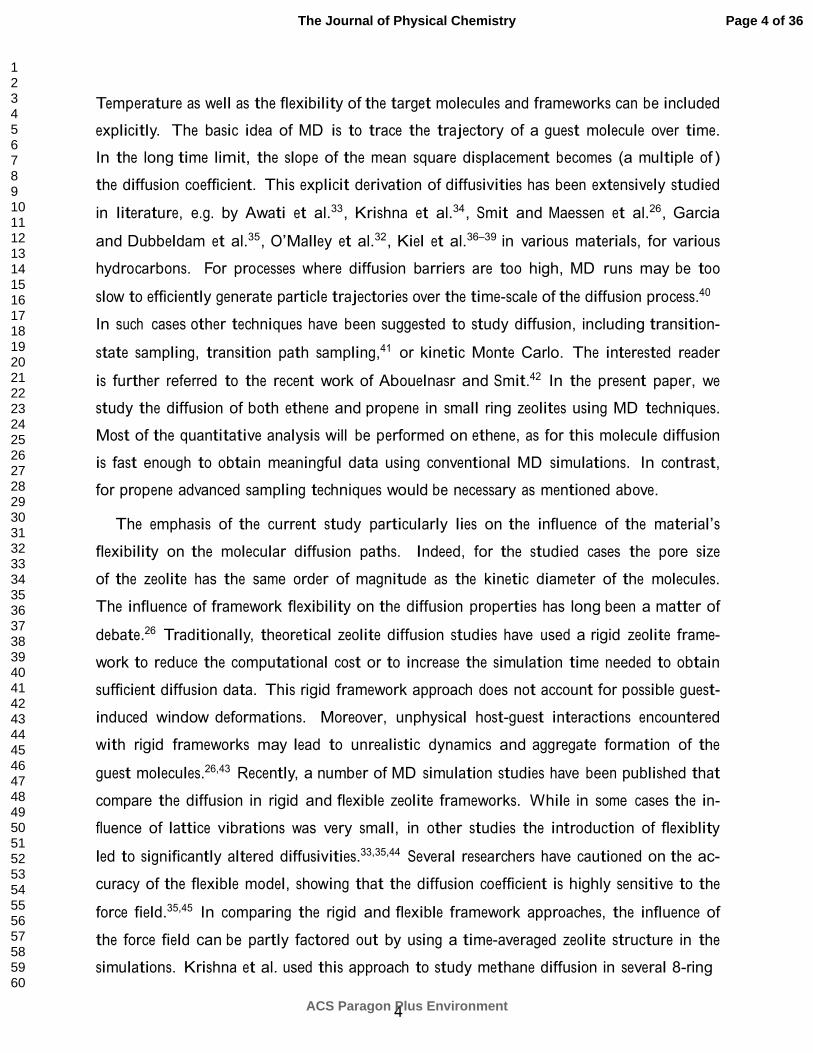
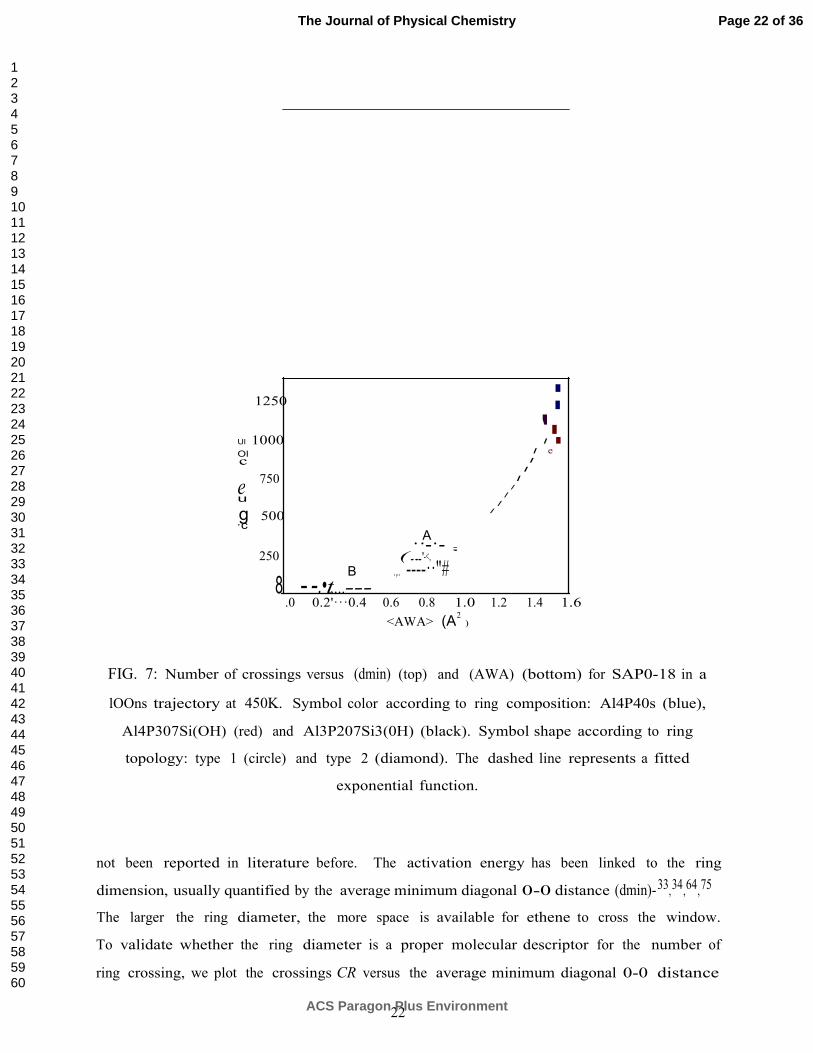
FIG. 7: Number of crossings versus (dmin) (top) and (AWA) (bottom) for SAP0-18 in a
lOOns trajectory at 450K. Symbol color according to ring composition: Al4P40s (blue),
Al4P307Si(OH) (red) and Al3P207Si3(0H) (black). Symbol shape according to ring
topology: type 1 (circle) and type 2 (diamond). The dashed line represents a fitted
exponential function.
not been reported in literature before. The activation energy has been linked to the ring
dimension, usually quantified by the average minimum diagonal 0-0 distance (dmin)- 33,34,64,75
The larger the ring diameter, the more space is available for ethene to cross the window.
To validate whether the ring diameter is a proper molecular descriptor for the number of
ring crossing, we plot the crossings CR versus the average minimum diagonal 0-0 distance
Page 22 of 36
ACS Paragon Plus Environment
The Journal of Physical Chemistry
123456789101112131415161718192021222324252627282930313233343536373839404142434445464748495051525354555657585960
23
(dmin) in Fig. 7 for the SAPO-18 material at 450 K. It is remarkable that the crossing counts
cluster into groups. Although clustering is often due to differences in ring character, this
is not always the case. For example, the two clusters A and B in Fig. 7 have identical
ring character (indicated by blue diamonds), but their crossing counts are different. This
means that the two factors – ring topology and ring composition – are valuable descriptors,
but are unable to fully capture how slow/fast the diffusion would occur. Moreover the
minimum diagonal O-O distance (dmin) is also not able to discriminate the variations in ring
diffusivity observed between clusters A and B. In the next Section III C we will introduce a
new geometrical descriptor that can explain the clustering.
C. A new molecular descriptor for ring crossings
In Fig. 7, many more crossings are observed for cluster A versus cluster B, even though
the computed (dmin) is smaller. The first and second factor (ring topology, ring composition)
cannot explain this difference, and therefore the rings’ structures are compared in detail to
reveal a third factor. In an attempt to find a molecular descriptor which correlates well with
the observed ring crossings, a number of alternative ring descriptors were computed. The
details may be found in the Supp. Info (see Figs. S10-12). Some describe ring size (average
ring area computed as the area of the fitted ellipse of Section II F, average maximum distance
(dmax) between opposite T-site atoms). Some describe ring deformation in the plane (average
ratio (dmax/dmin), average eccentricity of the fitted ellipse), or ring deformation out of the
plane (average boat, chair and total puckering amplitudes). Others describe ring flexibility
(standard deviation on dmin, probability P [dmin > dt] of having a distance dmin above a
certain chosen treshold value dt).
None of these computed structural parameters can explain all trends in ring crossings.
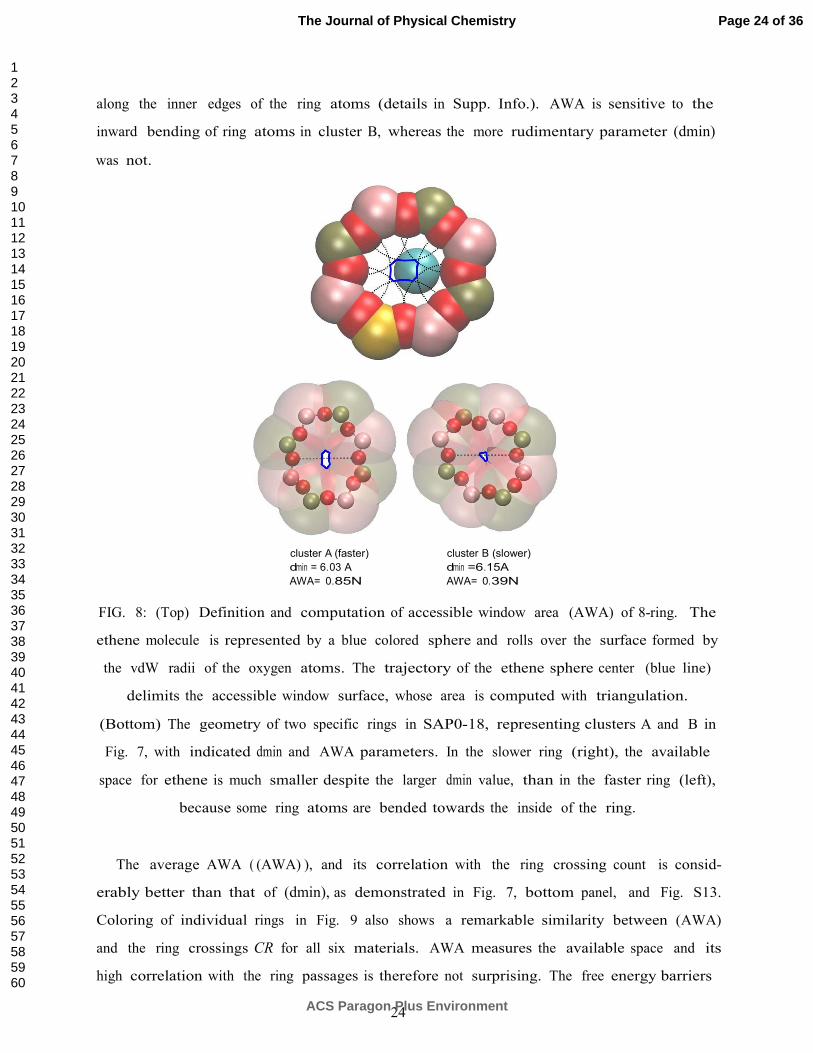
Visualization of clusters A and B rings (bottom panel in Fig. 8) shows that the displacement
of some of the ring atoms towards the inside of the ring seriously reduces the available
space for ethene to pass. As a new parameter that can capture this effect, we propose the
accessible window area (AWA) as a structural descriptor. AWA is inspired by the solvent
accessible surface area that is commonly used in implicit solvation models of proteins and
small molecules.76 The ethene AWA of a ring is the free space available to an ethene molecule
when placed inside a ring. It is computed by rolling a disk with the size of an ethene molecule
Page 23 of 36
ACS Paragon Plus Environment
The Journal of Physical Chemistry
123456789101112131415161718192021222324252627282930313233343536373839404142434445464748495051525354555657585960
24
along the inner edges of the ring atoms (details in Supp. Info.). AWA is sensitive to the
inward bending of ring atoms in cluster B, whereas the more rudimentary parameter (dmin)
was not.
cluster A (faster)
dmin = 6.03 A
AWA= 0.85N
cluster B (slower)
dmin =6.15A
AWA= 0.39N
FIG. 8: (Top) Definition and computation of accessible window area (AWA) of 8-ring. The
ethene molecule is represented by a blue colored sphere and rolls over the surface formed by
the vdW radii of the oxygen atoms. The trajectory of the ethene sphere center (blue line)
delimits the accessible window surface, whose area is computed with triangulation.
(Bottom) The geometry of two specific rings in SAP0-18, representing clusters A and B in
Fig. 7, with indicated dmin and AWA parameters. In the slower ring (right), the available
space for ethene is much smaller despite the larger dmin value, than in the faster ring (left),
because some ring atoms are bended towards the inside of the ring.
The average AWA ( (AWA) ), and its correlation with the ring crossing count is consid-
erably better than that of (dmin), as demonstrated in Fig. 7, bottom panel, and Fig. S13.
Coloring of individual rings in Fig. 9 also shows a remarkable similarity between (AWA)
and the ring crossings CR for all six materials. AWA measures the available space and its
high correlation with the ring passages is therefore not surprising. The free energy barriers
Page 24 of 36
ACS Paragon Plus Environment
The Journal of Physical Chemistry
123456789101112131415161718192021222324252627282930313233343536373839404142434445464748495051525354555657585960
25
SAP0-18
<AWA>
H-SSZ-39
low
SAP0-34
<AWA>
H-SSZ-13
high
SAP0-56
H-SSZ-16
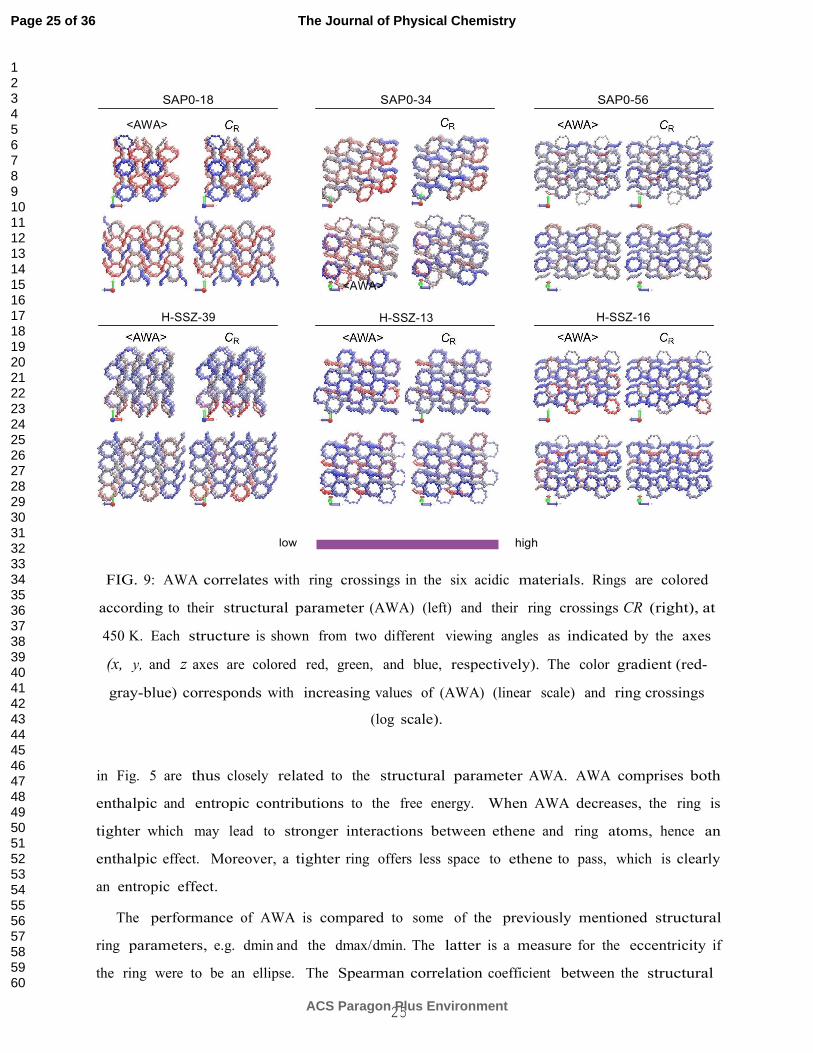
FIG. 9: AWA correlates with ring crossings in the six acidic materials. Rings are colored
according to their structural parameter (AWA) (left) and their ring crossings CR (right), at
450 K. Each structure is shown from two different viewing angles as indicated by the axes
(x, y, and z axes are colored red, green, and blue, respectively). The color gradient (red-
gray-blue) corresponds with increasing values of (AWA) (linear scale) and ring crossings
(log scale).
in Fig. 5 are thus closely related to the structural parameter AWA. AWA comprises both
enthalpic and entropic contributions to the free energy. When AWA decreases, the ring is
tighter which may lead to stronger interactions between ethene and ring atoms, hence an
enthalpic effect. Moreover, a tighter ring offers less space to ethene to pass, which is clearly
an entropic effect.
The performance of AWA is compared to some of the previously mentioned structural
ring parameters, e.g. dmin and the dmax/dmin. The latter is a measure for the eccentricity if
the ring were to be an ellipse. The Spearman correlation coefficient between the structural
Page 25 of 36
ACS Paragon Plus Environment
The Journal of Physical Chemistry
123456789101112131415161718192021222324252627282930313233343536373839404142434445464748495051525354555657585960
26
I I I
-= == == ==
1.0
0.8 u ...: 5 0.6 u c
E
.... ca
o.4
0.2 Vl
•- • (AWA)
·- AWATA
+ - + (dmin)
•- -. (dmax/dmin)
0.0
co -.:t 1.0 01 ("() 1.0 r-1 ("() 10 ("() r-1 r-1 I I I I I I
0 0 0 N N N a.. a.. a.. Vl Vl Vl <( <( <( Vl Vl Vl Vl Vl Vl :::c :::c :::c
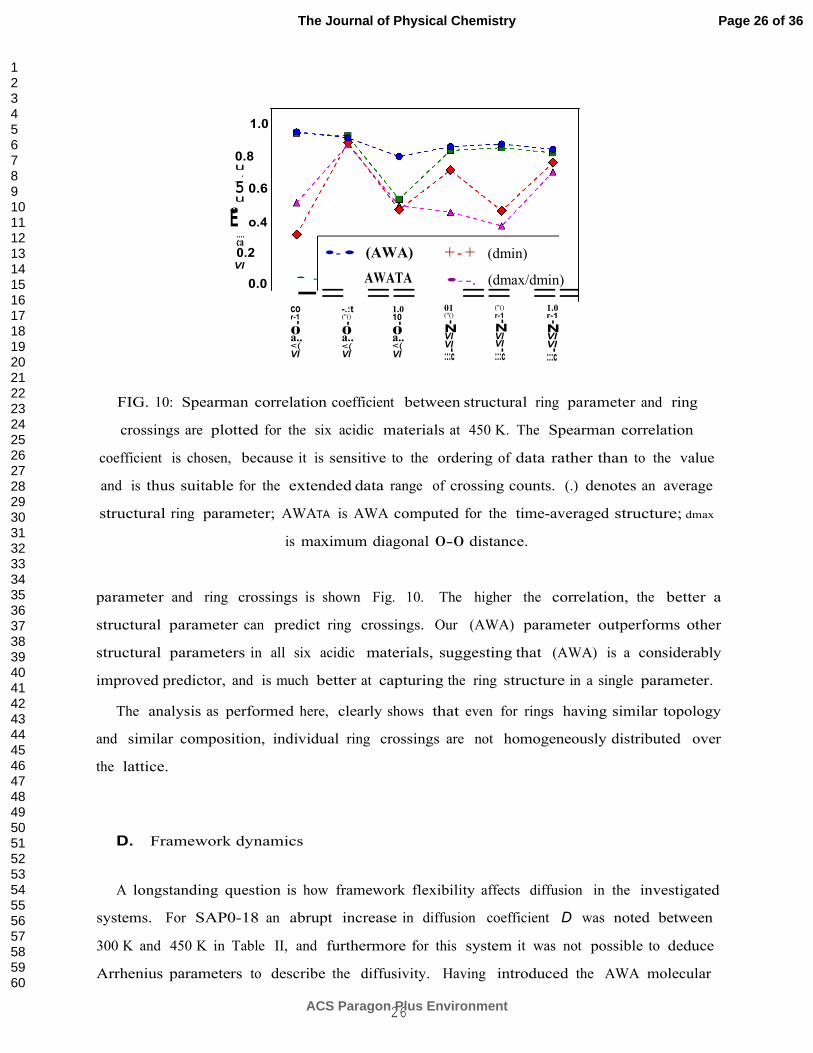
FIG. 10: Spearman correlation coefficient between structural ring parameter and ring
crossings are plotted for the six acidic materials at 450 K. The Spearman correlation
coefficient is chosen, because it is sensitive to the ordering of data rather than to the value
and is thus suitable for the extended data range of crossing counts. (.) denotes an average
structural ring parameter; AWATA is AWA computed for the time-averaged structure; dmax
is maximum diagonal 0-0 distance.
parameter and ring crossings is shown Fig. 10. The higher the correlation, the better a
structural parameter can predict ring crossings. Our (AWA) parameter outperforms other
structural parameters in all six acidic materials, suggesting that (AWA) is a considerably
improved predictor, and is much better at capturing the ring structure in a single parameter.
The analysis as performed here, clearly shows that even for rings having similar topology
and similar composition, individual ring crossings are not homogeneously distributed over
the lattice.
D. Framework dynamics
A longstanding question is how framework flexibility affects diffusion in the investigated
systems. For SAP0-18 an abrupt increase in diffusion coefficient D was noted between
300 K and 450 K in Table II, and furthermore for this system it was not possible to deduce
Arrhenius parameters to describe the diffusivity. Having introduced the AWA molecular
Page 26 of 36
ACS Paragon Plus Environment
The Journal of Physical Chemistry
123456789101112131415161718192021222324252627282930313233343536373839404142434445464748495051525354555657585960
27
SAP0-18
300 K 450 K 600 K
SAP0-56
300 K 450 K 600 K
low high
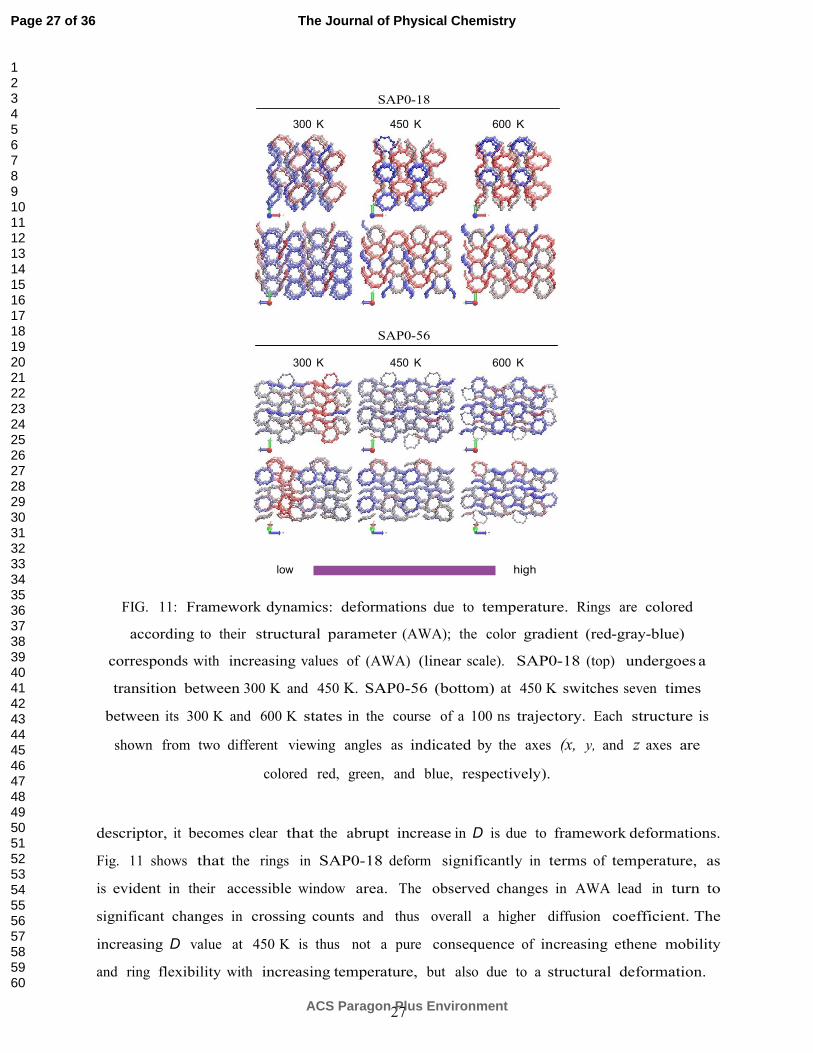
FIG. 11: Framework dynamics: deformations due to temperature. Rings are colored
according to their structural parameter (AWA); the color gradient (red-gray-blue)
corresponds with increasing values of (AWA) (linear scale). SAP0-18 (top) undergoes a
transition between 300 K and 450 K. SAP0-56 (bottom) at 450 K switches seven times
between its 300 K and 600 K states in the course of a 100 ns trajectory. Each structure is
shown from two different viewing angles as indicated by the axes (x, y, and z axes are
colored red, green, and blue, respectively).
descriptor, it becomes clear that the abrupt increase in D is due to framework deformations.
Fig. 11 shows that the rings in SAP0-18 deform significantly in terms of temperature, as
is evident in their accessible window area. The observed changes in AWA lead in turn to
significant changes in crossing counts and thus overall a higher diffusion coefficient. The
increasing D value at 450 K is thus not a pure consequence of increasing ethene mobility
and ring flexibility with increasing temperature, but also due to a structural deformation.
Page 27 of 36
ACS Paragon Plus Environment
The Journal of Physical Chemistry
123456789101112131415161718192021222324252627282930313233343536373839404142434445464748495051525354555657585960
28
Also for SAPO-56 a structural deformation between 300 K and 600 K (Fig. 11) is noticed.
At lower temperatures (300 K) two bands of narrow and wide rings parallel to the xy-plane
are present. At higher temperature (600 K), wide rings predominate in the direction normal
to the x-axis, while narrow rings are mostly found normal to the y-axis. At 450 K, the
SAPO-56 framework is in equilibrium between the two states. In our 100 ns trajectory at
450 K, seven transitions between the two states are observed, and both states are sampled
about equally. Consequently, AWA has a bimodal distribution, and the signature of (AWA)
at 450K is intermediate between the 300 K and 600 K figures in Fig. 11.
Our averaged AWA descriptor ((AWA)) correlates well with the ring crossings as observed
in Fig. 10. To facilitate the computation of structural parameters, one could opt to calculate
the AWA once at the time-averaged (TA) structure, which is obtained by taking the time
average of the framework coordinates over the whole trajectory. The correlation of this
parameter, denoted by AWATA, with the number of ring crossings is also shown in Fig. 10.
In most of the cases, AWATA captures the ring crossings sufficiently, except in those cases
where framework deformations are large, or have a bimodal distribution, as is the case for
SAPO-56 at 450 K. When a two-state dynamics is observed of the system, the time-averaged
structure is not able to capture the behavior along the whole trajectory and at least two
structures should be included in the evaluation of the AWA parameter.
IV. CONCLUSIONS
In this paper, we investigated diffusion of ethene and propene in a series of 8-ring zeolites
to assess the influence of topology, acidity and flexibility on the diffusion in confined zeolites
and zeotype materials. The study is inspired by the knowledge that diffusion of product
species is important to determine the selectivity in the methanol to olefin (MTO) process.
We have investigated the AEI, CHA and AFX topology which are all relevant for the MTO
process. In each of the cases we have considered the all silica and aluminophosphate versions
of the isostructural materials. Furthermore the influence of inclusion of acid sites is investi-
gated. To properly assess the influence of the flexibility of the material all MD simulations
were performed using a flexible force field, which was designed for the problem at hand.
First of all, some general features concerning the diffusivity were observed. As expected,
ethene diffuses much more easily than propene, and only for ethene it is meaningful to derive
Page 28 of 36
ACS Paragon Plus Environment
The Journal of Physical Chemistry
123456789101112131415161718192021222324252627282930313233343536373839404142434445464748495051525354555657585960
29
quantitative diffusion coefficients based on MD runs of 100-200 ns. Inclusion of acid sites
in the material yields a slower diffusion, and diffusion is in general faster in AlPO/SAPO
materials than in SSZ/H-SSZ materials. In general diffusion of ethene is an activated process,
meaning that the molecule spends most of the time within a cage and occasionally hops from
one cage to the other. To jump from one cage to the other a free energy has to be overcome,
which may differ quite substantially depending on the nature of the ring. Apparently, some
rings have identical characteristics such as ring topology and ring composition but still show
different ring crossings.
A new molecular descriptor had to be introduced to find a good correlation with the
number of ring crossings, namely the accessible window area (AWA), which measures the free
space available for ethene molecules. The concept is inspired by the accessible surface area
that is often used in implicit solvation models. The free energy barriers for the individual
rings can be correlated with the AWA parameter, which may be assessed along the MD
trajectories.
For some materials such as SAPO-18, framework dynamics contributed to large changes
in the diffusivity in terms of temperature. Indeed at lower temperature, SAPO-18 shows
low diffusivity whereas at higher temperatures structural transformations at the level of the
individual rings have taken place which contribute to a larger diffusivity. The observed ef-
fects can also be explained in terms of the newly introduced AWA descriptor. Summarizing,
this study has shown that overall observed diffusivity is determined by molecular character-
istics of individual rings for which proper descriptors need to be used. The new descriptor
as introduced here should be applicable to other materials and provides a good basis for
studying the molecular factors controlling diffusion.
ACKNOWLEDGEMENT
The computational resources and services used were provided by Ghent University (Stevin
Supercomputer Infrastructure). Funding was received from the Research Board of Ghent
University (BOF), the Foundation of Scientific Research - Flanders (FWO), and BEL-
SPO in the frame of IAP/7/05. V. Van Speybroeck acknowledges funding from the Euro-
pean Research Council under the European Community’s Seventh Framework Programme
(FP7(2007-2013) ERC grant agreement number 240483), and from the European Union’s
Page 29 of 36
ACS Paragon Plus Environment
The Journal of Physical Chemistry
123456789101112131415161718192021222324252627282930313233343536373839404142434445464748495051525354555657585960
30
Horizon 2020 research and innovation programme (consolidator ERC grant agreement No
647755 - DYNPOR (2015-2020)). G. Sastre thanks the Spanish government for the provision
of Severo Ochoa project (SEV 2012-0267) and SGAI-CSIC for computing time.
1 V. Van Speybroeck, K. Hemelsoet, L. Joos, M. Waroquier, R. G. Bell, and C. R. A. Catlow.
Advances In Theory And Their Application Within The Field Of Zeolite Chemistry. Chem. Soc.
Rev., pages –, 2015.
2 IZA database. http://www.iza-structure.org/databases. Accessed: 2015-08-22.
3 C. Baerlocher, L. B. McCusker, and D. H. Olson. Atlas of Zeolite Framework Types, 6th Ed.,
Elsevier, Amsterdam, 2007.
4 A. Corma. From Microporous To Mesoporous Molecular Sieve Materials And Their Use In
Catalysis.Chem. Rev., 97(6):2373–2420, 1997.
5 D. E. De Vos, M. Dams, B. F. Sels, and P. A. Jacobs. Ordered Mesoporous And Microporous
Molecular Sieves Functionalized With Transition Metal Complexes As Catalysts For Selective
Organic Transformations. Chem. Rev., 102(10):3615–3640, 2002.
6 W. Vermeiren and J.-P. Gilson. Impact Of Zeolites On The Petroleum And Petrochemical
Industry. Topics In Catalysis, 52(9):1131–1161, 2009.
7 P. A. Jacobs, M. Dusselier, and B. F. Sels. Will Zeolite-Based Catalysis Be As Relevant In
Future Biorefineries As In Crude Oil Refineries? Angew. Chem. Int. Ed., 53(33):8621–8626,
2014.
8 A. Primo and H. Garcia. Zeolites As Catalysts In Oil Refining. Chem. Soc. Rev., 43(22):7548–
7561, 2014.
9 M. Stocker. Methanol-To-Hydrocarbons: Catalytic Materials And Their Behavior.
Micropor. Mesopor. Mater., 29:3, 1999.
10 U. Olsbye, S. Svelle, M. Bjørgen, P. Beato, T. V. W. Janssens, F. Joensen, S. Bordiga, and K. P.
Lillerud. Conversion Of Methanol To Hydrocarbons: How Zeolite Cavity And Pore Size
Controls Product Selectivity. Angew. Chem. Int. Ed., 51:5810–5831, 2012.
11 K. Hemelsoet, J. Van der Mynsbrugge, K. De Wispelaere, M. Waroquier, and V. Van Spey-
broeck. Unraveling The Reaction Mechanisms Governing Methanol-To-Olefins Catalysis By
Page 30 of 36
ACS Paragon Plus Environment
The Journal of Physical Chemistry
123456789101112131415161718192021222324252627282930313233343536373839404142434445464748495051525354555657585960
31
Theory And Experiment. ChemPhysChem, 14:1526, 2013.
12 J. F. Haw, W. Song, D. M. Marcus, and J. B. Nicholas. The Mechanism Of Methanol
To Hydrocarbon Catalysis. Acc. Chem. Res., 36:317–326, 2003.
13 F. Bleken, M. Bjorgen, L. Palumbo, S. Bordiga, S. Svelle, K. P. Lillerud, and U. Olsbye. The
Effect of Acid Strength On the Conversion Of Methanol to Olefins Over Acidic Microporous
Catalysts With the CHA Topology. Topics in Catal., 52(3):218–228, 2009.
14 B. P. C. Hereijgers, F. Bleken, M. H. Nilsen, S. Svelle, K.-P. Lillerud, M. Bjrgen, B. M. Weckhuy-
sen, and U. Olsbye. Product Shape Selectivity Dominates the Methanol-to-Olefins (Mto)
Reaction Over H-SAPO-34 Catalysts. J. Catal., 264(1):77–87, 2009.
15 I. M. Dahl and S. Kolboe. On the Reaction-Mechanism for Propene Formation in the
MTO Reaction Over SAPO-34. Catal. Lett., 20:329–336, 1993.
16 I. M. Dahl and S. Kolboe. On the Reaction Mechanism for Hydrocarbon Formation from
Methanol Over SAPO-34: 1. Isotopic Labeling Studies of the Co-Reaction Of Ethene and
Methanol. J. Catal.,149:458–464, 1994.
17 I. M. Dahl and S. Kolboe. On the Reaction Mechanism for Hydrocarbon Formation from
Methanol Over SAPO-34: 2. Isotopic Labeling Studies of the Co-Reaction Of Propene and
Methanol. J. Catal., 161(1):304–309, 1996.
18 D. Lesthaeghe, V. Van Speybroeck, G. B. Marin, and M. Waroquier. Understanding the Failure
of Direct Cc Coupling in the Zeolite-Catalyzed Methanol-to-Olefin Process. Angew. Chem. Int.
Ed., 45(11):1714–1719, 2006.
19 D. Lesthaeghe, V. Van Speybroeck, G. B. Marin, and M. Waroquier. The Rise And Fall Of
Direct Mechanisms in Methanol-to-Olefin Catalysis: An Overview of Theoretical Contributions.
Ind. Eng. Chem. Res., 46(26):8832–8838, 2007.
20 V. Van Speybroeck, K. De Wispelaere, J. Van der Mynsbrugge, M. Vandichel, K. Hemelsoet,
and M. Waroquier. First Principle Chemical Kinetics in Zeolites: The Methanol-to-Olefin
Process As a Case Study. Chem. Soc. Rev., 43(21):7326–7357, 2014.
21 J. Karger. Comment on “PFG NMR Self-Diffusion of Small Hydrocarbons in High Silica
DDR, CHA And LTA Structures” [micropor. mesopor. mater. 109 (2008) 327]. Micropor.
Mesopor. Mat., 116:715–717, 2008.
22 A. Vidoni and D. M. Ruthven. Experimental Self-Diffusion Coefficients of C2H6 and C2H4 in
DDR. Ind. Eng. Chem. Res., 51:1383, 2012.
Page 31 of 36
ACS Paragon Plus Environment
The Journal of Physical Chemistry
123456789101112131415161718192021222324252627282930313233343536373839404142434445464748495051525354555657585960
32
23 W. Dai, M. Scheibe, L. Li, N. Guan, and M. Hunger. Effect of the Methanol-to-Olefin
Conversion on the Pfg Nmr Self-Diffusivities of Ethane and Ethene In Large-Crystalline
SAPO-34. J. Phys. Chem. C, 116(3):2469–2476, 2012.
24 J. Karger and D. M. Ruthven. Diffusion in Zeolites and Other Microporous Solids, page 605.
John Wiley, New York, USA, 1992.
25 J. Karger. Transport Phenomena in Nanoporous Materials. ChemPhysChem, 16:24–51, 2015.
26 B. Smit and T. L. M. Maesen. Molecular Simulations Of Zeolites: Adsorption, Diffusion,
and Shape Selectivity. Chem. Rev., 108:4125–4184, 2008.
27 M. A. Granato, J. Miguel, T. J. H. Vlugt, and A. E. Rodrigues. Diffusion Of Propane, Propylene
and Isobutane In 13X Zeolite by Molecular Dynamics. Chem. Eng. Sci., 65:2656–2663, 2010.
28 C. Wang, B. Li, Y. Wang, and Z. Xie. Insight into The Topology Effect On The Diffusion Of
Ethene and Propene in Zeolites: A Molecular Dynamics Simulation Study. J. Energy Chem.,
22:914–918,2013.
29 G. Sastre. Computational Study of Diffusion of Propane In Small Pore Acidic Zeotypes AFX
and AEI. Catal. Today, 226:25–36, 2014.
30 A. F. Combariza, D. A. Gomez, and G. Sastre. Simulating the Properties of Small Pore
Silica Zeolites Using Interatomic Potentials. Chem. Soc. Rev., 42:114–127, 2013.
31 A. J. O’Malley and C. R. A. Catlow. Molecular Dynamics Simulations Of Longer N-Alkanes
in Silicalite: A Comparison Of Framework And Hydrocarbon Models. Phys. Chem. Chem.
Phys., 15(43):19024–19030, 2013.
32 A. J. O’Malley and C. R. A. Catlow. Molecular Dynamics Simulations Of Longer N-Alkanes
In Silicalite: State-Of-The-Art Models Achieving Close Agreement With Experiment. Phys. Chem.
Chem. Phys., 17(3):1943–1948, 2015.
33 R. V. Awati, P. I. Ravikovitch, and D. S. Sholl. Efficient And Accurate Methods For
CharacterizingEffects Of Framework Flexibility on Molecular Diffusion In Zeolites: CH4 Diffusion In
Eight Member Ring Zeolites. J. Phys. Chem. C, 117(26):13462–13473, 2013.
34 R. Krishna and J. M. van Baten. A Molecular Dynamics Investigation Of The Diffusion
Character-Istics of Cavity-Type Zeolites With 8-Ring Windows. Micropor. Mesopor. Mater.,
137(13):83–91, 2011.
35 A. Garcıa-Sanchez, D. Dubbeldam, and S. Calero. Modeling Adsorption And Self-Diffusion
Of Methane In Lta Zeolites: The Influence Of Framework Flexibility. J. Phys. Chem. C,
Page 32 of 36
ACS Paragon Plus Environment
The Journal of Physical Chemistry
123456789101112131415161718192021222324252627282930313233343536373839404142434445464748495051525354555657585960
33
114(35):15068–15074, 2010.
36 S. Jakobtorweihen, M. G. Verbeek, C. P. Lowe, F. J. Keil, and B. Smit. Understanding The
Loading Dependence Of Self-Diffusion In Carbon Nanotubes. Phys. Rev. Lett., 95:044501,
2005.
37 S. Jakobtorweihen, C. P. Lowe, F. J. Keil, and B. Smit. A Novel Algorithm To Model
The Influence Of Host Lattice Flexibility In Molecular Dynamics Simulations: Loading
Dependence Of Self-Diffusion In Carbon Nanotubes. J. Chem. Phys., 124:154706, 2006.
38 S. Jakobtorweihen, C. P. Lowe, F. J. Keil, and B. Smit. Diffusion Of Chain Molecules And
Mixtures In Carbon Nanotubes: The Effect Of Host Lattice Flexibility And Theory Of Diffusion
In The Knudsen Regime. J. Chem. Phys., 127:024904, 2007.
39 N. E. R. Zimmermann, M. Haranczyk, M. Sharma, B. Liu, B. Smit, and F. J. Keil. Adsorption
And Diffusion In Zeolites: The Pitfall Of Isotypic Crystal Structures. Mol. Simul., 37:986–989,
2011.
40 B. Smit and R. Krishna. Molecular Simulations In Zeolitic Process Design. Chemical Engineering
Science, 58(36):557–568, 2003.
41 S. E. Boulfelfel, P. I. Kavikovitch, and D. S. Sholl. Modeling Diffusion Of Linear Hydrocarbons
In Silica Zeolite LTA Using Transition Path Sampling. J. Phys. Chem. C., 119:15643–15653,
2015.
42 M. K. F. Abouelnasr and B. Smit. Diffusion In Confinement: Kinetic Simulations Of Self-
And Collective Diffusion Behavior Of Adsorbed Gases. Phys. Chem. Chem. Phys., 14(33):11600–
11609, 2012.
43 P. Demontis and G. B. Suffritti. A Comment On The Flexibility Of Framework In
Molecular Dynamics Simulations Of Zeolites. Micropor. Mesopor. Mater., 125(12):160–168,
2009.
44 S. Fritzsche, M. Wolfsberg, and R. Haberlandt. The Importance of Various Degrees Of Freedom
In the Theoretical Study Of The Diffusion Of Methane In Silicalite-1. Chemical Physics,
289(23):321– 333, 2003.
45 N. E. R. Zimmermann, S. Jakobtorweihen, E. Beerdsen, B. Smit, and F. J. Keil. In-Depth
Study Of The Influence Of Hostframework Flexibility On The Diffusion Of Small Gas
Molecules In One-Dimensional Zeolitic Pore Systems. J. Phys. Chem. C, 111(46):17370–17381,
2007.
Page 33 of 36
ACS Paragon Plus Environment
The Journal of Physical Chemistry
123456789101112131415161718192021222324252627282930313233343536373839404142434445464748495051525354555657585960
34
46 R. Krishna and J. M. van Baten. Comment on ”Modeling Adsorption And Self-Diffusion
Of Methane In Lta Zeolites: The Influence Of Framework Flexibility”. J. Phys. Chem. C,
114(41):18017–18021, 2010.
47 G. Sastre and J. D. Gale. ZeoTsites: A Code For Topological And Crystallographic
Tetrahedral Sites Analysis In Zeolites And Zeotypes. Micropr. Mesopor. Mater., 43:27–40,
2001.
48 G. Sastre and A. Corma. Topological Descriptor For Oxygens In Zeolites. Analysis Of Ring
Counting In Tetracoordinated Nets. J. Phys. Chem. C, 113:6398–6405, 2009.
49 J. Chen, J. M. Thomas, P. A. Wright, and R. P. Townsend. Silicoaluminophosphate Number
Eighteen (SAPO-18): A New Microporous Solid Acid Catalyst. Catal. Lett., 28(2-4):241–248,
1994.
50 N. Katada, K. Nouno, J. K. Lee, J. Shin, S. B. Hong, and M. Niwa. Acidic Properties Of
Cage- Based, Small-Pore Zeolites With Different Framework Topologies And Their
Silicoaluminophosphate Analogues. J. Phys. Chem. C, 115(45):22505–22513, 2011.
51 S. T. Wilson, R. W. Broach, C. S. Blackwell, C. A. Bateman, N. K. McGuire, and R. M.
Kirchner. Synthesis, Characterization And Structure Of SAPO-56, A Member Of The Abc
Double- Six-Ring Family Of Materials With Stacking Sequence aabbccbb. Micropor.
Mesopor. Mater., 28(1):125–137, 1999.
52 G. Sastre, D. W. Lewis, and C. R. A. Catlow. Structure And Stability Of Silica Species In
SAPO
Molecular Sieves. J. Phys. Chem., 100(16):6722–6730, 1996.
53 G. Sastre, D. W. Lewis, and C. R. A. Catlow. Modeling Of Silicon Substitution In SAPO-5 And
SAPO-34 Molecular Sieves. J. Phys. Chem. B, 101(27):5249–5262, 1997.
54 K. Hemelsoet, A. Ghysels, D. Mores, K. De Wispelaere, V. Van Speybroeck, B. M. Weckhuysen,
and M. Waroquier. Experimental And Theoretical IR Study Of Methanol And Ethanol
Conversion Over H-SAPO-34. Cat. Today, 177(1):12–24, 2011.
55 P. Demontis and G. B. Suffritti. Structure And Dynamics Of Zeolites Investigated By
Molecular
Dynamics. Chem. Rev., 97(8):2845–2878, 1997.
56 R. Krishna. Diffusion In Porous Crystalline Materials. Chem. Soc. Rev., 41:3099–3118, 2012.
57 W. Smith, C. W. Yong, and P. M. Rodger. DL POLY: Application To Molecular Simulation.
Page 34 of 36
ACS Paragon Plus Environment
The Journal of Physical Chemistry
123456789101112131415161718192021222324252627282930313233343536373839404142434445464748495051525354555657585960
35
Mol. Simul., 28(5):385–471, 2002.
58 Y. G. Bushuev and G. Sastre. Atomistic Simulations Of Water And Organic Templates
Occluded During The Synthesis Of Zeolites. Micropor. Mesopor. Mater., 129(12):42–53, 2010.
59 Y. G. Bushuev and G. Sastre. Atomistic Simulations Of Structural Defects And Water
Occluded in ssz-74 Zeolite. J. Phys. Chem. C, 113(25):10877–10886, 2009.
60 J. D. Gale and N. J. Henson. Derivation Of Interatomic Potentials For Microporous
Aluminophos- Phates From The Structure And Properties Of Berlinite. J. Chem. Soc.,
Faraday Trans., 90:3175–3179, 1994.
61 K.-P. Schroder, J. Sauer, M. Leslie, C. Richard, A. Catlow, and J. M. Thomas. Bridging Hydroxyl
Groups In Zeolitic Catalysts: A Computer Simulation Of Their Structure, Vibrational Properties
And Acidity In Protonated Faujasites (H-Y Zeolites). Chem. Phys. Lett., 188(34):320–325,
1992.
62 J. D. Gale and A. L. Rohl. The General Utility Lattice Program (Gulp). Mol. Simul.,
29(5):291–341, 2003.
63 T. Oie, G. M. Maggiora, R. E. Christoffersen, and D. J. Duchamp. Development Of A
Flexi- Ble Intra- And Intermolecular Empirical Potential Function For Large Molecular
Systems. Int. J. Quantum Chem., 20(S8):1–47, 1981.
64 A. F. Combariza, G. Sastre, and A. Corma. Molecular Dynamics Simulations Of The Diffusion
Of Small Chain Hydrocarbons In 8-Ring Zeolites. J. Phys. Chem. C, 115(4):875–884, 2011.
65 W. Smith and T.R. Forester. DL POLY 2.0: A General-Purpose Parallel Molecular
Dynamics Simulation Package. J. Mol. Graph., 14(3):136–141, 1996.
66 P. Tschaufeser and S. C. Parker. Thermal Expansion Behavior Of Zeolites And Alpo4s. J. Phys
Chem., 99(26):10609–10615, 1995.
67 D. A. Woodcock, P. Lightfoot, L. A. Villaescusa, M.-J. Dıaz-Cabanas, M. A. Camblor, And
D. Engberg. Negative Thermal Expansion In The Siliceous Zeolites Chabazite And Itq-4: A
Neutron Powder Diffraction Study. Chem. Mater., 11(9):2508–2514, 1999.
68 J. D. Gale. Analytical Free Energy Minimization Of Silica Polymorphs. J. Phys. Chem.
B, 102(28):5423–5431, 1998.
69 M. M. Martınez-Inesta and R. F. Lobo. Investigation Of The Negative Thermal Expansion
Mech- Anism Of Zeolite Chabazite Using The Pair Distribution Function Method. J. Phys.
Page 35 of 36
ACS Paragon Plus Environment
The Journal of Physical Chemistry
123456789101112131415161718192021222324252627282930313233343536373839404142434445464748495051525354555657585960
36
Chem. B, 109(19):9389–9396, 2005.
70 B. W. H. van Beest, G. J. Kramer, and R. A. van Santen. Force Fields For Silicas And
Alu- Minophosphates Based On Ab Initio Calculations. Phys. Rev. Lett., 64(16):1955–1958,
1990.
71 A. F. Combariza, G. Sastre, and A. Corma. Propane/Propylene Diffusion In Zeolites: Framework
Dynamics. J. Phys. Chem. C, 113:11246–11253, 2009.
72 N. Hedin, G. J. DeMartin, W. J. Roth, K. G. Strohmaier, and S. R. Reyes. Experimental Self-
Diffusion Coefficients Of Methane, Ethene, Ethane And Propene in DDR, CHA and LTA.
Micropor. Mesopor. Mater., 109:327, 2008.
73 D. H. Olson, M. A. Camblor, L. A. Villaescusa, and G. H. Kuehl. Light Hydrocarbon Sorption
Properties Of Pure Silica Si-Cha And Itq-3 And High Silica zsm-58. Micropor. Mesopor.
Mat., 67:27–33, 2004.
74 D. M. Ruthven and S. C. Reyes. Adsorptive Separation Of Light Olefins From Paraffins.
Micropor. Mesopor. Mat., 104:59–66, 2007.
75 N. A. Ramsahye and R. G. Bell. Calculating The Energy Barriers To Sodium Cation
Motion Through The Six-Rings Of Zeolite Y. Micropor. Mesopor. Mater., 109:405–412, 2007.
76 J. Chen and C. L. Brooks III. Implicit Modeling Of Nonpolar Solvation For Simulating
Protein Folding And Conformational Transitions. Phys. Chem. Chem. Phys., 10:471–481, 2008.
Page 36 of 36
ACS Paragon Plus Environment
The Journal of Physical Chemistry
123456789101112131415161718192021222324252627282930313233343536373839404142434445464748495051525354555657585960