pages from 59679rv06 pro03 pri 06 print ready - 87-792
TRANSCRIPT
Vote 09 Department: Economic Development, Environmental Affairs and Tourism
Table 1: Summary of departmental allocation R’000 To be appropriated by Vote in 2019/20
Responsible MEC
Administrating Department
Accounting Officer
R 1 481 960 MEC of Finance, Economic Development, Environmental Affairs and Tourism Department of Economic Development, Environmental Affairs and Tourism Head of Department
1. Overview
1.1 Vision
Sustainable development underpinned by economic growth and sound environmental management.
1.2 Mission
To lead economic development and environmental management in the Eastern Cape.
1.3 Core functions and responsibilities
The core functions of the department are summarised as follows:
To drive economic growth and development in the Eastern Cape;
To develop and promote the provincial tourism sector;
To provide consumer protection services, gambling and betting regulations, trade inspection andregulate the liquor industry; and
To develop regulatory frameworks and monitor the implementation of policies for the protection ofbiodiversity and environment in the province.
1.4 Main Services
Coordinate all strategic initiatives relating to the creation of decent work through inclusive economicgrowth; including the implementation of the New Growth Path (NGP) and the aligned provincialgrowth strategies
Develop and utilise strategic frameworks and partnerships for the support and promotion ofsustainable Small Medium and Micro Enterprises (SMMEs) and Cooperatives as well as supportlocal procurement in the province
Promote economic growth and development of local economies in partnership with key stakeholdersby aligning Local Economic Development (LED) initiatives with government programmes as well ascreating and facilitating an enabling environment for implementation. This includes small townrevitalisation and the development of township economies
Increase the number of jobs created through sector and cluster development and supportsustainable initiatives in agro-processing, manufacturing and the revitalisation of old industrial parks.
543
Estimates of the Provincial Revenue and Expenditure (EPRE) - 2019/20 Financial Year
Facilitate the development of strategic infrastructure projects that will stimulate the competitivenessof priority sectors in the provincial economy. Focus is placed on socio-economic infrastructure,Operation Phakisa, the Black Industrialisation Programme and support of Strategic InfrastructureProgrammes (SIPs)
Promote consumer rights, develop systems for effective regulation of the liquor, gambling and bettingindustries in the province
Provide credible information and databank that informs economic policy and planning processes.
Establish, implement and maintain effective systems to manage the sustainable utilisation ofbiological resources and conservation of ecosystems
Establish, implement and maintain effective systems using environmental legislation to protect theenvironment and implement environmental awareness programmes to empower communities
Facilitate informed environmental decision-making through the implementation of comprehensiveenvironmental planning and coordination mechanisms.
1.5 Demands for and expected changes in the services
DEDEAT is the centre for economic growth and sustainable development through collaboration, co-ordination, facilitation, integration and support provided to all Economic Development (ED) cluster departments in order to improve economic growth and sustainable development. The province is faced with high unemployment rate as well as high level of inequality and distribution of income. Furthermore, de-industrialisation and the poor investor climate create a challenging environment for the department to create economic opportunities for investment and associated job creation. The Provincial Economic Development Strategy (PEDS) and the Jobs Strategy require a new set of industrial skills in areas such as petrochemicals, green technology manufacturing, agro-processing and auto-manufacturing.
An additional mandate to the departmental is the interventions for Integrated Social Infrastructure Development programme (ISIDP) for the ongoing housing project at Nelson Mandela Bay Metropolitan. Over the 2019 MTEF, the focus will be on the coordination and implementation of key economic projects to stimulate economic growth and development in the province.
The department foresees an increased demand on skills development programmes and applications for financial and non-financial support from SMME’s and cooperatives. Although the skills development programmes at Easter Cape Development Corporation (ECDC) and Coega Development Corporation (CDC) should be able to meet the demand for skills, the department may not have sufficient financialresources to meet the needs for support to the SMME and cooperative sectors.
1.6 The Acts, rules and regulations
The department operates in a highly regulated environment, with more than 100 Acts and Regulations that serve as operational boundaries of the DEDEAT Group (department and its six public entities). The following key acts, rules and regulations are applicable to the core functions of the department: Consumer Protection Act, 2008; Broad Based Black Economic Empowerment Amended Act, 2013; Co-operatives Bank Act, 2005; Amended Co-operatives Act, 2013; National Gambling and Betting Act, 2008; National Small Business Act, 1996; National Liquor Act, 2003; Eastern Cape Liquor Act, 2003; Unfair Business Act, 1998; National Credit Act, 2006; Eastern Cape Eastern Cape Gambling Amendment Act, 1 of 2015; Eastern Cape Development Corporation Act, 1997; Eastern Cape Parks and Tourism Agency Act, 2010; Nature Conservation Ordinance, 1974; Environmental Management Act, 1998; Environmental Conservation Act, 1998; National Environmental Management Air Quality Act, 2004; National Environmental Management Biodiversity Act, 2004; National Environmental Management Integrated Coastal Management Act, 2008; National Environmental Management Waste Act, 2008; National Environmental Management Protected Areas Act, 2009, and Special Economic Zones Act, 2014.
544
Department: Economic Development, Environmental Affairs and Tourism
1.7 Budget decisions
The current economic climate and the constraints placed on the provincial financial resources has directed the department to prioritise its budget allocation within its programmes within the limited resources. The department will continue with its untiring efforts of donor mobilisation and working with private sector in order to leverage on their resources in projects where there are common goals.
The department aims to ensure that resources are allocated to meet provincial priorities and to improve the quality and effectiveness of spending within the sustainable fiscal limits. The departmental budget process guaranteed that existing budget are more closely aligned with policy priorities and objectives that are funded within the current aggregate expenditure ceiling.
Cost containment measures will continue to be applied by the department over the 2019 MTEF and value for money spending.
1.8 Aligning departmental budgets to achieve government’s prescribed outcomes
The departmental budget is supported by a Strategic Plan (SP), Annual Performance Plan (APP) that has been aligned to the Medium Term Strategic Framework (MSTF) and Provincial Development Plan (PDP). Decent employment through inclusive economic growth and sustainable livelihoods are the cornerstone objectives of Outcome 4. The department has aligned it plans to this national outcome by promoting the Green Economy through extensive collaboration with communities and local municipalities in creating EPWP-led initiatives and investing in research, skills and capacity development. In addition, the department will further align its budget with market development and promote the manufacturing of solar, bio-energy and wind energy generation capabilities and applications and supporting the creation of Green Jobs in the Tourism and Environmental Management sectors. The department will also further support Local and Regional Economic Development projects, SMMEs and co-operatives to stimulate the sustainable economic growth and development in the province.
In support of Outcome 5 (a skilled and capable workforce to support an inclusive growth path), the department will contribute to enhancing the skills-base of the province through various capacity and skills development initiatives.
Although the mandate of the department does not include building social and economic infrastructure, it supports Outcome 6 through the existing infrastructure build programme being implemented by the ECDC and CDC.
Outcome 7 (rural development, land and agrarian reform, and food security) is supported through collaboration with DRDAR. The Trade and Sector Development unit needs to undertake market development and export promotion which links farmers to markets, supporting sustainable economic development initiatives in agriculture and influencing collaborating departments to improve road networks linking farm and non-farm activities in strategic rural locations.
Economic growth must be balanced against sustainable resource management and use (Outcome 10). In doing so, the department develops guidelines for the protection and promotion of bio-cultural diversity; promotes the use of cleaner technologies to enhance environmental quality and supports initiatives to identify and commercialise alternate energy production.
545
Estimates of the Provincial Revenue and Expenditure (EPRE) - 2019/20 Financial Year
2. Review of the current financial year (2018/19)
2.1 Key achievements
Trade and sector development created 15 490 jobs opportunities through the attraction of 11 investments into the SEZ’s at a value of approximately R1.720 billion. ECDC facilitated a further 2 570 youth jobs by contributing to eradicate unemployment in the province. The contribution to skills development has seen over 4 532 people trained in prioritised sectors against the annual target of 6 154 people. The department supported the implementation of three (3) socio-economic infrastructure projects against the annual target of four (4).
In respect of Local and Regional Economic Development (LRED), four (4) projects were funded against the revised annual target of eight (8). The department met the target of 17 projects supported on agro-processing, manufacturing, and sustainable energy sectors in response to Provincial Economic Development Strategy (PEDS) to improve skills development, infrastructure development and youth empowerment. In addition, working with Eastern Cape Parks and Tourism Agency (ECPTA), the department increased hospitality revenue by R3.9 million against the annual target of R5.5 million through accommodation establishment in the reserves owned by the ECPTA.
In respect of the Integrated economic development services, the department provided 177 SMMEs and 49 co-operatives with non-financial support in the form of business management training, development of business plans, and marketing against the revised annual target of 150 SMME’s and 98 co-operatives.
Furthermore, 136 SMME’s and 17 co-operatives were provided with development finance against the annual target of 200 SMME’s and 20 co-operatives. Three (3) incubation programmes were supported against the annual target of six (6).
In an effort to improve liquor regulation in the province, the department through the ECLB processed 69.3 per cent of liquor license applications within the legislated 60 working days against the annual target of 100 per cent. The ECLB has undertaken 10 social responsibility programmes on alcohol abuse against the annual target of five (5), whilst the ECGBB implemented 11 responsible gambling programmes against the annual target of 16.
In order to improve compliance to environmental legislation, the department processed 99.1 per cent of the Environmental Impact Assessments (EIA) within legislated timeframes against the annual target of 100 per cent. In support of conservation efforts and creating awareness 28 environmental awareness activities and 25 environmental capacity building were held throughout the province against the annual target of 25 and 27, respectively. Furthermore, 362 work opportunities have been created through environmental programmes against the annual target of 839.
2.2 Key challenges
The quality of applications for Local and Regional Economic Development (LRED) project fundingremains a challenge.
The province did not have its own legislation governing the SEZs apart from the Special EconomicZones Act as a result of the co-funding model that is not yet finalised.
The online application and management of biodiversity permits that was being developed andsupported by SITA was not completed as planned. As a result, the department continues to makeuse of manual permitting system.
546

Department: Economic Development, Environmental Affairs and Tourism
3. Outlook for the coming financial year (2019/20)
The department aims to attract 15 investors worth approximately R2.790 billion in 2019/20 and continue work on the realisation of the SEZ transitioning in 2019/20. The department intends to create 27 890 jobs while simultaneously contributing to skills and development by training approximately 5 373 people. Through the ECDC, the department intends to support four (4) socio-economic infrastructure projects to be implemented throughout the Province.
An amount of R339.402 million is being ring-fenced in 2019/20 to the department for the provincial economic stimulus to fund economic development projects that will contribute to the GDP of the province. Expenditure is contingent on the successful submission of credible business plans by Provincial Departments and Entities.
The department will support 150 SMMEs with non-financial support such as business training, development of plans and marketing. The ECDC will disburse approximately R95 million as SMME loans. In line with the Department of Small Business Development support programme for incubators, the department intends to support three (3) incubation programmes such as the Chemistry Incubation (CHEMIN), Cortex hub, as well as Eastern Cape Information Technology Initiative (ECITI), which are housed at the ELIDZ.
Local and Regional Economic Development (LRED) projects funded will be 10 at local and regional levels. Furthermore, 17 projects in the agro-processing, manufacturing and sustainable energy sectors will be supported in line with the Provincial Economic Development Strategy (PEDS) in order to improve skills development, infrastructure development and youth empowerment. Tourism development and transformation is prominent on the policy agenda and will receive focus through the implementation of the Provincial Tourism Master Plan, which is ending soon. In addition, working with the ECPTA, the Department aims to increase hospitality revenue but at least R7.3 million through accommodation establishments in the reserves owned by the ECPTA.
Through the ECLB the department will process all (100 per cent) fully compliant liquor license applications, as well as undertake eight (8) social responsibility programmes. Only one (1) gambling license is targeted for 2019/20, to be issued through the ECGBB. This will further enhance revenue collection going forward. A target of R200 million has been set for revenue collection through the ECGBB. The ECGBB will implement 14 responsible gambling programmes throughout the province. Through the Consumer awareness programme, the department plans to reach 9 050 participants through six (6) consumer education programmes and other consumer protection initiatives.
In support of sustainable environmental management and sustainable economic development the department will strive to process all environmental-related applications within legislated timeframes. The department under biodiversity programme intends to issue 1 700 Threatened or Protected Species (TOPS) permits in 2019/20.
Environmental awareness and capacity building activities will continue to play an important role in educating the public on environmental issues. As such, the department will conduct a total of 28 environmental awareness and 25 capacity building activities throughout the province. There are also plans to create approximately 600 work opportunities through environmental programmes.
547
Estimates of the Provincial Revenue and Expenditure (EPRE) - 2019/20 Financial Year
4. Reprioritisation
Cost containment measures are currently in place and will continue over the MTEF. The drive to intensify cost containment measures has been monitored while introducing efforts that have reduced travelling costs for departmental meetings (regions and head office) through the introduction of video conferencing and catering is procured when necessary in line with the cost containment directives.
Non-core goods and services budget provisions were adjusted below the inflationary rate in the 2019 MTEF. The budget committee will continue to play an active role in ensuring that the programmes are spending as projected and the budget pressures are addressed through reprioritisation. The department’s has made a concerted effort to be visible to communities within the regions. This has increased the budget allocation for travelling and subsistence baseline.
The departmental budget is more stewed towards the core business to meet the departmental objectives and mandate through core programmes and Public entities.
5. Procurement
The department has a plan to start the procurement process earlier in the financial year to accelerate service delivery. That is to submit the business cases and terms of reference for assessment, by the departmental committees. The department will procure a number of projects through the bidding and quotation procurements processes. The department will further ensure efficient and cost effective procurement through bulk purchasing agreements. The department will continue to outsource some functions due to the limited capacity within the department. However, there will be an effort to transfer skills to departmental staff taking into consideration the gap analysis. The procurement processes will be aligned according to the implementation date of the projects as listed in the departments’ procurement plan.
6. Receipts and financing
6.1 Summary of receipts
Table 2: Summary of departmental receipts Outcome
Main appropriation
Adjusted appropriation
Revised estimate
Medium-term estimates
R thousand 2015/16 2016/17 2017/18 2019/20 2020/21 2021/22Equitable share 1 244 981 1 037 498 1 075 225 1 143 802 1 164 848 1 159 217 1 479 290 1 533 091 1 566 238 27.6
Conditional grants 1 370 2 026 2 554 2 204 2 204 2 204 2 670 – – 21.1
EPWP Intergrated Grants for Provinces 1 370 2 026 2 554 2 204 2 204 2 204 2 670 – –
Total receipts 1 246 351 1 039 524 1 077 779 1 146 006 1 167 052 1 161 421 1 481 960 1 533 091 1 566 238 27.6of which
Departmental receipts 230 282 201 567 206 230 218 333 218 333 219 070 230 560 243 240 256 376 5.2
% change from 2018/19
2018/19
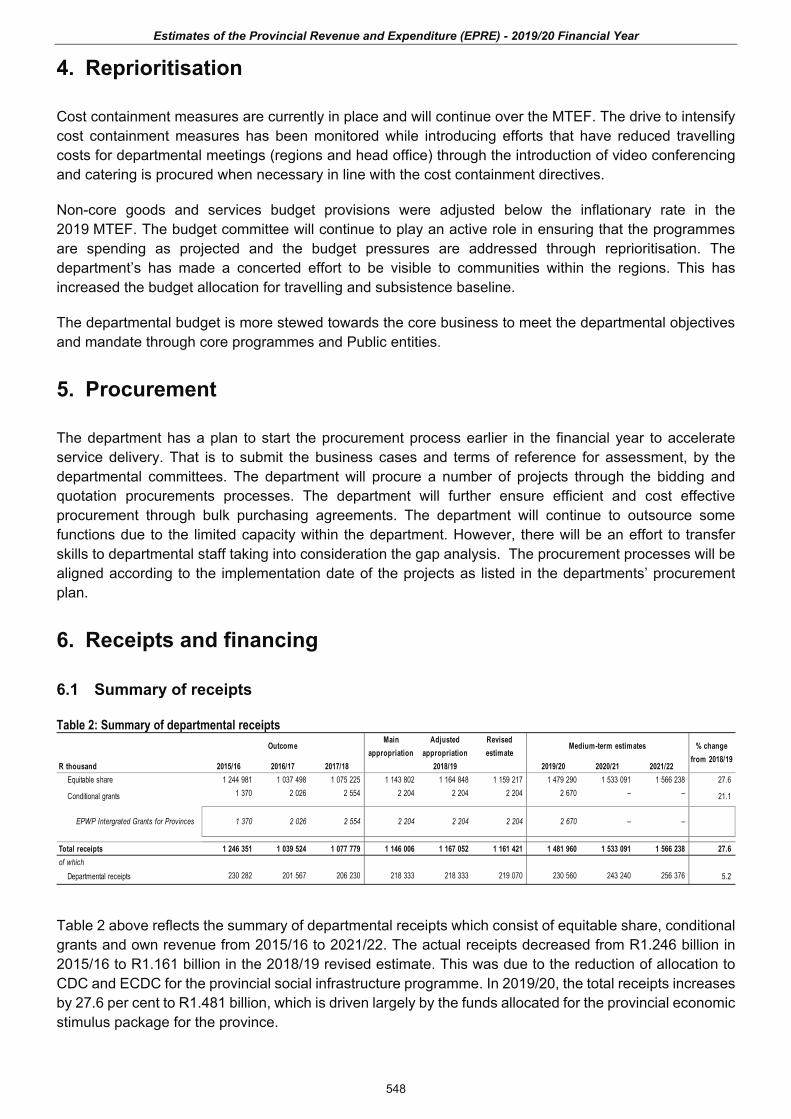
Table 2 above reflects the summary of departmental receipts which consist of equitable share, conditional grants and own revenue from 2015/16 to 2021/22. The actual receipts decreased from R1.246 billion in 2015/16 to R1.161 billion in the 2018/19 revised estimate. This was due to the reduction of allocation to CDC and ECDC for the provincial social infrastructure programme. In 2019/20, the total receipts increases by 27.6 per cent to R1.481 billion, which is driven largely by the funds allocated for the provincial economic stimulus package for the province.
548
Department: Economic Development, Environmental Affairs and Tourism
6.2 Departmental receipts collection
Table 3: Summary of departmental receipts and collection Outcome
Main appropriation
Adjusted appropriation
Revised estimate
Medium-term estimates
R thousand 2015/16 2016/17 2017/18 2019/20 2020/21 2021/22Tax receipts 183 996 194 108 200 873 216 210 216 210 217 113 228 319 240 875 254 124 5.2
Casino tax es 150 632 159 638 168 800 177 359 177 359 176 999 187 291 197 592 208 460 5.8Horse racing tax es 9 294 14 028 12 106 15 421 15 421 15 135 16 285 17 180 18 125 7.6Liquor licences 24 070 20 442 19 967 23 430 23 430 24 979 24 743 26 103 27 539 (0.9)Motor v ehicle licences – – – – – – – – –
Sales of goods and serv ices other than capital assets 1 071 1 197 1 187 1 359 1 359 1 311 1 433 1 513 1 353 9.3Transfers receiv ed – – – – – – – – – Fines, penalties and forfeits 514 1 019 465 – – 90 – – – (100.0)Interest, div idends and rent on land 73 325 117 680 680 458 719 758 800 57.0Sales of capital assets 149 – 178 – – – – – – Transactions in financial assets and liabilities 44 479 4 918 3 410 84 84 98 89 94 99 (9.2)
Total departmental receipts 230 282 201 567 206 230 218 333 218 333 219 070 230 560 243 240 256 376 5.2
% change from 2018/19
2018/19
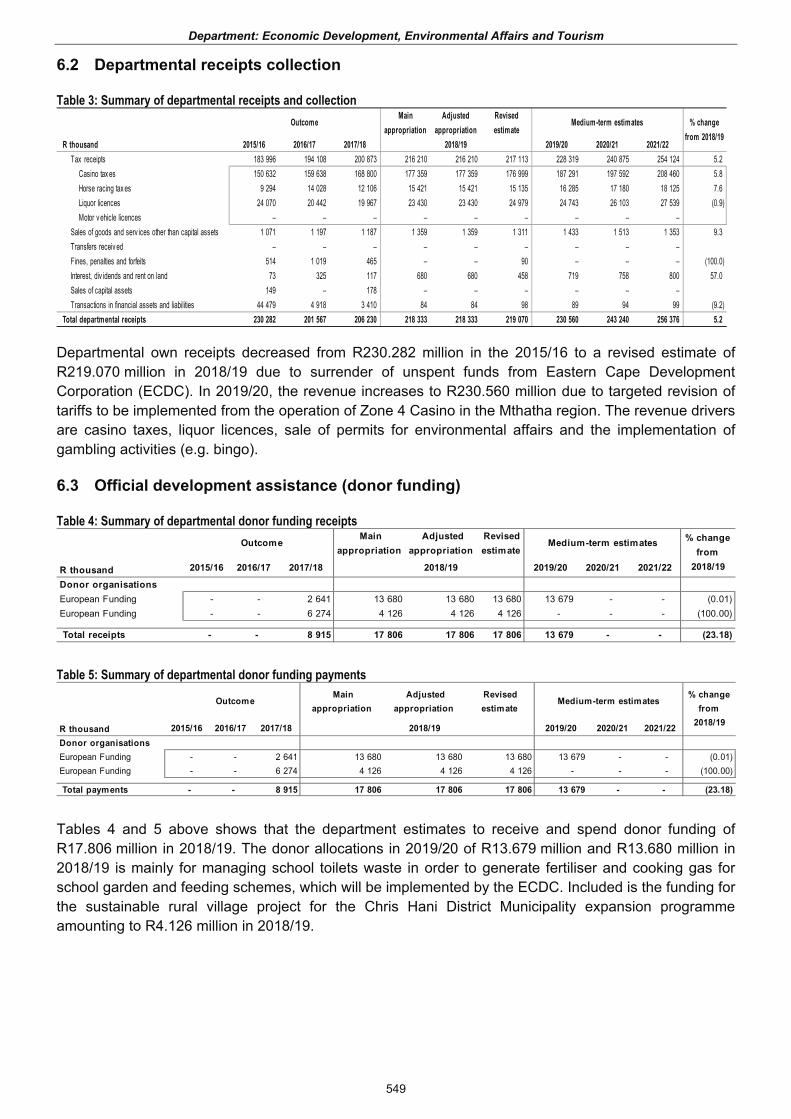
Departmental own receipts decreased from R230.282 million in the 2015/16 to a revised estimate of R219.070 million in 2018/19 due to surrender of unspent funds from Eastern Cape Development Corporation (ECDC). In 2019/20, the revenue increases to R230.560 million due to targeted revision of tariffs to be implemented from the operation of Zone 4 Casino in the Mthatha region. The revenue drivers are casino taxes, liquor licences, sale of permits for environmental affairs and the implementation of gambling activities (e.g. bingo).
6.3 Official development assistance (donor funding)
Table 4: Summary of departmental donor funding receipts Outcome
Mainappropriation
Adjusted appropriation
Revised estimate
Medium-term estimates
2015/16 2016/17 2017/18 2018/19 2019/20 2020/21 2021/22
- - 2 641 13 680 13 680 13 680 13 679 - - (0.01) - - 6 274 4 126 4 126 4 126 - - - (100.00)
- - 8 915 17 806 17 806 17 806 13 679 - - (23.18) Total receipts
European Funding
R thousand
% change from
2018/19
Donor organisationsEuropean Funding
Table 5: Summary of departmental donor funding payments Main
appropriation Adjusted
appropriation Revised estimate
2015/16 2016/17 2017/18 2018/19 2019/20 2020/21 2021/22
- - 2 641 13 680 13 680 13 680 13 679 - - (0.01) - - 6 274 4 126 4 126 4 126 - - - (100.00)
- - 8 915 17 806 17 806 17 806 13 679 - - (23.18) Total payments
European Funding
R thousand
% change from
2018/19
Donor organisationsEuropean Funding
Outcome Medium-term estimates
Tables 4 and 5 above shows that the department estimates to receive and spend donor funding of R17.806 million in 2018/19. The donor allocations in 2019/20 of R13.679 million and R13.680 million in 2018/19 is mainly for managing school toilets waste in order to generate fertiliser and cooking gas for school garden and feeding schemes, which will be implemented by the ECDC. Included is the funding for the sustainable rural village project for the Chris Hani District Municipality expansion programme amounting to R4.126 million in 2018/19.
549

Estimates of the Provincial Revenue and Expenditure (EPRE) - 2019/20 Financial Year
7. Payment summary
7.1 Key assumptions
The expectations for crafting this budget were to provide a framework to the departmental officials for setting priorities, determining service levels and allocating financial resources efficiently.
The following key assumptions were taken into consideration when this budget was formulated:
Salary increases were taken into account as per the guidelines of CPI plus 1 per cent;
Inflationary increases in other expenditure items are based on the following CPI rates: 5.4 per cent in 2019/20, 5.6. per cent in 2020/21 and 5.4 per cent in 2021/22; and
Cost containment measures to be implemented as much as possible in order to ensure an efficient use of fiscal resources.
7.2 Programme summary
Table 6: Summary of payments and estimates by programme Outcome
Main appropriation
Adjusted appropriation
Revised estimate
Medium-term estimates
R thousand 2015/16 2016/17 2017/18 2019/20 2020/21 2021/221. Administration 196 745 220 907 219 921 234 687 242 643 240 776 241 697 250 847 259 452 0.42. Economic Dev elopment And Tourism 760 022 522 790 569 345 591 542 611 626 608 613 904 203 928 342 942 001 48.63. Env ironmental Affairs 289 584 295 827 288 513 319 777 312 783 312 032 336 060 353 902 364 785 7.7Total payments and estimates 1 246 351 1 039 524 1 077 779 1 146 006 1 167 052 1 161 421 1 481 960 1 533 091 1 566 238 27.6
% change from 2018/19
2018/19
7.3 Summary of economic classification
Table 7: Summary of payments and estimates by economic classification Outcome
Main appropriation
Adjusted appropriation
Revised estimate
Medium-term estimates
R thousand 2015/16 2016/17 2017/18 2019/20 2020/21 2021/22Current payments 393 855 355 171 365 109 415 112 407 132 405 011 414 521 435 054 448 561 2.3
Compensation of employ ees 216 292 225 822 240 050 265 851 258 541 258 058 269 962 287 532 299 362 4.6Goods and serv ices 177 563 129 349 125 059 149 261 148 591 146 953 144 559 147 522 149 199 (1.6)Interest and rent on land – – – – – – – – –
Transfers and subsidies to: 756 996 648 398 668 698 684 702 742 751 739 671 1 028 147 1 088 387 1 107 502 39.0Prov inces and municipalities 76 132 26 501 13 038 13 450 13 450 12 789 18 956 20 731 21 631 48.2Departmental agencies and accounts 649 828 590 940 636 482 645 657 703 267 703 267 980 675 1 039 835 1 056 631 39.4Higher education institutions 3 433 3 042 – – – – 600 634 669 Foreign gov ernments and international organisations – – – – – – – – – Public corporations and priv ate enterprises 23 796 24 237 16 801 22 801 21 001 20 101 21 800 21 899 23 103 8.5Non-profit institutions 978 1 300 1 268 1 794 1 583 2 041 1 526 1 609 1 697 (25.2)Households 2 829 2 378 1 109 1 000 3 450 1 473 4 590 3 679 3 771 211.6
Payments for capital assets 95 500 33 897 43 764 46 192 17 169 16 739 39 292 9 650 10 175 134.7Buildings and other fix ed structures 71 018 21 357 30 974 34 524 5 000 5 023 28 954 – – 476.4Machinery and equipment 24 482 12 540 12 790 11 668 12 169 11 716 10 338 9 650 10 175 (11.8)Heritage Assets – – – – – – – – – Specialised military assets – – – – – – – – – Biological assets – – – – – – – – – Land and sub-soil assets – – – – – – – – – Softw are and other intangible assets – – – – – – – – –
Payments for financial assets – 2 058 208 – – – – – –
Total economic classification 1 246 351 1 039 524 1 077 779 1 146 006 1 167 052 1 161 421 1 481 960 1 533 091 1 566 238 27.6
% change from 2018/19
2018/19
Tables 6 and 7 show the summary of payments and estimates per programme and economic classification. The actual expenditure decreased from R1.246 billion in 2015/16 to a revised estimate of R1.161 billion in 2018/19 due to reduction of allocation to CDC for the provincial social infrastructure programme. The budget further increases by 27.6 per cent to R1.481 billion in 2019/20 due to funds allocated and ring-fenced for provincial economic stimulus package.
Compensation of employees increased from R216.292 million in 2015/16 to a revised estimate of R258.058 million in 2018/19 and further increased to R269.962 million in 2019/20 due to the annual
550
Department: Economic Development, Environmental Affairs and Tourism
improvement in conditions of services (ICS adjustment) throughout the years. The 2019/20 budget includes funds to create human resource capacity in critical areas in the core programmes.
Expenditure on Goods and services decreased from R177.563 million to a revised estimate of R146.953 million in 2018/19 as a result of reduction in the allocation to the CDC for social infrastructure projects. In 2019/20, the budget decreases by 1.6 per cent to R144.559 million due to the baseline reduction for the province.
Transfers to public entities are the main cost driver of expenditure. Transfers and subsidies decreased from R756.996 million in 2015/16 to a revised estimate of R736.671 million in 2018/19. This was due to the reduction of allocation to CDC and ECDC for the provincial social and economic infrastructure programme. In 2019/20, the budget increases by 39 per cent to R1.028 billion due to funds provided for economic stimulus package for the provincial growth and development.
Payments for capital assets decreased from R95.500 million in 2015/16 to a revised estimate of R16.739 million in 2018/19. Funds for CDC social infrastructure capital projects could not be spent in 2018/19 and were thus rescheduled to 2019/20 resulting in an increase of 134.7 per cent to R39.292 million.
7.4 Expenditure by Municipal Boundary
Table 8: Summary of departmental payments and estimates by benefiting municipal boundary Outcome
Main appropriation
Adjusted appropriation
Revised estimate
Medium-term estimates
R thousand 2015/16 2016/17 2017/18 2019/20 2020/21 2021/22 Buffalo City 1 170 219 1 013 023 1 064 741 1 132 556 1 153 602 1 148 912 1 463 004 1 512 360 1 544 607 2.1 Nelson Mandela Bay 55 000 15 000 – – – – – – – Cacadu District Municipality – 4 256 2 554 – – – 2 670 – –
Dr Bey ers Naude – – 2 554 – – – – – – Blue Crane Route – – – – – – – – – Makana – 1 600 – – – – – – – Ndlambe – 2 656 – – – – – – – Sunday s Riv er Valley – – – – – – – – – Kouga – – – – – – – – – Kou-Kamma – – – – – – 2 670 – –
Amatole District Municipality 500 770 – 3 746 3 746 1 813 4 000 – – 120.6 Mbhashe – – – – – – 4 000 – – Mnquma – – – – – – – – – Great Kei – – – 3 476 3 476 1 543 – – – (100.0) Amahlathi – 770 – – – – – – – Ngqushw a – – – – – – – – – Ray mond Mhlaba 500 – – 270 270 270 – – – (100.0)
Chris Hani District Municipality 200 200 2 400 5 204 5 204 6 196 3 000 – – (51.6) Inx uba Yethemba – – – – – – 3 000 – – Intsika Yethu – – 2 400 2 204 2 204 3 196 – – – (100.0) Emalahleni 200 200 – 3 000 3 000 3 000 – – – (100.0) Engcobo – – – – – – – – – Sakhisizw e – – – – – – – – – Enoch Mgijima – – – – – – – – –
Joe Gqabi District Municipality 500 1 500 500 500 500 500 2 000 – – 300.0 Elundini – 500 500 500 500 500 – – – (100.0) Senqu – – – – – – – – – Walter Sisulu 500 1 000 – – – – 2 000 – –
O.R. Tambo District Municipality 5 800 1 800 6 784 3 000 3 000 3 000 3 000 – – 0.0 Ngquza Hill 3 500 – – – – – – – – Port St Johns – – 200 3 000 3 000 3 000 3 000 – – 0.0 Ny andeni 1 800 500 6 084 – – – – – – Mhlontlo 500 1 000 – – – – – – – King Sabata Dalindy ebo – 300 500 – – – – – –
Alfred Nzo District Municipality 800 1 000 800 – – – 3 286 – – Matatiele 500 – – – – – – – – Umzimv ubu 300 – 300 – – – – – – Mbizana – – 500 – – – 3 286 – – Ntabankulu – 1 000 – – – – – – –
District Municipalities 13 332 1 975 – – – – – – – Cacadu District Municipality 8 000 – – – – – – – – Amatole District Municipality – 1 975 – – – – – – – Chris Hani District Municipality 4 532 – – – – – – – – Cacadu District Municipality 800 – – – – – – – – Joe Gqabi District Municipality – – – – – – – – – O.R. Tambo District Municipality – – – – – – – – – Alfred Nzo District Municipality – – – – – – – – –
Whole Province – – – 1 000 1 000 1 000 1 000 20 731 21 631 0.0Total Payments to municipalies 1 246 351 1 039 524 1 077 779 1146006.2 1 167 052 1 161 421 1481960.3 1 533 091 1 566 238 27.6
% change from 2018/19
2018/19
551
Estimates of the Provincial Revenue and Expenditure (EPRE) - 2019/20 Financial Year
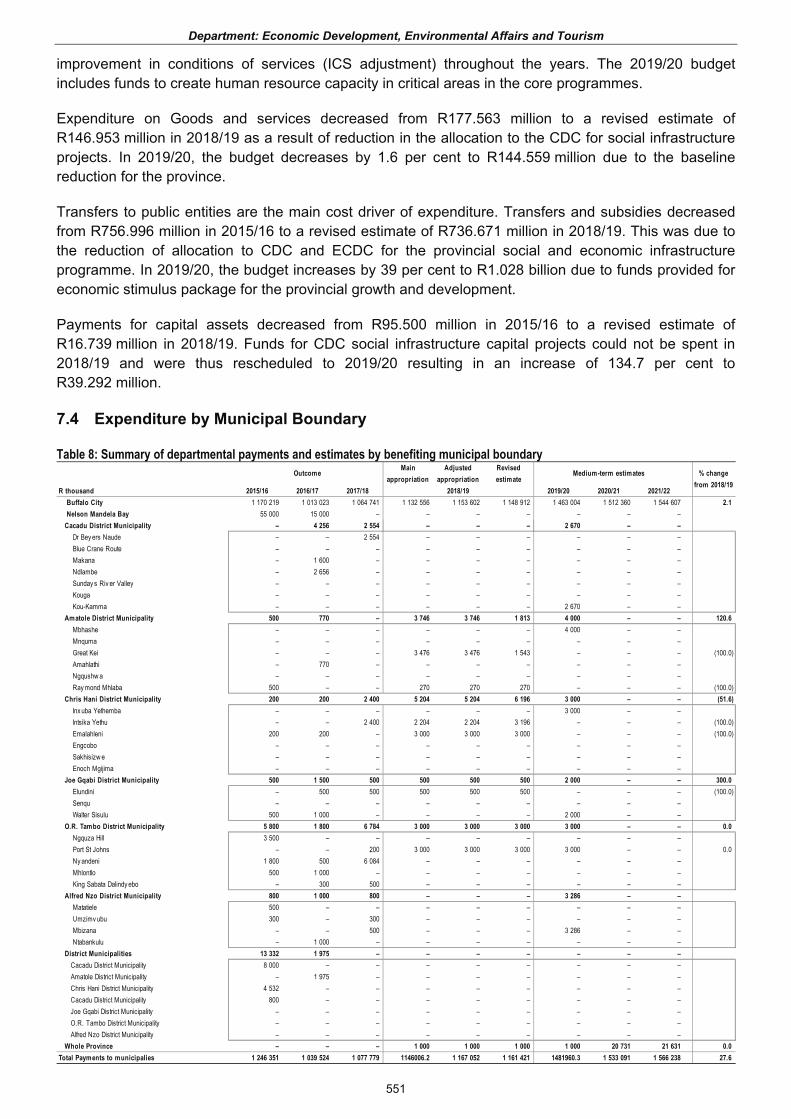
Table 8 above show the departmental payments and estimates by benefiting municipal boundary. The budget decreases from R1.246 billion in 2014/15 to a revised estimate of R1.161 billion in 2018/19. In 2019/20, budget increases to R1.481 billion. The Buffalo City Metropolitan Municipality reflects the highest budget share as compared to other district and local municipalities due to funds allocated to public entities and head office.
7.5 Infrastructure payments
7.5.1 Departmental infrastructure payments
Table 9: Summary of departmental infrastructure payments Outcome
Main appropriation
Adjusted appropriation
Revised estimate
Medium-term estimates
R thousand 2015/16 2016/17 2017/18 2019/20 2020/21 2021/22
Existing infrastructure assets – – – – – – – – – Maintenance and repairs – – – – – – – – – Upgrades and additions – – – – – – – – – Rehabilitation and refurbishment – – – – – – – – –
New infrastructure assets – – 36 908 34 524 34 524 34 672 28 954 – – (16.5)Infrastructure transfers – 9 500 39 521 27 453 27 453 22 385 – – – (100.0)
Current – – – – – – – – – Capital – 9 500 39 521 27 453 27 453 22 385 – – – (100.0)
Infrastructure payments for financial assets – – – – – – – – – Infrastructure leases – – – – – – – – – Non infrastructure 1 370 2 656 2 554 2 204 2 204 2 204 2 670 – – 21.1Total department infrastructure 1 370 12 156 78 983 64 181 64 181 59 261 31 624 – – (46.6)
1. Total provincial infrastructure is the sum of "Capital" plus "Recurrent maintenance". This includes non infrastructure items.
% change from 2018/19
2018/19
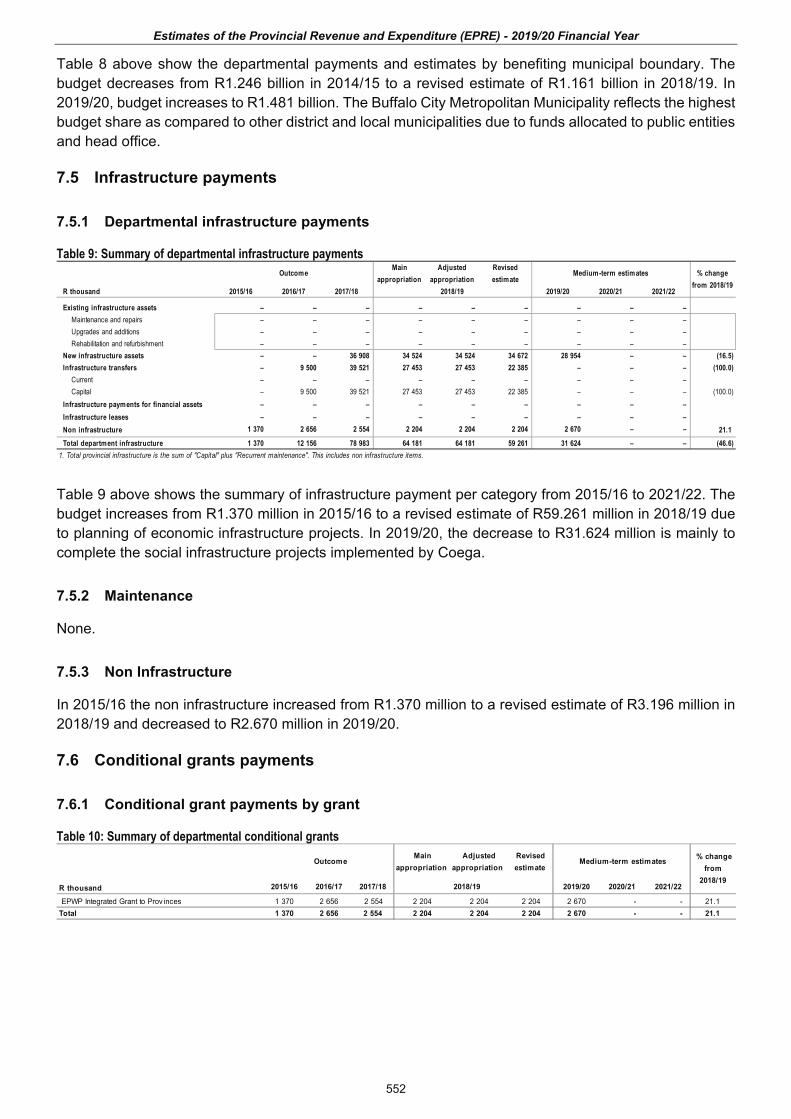
Table 9 above shows the summary of infrastructure payment per category from 2015/16 to 2021/22. The budget increases from R1.370 million in 2015/16 to a revised estimate of R59.261 million in 2018/19 due to planning of economic infrastructure projects. In 2019/20, the decrease to R31.624 million is mainly to complete the social infrastructure projects implemented by Coega.
7.5.2 Maintenance
None.
7.5.3 Non Infrastructure
In 2015/16 the non infrastructure increased from R1.370 million to a revised estimate of R3.196 million in 2018/19 and decreased to R2.670 million in 2019/20.
7.6 Conditional grants payments
7.6.1 Conditional grant payments by grant
Table 10: Summary of departmental conditional grants Main
appropriation Adjusted
appropriation Revised estimate
2015/16 2016/17 2017/18 2018/19 2019/20 2020/21 2021/22
1 370 2 656 2 554 2 204 2 204 2 204 2 670 - - 21.1 1 370 2 656 2 554 2 204 2 204 2 204 2 670 - - 21.1
R thousand
Outcome % change from
2018/19
EPWP Integrated Grant to Prov inces
Medium-term estimates
Total
552
Department: Economic Development, Environmental Affairs and Tourism
7.6.2 Conditional grants by economic classification
Table 11: Summary of departmental conditional grants by economic classification Main
appropriation Adjusted
appropriation Revised estimate
2015/16 2016/17 2017/18 2018/19 2019/20 2020/21 2021/22 - - - - - - - - -
- - - - - - - - - - - - - - - - - - - - - - - - - -
Transfers and subsidies 1 370 2 656 2 554 2 204 2 204 2 204 2 670 - - 21.1 Prov inces and municipalities 1 370 2 656 2 554 2 204 2 204 2 204 2 670 - - 21.1
Departmental agencies and accounts - - - - - - - - - Households - - - - - - - - -
- - - - - - - - - - - - - - - - - - - - - - - - - - - - - - - - - - - - - - - - - - - - - - - - - - - - - - - - - - - - - - - - - - - - - - - - - - - - - - - - - 1 370 2 656 2 554 2 204 2 204 2 204 2 670 - - 21.1
Goods and serv icesInterest and rent on land
Medium-term estimates
R thousand
Outcome % change from
2018/19
Current paymentsCompensation of employ ees
Biological assets
Payments for capital assetsBuildings and other fix ed structuresMachinery and equipmentHeritage assetsSpecialised military assets
Land and sub-soil assetsSoftw are and other intangible assets
Payments for financial assets Total
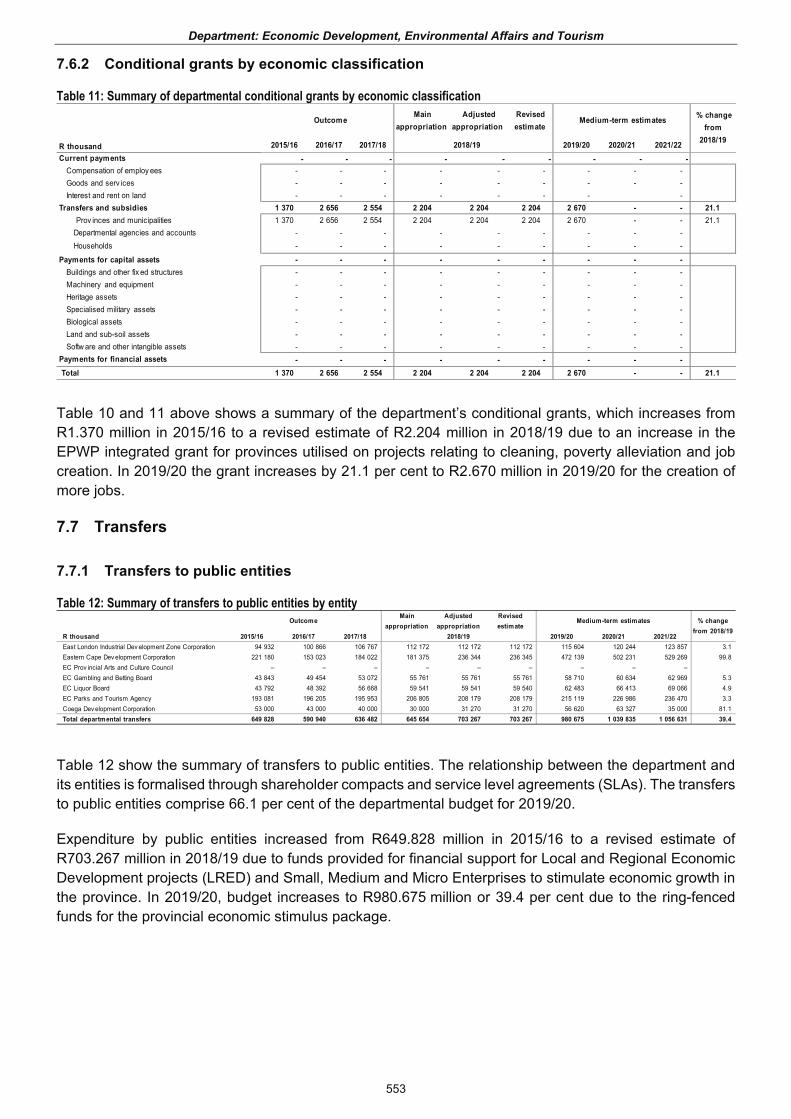
Table 10 and 11 above shows a summary of the department’s conditional grants, which increases from R1.370 million in 2015/16 to a revised estimate of R2.204 million in 2018/19 due to an increase in the EPWP integrated grant for provinces utilised on projects relating to cleaning, poverty alleviation and job creation. In 2019/20 the grant increases by 21.1 per cent to R2.670 million in 2019/20 for the creation of more jobs.
7.7 Transfers
7.7.1 Transfers to public entities
Table 12: Summary of transfers to public entities by entity Outcome
Main appropriation
Adjusted appropriation
Revised estimate
Medium-term estimates
R thousand 2015/16 2016/17 2017/18 2019/20 2020/21 2021/22East London Industrial Dev elopment Zone Corporation 94 932 100 866 106 767 112 172 112 172 112 172 115 604 120 244 123 857 3.1Eastern Cape Dev elopment Corporation 221 180 153 023 184 022 181 375 236 344 236 345 472 139 502 231 529 269 99.8EC Prov incial Arts and Culture Council – – – – – – – – – EC Gambling and Betting Board 43 843 49 454 53 072 55 761 55 761 55 761 58 710 60 634 62 969 5.3EC Liquor Board 43 792 48 392 56 668 59 541 59 541 59 540 62 483 66 413 69 066 4.9EC Parks and Tourism Agency 193 081 196 205 195 953 206 805 208 179 208 179 215 119 226 986 236 470 3.3Coega Dev elopment Corporation 53 000 43 000 40 000 30 000 31 270 31 270 56 620 63 327 35 000 81.1Total departmental transfers 649 828 590 940 636 482 645 654 703 267 703 267 980 675 1 039 835 1 056 631 39.4
% change from 2018/19
2018/19
Table 12 show the summary of transfers to public entities. The relationship between the department and its entities is formalised through shareholder compacts and service level agreements (SLAs). The transfers to public entities comprise 66.1 per cent of the departmental budget for 2019/20.
Expenditure by public entities increased from R649.828 million in 2015/16 to a revised estimate of R703.267 million in 2018/19 due to funds provided for financial support for Local and Regional Economic Development projects (LRED) and Small, Medium and Micro Enterprises to stimulate economic growth in the province. In 2019/20, budget increases to R980.675 million or 39.4 per cent due to the ring-fenced funds for the provincial economic stimulus package.
553

Estimates of the Provincial Revenue and Expenditure (EPRE) - 2019/20 Financial Year
7.7.2 Transfers to other entities
Table 13: Summary of transfers to other entities Outcome
Main appropriation
Adjusted appropriation
Revised estimate
Medium-term estimates
R thousand 2015/16 2016/17 2017/18 2019/20 2020/21 2021/22Rhodes Univ ersity 2 233 2 778 2 919 – – – – – – Fort Hare Univ ersity – 197 – – – – – – – Nelson Mandela Metropolitan Univ ersity 1 200 70 3 094 – – – – – – LRED Fund 23 796 32 226 15 001 21 001 21 001 21 001 20 000 20 000 21 100 (4.8)Chemin Incubation 1 800 2 100 1 800 1 800 1 800 1 800 1 800 1 899 2 003 0.0Non Profit Institutions 978 1 432 1 268 1 794 1 794 1 794 1 525 1 609 1 697 (15.0)Total departmental transfers 30 007 38 803 24 082 24 595 24 595 24 595 23 325 23 508 24 800 (5.2)
% change from 2018/19
2018/19
Table 13 above provides for all departmental transfers to other entities other than Public Corporations and Private Enterprises. Transfers to other entities decreased from R30.007 million in 2015/16 to a revised estimate of R24.595 million in 2018/19 and further decreases to R23.325 million in 2019/20 due to the baseline reductions.
The Local and Regional Economic Development (LRED) funds are transferred to businesses and industries from different sectors such as agriculture, manufacturing, tourism, agro-processing, aquaculture, renewable energy, services, mining and construction. The transfer to the Chemin Incubator is for training and support materials for the SMME training in the chemistry sector incubation programme.
7.7.3 Transfers to local government
Table 14: Transfers to local government by category Outcome
Main appropriation
Adjusted appropriation
Revised estimate
Medium-term estimates
R thousand 2015/16 2016/17 2017/18 2019/20 2020/21 2021/22Category A 55 000 15 000 – – – – – – – Category B 7 800 9 526 13 038 12 450 12 450 11 789 17 956 – – 52.3Category C 13 332 1 975 – – – – – – – Unallocated – – – 1 000 1 000 1 000 1 000 20 731 21 631 0.0Total departmental transfers 76 132 26 501 13 038 13 450 13 450 12 789 18 956 20 731 21 631 48.2
% change from 2018/19
2018/19
The transfers to municipalities decreases from R76.132 million in 2015/16 to a revised estimate of R12.789 million in the 2018/19 revised estimate, due to the once off payment to the Nelson Mandela Metropolitan Municipality for storm water ponds as well as providing electricity to RDP houses. In 2019/20, an amount of R18.956 million has been allocated. The department, in partnership with local municipalities has been utilising these grants to create jobs on environmental sector projects and will continue to do so over the 2019 MTEF.
8. Programme description
8.1 Programme 1: Administration
Objectives: To provide leadership, strategic management, direction, financial and human capital management in accordance with legislation, regulations and policies of the department and its public entities. The Programme is divided into 4 sub-programmes:
Office of the MEC: To effectively and efficiently manage and direct the activities of the MEC;
Office of the HOD: To manage and direct the departmental transversal administrative programmes that give leadership to the department and effectively maintain an oversight function of the whole department’s mandate and function;
Financial Management: To provide an effective financial management function and ensure implementation of the PFMA and other related financial regulations and policies; and
Corporate Services: To ensure adequate provision of institutional capacity through effective human capital management and organisational development interventions.
554
Department: Economic Development, Environmental Affairs and Tourism
Table 15: Summary of payments and estimates: by Sub-Programme P1- Administration Outcome
Main appropriation
Adjusted appropriation
Revised estimate
Medium-term estimates
R thousand 2015/16 2016/17 2017/18 2019/20 2020/21 2021/221. Office of the MEC 1 451 2 130 2 233 3 029 4 029 3 904 4 372 4 647 4 706 12.02. Office of the HOD 53 169 68 197 64 192 66 090 70 660 68 026 67 765 71 322 73 953 (0.4)3. Financial Management 96 167 99 471 98 247 103 528 111 021 111 194 113 470 116 307 119 242 2.04. Corporate Serv ices 45 958 51 109 55 249 62 040 56 933 57 652 56 090 58 571 61 551 (2.7)Total payments and estimates 196 745 220 907 219 921 234 687 242 643 240 776 241 697 250 847 259 452 0.4
% change from 2018/19
2018/19
Table 16: Summary of payments and estimates by economic classification: P1- Administration Outcome
Main appropriation
Adjusted appropriation
Revised estimate
Medium-term estimates
R thousand 2015/16 2016/17 2017/18 2019/20 2020/21 2021/22Current payments 179 299 205 178 205 849 224 015 227 024 227 587 226 169 236 884 244 837 (0.6)
Compensation of employ ees 103 037 108 294 111 326 123 132 118 632 117 922 124 254 132 843 140 150 5.4Goods and serv ices 76 262 96 884 94 523 100 883 108 392 109 665 101 915 104 041 104 687 (7.1)Interest and rent on land – – – – – – – – –
Transfers and subsidies to: 2 829 2 378 1 109 1 003 3 450 1 473 5 190 4 313 4 440 252.3Prov inces and municipalities – – – – – – – – – Departmental agencies and accounts – – – 3 – – – – – Higher education institutions – – – – – – 600 634 669 Foreign gov ernments and international organisations – – – – – – – – – Public corporations and priv ate enterprises – – – – – – – – – Non-profit institutions – – – – – – – – – Households 2 829 2 378 1 109 1 000 3 450 1 473 4 590 3 679 3 771 211.6
Payments for capital assets 14 617 11 293 12 755 9 669 12 169 11 716 10 338 9 650 10 175 (11.8)Buildings and other fix ed structures – – – – – – – – – Machinery and equipment 14 617 11 293 12 755 9 669 12 169 11 716 10 338 9 650 10 175 (11.8)Heritage Assets – – – – – – – – – Specialised military assets – – – – – – – – – Biological assets – – – – – – – – – Land and sub-soil assets – – – – – – – – – Softw are and other intangible assets – – – – – – – – –
Payments for financial assets – 2 058 208 – – – – – –
Total economic classification 196 745 220 907 219 921 234 687 242 643 240 776 241 697 250 847 259 452 0.4
% change from 2018/19
2018/19
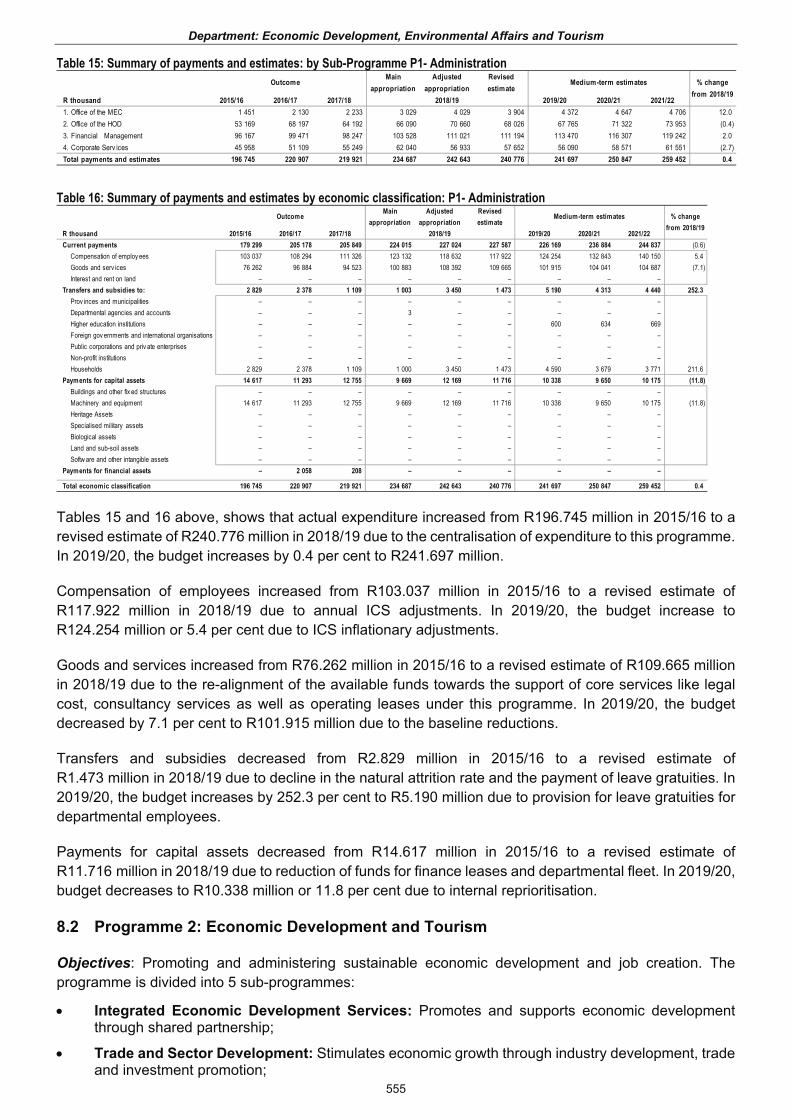
Tables 15 and 16 above, shows that actual expenditure increased from R196.745 million in 2015/16 to a revised estimate of R240.776 million in 2018/19 due to the centralisation of expenditure to this programme. In 2019/20, the budget increases by 0.4 per cent to R241.697 million.
Compensation of employees increased from R103.037 million in 2015/16 to a revised estimate of R117.922 million in 2018/19 due to annual ICS adjustments. In 2019/20, the budget increase to R124.254 million or 5.4 per cent due to ICS inflationary adjustments.
Goods and services increased from R76.262 million in 2015/16 to a revised estimate of R109.665 million in 2018/19 due to the re-alignment of the available funds towards the support of core services like legal cost, consultancy services as well as operating leases under this programme. In 2019/20, the budget decreased by 7.1 per cent to R101.915 million due to the baseline reductions.
Transfers and subsidies decreased from R2.829 million in 2015/16 to a revised estimate of R1.473 million in 2018/19 due to decline in the natural attrition rate and the payment of leave gratuities. In 2019/20, the budget increases by 252.3 per cent to R5.190 million due to provision for leave gratuities for departmental employees.
Payments for capital assets decreased from R14.617 million in 2015/16 to a revised estimate of R11.716 million in 2018/19 due to reduction of funds for finance leases and departmental fleet. In 2019/20, budget decreases to R10.338 million or 11.8 per cent due to internal reprioritisation.
8.2 Programme 2: Economic Development and Tourism
Objectives: Promoting and administering sustainable economic development and job creation. The programme is divided into 5 sub-programmes:
Integrated Economic Development Services: Promotes and supports economic development through shared partnership;
Trade and Sector Development: Stimulates economic growth through industry development, trade and investment promotion;
555
Estimates of the Provincial Revenue and Expenditure (EPRE) - 2019/20 Financial Year
Business Regulation and Governance: Ensures an enabling socially responsible businessenvironment that allows for predictability;
Economic Planning: Develops provincial economic policies and strategies to achieve and measuresustainable economic development; and
Tourism: Creates an enabling tourism environment through legislation, policy and strategydevelopment. Creates demand and supply for tourism.
Table 17: Summary of departmental payments and estimates by Sub-programme P2 - Economic Development and Tourism Outcome
Main appropriation
Adjusted appropriation
Revised estimate
Medium-term estimates
R thousand 2015/16 2016/17 2017/18 2019/20 2020/21 2021/221. Intergrated Economic Dev elopment Serv ices 145 339 160 197 160 395 180 827 203 640 230 940 179 456 186 014 193 243 (22.3)2. Trade And Sector Dev elopment 492 933 232 373 262 438 252 525 251 645 222 423 559 173 566 724 565 498 151.43. Business Regulation & Gov ernance 111 916 120 019 131 783 141 615 141 865 140 679 148 013 156 087 162 671 5.24. Economic Planning 5 510 6 057 4 852 7 525 3 826 3 957 6 517 7 893 8 327 64.75. Tourism 4 324 4 144 9 877 9 050 10 650 10 614 11 044 11 624 12 262 4.1Total payments and estimates 760 022 522 790 569 345 591 542 611 626 608 613 904 203 928 342 942 001 48.6
% change from 2018/19
2018/19
Table 18: Summary of departmental payments and estimates by economic classification: Programme P2 - Economic Development and Tourism
OutcomeMain
appropriationAdjusted
appropriationRevised estimate
Medium-term estimates
R thousand 2015/16 2016/17 2017/18 2019/20 2020/21 2021/22Current payments 129 863 63 304 75 041 88 881 83 459 81 323 81 244 86 579 91 336 (0.1)
Compensation of employ ees 41 370 43 010 56 784 59 930 60 988 60 689 60 406 65 436 69 033 (0.5)Goods and serv ices 88 493 20 294 18 257 28 951 22 471 20 634 20 838 21 143 22 303 1.0Interest and rent on land – – – – – – – – –
Transfers and subsidies to: 549 276 437 514 463 330 467 354 523 167 522 267 794 005 841 763 850 665 52.0Prov inces and municipalities 65 300 15 500 1 000 770 770 770 – – – (100.0)Departmental agencies and accounts 456 747 394 735 445 529 443 783 501 396 501 396 772 205 819 864 827 562 54.0Higher education institutions 3 433 3 042 – – – – – – – Foreign gov ernments and international organisations – – – – – – – – – Public corporations and priv ate enterprises 23 796 24 237 16 801 22 801 21 001 20 101 21 800 21 899 23 103 8.5Non-profit institutions – – – – – – – – – Households – – – – – – – – –
Payments for capital assets 80 883 21 972 30 974 35 307 5 000 5 023 28 954 – – 476.4Buildings and other fix ed structures 71 018 21 357 30 974 34 524 5 000 5 023 28 954 – – 476.4Machinery and equipment 9 865 615 – 783 – – – – – Heritage Assets – – – – – – – – – Specialised military assets – – – – – – – – – Biological assets – – – – – – – – – Land and sub-soil assets – – – – – – – – – Softw are and other intangible assets – – – – – – – – –
Payments for financial assets – – – – – – – – –
Total economic classification 760 022 522 790 569 345 591 542 611 626 608 613 904 203 928 342 942 001 48.6
% change from 2018/19
2018/19
Tables 17 and 18 above show expenditure and the budget allocation for Programme 2. The transfers to the entities include the ECDC, CDC, ELIDZ, ECLB and ECGBB and account for 66.1 per cent of the department’s budget. The expenditure declines from R760.022 million in 2015/16 to a revised estimate of R608.613 million in 2018/19 due to the reduction in the social and economic infrastructure programme implemented by CDC and ECDC. In 2019/20, the budget increases to R904.203 million due to provision made for the implementation of economic stimulus package for the province.
Compensation of employees increased from R41.370 million in 2015/16 to a revised estimate of R60.689 million in 2018/19 due to the filling of vacant posts to strengthen the functional programme performance and ICS inflationary adjustments. The budget decreases by 0.5 per cent to R60.406 million in 2019/20.
Goods and services decreased from R88.493 million in 2015/16 to a revised estimate of R20.634 million in 2018/19 as result of the funds for social infrastructure projects being allocated under capital assets. In 2019/20, the budget increases by 1 per cent to R20.838 million.
Transfers and subsidies decreased from R549.276 million in 2015/16 to a revised estimate of R522.267 million in 2018/19 due to the once off payment to the Nelson Mandela Metropolitan Municipality for storm water ponds as well as providing electricity to RDP houses. In 2019/20, the budget increases by 52 per cent to R794.005 million due to allocation of funds for the implementation of provincial economic stimulus package.
556

Department: Economic Development, Environmental Affairs and Tourism
Payment for capital assets expenditure decreased from R80.883 million in 2015/16 to a revised estimate of R5.023 million in 2018/19 due to completion of some CDC Social Infrastructure projects. In 2019/20, budget increases to R28.954 million or 476.4 per cent to finalise the completion of CDC Social infrastructure projects.
Table 19: Selected service delivery measures for the programme: P2: Economic Development and Tourism Estimated
performanceMedium-term estimates
Programme performance measures 2018/19 2019/20 2020/21 2021/22Number of cooperativ es prov ided w ith non-financial support 108 108 118 150 Number of economic dev elopment projects funded at local and regional lev els 10 8 10 12 Number of sustainable energy initiativ es facilitated 6 6 6 8 Number of manufacturing initiativ es facilitated 6 6 6 8 Number of agro-processing initiativ es facilitated 5 5 5 6 Public Entities Accountability index 10 10 10 10 Number of policy framew orks dev eloped to enable the ease of doing business 3 3 3 3 Number of consumer education programmes implemented 6 6 6 6 Number of participants reached 9 050 9 050 10 000 12 000 Number of prov incial economic intelligence reports produced 4 4 4 4 Status report on implementation of sector policies / strategies 2 2 2 2
The department’s plans to increase the number of cooperatives funded in 2019/20, and to maintain support to different sectors (sustainable energy, manufacturing, agro-processing) in the economy. The number of jobs created are expected to increase over the 2019 MTEF as a means to address unemployment. The department also focuses on consumer education programmes.
8.3 Programme 3: Environmental Affairs
Objectives: Administers environmental policies that are cascaded from national level in line with the mandate of the department. It regulates environmental management through instruments such as the environmental impact assessments, compliance and enforcement, air quality, waste and biodiversity management tools. The programme is divided into 5 sub-programmes:
Environmental Policy, Planning and Coordination: Ensure the integration of environmentobjectives in national, provincial and local government planning, including provincial growth anddevelopment strategies, and local economic developments plans and integrated plans;
Compliance and Enforcement: Ensure that environmental compliance monitoring systems areestablished and implemented and ensure the enforcement of legislation and environmentauthorisations;
Environmental Quality Management: Establish legislation, policies, norms, standards andguidelines for environmental impact management, air quality management and management ofwaste and pollution at provincial and local sphere of government;
Biodiversity Management: Promote equitable and sustainable use of ecosystem goods andservices to contribute to economic development, by managing biodiversity, and its components,processes, habitats and functions. Effectively mitigate threats to biodiversity; and
Environmental Empowerment Services: Empower and capacitate external stakeholders of thedepartment to meaningfully participate in and contribute to effective environmental management.
Table 20: Summary of payments and estimates by Sub-Programme: P3 - Environmental Affairs Outcome
Main appropriation
Adjusted appropriation
Revised estimate
Medium-term estimates
R thousand 2015/16 2016/17 2017/18 2019/20 2020/21 2021/221. Env ironmental Policy , Planning and Coordination 20 261 21 368 22 419 26 310 24 583 24 477 30 832 33 204 34 489 26.02. Compliance and Enforcement 43 957 45 544 41 225 45 735 46 435 46 473 51 422 52 345 54 286 10.63. Env ironmental Quality Management 17 836 16 960 18 164 23 339 22 150 21 846 23 021 24 958 25 686 5.44. Biodiv ersity Management 198 385 201 722 196 260 211 234 207 324 207 249 217 236 228 881 236 783 4.85. Env ironmental Empow erment Serv ices 9 145 10 233 10 445 13 159 12 291 11 987 13 549 14 514 13 541 13.0Total payments and estimates 289 584 295 827 288 513 319 777 312 783 312 032 336 060 353 902 364 785 7.7
% change from 2018/19
2018/19
557
Estimates of the Provincial Revenue and Expenditure (EPRE) - 2019/20 Financial Year
Table 21: Summary of payments and estimates by economic classification: P3 - Environmental Affairs Outcome
Main appropriation
Adjusted appropriation
Revised estimate
Medium-term estimates
R thousand 2015/16 2016/17 2017/18 2019/20 2020/21 2021/22Current payments 84 693 86 689 84 219 102 216 96 649 96 101 107 108 111 591 112 388 11.5
Compensation of employ ees 71 885 74 518 71 940 82 789 78 921 79 447 85 302 89 253 90 179 7.4Goods and serv ices 12 808 12 171 12 279 19 427 17 728 16 654 21 806 22 338 22 209 30.9Interest and rent on land – – – – – – – – –
Transfers and subsidies to: 204 891 208 506 204 259 216 345 216 134 215 931 228 952 242 311 252 397 6.0Prov inces and municipalities 10 832 11 001 12 038 12 680 12 680 12 019 18 956 20 731 21 631 57.7Departmental agencies and accounts 193 081 196 205 190 953 201 871 201 871 201 871 208 470 219 971 229 069 3.3Higher education institutions – – – – – – – – – Foreign gov ernments and international organisations – – – – – – – – – Public corporations and priv ate enterprises – – – – – – – – – Non-profit institutions 978 1 300 1 268 1 794 1 583 2 041 1 526 1 609 1 697 (25.2)Households – – – – – – – – –
Payments for capital assets – 632 35 1 216 – – – – – Buildings and other fix ed structures – – – – – – – – – Machinery and equipment – 632 35 1 216 – – – – – Heritage Assets – – – – – – – – – Specialised military assets – – – – – – – – – Biological assets – – – – – – – – – Land and sub-soil assets – – – – – – – – – Softw are and other intangible assets – – – – – – – – –
Payments for financial assets – – – – – – – – –
Total economic classification 289 584 295 827 288 513 319 777 312 783 312 032 336 060 353 902 364 785 7.7
% change from 2018/19
2018/19
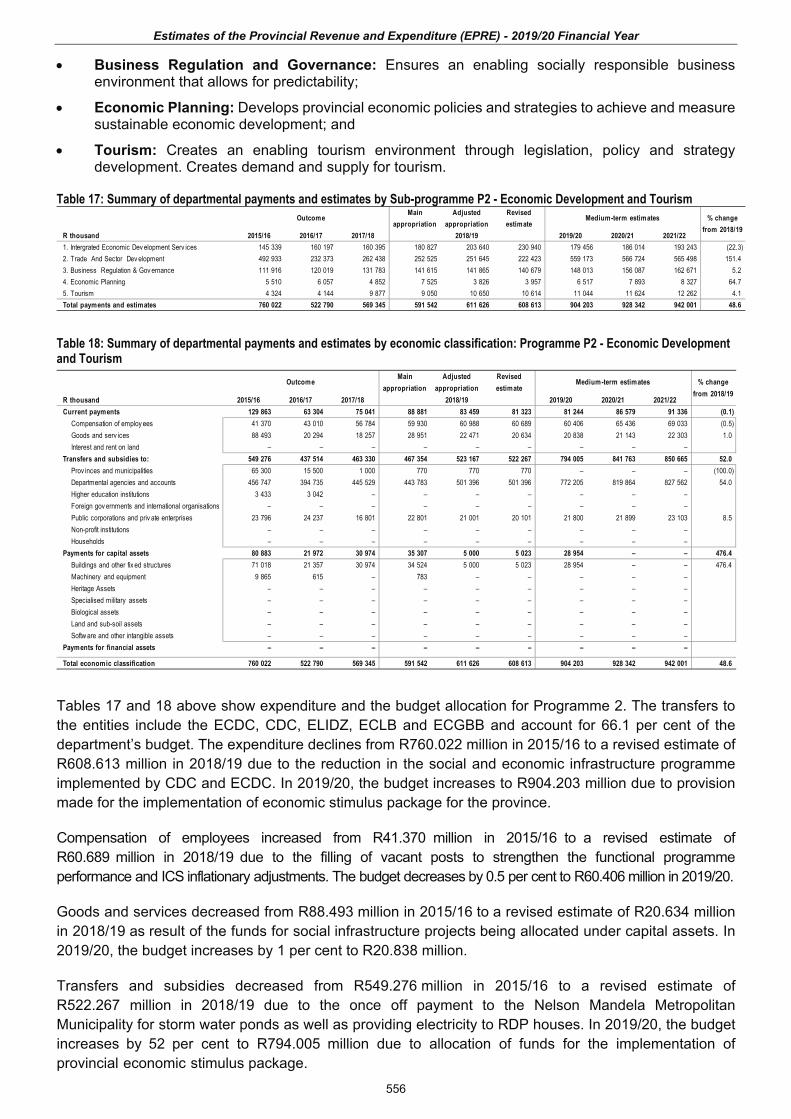
Tables 20 and 21 above reflect a stable expenditure increased from R289.584 million in 2015/16 to a revised estimate of R312.032 million in 2018/19 due to internal reprioritisation for the payments of leave gratuities and the posts that was not filled in 2018/19. In 2019/20, the budget increased to R336.060 million or 7.7 per cent due to ICS adjustment.
Compensation of employees increased from R71.885 million in 2015/16 to a revised estimate of R79.447 million in 2018/19 due to the filling of posts for environmental and law enforcement officers. In 2019/20, the budget increases by 7.4 per cent to R85.302 million for the filling of posts of the environmental officers and provision for ICS adjustment.
Goods and services increased from R12.808 million in 2015/16 to a revised estimate of R16.654 million in 2018/19 due to the implementation of environmental management programmes such as Biodiversity day, Wetlands programmes and Environmental implementation of the Biodiversity Conservation Strategy Action Plan and ICS inflationary adjustment. In 2019/20, the budget further increases by 30.9 per cent to R21.806 million due to funding of Biodiversity day, Wetlands programmes and Environmental implementation of the Biodiversity Conservation Strategy Action Plan, the development of a Species Management Plan, implementation of the provincial Integrated Waste Management Programmes (IWMPs) research and provincial recycling strategy.
Transfers and subsidies increased from R204.891 million in 2015/16 to a revised estimate of R215.931 million in 2018/19 due to the implementation of environmental awareness sessions and EPWP job creation programmes for the province. The budget increases by 6 per cent to R228.952 million in 2019/20 due to inflationary adjustment.
Payment for capital assets expenditure decrease from R632 thousand in 2016/17 to zero in the 2018/19 revised estimates and in 2019/20 due to the centralisation of capex funds to the Administration.
558

Department: Economic Development, Environmental Affairs and Tourism
Table 22: Selected service delivery measures for the programme: P3: Environmental Affairs Estimated
performanceMedium-term estimates
Programme performance measures 2018/19 2019/20 2020/21 2021/22Number of inter-gov ernmental sector tools rev iew ed 39 39 39 39 Number of legislated tools dev eloped 1 1 1 1 Number of env ironmental research projects completed - - – 1 Number of functional env ironmental information management sy stems maintained 1 1 1 1 Number of climate change response interv entions implemented - - - -Number of administrativ e enforcement notices issued for non-compliance w ith env ironmental management legislation 68 70 80 80 Number of completed criminal inv estigations handed to the NPA for prosecution 50 65 70 70 Number of compliance inspections conducted 88 90 100 100 Number of s24G applications finalised 6 6 6 6 Percentage of complete EIA applications finalized w ithin legislated time-frames 1 1 1 1 Percentage of Atmospheric Emission Licenses issued w ithin legislated timeframes 1 1 1 1 Percentage of w aste licence applications finalised w ithin legislated time-frames 1 1 1 1 Number of permits issued w ithin legislated timeframes 1 600 1 700 1 700 1 700 Number of w ork opportunities created through env ironmental programmes 350 600 700 700 Number of env ironmental capacity building activ ities conducted 25 25 25 25 Number of env ironmental aw areness activ ities conducted 28 28 28 28
The department’s performance is measured through enforcing environmental legislation and the issuing of permits within legislated timeframes. The number of work opportunities will also be increased through environmental programmes
9. Other programme information
9.1 Personnel numbers and costs by component
Table 23: Personnel numbers and costs by component Actual Revised estimate Medium-term expenditure estimate
R thousands
Personnel numbers1 Costs
Personnel numbers1 Costs
Personnel numbers1 Costs
Filled posts
Additional posts
Personnel numbers1 Costs
Personnel numbers1 Costs
Personnel numbers1 Costs
Personnel numbers1 Costs
Personnel growth rate
Costs growth rate
% Costs of
Total Salary level
1 – 6 142 23 247 118 29 048 100 22 468 97 11 108 22 910 103 25 882 103 26 474 103 27 929 -1.6% 6.8% 9.1%7 – 10 306 118 554 309 117 857 341 144 225 327 6 333 150 954 357 145 829 357 158 048 357 162 757 2.3% 2.5% 55.8%11 – 12 39 35 261 51 36 284 49 32 768 52 3 55 41 083 55 54 526 55 56 892 55 60 021 – 13.5% 18.7%13 – 16 38 36 890 42 40 833 37 38 789 32 6 38 40 771 38 41 373 38 43 766 38 46 173 – 4.2% 15.5%Other 30 2 340 25 1 800 30 1 800 32 – 32 2 340 32 2 352 32 2 352 32 2 482 – 2.0% 0.8%
Total 555 216 292 545 225 822 557 240 050 540 26 566 258 058 585 269 962 585 287 532 585 299 362 1.1% 5.1% 100.0%Programme
1. Administration 293 103 037 282 108 294 291 111 326 293 7 300 117 922 290 124 254 290 132 843 290 140 150 -1.1% 5.9% 46.3%2. Economic Dev elopment And Tourism 97 41 370 100 43 010 100 56 784 93 7 100 60 689 108 60 406 108 65 436 108 69 033 2.6% 4.4% 23.1%3. Env ironmental Affairs 165 71 885 163 74 518 166 71 940 154 12 166 79 447 187 85 302 187 89 253 187 90 179 4.1% 4.3% 30.6%Direct charges – – – – – – – – – – – – – – – – – – –
Total 555 216 292 545 225 822 557 240 050 540 26 566 258 058 585 269 962 585 287 532 585 299 362 1.1% 5.1% 100.0%Employee dispensation classification
Public Serv ice Act appointees not cov ered by OSDs
430 138 803 339 142 388 346 152 011 329 26 355 162 318 374 168 978 374 178 479 374 184 427 1.8% 4.3% 62.2%
Public Serv ice Act appointees still to be cov ered by OSDs
125 75 449 176 81 334 176 85 939 176 – 176 93 640 176 98 884 176 106 953 176 112 835 – 6.4% 37.1%
Professional Nurses, Staff Nurses and Nursing Assistants
– – – – – – – – – – – – – – – – – – –
Legal Professionals – – – – – – – – – – – – – – – – – – –Social Serv ices Professions – – – – – – – – – – – – – – – – – – –Engineering Professions and related occupations
– – – – – – – – – – – – – – – – – – –
Medical and related professionals – – – – – – – – – – – – – – – – – – –Therapeutic, Diagnostic and other related Allied Health Professionals
– – – – – – – – – – – – – – – – – – –
Educators and related professionals – – – – – – – – – – – – – – – – – – –Others such as interns, EPWP, learnerships, etc
– 2 040 30 2 100 35 2 100 35 – 35 2 100 35 2 100 35 2 100 35 2 100 – – 0.7%
Total 555 216 292 545 225 822 557 240 050 540 26 566 258 058 585 269 962 585 287 532 585 299 362 1.1% 5.1% 100.0%1. Personnel numbers includes all filled posts together with those posts additional to the approved establishment
Average annual growth over MTEF 2015/16 2016/17 2017/18 2018/19 2019/20 2020/21 2021/22 2018/19 - 2021/22
Table 23 shows personnel numbers and cost by programme and component for 2019 MTEF period. Personnel numbers increase slightly from 555 in 2015/16 to a revised estimates of 566 in 2018/19. The department is focussing on increasing the numbers on core programmes to improve service delivery in 2019/20.
559
Estimates of the Provincial Revenue and Expenditure (EPRE) - 2019/20 Financial Year
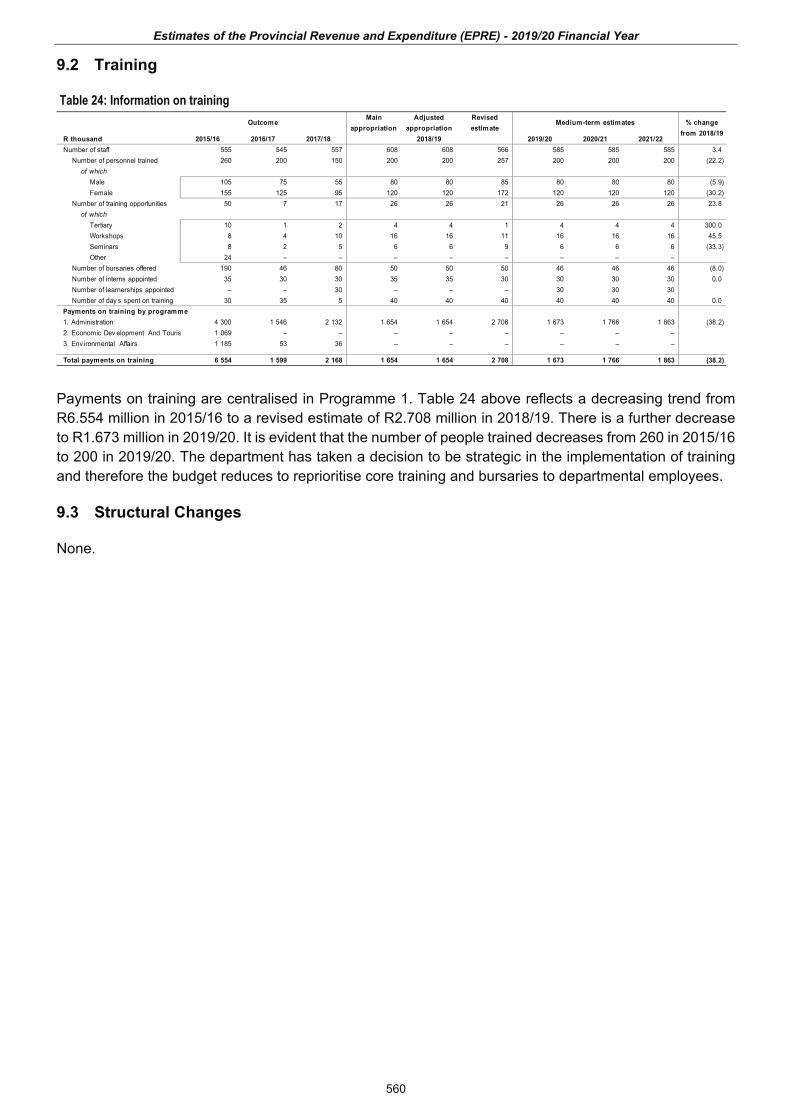
9.2 Training
Table 24: Information on training Outcome
Main appropriation
Adjusted appropriation
Revised estimate
Medium-term estimates
R thousand 2015/16 2016/17 2017/18 2019/20 2020/21 2021/22Number of staff 555 545 557 608 608 566 585 585 585 3.4
Number of personnel trained 260 200 150 200 200 257 200 200 200 (22.2)of which
Male 105 75 55 80 80 85 80 80 80 (5.9)Female 155 125 95 120 120 172 120 120 120 (30.2)
Number of training opportunities 50 7 17 26 26 21 26 26 26 23.8of which
Tertiary 10 1 2 4 4 1 4 4 4 300.0Workshops 8 4 10 16 16 11 16 16 16 45.5Seminars 8 2 5 6 6 9 6 6 6 (33.3)Other 24 – – – – – – – –
Number of bursaries offered 190 46 80 50 50 50 46 46 46 (8.0)Number of interns appointed 35 30 30 35 35 30 30 30 30 0.0Number of learnerships appointed – – 30 – – – 30 30 30 Number of day s spent on training 30 35 5 40 40 40 40 40 40 0.0
Payments on training by programme1. Administration 4 300 1 546 2 132 1 654 1 654 2 708 1 673 1 766 1 863 (38.2)2. Economic Dev elopment And Touris 1 069 – – – – – – – – 3. Env ironmental Affairs 1 185 53 36 – – – – – –
Total payments on training 6 554 1 599 2 168 1 654 1 654 2 708 1 673 1 766 1 863 (38.2)
% change from 2018/19
2018/19
Payments on training are centralised in Programme 1. Table 24 above reflects a decreasing trend from R6.554 million in 2015/16 to a revised estimate of R2.708 million in 2018/19. There is a further decrease to R1.673 million in 2019/20. It is evident that the number of people trained decreases from 260 in 2015/16 to 200 in 2019/20. The department has taken a decision to be strategic in the implementation of training and therefore the budget reduces to reprioritise core training and bursaries to departmental employees.
9.3 Structural Changes
None.
560
Department: Economic Development, Environmental Affairs and Tourism
Annexure to the Estimates of Provincial Revenue
and Expenditure
Department of Economic Development Environmental Affairs and Tourism
561
Estimates of the Provincial Revenue and Expenditure (EPRE) - 2019/20 Financial Year
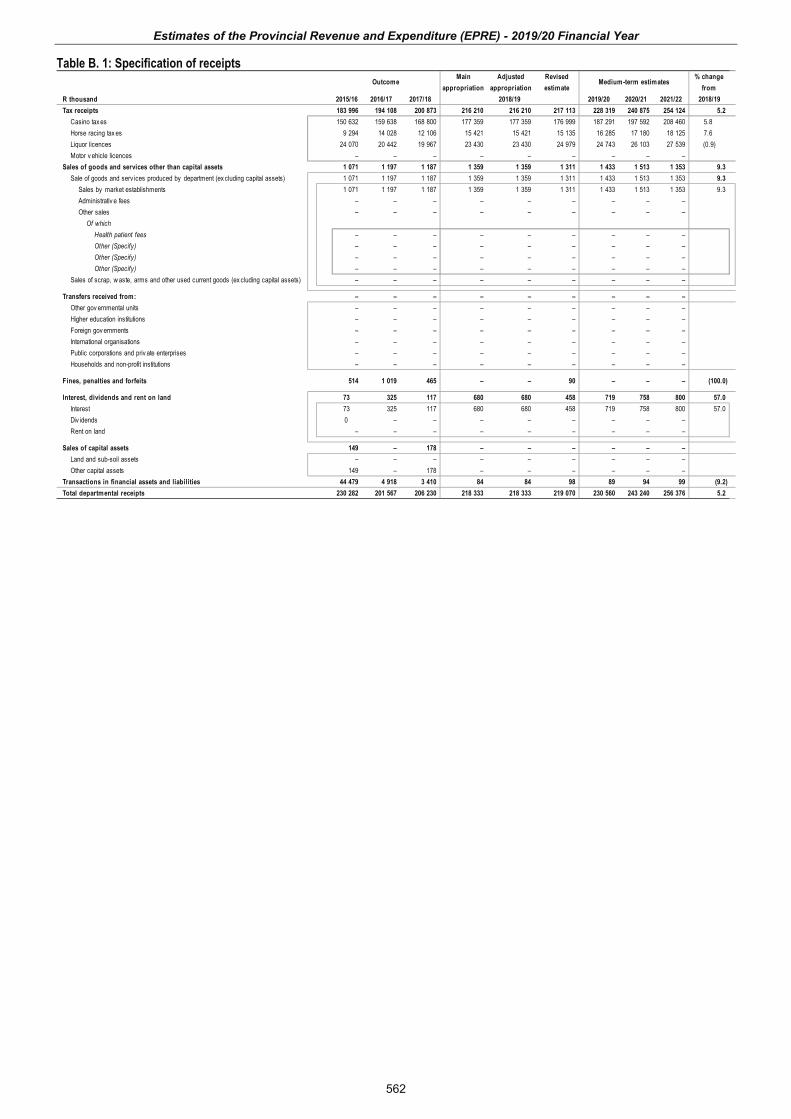
Table B. 1: Specification of receipts Outcome
Main appropriation
Adjusted appropriation
Revised estimate
Medium-term estimates
R thousand 2015/16 2016/17 2017/18 2019/20 2020/21 2021/22Tax receipts 183 996 194 108 200 873 216 210 216 210 217 113 228 319 240 875 254 124 5.2
Casino tax es 150 632 159 638 168 800 177 359 177 359 176 999 187 291 197 592 208 460 5.8Horse racing tax es 9 294 14 028 12 106 15 421 15 421 15 135 16 285 17 180 18 125 7.6Liquor licences 24 070 20 442 19 967 23 430 23 430 24 979 24 743 26 103 27 539 (0.9)Motor v ehicle licences – – – – – – – – –
Sales of goods and services other than capital assets 1 071 1 197 1 187 1 359 1 359 1 311 1 433 1 513 1 353 9.3Sale of goods and serv ices produced by department (ex cluding capital assets) 1 071 1 197 1 187 1 359 1 359 1 311 1 433 1 513 1 353 9.3
Sales by market establishments 1 071 1 197 1 187 1 359 1 359 1 311 1 433 1 513 1 353 9.3Administrativ e fees – – – – – – – – – Other sales – – – – – – – – –
Of which Health patient fees – – – – – – – – – Other (Specify) – – – – – – – – – Other (Specify) – – – – – – – – – Other (Specify) – – – – – – – – –
Sales of scrap, w aste, arms and other used current goods (ex cluding capital assets) – – – – – – – – –
Transfers received from: – – – – – – – – – Other gov ernmental units – – – – – – – – – Higher education institutions – – – – – – – – – Foreign gov ernments – – – – – – – – – International organisations – – – – – – – – – Public corporations and priv ate enterprises – – – – – – – – – Households and non-profit institutions – – – – – – – – –
Fines, penalties and forfeits 514 1 019 465 – – 90 – – – (100.0)
Interest, dividends and rent on land 73 325 117 680 680 458 719 758 800 57.0
Interest 73 325 117 680 680 458 719 758 800 57.0Div idends 0 – – – – – – – – Rent on land – – – – – – – – –
Sales of capital assets 149 – 178 – – – – – –
Land and sub-soil assets – – – – – – – – – Other capital assets 149 – 178 – – – – – –
Transactions in financial assets and liabilities 44 479 4 918 3 410 84 84 98 89 94 99 (9.2)Total departmental receipts 230 282 201 567 206 230 218 333 218 333 219 070 230 560 243 240 256 376 5.2
% change from
2018/192018/19
562
Department: Economic Development, Environmental Affairs and Tourism
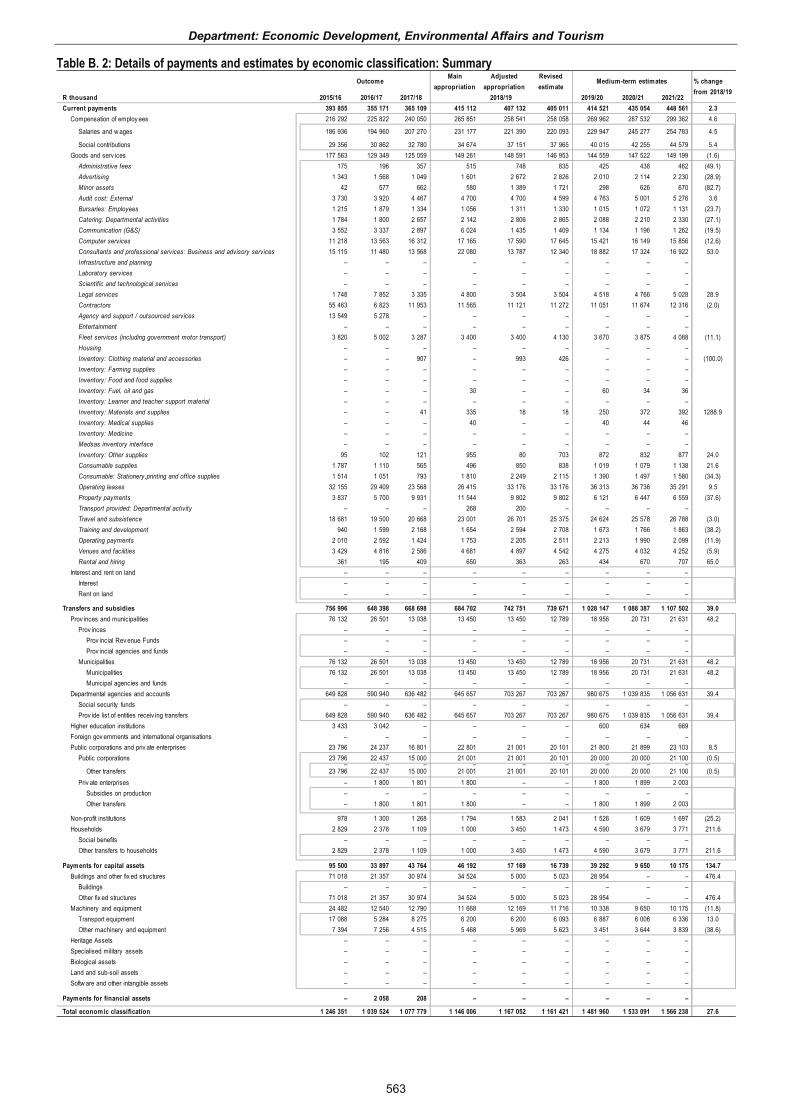
Table B. 2: Details of payments and estimates by economic classification: Summary Outcome
Main appropriation
Adjusted appropriation
Revised estimate
Medium-term estimates
R thousand 2015/16 2016/17 2017/18 2019/20 2020/21 2021/22Current payments 393 855 355 171 365 109 415 112 407 132 405 011 414 521 435 054 448 561 2.3
Compensation of employ ees 216 292 225 822 240 050 265 851 258 541 258 058 269 962 287 532 299 362 4.6
Salaries and w ages 186 936 194 960 207 270 231 177 221 390 220 093 229 947 245 277 254 783 4.5
Social contributions 29 356 30 862 32 780 34 674 37 151 37 965 40 015 42 255 44 579 5.4 Goods and serv ices 177 563 129 349 125 059 149 261 148 591 146 953 144 559 147 522 149 199 (1.6)
Administrative fees 175 196 357 515 748 835 425 438 462 (49.1)Advertising 1 343 1 568 1 049 1 601 2 672 2 826 2 010 2 114 2 230 (28.9)Minor assets 42 577 662 580 1 389 1 721 298 626 670 (82.7)Audit cost: External 3 730 3 920 4 467 4 700 4 700 4 599 4 763 5 001 5 276 3.6 Bursaries: Employees 1 215 1 879 1 334 1 056 1 311 1 330 1 015 1 072 1 131 (23.7)Catering: Departmental activities 1 784 1 800 2 657 2 142 2 806 2 865 2 088 2 210 2 330 (27.1)Communication (G&S) 3 552 3 337 2 897 6 024 1 435 1 409 1 134 1 196 1 262 (19.5)Computer services 11 218 13 563 16 312 17 165 17 590 17 645 15 421 16 149 15 856 (12.6)Consultants and professional services: Business and advisory services 15 115 11 480 13 568 22 080 13 787 12 340 18 882 17 324 16 922 53.0 Infrastructure and planning – – – – – – – – – Laboratory services – – – – – – – – – Scientific and technological services – – – – – – – – – Legal services 1 748 7 852 3 335 4 800 3 504 3 504 4 518 4 766 5 028 28.9 Contractors 55 463 6 823 11 953 11 565 11 121 11 272 11 051 11 674 12 316 (2.0)Agency and support / outsourced services 13 549 5 278 – – – – – – – Entertainment – – – – – – – – – Fleet services (including government motor transport) 3 820 5 002 3 287 3 400 3 400 4 130 3 670 3 875 4 088 (11.1)Housing – – – – – – – – – Inventory: Clothing material and accessories – – 907 – 993 426 – – – (100.0)Inventory: Farming supplies – – – – – – – – – Inventory: Food and food supplies – – – – – – – – – Inventory: Fuel, oil and gas – – – 30 – – 60 34 36 Inventory: Learner and teacher support material – – – – – – – – – Inventory: Materials and supplies – – 41 335 18 18 250 372 392 1288.9 Inventory: Medical supplies – – – 40 – – 40 44 46 Inventory: Medicine – – – – – – – – – Medsas inventory interface – – – – – – – – – Inventory: Other supplies 95 102 121 955 80 703 872 832 877 24.0 Consumable supplies 1 787 1 110 565 496 850 838 1 019 1 079 1 138 21.6 Consumable: Stationery,printing and office supplies 1 514 1 051 793 1 810 2 249 2 115 1 390 1 497 1 580 (34.3)Operating leases 32 155 29 409 23 568 26 415 33 176 33 176 36 313 36 736 35 291 9.5 Property payments 3 837 5 700 9 931 11 544 9 802 9 802 6 121 6 447 6 559 (37.6)Transport provided: Departmental activity – – – 268 200 – – – – Travel and subsistence 18 681 19 500 20 668 23 001 26 701 25 375 24 624 25 578 26 788 (3.0)Training and development 940 1 599 2 168 1 654 2 594 2 708 1 673 1 766 1 863 (38.2)Operating payments 2 010 2 592 1 424 1 753 2 205 2 511 2 213 1 990 2 099 (11.9)Venues and facilities 3 429 4 816 2 586 4 681 4 897 4 542 4 275 4 032 4 252 (5.9)Rental and hiring 361 195 409 650 363 263 434 670 707 65.0
Interest and rent on land – – – – – – – – – Interest – – – – – – – – – Rent on land – – – – – – – – –
Transfers and subsidies 756 996 648 398 668 698 684 702 742 751 739 671 1 028 147 1 088 387 1 107 502 39.0 Prov inces and municipalities 76 132 26 501 13 038 13 450 13 450 12 789 18 956 20 731 21 631 48.2
Prov inces – – – – – – – – – Prov incial Rev enue Funds – – – – – – – – – Prov incial agencies and funds – – – – – – – – –
Municipalities 76 132 26 501 13 038 13 450 13 450 12 789 18 956 20 731 21 631 48.2 Municipalities 76 132 26 501 13 038 13 450 13 450 12 789 18 956 20 731 21 631 48.2 Municipal agencies and funds – – – – – – – – –
Departmental agencies and accounts 649 828 590 940 636 482 645 657 703 267 703 267 980 675 1 039 835 1 056 631 39.4 Social security funds – – – – – – – – – Prov ide list of entities receiv ing transfers 649 828 590 940 636 482 645 657 703 267 703 267 980 675 1 039 835 1 056 631 39.4
Higher education institutions 3 433 3 042 – – – – 600 634 669 Foreign gov ernments and international organisations – – – – – – – – – Public corporations and priv ate enterprises 23 796 24 237 16 801 22 801 21 001 20 101 21 800 21 899 23 103 8.5
Public corporations 23 796 22 437 15 000 21 001 21 001 20 101 20 000 20 000 21 100 (0.5)– – – – – – – – –
Other transfers 23 796 22 437 15 000 21 001 21 001 20 101 20 000 20 000 21 100 (0.5)Priv ate enterprises – 1 800 1 801 1 800 – – 1 800 1 899 2 003
Subsidies on production – – – – – – – – – Other transfers – 1 800 1 801 1 800 – – 1 800 1 899 2 003
Non-profit institutions 978 1 300 1 268 1 794 1 583 2 041 1 526 1 609 1 697 (25.2)Households 2 829 2 378 1 109 1 000 3 450 1 473 4 590 3 679 3 771 211.6
Social benefits – – – – – – – – – Other transfers to households 2 829 2 378 1 109 1 000 3 450 1 473 4 590 3 679 3 771 211.6
Payments for capital assets 95 500 33 897 43 764 46 192 17 169 16 739 39 292 9 650 10 175 134.7 Buildings and other fix ed structures 71 018 21 357 30 974 34 524 5 000 5 023 28 954 – – 476.4
Buildings – – – – – – – – – Other fix ed structures 71 018 21 357 30 974 34 524 5 000 5 023 28 954 – – 476.4
Machinery and equipment 24 482 12 540 12 790 11 668 12 169 11 716 10 338 9 650 10 175 (11.8)Transport equipment 17 088 5 284 8 275 6 200 6 200 6 093 6 887 6 006 6 336 13.0 Other machinery and equipment 7 394 7 256 4 515 5 468 5 969 5 623 3 451 3 644 3 839 (38.6)
Heritage Assets – – – – – – – – – Specialised military assets – – – – – – – – – Biological assets – – – – – – – – – Land and sub-soil assets – – – – – – – – – Softw are and other intangible assets – – – – – – – – –
Payments for financial assets – 2 058 208 – – – – – –
Total economic classification 1 246 351 1 039 524 1 077 779 1 146 006 1 167 052 1 161 421 1 481 960 1 533 091 1 566 238 27.6
% change from 2018/19
2018/19
563

Estimates of the Provincial Revenue and Expenditure (EPRE) - 2019/20 Financial Year
Table B.2A: Details of payments and estimates by economic classification: P1- Administration Outcome
Main appropriation
Adjusted appropriation
Revised estimate
Medium-term estimates
R thousand 2015/16 2016/17 2017/18 2019/20 2020/21 2021/22Current payments 179 299 205 178 205 849 224 015 227 024 227 587 226 169 236 884 244 837 (0.6)
Compensation of employ ees 103 037 108 294 111 326 123 132 118 632 117 922 124 254 132 843 140 150 5.4 Salaries and w ages 88 600 93 193 95 600 105 934 101 434 100 887 102 697 110 061 116 114 1.8 Social contributions 14 437 15 101 15 726 17 198 17 198 17 035 21 557 22 782 24 036 26.5
Goods and serv ices 76 262 96 884 94 523 100 883 108 392 109 665 101 915 104 041 104 687 (7.1)Administrative fees 168 196 343 422 678 765 325 341 360 (57.5)Advertising 624 1 051 395 651 652 626 1 050 1 108 1 169 67.7 Minor assets 42 577 662 300 1 389 1 721 208 219 241 (87.9)Audit cost: External 3 730 3 920 4 467 4 700 4 700 4 599 4 763 5 001 5 276 3.6 Bursaries: Employees 1 215 1 879 1 334 1 056 1 311 1 330 1 015 1 072 1 131 (23.7)Catering: Departmental activities 326 361 236 271 511 519 329 347 366 (36.6)Communication (G&S) 3 552 3 337 2 897 6 024 1 435 1 409 1 134 1 196 1 262 (19.5)Computer services 7 993 11 965 15 308 11 024 15 544 15 374 10 692 11 291 10 730 (30.5)Consultants and professional services: Business and advisory services 5 557 4 611 4 400 7 449 4 959 4 987 7 294 5 828 6 148 46.3 Infrastructure and planning – – – – – – – – – Laboratory services – – – – – – – – – Scientific and technological services – – – – – – – – – Legal services 1 748 7 852 3 335 4 800 3 504 3 504 4 518 4 766 5 028 28.9 Contractors 114 6 651 11 625 10 995 10 658 10 909 10 678 11 277 11 897 (2.1)Agency and support / outsourced services – – – – – – – – – Entertainment – – – – – – – – – Fleet services (including government motor transport) 3 820 5 002 3 287 3 400 3 400 4 130 3 670 3 875 4 088 (11.1)Housing – – – – – – – – – Inventory: Clothing material and accessories – – 254 – 95 95 – – – (100.0)Inventory: Farming supplies – – – – – – – – – Inventory: Food and food supplies – – – – – – – – – Inventory: Fuel, oil and gas – – – – – – – – – Inventory: Learner and teacher support material – – – – – – – – – Inventory: Materials and supplies – – – – – – – – – Inventory: Medical supplies – – – – – – – – – Inventory: Medicine – – – – – – – – – Medsas inventory interface – – – – – – – – – Inventory: Other supplies – – – – – – – – – Consumable supplies 989 960 550 496 810 798 969 1 023 1 079 21.4 Consumable: Stationery,printing and office supplies 818 800 701 1 084 1 443 1 395 505 534 564 (63.8)Operating leases 32 155 29 409 23 568 26 415 33 176 33 176 36 313 36 736 35 291 9.5 Property payments 3 837 5 700 9 931 11 544 9 802 9 802 6 121 6 447 6 559 (37.6)Transport provided: Departmental activity – – – – – – – – – Travel and subsistence 6 322 7 998 7 484 6 333 8 968 9 095 8 196 8 617 8 895 (9.9)Training and development 940 1 546 2 132 1 654 2 594 2 708 1 673 1 766 1 863 (38.2)Operating payments 1 727 2 380 1 156 1 732 2 070 2 031 1 868 1 971 2 079 (8.0)Venues and facilities 585 689 458 533 693 692 594 626 661 (14.2)Rental and hiring – – – – – – – – –
Interest and rent on land – – – – – – – – – Interest – – – – – – – – – Rent on land – – – – – – – – –
Transfers and subsidies 2 829 2 378 1 109 1 003 3 450 1 473 5 190 4 313 4 440 252.3 Prov inces and municipalities – – – – – – – – –
Prov inces – – – – – – – – – Prov incial Rev enue Funds – – – – – – – – – Prov incial agencies and funds – – – – – – – – –
Municipalities – – – – – – – – – Municipalities – – – – – – – – – Municipal agencies and funds – – – – – – – – –
Departmental agencies and accounts – – – 3 – – – – – Social security funds – – – – – – – – – Prov ide list of entities receiv ing transfers – – – 3 – – – – –
Higher education institutions – – – – – – 600 634 669 Foreign gov ernments and international organisations – – – – – – – – – Public corporations and priv ate enterprises – – – – – – – – –
Public corporations – – – – – – – – – Subsidies on production – – – – – – – – –Other transfers – – – – – – – – –
Priv ate enterprises – – – – – – – – – Subsidies on production – – – – – – – – – Other transfers – – – – – – – – –
Non-profit institutions – – – – – – – – – Households 2 829 2 378 1 109 1 000 3 450 1 473 4 590 3 679 3 771 211.6
Social benefits – – – – – – – – – Other transfers to households 2 829 2 378 1 109 1 000 3 450 1 473 4 590 3 679 3 771 211.6
Payments for capital assets 14 617 11 293 12 755 9 669 12 169 11 716 10 338 9 650 10 175 (11.8)Buildings and other fix ed structures – – – – – – – – –
Buildings – – – – – – – – – Other fix ed structures – – – – – – – – –
Machinery and equipment 14 617 11 293 12 755 9 669 12 169 11 716 10 338 9 650 10 175 (11.8)Transport equipment 7 223 5 284 8 275 6 200 6 200 6 093 6 887 6 006 6 336 13.0 Other machinery and equipment 7 394 6 009 4 480 3 469 5 969 5 623 3 451 3 644 3 839 (38.6)
Heritage Assets – – – – – – – – – Specialised military assets – – – – – – – – – Biological assets – – – – – – – – – Land and sub-soil assets – – – – – – – – – Softw are and other intangible assets – – – – – – – – –
Payments for financial assets – 2 058 208 – – – – – –
Total economic classification 196 745 220 907 219 921 234 687 242 643 240 776 241 697 250 847 259 452 0.4
% change from 2018/19
2018/19
564

Department: Economic Development, Environmental Affairs and Tourism
Table B.2B: Details of payments and estimates by economic classification: P2 - Economic Development and Tourism Outcome
Main appropriation
Adjusted appropriation
Revised estimate
Medium-term estimates
R thousand 2015/16 2016/17 2017/18 2019/20 2020/21 2021/22Current payments 129 863 63 304 75 041 88 881 83 459 81 323 81 244 86 579 91 336 (0.1)
Compensation of employ ees 41 370 43 010 56 784 59 930 60 988 60 689 60 406 65 436 69 033 (0.5)Salaries and w ages 36 392 37 686 49 721 53 544 53 102 52 031 53 660 58 320 61 527 3.1 Social contributions 4 978 5 324 7 063 6 386 7 886 8 658 6 746 7 116 7 506 (22.1)
Goods and serv ices 88 493 20 294 18 257 28 951 22 471 20 634 20 838 21 143 22 303 1.0 Administrative fees 4 – – 23 – – 20 21 22 Advertising 628 517 648 900 2 000 2 093 900 950 1 002 (57.0)Minor assets – – – – – – – – – Audit cost: External – – – – – – – – – Bursaries: Employees – – – – – – – – – Catering: Departmental activities 871 713 1 178 1 167 1 097 1 058 1 024 1 078 1 136 (3.2)Communication (G&S) – – – – – – – – – Computer services 3 225 1 598 966 3 487 1 302 1 527 2 000 2 112 2 228 31.0 Consultants and professional services: Business and advisory services 8 319 4 845 8 358 12 931 7 006 6 031 8 088 8 021 8 463 34.1 Infrastructure and planning – – – – – – – – – Laboratory services – – – – – – – – – Scientific and technological services – – – – – – – – – Legal services – – – – – – – – – Contractors 55 304 123 167 280 280 180 70 74 78 (61.1)Agency and support / outsourced services 13 549 5 278 – – – – – – – Entertainment – – – – – – – – – Fleet services (including government motor transport) – – – – – – – – – Housing – – – – – – – – – Inventory: Clothing material and accessories – – – – – – – – – Inventory: Farming supplies – – – – – – – – – Inventory: Food and food supplies – – – – – – – – – Inventory: Fuel, oil and gas – – – – – – – – – Inventory: Learner and teacher support material – – – – – – – – – Inventory: Materials and supplies – – – – – – – – – Inventory: Medical supplies – – – – – – – – – Inventory: Medicine – – – – – – – – – Medsas inventory interface – – – – – – – – – Inventory: Other supplies – – – – – – – – – Consumable supplies – – – – – – – – – Consumable: Stationery,printing and office supplies 83 – 92 470 300 215 295 312 329 37.2 Operating leases – – – – – – – – – Property payments – – – – – – – – – Transport provided: Departmental activity – – – – – – – – – Travel and subsistence 4 525 4 397 5 305 6 915 7 607 6 994 6 113 6 368 6 718 (12.6)Training and development – – – – – – – – – Operating payments 63 35 153 11 11 44 7 7 7 (84.1)Venues and facilities 1 831 2 788 1 189 2 716 2 868 2 492 2 321 2 200 2 320 (6.9)Rental and hiring 91 – 201 50 – – – – –
Interest and rent on land – – – – – – – – – Interest – – – – – – – – – Rent on land – – – – – – – – –
Transfers and subsidies 549 276 437 514 463 330 467 354 523 167 522 267 794 005 841 763 850 665 52.0 Prov inces and municipalities 65 300 15 500 1 000 770 770 770 – – – (100.0)
Prov inces – – – – – – – – – Prov incial Rev enue Funds – – – – – – – – – Prov incial agencies and funds – – – – – – – – –
Municipalities 65 300 15 500 1 000 770 770 770 – – – (100.0)Municipalities 65 300 15 500 1 000 770 770 770 – – – (100.0)Municipal agencies and funds – – – – – – – – –
Departmental agencies and accounts 456 747 394 735 445 529 443 783 501 396 501 396 772 205 819 864 827 562 54.0 Social security funds – – – – – – – – – Prov ide list of entities receiv ing transfers 456 747 394 735 445 529 443 783 501 396 501 396 772 205 819 864 827 562 54.0
Higher education institutions 3 433 3 042 – – – – – – – Foreign gov ernments and international organisations – – – – – – – – – Public corporations and priv ate enterprises 23 796 24 237 16 801 22 801 21 001 20 101 21 800 21 899 23 103 8.5
Public corporations 23 796 22 437 15 000 21 001 21 001 20 101 20 000 20 000 21 100 (0.5)Subsidies on production – – – – – – – – –Other transfers 23 796 22 437 15 000 21 001 21 001 20 101 20 000 20 000 21 100 (0.5)
Priv ate enterprises – 1 800 1 801 1 800 – – 1 800 1 899 2 003 Subsidies on production – – – – – – – – – Other transfers – 1 800 1 801 1 800 – – 1 800 1 899 2 003
Non-profit institutions – – – – – – – – – Households – – – – – – – – –
Social benefits – – – – – – – – – Other transfers to households – – – – – – – – –
Payments for capital assets 80 883 21 972 30 974 35 307 5 000 5 023 28 954 – – 476.4 Buildings and other fix ed structures 71 018 21 357 30 974 34 524 5 000 5 023 28 954 – – 476.4
Buildings – – – – – – – – – Other fix ed structures 71 018 21 357 30 974 34 524 5 000 5 023 28 954 – – 476.4
Machinery and equipment 9 865 615 – 783 – – – – – Transport equipment 9 865 – – – – – – – – Other machinery and equipment – 615 – 783 – – – – –
Heritage Assets – – – – – – – – – Specialised military assets – – – – – – – – – Biological assets – – – – – – – – – Land and sub-soil assets – – – – – – – – – Softw are and other intangible assets – – – – – – – – –
Payments for financial assets – – – – – – – – –
Total economic classification 760 022 522 790 569 345 591 542 611 626 608 613 904 203 928 342 942 001 48.6
% change from 2018/19
2018/19
565
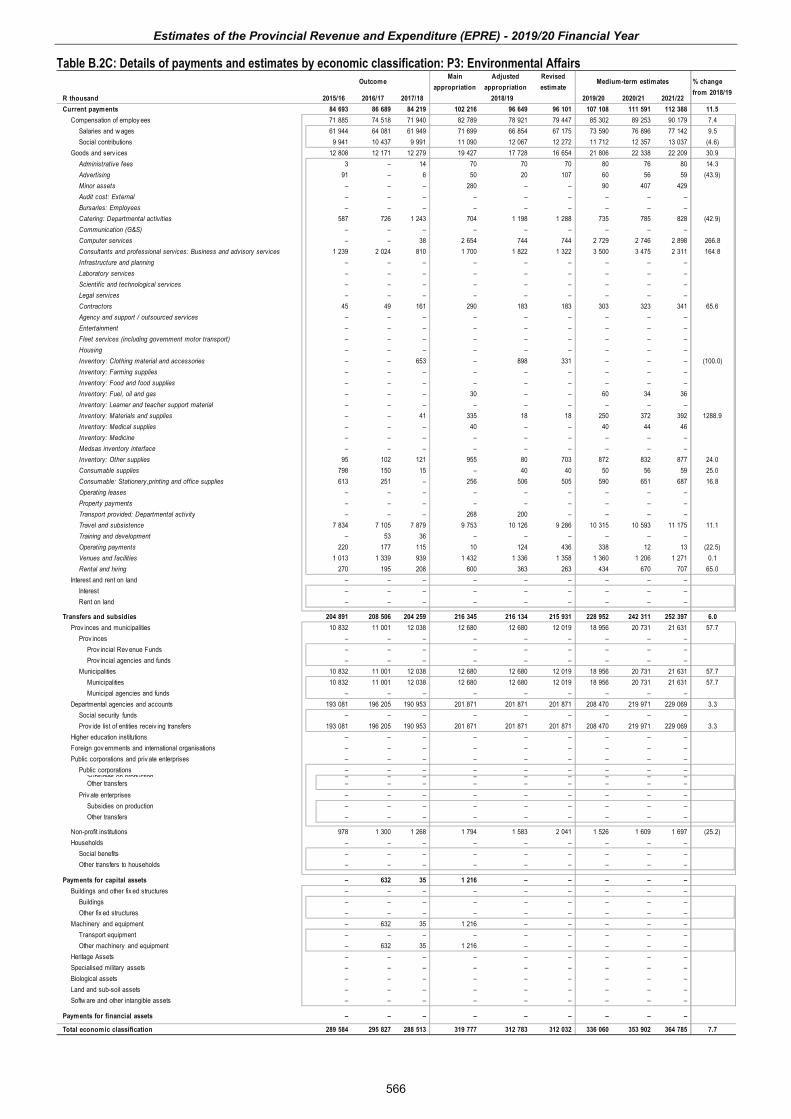
Estimates of the Provincial Revenue and Expenditure (EPRE) - 2019/20 Financial Year
Table B.2C: Details of payments and estimates by economic classification: P3: Environmental Affairs Outcome
Main appropriation
Adjusted appropriation
Revised estimate
Medium-term estimates
R thousand 2015/16 2016/17 2017/18 2019/20 2020/21 2021/22Current payments 84 693 86 689 84 219 102 216 96 649 96 101 107 108 111 591 112 388 11.5
Compensation of employ ees 71 885 74 518 71 940 82 789 78 921 79 447 85 302 89 253 90 179 7.4 Salaries and w ages 61 944 64 081 61 949 71 699 66 854 67 175 73 590 76 896 77 142 9.5 Social contributions 9 941 10 437 9 991 11 090 12 067 12 272 11 712 12 357 13 037 (4.6)
Goods and serv ices 12 808 12 171 12 279 19 427 17 728 16 654 21 806 22 338 22 209 30.9 Administrative fees 3 – 14 70 70 70 80 76 80 14.3 Advertising 91 – 6 50 20 107 60 56 59 (43.9)Minor assets – – – 280 – – 90 407 429 Audit cost: External – – – – – – – – – Bursaries: Employees – – – – – – – – – Catering: Departmental activities 587 726 1 243 704 1 198 1 288 735 785 828 (42.9)Communication (G&S) – – – – – – – – – Computer services – – 38 2 654 744 744 2 729 2 746 2 898 266.8 Consultants and professional services: Business and advisory services 1 239 2 024 810 1 700 1 822 1 322 3 500 3 475 2 311 164.8 Infrastructure and planning – – – – – – – – – Laboratory services – – – – – – – – – Scientific and technological services – – – – – – – – – Legal services – – – – – – – – – Contractors 45 49 161 290 183 183 303 323 341 65.6 Agency and support / outsourced services – – – – – – – – – Entertainment – – – – – – – – – Fleet services (including government motor transport) – – – – – – – – – Housing – – – – – – – – – Inventory: Clothing material and accessories – – 653 – 898 331 – – – (100.0)Inventory: Farming supplies – – – – – – – – – Inventory: Food and food supplies – – – – – – – – – Inventory: Fuel, oil and gas – – – 30 – – 60 34 36 Inventory: Learner and teacher support material – – – – – – – – – Inventory: Materials and supplies – – 41 335 18 18 250 372 392 1288.9 Inventory: Medical supplies – – – 40 – – 40 44 46 Inventory: Medicine – – – – – – – – – Medsas inventory interface – – – – – – – – – Inventory: Other supplies 95 102 121 955 80 703 872 832 877 24.0 Consumable supplies 798 150 15 – 40 40 50 56 59 25.0 Consumable: Stationery,printing and office supplies 613 251 – 256 506 505 590 651 687 16.8 Operating leases – – – – – – – – – Property payments – – – – – – – – – Transport provided: Departmental activity – – – 268 200 – – – – Travel and subsistence 7 834 7 105 7 879 9 753 10 126 9 286 10 315 10 593 11 175 11.1 Training and development – 53 36 – – – – – – Operating payments 220 177 115 10 124 436 338 12 13 (22.5)Venues and facilities 1 013 1 339 939 1 432 1 336 1 358 1 360 1 206 1 271 0.1 Rental and hiring 270 195 208 600 363 263 434 670 707 65.0
Interest and rent on land – – – – – – – – – Interest – – – – – – – – – Rent on land – – – – – – – – –
Transfers and subsidies 204 891 208 506 204 259 216 345 216 134 215 931 228 952 242 311 252 397 6.0 Prov inces and municipalities 10 832 11 001 12 038 12 680 12 680 12 019 18 956 20 731 21 631 57.7
Prov inces – – – – – – – – – Prov incial Rev enue Funds – – – – – – – – – Prov incial agencies and funds – – – – – – – – –
Municipalities 10 832 11 001 12 038 12 680 12 680 12 019 18 956 20 731 21 631 57.7 Municipalities 10 832 11 001 12 038 12 680 12 680 12 019 18 956 20 731 21 631 57.7 Municipal agencies and funds – – – – – – – – –
Departmental agencies and accounts 193 081 196 205 190 953 201 871 201 871 201 871 208 470 219 971 229 069 3.3 Social security funds – – – – – – – – – Prov ide list of entities receiv ing transfers 193 081 196 205 190 953 201 871 201 871 201 871 208 470 219 971 229 069 3.3
Higher education institutions – – – – – – – – – Foreign gov ernments and international organisations – – – – – – – – – Public corporations and priv ate enterprises – – – – – – – – –
Public corporations – – – – – – – – – Subsidies on production – – – – – – – – –Other transfers – – – – – – – – –
Priv ate enterprises – – – – – – – – – Subsidies on production – – – – – – – – – Other transfers – – – – – – – – –
Non-profit institutions 978 1 300 1 268 1 794 1 583 2 041 1 526 1 609 1 697 (25.2)Households – – – – – – – – –
Social benefits – – – – – – – – – Other transfers to households – – – – – – – – –
Payments for capital assets – 632 35 1 216 – – – – – Buildings and other fix ed structures – – – – – – – – –
Buildings – – – – – – – – – Other fix ed structures – – – – – – – – –
Machinery and equipment – 632 35 1 216 – – – – – Transport equipment – – – – – – – – – Other machinery and equipment – 632 35 1 216 – – – – –
Heritage Assets – – – – – – – – – Specialised military assets – – – – – – – – – Biological assets – – – – – – – – – Land and sub-soil assets – – – – – – – – – Softw are and other intangible assets – – – – – – – – –
Payments for financial assets – – – – – – – – –
Total economic classification 289 584 295 827 288 513 319 777 312 783 312 032 336 060 353 902 364 785 7.7
% change from 2018/19
2018/19
566
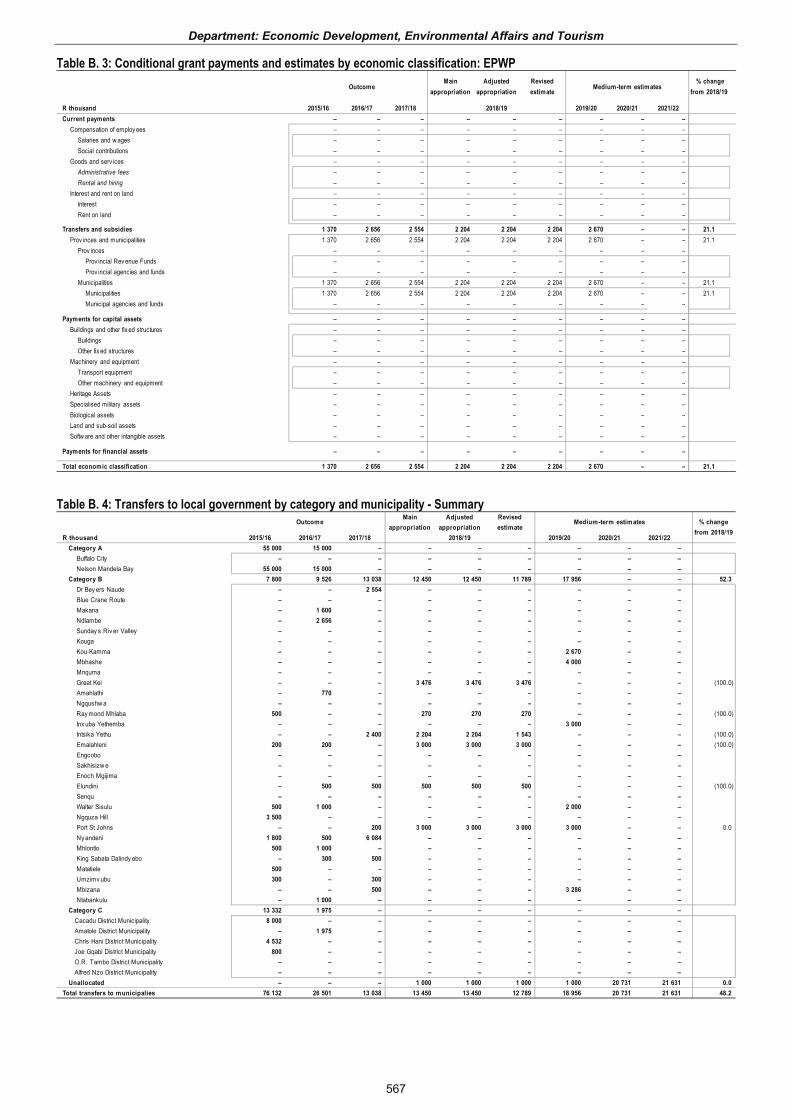
Department: Economic Development, Environmental Affairs and Tourism
Table B. 3: Conditional grant payments and estimates by economic classification: EPWP Outcome
Main appropriation
Adjusted appropriation
Revised estimate
Medium-term estimates % change
from 2018/19
R thousand 2015/16 2016/17 2017/18 2019/20 2020/21 2021/22Current payments – – – – – – – – –
Compensation of employ ees – – – – – – – – – Salaries and w ages – – – – – – – – – Social contributions – – – – – – – – –
Goods and serv ices – – – – – – – – – Administrative fees – – – – – – – – – Rental and hiring – – – – – – – – –
Interest and rent on land – – – – – – – – – Interest – – – – – – – – – Rent on land – – – – – – – – –
Transfers and subsidies 1 370 2 656 2 554 2 204 2 204 2 204 2 670 – – 21.1 Prov inces and municipalities 1 370 2 656 2 554 2 204 2 204 2 204 2 670 – – 21.1
Prov inces – – – – – – – – – Prov incial Rev enue Funds – – – – – – – – – Prov incial agencies and funds – – – – – – – – –
Municipalities 1 370 2 656 2 554 2 204 2 204 2 204 2 670 – – 21.1 Municipalities 1 370 2 656 2 554 2 204 2 204 2 204 2 670 – – 21.1 Municipal agencies and funds – – – – – – – – –
Payments for capital assets – – – – – – – – – Buildings and other fix ed structures – – – – – – – – –
Buildings – – – – – – – – – Other fix ed structures – – – – – – – – –
Machinery and equipment – – – – – – – – – Transport equipment – – – – – – – – – Other machinery and equipment – – – – – – – – –
Heritage Assets – – – – – – – – – Specialised military assets – – – – – – – – – Biological assets – – – – – – – – – Land and sub-soil assets – – – – – – – – – Softw are and other intangible assets – – – – – – – – –
Payments for financial assets – – – – – – – – –
Total economic classification 1 370 2 656 2 554 2 204 2 204 2 204 2 670 – – 21.1
2018/19
Table B. 4: Transfers to local government by category and municipality - Summary Outcome
Main appropriation
Adjusted appropriation
Revised estimate
Medium-term estimates
R thousand 2015/16 2016/17 2017/18 2019/20 2020/21 2021/22Category A 55 000 15 000 – – – – – – –
Buffalo City – – – – – – – – – Nelson Mandela Bay 55 000 15 000 – – – – – – –
Category B 7 800 9 526 13 038 12 450 12 450 11 789 17 956 – – 52.3 Dr Bey ers Naude – – 2 554 – – – – – – Blue Crane Route – – – – – – – – – Makana – 1 600 – – – – – – – Ndlambe – 2 656 – – – – – – – Sunday s Riv er Valley – – – – – – – – – Kouga – – – – – – – – – Kou-Kamma – – – – – – 2 670 – – Mbhashe – – – – – – 4 000 – – Mnquma – – – – – – – – – Great Kei – – – 3 476 3 476 3 476 – – – (100.0) Amahlathi – 770 – – – – – – – Ngqushw a – – – – – – – – – Ray mond Mhlaba 500 – – 270 270 270 – – – (100.0) Inx uba Yethemba – – – – – – 3 000 – – Intsika Yethu – – 2 400 2 204 2 204 1 543 – – – (100.0) Emalahleni 200 200 – 3 000 3 000 3 000 – – – (100.0) Engcobo – – – – – – – – – Sakhisizw e – – – – – – – – – Enoch Mgijima – – – – – – – – – Elundini – 500 500 500 500 500 – – – (100.0) Senqu – – – – – – – – – Walter Sisulu 500 1 000 – – – – 2 000 – – Ngquza Hill 3 500 – – – – – – – – Port St Johns – – 200 3 000 3 000 3 000 3 000 – – 0.0 Ny andeni 1 800 500 6 084 – – – – – – Mhlontlo 500 1 000 – – – – – – – King Sabata Dalindy ebo – 300 500 – – – – – – Matatiele 500 – – – – – – – – Umzimv ubu 300 – 300 – – – – – – Mbizana – – 500 – – – 3 286 – – Ntabankulu – 1 000 – – – – – – –
Category C 13 332 1 975 – – – – – – – Cacadu District Municipality 8 000 – – – – – – – – Amatole District Municipality – 1 975 – – – – – – – Chris Hani District Municipality 4 532 – – – – – – – – Joe Gqabi District Municipality 800 – – – – – – – – O.R. Tambo District Municipality – – – – – – – – – Alfred Nzo District Municipality – – – – – – – – –
Unallocated – – – 1 000 1 000 1 000 1 000 20 731 21 631 0.0Total transfers to municipalies 76 132 26 501 13 038 13 450 13 450 12 789 18 956 20 731 21 631 48.2
% change from 2018/19
2018/19
567

Tabl
e B. 5
: Pay
men
ts o
f inf
rast
ruct
ure b
y cat
egor
y (Pr
ojec
t List
)
No.
Type
of
infra
stru
ctur
e Pr
ojec
t nam
e ID
MS G
ates
Mu
nicip
ality
/ Re
gion
Pr
ojec
t dur
atio
n So
urce
of
fund
ing
Budg
et
Prog
ram
me
nam
e De
liver
y Me
chan
ism
Tota
l pr
ojec
t co
st
Tota
l Ex
pend
iture
fro
m
prev
ious
ye
ars
Tota
l av
ailab
le MT
EF
For
ward
estim
ates
R th
ousa
nds
Da
te: S
tart
Date
: Fin
ish
20
19/20
MT
EF
2020
/21
MTEF
20
21/22
New
infra
stru
ctur
e ass
ets
1 Bu
ilding
s Int
egra
ted
Socia
l Inf
rastr
uctur
e De
velop
ment
Proje
cts
(ISID
P) b
y Co
ega
Deve
lopme
nt Co
oper
ation
W
orks
Ne
lson
Mand
ela B
ay
Metro
01
/04/20
16
30/03
/2020
Eq
uitab
le sh
are
Econ
omic
Deve
lopme
nt &
Tour
ism
Indiv
idual
proje
ct
71 43
2 34
524
28 95
4 –
–
Tota
l Ne
w in
frast
ruct
ure
asse
ts
71 43
2 34
524
28 95
4 –
– No
n in
frast
ruct
ure
1 No
n- In
frastr
uctur
e Ex
pand
ed
Publi
c W
ork
Proje
ct W
orks
Int
sika Y
etu
01/04
/2016
30
/03/20
20
Cond
itiona
l gr
ants
Envir
onme
ntal
Affai
rs In
dividu
al pr
oject
2 2
04
2 204
2 6
70
– –
Tota
l Non
-infra
stru
ctur
e
2 2
04
2 204
2 6
70
– –
Tota
l Ec
onom
ic De
velo
pmen
t, En
viron
men
tal
Affa
irs
And
Tour
ism
Infra
stru
ctur
e
73
636
36 72
8 31
624
– –
EN
D O
F EP
RE
568

569
570