paid leave in america - shrm advocacy
TRANSCRIPT

PAID LEAVE IN AMERICAAN ECONOMIC OVERVIEW


3
Paid leave in America An economic overview
Contents
Executive summary 4
The current state of paid leave benefits 7
An overview of offerings and utilization 7
Employer size and cascading impact of state mandates 9
Paid leave and competitive advantage 12
Paying for paid leave benefits 14
Estimating costs of a national program 14
Comparing our research to other paid leave cost estimates 16
Strategies for containing costs: New child leave 17
Other strategies for containing costs 19
Conclusion 20
Appendix 22
Notes on our sample population 22
Notes on cost estimates 24

4
Paid leave in America An economic overview
Executive summaryA comprehensive overview of paid leave offerings and usage in the United States is surprisingly hard to come by. To shed light on this important topic, Oxford Economics and the Society for Human Resource Management (SHRM) surveyed over 1,000 human resource (HR) managers within SHRM’s membership across the United States and more than 500 senior executives in the US drawn from outside SHRM’s membership. We also conducted three in-depth interviews with senior HR executives.
This report details the findings from our research, including statistics about paid leave offerings and usage, insights into the motivations of employers considering various paid leave policies, and perceptions about the value and cost of providing these benefits. The survey results also allow us to estimate how frequently employees use these programs and for how long. By examining the actual experience of employers that offer these benefits, we are able to provide estimates of what paid leave benefits would cost if mandated at the national level.
The survey results and analytics presented in this report were completed prior to the COVID-19 pandemic, and our report does not specifically address the role of paid sick leave. While our government’s policy responses are rapidly evolving, the role of paid leave is an important part of the national conversation. Our report likely will not inform the immediate response of our government to the current crisis, but hopefully will help guide a more informed discussion about the role of paid family leave in the longer term.
Our surveys examined four types of paid family leave programs: new child care leave for women, new child care leave for men, extended personal medical leave, and extended family care leave (see our definitions box below).
How we defined paid leave
For the purposes of this study, we focused on the following types of paid leave:
Paid new child leave (for women or for men): Gives employees paid time off to care for and bond with a new child, whether after a birth or an adoption. New child leave for women might be a standalone benefit or, for birth mothers, may be covered by short-term disability.
Paid extended family care leave: Gives workers paid time off to care for a sick family member, including children, spouses, and parents. Note that this benefit goes beyond the (unpaid) Family and Medical Leave Act of 1993 (FMLA), since it is paid.
Paid personal extended medical leave: Gives employees paid time off to care for their own illness or disability. This could include short-term disability leave, if relevant.
Note that these types of leave are distinct from one-off sick days, vacation days, or personal days. The types of paid leave we refer to in this survey are for extended absences. However, these policies also could include unlimited paid time off or open leave.

5
Paid leave in America An economic overview
The research into these types of paid leave shows:
l Most employers offering paid leave do so voluntarily. Overall, employers in our HR survey offer paid leave between 35% and 55% of the time, depending on the type of leave. Most employers that offer the benefit do so without being required to, but a sizable minority of those offering leave programs have operations in one of the four states that mandated paid leave benefits in 2019.
l Paid leave offerings are expected to stay the same or increase over the coming years. Assuming there are no changes to legal or regulatory requirements, a majority of HR respondents expect their paid leave offerings to remain the same for both salaried and hourly employees over the next two years. Nearly one-fifth (19%) expect to voluntarily increase offerings—possibly because paid leave is seen by many employers as having benefits for talent retention and recruitment in a competitive labor market. These numbers could swell in response to COVID-19.
l Not all employees have equal access to paid leave and other employer-sponsored benefits. Employers offering paid leave often put eligibility requirements in place, such as full-time status or minimum tenure. At surveyed companies offering paid leave programs, HR respondents reported that roughly two-thirds of employees are eligible for the benefits—which suggests the other one-third do not meet eligibility requirements and thus do not have paid leave available to them.
l Women are more likely than men to utilize the full paid leave benefits offered to them for new child care. In addition to medical considerations that may affect women’s decisions to take leave, cultural norms and expectations also come into play. Some new parents may have concerns that extended leave jeopardizes future earnings or advancement, and these fears may not be unfounded: only one-third of senior executives who have taken paid leave strongly agreed that the time away did not adversely affect their careers.
l State mandates have a ripple effect on employer offerings throughout the nation. At year-end 2019, four states mandated paid family leave or required firms to participate in equivalent partial wage-replacement programs: California, New York, New Jersey, and Rhode Island.1 Our findings suggest that when an employer with facilities in multiple states has an operation in one of these four mandate states, that organization’s policies tend to resemble those of employers operating only in a state with a paid leave mandate. The impact of even a few state mandates seems to cascade throughout the economy.
1 In addition to these four states, eight other states plus the District of Columbia mandated paid sick leave in 2019. For purposes of this paper, however, we are focused on the four states cited above, which have mandated more comprehensive paid family leave programs.

6
Paid leave in America An economic overview
l Growing state and local regulation may increase complexity. The number of states mandating paid leave continues to grow. As of early 2020, Washington, Nevada, and the District of Columbia have also mandated paid leave, and Connecticut and Massachusetts will join their ranks in 2021. Some employers note that the increasing number of state programs introduces a degree of complexity into paid leave administration, including not only determining minimum weeks offered but also standardizing eligibility definitions (e.g., appropriate medical events, family members).
l The cost of a comprehensive national paid leave program would likely range between $21.5 billion and $43.0 billion annually, depending on policy. The most commonly cited reason by employers for not offering paid leave programs was cost. This report explores the potential costs that would result if a national paid leave program were introduced and examines possible policy options to control program expenses. Depending on the policy scenarios, we estimate the combined annual cost of paid leave programs to range between $21.5 billion and $43.0 billion annually (less than currently allocated for many other social programs). This is comparable to other published studies, including cost estimates released by the Congressional Budget Office earlier this year.
All of these topics—including statistics from the surveys, insights from our executive interviews, detail on our cost calculations and policy options examined, and comparison to other comparable studies—are covered in greater depth in the pages that follow.
7
Paid leave in America An economic overview
An overview of offerings and utilization
The United States stands apart from other countries in its approach to paid leave. As the only developed country without nationally mandated paid leave programs,2 employers in most states often end up taking on the decision of how much paid leave to offer their workers, and at what pay rate. Often these policies extend beyond parental leave to personal medical leave or extended family care leave.
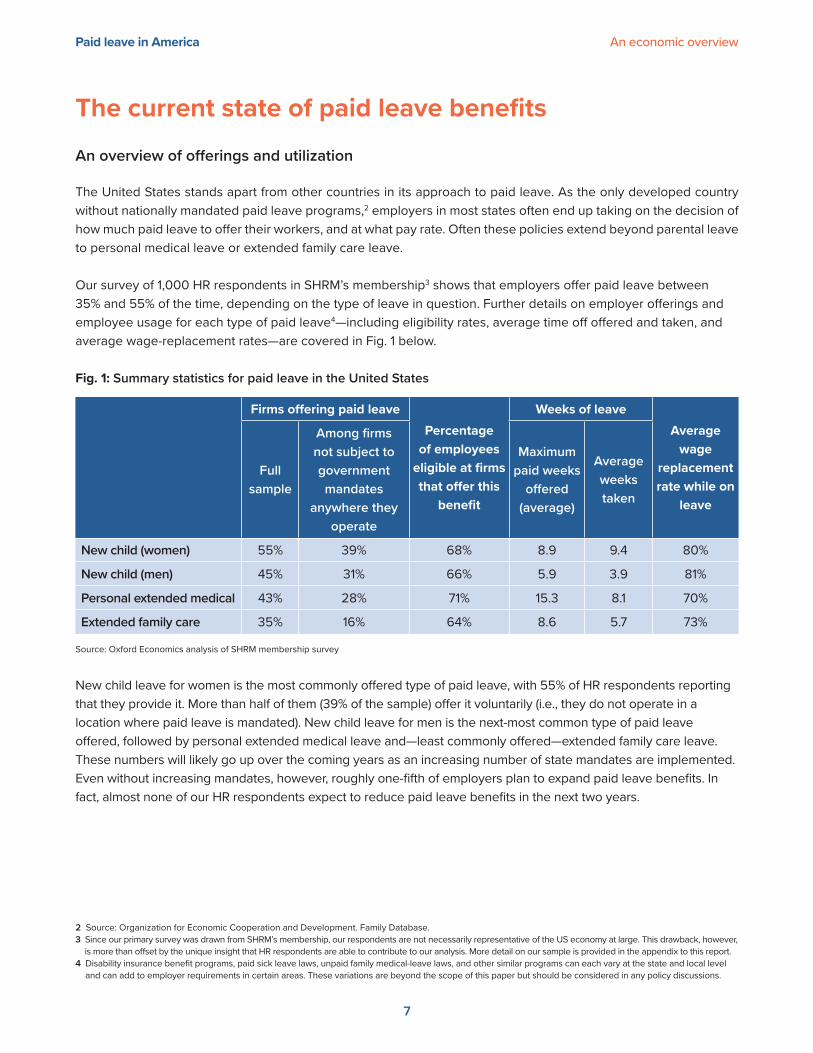
Our survey of 1,000 HR respondents in SHRM’s membership3 shows that employers offer paid leave between 35% and 55% of the time, depending on the type of leave in question. Further details on employer offerings and employee usage for each type of paid leave4—including eligibility rates, average time off offered and taken, and average wage-replacement rates—are covered in Fig. 1 below.
Fig. 1: Summary statistics for paid leave in the United States
Firms offering paid leavePercentage
of employees eligible at firms that offer this
benefit
Weeks of leaveAverage
wage replacement rate while on
leave
Full sample
Among firms not subject to government mandates
anywhere they operate
Maximum paid weeks
offered (average)
Average weeks taken
New child (women) 55% 39% 68% 8.9 9.4 80%
New child (men) 45% 31% 66% 5.9 3.9 81%
Personal extended medical 43% 28% 71% 15.3 8.1 70%
Extended family care 35% 16% 64% 8.6 5.7 73%
Source: Oxford Economics analysis of SHRM membership survey
New child leave for women is the most commonly offered type of paid leave, with 55% of HR respondents reporting that they provide it. More than half of them (39% of the sample) offer it voluntarily (i.e., they do not operate in a location where paid leave is mandated). New child leave for men is the next-most common type of paid leave offered, followed by personal extended medical leave and—least commonly offered—extended family care leave. These numbers will likely go up over the coming years as an increasing number of state mandates are implemented. Even without increasing mandates, however, roughly one-fifth of employers plan to expand paid leave benefits. In fact, almost none of our HR respondents expect to reduce paid leave benefits in the next two years.
2 Source: Organization for Economic Cooperation and Development. Family Database.3 Since our primary survey was drawn from SHRM’s membership, our respondents are not necessarily representative of the US economy at large. This drawback, however,
is more than offset by the unique insight that HR respondents are able to contribute to our analysis. More detail on our sample is provided in the appendix to this report.4 Disability insurance benefit programs, paid sick leave laws, unpaid family medical-leave laws, and other similar programs can each vary at the state and local level
and can add to employer requirements in certain areas. These variations are beyond the scope of this paper but should be considered in any policy discussions.
The current state of paid leave benefits

8
Paid leave in America An economic overview
As organizations consider their paid leave offerings, eligibility requirements should be a key part of the planning process. Among organizations offering paid leave, HR respondents report that roughly two-thirds of their employees are eligible for the paid leave they provide, presumably leaving one-third of employees who do not meet various requirements without any paid leave. In addition, contingent or contract work—an increasingly common employment model—may also leave individuals without qualifying for any employer-sponsored benefits.
The data in Fig. 1 also reveal important variations in the ways men and women use paid leave benefits. According to HR respondents, women took an average 9.4 weeks of new child leave, slightly more than the average 8.9 weeks offered.5 Men, on the other hand, used new child leave for an average of 3.9 weeks, substantially less than the average 5.9 weeks offered. This difference is particularly notable since for both programs, wage replacement was approximately 80%.
There are a few possible explanations—ranging from medical to cultural—for this divergence in usage between male and female parents. For example, the senior executives we interviewed have experienced reluctance among male employees to fully use their paid leave, and many are taking steps to change this pattern. When IBM rolled out its new parental leave, an internal survey showed that men were not taking as much of the time off available to them as female employees were, or they were taking it intermittently. Leadership at the company encourages new fathers who may feel pressure to return to work sooner after the birth of a child to take their leave; oftentimes managers must work hard to make sure employees know they have that permission.
5 This imbalance might reflect weeks taken unpaid. FMLA allows for 12 weeks of unpaid, job-protected leave.
Reducing eligibility requirements has turned out to be beneficial for Johnson & Johnson, the 134-year-old consumer products, medical devices, and pharmaceuticals company, in more ways than originally expected. The company offers eight weeks of parental leave (in addition to maternity and paternity minimums immediately after birth or adoption) within the first year of having a new child.
“It’s for all new parents—maternal, paternal, adoptive, or surrogacy-assisted,”says Kristen Mulholland, the company’s Global Head of Total Rewards.
The leave is flexible, allowing employees to take it all at once or in shorter increments. Reducing restrictions based on timing, location, primary caregiving, or other factors has been well received by employees. “Just keeping it simple has gone a long way.”

9
Paid leave in America An economic overview
One strategy for influencing culture: highlighting examples of male executives and employees fully using the paid leave available to them. This may encourage other male employees to take their paid parental leave, especially in locations where it may not be seen as acceptable. For example, J&J’s Global Head of Total Rewards Kristen Mulholland notes that the company has taken extra measures in Japan, where usage rates for paternity leave tend to be very low, to market paid leave benefits to male employees through a mix of communication and role-modeling.
Employer size and cascading impact of state mandates
Our survey results found that the largest employers are more likely than others to offer paid leave programs of all types. However, small employers tend to offer more paid leave than some mid-size employers. This could be due to a range of factors, including competition for talent, stronger personal relationships between executives and the workforce, or other factors related to company size.
Fig. 2: Paid leave offerings by employer size
Company size (number of employees)
Percentage of employers offering
New child (women) New child (men) Personal medical Extended family care
0–100 54% 44% 43% 34%
101–250 47% 39% 34% 31%
251–1,000 54% 45% 44% 31%
1,001–5,000 64% 52% 49% 40%
5,001+ 64% 58% 59% 49%
Source: Oxford Economics analysis of SHRM membership survey
While the United States has no federal paid leave requirement, some state and local governments have taken matters into their own hands. As of year-end 2019, four states (California, Rhode Island, New York, and New Jersey) required companies to offer paid leave benefits to eligible employees, or to participate in an equivalent partial wage replacement program. (By early 2020, after our surveys were fielded, Washington, Nevada, and the District of Columbia had also mandated paid family leave.)
The largest employers are more likely than others to offer paid leave programs of all types.

10
Paid leave in America An economic overview
The complexity of paid leave and HR benefit decisions—especially for those operating in states or countries with their own regulations—can be difficult for companies to navigate. Meeting compliance and reporting obligations takes a lot of time and resources, and can be confusing for even the most knowledgeable people. This kind of administrative burden is one reason why large, international companies like IBM have standardized their paid leave offerings. The company has a consistent approach to paid leave that it applies across the United States and is working to implement globally; it then tops up as needed based on state laws, and incorporates additional leave for vacation, personal sick time, and bereavement.
IBM gives managers discretion to provide additional time off when it is needed. But it also provides a baseline amount of time off for employees, and it’s expected that managers respect that time and encourage employees to take it, whether it be for parental bonding or caring for a family member. The company also is adjusting its paid leave policies in response to COVID-19, focusing on flexibility for parents who may deal with uncertain or evolving school schedules.
The need for consistency could be the driving reason behind why surveyed employers with operations in any of the four mandate states are more likely to offer more paid leave, even in non-mandate states. In other words, our findings suggest that when an employer operates in multiple states—including at least one that requires paid leave—its policies tend to resemble those of companies operating only in a state that mandates paid leave. This trend is stronger with respect to new child leave than family care leave.
Throughout the COVID-19 pandemic, IBM has made the health and wellness of its employees a priority. “We are committed to providing flexibility, paired with proactive support,” says Jaqueline Oliveira-Cella, Global Benefits Design and Strategy Leader, noting that the company continually seeks feedback from employees about how they are doing and designs benefits accordingly. “Based on their feedback, we are providing additional 20 days of flexible emergency leave for parents and caregivers through August to the end of 2020 to support with school and care disruption due to COVID-19, high-touch diverse ability support, and emergency family back-up care for our employees who are parents and caregivers juggling family responsibilities.” This is in addition to the benefits announced earlier this year such as expanded mental health services for employees and their family members, additional sick and care leave, and more paid time off to deal with emergencies.
Meeting compliance and reporting obligations takes a lot of time and resources, and can be confusing for even the most knowledgeable people.

11
Paid leave in America An economic overview
Fig. 3 shows that among employers operating in multiple states (mostly large companies), those doing business in at least one state with a mandate offer 1.8 weeks more maternity leave and 1.6 weeks more paternity leave than those multistate employers that do not operate in a mandate state. With the 2020 introduction of mandated leave programs in Washington, Nevada, and the District of Columbia, this cascading effect emanating from states with a paid leave mandate is likely to increase.
Beyond reducing administrative burden, standardizing paid leave can unify an organization’s culture and ultimately boost morale. Joan Burke, Chief People Officer of DocuSign, the $1 bn technology company based in Silicon Valley, recommends picking an approach and applying it consistently. “Employees won’t feel great about these benefits if they get X in California, but coworkers in Illinois get Y,” says Ms. Burke. “Don’t try to add complexity to it by having different policies for different states, depending on what those state requirements are. Just create one unified policy and apply it everywhere.”
Fig. 3: The ripple effect of state mandates
Source: Oxford Economics analysis of SHRM membership survey
New child leave for women
New child leave for men
Not mandated in any states
Not mandated in any states
Mandated in some states
Mandated in some states
Mandated in all states
Mandated in all states
9.1 weeks
4.7 weeks
10.9 weeks
6.3 weeks
10.6 weeks
7.1 weeks
12
Paid leave in America An economic overview
Attracting and retaining skilled talent is a competitive necessity for organizations across industries—in fact, among senior executive respondents, 31% report that their ability to attract talent is below target; among HR respondents, 29% are below target.
Many employers are looking to paid leave programs to help address these talent challenges. When leadership at DocuSign noticed that other companies were expanding their paid leave policies, they decided to overhaul their own offerings as well, voluntarily expanding paid time off in excess of California’s state-mandated minimums. “We thought it would be good for business—and I think it is even better for our employees,” says Ms. Burke. DocuSign has seen positive results in terms of employee engagement scores, organizational culture, attrition, and recruiting.
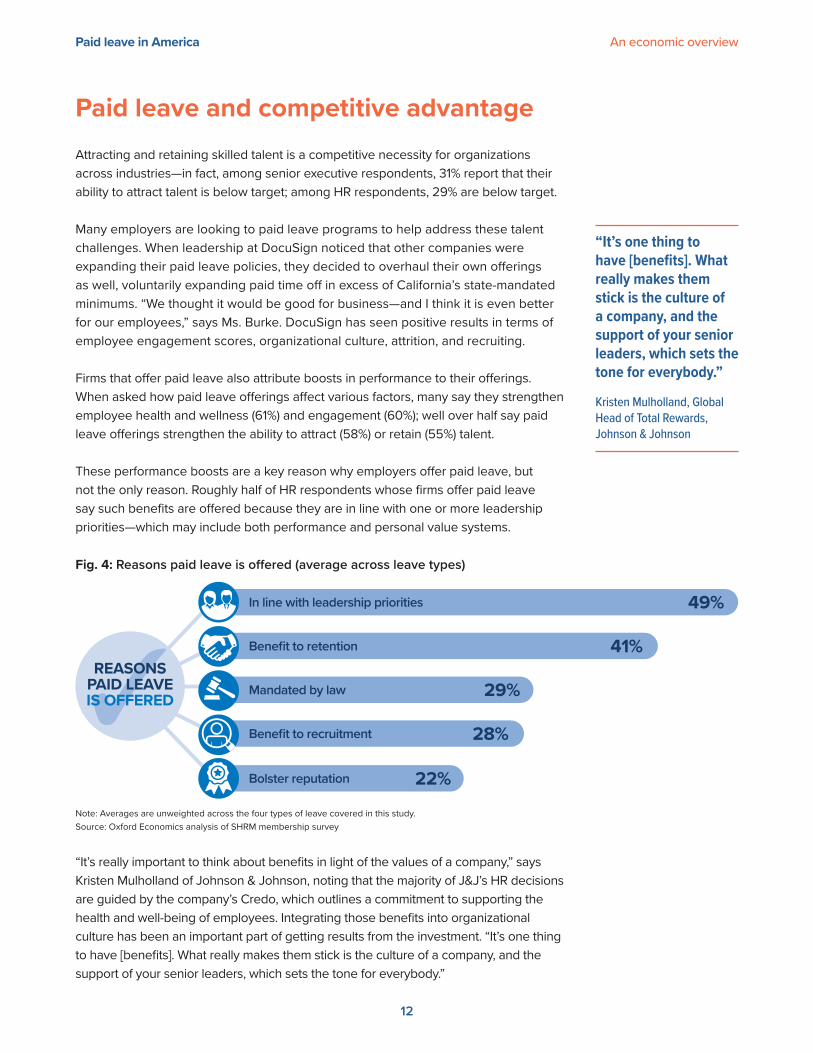
Firms that offer paid leave also attribute boosts in performance to their offerings. When asked how paid leave offerings affect various factors, many say they strengthen employee health and wellness (61%) and engagement (60%); well over half say paid leave offerings strengthen the ability to attract (58%) or retain (55%) talent.
These performance boosts are a key reason why employers offer paid leave, but not the only reason. Roughly half of HR respondents whose firms offer paid leave say such benefits are offered because they are in line with one or more leadership priorities—which may include both performance and personal value systems.
“It’s really important to think about benefits in light of the values of a company,” says Kristen Mulholland of Johnson & Johnson, noting that the majority of J&J’s HR decisions are guided by the company’s Credo, which outlines a commitment to supporting the health and well-being of employees. Integrating those benefits into organizational culture has been an important part of getting results from the investment. “It’s one thing to have [benefits]. What really makes them stick is the culture of a company, and the support of your senior leaders, which sets the tone for everybody.”
Paid leave and competitive advantage
Fig. 4: Reasons paid leave is offered (average across leave types)
Note: Averages are unweighted across the four types of leave covered in this study.Source: Oxford Economics analysis of SHRM membership survey
Bolster reputation
Benefit to recruitment
Mandated by law
Benefit to retention
In line with leadership priorities
22%
28%
29%
41%
49%
REASONS PAID LEAVE IS OFFERED
“It’s one thing to have [benefits]. What really makes them stick is the culture of a company, and the support of your senior leaders, which sets the tone for everybody.”
Kristen Mulholland, Global Head of Total Rewards, Johnson & Johnson

13
Paid leave in America An economic overview
Despite good intentions and good strategy, cost and other operational hurdles often stand in the way of policy changes. Among surveyed employers not offering paid leave, cost is a top-cited reason for not providing the benefit. This may include not only the cost of paying the benefit, but of hiring a replacement employee, , or otherwise disrupting operations. None of these are inconsequential concerns.
Yet the alternative to offering paid leave could also come at a cost. “When you’re not offering flexibility, people feel that they don’t have choices—they may choose to opt out or another path,” says Ms. Mulholland. “It’s costly to continue to hire people, and to have a high level of turnover.” She attributes J&J’s relatively low global turnover in part to its paid leave programs, and notes that parents taking new leave return to work in nearly every instance (for parents in the U.S., 98% of women, 100% of men).
Ancillary benefits that support family care may also be a growing focus for employers. Services for breastfeeding mothers, childcare for parents with young children, or support for employees caring for ill family members are increasingly common and used as competitive differentiators in a tight labor market.
However, these types of benefits can be hard for small employers to swing. “Big companies have deep pockets and it allows them to have access to the resources and ability to actually provide childcare on site,” says Ms. Burke of DocuSign. But there are ways for smaller companies to begin integrating these types of services, too. DocuSign is exploring third-party services that can provide last-minute support when an employee needs an emergency caregiver. “This is the kind of in-between solution or resource that smaller companies should be thinking about.”
Fig. 5: Paid leave and organizational culture“Agree” and “Strongly agree” responses shown
Source: Oxford Economics survey of senior executives
Our organization’s paid leave offerings are in line with our
organizational culture
Our paid leave offerings are designed to
accommodate concerns raised by our employees
Our paid leave offerings are designed to
enhance our brand
Our organization’s culture influences our paid leave offerings
65% 62% 57% 21%

14
Paid leave in America An economic overview
Estimating costs of a national program
Policy considerations around paid leave often focus on costs—for both employers and employees. In fact, nearly half of surveyed companies that do not offer paid leave cite cost as a primary reason for holding back.
Oxford Economics used the data collected in the survey of HR respondents to estimate what a mandated national paid leave program would cost. To do this, we relied on the insights of HR respondents to estimate the number of employees likely to use each benefit program in a given year, as well as the average duration of the leave taken by employees that use it. The amount of weekly benefit offered under these first two scenarios is either complete replacement of wages while the employee is on leave, or replacement of wages up to a weekly cap of $800.
Specifically, we calculated costs under two scenarios:
l Scenario 1: No weekly cap. This scenario assumes that workers receive 100% of their wages during their leave. The amount of leave taken corresponds to the average amount of leave that employees actually use for that particular benefit as reported by HR respondents.
l Scenario 2: $800 weekly cap. This scenario assumes that workers receive 100% of wages up to a weekly cap of $800 (an amount roughly equal to the weekly median wage for US workers). Note that workers earning below this amount will receive 100% of their actual wage, whereas workers earning above this amount will see their benefit capped.
Fig. 6: Cost scenarios under a national paid leave mandate
Leave typeEligible workers
Annual usageAverage weeks taken
Scenario 1: Full salary replacement
Scenario 2: $800 weekly cap on wages
% Workers Average weekly benefit
Total costAverage weekly benefit
Total cost
CPS Survey Calculation Survey CPS Calculation CPS CalculationNew child (women) 68 m 2.2% 1.5 m 9.4 $867 $12.0 bn $601 $8.3 bnNew child (men) 76 m 1.3% 1.0 m 3.9 $1,132 $4.4 bn $672 $2.6 bnPersonal extended medical 143 m 1.6% 2.2 m 8.1 $1,005 $18.1 bn $638 $11.5 bn
Extended family care 143 m 1.0% 1.5 m 5.7 $1,005 $8.5 bn $638 $5.4 bn
Total 143 m 4.3% 6.2 m 7.1 $973 $43.0 bn $629 $27.8 bnNotes: Includes full- and part-time workers; excludes self-employed. Weeks taken and weekly benefits in “Total” row represent weighted averages; total cost is the sum across the four leave programs and does not exactly equal the product of these averages and the number of workers. Average annual usage represents the percentage of employees eligible for that program that take leave for that purpose during a given year. Full salary replacement assumes 100% of regular pay. Weekly cap scenario assumes 100% of regular pay up to $800 max.
Source: Oxford Economics calculations based on SHRM survey and Current Population Survey (CPS) data
Paying for paid leave benefits

15
Paid leave in America An economic overview
As noted, the “weeks taken” calculation reflects the actual length of leave taken by employees working for employers that currently offer paid leave benefits, according to our HR survey. For example, based on actual experience, our calculation reflects the observation that men utilize less paid leave than women. Hence for new child care benefits, women are assumed to be on leave for 9.4 weeks whereas men for only 3.9 weeks.
There are a number of interesting insights reported in Fig. 6:
l Imposing a cap equal to the median national wage ($800) cuts the total cost of these four programs by slightly more than one-third (from $43.0 billion to $27.8 billion).
l Medical leave is the most expensive program, and under each scenario costs more than the combined cost of new child for men and women.
l Paternity leave costs roughly one-third that of maternity leave despite men’s average wages being higher than women’s average wages. This is a result of men’s apparent reluctance to fully utilize the benefit, according to our HR survey.
Calculating how much a program is likely to cost is only half of the question; the other half is how that cost will be paid. One way to finance paid leave programs at the national level, should one be introduced, is to use a funding methodology comparable to that used by the states that mandated paid leave as of year-end 2019. Those programs are funded in a manner roughly comparable to how states fund unemployment insurance. In 2019, employees paid a tax (generally between 0.2% and 1% of wages) up to a certain wage level or capped dollar amount. The taxes collected are then pooled into a paid leave fund (administered either publicly or privately) that is used to pay for benefits.
Using tax rates comparable to those currently used by the states, we examined the impact on employee wages of funding a national program costing $43.0 billion (i.e., Scenario 1 in Fig. 6). We estimate that taxing 1% of wages up to $686 per week achieved that result. To fund a national program with paid leave benefits capped at $800 per week (scenario 2), taxing 1% of wages up to $399 per week would likely suffice.

16
Paid leave in America An economic overview
Comparing our research to other paid leave cost estimates
6 https://www.dol.gov/whd/fmla/survey/7 American Enterprise Institute – Brookings Working Group on Paid Family Leave (September 2018). “The AEI-Brookings Working Group Report on Paid Family
and Medical Leave: Charting a Path Forward.” AEI-Brookings considers programs covering the same four categories of paid leave we consider in this paper.
Prior to publication of this report, two primary data sources have typically been used to estimate paid leave costs:
l A survey of workers’ experiences under the (unpaid) Family and Medical Leave Act conducted by the Department of Labor in 20126
l Reported data from states with mandated paid leave programs
These sources are considered in a 2018 review of family leave policy by AEI-Brookings.7 Fig. 7 reports the results of that study, alongside our benchmark cost estimate using the $800 cap scenario presented in Fig. 6 above.
As the table shows, Brookings’ estimates based upon the experience of states mandating paid leave are roughly in line with the OE-SHRM estimate. Our estimate that 4.3% of eligible employees will utilize the program falls within the state experience range of 3.8% to 8.5%. However, our use of a weekly cap of $800 (average cost $629 per week) is quite a bit higher than the mean weekly benefits paid reported by the
states ($175 to $247), as OE-SHRM’s benefit is based on an average national wage, which is higher than the average amount of benefit paid by the four states that mandate leave. Hence, our estimate of $27.8 billion is consistent with the higher end of the state experience estimate (i.e., 8.5% usage rate by employees with a $247 weekly benefit for a total cost of $24.3 billion).
The outlier value that is of most concern on this chart is the 15.9% usage rate reported in the FMLA survey, which is significantly higher than the usage rates found in our study. It is possible that some of the leave-taking reported on the FMLA survey, while technically covered by the FMLA law, is more akin to what is usually thought of as regular sick leave or personal leave, rather than what we have described in this paper as paid extended medical or family leave. Still, usage rates three times higher than what our survey suggests will dramatically impact the cost estimates presented in this report.
More detailed discussion on our cost calculations is included in the appendix to this report.
Fig. 7: Comparing cost estimates
Estimating entity
Source of key assumptions
Core assumptions Original cost estimates Recalculated cost using OE-SHRM average capped benefit ($629)
and universe size assumptions
Percentage of workers
taking paid leave annually
Average duration of paid leave
taken
Average weekly benefit
assumption
Originally reported
cost
OE-SHRM Survey of HR representatives 4.3% 7.1 weeks $629 $27.8 bn not recalculated
AEI-Brookings
Experience of existing paid state-level programs
3.8%−8.5% 7.7−7.8 weeks $175−$247 $7.6 bn− $24.3 bn $26.5 bn−$59.8 bn
FMLA survey 15.9% 4.4 weeks $452 $46.3 bn $62.8 bn
Source: Oxford Economics and AEI-Brookings working group

17
Paid leave in America An economic overview
Strategies for containing costs: New child leave
There are a few likely variables that might be manipulated in order to constrain the costs of expanded or mandated offerings. These include capping weekly benefits, limiting the amount of leave time, or excluding some employers from the mandate. One variation of capping weekly benefits is to limit wage replacement during leave time to something less than 100%.
In this section, we will briefly explore these options in some detail. For the purposes of this exercise, we focus only on new child leave benefits for men and women. As outlined below, we rely on the same set of assumptions previously used in Fig. 6 to define the universe of eligible employees and likely percentages of those employees using the program in any given year.
Fig. 8: Key assumptions used in the following cost scenarios
Number of workers Percentage of workers using program (according to HR survey)
Number of workers taking leave annually
New child leave (women) 67.6 m 2.18% 1.47 m
New child leave (men) 75.6 m 1.32% 1.00 m
Total 143.2 m 2.47 m
Figs. 8a to 8d add four new scenarios to the two previously considered in Fig. 6. In each of these new scenarios, we assume that each parent utilizes the full amount of leave available to them. Depending upon the scenario, this might mean 10 weeks for each parent, or 10 weeks for the primary parent and five weeks for the secondary parent. We also consider a weekly benefit cap of $800 (as before) but now introduce a new scenario where the cap is lowered to $700.
Each of these scenarios reflects relatively small changes to core assumptions. Our most generous scenario (Fig. 8a, Scenario 3) provides 10 weeks of leave to each parent with a weekly cap on benefits of $800. Our least generous scenario (Fig. 8d, Scenario 6) limits leave time for one parent to five weeks and lowers the weekly cap to $700. Although the changes in these scenarios are not that dramatic, the cost difference is relatively sizable, with Scenario 3 costing $15.6 billion and Scenario 6 costing nearly 30% less, at $11.2 billion.
Fig. 8a: Scenario 3 – Each parent receives 10 weeks of paid leave with a maximum weekly benefit of $800*
Scenario 3 Weekly benefit cap Estimated weekly benefit paid
Weeks taken Total cost
New child leave for women (10 weeks) $800 $601 10 $8.8 bn
New child leave for men (10 weeks) $800 $672 10 $6.7 bn
Both (combined) 20 $15.6 bn

18
Paid leave in America An economic overview
Fig. 8b: Scenario 4 – Leave duration varies by named primary and secondary caregiver; each has a maximum weekly benefit of $800*
Scenario 4 Weekly benefit cap Estimated weekly benefit paid
Weeks taken Total cost
Primary caregiver (10 weeks) $800 $601 10 $8.8 bn
Secondary caregiver (5 weeks) $800 $672 5 $3.4 bn
Both (combined) 15 $12.2 bn
Fig. 8c: Scenario 5 – Each new parent receives 10 weeks of paid leave with a maximum benefit of $700*
Scenario 5 Weekly benefit cap Estimated weekly benefit paid
Weeks taken Total cost
New child leave for women (10 weeks) $700 $555 10 $8.2 bn
New child leave for men (10 weeks) $700 $611 10 $6.1 bn
Both (combined) 20 $14.3 bn
Fig. 8d: Scenario 6 – Leave duration varies by named primary and secondary caregiver; each has a maximum weekly benefit of $700*
Scenario 6 Weekly benefit cap Estimated weekly benefit paid
Weeks taken Total cost
Primary caregiver (10 weeks) $700 $555 10 $8.2 bn
Secondary caregiver (5 weeks) $700 $611 5 $3.0 bn
Both (combined) 15 $11.2 bn
*Note: Rounding may affect displayed calculations
The estimated weekly benefit paid is higher for men than for women in all of our scenarios. This reflects the generally higher pay that men currently receive in the workplace, relative to women. Moreover, we assume that the primary caregiver is a woman, and the secondary caregiver a man. This assumption is not an endorsement of these gender roles—rather, we have made calculations based on how the workforce is currently structured and likely to respond, according to our surveys.
In the Appendix to this report, we discuss recent cost estimates produced by the Congressional Budget Office (CBO). One assumption made by the CBO is that over time, workers will grow accustomed to using the full amount of available paid leave time. Implicit in the four scenarios above is a similar assumption. At the same time, we note that our primary/secondary caregiver assumptions (Scenarios 4 and 6) are more in line with what our HR survey respondents report as their actual experience.

19
Paid leave in America An economic overview
Other strategies for containing costs
One strategy to motivate higher-earning individuals to take the paid leave available to them is capping benefits at a percentage of weekly pay, rather than at a specific dollar figure. (This is because the absolute dollar figure may represent a significantly lower portion of their salary than the average percentage cap.) One key downside to this strategy, however, is that workers whose wages are below a weekly cap receive a benefit equal to 100% of their pay. Therefore, low-wage workers do better under a dollar-cap scenario than they do when benefits are limited to a percentage of wages. Nevertheless, the costs of this strategy are illustrated in Fig. 9 below. Please note that our baseline scenario (100% wage replacement) was previously presented and detailed in Fig. 6.
Fig. 9: Benefits limited to percent of wage
Overall cost if 100% of wages provided
Overall cost if 75% of wages provided
Overall cost if 50% of wages provided
New child (women) $12.0 bn $9.0 bn $6.0 bn
New child (men) $4.4 bn $3.3 bn $2.2 bn
Personal extended medical $18.1 bn $13.5 bn $9.0 bn
Extended family care $8.5 bn $6.4 bn $4.3 bn
Total $43.0 bn $32.2 bn $21.5 bn
One final policy consideration that might be considered is whether or not to include small employers in a national paid leave benefit program. Currently, the FMLA excludes organizations with less than 50 employees, so if a national mandate was applied only to FMLA-covered employers, three quarters (72.6%) of employees would be covered. As previously noted, the smallest employers in our HR survey tend to offer paid leave more frequently than some categories of mid-sized employers (see Fig. 2). Excluding small employers from the mandate would reduce the cost and coverage of a national mandate by approximately 25%.

20
Paid leave in America An economic overview
This report captures a continually evolving picture of paid leave programs in the United States. Given the introduction of state and local policies, as well as employee demands, employers will likely continue to adjust their approaches to paid leave in the coming years.
At the time of this research, state governments and large employers are taking the lead on introducing (or requiring) paid leave benefits in the workplace.
Fig. 10 shows that, depending upon the leave program, our survey respondents report that between 16% and 39% of employers offer these benefits voluntarily while an additional 14% to 19% operate in a state where paid leave is mandated.
Even absent a national mandate, there are two important reasons the percentages of employers offering paid leave will likely continue to increase:
l More states are mandating paid leave in 2020 than did so in 2019
l Most companies expect their paid leave benefits to remain the same or increase over the next two years
l The COVID-19 pandemic may have shifted executive and employee perceptions about the need for paid leave
These trends are occurring simultaneously and will likely amplify each other. For example, our survey results suggest that an employer that operates in at least one location mandating paid leave tends to resemble an employer that operates only in states mandating paid leave. With an increasing number of states mandating paid leave, the ripple effect originating from the states that mandate paid leave will increase at the national level. The pressure to add paid leave benefits will only increase, particularly among employers competing for the same talent. “Just be as generous as you can be with paid leave,” says Ms. Burke, of DocuSign. “My advice to companies that are thinking about doing this is to evaluate what it is you can do realistically, the maximum amount you can support from a cost perspective, and then just do it.”
Fig. 10: Percentage of employers offering paid leave—and why it is offered
New child (women)
New child (men)
Personal extended medical
Extended family care
Percentage offering voluntarily 39% 31% 28% 16%
Percentage offering because they operate in a mandate state
16% 14% 15% 19%
Percentage not offering 45% 55% 57% 65%
Total 100% 100% 100% 100%
Source: Oxford Economics analysis of SHRM membership survey
Conclusion
“Just be as generous as you can be with paid leave. My advice to companies that are thinking about doing this is to evaluate what it is you can do realistically, the maximum amount you can support from a cost perspective, and then just do it.”
Joan Burke, Chief People Officer, DocuSign

21
Paid leave in America An economic overview
The experiences of the states that mandate paid leave, and the employers that voluntarily provide these benefits, could help resolve important and outstanding policy issues, including the following.
l Balancing leave benefits with program costs: There remains a fair amount of uncertainty regarding how employee usage of paid leave programs will vary in response to different benefit levels. How much will leave duration increase as benefits increase from 40% of weekly pay, for example, to 60% of weekly pay?
l Tax equitable strategies for funding paid leave programs: Today’s state programs are generally funded through imposition of a flat payroll tax rate paid by employees, with no income test for benefit qualification. Since our survey suggests that one-third of workers are not eligible for the benefit even when it is offered by their employer, a full understanding of the tax burden should inform the design of any mandatory paid leave programs. Some state programs, for example, are designed to fund their mandated leave programs more progressively.
l Changing workplace attitudes: It remains uncertain as to how much of today’s gender differences in program utilization is due to economic incentives or cultural bias. For example, will male usage of new child leave benefits increase over time as state- or employer-sponsored paid leave programs remain in place?
State programs and company policies might be easier to implement if there were greater standardization in the definition of key terms used in paid leave programs. This could ease administrative complexity, encourage flexibility in the workplace, and accelerate further policy innovation. For example, some of our survey respondents indicated that with more states mandating paid leave, there is an increasing amount of complexity or variation in terms such as “eligible event” or “family member.”
National guidelines, rather than local, would help in this regard. Caregiving or bereavement leaves may vary based on how certain relationships are codified in the law in a particular state, and it can be difficult to explain to employees why they might receive different packages of time off.
In addition, it is already evident that many employers voluntarily choose to provide benefits well in excess of what is mandated in the state(s) in which they operate. Therefore, if federal paid leave policies are considered, it is important that they provide administrative flexibility to employers willing to voluntarily meet or exceed what new policies might require.
Whether or not their organization provided paid leave benefits, virtually all of our respondents indicated that these benefits were important to employees. Given that backdrop, we hope this paper provides insights to government policy makers and corporate leaders weighing how best to structure benefit packages for their workforces.

22
Paid leave in America An economic overview
Fig. 11: HR survey respondents by industry
Broad industry Detailed industryFirms Employment
# % % # % %Manufacturing Manufacturing 135 16% 16% 224,407 19% 19%
Business Services
Professional, scientific, & technical 92 11%
22%
42,251 4%
11%Administrative support 5 1% 12,226 1%Finance, insurance & real estate 79 9% 71,227 6%Other 8 1% 2,525 0%
Trade & Hospitality
Hotels & restaurants 18 2%
10%
37,852 3%
14%Wholesale 18 2% 10,525 1%Retail 24 3% 58,503 5%Transportation & warehousing 17 2% 46,428 4%Other 8 1% 5,925 1%
Education, Health & Gov
Education 74 9%
30%
183,957 16%
42%Health care 84 10% 148,531 13%Government 71 8% 127,007 11%Other 24 3% 34,677 3%
OtherConstruction 39 5%
22%15,175 1%
15%Other 146 17% 155,458 13%
Total 842 100% 100% 1,176,674 100% 100%Source: Oxford Economics
Notes on our sample population
The research findings detailed in this report are based on parallel surveys fielded online between mid-November and mid-December 2019. Both surveys included respondents from for-profit businesses and non-profits and government organizations.
The survey of SHRM members
The survey used to calculate cost scenarios was drawn from HR professionals who are SHRM members. A total of 1,036 organizations responded to the survey, yielding 842 valid responses. It is important to note that this is a sample of SHRM members, and therefore is not necessarily representative of US businesses and other organizations as a whole. (However, we would expect SHRM members to be well informed and insightful about their HR policies, allowing us to get deep insight and detailed statistics.) The sampling margin of error (at 95% confidence) for percentage share estimates (e.g., the percentage of firms offering a certain type of leave) is ±3.4%.
The distribution of survey respondents by industry is presented in Fig. 11 below. Over one-third of respondents were in the education, health, and government sectors, with government representing approximately 10% of total respondents. Non-profit organizations are not broken out separately, but most fall into the education, health and government grouping. Note that the largest class of organizations, those employing over 10,000 workers, represent 42% of total employment in the survey (see Fig. 12).
Appendix

23
Paid leave in America An economic overview
Fig. 12: HR respondents by company size
Employment sizeFirms Employment
# % # %< 50 134 16% 3,350 0%50–100 150 18% 11,250 1%101–250 178 21% 31,150 3%251–500 93 11% 34,875 3%501–750 50 6% 31,250 3%751–1,000 34 4% 29,750 3%1,001–2,500 65 8% 113,750 10%2,501–5,000 53 6% 198,750 17%5,001–10,000 31 4% 232,500 20%10,001+ 49 6% 490,049 42%No response 5 1% 0 0%Total 842 100% 1,176,674 100%
Source: Oxford Economics
The survey of senior executives
The second survey was fielded to senior executives—C-suite and direct reports to the C-suite—outside SHRM’s membership. This survey was administered through an independent survey vendor; 3,654 executives were contacted, yielding 507 valid responses. Respondents
to this survey spanned industries, sizes, and locations within the US, but responses may not be representative of the US economy as a whole. The sampling margin of error (at 95% confidence) for percentage share estimates is ±4.4%.
Fig. 13: Senior executive survey respondents by industry
Broad industry Detailed industryFirms Employment
# % % # % %Manufacturing Manufacturing 56 11% 11% 68,643 12% 12%
Business Services
Professional, scientific, & technical 72 14%
33%
74,387 13%
34%Administrative support 21 4% 20,002 4%Finance, insurance & real estate 63 12% 83,142 15%Other services 9 2% 8,125 1%
Trade & Hospitality
Hotels & restaurants 25 5%
23%
28,005 5%
25%Wholesale 21 4% 27,383 5%Retail 47 9% 57,511 10%Transportation & warehousing 22 4% 23,754 4%
Education, Health & Gov
Education 39 8%20%
42,380 8%19%Health care 37 7% 34,878 6%
Government 26 5% 27,255 5%
OtherConstruction 34 7%
14%31,254 6%
11%Other 35 7% 27,006 5%
Total 507 100% 100% 553,725 100% 100%

24
Paid leave in America An economic overview
Fig. 14: Senior executive respondents by company size
Employment sizeFirms Employment
# % # %
< 250 102 20% 12,750 2%
250–500 101 20% 37,875 7%
501–1,000 104 21% 78,000 14%
1,000–2,500 100 20% 175,000 32%
2,501+ 100 20% 250,100 45%
Total 507 100% 553,725 100%
Notes on cost estimates
8 In fact, although based on the experience of state paid leave programs, the mean duration of leave used in the AEI-Brookings cost estimates assumes an 8-week cap on the maximum duration of paid leave. It’s important to note that our survey data are based on the experience across companies, which offer various maximum durations of paid leave, averaging between 5.9 weeks for new child leave for men to 15.3 weeks for medical leave (see Fig. 1).
9 It’s possible that some of the leave-taking reported on the FMLA survey, while technically covered by the FMLA law, is more akin to what’s usually thought of as regular sick leave or personal leave than what we’ve described in this paper as extended medical or family leave.
Excluding administrative costs, the cost of a paid leave program, whether borne by employers, insurance, or government, is relatively straightforward to calculate:
(Cost of paid leave program) = (# of eligible employees) × (Share who take leave in a given year) × (Avg. duration of leave taken) × (Avg. weekly benefit)
The number of eligible workers and the amount of weekly benefits depend somewhat on policy choices (e.g., whether to cap benefits), but given these choices, the relevant statistics are easy to determine. Estimating the cost of paid leave programs, therefore, depends primarily on assumptions about the share of workers who take the leave and how long they take it.
Overall, AEI-Brookings produces a wide range of annual cost estimates for a paid leave program, from $7.6 billion to $24.3 billion, based on the experience of state programs, to $46.3 billion based on the FMLA survey (see Fig. 7). Comparing the key assumptions on the share of workers taking leave and the mean duration of leave taken, it’s clear that the results of our HR survey are much more consistent with the
experience of state leave programs than the FMLA survey results.8 This is sensible, as both of these are based on the actual leave-taking behavior of workers in paid leave programs, whereas the FMLA survey results largely reflects the behavior of workers taking unpaid leave. Overall, it would appear that, in the FMLA data, far more workers take this type of leave (almost 16% do), but of a shorter duration (4.4 weeks on average).9
Note that AEI-Brookings’ original cost estimates based on the experience of state leave programs ($7.6 billion to $24.3 billion) are distinctly below our cost estimate ($27.8 billion) largely owing to their lower assumptions for the mean benefit ($175–$245 per week). Adjusting the AEI-Brookings assumptions to match our mean benefit of $629 per week based on an $800 cap, along with our estimate of the number of eligible workers, this range would be $26.5 billion to $59.8 billion.

25
Paid leave in America An economic overview
CBO cost estimate
10 Congressional Budget Office (February 13, 2020). Letter to Representative Kevin Brady.
On February 13, 2020, the Congressional Budget Office (CBO) released its budget estimate of the FAMILY Act, which would provide paid leave broadly similar to the four categories of leave discussed in this study.10 Overall, the CBO estimates a 10-year cost for this program of $547 billion, including $27 billion in program administration costs (not considered in our or AEI-Brookings’ estimates), and offset by $319 billion in net new tax revenue for a total budget cost of $228 billion. As noted earlier in our report, we think it is noteworthy that although the SHRM/Oxford Economics study draws from a unique survey of SHRM members to estimate costs, our study calculated annual program costs roughly comparable to both the CBO and Brookings.
The CBO assumes a ramp-up in costs for the FAMILY Act, with costs (exclusive of administrative costs) increasing from $34.0 billion in Fiscal Year 2023 (the first full year of eligibility) to $84.3 billion in FY2030 as a result of inflation, rising real wages, and increased utilization as workers become more familiar with the program. As with the AEI-Brookings results presented above, the CBO largely relies on the results of the FMLA survey and the experience of existing state-level paid leave programs to arrive at these estimates. While the details of the CBO calculations require a more detailed review than what is presented in this report, the results are generally of a comparable magnitude to those arrived at both by us and by AEI-Brookings.

26
Paid leave in America An economic overview
Oxford Economics
Oxford Economics was founded in 1981 as a commercial venture with Oxford University’s business college to provide economic forecasting and modelling to UK companies and financial institutions expanding abroad. Since then, we have become one of the world’s foremost independent global advisory firms, providing reports, forecasts, and analytical tools on more than 200 countries, 250 industrial sectors, and 7,000 cities and regions. Our best-in-class global economic and industry models and analytical tools give us an unparalleled ability to forecast external market trends and assess their economic, social, and business impact.
Headquartered in Oxford, England, with regional centers in New York, London, Frankfurt, and Singapore, Oxford Economics has offices across the globe and is a key adviser to corporate, financial and government decision-makers and thought leaders. Our worldwide client base now comprises over 1,500 international organizations, including leading multinational companies and financial institutions; key government bodies and trade associations; and top universities, consultancies, and think tanks.
SHRM
SHRM, the Society for Human Resource Management, creates better workplaces where employers and employees thrive together. As the voice of all things work, workers, and the workplace, SHRM is the foremost expert, convener, and thought leader on issues impacting today’s evolving workplaces. With 300,000+ HR and business executive members in 165 countries, SHRM impacts the lives of more than 115 million workers and families globally. Learn more at SHRM.org and on Twitter @shrm.
AUGUST 2020
All data shown in tables and charts are Oxford Economics’ own data, except where otherwise stated and cited in footnotes, and are copyright © Oxford Economics Ltd.
This report is confidential to SHRM and may not be published or distributed without their prior written permission unless obtained through an authorized on-line posting.
The modeling and results presented here are based on information provided by third parties, upon which Oxford Economics has relied in producing its report and forecasts in good faith. Any subsequent revision or update of those data will affect the assessments and projections shown.
To discuss this report further, please contact:
Dan Levine Practice Leader, Location Strategies Oxford Economics 5 Hanover Square, 8th FloorNew York, NY, 10004(646) 503-3067
Julie Hirschhorn Senior Specialist, Media Affairs SHRM 1800 Duke Street Alexandria, VA 22314 (800) [email protected] [email protected]

