palangana ni 43-101 technical report 199600.010 kg · 6 deposit type ... idealized model of uranium...
TRANSCRIPT

NI 43-101 Technical Report on Resources Uranium Energy Corp.
Palangana ISR Uranium Project, Deposits PA-1, PA-2 and Adjacent Exploration Areas
Duval County, Texas
Prepared for:
Uranium Energy Corp. 9801 Anderson Mill Rd
Austin, Texas, USA 78750
512-535-0832
SRK Project Number: 199600.010
Prepared by:
7175 W. Jefferson Ave.
Suite 3000 Lakewood, CO 80235
Effective Date: January 15, 2010 Report Date: February 19, 2010
Contributors: Qualified Persons: Dr. Neal Rigby CEng, MIMMM, PhD Bart Stryhas PhD, CPG Sean C. Muller, CPG, Texas P.Geo, SME Frank Daviess, MAusIMM Patrick Hollenbeck, B.A. Geology Andy Kurrus, Texas P.Geo

Uranium Energy Corp. i Palangana ISR Uranium Project NI 43-101 Technical Report on Resources
SRK Consulting (U.S.), Inc. February 19, 2010 Palangana_NI 43-101 Technical Report_199600.010_KG.012
Table of Contents
1 INTRODUCTION ........................................................................................................... 1-1 1.1 Terms of Reference and Purpose of the Report ................................................... 1-1 1.2 Reliance on Other Experts ................................................................................... 1-1
1.2.1 Sources of Information .......................................................................... 1-1 1.3 Qualifications of Consultants (SRK) ................................................................... 1-2
1.3.1 Site Visit ................................................................................................ 1-3
2 PROPERTY DESCRIPTION AND LOCATION ........................................................... 2-1 2.1 Property Location................................................................................................. 2-1 2.2 Mineral Titles ....................................................................................................... 2-1 2.3 Location of Mineralization .................................................................................. 2-2 2.4 Royalties, Agreements and Encumbrances .......................................................... 2-2
2.4.1 DeHoyos Lease (revised by Replacement Lease 7 - 08) ....................... 2-2 2.4.2 Schallert Lease (Palangana Ranch) ....................................................... 2-3
2.5 Environmental Liabilities and Permitting ............................................................ 2-5 2.5.1 Required Permits and Status .................................................................. 2-5
3 ACCESSIBILITY, CLIMATE, LOCAL RESOURCES, INFRASTRUCTURE AND PHYSIOGRAPHY ....................................................................................................................... 3-1
3.1 Topography, Elevation and Vegetation ............................................................... 3-1 3.2 Climate and Length of Operating Season ............................................................ 3-1 3.3 Physiography........................................................................................................ 3-1 3.4 Access to Property ............................................................................................... 3-1 3.5 Surface Rights ...................................................................................................... 3-1 3.6 Local Resources and Infrastructure ..................................................................... 3-2
3.6.1 Access Road and Transportation ........................................................... 3-2 3.6.2 Power Supply ......................................................................................... 3-2 3.6.3 Buildings and Ancillary Facilities ......................................................... 3-2 3.6.4 Manpower .............................................................................................. 3-2
4 HISTORY ........................................................................................................................ 4-1
5 GEOLOGICAL SETTING .............................................................................................. 5-1
6 DEPOSIT TYPE .............................................................................................................. 6-1 6.1 Geological Model ................................................................................................. 6-1
7 MINERALIZATION ....................................................................................................... 7-1 7.1 Mineralized Zones ............................................................................................... 7-1 7.2 Relevant Geological Controls .............................................................................. 7-2 7.3 Type, Character and Distribution of Mineralization ............................................ 7-2
8 EXPLORATION.............................................................................................................. 8-1 8.1 Surveys and Investigations .................................................................................. 8-1
8.1.1 Procedures and Parameters .................................................................... 8-1 8.2 Interpretation ........................................................................................................ 8-1
9 DRILLING ....................................................................................................................... 9-1 9.1 Rotary Drilling and Logging ................................................................................ 9-1 9.2 UCC Drilling Program ......................................................................................... 9-1

Uranium Energy Corp. ii Palangana ISR Uranium Project NI 43-101 Technical Report on Resources
SRK Consulting (U.S.), Inc. February 19, 2010 Palangana_NI 43-101 Technical Report_199600.010_KG.012
9.3 Chevron Drilling Program ................................................................................... 9-1 9.4 Uranium One Drilling Program ........................................................................... 9-2 9.5 Core Drilling ........................................................................................................ 9-2 9.6 Procedures ............................................................................................................ 9-2 9.7 Results .................................................................................................................. 9-2 9.8 Interpretation ........................................................................................................ 9-3
10 SAMPLING METHOD AND APPROACH ................................................................. 10-1 10.1 Gamma-Ray Logs .............................................................................................. 10-1 10.2 PFN Logging ...................................................................................................... 10-2 10.3 Disequilibrium ................................................................................................... 10-2 10.4 Sampling Methods ............................................................................................. 10-3 10.5 Factors Impacting Accuracy of Results ............................................................. 10-3 10.6 Sample Quality................................................................................................... 10-3 10.7 Sample Parameters ............................................................................................. 10-3 10.8 Relevant Samples ............................................................................................... 10-3
11 SAMPLE PREPARATION, ANALYSES AND SECURITY ...................................... 11-1 11.1 Interpretation ...................................................................................................... 11-2
12 DATA VERIFICATION ............................................................................................... 12-1 12.1 Quality Control Measures and Procedures ........................................................ 12-1 12.2 Limitations ......................................................................................................... 12-2
13 ADJACENT PROPERTIES .......................................................................................... 13-1
14 MINERAL PROCESSING AND METALLURGICAL TESTING ............................. 14-1
15 MINERAL RESOURCE AND MINERAL RESERVE ESTIMATES ......................... 15-1 15.1 Mineral Resource Estimation of PA-1 and PA-2 ............................................... 15-1
15.1.1 Qualified Person of the Mineral Resource Estimate ........................... 15-1 15.1.2 Drillhole Database ............................................................................... 15-1 15.1.3 Geologic Model ................................................................................... 15-1 15.1.4 Resource Block Model ........................................................................ 15-2 15.1.5 Specific Gravity ................................................................................... 15-2 15.1.6 Drillhole Compositing ......................................................................... 15-2 15.1.7 Variogram Analysis ............................................................................. 15-3 15.1.8 Grade Interpolation .............................................................................. 15-3 15.1.9 Grade Estimation ................................................................................. 15-4 15.1.10 DEF Application .................................................................................. 15-4 15.1.11 Resource Classification and Estimation .............................................. 15-5 15.1.12 Block Model Validation ...................................................................... 15-6 15.1.13 Mineral Resource Sensitivity .............................................................. 15-6 15.1.14 Resource Statement ............................................................................. 15-7
15.2 Mineral Resource and Mineral Reserve Estimates, Palangana Exploration Trends ............................................................................................................................ 15-7
15.2.1 Qualified Person of the Mineral Resource Estimate ........................... 15-7 15.2.2 Drillhole Database/Composites ........................................................... 15-7 15.2.3 Geological Model ................................................................................ 15-8 15.2.4 Resource Block Models ....................................................................... 15-9 15.2.5 Density ................................................................................................. 15-9

Uranium Energy Corp. iii Palangana ISR Uranium Project NI 43-101 Technical Report on Resources
SRK Consulting (U.S.), Inc. February 19, 2010 Palangana_NI 43-101 Technical Report_199600.010_KG.012
15.2.6 Block Model Extents ........................................................................... 15-9 15.2.7 Thickness Digital Terrain Models ....................................................... 15-9 15.2.8 Dynamic Anisotropy and Search Orientation .................................... 15-10 15.2.9 Grade Estimation and Resource Classification Criteria .................... 15-10 15.2.10 Block Model Validation & Mineral Resource Sensitivity ................ 15-11 15.2.11 Resource Statement, Exploration Trend Inferred Resources ............ 15-13
16 OTHER RELEVANT DATA AND INFORMATION ................................................. 16-1 16.1 Review of ISR Uranium Mining ........................................................................ 16-1 16.2 Mining Method .................................................................................................. 16-1 16.3 Processing .......................................................................................................... 16-1
16.3.1 Recoverability ...................................................................................... 16-1
17 INTERPRETATION AND CONCLUSIONS ............................................................... 17-1 17.1 Field Surveys ..................................................................................................... 17-1 17.2 Analytical and Testing Data............................................................................... 17-1 17.3 Exploration Conclusions .................................................................................... 17-1 17.4 Other Relevant Information ............................................................................... 17-1
18 RECOMMENDATIONS ............................................................................................... 18-1 18.1 Recommended Work Programs ......................................................................... 18-1
18.1.1 Costs .................................................................................................... 18-1
19 REFERENCES .............................................................................................................. 19-1
20 GLOSSARY .................................................................................................................. 20-1 20.1 Mineral Resources and Reserves ....................................................................... 20-1
20.1.1 Mineral Resources ............................................................................... 20-1 20.1.2 Mineral Reserves ................................................................................. 20-1
20.2 Glossary ............................................................................................................. 20-2
List of Tables
Table 1: Palangana Project Resource Statement (DEF adjusted and based on a zero % eU3O8 cut-off) ...............................................................................................................................III
Table 1.3.1: Project Team and Discipline ................................................................................... 1-2
Table 2.2.1: Palangana Project Mineral Leases .......................................................................... 2-1
Table 2.4.1.1: DeHoyos Royalty Schedule ................................................................................. 2-3
Table 2.4.2.1: Schallert Royalty Schedule .................................................................................. 2-4
Table 3.5.1: Current Palangana Project Surface Rights .............................................................. 3-2
Table 9.7.1: Palangana Drilling Results ..................................................................................... 9-3
Table 15.1.4.1: PA-1 Model Extent in Texas, State Plane Coordinates ................................... 15-2
Table 15.1.4.2: PA-2 Model Extent in Texas, State Plane Coordinates ................................... 15-2
Table 15.1.6.1: PA-1 Statistical Composites ............................................................................ 15-3
Table 15.1.6.2: PA-2 Statistical Composites ............................................................................ 15-3

Uranium Energy Corp. iv Palangana ISR Uranium Project NI 43-101 Technical Report on Resources
SRK Consulting (U.S.), Inc. February 19, 2010 Palangana_NI 43-101 Technical Report_199600.010_KG.012
Table 15.1.7.1: Variography Search Radii Computed for the G2 Roll-front ........................... 15-3
Table 15.1.10.1: Average Spacing Between PFN-Logged Drillholes by Resource Zone ........ 15-4
Table 15.1.10.2: Estimated Average Default Values for PA-1 Blocks Outside of the Search Radius ............................................................................................................................ 15-5
Table 15.1.10.3: Estimated Average Default Values for PA-2 Blocks Outside of the Search Radius ............................................................................................................................ 15-5
Table 15.1.11.1: Resource Criteria ........................................................................................... 15-6
Table 15.1.12.1: Statistical % eU3O8 Validation of the PA-1 Model ....................................... 15-6
Table 15.1.12.2: Statistical % eU3O8 Validation of the PA-2 Model ....................................... 15-6
Table 15.1.14.1: Palangana, Combined PA-1 and PA-2 Resource Statement* (as at January 15, 2010) ........................................................................................................................ 15-7
Table 15.2.6.1: Exploration Trends Model Extents, Texas, State Plane Coordinates .............. 15-9
Table 15.2.10.1: Drillhole Intercepts & Resource by Zone .................................................... 15-12
Table 15.2.11.1: Resource Statements, Exploration Trends Inferred Resources (as at January 15, 2010) ...................................................................................................................... 15-13
Table 18.1.1: Details of the Phase II Drilling Program ............................................................ 18-1
Table 18.1.1.1: Phase II Exploration Drilling Program ............................................................ 18-2
Table 20.2.1: Glossary .............................................................................................................. 20-2
List of Figures
Figure 2-1: Palangana Project Location Map ............................................................................. 2-6
Figure 2-2: Palangana Mineral Trend and Drillhole Location Map ........................................... 2-7
Figure 3-1: Palangana Topography and Property Boundaries .................................................... 3-3
Figure 4-1: Palangana Dome with Location of PA-1, PA-2 and the Exploration Trend Resource Areas ................................................................................................................ 4-2
Figure 5-1: Regional Geologic Map with Uranium Trend ......................................................... 5-2
Figure 6-1: Idealized Model of Uranium Roll Front Mineralization ......................................... 6-2
Figure 7-1: Typical Stratigraphic Section ................................................................................... 7-4
Figure 7-2: Cross-section Index across PA-1 Deposit ................................................................ 7-5
Figure 7-3: PA-1 Deposit Cross-section A-A’ ............................................................................ 7-6
Figure 7-4: PA-1 Deposit Cross-section B-B’ ............................................................................ 7-7
Figure 7-5: PA-1 Deposit Cross-section C-C’ ............................................................................ 7-8
Figure 7-6: PA-2 Cross-section Index ........................................................................................ 7-9
Figure 7-7: PA-2 Deposit Cross Section F-F’ ........................................................................... 7-10

Uranium Energy Corp. v Palangana ISR Uranium Project NI 43-101 Technical Report on Resources
SRK Consulting (U.S.), Inc. February 19, 2010 Palangana_NI 43-101 Technical Report_199600.010_KG.012
Figure 7-8: PA-2 Deposit Cross-section G-G’ .......................................................................... 7-11
Figure 7-9: PA-2 Deposit Cross-section H-H’ .......................................................................... 7-12
Figure 15-1: Variogram for Zone G2 ...................................................................................... 15-14
Figure 15-2: Applying a 25ft Spacing from Oxidized (Ox) Holes ......................................... 15-15
Figure 15-3: Ordinary Krige Grade Distribution – G2 Zone .................................................. 15-16
Figure 15-4: ID2 Grade Distribution – G2 Zone .................................................................... 15-17
Figure 15-5: PA-1 Measured and Indicated Resource Grade Tonnage Chart ........................ 15-18
Figure 15-6: PA-2 Measured and Indicated Resource Grade Tonnage Chart ........................ 15-19
Figure 15-7: Grade Thickness Contouring ............................................................................. 15-20
Figure 15-8: Exploration Trend Overview ............................................................................. 15-21
Figure 15-9: Jemison Fence .................................................................................................... 15-22
Figure 15-10: CC Brine .......................................................................................................... 15-23
Figure 15-11: NE Garcia ......................................................................................................... 15-24
Figure 15-12: Jemison East ..................................................................................................... 15-25
Figure 15-13: Dome ................................................................................................................ 15-26
Figure 15-14: SW Garcia ........................................................................................................ 15-27
Figure 15-15: Jemison Fence Digital Terrain Model .............................................................. 15-28
Figure 15-16: CC Brine Digital Terrain Model ...................................................................... 15-29
Figure 15-17: NE Garcia Digital Terrain Model .................................................................... 15-30
Figure 15-18: Jemison East Terrain Model ............................................................................ 15-31
Figure 15-19: Dome Digital Terrain Model ............................................................................ 15-32
Figure 15-20: SW Garcia Digital Terrain Model .................................................................... 15-33
Figure 15-21: Jemison Fence Grade Thickness Model ........................................................... 15-34
Figure 15-22: CC Brine Grade Thickness Model ................................................................... 15-35
Figure 15-23: NE Garcia Grade Thickness Model ................................................................. 15-36
Figure 15-24: Jemison East Grade Thickness Model ............................................................. 15-37
Figure 15-25: Dome Grade Thickness Model ........................................................................ 15-38
Figure 15-26: SW Garcia Grade Thickness Model ................................................................. 15-39

Uranium Energy Corp. I Palangana ISR Uranium Project NI 43-101 Technical Report on Resources
SRK Consulting (U.S.), Inc. February 19, 2010 Palangana_NI 43-101 Technical Report_199600.010_KG.012
Summary SRK Consulting (U.S.), Inc. (SRK) was retained by Uranium Energy Corp. (UEC) to provide an independent resource and reserve evaluation on a portion of the Palangana ISR Project in south Texas known as Production Areas 1 and 2 (PA-1 and PA-2) and adjacent exploration areas. The intent of this Technical Report on Resources is to provide the reader with a comprehensive review of the historical exploration activities conducted at the Palangana ISR Project, and a current SRK resource estimate based on 2,694 drillholes totaling 1,263,166ft. SRK was given complete access to:
The UEC database including drill and lithologic logs, interpretive maps, electronic files, analytical data and other information necessary to support a resource and reserve estimate in accordance with Canadian Institute of Mining, Metallurgy and Petroleum (CIM) classification system;
Other pertinent data and reports by prior owner/operators including Uranium One Inc., Union Carbide Corporation (UCC), Chevron, Everest Exploration, Inc. (EEI) and Energy Metals Corporation (Energy Metals);
UEC personnel by telephone, e-mail and in person; and
The Palangana site during drilling and infrastructural development.
Property Description and Location
The Palangana uranium property is 25mi west of the town of Alice, Texas and 15mi to the southeast of Freer, Texas in Duval County. Corpus Christi is about 65mi to the east of the Palangana deposit. The Palangana uranium property is between 300 to 500ft in elevation and the physiography is characterized by low gentle relief. The uranium deposits are contained within fault-controlled roll-fronts in the Pliocene-age Goliad Formation on the flank of the Palangana salt dome. The uranium mineralization occurs at a depth of approximately 220 to 600ft below the surface.
Ownership
There are nineteen current leases covering the area of interest of the Palangana Property which total to 8791.28 acres. The PA-1 deposit is on the DeHoyos lease while the PA-2 deposit, the Dome trend and the CC Brine trend are on the Palangana Ranch Lease. Bordering the east side of the Palangana Ranch Lease is the White Bell Ranch Lease, comprised of 1,000 acres, which contains the Jemison Fence and Jemison East trends. The fourth major lease is the Garcia/Booth lease which borders the east side of the De Hoyos property. It contains the NE Garcia and SW Garcia trends.
Current lease ownership is in South Texas Mining Venture (STMV), which is a Texas limited partnership which is wholly and indirectly owned by UEC through it’s subsidiary URN Resources Inc. (as to 99%), and through its direct acquisition of the remaining 1% of STMV from Everest Exploration Inc. The PA-1 deposit is on the DeHoyos lease while the PA-2 deposit is on the Schallert lease.

Uranium Energy Corp. II Palangana ISR Uranium Project NI 43-101 Technical Report on Resources
SRK Consulting (U.S.), Inc. February 19, 2010 Palangana_NI 43-101 Technical Report_199600.010_KG.012
Geology and Mineralization
The Pliocene Goliad Formation, host for the Palangana and other uranium deposits, unconformably overlies the Fleming Formation and is composed of three units: a basal fine to coarse-grained to conglomeratic cross-bedded unit with calcareous clay; a middle member of calcareous clay; and an upper unit of sandstone and calcareous clay. Caliche is common, especially in the muddy sediments. The conglomerates contain a variety of lithic fragments from the Fleming and older formations. The Goliad is interpreted to be a braided meander belt fluvial deposit with muds as flood plain or overbank deposits. The sands, and gravels, composed mostly of quartz and chert, are very clean and associated with channels and point bars. Passive margin growth faulting along the South Texas Uranium Belt is common with “down-to-the-coast” normal faults predominating.
The local and property geology at Palangana is characterized by the occurrence of a Gulf Coast piercement salt dome. This dome is approximately 2mi in diameter and is overlain by Pliocene sediments of the Goliad Formation. The Palangana dome is marked at the surface by a shallow circular basin surrounded by low hills rising 50 to 80ft above the basin floor, and hence its Spanish name.
The Goliad Formation at Palangana is comprised of eight fluvial deposited, sand zones identified as the “A” through “H” Sands, each separated by clay horizons. The “C”, “E” and “G” Sands all host uranium mineralization. Due to erosion associated with the uplift, only the “A” through “D” sands are present directly over the dome. The deposits of significance to PA-1 and PA-2 occur in differing fluvially deposited sand zones known as the “G” and “E” zones respectively. The PA-1 and PA-2 deposits occur on the east side of the dome outside the area of the faulted uplift. Also on the east side of the dome are the CC Brine, Jemison East and Jemison Fence trends which occur in the “E” zone, as well as the NE Garcia and SW Garcia trends which occur in the “C” zone. In the Dome trend area on the west side of the dome and also the area of the prior UCC production, the mineralization occurs in what has been mapped as the “C” sand zone.
Exploration
While UEC and its predecessors have drilled over 2,500 rotary holes on the entire Palangana property, their efforts have been focused on eight discoveries, PA-1, PA-2, and six trends still being defined (the exploration trends), where more than 70% of the drillholes are located. The average depth of these holes is 450ft. All of these holes have all been logged by conventional gamma, SP, resistivity methods and the majority have also been probed using a Prompt Fission Neutron (PFN) probe that approximates directly uranium content.
CIM Compliant Resource Estimate
SRK developed its resource estimates within distinct sand and roll-front zones utilizing detailed computer block modeling of grade and GT modeling. The results of the resource estimation are presented in Table 1 below. This work included a review of the redox characteristics of the roll-fronts based on PFN logging to verify that the redox interface per zone was chosen correctly by project geologist. Where positive DEF’s exist outside the initially indentified interface, a re-evaluation of the boundary was made by SRK. Specifically the thickness, grade, gamma signature and lithologic description or photos were examined to discern if the designation of oxidation was supportable. Low DEF interceptions were also re-evaluated to determine if the boundary should be moved inward.

Uranium Energy Corp. III Palangana ISR Uranium Project NI 43-101 Technical Report on Resources
SRK Consulting (U.S.), Inc. February 19, 2010 Palangana_NI 43-101 Technical Report_199600.010_KG.012
All uranium mineralization at Palangana except the Dome trend, have a net positive chemical disequilibrium relative to the %eU3O8 values determined from down hole gamma logging. The Dome trend is assumed to have a similar disequilibrium, but has not yet been tested. This is related to low chemical U content in the oxidized portion of the roll-front and the high chemical U content in the reduced portion. The usage of the PFN probe to identify the DEF factor has enabled a spatially specific adjustment to chemical uranium. UEC has employed the use of a PFN borehole probe to augment gamma readings. A properly calibrated PFN probe provides a radiometric reading that approximates directly uranium content. Where there is a high variability in the DEF as in the case of many Texas deposits, either extensive coring is necessary or quantification by a PFN probe is desirable to ascertain true uranium resources and reserves. About 30% of the drillholes in the PA-1 deposit were logged with the PFN probe and nearly all of the holes in the PA-2 area and the exploration trends were logged using this probe.
SRK has noted under the discussion of resource sensitivity for many of the exploration trends that these areas are still at an early stage of delineation. The inferred resources estimated are sensitive not only to the very limited number of intercepts available but also their location. For example 220,000 pounds are defined for zone E3 Jemison Fence which has a total of 8 intercepts, four of which are primarily the basis of the resource. With a regular pattern of delineation drilling as exploration continues these resources will change both in tons and grade.
Table 1 shows the resource statement with DEF adjustment and based on a zero % eU3O8 cut-off.
Table 1: Palangana Project Resource Statement (DEF adjusted and based on a zero % eU3O8 cut-off)
Area Classification Tons (000s) % eU3O8 eU3O8 lbs (000s) PA-1 & PA-2 Measured 7 0.158 21 PA-1 & PA-2 Indicated 386 0.134 1,036 PA-1 & PA-2 M & I 393 0.135 1,057 PA-1 & PA-2 Inferred 96 0.100 193 Jemison Fence Inferred 45 0.296 268 CC Brine Inferred 38 0.287 219 NE Garcia Inferred 57 0.180 205 Jemison East Inferred 22 0.241 105 Dome Inferred 57 0.097 111 SW Garcia Inferred 13 0.200 53 Total Inferred 328 0.176 1,154
Conclusions and Recommendations
The sandstone, roll-front deposits on the east side of the Palangana Dome in South Texas contain significant resources of eU3O8. The resources reported herein have been developed in mineralized trends away from the areas of historically reported resources by previous operators. Two of these deposits, known as the PA-1 and PA-2 bodies, have been adequately delimited for the calculation of Measured and Indicated Resources. A portion of the six exploration trends have been drilled adequately to establish Inferred Resources.
In SRK’s opinion, there has been sufficient drilling and coring, along with supportive interpretive studies to demonstrate geological and grade continuity within these deposits. The

Uranium Energy Corp. IV Palangana ISR Uranium Project NI 43-101 Technical Report on Resources
SRK Consulting (U.S.), Inc. February 19, 2010 Palangana_NI 43-101 Technical Report_199600.010_KG.012
resource numbers presented herein represent a significant uranium deposit which warrants the implementation of the following two phase programs. Phase I being advanced engineering and economic study of PA-1 and PA-2 leading toward near term production and Phase II being the implementation of a delineation drilling program to further define and expand the inferred resources present in the six exploration areas.

Uranium Energy Corp. 1-1 Palangana ISR Uranium Project NI 43-101 Technical Report on Resources
SRK Consulting (U.S.), Inc. February 19, 2010 Palangana_NI 43-101 Technical Report_199600.010_KG.012
1 Introduction SRK Consulting (U.S.), Inc. (SRK) was retained by Uranium Energy Corp. (UEC) to provide an independent NI 43-101 compliant resource estimation on a portion of the Palangana property in south Texas known as Production Areas 1 and 2 (PA-1 and PA-2) and adjacent exploration areas.
1.1 Terms of Reference and Purpose of the Report
SRK has been commissioned by UEC to prepare a Canadian National Instrument 43-101 (NI 43-101) compliant Technical Report on Resources for the Palangana ISR Project – PA-1, PA-2 and adjacent exploration areas, Duval County, Texas, USA located near the city of Corpus Christi. This project includes a historic ISR Uranium mine, a previously operated ISR processing facility, all support infrastructure and approximately 8,791.28 acres of fee lands. This document provides a Technical Report on Resources of the Palangana ISR Project – PA-1, PA-2 and adjacent exploration areas, prepared according to NI 43-101 guidelines. Form NI 43-101F1 was used as the format for this report. The intent of this Technical Report on Resources is to provide the reader with a comprehensive review of the historical exploration activities conducted at the Palangana Project, and a current SRK resource estimate based on 2694 drillholes totaling 1,263,166ft.
This Technical Report on Resources is prepared using the industry accepted Canadian Institute of Mining, Metallurgy and Petroleum (CIM) “Best Practices and Reporting Guidelines” for disclosing mineral exploration information, the Canadian Securities Administrators revised regulations in NI 43-101 (Standards of Disclosure For Mineral Projects) and Companion Policy 43-101CP, and CIM Definition Standards for Mineral Resources and Mineral Reserves (December 11, 2005).
1.2 Reliance on Other Experts
SRK’s opinion contained herein is based on information provided to SRK by UEC and its consultants throughout the course of SRK’s investigations, which in turn reflect various technical and economic conditions at the time of writing. Given the nature of the mining business, these conditions can change significantly over relatively short periods due to new drilling, cut-off grade (CoG) criteria, processing developments and evolving economics associated with market price, production scenarios and cost considerations.
This report includes technical information, which requires subsequent estimations to derive subtotals, totals and weighted averages. Such estimations inherently involve a degree of rounding and consequently introduce a margin of error. Where these occur, SRK does not consider them to be material.
1.2.1 Sources of Information
UEC provided SRK with an extensive and detailed database of technical information compiled by UEC and previous operators technical staff or outside consultants. Additionally, SRK was afforded full and open access to personnel involved in the working on the site under evaluation and to relevant information prepared by other consultants. At no time was SRK denied access to any individual associated with the projects. A summary of documentation provided to and reviewed by SRK is included in Section 19, References.

Uranium Energy Corp. 1-2 Palangana ISR Uranium Project NI 43-101 Technical Report on Resources
SRK Consulting (U.S.), Inc. February 19, 2010 Palangana_NI 43-101 Technical Report_199600.010_KG.012
This report is based upon published geologic reports, unpublished company reports and data, communication with employees and expert consultants familiar with the project.
Key reports, maps, and data were reviewed and validated at UEC’s Corpus Christi office. When necessary, electronic files were procured for more detailed review and analysis. While much of the historical information dates back to the initial Palangana discovery in the 1950’s, most of the work in resource Areas PA-1 and PA-2 was generated in the past five years. Mr. Sean Muller visited these new resource areas within the Palangana property on October 30, 2007 and had several follow-up visits to the Uranium One office in Corpus Christi through April 2008.
1.3 Qualifications of Consultants (SRK)
The SRK Group comprises more than 900 professionals, offering expertise in a wide range of resource engineering disciplines. The SRK Group’s independence is ensured by the fact that it holds no equity in any project and that its ownership rests solely with its staff. This permits the SRK Group to provide its clients with conflict-free and objective recommendations on crucial judgment issues. The SRK Group has a demonstrated track-record in undertaking independent assessments of resources and reserves, project evaluations and audits, technical reports and independent feasibility evaluations to bankable standards on behalf of exploration and mining companies and financial institutions worldwide. The SRK Group has also worked with a large number of major international mining companies and their projects, providing mining industry consultancy service inputs.
This Technical Report has been prepared based on a technical and economic review by a team of consultants sourced from the SRK Group’s Denver office. These consultants are specialists in the fields of geology, mineral resource and mineral reserve estimation and classification, underground and open pit mining, rock mechanics engineering, metallurgical processing, hydrogeology and hydrology, tailings management, infrastructure, environmental management and mineral economics.
Neither SRK nor any of its employees and associates employed in the preparation of this report has any significant beneficial interest in the assets of UEC or any of its subsidiaries. SRK will be paid a fee for this work in accordance with normal professional consulting practice.
The SRK team members assembled for this assignment and their specific area of responsibility are provided in Table 1.3.1.
Table 1.3.1: Project Team and Discipline
Team Members Project Responsibility Dr. Neal Rigby, CEng, MIMMM, PhD Project Manager, Mining Review Dr. Bart Stryhas, PhD, CPG Report overview, PA-1 and PA-2 Resource QP Frank Daviess, MAusIMM Exploration Areas Resource QP Sean Muller, CPG, and Texas P.Geo Geology, Resources PA-1 and PA-2 Andy Kurrus, Texas P.Geo Overview QP Patrick Hollenbeck, B.A. Geology Resource Modeler PA-1 and PA-2
Dr. Stryhas, Mr. Daviess and Mr. Kurrus are Qualified Persons for this Technical Report on Resources. Dr. Stryhas is responsible for all sections of the report except for the resource estimation of Section 15.2. Mr. Daviess is responsible for Section 15.2 and Mr. Kurrus is responsible for overview. The Certificates of Authors are provided in Appendix A.

Uranium Energy Corp. 1-3 Palangana ISR Uranium Project NI 43-101 Technical Report on Resources
SRK Consulting (U.S.), Inc. February 19, 2010 Palangana_NI 43-101 Technical Report_199600.010_KG.012
1.3.1 Site Visit
Mr. Kurrus visited the property on January 27, 2010. The site visit consisted of inspection of production areas, exploration and drilling targets, equipment and supplies.

Uranium Energy Corp. 2-1 Palangana ISR Uranium Project NI 43-101 Technical Report on Resources
SRK Consulting (U.S.), Inc. February 19, 2010 Palangana_NI 43-101 Technical Report_199600.010_KG.012
2 Property Description and Location 2.1 Property Location
The Palangana uranium property is located in Duval County, Texas, 25mi west of the town of Alice. More specifically lies 6mi north of the town of Benavides; 15mi southeast of the town of Freer and 12mi southwest of the town of San Diego (Figure 2-1). Freer, San Diego and Benavides are small rural agricultural towns with populations of 3,000, 5,000 and 1,600, respectively. Alice has a population of about 20,000 and is the county seat of the adjoining Jim Wells County.
2.2 Mineral Titles
There are nineteen current leases covering the area of interest of the Palangana Property. The PA-1 deposit is on the DeHoyos lease while the PA-2 deposit, the Dome trend and the CC Brine trend are on the Palangana Ranch Lease. Bordering the east side of the Palangana Ranch Lease is the White Bell Ranch Lease, comprised of 1,000 acres, which contains the Jemison Fence and Jemison East trends. The fourth major lease is the Garcia/Booth lease which borders the east side of the De Hoyos property. It contains the NE Garcia and SW Garcia trends. The size and terms of each lease are summarized in Table 2.2.1 below.
Current lease ownership is in South Texas Mining Venture (STMV), which is a Texas limited partnership which is wholly and indirectly owned by UEC through it’s subsidiary URN Resources Inc. (as to 99%), and through its direct acquisition of the remaining 1% of STMV from Everest Exploration Inc. The PA-1 deposit is on the DeHoyos lease while the PA-2 deposit is on the Schallert lease.
The mineral lease boundaries are located by coordinates referenced to the Texas State Plane survey datums. There are no specific monuments located in the field to document the corners or boundaries of the mineral titles other than typical surface property boundary markers.
Table 2.2.1: Palangana Project Mineral Leases
Lease Name Size (acres) Date Acquired Primary Term Plus Extensions (yrs) De Hoyos/ Hyde 1550.32 January 1, 2005 7 Zulema De Hoyos Living trust et al (cover the same areas as above) 1550.32 January 14, 2005 7 Palangana Ranch Lease 3003.745 March 24, 2005 10 Edward Steelhammer 96.895 February 15, 2006 10 White Bell Ranch 1,000 May 24, 2008 8 Patricia Booth 1278 May 18 2007 8 Paul Megerle 14 March 27, 2006 8 Stephanie Megerle 14 Robert Megerle 14 Claudia Megerle Reno 43 April 10, 2006 8 Howard Whitaker 15 March 23, 2006 8 Troy King 4 April 10, 2006 8 Fructoso H. Canales, Jr. 16 August 1, 2007 13 Albino F. Canales 32 August 1, 2007 13 Liborio Canales, Jr & Alicia Canales Garcia 32 August 1, 2007 13 Alicia Canales Carrillo 32 August 1, 2007 13 Angel Saenz, Jr, and Azalia Perez 32 August 1, 2007 13 Lydia Canales 64 August 20, 2007 13 Totals 8791.28

Uranium Energy Corp. 2-2 Palangana ISR Uranium Project NI 43-101 Technical Report on Resources
SRK Consulting (U.S.), Inc. February 19, 2010 Palangana_NI 43-101 Technical Report_199600.010_KG.012
2.3 Location of Mineralization
The PA-1, PA-2, and five of the six exploration trend deposits lie on the eastern flank of the Palangana salt dome as shown in Figure 2-2. The Dome trend lies in the underlying strata of the western half of all trends. They are located at a depth between approximately 220 and 600ft within the ”C”, “E” and “G” sands of the Goliad Formation of Pliocene age. These roll-front type, uranium-bearing sands are permeable and water saturated making it favorable for ISR. The mineralized zones, like many roll-front uranium deposits, occur in the reduced portion of the paleochannel sands. The general configuration of the sands is stacked, sinuous in nature and subparallel in aerial extent.
2.4 Royalties, Agreements and Encumbrances
2.4.1 DeHoyos Lease (revised by Replacement Lease 7 - 08)
The DeHoyos lease, constituting a single block, is located approximately 6mi north of Benavides and 12mi southwest of San Diego in Duval County, Texas. Title to the land is contained and reserved in Book 61, pages 285-289 of the Deed Records of Duval County, Texas, and is a portion of the tract of land known as the Palangana Pasture allotted to Mrs. Lizzie Singer under terms of the will of Mrs. Anna Collins, deceased, and decree of the District Court of Nueces County, Texas, and being Share 4 of Parcel F, First, and Parcel F, Second, and which decree is of record in Volume Z, page 314 et. seq., Deed Records of Duval County, Texas, and described by the meets and bounds contained therein. Provisions are:
1. The lease has a five-year primary term, is subject to the royalty schedule in Table 2.4.1.1 and is held by production or efforts by lessee to establish or reestablish production. The lease can be extended for a Renewal Term of two years upon payment of a US$75/acre (US$20/acre) bonus.
2. An annual rental of US$10/acre (US$20/acre) is payable during the time the Primary and Secondary Terms are in effect but no mining is in progress.
3. STMV has all right and title to conduct all activities necessary to explore, develop and mine. Specifically granted are: investigating, exploring, prospecting, drilling, solution mining, producing, extracting, milling, treating, processing, upgrading, removing, transporting, stockpiling and storing uranium, thorium and other fissionable or spatially associated substances. Rights to build roads, pipelines, utilities, processing structures and other necessary facilities are also granted.
4. Lessor reserves oil, gas and hydrocarbon mineral rights and the right to use and lease the surface.
5. Lessee has the right to pool and commingle uranium or other leased substances.
6. The lease can be assigned (No sale or assignment shall be binding upon Lessee until 30-days after Lessee is furnished a certified copy of the recorded assignment. May not assign without written consent of Lessor, which consent shall not be unreasonably withheld. Lessee shall not be relieved of obligations, conditions and covenants of the lease with respect to assigned portion of the lease arising subsequent to the date of assignment).
7. "Shut-In Royalty" provision. This provision states that if lessee deems there is commercially recoverable uranium but has not produced by the end of the Primary or

Uranium Energy Corp. 2-3 Palangana ISR Uranium Project NI 43-101 Technical Report on Resources
SRK Consulting (U.S.), Inc. February 19, 2010 Palangana_NI 43-101 Technical Report_199600.010_KG.012
Renewal Term, or if lessee halts production because of market reasons, lessee can continue the lease in force through payment of a "Shut-In Royalty" of US$10/acre (1 ½ times annual delay rental, i.e. US$30/acre) for a maximum of three years, (in aggregate, after the expiration of the primary term or renewal term) which do not have to be consecutive.
8. The lease contains provisions for continuing the lease in force for 180 days after expiration of the Primary or Renewal Term if lessee is engaged in efforts to begin operations (or resume operations if interrupted) that result in production. In addition, if production is halted during the Primary or Secondary Term, the lease can continue to be held if lessee resumes payment of Rental as described above.
9. Lessor to have access to all records pertinent and necessary for substantiating compliance of lessee with provisions of the lease, including: production records, assays and evaluation ore records, and all other records pertinent and necessary.
10. Lessor is due US$25 (US$50) per exploration hole and a one-time payment of US$250/acre (US$750/acre) for acreage taken out of use.
11. Lessee shall not be liable for delays or defaults due to force majeure.
12. Lessee has the right to take its royalty in kind provided that any such election must be for a minimum of one year.
Table 2.4.1.1: DeHoyos Royalty Schedule
Price/lb for which Leased Substances are Sold Royalty Percentage Rate Less than US$30 8 US$30 or more, but less than US$40 9 US$40 or more 10
2.4.2 Schallert Lease (Palangana Ranch)
The Schallert mineral rights lease is limited to depths from the ground surface to 1,500ft. The lease is in Duval County, Texas. The 3100.64 acres is described as Share 3, Parcel F-2, allotted to Robert Schallert in the decree of partition rendered by the District Court of Nueces County, Texas, on August 8, 1908 (Robert Schallert, et al vs. Chas. Hoffman, et al), which decree is incorporated by reference into the lease. Pertinent provisions are:
1. The lease has a five-year Primary Term and is held by production thereafter and a Secondary Term of five years upon payment of a US$60/acre bonus.
2. An annual rental of US$10/acre is payable during the time the Primary and Secondary Terms are in effect but no mining is in progress.
3. Surface usage payments of US$50 per exploration hole and US$650/acre for acreage taken out of use.
4. STMV has all right and title to conduct all activities necessary to explore, develop and mine. Specifically granted are: investigating, exploring, prospecting, drilling, solution mining, producing, extracting, milling, treating, processing, upgrading, removing, transporting, stockpiling and storing uranium, thorium and other fissionable or spatially associated substances.

Uranium Energy Corp. 2-4 Palangana ISR Uranium Project NI 43-101 Technical Report on Resources
SRK Consulting (U.S.), Inc. February 19, 2010 Palangana_NI 43-101 Technical Report_199600.010_KG.012
5. Lessor reserves oil, gas and hydrocarbon mineral rights and the right to use and lease the surface. Lessor further prohibits use of the leased premises for disposal of any tailings or waste liquid or material from its operations, laying pipeline, building roads, power lines and other utilities or processing structures except as expressly authorized in the lease.
6. Lessee has the right to pool and commingle uranium or other leased substances.
7. The lease can be assigned.
8. "Shut-In Royalty" provision. This provision states that if lessee deems there is commercially recoverable uranium but has not produced by the end of the Primary or Renewal Term, or if lessee halts production because of market reasons, lessee can continue the lease in force through payment of a "Shut-In Royalty" of US$10/acre for a maximum of two years, which do not have to be consecutive.
9. The lease contains provisions for continuing the lease in force for 90 days after expiration of the Primary or Secondary Term if lessee is engaged in efforts to begin operations (or resume operations if interrupted) that result in production. In addition, if production is halted during the Primary or Secondary Term, the lease can continue to be held if lessee resumes payment of Rental as described above.
10. Lessor to have access to all records pertinent and necessary for substantiating compliance of lessee with provisions of the lease, including: production records, copies of all data developed on the property, logs, tests, assays, reservoir studies, and reports to government agencies. Lessor shall also be entitled to receive copies of sales agreements and contracts, which will be held confidential for two years except when required by lessors representatives for audit, which release will be under a confidentially agreement with said representatives.
11. Lessee shall not be liable for delays or defaults due to force majeure.
12. Royalties for the Schallert tract are set forth in Table 2.4.2.1. Lessee has the right to take its royalty in kind provided that any such election must be for a minimum of one year.
Table 2.4.2.1: Schallert Royalty Schedule
U3O8 US$/lb Sold (Net Sales Proceeds) Royalty Percent US$25 or less 7 US$25.01 to less than US$30.01 8 US$30.01 to less than US$40.01 9 US$40.01 or more 10
Palangana Ranch Lease (3,004 net mineral acres) covers depths from the surface to a depth of 1,500 feet on 3,100.64 acres. It is dated March 24, 2005 has a five year primary term with an option for five more years. Royalties run from 7% when uranium sells below US$25/lb to 10% when uranium is more than US$40/lb.
Edward Steelhammer Lease dated February 15, 2006 (97 net mineral acres) covers depths from the surface to a depth of 1,500 feet on 3,100.64 acres. 10% royalty; five year term with US$10/ac/yr rentals. Pay US$60/ac to enter a second five year renewal term with US$10/ac/yr rentals. After discovery Lessee may pay US$10/ac shut-In Royalty for a cumulative period of two years
Uranium Energy Corp. 2-5 Palangana ISR Uranium Project NI 43-101 Technical Report on Resources
SRK Consulting (U.S.), Inc. February 19, 2010 Palangana_NI 43-101 Technical Report_199600.010_KG.012
White Bell Ranch Lease (sometimes called “Jemison Lease”) dated May 24, 2008 covers 1,000 acres, out of Lessor’s 3,043.69 acres, contiguous and to the East of the Palangana Lease and has a primary term of eight years. Royalties run from 7% when uranium sells below US$35/lb to 10% when uranium is more than US$50/lb.
Angelina R Garcia Lease 1,528.08 surface acres dated August 31, 2007 with a primary term of four years with the option for another four years / Patricia A Booth Lease dated May 15, 2009 with a primary term of eight years1,278 acres of minerals. These two leases cover contiguous lands south of White Bell Ranch Lease and East of Zulema De Hoyos Living Trust Lease. If uranium falls under the surface Lessor, royalty runs from 10% when uranium is below US$50/lb to 12% when it is over US$85/lb. If deposits are deeper and under the terms of the Booth Lease, royalty runs from 6% below a uranium price of US$30/lb to 8% above US$35/lb.
2.5 Environmental Liabilities and Permitting
UEC, as part of the acquisition of South Texas Mining Venture, LLP has obtained all necessary permits and license to begin ISR mining operations at the Palangana Project. Because Texas is an Agreement State, all the primary permits must be obtained through various Texas regulatory agencies. The primary permit for an ISR mine is the large site mine permit from the Texas Commission on Environmental Quality (TCEQ). There are several required geologic, hydrogeology, and environmental studies that must be submitted with the permit application. Within the large permit area, individual production area authorizations (PAA) must be approved by the TCEQ prior to mining each area. Additional permits required include a Radioactive Material License, an EPA Aquifer Exemption, and an Air Quality Exemption Permit. A deep waste disposal well is required at the facility; therefore a Class I Underground Injection Control (UIC) permit must be applied for and approved by the TCEQ.
All of the environmental baseline studies were completed as required by the permitting process.. Completed studies include: cultural resources (including archaeology), socioeconomic impact, and soils mapping. Flora and fauna studies are completed as are background radiation surveys. The cultural resources study found no adverse impacts to the site and socioeconomic impacts are projected to be positive for the community.
The permitting process commenced in the summer of 2006 and was fully completed in January 2010. In November of 2008 the larger Area Mine Permit was issued by TCEQ. In January of 2009 PA-1 Permit was approved by TCEQ. The Class I disposal well permits for WDW-418 and WDW-419 were issued in March 2009. The Radioactive Material License was issued by TCEQ in January 2010. This would complete all of the permitting requirements to begin operation at the Palangana Project.
2.5.1 Required Permits and Status
As far as the studies have shown, Palangana has no environmental liabilities. The UCC in-situ recovery field and plant site, partially on the DeHoyos tract, have been fully restored and reclaimed and are not hierologically linked to PA-1 and PA-2. SRK has not assessed the potential for environmental liability associated with the Hobson Plant. Required Permits and Status
UEC, as part of the acquisition of South Texas Mining Venture, LLP has obtained all necessary permits and license to begin ISR mining operations at the Palangana Project.

SRK Job No.: 199600.010
File Name: Figure 2-1.docx Date: 01/29/10 Approved: BAS Figure: 2-1
Palangana ISR Uranium Project, Duval County, Texas
Source: UEC
Palangana Project Location Map

SRK Job No.: 199600.010
File Name: Figure 2-2.docx Date: 01/29/10 Approved: BAS Figure: 2-2
Palangana ISR Uranium Project, Duval County, Texas
Source: UEC
Palangana Mineral Trend and
Drillhole Location Map

Uranium Energy Corp. 3-1 Palangana ISR Uranium Project NI 43-101 Technical Report on Resources
SRK Consulting (U.S.), Inc. February 19, 2010 Palangana_NI 43-101 Technical Report_199600.010_KG.012
3 Accessibility, Climate, Local Resources, Infrastructure and Physiography
3.1 Topography, Elevation and Vegetation
Elevations of the Palangana Project deposits at the surface range from about 410ft to 500ft. Figure 3-1 illustrates the local rolling topography in and around the Palangana property.
3.2 Climate and Length of Operating Season
The region's subtropical climate allows uninterrupted, year-round mining operations. Temperatures during the summer range from 75° to 95°F, although highs above 100°F are common; winter temperatures range from 45° to 65°F. Humidity is generally over 85% year-round, and commonly exceeds 90% during the summer months. Average annual rainfall is 30in. The climate is characterized by a warm desert-like to subtropical climate and low gentle relief with elevations of 300 to 500ft above sea level.
3.3 Physiography
The dome area to the west of the PA-1 and PA-2 deposits is a concentric collapsed area (Figure 3-1) with the surrounding landscape being hilly and elevated. Surface water generally drains away from the dome area although no prominent creeks or rivers are evident.
3.4 Access to Property
The Palangana uranium in-situ recovery (ISR) project, of which PA-1 and PA-2 are a part, occurs in the South Texas Uranium Belt between San Antonio and Corpus Christi in Duval County. Corpus Christi is about 65mi to the east of the Palangana property. It can be accessed off Texas Highway 44 toward Freer. Halfway between San Diego and Freer is a turn-off to the south called Ranch Road 3196 that runs right through the property about 8mi from the turn. The road continues southward about 6mi to the town of Benavides.
Access is excellent, with major two lane roads connecting the three surrounding towns and dirt secondary roads connecting Palangana to these. Corpus Christi, 65mi east, is the largest nearby metropolitan district.
3.5 Surface Rights
The uranium leaseholders under most of the current leases have conveyed the surface rights under certain conditions of remuneration. These conditions essentially require payments for surface area taken out of usage. The surface areas currently under agreements are presented in Table 3.5.1

Uranium Energy Corp. 3-2 Palangana ISR Uranium Project NI 43-101 Technical Report on Resources
SRK Consulting (U.S.), Inc. February 19, 2010 Palangana_NI 43-101 Technical Report_199600.010_KG.012
Table 3.5.1: Current Palangana Project Surface Rights
Palangana Area Leases Gross Acres Net AcresdeHoyos/Hyde Lease
3,101
775 Singer Heirs (35) 775Zulema deHoyos Lease 775Singer Heirs (35) 775Palangana Ranch Lease
3,101 3,004Edward Steelhammer 97Paul Megerle Lease
85
14Stephanie Megerle Lease 14Robert Megerle Lease 14Claudia Megerle Reno Lease 43Howard Whitaker Lease
125 15Troy King Lease 4Angelina Garcia (Surf only - conflict w/Patricia Booth) 1,528 1,528White Bell Ranch 1,000 500 Oscar Ruiz 103 103Fructoso H. Canales, Jr. 16 16Albino F. Canales 32 32Liborio Canales, Jr. and Alicia Canales Garcia 32 32 Alicia Canales Carrillo 32 32Angel Saenz Jr. and Azalia Perez 32 32Lydia Canales 64 64Total acres of surface ownership under lease 9251 8645
3.6 Local Resources and Infrastructure
Excepting the wellfield development, much of the infrastructure is in place including roads, and power maintenance faculties. The well control facilities and wellfields are yet to be constructed.
3.6.1 Access Road and Transportation
The property is readily accessible by existing roads.
3.6.2 Power Supply
Power for operating the wellfield already exists on the property.
3.6.3 Buildings and Ancillary Facilities
Currently a maintenance facility and office exists on the site. Other buildings associated with wellfield production are under construction.
3.6.4 Manpower
A nearby workforce of field technicians, welders, electricians, drillers and pipefitters exists in the local communities. The technical workforce for facility operations has largely disappeared from the area although ample qualified resources can be found in the south Texas area from the petrochemical industry.

SRK Job No.: 199600.010
File Name: Figure 3-1.docx Date: 01/29/10 Approved: BAS Figure: 3-1
Palangana ISR Uranium Project, Duval County, Texas
Source: UEC
Palangana Topography and Property Boundaries

Uranium Energy Corp. 4-1 Palangana ISR Uranium Project NI 43-101 Technical Report on Resources
SRK Consulting (U.S.), Inc. February 19, 2010 Palangana_NI 43-101 Technical Report_199600.010_KG.012
4 History Uranium mineralization was discovered during potash exploration drilling of the Palangana Dome's gypsum-anhydrite cap rock in 1952 by Columbia Southern Inc. (CSI), a subsidiary of Pittsburgh Plate Glass Corp. CSI conducted active uranium exploration drilling on the property starting in March 1956. Records of CSI's exploration work are unavailable. However, both CSI and the U.S. Atomic Energy Commission (USAEC) estimated underground mineable uranium resources. The only known details of the estimation method include a 0.15% eU3O8 CoG, a minimum mining thickness of 3ft, and widely spaced drilling on a nominal 200ft exploration grid.
UCC acquired the Palangana property in 1958 and initiated underground mine development. Development work was quickly abandoned due to heavy concentrations of H2S gas and UCC dropped the property. UCC reacquired Palangana in 1967 after recognizing that it would be amenable to exploitation by the emerging ISR mining technologies. During the 1960’s and 1970’s, UCC drilled over 1,000 exploration and development holes and installed over 3,000 injection-production holes in a 31 acre block.
UCC attempted an ISR operation from 1977 through 1979 using a push/pull injection/recovery system. Ammonia was used as the lixiviate that later caused some environmental issues with groundwater. About 340,000lbs of U3O8 were produced from portions of a 31 acre wellfield block. The production pounds indicate a 32% to 34% recovery rate. The push/pull injection/recovery system was later proven to be less productive than well configurations or patterns of injection wells around a recovery well. Further, the wellfield was developed without any apparent regard to the geology of the deposit including disequilibrium. The UCC ISR work was basically conducted at a research level in contrast to the current level of knowledge. The historic production area lies on the western side of the dome and is not part of this resource estimate.
UCC placed the property leases up for sale in 1980. In 1981, Chevron Corporation (Chevron) acquired the UCC leases and conducted their own resource evaluation. This indicated that an estimated 8Mlbs (non-CIM compliant) of eU3O8 existed on the entire site within unclassified material containing 0.125% eU3O8. After the price of uranium dropped to under US$10/lb, General Atomics acquired the property and dismantled the process plant in a property-wide restoration effort. Upon formal approval of the clean up by the Texas Natural Resources Conservation Commission and the USNRC, the property was returned to the landowners in the late 1990’s.
In 2005, EEI acquired the Palangana property and later joint ventured with Energy Metals through the formation of STMV. An independent consultant, Blackstone (2005) estimated that there were 5.7Mlbs of inferred resources in an area now referred to as the Dome trend proximal to the dome on the west side north of the prior UCC leach field (Figure 4-1). In 2006 and 2007, Energy Metals drilled approximately 200 additional confirmation and delineation holes. The PA-1 and PA-2 areas were found during this drilling program. In 2008, Energy Metals was acquired by Uranium One. During 2008 and 2009 the remainder of the holes on this project were drilled by Uranium One. During this time the five exploration trends to the east of the dome were identified and partially delineated. In December 2009 UEC acquired 100% ownership of STMV.

SRK Job No.: 199600.010
File Name: Figure 4-1.docx Date: 01/29/10 Approved: BAS Figure: 4-1
Palangana ISR Uranium Project, Duval County, Texas
Source: UEC
Palangana Dome with Location of PA-1, PA-2 and the Exploration
Trend Resource Areas

Uranium Energy Corp. 5-1 Palangana ISR Uranium Project NI 43-101 Technical Report on Resources
SRK Consulting (U.S.), Inc. February 19, 2010 Palangana_NI 43-101 Technical Report_199600.010_KG.012
5 Geological Setting
South Texas geology is characterized by an arcuate belt of Tertiary fluvial clastic units deposited along the passive North American plate. These units strike parallel to the Gulf Coast between the Mexican border and Louisiana within an area known as the Mississippi Embayment (Figure 5-1). The sedimentary units are primarily of fluvial origin and were deposited by southeasterly flowing streams and rivers. Uranium deposits are contained within fault-controlled roll-fronts in the Pliocene-age Goliad Formation on the flank of the Palangana salt dome. The uranium mineralization in the Goliad Formation at Palangana occurs at a depth of approximately 220 to 600ft below the surface.
The Pliocene Goliad Formation, host for the Palangana and other uranium deposits, unconformably overlies the Fleming Formation and is composed of three units: a basal fine to coarse-grained to conglomeratic cross-bedded unit with calcareous clay; a middle member of calcareous clay; and an upper unit of sandstone and calcareous clay. Caliche is common, especially in the muddy sediments. The conglomerates contain a variety of lithic fragments from the Fleming and older formations. The Goliad is interpreted to be a braided meander belt fluvial deposit with muds as flood plain or overbank deposits. The sands, and gravels, composed mostly of quartz and chert, are very clean and associated with channels and point bars. Passive margin growth faulting along the South Texas Uranium Belt is common with “down-to-the-coast” normal faults predominating.
The local geology at Palangana is characterized by the occurrence of a Gulf Coast piercement salt dome. This dome (Figure 5-1) is approximately 2mi in diameter and is overlain by Pliocene sediments of the Goliad Formation. The Palangana dome is marked at the surface by a shallow circular basin surrounded by low hills rising 50 to 80ft above the basin floor, and hence its Spanish name, Palangana, which translates to “washbasin” in English. The Palangana dome has an almost perfectly circular salt core with a remarkably flat top that is approximately 10,000ft across and occurs from 800 to 850ft below the topographic surface. Radial faulting is present in all Goliad sands on the flanks of the dome due to uplift during the intrusion of the dome. Faults and fractures also exist in a random nature in the sands above the caprock due to solution of the salt dome from groundwater. Once the salt was solubilized and removed, the overlying sediment collapsed, creating the basin and associated faults.
The Goliad at Palangana is composed of fine- to medium-grained, often silty, channel sands interbedded with lenses of mudstone and siltstone. For the most part, the sand is very sparsely cemented although it varies from friable to indurated. There is known to be minor faulting on the north end of the PA-1 deposit. The Palangana stratigraphy is horizontal to sub-horizontal, with at most, a 2 to 3º southeasterly dip.

SRK Job No.: 199600.010
File Name: Figure 5-1.doc Date: 01/29/10 Approved: BAS Figure: 5-1
Palangana ISR Uranium Project, Duval County, Texas
Regional Geologic Map with Uranium Trend

Uranium Energy Corp. 6-1 Palangana ISR Uranium Project NI 43-101 Technical Report on Resources
SRK Consulting (U.S.), Inc. February 19, 2010 Palangana_NI 43-101 Technical Report_199600.010_KG.012
6 Deposit Type 6.1 Geological Model
Uranium mineralization in the South Texas Uranium Belt occurs as sandstone-hosted roll-front deposits. The deposits are strata-bound, elongate, and often, but not necessarily, occur in the classic “C” or truncated “C” roll configuration. They can be associated with an oxidation front or can be found in a re-reduced condition where an overprint of later reduction from hydrogen sulfide or other hydrocarbon reductant has seeped along faults and fractures. The uranium-bearing sandstone units can themselves be separated into several horizons by discontinuous mudstone units, and separate roll-fronts and sub-rolls can occur in the stacked sandstone sequences.
The generally accepted origin of uranium mineralization in the Goliad Formation is from leaching of intraformational tuffaceous material or erosion of older uranium-bearing strata. The leached uranium was carried by oxygenated ground water in a hexavalent state and deposited where a suitable reductant was encountered. The oxidation/reduction (redox) fronts are often continuous for miles, although minable grade uranium mineralization is not nearly as continuous. The discontinuous nature of uranium mineralization is often characterized as “beads on a string” and is due to sinuous vertical and lateral fluvial facies changes in the permeable sandstone host horizons, coupled with ground water movements and the presence or absence of reducing material.
Figure 6-1 is a schematic view of a typical uranium roll-front wellfield configuration. The red area is the uranium mineralization deposited at the interface between the oxidized (up gradient) sand shown in yellow and the reduced (down gradient) sand shown in gray. The up gradient sand has been altered by oxidizing groundwater that carried the uranium that was deposited in the roll-front at the oxidation/reduction (Redox) interface. The uranium mineralization is hydrologically confined by an upper and lower confining layer of shale or mudstone. A production (pumping) well has been completed in the center of the roll-front and is fed lixiviate (leach solutions) by two injection wells on each side of the front.
While not all roll front bodies exhibit the same mineralization geometry, Figure 6-1 provides a good conceptual picture of the idealized redox front. One item, in particular needs to be emphasized in evaluating the Goliad deposits at Palangana, namely: disequilibrium of the roll front wings or limbs. These can carry uranium values although the thickness is usually too thin to chase independently. PFN logging has defensibly shown that often these zones carry significant chemical uranium. One other explanation may be related to the correlation of the mini-roll front data. In some instances what appear to be chemically stable wings or limbs may be other subordinate roll fronts.

SRK Job No.: 199600.010
File Name: Figure 6-1.doc Date: 01/29/10 Approved: BAS Figure: 6-1
Palangana ISR Uranium Project, Duval County, Texas
Source: Blackstone, 2005
Idealized Model of Uranium Roll Front Mineralization

Uranium Energy Corp. 7-1 Palangana ISR Uranium Project NI 43-101 Technical Report on Resources
SRK Consulting (U.S.), Inc. February 19, 2010 Palangana_NI 43-101 Technical Report_199600.010_KG.012
7 Mineralization All known Goliad formation deposits at Palangana are multiple-stage roll-front-type deposits in a roughly “horseshoe shaped” configuration as illustrated in Figure 6-1. As uranium-bearing ground water moved from west to east through the region, a redox front was created around a subsurface high of reduced rock proximal to the dome. This reduced ground resulted from the introduction of hydrocarbons or their derivatives, mainly H2S, into the Goliad aquifers through fractures and formational seepage above the dome, providing the environment for uranium precipitation.
The Palangana uranium mineralization occurs in the Goliad sandstone unit at depths ranging from 200 to 650ft below the surface. The favorable sandstone unit is as much as 400ft thick and is bounded by mudstones. Within this unit are at least six separate sandstone horizons hosting roll-type uranium mineralization. These units are interbedded with mudstones that served as constraining aquitards for uraniferous groundwater movement. Mineralization occurs as uraninite and is fixed at positions where the migrating uranium-bearing solutions encountered a suitable reductant. Uranium values in mineralized strata grades from 0.001% to several percent eU3O8. Mineralized thicknesses range from less than 1ft to several tens of feet in multiple, stacked roll front zones.
Identification of the uranium minerals has not been specifically determined for Palangana. Uraninite is commonly found coating quartz grains and within the interstices in most south Texas sand and sandstone tabular and roll-front deposits. Molybdenum commonly occurs as jordisite, a molybdenum sulfide, but no documentation of mineralogical analyses was available. Molybdenum is a significant accessory to uranium mineralization, with an erratic distribution. Select core assay reports were reviewed, with assays ranging from a background of approximately 50ppm to as high as 0.23% Mo. More typically, assays range from 0.02% to 0.04% where molybdenum levels are elevated.
Although there were few selenium assays available, it too is commonly elevated in the mineralized zones, its grade generally following uranium grades. It does not appear to have a relationship to molybdenum. The highest value observed in core analyses was 0.09% Se associated with a chemical U3O8 grade of 1.8%; Se grades of 0.01% to 0.03% in the mineralized zones were the most common. Background values were generally less than 10ppm. Vanadium is not common in the south Texas deposits and the few V2O5 assays available did not show an elevation in mineralized zones over background values of 0.01% - 0.03%.
7.1 Mineralized Zones
As stated previously, mineralization does not occur in all of the Goliad sands nor does it persist in the same sand intervals across the dome area. On the west half of the dome near what is referred to as the Dome trend, UCC developed the “C” sand zone. The NW Garcia and SE Garcia trends to the east of the dome also reside in the “C” sand zone. Also to the east of the dome, the PA-2 deposit, as well as the CC Brine, Jemison Fence and Jemison East trends all occur in the “E” sand, while the PA-1 deposit occurs in the “G” sand. Within these mineralized horizons, smaller roll fronts are evident that can be mapped as discrete bodies. Some of these bodies contain economic mineralization while others do not. The mineralized horizons occur as stacked intervals often separated by claystones. Generally they overlap one another but there are differences making a concurrent, multiple-horizon recovery scenario not uniformly effective.

Uranium Energy Corp. 7-2 Palangana ISR Uranium Project NI 43-101 Technical Report on Resources
SRK Consulting (U.S.), Inc. February 19, 2010 Palangana_NI 43-101 Technical Report_199600.010_KG.012
Figure 7-1 is a typical section within the PA-1 deposit without detailed discrimination of the roll front zones in the “G” sand horizon.
7.2 Relevant Geological Controls
Key geologic controls on mineralization appear to be permeability of the oxidized portion of the roll front followed by either lower permeability zones containing reductants or possibly reductants associated with down-gradient fault traces. The source of reductants is generally thought to be hydrogen sulfide and methane seeps through faults that developed during emplacement of the salt dome. Position on the dome does not appear to control mineralization. This would suggest that mineralization occurred prior to the structural events associated with doming. The collapse of the centroid of the dome is not clearly understood in relation to uranium mineralization and it might be a partial result of salt mining.
A poorly understood phenomenon is the lack of uranium mineralization in some sand zones where neither upgradient nor down gradient roll fronts exist. Perhaps this may be due to unique attributes of the interfingering, paleodepositional system at the time of movement of uranium in groundwaters. However, the usage of marker clays for sand zone discrimination needs further study to confirm the structural continuity of sands across the dome and fringe areas. Uranium occurring in a post depositional system should be a temporal episode likely associated with volcanism or erosion of volcanic sediments outcropping upgradient of the Goliad sand beds.
7.3 Type, Character and Distribution of Mineralization
The uranium mineralization, as is the case in roll fronts elsewhere, can be significantly out of equilibrium. Consequently, the oxidized portion of the roll front while elevated in gross gamma radiation can be depleted of chemical uranium. Hexavalent uranium in solution in the groundwater, ultimately became stabilized in uranium oxide minerals as a function of lower pH and EH (redox potential) that has been caused by a variety of factors but mostly the introduction of hydrogen sulfide and perhaps methane gas along fault traces around the Palangana dome. Closely associated with this mineralization, is generally the introduction of iron sulfide.
Because of the differing mineral suites, the color of the sand and interbedded clays will vary on either side of the redox front from yellows and orange colors on the oxidized side of the system to greens, blue and dark grey on the reduced side. This is the reason why accurate lithologic logging is important as a first step to understanding where the drillhole is in relation to the redox interface. Great efforts have been taken in the past by Uranium One and it’s predecessors to document this color change through the use of field photos and field descriptions of drill cuttings that have been archived with the drillhole records.
The width of the reduced portion of the roll front systems at Palangana can vary from approximately 30-40m to only a few meters over a short strike distance. The reason for variation in the mineralized width is likely in part attributable to the permeability of the sand system in a particular part of the fluvial channel and the amount of reductant available at the time of the influx of uranium-bearing fluids. Multiple surges in oxidation fronts are believed to have formed the multiple mini-roll fronts within the sands although in many instances there are intervening claystones that could have caused the separation of the roll fronts within a specifically mapped sand zone.

Uranium Energy Corp. 7-3 Palangana ISR Uranium Project NI 43-101 Technical Report on Resources
SRK Consulting (U.S.), Inc. February 19, 2010 Palangana_NI 43-101 Technical Report_199600.010_KG.012
The cross sections shown in the following figures show the nature of the mineralization along the strike of the roll front trend and across the roll front interface or redox zone for PA-1 (Figures 7-2 through 7-4) and for PA-2 (Figures 7-5 through 7-9).

SRK Job No.: 199600.010
File Name: Figure 7-1.doc Date: 01/29/10 Approved: BAS Figure: 7-1
Palangana ISR Uranium Project, Duval County, Texas
Typical Stratigraphic Section

SRK Job No.: 199600.010
File Name: Figure 7-2.docx Date: 01/29/10 Approved: BAS Figure: 7-2
Palangana ISR Uranium Project, Duval County, Texas
Source: UEC
Cross-section Index across PA-1 Deposit

SRK Job No.: 199600.010
File Name: Figure 7-3.doc Date: 01/29/10 Approved: BAS Figure: 7-3
Palangana ISR Uranium Project, Duval County, Texas
Source: UEC
PA-1 Deposit Cross-section A-A’

SRK Job No.: 199600.010
File Name: Figure 7-4.doc Date: 01/29/10 Approved: BAS Figure: 7-4
Palangana ISR Uranium Project, Duval County, Texas
Source: UEC
PA-1 Deposit Cross-section B-B’

SRK Job No.: 199600.010
File Name: Figure 7-5.doc Date: 01/29/10 Approved: BAS Figure: 7-5
Palangana ISR Uranium Project, Duval County, Texas
Source: UEC
PA-1 Deposit Cross-section C-C’

SRK Job No.: 199600.010
File Name: Figure 7-6.docx Date: 01/29/10 Approved: BAS Figure: 7-6
Palangana ISR Uranium Project, Duval County, Texas
Source: UEC
PA-2 Cross-section Index

Uranium Energy Corp. 8-1 Palangana ISR Uranium Project NI 43-101 Technical Report on Resources
SRK Consulting (U.S.), Inc. February 19, 2010 Palangana_NI 43-101 Technical Report_199600.010_KG.012
8 Exploration Exploration activities in the 1950’s noted radioactivity in shallow sediments between 200 to 400ft around the Palangana salt dome. Follow-up drilling during the 1960’s was mostly wide spaced drilled holes several hundreds of feet apart. Upon a discovery in what has been called the “C” zone in the Goliad Sandstone, UCC attempted both underground and then in-situ development on the west flanks of the dome. The water filled nature of these mineralized sands made it favorable for ISR.
As an exploration target, the dome offered favorable attributes for roll-front deposits including a permeable, fluvial sand system that was subject to post depositional mineralization by uranium migration in solution from a likely volcanic source rock. Reductants around the dome area associated with faulting provided the requisite stabilization mechanism for the uranium roll-fronts to form. Several other mineralized sand zones were discovered across the dome area through the 1980's but the exploration methods were not sophisticated enough to map discrete roll-fronts in the stacked sand system. Extensive faulting, particularly around the dome and the lack of successful exploitation of one of the first in-situ production projects by UCC, slowed exploration efforts. This combined with the low cost of uranium during the late 1980’s and 1990’s essentially stopped exploration and development in the area.
In 2006, Energy Metals resumed exploration activities at Palangana. They began exploration by drilling a wide spaced grid across the property in an attempt to identify areas of oxidation and reduction of the mineralized trends. During this phase of work, the PA-1 and PA-2 deposits were identified as well as the six exploration trends identified in this report. These deposits were further delineated through concentrated drilling and were assessed using the PFN probe.
8.1 Surveys and Investigations
Detailed drillhole surveys have been conducted by all operators for all drillholes in at the Palangana Project. There is no reason to suspect that the input locations for modeling purposes are incorrect.
8.1.1 Procedures and Parameters
Exploration was initially conducted by most previous operators in the PA-1 area using gamma logging and minor coring. Later this was augmented by numerous in-fill drill fences and in-fill grid holes that were logged using the PFN logging tool. Nearly all of the drillholes in the PA-2 area were logged using the PFN tool although no coring was undertaken. The Dome trend, identified early, has not yet been revisited with the PFN tool. However, the majority of the drillholes in the other five trends were logged using both the gamma and PFN tools. Calibration of the PFN probes with actual corehole chemical analyses, was later used to modify PFN derived DEF on a hole by hole basis throughout the project.
8.2 Interpretation
Drillhole data was correlated using standard industry methods that employed comparison of analog printouts of proximal drillholes. Marker clay horizons were used for determining sand zones and position of local faults. Drillholes were also logged as oxidized or reduced based upon coloration supported by detailed field photographs. Logs were then evaluated in mineralized zones as being limbs or wings, fronts and proto-fronts based upon gamma

Uranium Energy Corp. 8-2 Palangana ISR Uranium Project NI 43-101 Technical Report on Resources
SRK Consulting (U.S.), Inc. February 19, 2010 Palangana_NI 43-101 Technical Report_199600.010_KG.012
signatures. Roll fronts within discrete sand zones were then subdivided numerically in order to map micro-roll fronts to enable detailed wellfield development planning.
Prior to model input, all of the data was further evaluated for interpreted validity using PFN data. A few zones that had been called oxidized were reclassified if the values were positive and where it was suspected that the field classification of oxidation might have been in error. Earlier in the drilling program at PA-1, drilling was not as careful to enable select drill cutting retrieval from the zone drilled. In these instances, it was later suspected that uphole mixing of oxidized material masked the likely reduced cuttings from some intervals.
In overview, the logging interpretation methods employed by Uranium One were performed to industry standards.

Uranium Energy Corp. 9-1 Palangana ISR Uranium Project NI 43-101 Technical Report on Resources
SRK Consulting (U.S.), Inc. February 19, 2010 Palangana_NI 43-101 Technical Report_199600.010_KG.012
9 Drilling 9.1 Rotary Drilling and Logging
In general, common roll-front exploration practice was to drill widely-spaced rotary holes on a 400 to 600ft grid pattern, examine cuttings for evidence of alteration-bleaching-oxidation, gamma logs for evidence of uranium mineralization, and resistivity/self-potential logs for evidence of permeable sandstone horizons. The drill spacing was tightened further between areas of reduced and oxidized sandstone host horizons to target the uranium enriched redox boundary. Once the roll-front mineralization was intersected and its trend established, fences were drilled every 200ft with holes within fences further tightened as required by the lateral continuity of the uranium mineralization.
Nearly all rotary holes were drilled to pre-targeted depths with truck-mounted mud rigs capable of drill depths up to 1,500ft. The holes were generally drilled to a 5-1/8in diameter and used a drilling fluid consisting of a polymer mud with various additives for fluid loss control. The drill orientation was vertical, and given the shallow depth of drilling (i.e., less than 400ft) in relatively soft sedimentary units, there was minimal hole drift or deviation. As a result, it is reasonable to assume that the holes intersected the horizontal to subhorizontal lenses of uranium mineralization at approximately a normal angle. Rotary cuttings were examined in the field and log data recorded. Upon completion of a drillhole, it was logged with gamma ray, self-potential, resistivity and continuous drift by either an in-house logging truck or contract unit. Drillhole collar locations were surveyed and recorded.
9.2 UCC Drilling Program
UCC drilling appears to have followed a normal exploration and development approach, but somewhat inconsistently. The result is that the 1,117 holes are unevenly distributed over the Palangana property with only a few in the PA-1 and PA-2 project areas. The primary focus of the UCC development drilling was within a 3,500 x 3,400ft area surrounding the ISR wellfield, an 800 x 1,700ft area on the southwest flank of the Palangana Dome depression. The remainder of the UCC drilling appears to have targeted mineralization around the periphery of the depression of the dome, as well as topographic highs in the center of the depression. The resulting drilling appears somewhat scattered, often occurring in clusters of 100 to 200ft centered patterns surrounding +0.50GT holes. There are isolated +0.50 GT holes in a number of locations on the property, some with no other hole within hundreds of feet.
9.3 Chevron Drilling Program
Chevron's drill program was limited, totaling just 163 holes, but followed a much more consistent and methodical drilling strategy. Their exploration drilling focused on filling in areas of sparse UCC drilling west and northwest of the ISR wellfield. This region corresponds to much of the western margin of the salt dome depression. The resulting pattern stepping west from the ISR wellfield yielded a fairly regular delineation drill grid on nominal 100ft-centers. To the northwest, Chevron's drilling was clearly for exploration and not delineation, resulting in a nominal 200ft grid pattern.
UCC and Chevron confined the great majority of their drilling to less than 200 acres comprising their wellfield and the immediate vicinity. A focus on production issues discouraged UCC from an aggressive exploration and delineation program. Chevron's focus was on filling in gaps in the

Uranium Energy Corp. 9-2 Palangana ISR Uranium Project NI 43-101 Technical Report on Resources
SRK Consulting (U.S.), Inc. February 19, 2010 Palangana_NI 43-101 Technical Report_199600.010_KG.012
UCC drilling necessary to evaluate the deposits for their open pit scenario. Significant mineralized intercepts were encountered outside of the production wellfield vicinity, but there was limited exploration follow-up.
9.4 Uranium One Drilling Program
While Uranium One and its predecessors have drilled over 2,500 rotary holes on the entire Palangana property, their efforts have been focused on eight discoveries, PA-1, PA-2, and six trends still being defined (the exploration trends), where more than 70% of the drillholes are located. The average depth of these holes is 450ft. All of these holes have all been logged by conventional gamma, SP, resistivity methods and the majority have also been probed using a Prompt Fission Neutron (PFN) probe that more closely estimates the chemical uranium.
9.5 Core Drilling
There were 296 core holes completed by UCC on the Palangana property. Assaying for these holes was conducted either at UCC's in-house laboratories in Grand Junction or Rifle, Colorado, and at independent Core Laboratories Inc. located in Corpus Christi, Texas. Thirty-three of the core holes were examined in detail. Core recovery was generally between 80% and 100%. Where the loss occurred in the mineralized interval, which unfortunately happened regularly, it rendered that interval useless for disequilibrium comparison (see discussion below) with the downhole gamma log results.
From the available reports and records reviewed, there is no evidence that Chevron conducted core drilling on the Palangana property. Energy Metals and Uranium One drilled a total of eight core holes on the PA-1 property. However, the usage of PFN logging has largely reduced the need for coring for exploration purposes.
9.6 Procedures
Drilling procedures conducted by Energy Metals and Uranium One are acceptable for resource and reserve modeling. Field examination by Sean Muller confirmed that proper methods for sampling and logging were being conducted and the drilling and geophysical logging methods were at or above the industry standard. Core and rotary cutting recovery were well documented and of good quality for interpretation.
9.7 Results
Results compiled from the above described drilling activities were carefully compiled in a consistent and quality manner enabling easy retrieval and correlation for interpretive purposes. Table 9.7.1 below summarizes the results of drilling at the Palangana Project.
The mineralized zones at Palangana are oriented essentially horizontal along semi-linear fronts. The drillhole are all oriented vertical which intersect the mineralized zones at right angles. Therefore, the mineralized intercepts as recorded in the drillholes do represent true thickness of the mineralized zones.

Uranium Energy Corp. 9-3 Palangana ISR Uranium Project NI 43-101 Technical Report on Resources
SRK Consulting (U.S.), Inc. February 19, 2010 Palangana_NI 43-101 Technical Report_199600.010_KG.012
Table 9.7.1: Palangana Drilling Results
Trend Total #
DHs Max.
Depth Avg.
Depth # of Mineralized
Intervals Interval Thickness
Range Interval Thickness
Avg. PA-1 518 660 565 389 0.5 – 13.5 5.24 PA-2 239 600 337.5 186 0.5 – 13.5 5.79 Dome 231 600 346 239 0.5 – 12.5 4.10 CC Brine 69 520 417 49 2.0 – 18.5 5.9 Jemison East 53 560 434 17 1.0 – 11.0 4.4 Jemison Fence 109 600 412 55 1.5 – 16.5 4.3 NE Garcia 186 600 344 158 0.5 – 20.0 4.6 SW Garcia 84 600 367 45 0.5 – 11.0 4.6
9.8 Interpretation
Drill data is of high quality for data compilation, data reduction for modeling and data comparison for interpretation.

Uranium Energy Corp. 10-1 Palangana ISR Uranium Project NI 43-101 Technical Report on Resources
SRK Consulting (U.S.), Inc. February 19, 2010 Palangana_NI 43-101 Technical Report_199600.010_KG.012
10 Sampling Method and Approach The following describes the standard sampling methods used by the Energy Metals and Uranium One drilling programs. Rotary cuttings were typically collected by the driller’s helper or field geologist using a strainer, washed and piled in neat rows of 5ft intervals for each one-hundred foot length for geological logging. In addition to detailed lithological logging, careful attention was paid to the oxidation or reduction state of the sands where possible for later reinterpretation of the reduction-oxidation (redox) interface of specific roll-fronts. For future reference, field photographs were also taken and stored with the lithological log records.
Core diameter was 3.0in, and was boxed, split, and logged with particular attention to alteration, oxidation, lithology, and mineralization. A hand-held Geiger counter or scintillometer was used to define mineralized boundaries and the interval to be sent to the assay lab. One-half the core was bagged for assay and the other half stored for later reference. None of the original physical core is available today. Core from the older program does have some relevance to the PA-1 and PA-2 areas since coring in this area was limited to eight holes.
Cores were run from the top of the mineralized sand to the projected bottom of the sand. Cores were sampled 1.0ft intervals, based on mineralized zones from the gamma log and scintillometer readings. Core descriptions and a graphical representation of the core hole were also included in the core-hole files.
10.1 Gamma-Ray Logs
Gamma-ray logging of each drillhole utilized the same basic methodology that has been used for 40 years in the uranium industry. The older logs were generally run with analog equipment and more recent logging utilized digital equipment. The use of downhole logging equipment to obtain a digital record of calibrated gamma-ray, single point resistance, and self-potential continues to be the primary method for exploration and delineation of uranium mineralized zones in South Texas ISR sites. The mineralized intercepts correlated by Energy Metals for the historic resource estimates were derived from gamma-ray logs run as part of an electric log suite on each of the exploration drillholes. The equivalent U3O8 value (eU3O8) from the gamma-ray curves was calculated by converting counts per second (CPS) to grade (% eU3O8) for each one-half foot interval above a specific CoG. This method is essentially the standard method as developed by the USAEC. In addition to gamma-ray logging, an electric log suite included self-potential (SP) and single point resistance. The SP and resistance curves were used to identify lithologic boundaries and to correlate sand and mineralized zones between drillholes.
Chevron exclusively used the contract services of Century Geophysical Corp for down-hole logging. Logging technologies had advanced considerably from the 1970’s time frame of UCC drilling. As a result, Chevron logged all of their holes using two techniques: Princeton Gamma Tech (PGT) and CompuLog. The (PGT) probe measured U3O8 directly - making it equilibrium corrected. The PGT probe was a precursor to the later more sophisticated, accurate, faster, less expensive and less complex neutron activation probes of today.
Energy Metals and now Uranium One utilized a Century CompuLog system calculated uranium thickness and grade intervals automatically from the down-hole gamma log at various cut-offs and graphically recorded the gamma grades at the bottom of the log. The downhole data was also made available in digital format.

Uranium Energy Corp. 10-2 Palangana ISR Uranium Project NI 43-101 Technical Report on Resources
SRK Consulting (U.S.), Inc. February 19, 2010 Palangana_NI 43-101 Technical Report_199600.010_KG.012
10.2 PFN Logging
Uranium One and subsequently UEC utilized the PFN downhole logging on all of the Palangana deposits except the Dome trend, which was explored prior to acquisition of the PFN probes. This technology is used to identify disequilibrium by a direct assay determination of U3O8 (cU3O8) and a calibrated gamma ray log determination of U3O8 (eU3O8) in a drillhole.
PFN direct U3O8 assays and equivalent gamma log (eU3O8) readings were obtained for each half foot of logged hole. Using a project CoG of 0.02% U3O8, all chemical and PFN assay values below 0.02% were excluded. Individual DEFs were then determined for each half-foot foot interval with assay values above 0.02% U3O8 and the values weighted by interval thickness to obtain a DEF for each mineralized zone. The PFN drilling on PA-1 was done for the most part as in-fill fences rendering a reasonable representation across the deposit and respective sand zones. Nearly all of the drilling on the PA-2 deposit, as well as all of the exploration trends with the exception of the Dome trend utilized the PFN tools providing excellent representation of the deposit. The Dome trend, which was identified by Energy Metals Corp. has not had any holes logged with the PFN probe. Uranium One augmented the PFN derived DEF data by obtaining chemical uranium analyses of samples from eight core holes drilled between 2006 and February 2007.
The cores were analyzed using induced coupled plasma with mass spectrophotometer (ICP/ICP-MS) method by Energy Laboratories of Casper, Wyoming. The eU3O8, and the gamma log eU3O8 value for that interval was determined to calculate the DEF values for each one-foot sample interval. All core and PFN data from each sand zone were tabulated and weighted by data interval thickness to determine a final DEF value. The intercepts with chemical or PFN assay values below the 0.02% U3O8 cut-off were excluded from the calculations, and subsequent resource estimates. As noted in other sections of this report, the nominal project U3O8 grade cut-off is 0.02% for mineralized intercepts.
10.3 Disequilibrium
Uranium disequilibrium is the ratio of chemical or other direct assay method that measures the actual U3O8 content (cU3O8) to the equivalent U3O8 content determined by a calibrated natural gamma ray log (eU3O8). The first determination has been historically conducted in a laboratory, while the second determination is typically a field measurement, from which an indirect or equivalent measure of uranium content is made. With PFN technology, the need for extensive laboratory analysis is much reduced excepting for calibration checks.
The ratio or disequilibrium between chemical/assay values of U3O8 and equivalent gamma logging values occurs because of the ongoing radioactive decay of uranium over time. A positive disequilibrium factor (DEF) >1.0 indicates the presence of more chemical uranium than equivalent uranium in the same nominal sample of subsurface.
The Palangana deposit has been characterized as a "young" deposit that has yet to reach equilibrium (Oman, Palangana report). In such deposits, the radioactivity level is lower than would be expected and actual uranium grade higher than indicated by the gamma log. In the oxidized zone, however, the opposite might be the case; uranium has been removed, leaving radioactive daughter products behind and a higher-grade interpretation from the gamma log than actual in-place uranium content. In such instance, the reduced resource can and does exhibit a higher than normal disequilibrium factor than gamma attributable in part to the calibration of the

Uranium Energy Corp. 10-3 Palangana ISR Uranium Project NI 43-101 Technical Report on Resources
SRK Consulting (U.S.), Inc. February 19, 2010 Palangana_NI 43-101 Technical Report_199600.010_KG.012
original gamma logs but also due to chemical uranium enrichment. Knowledge of the variance in disequilibrium is critical in understanding the true resource and reserve potential for development.
10.4 Sampling Methods
The industry standard is not to collect drill cuttings for chemical analyses due to potential for mixing during the drilling process. Often cuttings are monitored by a hand held scintillation unit if select coring is to be undertaken. More commonly, rotary holes with gamma log signatures were offset for taking core samples. In such instances, core was carefully preserved from oxidation by freezing the core until analysis by the laboratory. Laboratory methods for analysis of core meet or exceed industry standards.
10.5 Factors Impacting Accuracy of Results
Based upon SRK’s review of the data, there do not appear to be any factors that limited the accuracy of the physical data collection. The only issue identified was the lack of calibration of the PFN probes that was later mitigated by relogging a core hole and adjusting the DEF readings by the probe specific calibration drift. The presumption has been made that this drift in accuracy occurred uniformly throughout the program. Without initial calibration information at the start of the PFN logging program, there is no conclusive answer in this regard. Since both probes read higher than the chemical in the core hole, the PFN values in all instances have been reduced accounting for a reduction in the DEF value ultimately used for disequilibrium adjustment.
10.6 Sample Quality
Samples were evaluated in the field very carefully on drill logs, photographed, probed correctly and collected in a manner (re; core) that is defensible for resource and reserve estimation. These samples are representative of the mineralization at each mineral deposit.
10.7 Sample Parameters
In addition to the chemistry noted for core samples, recovery was measured, color and texture was recorded, any visible and radioactive mineralization was recorded, pyrite and secondary minerals were noted when observed. These methods are acceptable by industry standards.
10.8 Relevant Samples
More core samples across the deposits would have been desirable especially at PA-2. However, the extensive usage of the PFN probe makes the prediction of actual uranium grade very robust and defensible.

Uranium Energy Corp. 11-1 Palangana ISR Uranium Project NI 43-101 Technical Report on Resources
SRK Consulting (U.S.), Inc. February 19, 2010 Palangana_NI 43-101 Technical Report_199600.010_KG.012
11 Sample Preparation, Analyses and Security Discussion on sample preparation, analyses and security in this report is limited to the samples collected by employees of Energy Metals and Uranium One. Core sample acquisition has been done using appropriate QA/QC methods to minimize contamination and oxidization. The core was wrapped and frozen immediately after acquisition then shipped directly to Energy Laboratories in Casper, Wyoming. Although Energy Laboratories does have approximately 26 certifications from various federal and state agencies they are not an ISO certified laboratory.
Energy Laboratories has an impeccable reputation for uranium assay and physio-chemical testing for ISR amenability. Being located amidst the Wyoming uranium belt of the Powder River Basin has enabled Energy Laboratories to continue with advances in technologies during the down cycle of uranium prices since production in the area continued during this period. Their QA/QC procedures have historically been overseen by uranium experts who understand the propensity for uranium disequilibrium in Texas deposits and the requisites for laboratory check samples, standards and blanks.
Generally, two assays were typically run: a percent chemical U3O8 by one of several acceptable methods and an equivalent percent U3O8 based on a “closed can” radiometric assay to determine a gamma equivalent assay to approximate the downhole gamma log. Although it was standard practice to insert QA control samples (i.e., blanks, standards, and duplicates) into the sample sequence, there are no records from the UCC sampling to verify that a QA/QC procedure was followed.
Assay sheets report “chemical” U3O8 (probably by fluorimetric method) and closed can (Core Laboratories) or radio assay (UCC labs). Most samples were also run for Mo, Se, total S, total Fe, Fe+2, Fe+3, and a few assays for V2O5 and As were also noted. In addition, Core Laboratories Inc. ran select samples for horizontal and vertical permeability and porosity from core plugs and density measurements. Core Laboratories Inc. is an industry leader in petroleum services but is not ISO certified.
Horizontal permeability values ranged from practically zero to over eight darcies in the UCC production area which should be reasonably applicable to all Goliad sand units within the Palangana Project. The lower values corresponded to mudstones and some very fine-grained zones described as “silty” and/or “limy”. Within mineralized zones, horizontal permeability varies from a few hundred millidarcies to the upper limit of over eight darcies. Sample descriptions between the two extremes are hardly different - both are most often described as very fine-grained to fine-grained, silty sandstone. Absent any analytical data and more detailed descriptions, the conclusion is that the lower permeability samples are due to more clay or calcium carbonate cement. Vertical permeability ranged from 50% to 75% of horizontal. Porosity percentages from core plugs ranged from the low 20’s to the low 30’s with an average of about 28% in the core descriptions examined.
UCC settled on a density factor of 17ft3/t for rock density. An average of 137 density values available for 15 cores studied averaged 16.8ft3/t.
Methodologies utilized by UEC are deemed acceptable to meet the CIM requirements for the industry.
Uranium Energy Corp. 11-2 Palangana ISR Uranium Project NI 43-101 Technical Report on Resources
SRK Consulting (U.S.), Inc. February 19, 2010 Palangana_NI 43-101 Technical Report_199600.010_KG.012
11.1 Interpretation
The sampling and analysis methods employed by Uranium One and previous operators meet or exceed industry standards. The usage of PFN borehole logging is particularly useful in deposits that exhibit disequilibrium such as those at Palangana.

Uranium Energy Corp. 12-1 Palangana ISR Uranium Project NI 43-101 Technical Report on Resources
SRK Consulting (U.S.), Inc. February 19, 2010 Palangana_NI 43-101 Technical Report_199600.010_KG.012
12 Data Verification A review was made of UEC’s project files at their office in Corpus Christi, Texas. Review of information included both analog and digital gamma ray logs with conversions to chemical equivalents by interval, PFN logs with gamma and chemical equivalents, edited SP and resistivity logs flagging correlated sand zones and marker clays, interpretive GT maps, historical reports, memos, field photographs cuttings and invaluable discussions with experienced field personnel.
Over 100 drill logs, numerous cross-sections and analytical data were reviewed in detail and cross checked against input files in access for computer entry by Sean Muller. Some errors in correlation were discovered particularly for PA-2, not of a technical nature but of a correlation nature. Early interpretations of the mineralized sand zone had called the “E” sand, the “C”. This miscoding was recognized during computer validation runs and corrected with the assistance of UEC’s geologists. Other potential data miscodings were found where early rotary samples were either mixed with drilling mud or field interpretation of the oxidation-reduction zone was poor. To validate and correct these data entries to the model, the PFN tool proved invaluable providing disequilibrium data supporting either oxidized or reduced samples where neither could be discerned in the field. This was coordinated and corrected in the database.
As far as could be determined, the down-hole eU3O8 data from the Palangana exploration programs are reliably represented by the continuous gamma-logs from the various drilling programs. These logs were run by in-house and independent contract logging companies. The procedure followed was standard to uranium industry practice and all required correction factors were recorded on the headings of the logs reviewed.
One concern observed by SRK was that geophysical operators were not required to calibrate PFN probes due to the unavailability of calibration pits. To validate the calibration of the two probes that were used on the deposits, SRK requested and received data from the relogging of a core hole where certifiable analytical data was available. This validation test determined that both PFN probes were reading high relative to chemical; one at 10% and the other at 26%. Since it was known which probe logged which hole, all of the chemical conversions were adjusted to account for this new calibration factor and DEF were recomputed on a hole by hole, roll-front zone by zone basis.
To further quantify the corrected DEF data, the areal distribution by roll-front zone was mapped and integrated into the DEF adjusted resource estimate. This was done by taking half the distance of the average PFN hole spacing per hole in a zone for defining an area of influence on all of the gamma holes in a resource trend. Next, modeled blocks that fell outside of this range but still fell in the block were assigned the average DEF for the block. This technique far surpasses the older methodology of taking a deposit wide average of the DEF for the conversion to chemical.
12.1 Quality Control Measures and Procedures
Quality control measure for PFN logging could be improved with periodic calibration of the probes. Adjustment of the data using the relogging of a core hole with known chemical values partially compensated for this QC omission. It has been concluded that adjustment of the DEF values to account for the PFN drift is acceptable.

Uranium Energy Corp. 12-2 Palangana ISR Uranium Project NI 43-101 Technical Report on Resources
SRK Consulting (U.S.), Inc. February 19, 2010 Palangana_NI 43-101 Technical Report_199600.010_KG.012
12.2 Limitations
Generally, the DEF of a deposit is based upon an average of the disequilibrium in core holes. This practice is a limitation in roll front deposits that are in disequilibrium such as those found in South Texas. UEC has compensated for this limitation by using the PFN probe. To increase the accuracy of the application of the post-probing calibration, SRK employed a site and mineralized zone specific application of the DEF results rather than the averaging method. This method compensates for a limitation commonly used by the industry by increasing the accuracy of the prediction of grade in a specific area.

Uranium Energy Corp. 13-1 Palangana ISR Uranium Project NI 43-101 Technical Report on Resources
SRK Consulting (U.S.), Inc. February 19, 2010 Palangana_NI 43-101 Technical Report_199600.010_KG.012
13 Adjacent Properties The closest comparable mining operation and known deposit to areas PA-1 and PA-2 is the prior ISR production block on the west side of the Palangana dome that was operated by UCC about 30 years ago. It is not part of this evaluation and is currently not under consideration for further development due to the prior environmental issues associated with the old method of using ammonia lixiviate. However, there are similarities in that all of the deposits are in the Goliad sand system and are leachable. The grades and size of the UCC deposit are comparable although the sand zone is higher in the section, mapped as the “C” sand. Further, the UCC deposit is in a more structurally complicated area on the dome as is the Dome trend delineated by Energy Metals Corp and Uranium One, while the PA-1, PA-2, CC Brine, Jemison East, Jemison Fence, NE Garcia and SW Garcia areas are on the fringe of the structure.
UCC reacquired the Palangana property in 1967 after recognizing that uranium mineralization occurred in ISR amenable roll-front-type deposits. ISR technology was in the research and development phase at the time and had not been successfully demonstrated as a commercially viable mining method. UCC conducted a small pilot ISR operation from 1969 to 1970 using push-pull ISR methods (consisting of injecting and producing from the same well). This pilot operation yielded 12,000lbs of uranium yellow cake (UCC internal document). The plant was dismantled and the project abandoned in 1970.
Other more recent uranium mining from the Goliad Formation has occurred in Kleberg County, southeast of Kingsville for several years at the Kingsville Dome ISR mine and at the Rosita ISR mine in Duval County west of Alice, Texas.
In October 1990, Uranium Resources Inc (URI) started production from its Rosita property in South Texas and produced a total of approximately 1.1Mlbs of uranium from that property prior to March 1992 when it was shut-in because of low uranium prices. Production was re-established in June 1995 and an additional 1.5Mlbs of uranium were produced through 1999. In early 1999, URI placed production at Rosita on stand-by but continued to maintain nominal production through July 1999. Total production for 1999 was 48,000lbs.

Uranium Energy Corp. 14-1 Palangana ISR Uranium Project NI 43-101 Technical Report on Resources
SRK Consulting (U.S.), Inc. February 19, 2010 Palangana_NI 43-101 Technical Report_199600.010_KG.012
14 Mineral Processing and Metallurgical Testing The Palangana uranium host rock consists of both sand and clay with about 20% calcium carbonate. The uranium content can vary from essentially zero to over 1% U3O8 within a few feet. Although grades and analyses are generally given in terms of U3O8, which species itself has not been identified. The uranium phase present in the mineralization is thought to be UO2, although because of its extreme fineness, no mineral has been positively identified. The Palangana uranium is considered to be a secondary deposit, in which the uranium was originally transported from another deposit, probably in the soluble hexavalent form, and then was reprecipitated as UO2 by H2S or other reducing agents.
Iron and sulfur contents are in about equal proportions at around 1%. The FeS2 minerals marcasite and pyrite have been identified, with marcasite predominating. Most of the sulfur is in the form of FeS2, although small amounts are apparently present as sulfate. The amount of iron exceeds that necessary to combine with sulfur and likely is a form of ferrous carbonate. Detailed mineralogical studies have not been found in the references and may not exist.
Other metal constituents are molybdenum, vanadium, copper, and rhenium. It is likely that these metals, except possibly vanadium, are present as sulfides. Of these four, molybdenum is the most abundant, being on the average about 10% of the uranium content of the mineralization, but varying widely in range, Vanadium is not always detectable by chemical methods, since its concentration is <0.01%. Copper generally ranges from 0.003 to 0.005%. The precious metal rhenium is present as a trace constituent, and can be found in concentrations ranging from 0.01-0.2% rhenium for every 100% MoS2.
In 1970, UCC conducted their own pilot plant leach study using ammonia and hydrogen peroxide as respective oxidants. These tests concluded that the Palangana ores were very easy to leach with carbonate solutions at ambient temperature. The ease of leaching is thought to result from the extreme fineness of the uranium species. Some permeability reduction occurred as a result of montmorillonite swelling.
Energy Metals submitted selected core samples to Energy Laboratories, Inc. in Casper, Wyoming in April 2008. These core samples from the Palangana Project were sent to the laboratory for leach amenability studies intended to demonstrate that uranium mineralization at the property was capable of being leached using conventional in situ leach chemistry. The tests do not approximate other in-situ variables (permeability, porosity, and pressure) but provide an indication of a sample’s reaction rate and the potential chemical recovery.

Uranium Energy Corp. 15-1 Palangana ISR Uranium Project NI 43-101 Technical Report on Resources
SRK Consulting (U.S.), Inc. February 19, 2010 Palangana_NI 43-101 Technical Report_199600.010_KG.012
15 Mineral Resource and Mineral Reserve Estimates
15.1 Mineral Resource Estimation of PA-1 and PA-2
15.1.1 Qualified Person of the Mineral Resource Estimate
Mr. Sean Muller oversaw the construction of the geologic and resource model of the PA-1 and PA-2 areas discussed below. He was assisted by Patrick Hollenbeck. Dr. Bart Stryhas has reviewed the work of Mr. Muller and Mr. Hollenbeck on the PA-1 and PA-2 areas. He is responsible for the resource estimation methodology and the resource statement for the PA-1 and PA-2 areas. Dr. Stryhas is independent of the issuer applying all of the tests in Section 1.4 of NI 43-101.
15.1.2 Drillhole Database
The drillhole database provided by UEC and its predecessors is an Access-based Open Database Connectivity (ODBC) linked database consisting of three tables; Hole Collar Information, Gamma grade data, and PFN grade data. For the purposes of the SRK evaluation, the data was exported to three CSV tables, which were then imported into six VULCAN© software database sheets; drillhole collar information, downhole survey, gamma interceptions with lithology, gamma conversion to assay, PFN reading with associated lithologic intervals, and PFN assay conversion. The PA-1 database consists of 518 total drillholes at a maximum depth of 660ft, and an average depth of 565ft. PA-2 drillhole database consists of 239 total drillholes at a maximum depth of 600ft and an average depth of 337.5ft.
A total of 389 mineralized intervals were derived from the drillholes for PA-1, and 186 mineralized intervals were derived from the drillholes for PA-2. The sample intervals for PA-1 range in thickness from 0.5 to 13ft, with an average thickness of 5.24ft. The sample intervals for PA-2 range in thickness from 0.5 to 13ft, with an average thickness of 5.79ft.
15.1.3 Geologic Model
The Palangana project consists of multiple, fluvial sand beds, each given an alphanumeric designation A-H based on depth. While above background gamma spikes exist in almost every sand unit, the mineralized sands with potentially mineable grades are the “C”, “E” and “G” sands. The “C” sand is mineralized in the Dome trend, the NE Garcia trend and the SW Garcia trend. The “E” sand is mineralized in PA-2, the CC Brine trend, the Jemison East trend and the Jemison Fence trend. The “G” sand is mineralized in PA-2.
The geological input database included interpretation of the oxidation or reduction characteristics of the sample interval by the field geologist and a later interpretation of the geometry of the gamma mineralization from an analogue copy of the geophysical log. For example, where the wings or the limbs of the roll-front could be discerned on the oxidized side of the reduction/oxidation interface, it was noted on the data input as separate populations of data. This was later overlain with DEF data calculated from a ratio of probe-calibrated PFN grade compared to calculated gamma grade. Where positive DEF’s occurred outside of the reduced population of data, the oxidation and roll-front characteristics were re-evaluated and the resource zone input was adjusted accordingly.

Uranium Energy Corp. 15-2 Palangana ISR Uranium Project NI 43-101 Technical Report on Resources
SRK Consulting (U.S.), Inc. February 19, 2010 Palangana_NI 43-101 Technical Report_199600.010_KG.012
The mineralized sand zones for each production area were modeled as stratigraphic mineralized bodies. The principle behind the model is to generate stratigraphic boundaries that represent the top and bottom of the mineralized band, and then use those to generate a gridded block model for the grade estimation. Areas where the sand zone was not measured (between drillholes, where the sand had pinched out at a drillhole, etc.) were given an interpolated thickness based on surrounding data. The interpolated areas were ultimately cropped out during the final grade estimation process where appropriate. Because this was purely a lithologic model, no grade or grade-thickness cut-offs were used during this step in the modeling process.
The grid size used for this process was 10ft x 10ft node spacing. This is 1/5 of the average drillhole spacing of 50ft, and is standard industry practice for establishing model blocks. Each mineralized sand zone was broken into subzones reflective of separate roll-fronts by the resource geologist. The VULCAN model was developed for each of these subzones. For PA-1, the G sand was broken into five subzones; G0, G1, G2, G3, and G4. For PA-2, the E sand was broken into four subzones; E0, E1, E2, and E3. The E0 subzone had limited useable data, and was not included in the final resource estimation.
15.1.4 Resource Block Model
The Palangana block model was then estimated for eU3O8 content. The block model was derived from the stratigraphic grid models using an automated process in VULCAN. This procedure sets the x, y block dimensions at 10ft x 10ft allows each block height to match the thickness of the stratigraphic model. Thus, each subzone is one block thick. The model extents were defined by the limits of the overall resource as listed in Tables 15.1.4.1 and 15.1.4.2.
Table 15.1.4.1: PA-1 Model Extent in Texas, State Plane Coordinates
Direction Minimum (ft) Maximum (ft) Easting 1,017,295 1,020,105 Northing 17,128,095 17,131,505
Table 15.1.4.2: PA-2 Model Extent in Texas, State Plane Coordinates
Direction Minimum (ft) Maximum (ft) Easting 1,019,795 1,021,805 Northing 17,136,095 17,138,105
These areal extents were determined by the size of the stratigraphic grids that were determined by the lateral extent of the data. It was necessarily required that the grids be larger than the footprint of the drillhole data to be used in the outlined resource area. The block model was automatically made to the same lateral extents as the structure grids.
15.1.5 Specific Gravity
A tonnage factor of 17ft3/t was used since it was extensively evaluated by UCC in the 1970’s. For the density, the inverse of the tonnage factor was used, which is 0.059t/ft3.
15.1.6 Drillhole Compositing
The drillholes were composited by weight averaging all grade data within the individual horizons into a single grade interval. For the few drillholes that identified more than one intercept in a

Uranium Energy Corp. 15-3 Palangana ISR Uranium Project NI 43-101 Technical Report on Resources
SRK Consulting (U.S.), Inc. February 19, 2010 Palangana_NI 43-101 Technical Report_199600.010_KG.012
given subzone (a “wing” intercept, for example) both of the intercepts, along with any intermediate waste material, were composited together as a weighted average based on length, with the grade being diluted by the intermediate waste. The statistics for the composites used in the grade estimation are listed below in Tables 15.1.6.1 and 15.1.6.2.
Table 15.1.6.1: PA-1 Statistical Composites
Zone G0 G1 G2 G3 G4 Number of samples 12 80 170 73 50 Minimum 0.02 0.01 0 0.02 0.02 Maximum 0.1 0.34 0.4 0.42 0.24 Range 0.08 0.33 0.4 0.4 0.22 Average (% eU3O8) 0.051 0.066 0.091 0.082 0.062
Table 15.1.6.2: PA-2 Statistical Composites
Zone E1 E2 E3 Number of samples 52 71 36 Minimum 0.01 0.01 0.01 Maximum 0.1 0.19 0.15 Range 0.09 0.18 0.14 Average (% eU3O8) 0.041 0.044 0.046
15.1.7 Variogram Analysis
An evaluation using Ordinary Kriging (Figure 15-1) was performed on zone G2 to determine if it would be applicable for this depositional setting. The experimental variogram parameters for G2 were determined as listed in Table 15.1.7.1.
Table 15.1.7.1: Variography Search Radii Computed for the G2 Roll-front
Model Type Sill Differential Major Semi-major Minor SPHERICAL 0.003 208.5 81.9 25
15.1.8 Grade Interpolation
For each subzone, it was necessary to identify logical “mineralized boundaries” which delineated a REDOX boundary, and delimited those blocks to be estimated within a known and reasonable constraint. To create these boundaries, the following procedure was used for all subzones:
Identify and delineate only those drillholes that contained a certain mineralized subzone;
Within the drillholes, identify those that were oxidized. This was done by plotting the REDOX variable and locating the “Ox” notation; and
Mineralization boundaries were drawn 25ft (half the average drillhole spacing), from all non-oxidized holes within each subzone. These polygons were drawn encompassing closely-spaced “clumps” of non-“Ox” holes, leaving those flagged as “Ox” out of the mineralized boundaries and drawing the polygons directly between adjacent non-”OX” and “Ox” holes as illustrated in Figure 15-2.

Uranium Energy Corp. 15-4 Palangana ISR Uranium Project NI 43-101 Technical Report on Resources
SRK Consulting (U.S.), Inc. February 19, 2010 Palangana_NI 43-101 Technical Report_199600.010_KG.012
Once the preliminary boundaries were defined, they were checked by the holes with PFN data. Approximately 50% of the drillholes had been logged for PFN. For these holes, a Disequilibrium Factor (DEF) was calculated by dividing the PFN values by the original gamma values. A DEF value less than one indicate that the hole is oxidized and a DEF greater than one indicated that the hole is non-oxidized. The DEF values were displayed on-screen in conjunction with the mineralization boundaries, and determinations were made based on the DEF values as to whether a boundary would remain as-is or would have to be modified to add or remove certain drillholes. In most cases, if the DEF was less than 1.0, the mineralization boundary would be modified to remove that drillhole from the mineralization zone, and if the DEF was greater than one the drillhole would stay in the outline, and outlying drillholes with a DEF greater than 1.0 would likely be incorporated into the mineralization boundary. Factors that would contradict this determination would be high or low gamma GT’s: if a hole to be removed had a significantly high gamma GT, it would be left in the mineralization boundary; likewise if a hole to be incorporated had a significantly low gamma GT (less than .5), it would be removed. Once the mineralization boundaries were defined, the block model could be estimated. Each estimation had to occur within a discreet subzone and within that subzone’s associated mineralization boundary, creating a virtual “solid 3D boundary” inside which the blocks could be estimated. Those blocks outside the boundary were ignored.
15.1.9 Grade Estimation
An inverse distance squared (ID2) grade estimation was used. The search radii in all cases were spherical in the X and Y directions, and a moderate ellipse in the Z direction. The search radii were 150 x 150 x 20ft in all cases, using a minimum of one and maximum of ten samples for grade estimation.
15.1.10 DEF Application
Since approximately fifty percent of the drillholes were logged with both a PFN and a gamma detection tool, discrepancies between both grade and mineralization thickness were apparent in the database. The Disequilibrium Factor was calculated in order to quantify the discrepancy, and to ultimately generate a “corrected” gamma grade for the block model based upon the DEF value per block.
Drillholes were examined to identify those that had PFN data for each zone. An average drillhole spacing was calculated for the PFN holes by zone, in order to determine an appropriate search radius for the DEF block distribution. The average PFN drillhole spacing is presented in Table 151.10.1.
Table 15.1.10.1: Average Spacing Between PFN-Logged Drillholes by Resource Zone
Zone Average PFN Drillhole Spacing (ft) G0 175 G1 150 G2 150 G3 260 G4 340 E1 98 E2 85 E3 88

Uranium Energy Corp. 15-5 Palangana ISR Uranium Project NI 43-101 Technical Report on Resources
SRK Consulting (U.S.), Inc. February 19, 2010 Palangana_NI 43-101 Technical Report_199600.010_KG.012
Once the average drillhole spacing was calculated, an Inverse Distance to the 1st power (ID1) estimation was done with the DEF data to populate the blocks near the drillholes with PFN data. The ID1 estimation technique was used in order to not lose DEF value at distance; by using other estimation techniques, the DEF would decrease as the distance from the data point increased. The search radii used were simply the average PFN drillhole spacing for a given zone.
There were a number of areas that did not have PFN data available, and as such did not have DEF information to be used. A default value was used in their place, based upon the average DEF of the blocks that were estimated using the ID1 DEF estimation. To determine the averages, the following method was used:
Run the ID1 estimation to populate whichever blocks were appropriate with DEF data – those that weren’t populated were given a default DEF of 0 which is not the actual DEF;
Use statistics to find the average DEF of the blocks that were populated using the ID1 estimation; and
Apply an average DEF to the blocks where blocks were out of the search radius of actual DEF values.
The Default DEFs for the respective resource areas are listed in Tables 15.1.10.2 and 15.1.10.3.
Table 15.1.10.2: Estimated Average Default Values for PA-1 Blocks Outside of the Search Radius
Zone G0 G1 G2 G3 G4 Number of Blocks 99 1,018 2,856 1,456 441 Minimum 1.664 0.113 0.438 0.385 1.045 Maximum 2.209 5.283 3.586 4.151 2.26 Range 0.545 5.17 3.148 3.766 1.215 Average 1.861 1.453 1.812 1.952 1.654
Table 15.1.10.3: Estimated Average Default Values for PA-2 Blocks Outside of the Search Radius
Zone E1 E2 E3 Number of Blocks 1,429 1,661 644 Minimum 0.416 0.767 0.805 Maximum 6.108 9.624 5.551 Range 5.692 8.857 4.746 Average 2.283 2.424 1.862
15.1.11 Resource Classification and Estimation
The resources were classified using a block by block technique. The classification scheme considered the number of samples used to estimate each block and the average distance of all these samples from each block. The classification scheme is presented below in Table 15.1.11.1.
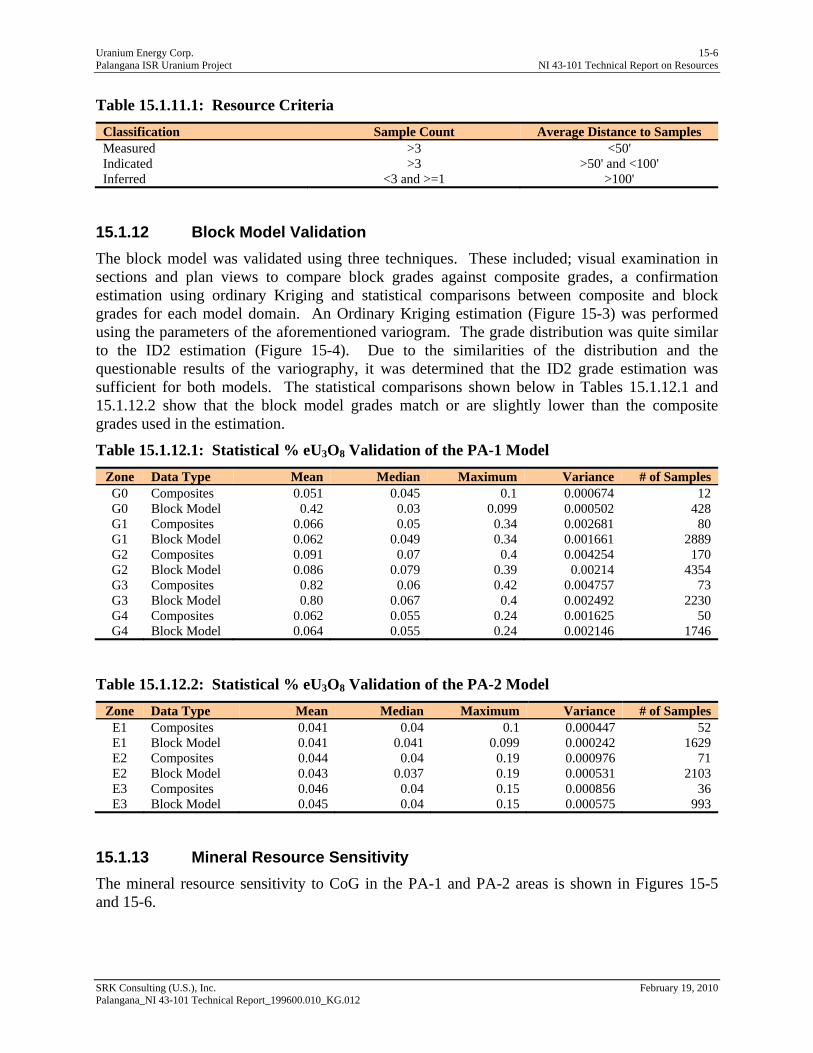
Uranium Energy Corp. 15-6 Palangana ISR Uranium Project NI 43-101 Technical Report on Resources
SRK Consulting (U.S.), Inc. February 19, 2010 Palangana_NI 43-101 Technical Report_199600.010_KG.012
Table 15.1.11.1: Resource Criteria
Classification Sample Count Average Distance to Samples Measured >3 <50' Indicated >3 >50' and <100' Inferred <3 and >=1 >100'
15.1.12 Block Model Validation
The block model was validated using three techniques. These included; visual examination in sections and plan views to compare block grades against composite grades, a confirmation estimation using ordinary Kriging and statistical comparisons between composite and block grades for each model domain. An Ordinary Kriging estimation (Figure 15-3) was performed using the parameters of the aforementioned variogram. The grade distribution was quite similar to the ID2 estimation (Figure 15-4). Due to the similarities of the distribution and the questionable results of the variography, it was determined that the ID2 grade estimation was sufficient for both models. The statistical comparisons shown below in Tables 15.1.12.1 and 15.1.12.2 show that the block model grades match or are slightly lower than the composite grades used in the estimation.
Table 15.1.12.1: Statistical % eU3O8 Validation of the PA-1 Model
Zone Data Type Mean Median Maximum Variance # of Samples G0 Composites 0.051 0.045 0.1 0.000674 12 G0 Block Model 0.42 0.03 0.099 0.000502 428 G1 Composites 0.066 0.05 0.34 0.002681 80 G1 Block Model 0.062 0.049 0.34 0.001661 2889 G2 Composites 0.091 0.07 0.4 0.004254 170 G2 Block Model 0.086 0.079 0.39 0.00214 4354 G3 Composites 0.82 0.06 0.42 0.004757 73 G3 Block Model 0.80 0.067 0.4 0.002492 2230 G4 Composites 0.062 0.055 0.24 0.001625 50 G4 Block Model 0.064 0.055 0.24 0.002146 1746
Table 15.1.12.2: Statistical % eU3O8 Validation of the PA-2 Model
Zone Data Type Mean Median Maximum Variance # of Samples E1 Composites 0.041 0.04 0.1 0.000447 52 E1 Block Model 0.041 0.041 0.099 0.000242 1629 E2 Composites 0.044 0.04 0.19 0.000976 71 E2 Block Model 0.043 0.037 0.19 0.000531 2103 E3 Composites 0.046 0.04 0.15 0.000856 36 E3 Block Model 0.045 0.04 0.15 0.000575 993
15.1.13 Mineral Resource Sensitivity
The mineral resource sensitivity to CoG in the PA-1 and PA-2 areas is shown in Figures 15-5 and 15-6.

Uranium Energy Corp. 15-7 Palangana ISR Uranium Project NI 43-101 Technical Report on Resources
SRK Consulting (U.S.), Inc. February 19, 2010 Palangana_NI 43-101 Technical Report_199600.010_KG.012
15.1.14 Resource Statement
Table 15.1.14.1 illustrates the current resources classified in accordance with CIM standards for each uranium deposit. For the resource reported in Table 15.1.14.1 SRK used a zero percent cut-off grade.
Table 15.1.14.1: Palangana, Combined PA-1 and PA-2 Resource Statement* (as at January 15, 2010)
Classification Tons % eU3O8 eU3O8 lbs Measured-w/o DEF adjustment 6,594 0.093 12,263 Indicated-w/o DEF adjustment 386,438 0.077 593,642 Meas. & Indic w/o DEF adjustment 393,032 0.077 605,905 Inferred-w/o DEF adjustment 96,251 0.057 110,562 Classification Tons % eU3O8 eU3O8 lbs Measured- with DEF adjustment 6,594 0.158 20,837 Indicated- with DEF adjustment 386,438 0.134 1,035,654 Meas. & Indic with DEF adjustment 393,032 0.135 1,056,491 Inferred- with DEF adjustment 96,251 0.10 192,502
*at a zero % CoG
15.2 Mineral Resource and Mineral Reserve Estimates, Palangana Exploration Trends
15.2.1 Qualified Person of the Mineral Resource Estimate
Mr. Frank Daviess constructed the geologic resource models for the Palangana exploration trend areas discussed below. He is responsible for the resource estimation methodology and the resource statement. Mr. Daviess is independent of the issuer applying all of the tests in Section 1.4 of NI 43-101. From initiation SRK’s understanding was that the primary purpose for the construction of the exploration trend resource block models was to calculate general global inferred resources for each of the zones within the trend areas to evaluate and rank their potential. Detailed evaluations, on a local scale, were not attempted at this time; the intent was to evaluate volumes and grades at levels sufficient to recommend further exploration activity. The resources reported are at the inferred level only and no attempt to address issues such as probably recovery have been made. In particular the grades reported are those entirely estimated directly from relatively limited available unadjusted composites.
15.2.2 Drillhole Database/Composites
The composited drillhole database was provided by UEC to SRK as CSV tables, which were then imported into a Datamine Studio3® database. The mineralized sand zones for each of the six trend area were identified and their characteristics summarized in Table 15.2.2.1.

Uranium Energy Corp. 15-8 Palangana ISR Uranium Project NI 43-101 Technical Report on Resources
SRK Consulting (U.S.), Inc. February 19, 2010 Palangana_NI 43-101 Technical Report_199600.010_KG.012
Table 15.2.2.1: Exploration Trends Composites Summary Statistics
Trend Zone
Number of Intercepts Thickness % eU3O8 GT Depth
Dome C4 10 8.7 0.13 1.05 268.9 C5 3 9.2 0.11 0.96 280.5 C6 11 7.9 0.18 1.41 292.2
NE Garcia C0 9 9.7 0.13 1.24 268.2 C1 16 7.6 0.20 1.46 274.9 C2 12 8.2 0.16 1.24 282.5
SW Garcia C0 7 7.9 0.17 1.32 264.9 C1 2 7.3 0.11 0.75 267.0 C2 5 7.3 0.20 1.44 264.3
CC Brine E1 5 6.8 0.23 1.56 353.3 E2 8 6.0 0.22 1.29 357.4 E3 6 9.0 0.26 2.27 374.7
Jemison Fence E2 7 5.4 0.25 1.30 340.6 E3 8 8.9 0.30 2.67 349.0
Jemison East E1 1 4.0 0.24 0.95 379.0 E2 4 7.6 0.23 1.75 375.0 E3 1 9.0 0.13 1.13 378.0
15.2.3 Geological Model
Electric logs containing gamma and/or PFN curves are evaluated by UEC and correlated to identify mineralized zones and check for the continuity of zones. Once each mineralized zone is known to be continuous, it can be classified as a roll front. The gamma and PFN curves on each log are given qualitative classifications, such as seep, wing or roll, and quantitative classifications, such as barren, weakly, strongly, or highly mineralized. The quantitative classification is based on Grade Thickness values taken from half-foot intervals of grade that are above 0.02%. The barren class is below all cutoff values, weak is 0.1 to 0.3GT, strong is 0.3 to 0.5GT and high is any GT value above 0.5GT. Each zone, or roll, is classified separately.
Once the intercept data for a series of holes is calculated, contours can be created based on the GT values of that zone (Figure 15-7). Only drillhole locations that meet the 0.5GT cutoff value are included inside the contour lines. UEC uses a contour interval of 0.5GT starting at 0.5 and ending at the highest GT interval in the vicinity, rounded up. The vicinity is based on the discretion of the geologist, which is generally between 50ft and 200ft from a given intercept’s location along the strike of the trend. This means the high GT contour can continually change due to changes in the GTs of the area being mapped. The 0.5GT contour is always on the reduced side of the roll front, while the highest GT contours theoretically occur along the oxidation-reduction interface. UEC geologists choose not to close the contours of these maps due to the recognition that although grade values must return to zero on the oxidized side of the roll, they do so at such a quick rate that the changes in the geologic model and resource estimations would be negligible.
Once the GT contouring is complete, an outline is created that bounds all contours for a given zone in a given trend (ex: CC Brine trend Zone E2). This outline can be used to calculate area, volume (with a given thickness) and can serve as a boundary constraint for models and resource

Uranium Energy Corp. 15-9 Palangana ISR Uranium Project NI 43-101 Technical Report on Resources
SRK Consulting (U.S.), Inc. February 19, 2010 Palangana_NI 43-101 Technical Report_199600.010_KG.012
estimations. SRK subsequently used these boundaries to constrain the formation of digital terrain models of the surfaces for each zone modeled for each of the six exploration trend areas.
15.2.4 Resource Block Models
Six resource block models were constructed; one for each of the significant exploration trend areas identified by UEC as displayed on the exploration trend overview index map Figure 15-8. These are referenced as:
Jemison Fence – With two zones in the E sand (Figure 15-9);
CC Brine – With three zones in the E sand (Figure 15-10);
NE Garcia – With three zones in the C sand (Figure 15-11);
Jemison East – With three zones in the E sand (Figure 15-12);
Dome – With three zones in the C sand (Figure 15-13); and
SW Garcia – With three zones in the C sand (Figure 15-14).
15.2.5 Density
A tonnage factor of 17ft3/t was used since it was extensively evaluated by UCC in the 1970’s. For the density, the inverse of the tonnage factor was used, which is 0.059t/ft.
15.2.6 Block Model Extents
A block model matrix of 25’ by 25’ in plan with a variable block height was chosen for each model. While the plan block size may or may not be appropriate in some areas for the available drilling density, since local grade variation is not of consideration, this is not an issue. Exploration trend model limits are presented in Table 15.2.6.1.
Table 15.2.6.1: Exploration Trends Model Extents, Texas, State Plane Coordinates
Exploration trend Direction Minimum(ft) Maximum(ft)
Jemison Fence Easting 1,021,800 1,022,700 Northing 17,137,500 17,139,000
CC Brine Easting 1,017,800 1,020,000 Northing 17,139,700 17,141,200
NE Garcia Easting 1,023,600 1,027,700 Northing 17,128,700 17,133,000
Jemison East Easting 1,023,000 1,025,000 Northing 17,137,400 17,138,150
Dome Easting 1,009,600 1,012,600 Northing 17,135,700 17,138,500
SW Garcia Easting 1,022,100 1,024,100 Northing 17,127,000 17,129,000
15.2.7 Thickness Digital Terrain Models
Using the top and bottom elevations for each of the zone composite intercepts, digital terrain models for the top and bottoms of the surfaces were created and loaded into the block models to create a thickness representation for each zone of each trend. The horizontal extent of the zones was limited by the respective zone outline created by UEC as described in Section 15.2.3. Given

Uranium Energy Corp. 15-10 Palangana ISR Uranium Project NI 43-101 Technical Report on Resources
SRK Consulting (U.S.), Inc. February 19, 2010 Palangana_NI 43-101 Technical Report_199600.010_KG.012
the paucity of available data points for the creation of surfaces, controlling elevations were created external to the outlines by a method whereby triangulation control “points” were fitted to the known plane of existing true data. The results of this process are displayed on the three dimensional projections of figure 15-15 through figure 15-20 for trends Jemison Fence through SW Garcia respectively. Given the importance of thickness and given the limitation of data in many of the narrow portions of the zones (one intercept), additional data will be required to fully characterize this variable.
15.2.8 Dynamic Anisotropy and Search Orientation
Variograms, indicator variograms and correllograms had been previously constructed with limited success at Palangana. Given the variation of lower and higher grade values and the lack of closely spaced values very erratic results were obtained with very high nugget values relative to sills. In particular, no preferential orientations (anisotropies) of the continuity of mineralization could be observed. SRK is of the opinion from general geologic inspection that broad orientation trends exist. The GT contouring carried out by UEC clearly identifies mineralized trends; data is too sparse for geostatistical confirmation.
The dynamic anisotropy option in Datamine Studio3® allows the anisotropy rotation angles for defining the search volume to be defined individually for each cell in the model. The search volume is oriented precisely and follows the trend of the mineralization. The rotation angles are assigned to each cell in the model; it is assumed that the dimensions of the ellipsoid, the lengths of the three axes, remain constant. Since the three axes of the search volume are orthogonal and only two rotations are used (dip and dip direction) the orientation of all axes are explicitly defined. The point values can be taken from the orientation of the triangular facets that comprise the surface of a wireframe. In this case the rotations are in plan only (one dimensional) and a point file, where each point has a value for direction, is created from the mineralization contour strings defined by UEC as described above. These points are displayed on Figure 15-15 through 15-20; each “arrow” is a locally interpreted “direction”. These points are interpolated into each zone of the block model (using zonal control) and control the subsequent ellipsoidal search orientation for grade estimation for that block.
15.2.9 Grade Estimation and Resource Classification Criteria
Block grades of eU3O8 were estimated using the dynamic search orientation as described above, with a two to one anisotropy (search along primary orientation was twice that across), hard boundary zonal control and an inverse power of two. The primary search was set initially to 150’ (secondary and tertiary to 50’) with the requirement of a minimum of two composites and subsequently doubled for an interpolation of non-interpolated blocks.
To obtain estimates in sparsely sampled zones the above rules were modified to allow blocks to be estimated with a minimum of one composite over a 100’ primary range.
A grade times thickness variable (GT) was calculated from the estimated eU3O8 variable and the thickness (T) variable derived from the digital terrain models. This is displayed against the composites provided by UEC on figure 15-21 through figure 15-26 for Trends Jemison Fence through SW Garcia respectively and in general there is very good agreement. SRK further constrained the estimated resource for the trends to areas that were considered to demonstrate reasonable geologic continuity and in particular to areas that were more or less interior to the drilling pattern. Projections beyond the extent of drilling were minimized; however certain

Uranium Energy Corp. 15-11 Palangana ISR Uranium Project NI 43-101 Technical Report on Resources
SRK Consulting (U.S.), Inc. February 19, 2010 Palangana_NI 43-101 Technical Report_199600.010_KG.012
projections between intercepts in zones with a reasonable appearance of good geologic continuity were in some cases allowed. This interpretation is partly subjective; being based on the available sample intercepts but also on an appraisal of continuity. In all cases these resources are classified as inferred.
15.2.10 Block Model Validation & Mineral Resource Sensitivity
The block model was validated visually through a comparison of estimated block grades and calculated GT values and those of the original composite file. The comparison is favorable as is a comparison against basic average statistics.
As noted below only limited intercepts are available for any comparative analysis on a zone by zone basis.
Table 15.2.10.1 summarizes the number of drillhole intercepts available versus the number of pounds estimated for each trend and each zone. For example Jemison Fence zone E3 is estimated to have an inferred resource of some 220,000 pounds however this estimate is based on eight drillhole intercepts. While the geologic interpretation for this trend and this zone look reasonable and the grades and thickness modeled reflect closely those of the drillhole intercepts, obviously considerable additional sampling will be required for an upgrade of classification to indicated. The grades estimated accurately reflect those of the drillhole composites used but, as stated above, no attempt to address “recoverable grade” has been made. There can also be no assumption made regarding the results of any subsequent in-fill drilling as to the conversion of inferred pounds to indicated.
The grades of the modeled zones of Jemison Fence and CC Brine in particular (and of many of the other exploration trends) are extremely sensitive to the location of one or two higher grade intercepts and their respective controlling outlines given the paucity of data. The average grade of a modeled zone is often higher than the average grade of the composites for that zone. The average GT of a modeled zone while much closer to that of the average GT of the composites can be marginally higher as well. This apparent bias will be eliminated with a more regular grid of in-fill drilling as exploration continues.

Uranium Energy Corp. 15-12 Palangana ISR Uranium Project NI 43-101 Technical Report on Resources
SRK Consulting (U.S.), Inc. February 19, 2010 Palangana_NI 43-101 Technical Report_199600.010_KG.012
Table 15.2.10.1: Drillhole Intercepts & Resource by Zone
Exploration Trend Zone Intercepts eU3O8 lbs (1000)
Jemison Fence E2 7 47 E3 8 220
Total 15 268
CC Brine
E1 5 49 E2 8 44 E3 6 126
Total 19 219
NE Garcia
C1 9 123 C2 16 50 C0 12 32
Total 37 205
Jemison East
E1 1 3 E2 4 93 E3 1 10
Total 6 105
Dome
C4 10 54 C5 3 9 C6 11 47
Total 24 111
SW Garcia
C1 7 2 C2 2 11 C0 5 40
Total 14 53 All Trends 115 959

Uranium Energy Corp. 15-13 Palangana ISR Uranium Project NI 43-101 Technical Report on Resources
SRK Consulting (U.S.), Inc. February 19, 2010 Palangana_NI 43-101 Technical Report_199600.010_KG.012
15.2.11 Resource Statement, Exploration Trend Inferred Resources
The resources estimated for each zone of each trend are presented in Table 15.2.11.1. The GT variable is computed from the thickness derived from the digital terrain model for each block in the model matrix and the interpolated block value of % eU3O8.
Table 15.2.11.1: Resource Statements, Exploration Trends Inferred Resources (as at January 15, 2010)
Exploration Trend Zone GT Tons (1000) %eU3O8 Grade eU3O8 lbs (1000)
Jemison Fence E2 1.9 9 0.268 47 E3 3.5 36 0.303 220
Total 3.2 45 0.296 268
CC Brine
E1 1.5 9 0.282 49 E2 1.4 9 0.239 44 E3 2.6 20 0.312 126
Total 2.1 38 0.287 219
NE Garcia
C1 2.0 28 0.222 123 C2 1.2 19 0.133 50 C0 1.5 11 0.153 32
Total 1.7 57 0.180 205
Jemison East
E1 0.7 1 0.176 3 E2 2.3 17 0.267 93 E3 1.1 4 0.129 10
Total 2.2 22 0.241 105
Dome
C4 1.0 31 0.088 54 C5 0.8 5 0.101 9 C6 0.9 21 0.110 47
Total 0.9 57 0.097 111
SW Garcia
C1 0.5 1 0.081 2 C2 0.9 3 0.210 11 C0 1.9 9 0.212 40
Total 1.6 13 0.200 53 All Trends 2.2 232 0.207 959

SRK Job No.: 199600.010
File Name: Figure 15-1.doc Date: 01/29/10 Approved: FD Figure: 15-1
Palangana ISR Uranium Project, Duval County, Texas
Variogram for Zone G2

SRK Job No.: 199600.010
File Name: Figure 15-2.doc Date: 01/29/10 Approved: FD Figure: 15-2
Palangana ISR Uranium Project, Duval County, Texas
Applying a 25ft Spacing from Oxidized (Ox) Holes

SRK Job No.: 199600.010
File Name: Figure 15-3.doc Date: 01/29/10 Approved: FD Figure: 15-3
Palangana ISR Uranium Project, Duval County, Texas
Ordinary Krige Grade Distribution – G2 Zone

SRK Job No.: 199600.010
File Name: Figure 15-4.doc Date: 01/29/10 Approved: FD Figure: 15-4
Palangana ISR Uranium Project, Duval County, Texas
ID2 Grade Distribution G2 Zone

SRK Job No.: 199600.010
File Name: Figure 15-5.doc Date: 01/29/10 Approved: FD Figure: 15-5
Palangana ISR Uranium Project, Duval County, Texas
PA-1 Measured and Indicated Resource Grade Tonnage Chart

SRK Job No.: 199600.010
File Name: Figure 15-6.doc Date: 01/29/10 Approved: FD Figure: 15-6
Palangana ISR Uranium Project, Duval County, Texas
PA-2 Measured and Indicated Resource Grade Tonnage Chart

SRK Job No.: 199600.010
File Name: Figure 15-7.docx Date: 01/29/10 Approved: FD Figure: 15-7
Palangana ISR Uranium Project, Duval County, Texas
Grade Thickness Contouring

SRK Job No.: 199600.010
File Name: Figure 15-8.docx Date: 01/29/10 Approved: FD Figure: 15-8
Palangana ISR Uranium Project, Duval County, Texas
Exploration Trend Overview

SRK Job No.: 199600.010
File Name: Figure 15-9.docx Date: 01/29/10 Approved: FD Figure: 15-9
Palangana ISR Uranium Project, Duval County, Texas
Source: UEC
Jemison Fence

SRK Job No.: 199600.010
File Name: Figure 15-10.docx Date: 01/29/10 Approved: FD Figure: 15-10
Palangana ISR Uranium Project, Duval County, Texas
Source: UEC
CC Brine

SRK Job No.: 199600.010
File Name: Figure 15-11.docx Date: 01/29/10 Approved: FD Figure: 15-11
Palangana ISR Uranium Project, Duval County, Texas
Source: UEC
NE Garcia

SRK Job No.: 199600.010
File Name: Figure 15-12.docx Date: 01/29/10 Approved: FD Figure: 15-12
Palangana ISR Uranium Project, Duval County, Texas
Source: UEC
Jamison East

SRK Job No.: 199600.010
File Name: Figure 15-13.docx Date: 01/29/10 Approved: FD Figure: 15-13
Palangana ISR Uranium Project, Duval County, Texas
Source: UEC
Dome

SRK Job No.: 199600.010
File Name: Figure 15-14.docx Date: 01/29/10 Approved: FD Figure: 15-14
Palangana ISR Uranium Project, Duval County, Texas
Source: UEC
SW Garcia

SRK Job No.: 199600.010
File Name: Figure 15-15.docx Date: 01/29/10 Approved: BAS Figure: 15-15
Palangana ISR Uranium Project, Duval County, Texas
Jemison Fence Digital
Terrain Model

SRK Job No.: 199600.010
File Name: Figure 15-16.docx Date: 01/29/10 Approved: BAS Figure: 15-16
Palangana ISR Uranium Project, Duval County, Texas
CC Brine Digital Terrain Model

SRK Job No.: 199600.010
File Name: Figure 15-17.docx Date: 01/29/10 Approved: BAS Figure: 15-17
Palangana ISR Uranium Project, Duval County, Texas
NE Garcia Digital Terrain
Model

SRK Job No.: 199600.010
File Name: Figure 15-18.docx Date: 01/29/10 Approved: BAS Figure: 15-18
Palangana ISR Uranium Project, Duval County, Texas
Jemison East Terrain Model

SRK Job No.: 199600.010
File Name: Figure 15-19.docx Date: 01/29/10 Approved: BAS Figure: 15-19
Palangana ISR Uranium Project, Duval County, Texas
Dome Digital Terrain Model

SRK Job No.: 199600.010
File Name: Figure 15-20.docx Date: 01/29/10 Approved: BAS Figure: 15-20
Palangana ISR Uranium Project, Duval County, Texas
SW Garcia Digital Terrain
Model

SRK Job No.: 199600.010
File Name: Figure 15-21.docx Date: 01/29/10 Approved: BAS Figure: 15-21
Palangana ISR Uranium Project, Duval County, Texas
Jemison Fence Grade
Thickness Model

SRK Job No.: 199600.010
File Name: Figure 15-22.docx Date: 01/29/10 Approved: BAS Figure: 15-22
Palangana ISR Uranium Project, Duval County, Texas
CC Brine Grade Thickness
Model

SRK Job No.: 199600.010
File Name: Figure 15-23.docx Date: 01/29/10 Approved: BAS Figure: 15-23
Palangana ISR Uranium Project, Duval County, Texas
NE Garcia Grade Thickness Model

SRK Job No.: 199600.010
File Name: Figure 15-24.docx Date: 01/29/10 Approved: BAS Figure: 15-24
Palangana ISR Uranium Project, Duval County, Texas
Jemison East Grade
Thickness Model

SRK Job No.: 199600.010
File Name: Figure 15-25.docx Date: 01/29/10 Approved: BAS Figure: 15-25
Palangana ISR Uranium Project, Duval County, Texas
Dome Grade Thickness Model

SRK Job No.: 199600.010
File Name: Figure 15-26.docx Date: 01/29/10 Approved: BAS Figure: 15-26
Palangana ISR Uranium Project, Duval County, Texas
SW Garcia Grade Thickness
Model

Uranium Energy Corp. 16-1 Palangana ISR Uranium Project NI 43-101 Technical Report on Resources
SRK Consulting (U.S.), Inc. February 19, 2010 Palangana_NI 43-101 Technical Report_199600.010_KG.012
16 Other Relevant Data and Information The Palangana Project appears to be most suitable for mining as an ISR (in-situ recovery) project. South Texas uranium deposits that occur in permeable sands situated below the groundwater table have historically been amenable to ISR. The operating ISR operations in Texas at present are all from mines within the Goliad Formation. In this formation, the sands are relatively high in transmissivity and the mineralization is normally very leachable to bicarbonate solutions. The fluvial geometry of the Goliad channel systems and relatively impermeable clays beneath and atop the sands make for manageable production units from a hydrological and environmental standpoint particularly where faulting is not prevalent as in the case of the PA-1 and PA-2 deposits. Deposits in the Goliad Formation are being produced successfully using ISR methods at other locales in South Texas.
16.1 Review of ISR Uranium Mining
In-situ recovery of uranium is a non-invasive, cost-effective mining process that minimizes the environmental impact of mineral extraction. ISR technology was first demonstrated by Atlantic Richfield Co. at its Clay West Project near George West, Texas. Since that time, it has been developed as the preferred technology for uranium extraction from sandstone-hosted roll-front-type ores. Essentially, the process extracts uranium from porous sandstone aquifers by reversing the natural process that deposited the uranium. The sandstone aquifers provide the “plumbing system” for both the original emplacement of mineralization and the recovery of the uranium.
16.2 Mining Method
The mining method to be employed, ISR, has proved successful in comparable uranium deposits in the Goliad Sandstone in southeast Texas. Based upon water saturation in the mineralized zones the vertical and lateral continuity of the deposits and other factors including favorable permeability and mineralogy, depth of the deposit, and unsuitability due to likely poor roof considerations for underground mining, the ISR method of extraction is essentially the only viable development alternative.
16.3 Processing
The Hobson processing plant will require facility and infrastructure rehabilitation, most notably to various pumps, the yellow cake thickener, all electrical and instrumentation and control systems, and laboratory analytical equipment. Site cleanup will include disposal of old, obsolete and outdated equipment and supplies. There is a considerable amount of valuable equipment available for construction of a satellite plant, including ion exchange vessels, resin, pumps, piping and wellfield hoses (Stover report).
The nominal capacity of the Hobson facility is 1Mlbs U3O8/year and an upgrade to 2.5Mlbs U3O8/year is justifiable. This upgrade can be affected with an updated resin handling system and installation of a new filter press and larger yellow cake dryer. The waste disposal well at Hobson is in good standing, but requires clean-up and testing. Title to the Hobson site appears to be in good standing.
16.3.1 Recoverability
Based upon prior recoveries at the Hobson Plant during operations in the 1980’s, a 99% recovery of the pregnant lixiviate should be achievable.

Uranium Energy Corp. 17-1 Palangana ISR Uranium Project NI 43-101 Technical Report on Resources
SRK Consulting (U.S.), Inc. February 19, 2010 Palangana_NI 43-101 Technical Report_199600.010_KG.012
17 Interpretation and Conclusions The sandstone, roll-front deposits on the east side of the Palangana Dome in South Texas contain economically exploitable reserves of U3O8. Two of these deposits, known as the PA-1 and PA-2 bodies, have been adequately delimited for the calculation of Measured and Indicated Resources. The six exploration trends have been drilled adequately to establish Inferred Resources. Utilization of the calibrated PFN probe has proven most useful in augmenting chemical equilibrium data from core on a local basis.
17.1 Field Surveys
Field survey methodologies are robust enough for designing production cells and commencing production. The quality of the surveys meets CIM standards.
17.2 Analytical and Testing Data
Analytical testing and the QA/QC appears quite acceptable for estimation of in-place, probable and proven reserves. The usage and recent calibration of PFN data with core data has been translated on an aerial and zone specific basis. This methodology is deemed much more accurate that taking core data alone that is often non-representative of a deposit, an operating standard of many other companies dealing with deposits comparable to Palangana.
The only criticism that can be made relative to the usage of PFN data at the Palangana Project is that calibration of the PFN probes occurred at the inception of its usage but subsequent calibrations has not been conducted. It is unknown if probe specific calibration drift or change occurred temporarily. In all future applications employing usage of the PFN probes, calibration should be done at a designated testing pit or hole after every 50 holes tested.
17.3 Exploration Conclusions
The exploration and potential development of other properties in vicinity of the Palangana dome should utilize recommendations addressed in this report. Due to the continuity and interpreted paucity of faults on the deposits, the effect on development has not reached the required level of exploratory detail that is essential for developmental optimization.
Exploration practice on the PA-1 and PA-2 sites meets and exceeds current industry standards.
17.4 Other Relevant Information
QA/QC of PFN usage needs enhancement in the future as remaining resources move into the reserve category. Multiple zone production techniques will face challenges but can be overcome with careful engineering practice.

Uranium Energy Corp. 18-1 Palangana ISR Uranium Project NI 43-101 Technical Report on Resources
SRK Consulting (U.S.), Inc. February 19, 2010 Palangana_NI 43-101 Technical Report_199600.010_KG.012
18 Recommendations In SRK’s opinion, there has been sufficient drilling and coring, along with supportive interpretive studies to demonstrate geological and grade continuity within these deposits. The resource numbers presented herein represent a significant uranium deposit which warrants the implementation of the following two phase programs. Phase I being advanced engineering and economic study of PA-1 and PA-2 leading toward near term production and Phase II being the implementation of a delineation drilling program to further define and expand the inferred resources present in the six exploration areas.
18.1 Recommended Work Programs
Phase I –UEC owns the nearby Hobson processing plant and currently has all environmental permits for production from PA-1. PA-2 is covered with the current mine permit and aquifer exemption. SRK recommends that UEC proceed with detailed engineering and economic studies of PA-1 and PA-2 leading toward production.
Phase II – The delineation drilling program should include 215 drillholes within the six exploration trend areas to further define and expand the known mineralization. This drill program will occur primarily in areas off the Dome and away from the faulting, and be utilized to extend previously identified mineralized trends, fill-in drilling where data gaps exist, and potentially develop new trends in areas where geologic evidence indicates such. Based on the SRK’s analysis of the geologic data and continuity of the mineralization, there is a strong likely hood that these resources will be expanded and upon further resource estimation, will be reclassified to a higher level of confidence.
UEC has prioritized a drilling program for the exploration trends as summarized in table 18.1.1 below. Based on a review of each of these trends and construction of resource models for each SRK is entirely in agreement with these priorities.
Table 18.1.1: Details of the Phase II Drilling Program
Proposed Estimated Drilling Priority Trend Name Number of Holes Average Depth Total Footage Total Cost (US$) 1 Jemison Fence 60 390 23400 100,385 2 CC Brine 62 396 24552 105,327 3 NE Garcia 65 337 21905 93,972 4 Jemison East 28 428 11984 51,411 5 Dome 6 SW Garcia Totals 215 388 81841 351,095
18.1.1 Costs
Costs for Phase I engineering and economic studies will be determined upon UEC’s decision over the best strategy to achieve near term production. The Costs for the Phase II delineation drilling are presented below in Table 18.1.1.1.

Uranium Energy Corp. 18-2 Palangana ISR Uranium Project NI 43-101 Technical Report on Resources
SRK Consulting (U.S.), Inc. February 19, 2010 Palangana_NI 43-101 Technical Report_199600.010_KG.012
Table 18.1.1.1: Phase II Exploration Drilling Program
Activity Unit Cost (US$) Total Cost (US$) Drill, log and plug 215 holes 1,633 351,095 Per day costs for supervision, expenses etc for 92 day program 365 33,580 One time costs for field supplies, drill bits, re-tipping, permits, etc. 28,322 28,322 Total Cost 412,997

Uranium Energy Corp. 19-1 Palangana ISR Uranium Project NI 43-101 Technical Report on Resources
SRK Consulting (U.S.), Inc. February 19, 2010 Palangana_NI 43-101 Technical Report_199600.010_KG.012
19 References Blackstone, R. E., 2005, Technical report on the Palangana and Hobson uranium in-situ leach
project, Duval and Karnes Counties, Texas
Bureau of Economic Geology, The University of Texas at Austin, 1987, Geologic atlas of Texas.
Bureau of Economic Geology, The University of Texas at Austin, 2000; Vegetation/cover types of Texas, map, Univ. of Texas.
Bureau of Economic Geology, The University of Texas at Austin, 1996; Physiographic map of Texas, Univ. of Texas.
Cohan, W.T. and Guilinger, R.R., 1971, internal UCC document, Preliminary Report, Uranium Ore Reserves At Palangana Dome, Duval Co., Texas.
Dale O. C., Moulder, E. A., and Arnow, T., 1957; Ground-Water resources of Goliad County, Texas, Texas Board of Water Engineers Bulletin 5711, 93 p.
Fitch, D. C., 2005, Technical report on the Strathmore Church Rock Uranium Property, McKinley County, New Mexico.
Galloway, W. E., Finley, R. J., and Henry, C. D., 1979, South Texas Uranium Province: Geologic Perspective: The University of Texas, Bureau of Economic Geology Guidebook 18, 3 p.
Goddard, J.B., 1970, Uranium In-Place Leach, Palangana Dome Texas – Bench Scale Leaching Studies, Union Carbide Corporation Technical Report No. N-70-24, 32p.
Hallenburg, J.K., Killeen, P.G., Furlong, V.L.R., and Duray, J., 1982, Borehole Logging for Uranium Exploration A Manual, Technical Reports Series No. 212, International Atomic Energy Agency, Vienna.
In-Situ All Mineral Symposium Proceedings, May 1989, Wyoming SME-AIME.
Jacobi Jr., Lawrence R., October, 2005, Report of an Environmental Review and Site Reconnaissance of the Palangana Uranium Mine Site, Austin, TX.
Jacobi Jr., Lawrence R., October 2005, Report of an Environmental Review and Site Reconnaissance of the Hobson Processing Facility, Austin, TX.
Larson, W.C. 1978, Uranium in situ leach mining in the United States; U.S. Dept. of Interior, Bur. of Mines Information Circular IC8777, 68p.
Ludeman, Frank L. 1989, Evaluation of Moore Energy Cadena and Weesatche Properties for Rio Algom Mining Corporation, 18p.
Oman, Carl, July 2005, Report On Palangana Geology and Resources.
Sheevel, R. W., 1957, A Study of the Uranium Ore Reserves, Palangana Dome, Duval Co., Texas, Union Carbide internal document.
Steinhauser, S. R., An Occurrence of Uranium at the Palangana Salt Dome, Duval County, Texas, USAEC DAO-5-Tm-1, March 1957.

Uranium Energy Corp. 20-1 Palangana ISR Uranium Project NI 43-101 Technical Report on Resources
SRK Consulting (U.S.), Inc. February 19, 2010 Palangana_NI 43-101 Technical Report_199600.010_KG.012
20 Glossary 20.1 Mineral Resources and Reserves
20.1.1 Mineral Resources
The mineral resources and mineral reserves have been classified according to the “CIM Standards on Mineral Resources and Reserves: Definitions and Guidelines” (December 2005). Accordingly, the Resources have been classified as Measured, Indicated or Inferred, the Reserves have been classified as Proven, and Probable based on the Measured and Indicated Resources as defined below.
A Mineral Resource is a concentration or occurrence of natural, solid, inorganic or fossilized organic material in or on the Earth’s crust in such form and quantity and of such a grade or quality that it has reasonable prospects for economic extraction. The location, quantity, grade, geological characteristics and continuity of a Mineral Resource are known, estimated or interpreted from specific geological evidence and knowledge.
An ‘Inferred Mineral Resource’ is that part of a Mineral Resource for which quantity and grade or quality can be estimated on the basis of geological evidence and limited sampling and reasonably assumed, but not verified, geological and grade continuity. The estimate is based on limited information and sampling gathered through appropriate techniques from locations such as outcrops, trenches, pits, workings and drillholes.
An ‘Indicated Mineral Resource’ is that part of a Mineral Resource for which quantity, grade or quality, densities, shape and physical characteristics can be estimated with a level of confidence sufficient to allow the appropriate application of technical and economic parameters, to support mine planning and evaluation of the economic viability of the deposit. The estimate is based on detailed and reliable exploration and testing information gathered through appropriate techniques from locations such as outcrops, trenches, pits, workings and drillholes that are spaced closely enough for geological and grade continuity to be reasonably assumed.
A ‘Measured Mineral Resource’ is that part of a Mineral Resource for which quantity, grade or quality, densities, shape, physical characteristics are so well established that they can be estimated with confidence sufficient to allow the appropriate application of technical and economic parameters, to support production planning and evaluation of the economic viability of the deposit. The estimate is based on detailed and reliable exploration, sampling and testing information gathered through appropriate techniques from locations such as outcrops, trenches, pits, workings and drillholes that are spaced closely enough to confirm both geological and grade continuity.
20.1.2 Mineral Reserves
A Mineral Reserve is the economically mineable part of a Measured or Indicated Mineral Resource demonstrated by at least a Preliminary Feasibility Study. This Study must include adequate information on mining, processing, metallurgical, economic and other relevant factors that demonstrate, at the time of reporting, that economic extraction can be justified. A Mineral Reserve includes diluting materials and allowances for losses that may occur when the material is mined.

Uranium Energy Corp. 20-2 Palangana ISR Uranium Project NI 43-101 Technical Report on Resources
SRK Consulting (U.S.), Inc. February 19, 2010 Palangana_NI 43-101 Technical Report_199600.010_KG.012
A ‘Probable Mineral Reserve’ is the economically mineable part of an Indicated, and in some circumstances a Measured Mineral Resource demonstrated by at least a Preliminary Feasibility Study. This Study must include adequate information on mining, processing, metallurgical, economic, and other relevant factors that demonstrate, at the time of reporting, that economic extraction can be justified.
A ‘Proven Mineral Reserve’ is the economically mineable part of a Measured Mineral Resource demonstrated by at least a Preliminary Feasibility Study. This Study must include adequate information on mining, processing, metallurgical, economic, and other relevant factors that demonstrate, at the time of reporting, that economic extraction is justified.
20.2 Glossary
Table 20.2.1: Glossary
Term Definition Assay: The chemical analysis of mineral samples to determine the metal content. Capital Expenditure: All other expenditures not classified as operating costs. Composite: Combining more than one sample result to give an average result over a larger distance. Concentrate: A metal-rich product resulting from a mineral enrichment process such as gravity concentration
or flotation, in which most of the desired mineral has been separated from the waste material in the ore.
Cut-off Grade (CoG): The grade of mineralized rock, which determines as to whether or not it is economic to recover its content by further concentration.
Dilution: Waste, which is unavoidably mined with ore. Dip: Angle of inclination of a geological feature/rock from the horizontal. Fault: The surface of a fracture along which movement has occurred. Footwall: The underlying side of an orebody or stope. Gangue: Non-valuable components of the ore. Grade: The measure of concentration within mineralized rock. Hangingwall: The overlying side of an orebody or slope. Igneous: Primary crystalline rock formed by the solidification of magma. Kriging: An interpolation method of assigning values from samples to blocks that minimizes the
estimation error. Level: Horizontal tunnel the primary purpose is the transportation of personnel and materials. Lithological: Geological description pertaining to different rock types. LoM Plans: Life-of-Mine plans. LRP: Long Range Plan. Mineral/Mining Lease: A lease area for which mineral rights are held. Mining Assets: The Material Properties and Significant Exploration Properties. Ongoing Capital: Capital estimates of a routine nature, which is necessary for sustaining operations. Sedimentary: Pertaining to rocks formed by the accumulation of sediments, formed by the erosion of other
rocks. Sill: A thin, tabular, horizontal to sub-horizontal body of igneous rock formed by the injection of
magma into planar zones of weakness. Stratigraphy: The study of stratified rocks in terms of time and space. Strike: Direction of line formed by the intersection of strata surfaces with the horizontal plane, always
perpendicular to the dip direction. Sulfide: A sulfur bearing mineral. Thickening: The process of concentrating solid particles in suspension. Total Expenditure: All expenditures including those of an operating and capital nature. Variogram: A statistical representation of the characteristics (usually grade).

Uranium Energy Corp. 20-3 Palangana ISR Uranium Project NI 43-101 Technical Report on Resources
SRK Consulting (U.S.), Inc. February 19, 2010 Palangana_NI 43-101 Technical Report_199600.010_KG.012
Abbreviations
All currency is in U.S. dollars (US$). The following abbreviations are used in this report.
Abbreviation Unit or Term
BRS BRS Inc. oC degrees Centigrade Capex Capital Expenditures CIM Canadian Institute of Mining cm centimeter CoG Cut-off Grade CSI Columbian Southern Inc. cU3O8 chemical grade of uranium from lab testing DEF disequilibrium factor (ratio of chemical U3O8 to gross
gamma measurement in drillhole) eU3O8 equivalent grade of uranium from gamma readings oF degrees Fahrenheit ft foot (feet) GT grade times thickness of eU3O8 ISR in-situ recovery lbs pounds (unit of weight) m meter mi mile(s) Mt million short tons M&I Measured and Indicated Resources NRC Nuclear Regulatory Commission QA/QC Quality Assurance/Quality Control Opex Operating Expenditures PFN Prompt Fission Neutron Probe RC rotary circulation drilling SG specific gravity SRK SRK Consulting (U.S.), Inc. t short ton, 2,000 pounds t/d short tons per day t/yr short tons per year U elemental uranium UCC Union Carbide Corporation USNRC U.S. Nuclear Regulatory Commission U3O8 uranium oxide

Item 24: Date and Signature Page
NI 43-101 Technical Report on Resources, Uranium Energy Corp., Palangana ISR Uranium Project, Deposits PA-1, PA-2 and Adjacent Exploration Areas, Duval County, Texas, February 19, 2010 (effective date January 15, 2010).
Dated this 19th Day of February, 2010.
(“Signed”) Bart Stryhas PhD. CPG
(“Signed”) Frank Daviess, MAusIMM
(“Signed”) Andy Kurrus, Texas P.Geo

Appendix A Certificates of Authors

SRK Consulting (U.S.), Inc. 7175 West Jefferson Avenue, Suite 3000 Lakewood, CO USA 80235 [email protected] www.srk.com
Tel: 303.985.1333 Fax: 303.985.9947
Group Offices:Africa Asia Australia Europe North America South America
Canadian Offices:Saskatoon 306.955.4778 Sudbury 705.682.3270 Toronto 416.601.1445 Vancouver 604.681.4196 Yellowknife 867.445.8670
U.S. Offices:Anchorage 907.677.3520 Denver 303.985.1333 Elko 775.753.4151 Fort Collins 970.407.8302 Reno 775.828.6800 Tucson 520.544.3688
CERTIFICATE of AUTHOR
I, Bart A. Stryhas, Ph.D. CPG # 11034, do hereby certify that: 1. I am a Principal Resource Geologist of:
SRK Consulting (U.S.), Inc. 7175 W. Jefferson Ave, Suite 3000 Denver, CO, USA, 80235
2. I graduated with a Doctorate degree in structural geology from Washington State University in 1988.
In addition, I have obtained a Master of Science degree in structural geology from the University of Idaho in 1985 and a Bachelor of Arts degree in geology from the University of Vermont in 1983.
3. I am a current member of the American Institute of Professional Geologists. 4. I have worked as a geologist for a total of 25 years since my graduation from university. 5. I have read the definition of “qualified person” set out in National Instrument 43-101 (“NI 43-101”)
and certify that by reason of my education, affiliation with a professional association (as defined in NI 43-101) and past relevant work experience, I fulfill the requirements to be a “qualified person” for the purposes of NI 43-101.
6. I am responsible for all sections of the report except for the resource estimation of Section 15.2. I
have also provided the final editing for the report titled NI 43-101 Technical Report on Resources, Uranium Energy Corp., Palangana ISR Uranium Project, Deposits PA-1, PA-2 and Adjacent Exploration Areas, Duval County, Texas and dated February 19, 2010 (the “Technical Report”) relating to the Palangana Project. I have not visited the Palangana Project.
7. I have had no prior involvement with the property that is the subject of the Technical Report. 8. As of the date of the certificate, to the best of my knowledge, information and belief, the Technical
Report contains all scientific and technical information that is required to be disclosed to make the technical report not misleading.
9. I am independent of the issuer applying all of the tests in Section 1.4 of National Instrument 43-101. 10. I have read National Instrument 43-101 and Form 43-101F1, and the Technical Report has been
prepared in compliance with that instrument and form.

SRK Consulting (U.S.), Inc. Page 2 of 2
11. I consent to the filing of the Technical Report with any stock exchange and other regulatory authority and any publication by them for regulatory purposes, including electronic publication in the public company files on their websites accessible by the public, of the Technical Report.
Dated this 19th Day of February, 2010.
(“Signed”) Bart Stryhas, PhD, CPG

SRK Consulting (U.S.), Inc. 7175 West Jefferson Avenue, Suite 3000 Lakewood, CO USA 80235 [email protected] www.srk.com
Tel: 303.985.1333 Fax: 303.985.9947
Group Offices:Africa Asia Australia Europe North America South America
Canadian Offices:Saskatoon 306.955.4778 Sudbury 705.682.3270 Toronto 416.601.1445 Vancouver 604.681.4196 Yellowknife 867.445.8670
U.S. Offices:Anchorage 907.677.3520 Denver 303.985.1333 Elko 775.753.4151 Fort Collins 970.407.8302 Reno 775.828.6800 Tucson 520.544.3688
CERTIFICATE of AUTHOR
I, Frank A Daviess, MAusIMM # 226303, do hereby certify that: 1. I am a Associate Principal Resource Geologist of:
SRK Consulting (U.S.), Inc. 7175 W. Jefferson Ave, Suite 3000 Denver, CO, USA, 80235
2. I graduated from the University Of Colorado, Boulder, Colorado, USA with a B.A. in Geology in
1971 and a M.A. in Natural Resource Economics and Statistics in 1975 3. I am a Member of the Australasian Institute of Mining and Metallurgy (Registration No. 226303). I
am a Registered Member of the Society for Mining, Metallurgy and Exploration, Inc. (Registration
No. 0742250).
4. I have worked as a geologist for a total of 25 years since my graduation from university. 5. I have read the definition of “qualified person” set out in National Instrument 43-101 (“NI 43-101”)
and certify that by reason of my education, affiliation with a professional association (as defined in NI 43-101) and past relevant work experience, I fulfill the requirements to be a “qualified person” for the purposes of NI 43-101.
6. I am responsible for Section 15.2 of the report titled NI 43-101 Technical Report on Resources,
Uranium Energy Corp., Palangana ISR Uranium Project, Deposits PA-1, PA-2 and Adjacent Exploration Areas, Duval County, Texas and dated February 19, 2010 (the “Technical Report”) relating to the Palangana Project. I have not visited the Palangana Project.
7. I have had no prior involvement with the property that is the subject of the Technical Report. 8. As of the date of the certificate, to the best of my knowledge, information and belief, the Technical
Report contains all scientific and technical information that is required to be disclosed to make the technical report not misleading.
9. I am independent of the issuer applying all of the tests in Section 1.4 of National Instrument 43-101. 10. I have read National Instrument 43-101 and Form 43-101F1, and the Technical Report has been
prepared in compliance with that instrument and form.

SRK Consulting (U.S.), Inc. Page 2 of 2
11. I consent to the filing of the Technical Report with any stock exchange and other regulatory authority and any publication by them for regulatory purposes, including electronic publication in the public company files on their websites accessible by the public, of the Technical Report.
Dated this 19th Day of February, 2010.
(“Signed”) Frank Daviess, MAusIMM

CERTIFICATE of AUTHOR I, Andrew W. Kurrus III, P. G., Texas License #2576 do hereby certify that: 12. I am Manager of:
Texas Exploration, South Texas Mining Venture. Care of : Uranium Energy Corp. 9801 Anderson Mill Rd Austin, Texas, USA 78750
13. I graduated from the University of Arkansas, Fayetteville, Arkansas, USA with a B.S. in Geology in
1977 and an M.S. in Geology in 1980. 14. I am a member of Corpus Christi Geological Society. I am a member of American Association of
Petroleum Geologists. 15. I have worked as a geologist for a total of 31 years since my graduation from university. 16. I have read the definition of “qualified person” set out in National Instrument 43-101 (“NI 43-101”)
and certify that by reason of my education, affiliation with a professional association (as defined in NI 43-101) and past relevant work experience, I fulfill the requirements to be a “qualified person” for the purposes of NI 43-101.
17. I am responsible for the overview of the report titled NI 43-101 Technical Report on Resources,
Uranium Energy Corp., Palangana ISR Uranium Project, Deposits PA-1, PA-2 and Adjacent Exploration Areas, Duval County, Texas and dated February 19, 2010 (the “Technical Report”) relating to the Palangana Project. I visited the site on January 27, 2010.
18. I have had no prior involvement with the property that is the subject of the Technical Report. 19. As of the date of the certificate, to the best of my knowledge, information and belief, the Technical
Report contains all scientific and technical information that is required to be disclosed to make the technical report not misleading.
20. I am not independent of the issuer applying all of the tests in Section 1.4 of National Instrument 43-
101.
21. I have read National Instrument 43-101 and Form 43-101F1, and the Technical Report has been prepared in compliance with that instrument and form.
22. I consent to the filing of the Technical Report with any stock exchange and other regulatory authority
and any publication by them for regulatory purposes, including electronic publication in the public company files on their websites accessible by the public, of the Technical Report.
Dated this 19th Day of February, 2010.
(“Signed”) Andrew W. Kurrus III, P. G.