palm oil in indonesia - sector...
TRANSCRIPT
1
Case study reportPalm oil in Indonesia
2015
Commissioned by
2
About this project
This research forms part of a project funded by the IFC, the Dutch Ministry of Affairs, SECO and IDH the sustainable trade initiative in which Aidenvironment, NewForesight and IIED sought to develop a holistic transformation model to scale sustainability in smallholder dominated agricultural commodity sectors.
For more information about the project and to access other research reports in the series please visit: www.sectortransformation.com
About the organisations
Aidenvironment is an independent value-driven consultancy. It advises clients in realizing their ambitions in sustainable market transformation in the most prominent commodity sectors. Aidenvironment is known for its in-depth knowledge, reliable quality and good advisory skills, and is continuously asked to work for frontrunners in the private, public and non-profit sector. For more information visit: www.aidenvironment.org
NewForesight facilitates sustainable market transformations. As a strategic consultancy NewForesight addresses the global challenges of our time. NewForesight develops innovative strategies, unites stakeholders around a transformative vision for their sector and drives implementation. For more information visit: www.newforesight.com
IIED is one of the world’s most influential international development and environment policy research organisations. We build bridges between policy and practice, rich and poor communities, the government and private sector, and across diverse interest groups. For more information visit: www.iied.org
Published by Aidenvironment, NewForesight and IIED (2015).
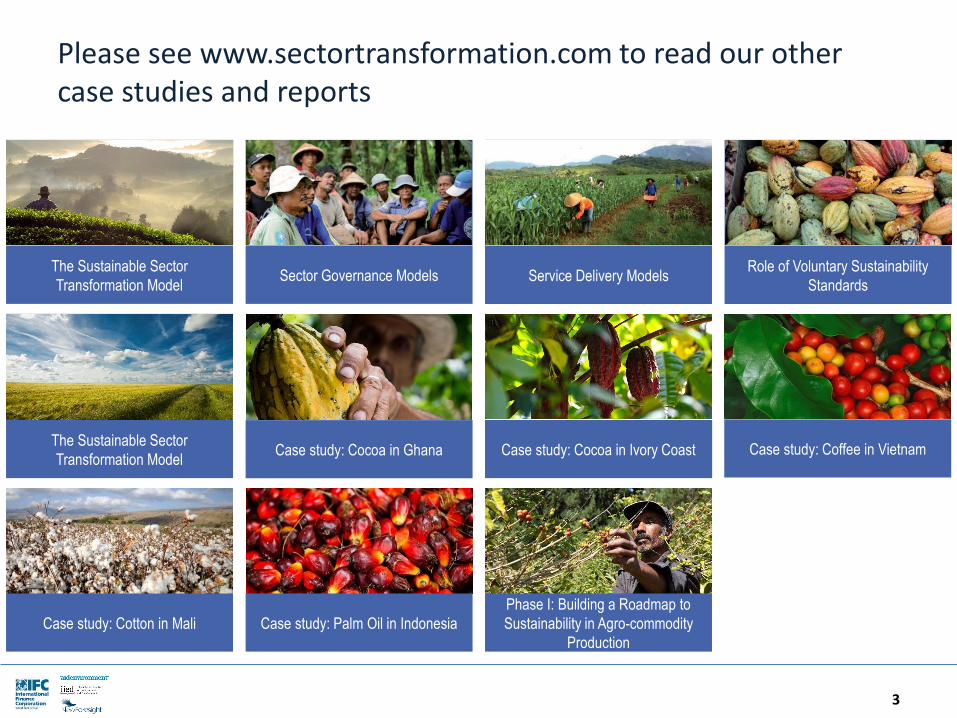
Please see www.sectortransformation.com to read our other case studies and reports
3
Case study: Cocoa in Ivory CoastCase study: Cocoa in Ghana Case study: Coffee in Vietnam
Case study: Cotton in Mali Case study: Palm Oil in Indonesia
The Sustainable Sector
Transformation ModelSector Governance Models Service Delivery Models
Role of Voluntary Sustainability
Standards
The Sustainable Sector
Transformation Model
Phase I: Building a Roadmap to
Sustainability in Agro-commodity
Production
Table of contents
4
Introduction
The Sustainable Sector Transformation Model
Case study– Palm oil in Indonesia
Appendix – the Sustainable Sector Scorecard
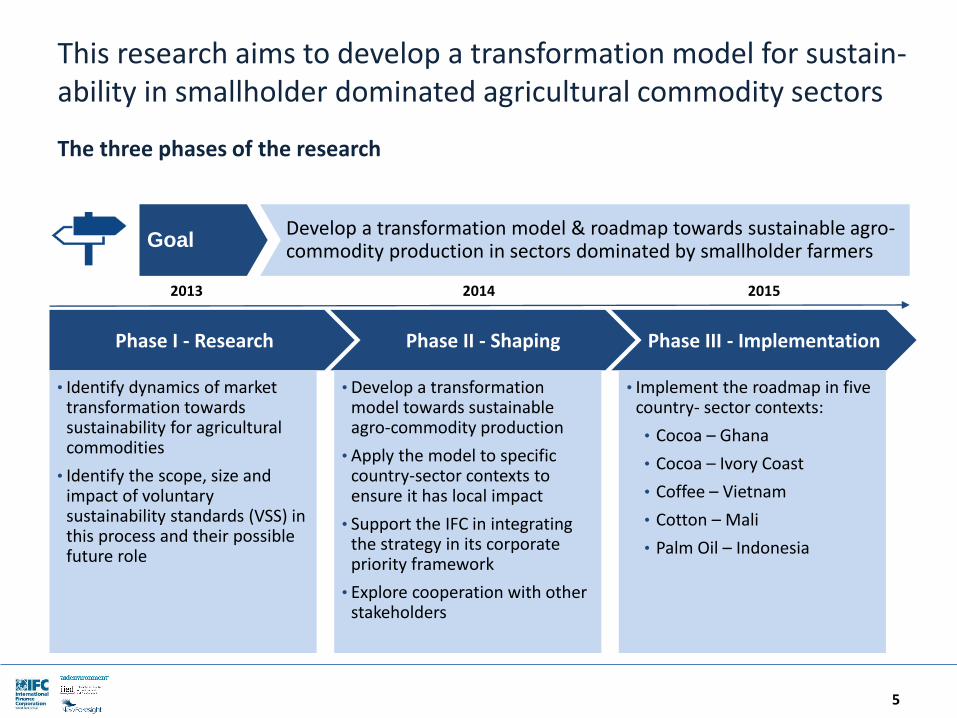
This research aims to develop a transformation model for sustain-ability in smallholder dominated agricultural commodity sectors
5
The three phases of the research
Phase I - Research Phase II - Shaping Phase III - Implementation
2013 2014 2015
• Identify dynamics of market transformation towards sustainability for agricultural commodities
• Identify the scope, size and impact of voluntary sustainability standards (VSS) in this process and their possible future role
• Implement the roadmap in five country- sector contexts:
• Cocoa – Ghana
• Cocoa – Ivory Coast
• Coffee – Vietnam
• Cotton – Mali
• Palm Oil – Indonesia
• Develop a transformation model towards sustainable agro-commodity production
• Apply the model to specific country-sector contexts to ensure it has local impact
• Support the IFC in integrating the strategy in its corporate priority framework
• Explore cooperation with other stakeholders
GoalDevelop a transformation model & roadmap towards sustainable agro-commodity production in sectors dominated by smallholder farmers
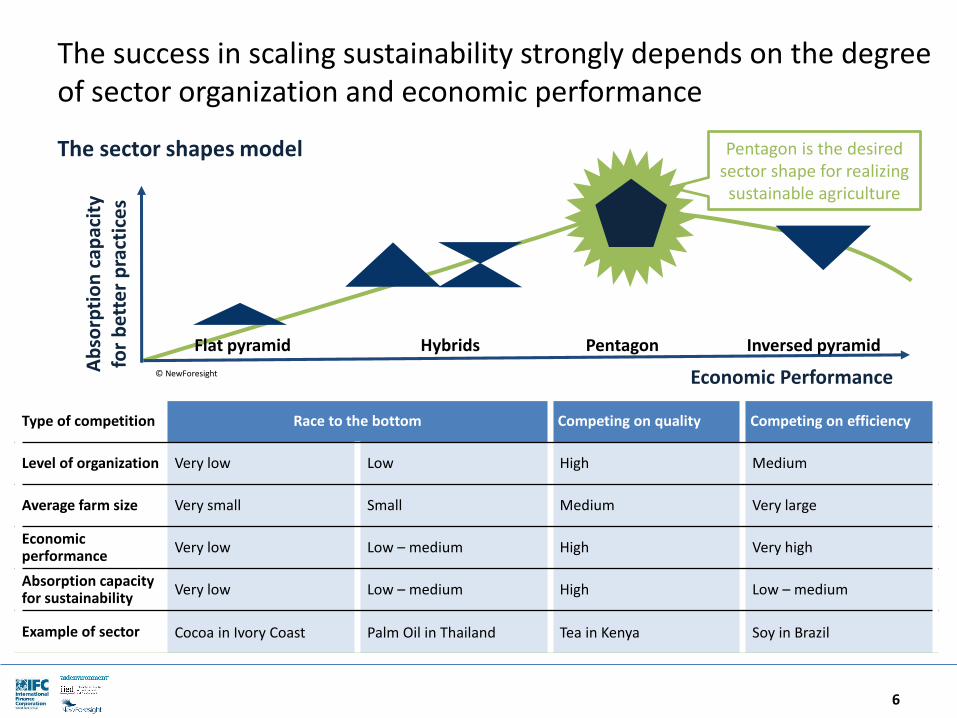
The success in scaling sustainability strongly depends on the degree of sector organization and economic performance
6
The sector shapes model Pentagon is the desired sector shape for realizing
sustainable agriculture
Ab
sorp
tio
n c
apac
ity
for
bet
ter
pra
ctic
es
Economic Performance
Pentagon Inversed pyramidHybridsFlat pyramid
Type of competition Race to the bottom Competing on quality Competing on efficiency
Level of organization Very low Low High Medium
Average farm size Very small Small Medium Very large
Economic performance
Very low Low – medium High Very high
Absorption capacity for sustainability
Very low Low – medium High Low – medium
Example of sector Cocoa in Ivory Coast Palm Oil in Thailand Tea in Kenya Soy in Brazil
© NewForesight
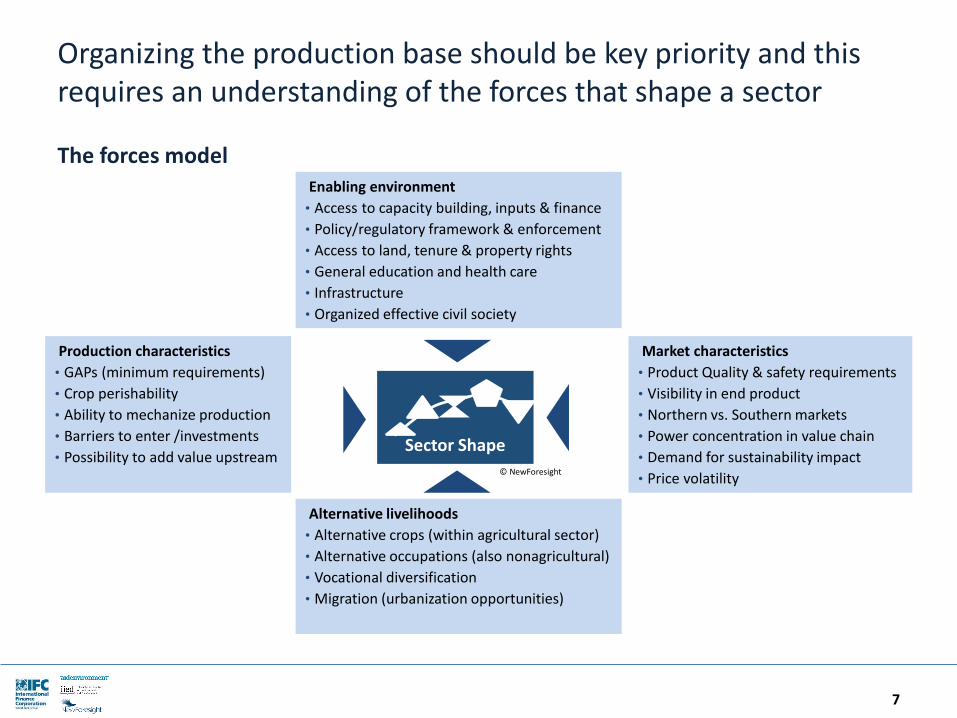
Organizing the production base should be key priority and this requires an understanding of the forces that shape a sector
7
The forces model Enabling environment
• Access to capacity building, inputs & finance
• Policy/regulatory framework & enforcement
• Access to land, tenure & property rights
• General education and health care
• Infrastructure
• Organized effective civil society
Market characteristics
• Product Quality & safety requirements
• Visibility in end product
• Northern vs. Southern markets
• Power concentration in value chain
• Demand for sustainability impact
• Price volatility
Production characteristics
• GAPs (minimum requirements)
• Crop perishability
• Ability to mechanize production
• Barriers to enter /investments
• Possibility to add value upstream
Alternative livelihoods
• Alternative crops (within agricultural sector)
• Alternative occupations (also nonagricultural)
• Vocational diversification
• Migration (urbanization opportunities)
Sector Shape
© NewForesight
Simplified sketch of the current situation
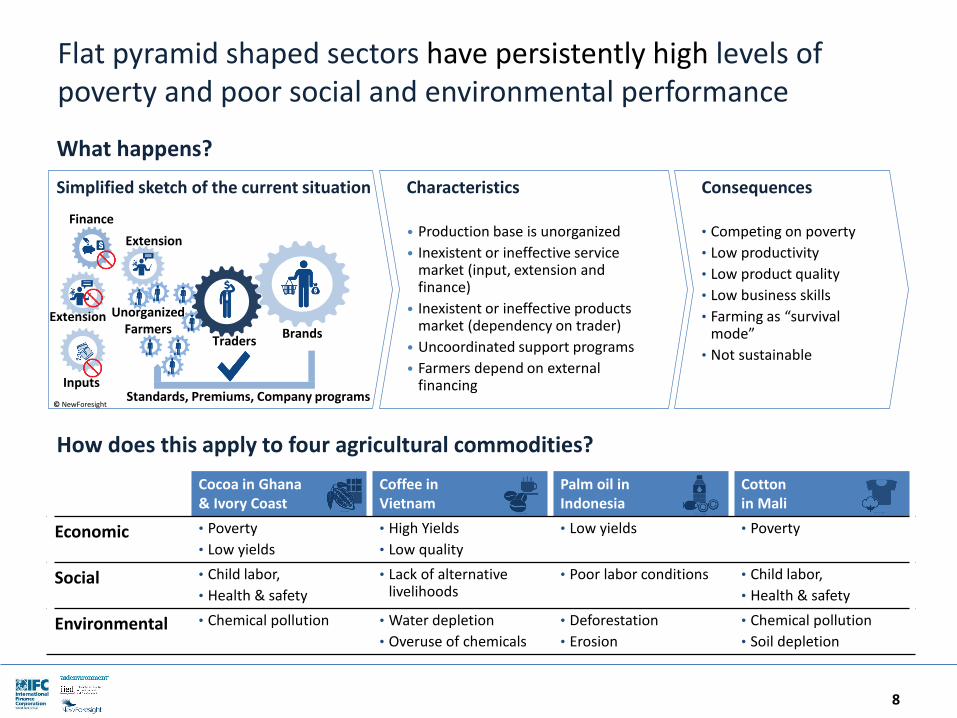
Flat pyramid shaped sectors have persistently high levels of poverty and poor social and environmental performance
8
Characteristics
• Production base is unorganized
• Inexistent or ineffective service market (input, extension and finance)
• Inexistent or ineffective products market (dependency on trader)
• Uncoordinated support programs
• Farmers depend on external financing
What happens?
Extension
Traders
Unorganized Farmers Brands
Standards, Premiums, Company programs
Finance
© NewForesight
Inputs
Extension
Cocoa in Ghana & Ivory Coast
Coffee in Vietnam
Palm oil in Indonesia
Cotton in Mali
Economic • Poverty
• Low yields
• High Yields
• Low quality
• Low yields • Poverty
Social • Child labor,
• Health & safety
• Lack of alternativelivelihoods
• Poor labor conditions • Child labor,
• Health & safety
Environmental • Chemical pollution • Water depletion
• Overuse of chemicals
• Deforestation
• Erosion
• Chemical pollution
• Soil depletion
How does this apply to four agricultural commodities?
Consequences
• Competing on poverty
• Low productivity
• Low product quality
• Low business skills
• Farming as “survival mode”
• Not sustainable
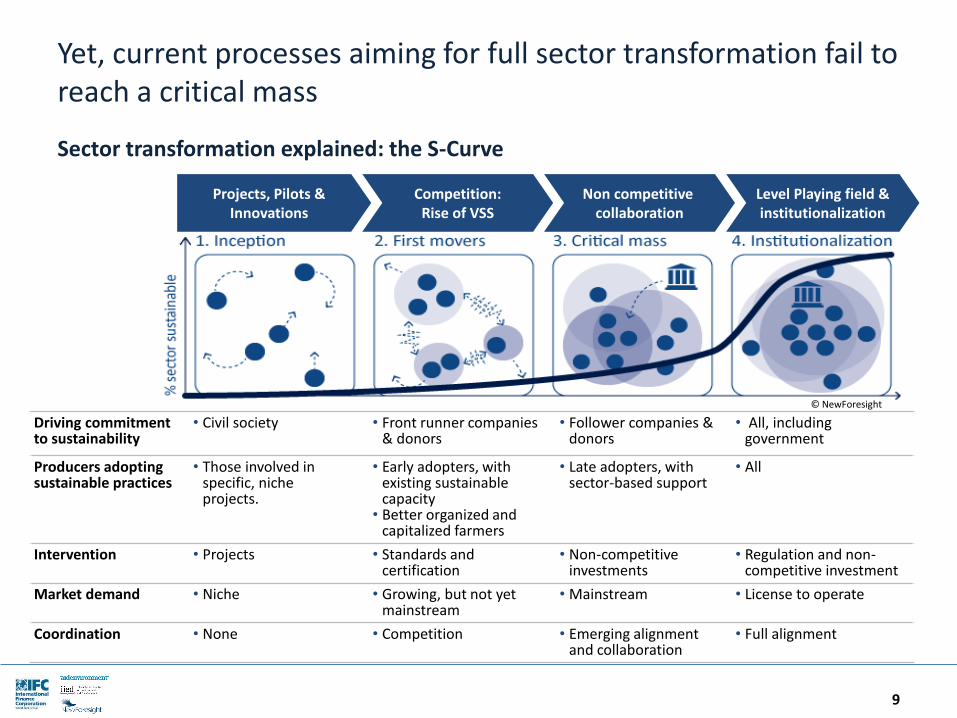
Yet, current processes aiming for full sector transformation fail to reach a critical mass
9
Sector transformation explained: the S-Curve
© NewForesight
Driving commitment to sustainability
• Civil society • Front runner companies & donors
• Follower companies & donors
• All, including government
Producers adopting sustainable practices
• Those involved in specific, niche projects.
• Early adopters, with existing sustainable capacity
• Better organized and capitalized farmers
• Late adopters, with sector-based support
• All
Intervention • Projects • Standards and certification
• Non-competitive investments
• Regulation and non-competitive investment
Market demand • Niche • Growing, but not yet mainstream
• Mainstream • License to operate
Coordination • None • Competition • Emerging alignment and collaboration
• Full alignment
Competition: Rise of VSS
Non competitive collaboration
Level Playing field & institutionalization
Projects, Pilots & Innovations
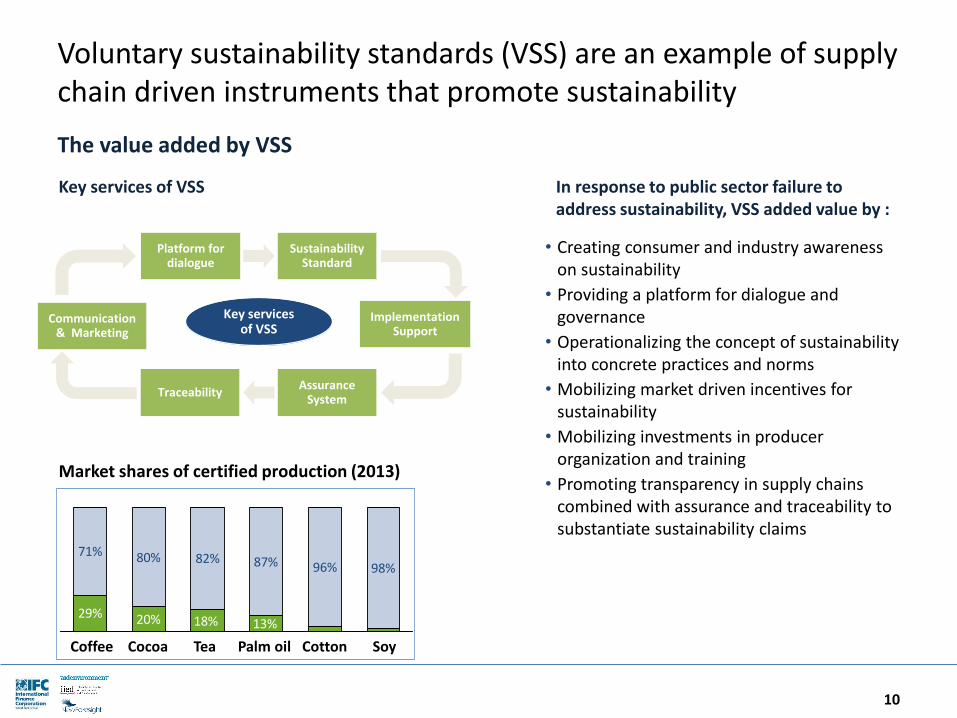
Voluntary sustainability standards (VSS) are an example of supply chain driven instruments that promote sustainability
10
In response to public sector failure to address sustainability, VSS added value by :
• Creating consumer and industry awareness on sustainability
• Providing a platform for dialogue and governance
• Operationalizing the concept of sustainability into concrete practices and norms
• Mobilizing market driven incentives for sustainability
• Mobilizing investments in producer organization and training
• Promoting transparency in supply chains combined with assurance and traceability to substantiate sustainability claims
Key services of VSS
Market shares of certified production (2013)
29% 20%
71% 80% 82% 87% 96% 98%
13%18%
Coffee Cocoa Tea Palm oil Cotton Soy
The value added by VSS
Sustainability Standard
Platform for dialogue
Assurance System
Traceability
Implementation Support
Communication & Marketing
Key services of VSS
11
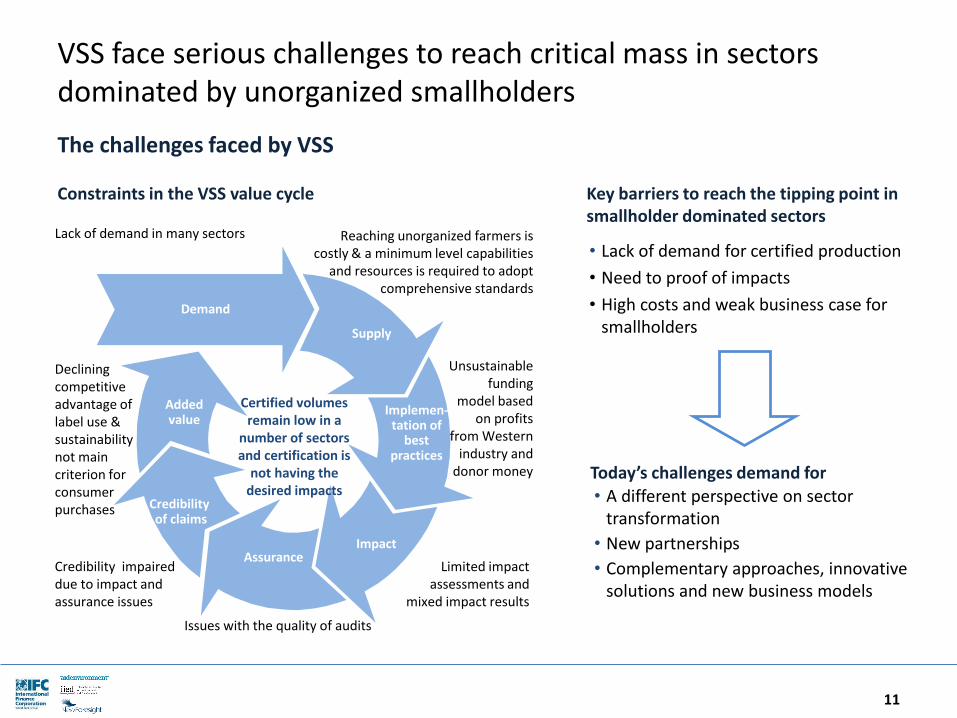
Constraints in the VSS value cycle Key barriers to reach the tipping point in smallholder dominated sectors
ImpactAssurance
Credibilityof claims
Addedvalue
Demand
Supply
Implemen-tation of
best practices
Certified volumes remain low in a
number of sectors and certification is
not having the desired impacts
Lack of demand in many sectors Reaching unorganized farmers is costly & a minimum level capabilities
and resources is required to adopt comprehensive standards
Unsustainable funding
model based on profits
from Western industry and
donor money
Limited impact assessments and
mixed impact results
Issues with the quality of audits
Credibility impaired due to impact and assurance issues
Declining competitive advantage of label use & sustainability not main criterion for consumer purchases
• Lack of demand for certified production
• Need to proof of impacts
• High costs and weak business case for smallholders
• A different perspective on sector transformation
• New partnerships
• Complementary approaches, innovative solutions and new business models
Today’s challenges demand for
The challenges faced by VSS
VSS face serious challenges to reach critical mass in sectors dominated by unorganized smallholders
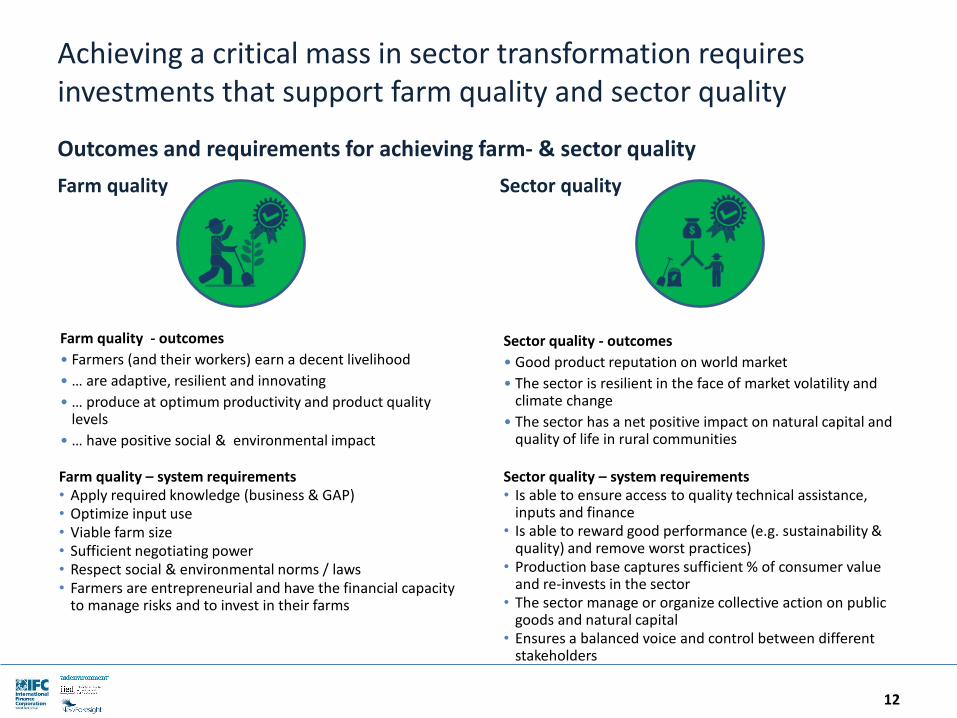
Achieving a critical mass in sector transformation requires investments that support farm quality and sector quality
12
Outcomes and requirements for achieving farm- & sector quality
Farm quality Sector quality
Farm quality - outcomes
• Farmers (and their workers) earn a decent livelihood
• … are adaptive, resilient and innovating
• … produce at optimum productivity and product quality levels
• … have positive social & environmental impact
Sector quality - outcomes
• Good product reputation on world market
• The sector is resilient in the face of market volatility and climate change
• The sector has a net positive impact on natural capital and quality of life in rural communities
Sector quality – system requirements• Is able to ensure access to quality technical assistance,
inputs and finance• Is able to reward good performance (e.g. sustainability &
quality) and remove worst practices)• Production base captures sufficient % of consumer value
and re-invests in the sector• The sector manage or organize collective action on public
goods and natural capital• Ensures a balanced voice and control between different
stakeholders
Farm quality – system requirements• Apply required knowledge (business & GAP)• Optimize input use• Viable farm size • Sufficient negotiating power• Respect social & environmental norms / laws• Farmers are entrepreneurial and have the financial capacity
to manage risks and to invest in their farms
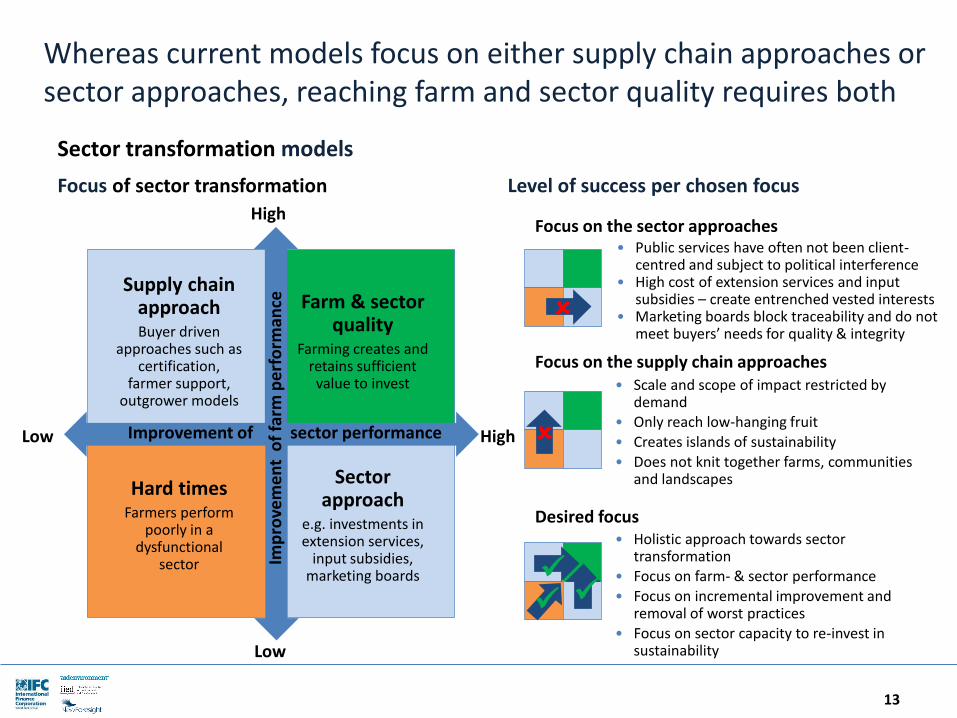
Whereas current models focus on either supply chain approaches or sector approaches, reaching farm and sector quality requires both
13
Focus of sector transformation Level of success per chosen focus
Supply chain approachBuyer driven
approaches such as certification,
farmer support, outgrower models
Hard times Farmers perform
poorly in a dysfunctional
sector
Farm & sector quality
Farming creates and retains sufficient value to invest
Sector approach
e.g. investments in extension services,
input subsidies, marketing boards
Low
High
Low HighImprovement of sector performance
Imp
rove
me
nt
of
farm
pe
rfo
rman
ce
• Public services have often not been client-centred and subject to political interference
• High cost of extension services and input subsidies – create entrenched vested interests
• Marketing boards block traceability and do not meet buyers’ needs for quality & integrity
• Scale and scope of impact restricted by demand
• Only reach low-hanging fruit
• Creates islands of sustainability• Does not knit together farms, communities
and landscapes
Focus on the sector approaches
Focus on the supply chain approaches
Sector transformation models
Desired focus • Holistic approach towards sector
transformation• Focus on farm- & sector performance
• Focus on incremental improvement and removal of worst practices
• Focus on sector capacity to re-invest in sustainability
Table of contents
14
Introduction
The Sustainable Sector Transformation Model
Case study– Palm oil in Indonesia
Appendix – the Sustainable Sector Scorecard
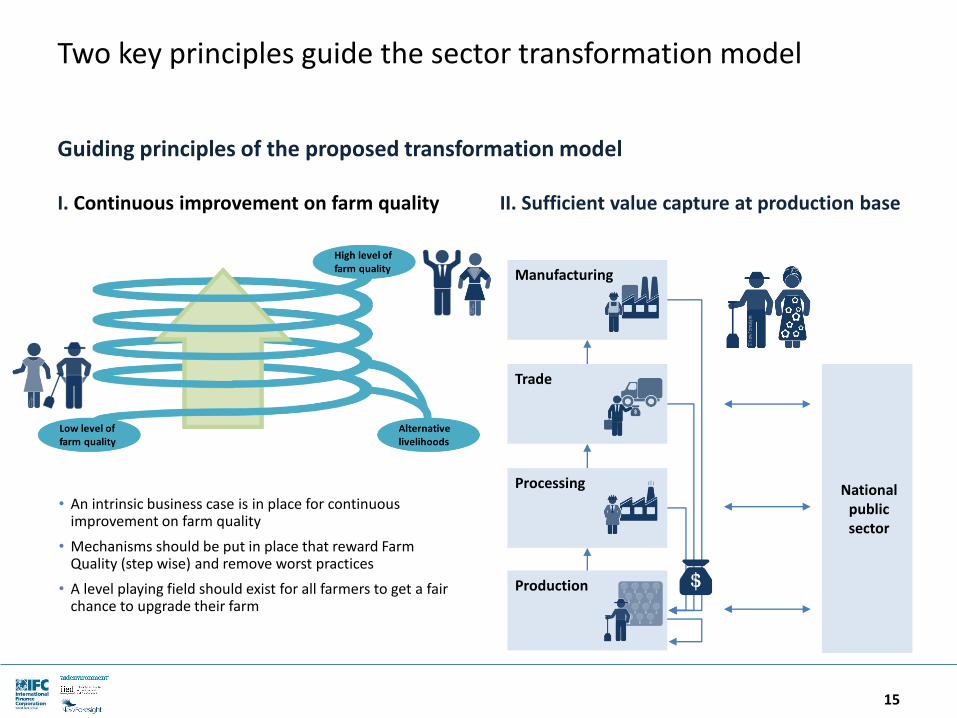
Two key principles guide the sector transformation model
15
Guiding principles of the proposed transformation model
I. Continuous improvement on farm quality II. Sufficient value capture at production base
• An intrinsic business case is in place for continuous improvement on farm quality
• Mechanisms should be put in place that reward Farm Quality (step wise) and remove worst practices
• A level playing field should exist for all farmers to get a fair chance to upgrade their farm
Manufacturing
Trade
Processing
Production
National public sector
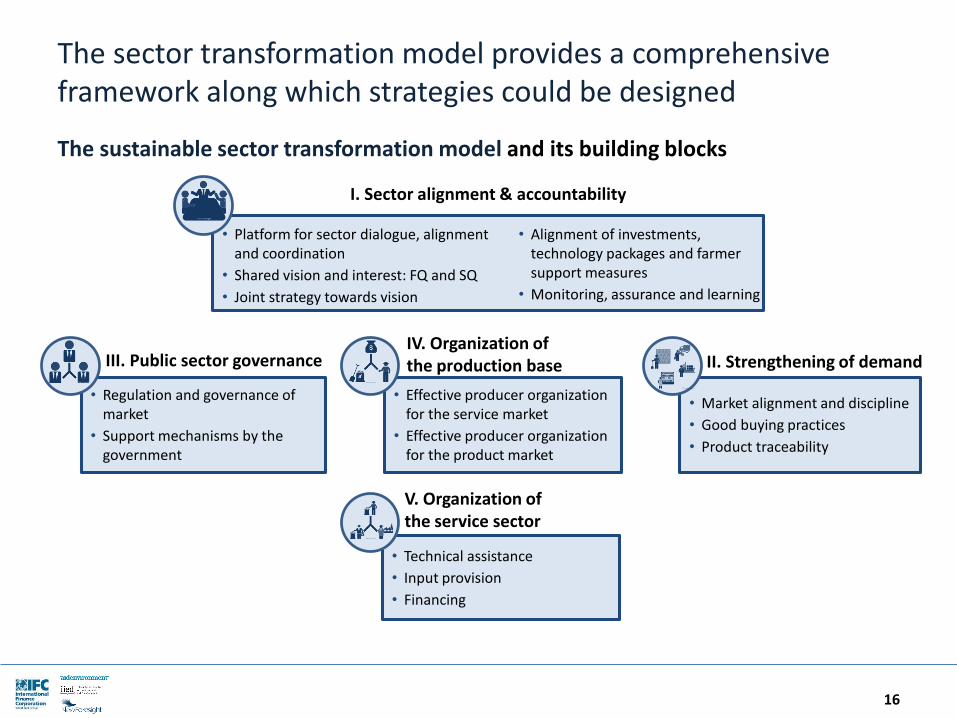
The sector transformation model provides a comprehensive framework along which strategies could be designed
16
The sustainable sector transformation model and its building blocks
• Regulation and governance of market
• Support mechanisms by the government
• Effective producer organization for the service market
• Effective producer organization for the product market
• Market alignment and discipline
• Good buying practices
• Product traceability
III. Public sector governance
• Technical assistance
• Input provision
• Financing
V. Organization of the service sector
I. Sector alignment & accountability
• Platform for sector dialogue, alignment and coordination
• Shared vision and interest: FQ and SQ
• Joint strategy towards vision
• Alignment of investments, technology packages and farmer support measures
• Monitoring, assurance and learning
II. Strengthening of demandIV. Organization ofthe production base
The required steps should follow a logical order to be most effective
17
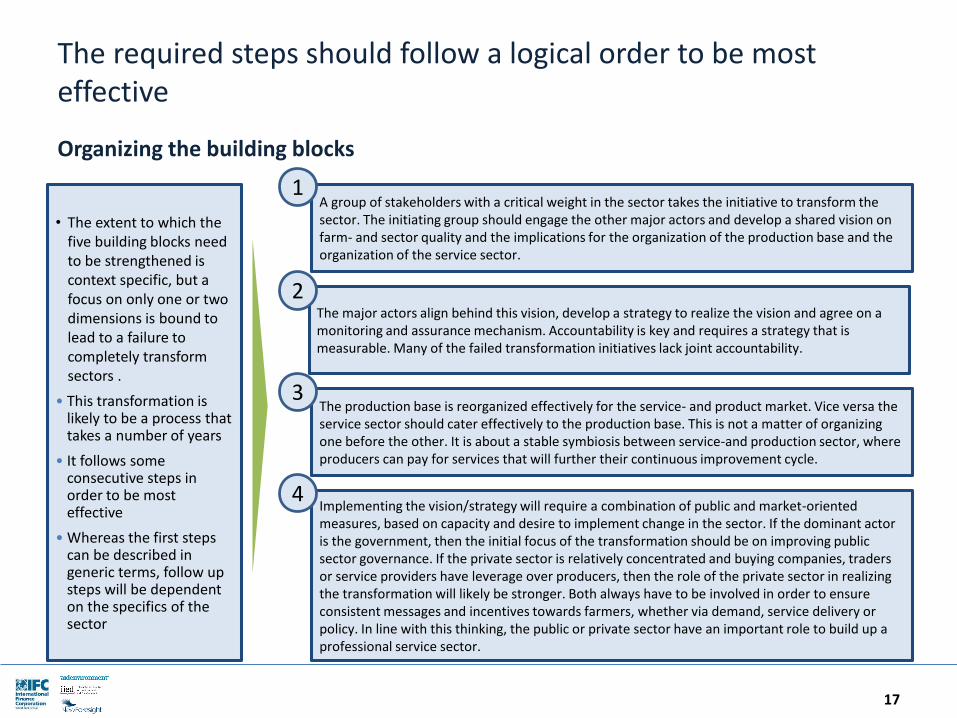
Organizing the building blocks
• The extent to which the five building blocks need to be strengthened is context specific, but a focus on only one or two dimensions is bound to lead to a failure to completely transform sectors .
• This transformation is likely to be a process that takes a number of years
• It follows some consecutive steps in order to be most effective
• Whereas the first steps can be described in generic terms, follow up steps will be dependent on the specifics of the sector
A group of stakeholders with a critical weight in the sector takes the initiative to transform the sector. The initiating group should engage the other major actors and develop a shared vision on farm- and sector quality and the implications for the organization of the production base and the organization of the service sector.
The major actors align behind this vision, develop a strategy to realize the vision and agree on a monitoring and assurance mechanism. Accountability is key and requires a strategy that is measurable. Many of the failed transformation initiatives lack joint accountability.
The production base is reorganized effectively for the service- and product market. Vice versa the service sector should cater effectively to the production base. This is not a matter of organizing one before the other. It is about a stable symbiosis between service-and production sector, where producers can pay for services that will further their continuous improvement cycle.
Implementing the vision/strategy will require a combination of public and market-oriented measures, based on capacity and desire to implement change in the sector. If the dominant actor is the government, then the initial focus of the transformation should be on improving public sector governance. If the private sector is relatively concentrated and buying companies, traders or service providers have leverage over producers, then the role of the private sector in realizing the transformation will likely be stronger. Both always have to be involved in order to ensure consistent messages and incentives towards farmers, whether via demand, service delivery or policy. In line with this thinking, the public or private sector have an important role to build up a professional service sector.
1
2
3
4
Table of contents
18
Introduction
The Sustainable Sector Transformation Model
Case study– Palm Oil In Indonesia
Appendix – the Sustainable Sector Scorecard
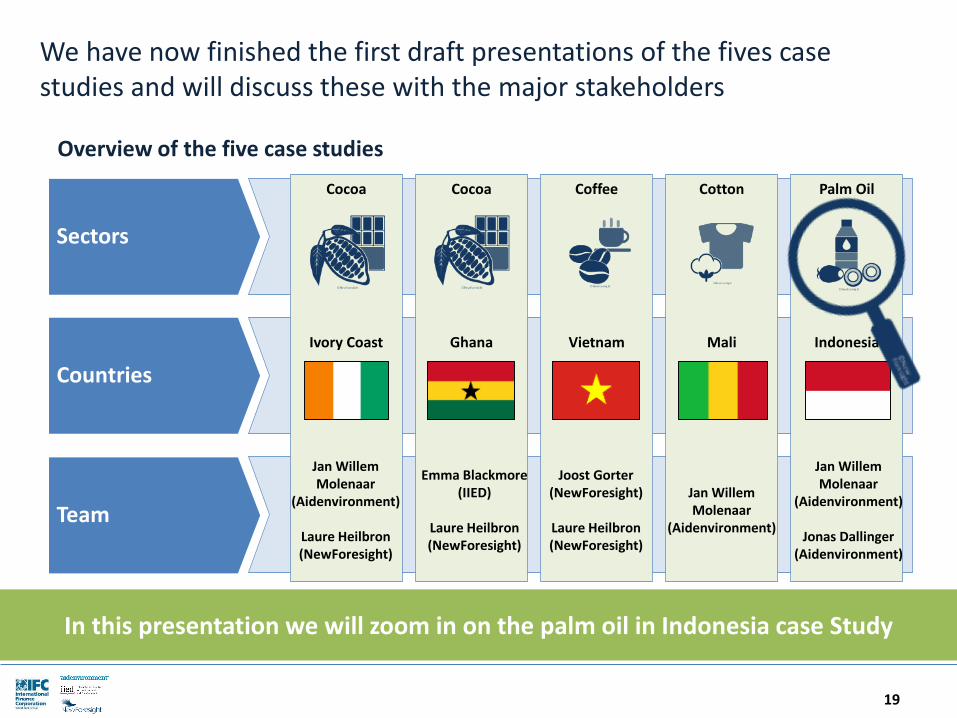
We have now finished the first draft presentations of the fives case studies and will discuss these with the major stakeholders
19
Overview of the five case studies
Sectors
Countries
Team
Cocoa
Ivory Coast
Cocoa
Ghana
Coffee
Vietnam
Cotton
Mali
Palm Oil
Indonesia
Jan Willem Molenaar
(Aidenvironment)
Laure Heilbron (NewForesight)
Emma Blackmore (IIED)
Laure Heilbron (NewForesight)
Joost Gorter(NewForesight)
Laure Heilbron (NewForesight)
Jan Willem Molenaar
(Aidenvironment)
Jan Willem Molenaar
(Aidenvironment)
Jonas Dallinger(Aidenvironment)
In this presentation we will zoom in on the palm oil in Indonesia case Study
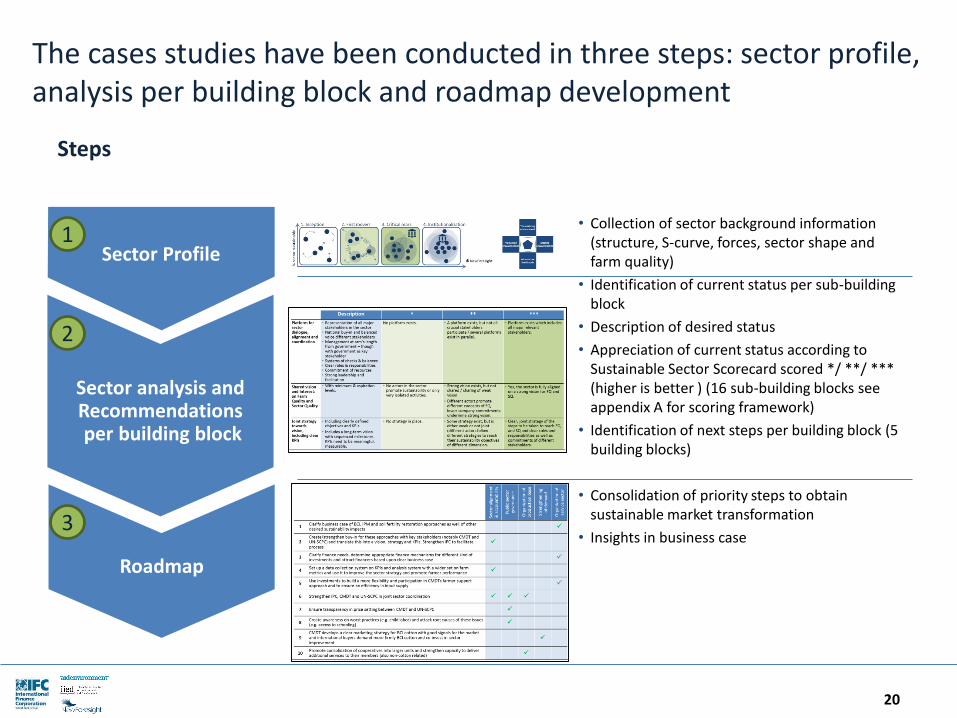
The cases studies have been conducted in three steps: sector profile, analysis per building block and roadmap development
20
• Collection of sector background information (structure, S-curve, forces, sector shape and farm quality)
• Identification of current status per sub-building block
• Description of desired status
• Appreciation of current status according to Sustainable Sector Scorecard scored */ **/ *** (higher is better ) (16 sub-building blocks see appendix A for scoring framework)
• Identification of next steps per building block (5 building blocks)
• Consolidation of priority steps to obtain sustainable market transformation
• Insights in business case
Sector Profile
Sector analysis and Recommendationsper building block
Roadmap
Steps
1
2
3
Table of contents
21
Introduction
The Sustainable Sector Transformation Model
Case study – Palm oil in Indonesia
Sector profile
Gap analysis
Priority steps & business case
Appendix – the SustainableSector Scorecard
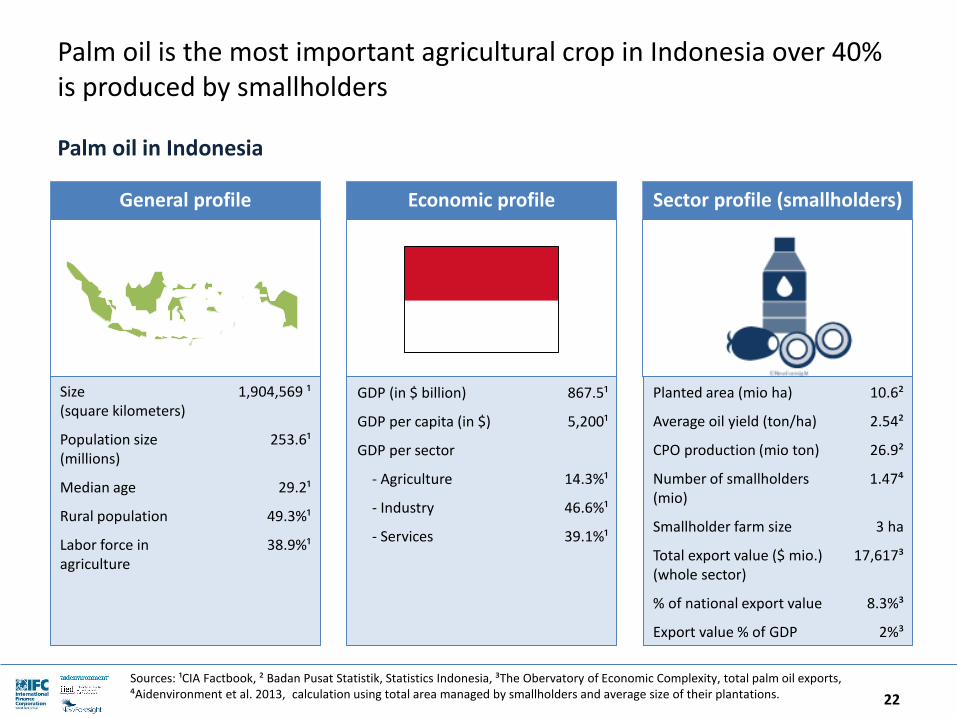
Palm oil is the most important agricultural crop in Indonesia over 40% is produced by smallholders
22
Palm oil in Indonesia
General profile Economic profile Sector profile (smallholders)
Size (square kilometers)
1,904,569 ¹
Population size (millions)
253.6¹
Median age 29.2¹
Rural population 49.3%¹
Labor force in agriculture
38.9%¹
GDP (in $ billion) 867.5¹
GDP per capita (in $) 5,200¹
GDP per sector
- Agriculture 14.3%¹
- Industry 46.6%¹
- Services 39.1%¹
Planted area (mio ha) 10.6²
Average oil yield (ton/ha) 2.54²
CPO production (mio ton) 26.9²
Number of smallholders(mio)
1.47⁴
Smallholder farm size 3 ha
Total export value ($ mio.) (whole sector)
17,617³
% of national export value 8.3%³
Export value % of GDP 2%³
Sources: ¹CIA Factbook, ² Badan Pusat Statistik, Statistics Indonesia, ³The Obervatory of Economic Complexity, total palm oil exports, ⁴Aidenvironment et al. 2013, calculation using total area managed by smallholders and average size of their plantations.
CPO Mill
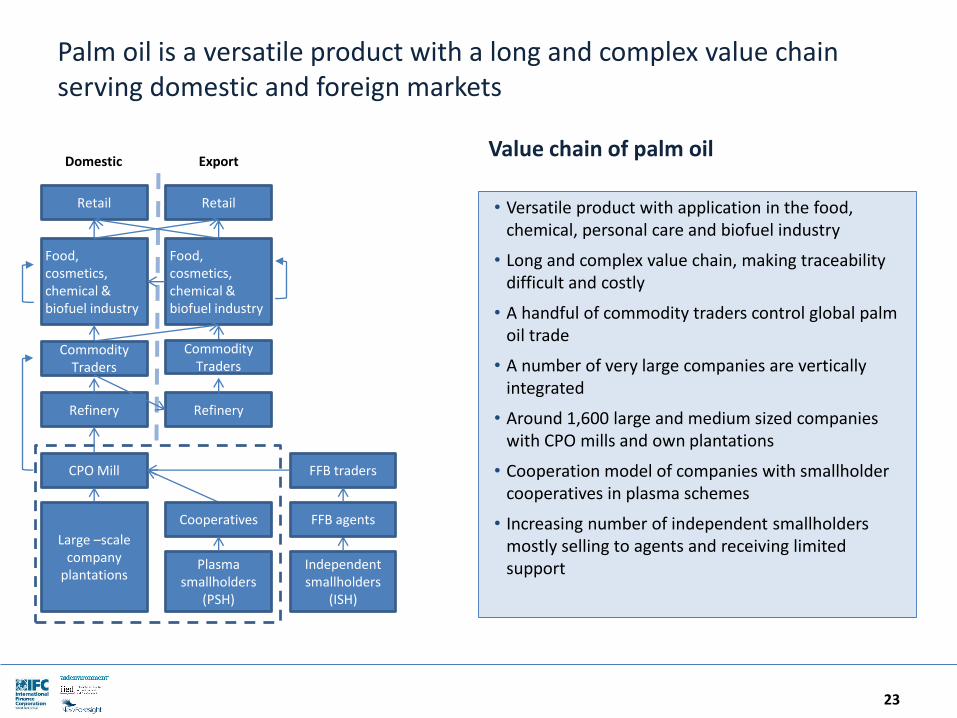
Palm oil is a versatile product with a long and complex value chain serving domestic and foreign markets
23
Value chain of palm oil
• Versatile product with application in the food, chemical, personal care and biofuel industry
• Long and complex value chain, making traceability difficult and costly
• A handful of commodity traders control global palm oil trade
• A number of very large companies are vertically integrated
• Around 1,600 large and medium sized companies with CPO mills and own plantations
• Cooperation model of companies with smallholder cooperatives in plasma schemes
• Increasing number of independent smallholders mostly selling to agents and receiving limited support
Large –scale company
plantationsPlasma
smallholders (PSH)
Independent smallholders
(ISH)
CPO Mill FFB traders
RefineryRefinery
Food, cosmetics, chemical & biofuel industry
ExportDomestic
RetailRetail
Food, cosmetics, chemical & biofuel industry
FFB agentsCooperatives
Commodity Traders
Commodity Traders
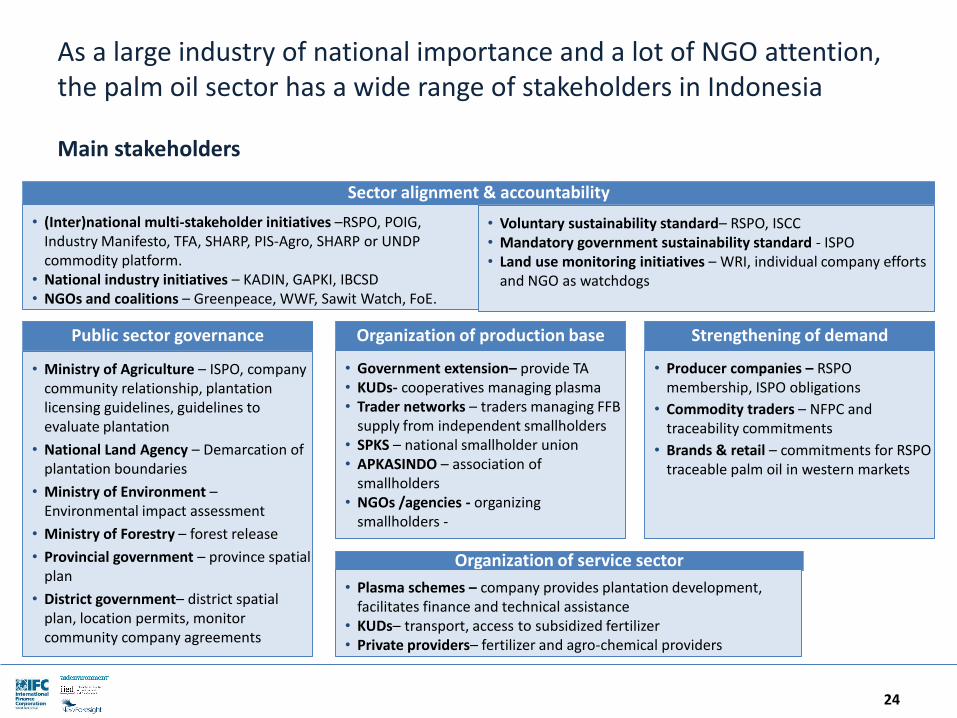
As a large industry of national importance and a lot of NGO attention, the palm oil sector has a wide range of stakeholders in Indonesia
24
Main stakeholders
Sector alignment & accountability
• (Inter)national multi-stakeholder initiatives –RSPO, POIG, Industry Manifesto, TFA, SHARP, PIS-Agro, SHARP or UNDP commodity platform.
• National industry initiatives – KADIN, GAPKI, IBCSD• NGOs and coalitions – Greenpeace, WWF, Sawit Watch, FoE.
Public sector governance
• Ministry of Agriculture – ISPO, company community relationship, plantation licensing guidelines, guidelines to evaluate plantation
• National Land Agency – Demarcation of plantation boundaries
• Ministry of Environment –Environmental impact assessment
• Ministry of Forestry – forest release
• Provincial government – province spatial plan
• District government– district spatial plan, location permits, monitor community company agreements
Strengthening of demandOrganization of production base
• Government extension– provide TA• KUDs- cooperatives managing plasma• Trader networks – traders managing FFB
supply from independent smallholders• SPKS – national smallholder union• APKASINDO – association of
smallholders• NGOs /agencies - organizing
smallholders -
• Producer companies – RSPO membership, ISPO obligations
• Commodity traders – NFPC and traceability commitments
• Brands & retail – commitments for RSPO traceable palm oil in western markets
Organization of service sector
• Plasma schemes – company provides plantation development, facilitates finance and technical assistance
• KUDs– transport, access to subsidized fertilizer• Private providers– fertilizer and agro-chemical providers
• Voluntary sustainability standard– RSPO, ISCC• Mandatory government sustainability standard - ISPO• Land use monitoring initiatives – WRI, individual company efforts
and NGO as watchdogs
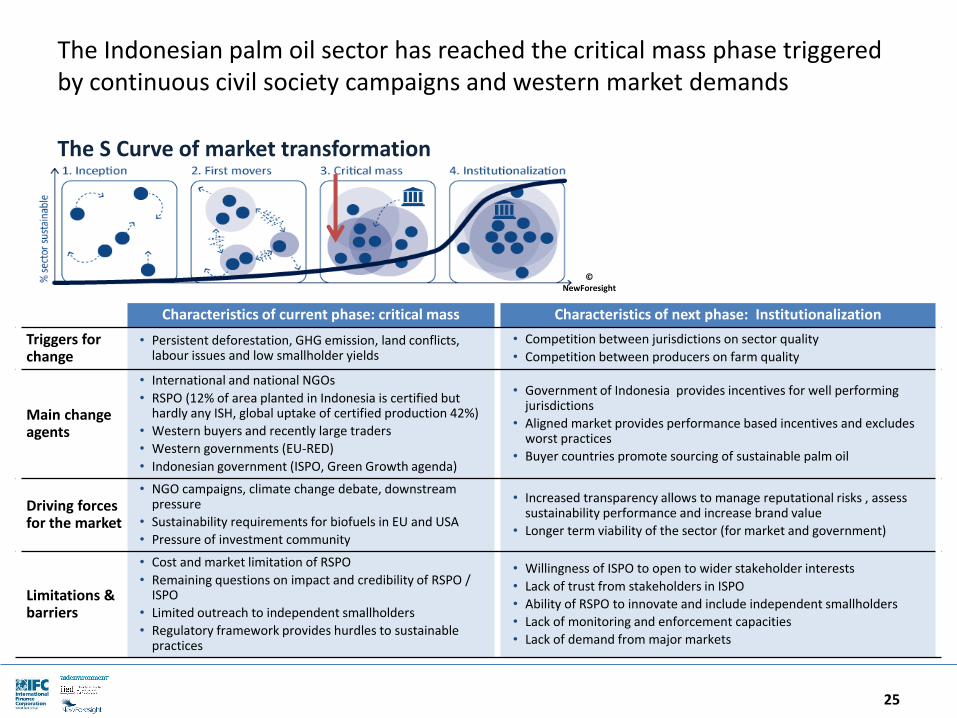
The Indonesian palm oil sector has reached the critical mass phase triggered by continuous civil society campaigns and western market demands
25
The S Curve of market transformation
Characteristics of current phase: critical mass Characteristics of next phase: Institutionalization
Triggers for change
• Persistent deforestation, GHG emission, land conflicts, labour issues and low smallholder yields
• Competition between jurisdictions on sector quality
• Competition between producers on farm quality
Main change agents
• International and national NGOs
• RSPO (12% of area planted in Indonesia is certified but hardly any ISH, global uptake of certified production 42%)
• Western buyers and recently large traders
• Western governments (EU-RED)
• Indonesian government (ISPO, Green Growth agenda)
• Government of Indonesia provides incentives for well performing jurisdictions
• Aligned market provides performance based incentives and excludes worst practices
• Buyer countries promote sourcing of sustainable palm oil
Driving forces for the market
• NGO campaigns, climate change debate, downstream pressure
• Sustainability requirements for biofuels in EU and USA
• Pressure of investment community
• Increased transparency allows to manage reputational risks , assess sustainability performance and increase brand value
• Longer term viability of the sector (for market and government)
Limitations & barriers
• Cost and market limitation of RSPO
• Remaining questions on impact and credibility of RSPO / ISPO
• Limited outreach to independent smallholders
• Regulatory framework provides hurdles to sustainable practices
• Willingness of ISPO to open to wider stakeholder interests
• Lack of trust from stakeholders in ISPO
• Ability of RSPO to innovate and include independent smallholders
• Lack of monitoring and enforcement capacities
• Lack of demand from major markets
© NewForesight
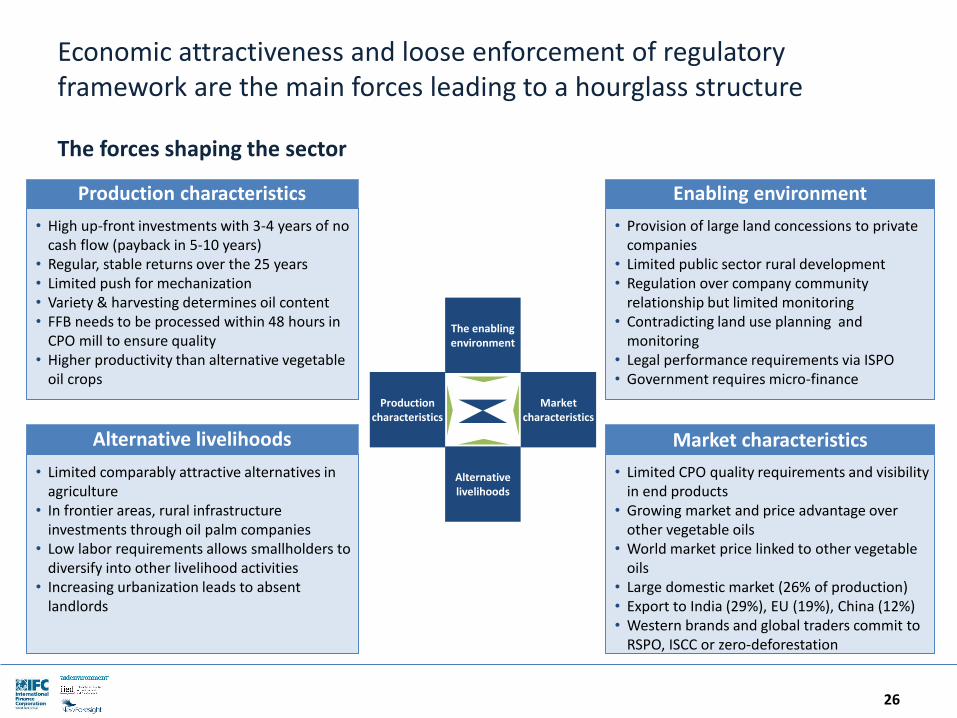
Economic attractiveness and loose enforcement of regulatory framework are the main forces leading to a hourglass structure
26
The forces shaping the sector
Enabling environment
Market characteristics
• High up-front investments with 3-4 years of no cash flow (payback in 5-10 years)
• Regular, stable returns over the 25 years• Limited push for mechanization• Variety & harvesting determines oil content• FFB needs to be processed within 48 hours in
CPO mill to ensure quality• Higher productivity than alternative vegetable
oil crops
• Limited comparably attractive alternatives in agriculture
• In frontier areas, rural infrastructure investments through oil palm companies
• Low labor requirements allows smallholders to diversify into other livelihood activities
• Increasing urbanization leads to absent landlords
• Provision of large land concessions to private companies
• Limited public sector rural development• Regulation over company community
relationship but limited monitoring• Contradicting land use planning and
monitoring• Legal performance requirements via ISPO• Government requires micro-finance
• Limited CPO quality requirements and visibility in end products
• Growing market and price advantage over other vegetable oils
• World market price linked to other vegetable oils
• Large domestic market (26% of production)• Export to India (29%), EU (19%), China (12%)• Western brands and global traders commit to
RSPO, ISCC or zero-deforestation
The enabling environment
Alternative livelihoods
Market characteristics
Production characteristics
Production characteristics
Alternative livelihoods
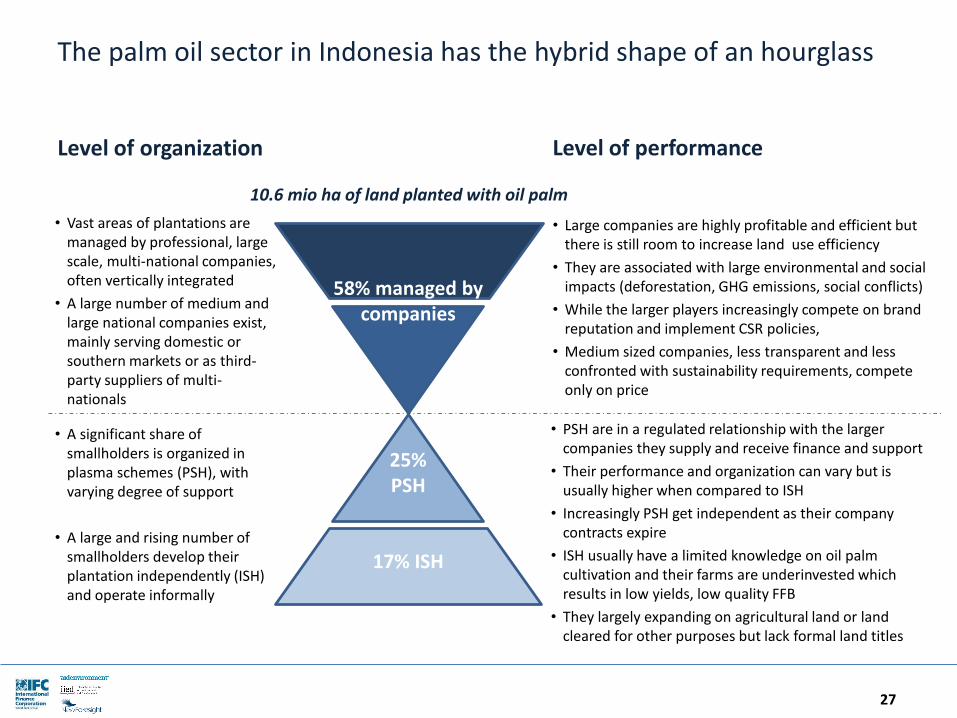
The palm oil sector in Indonesia has the hybrid shape of an hourglass
• Vast areas of plantations are managed by professional, large scale, multi-national companies, often vertically integrated
• A large number of medium and large national companies exist, mainly serving domestic or southern markets or as third-party suppliers of multi-nationals
27
Level of organization
58% managed by companies
25% PSH
17% ISH
10.6 mio ha of land planted with oil palm
• A significant share of smallholders is organized in plasma schemes (PSH), with varying degree of support
• A large and rising number of smallholders develop their plantation independently (ISH) and operate informally
• PSH are in a regulated relationship with the larger companies they supply and receive finance and support
• Their performance and organization can vary but is usually higher when compared to ISH
• Increasingly PSH get independent as their company contracts expire
• ISH usually have a limited knowledge on oil palm cultivation and their farms are underinvested which results in low yields, low quality FFB
• They largely expanding on agricultural land or land cleared for other purposes but lack formal land titles
• Large companies are highly profitable and efficient but there is still room to increase land use efficiency
• They are associated with large environmental and social impacts (deforestation, GHG emissions, social conflicts)
• While the larger players increasingly compete on brand reputation and implement CSR policies,
• Medium sized companies, less transparent and less confronted with sustainability requirements, compete only on price
Level of performance
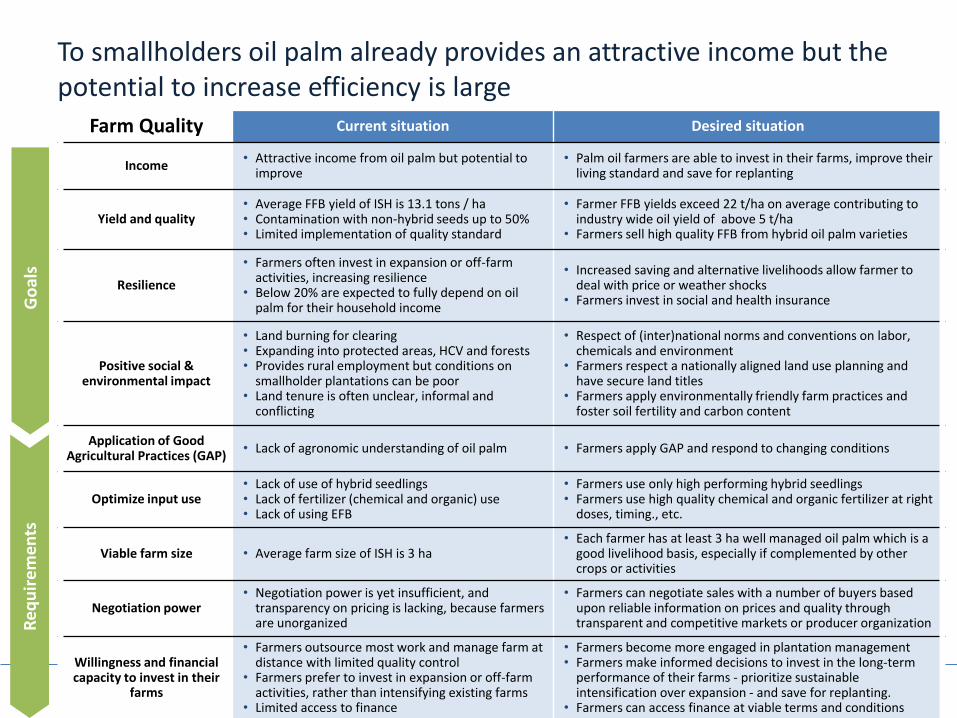
To smallholders oil palm already provides an attractive income but the potential to increase efficiency is large
28
Farm quality
Farm Quality Current situation Desired situation
Income• Attractive income from oil palm but potential to
improve• Palm oil farmers are able to invest in their farms, improve their
living standard and save for replanting
Yield and quality• Average FFB yield of ISH is 13.1 tons / ha• Contamination with non-hybrid seeds up to 50%• Limited implementation of quality standard
• Farmer FFB yields exceed 22 t/ha on average contributing to industry wide oil yield of above 5 t/ha
• Farmers sell high quality FFB from hybrid oil palm varieties
Resilience
• Farmers often invest in expansion or off-farmactivities, increasing resilience
• Below 20% are expected to fully depend on oil palm for their household income
• Increased saving and alternative livelihoods allow farmer to deal with price or weather shocks
• Farmers invest in social and health insurance
Positive social & environmental impact
• Land burning for clearing• Expanding into protected areas, HCV and forests• Provides rural employment but conditions on
smallholder plantations can be poor• Land tenure is often unclear, informal and
conflicting
• Respect of (inter)national norms and conventions on labor, chemicals and environment
• Farmers respect a nationally aligned land use planning and have secure land titles
• Farmers apply environmentally friendly farm practices and foster soil fertility and carbon content
Application of Good Agricultural Practices (GAP)
• Lack of agronomic understanding of oil palm • Farmers apply GAP and respond to changing conditions
Optimize input use• Lack of use of hybrid seedlings• Lack of fertilizer (chemical and organic) use• Lack of using EFB
• Farmers use only high performing hybrid seedlings• Farmers use high quality chemical and organic fertilizer at right
doses, timing., etc.
Viable farm size • Average farm size of ISH is 3 ha• Each farmer has at least 3 ha well managed oil palm which is a
good livelihood basis, especially if complemented by other crops or activities
Negotiation power• Negotiation power is yet insufficient, and
transparency on pricing is lacking, because farmers are unorganized
• Farmers can negotiate sales with a number of buyers based upon reliable information on prices and quality through transparent and competitive markets or producer organization
Willingness and financial capacity to invest in their
farms
• Farmers outsource most work and manage farm at distance with limited quality control
• Farmers prefer to invest in expansion or off-farm activities, rather than intensifying existing farms
• Limited access to finance
• Farmers become more engaged in plantation management• Farmers make informed decisions to invest in the long-term
performance of their farms - prioritize sustainable intensification over expansion - and save for replanting.
• Farmers can access finance at viable terms and conditions
Re
qu
ire
men
ts
Go
als
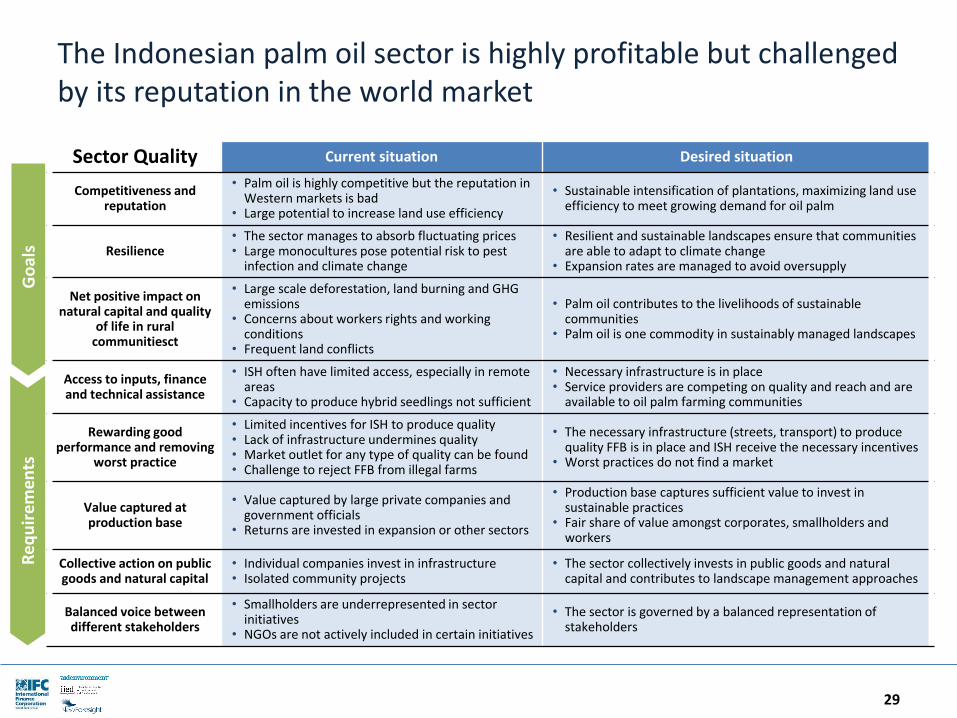
The Indonesian palm oil sector is highly profitable but challenged by its reputation in the world market
29
Farm quality Sector Quality Current situation Desired situation
Competitiveness and reputation
• Palm oil is highly competitive but the reputation inWestern markets is bad
• Large potential to increase land use efficiency
• Sustainable intensification of plantations, maximizing land use efficiency to meet growing demand for oil palm
Resilience• The sector manages to absorb fluctuating prices• Large monocultures pose potential risk to pest
infection and climate change
• Resilient and sustainable landscapes ensure that communities are able to adapt to climate change
• Expansion rates are managed to avoid oversupply
Net positive impact on natural capital and quality
of life in rural communitiesct
• Large scale deforestation, land burning and GHG emissions
• Concerns about workers rights and working conditions
• Frequent land conflicts
• Palm oil contributes to the livelihoods of sustainable communities
• Palm oil is one commodity in sustainably managed landscapes
Access to inputs, finance and technical assistance
• ISH often have limited access, especially in remote areas
• Capacity to produce hybrid seedlings not sufficient
• Necessary infrastructure is in place• Service providers are competing on quality and reach and are
available to oil palm farming communities
Rewarding good performance and removing
worst practice
• Limited incentives for ISH to produce quality• Lack of infrastructure undermines quality• Market outlet for any type of quality can be found• Challenge to reject FFB from illegal farms
• The necessary infrastructure (streets, transport) to produce quality FFB is in place and ISH receive the necessary incentives
• Worst practices do not find a market
Value captured at production base
• Value captured by large private companies and government officials
• Returns are invested in expansion or other sectors
• Production base captures sufficient value to invest in sustainable practices
• Fair share of value amongst corporates, smallholders and workers
Collective action on public goods and natural capital
• Individual companies invest in infrastructure• Isolated community projects
• The sector collectively invests in public goods and natural capital and contributes to landscape management approaches
Balanced voice between different stakeholders
• Smallholders are underrepresented in sector initiatives
• NGOs are not actively included in certain initiatives
• The sector is governed by a balanced representation of stakeholders
Re
qu
ire
men
ts
Go
als
Table of contents
30
Introduction
The Sustainable Sector Transformation Model
Case study – Palm oil in Indonesia
Sector profile
Gap analysis
Priority steps & business case
Appendix – the Sustainable Sector Scorecard
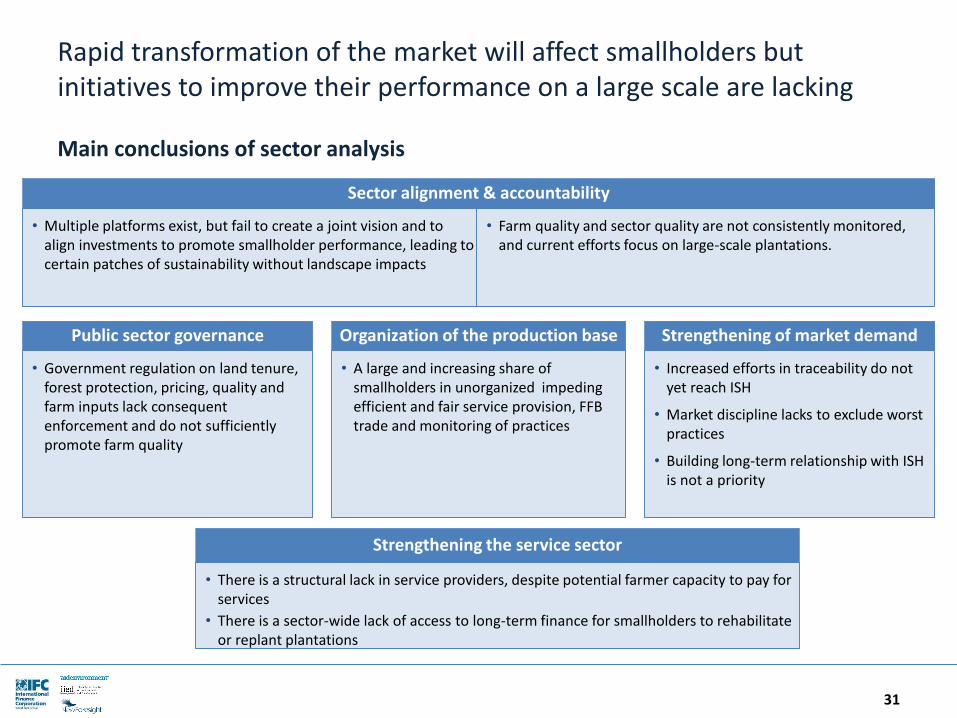
Rapid transformation of the market will affect smallholders but initiatives to improve their performance on a large scale are lacking
31
Main conclusions of sector analysis
Sector alignment & accountability
• Multiple platforms exist, but fail to create a joint vision and to align investments to promote smallholder performance, leading to certain patches of sustainability without landscape impacts
Public sector governance
• Government regulation on land tenure, forest protection, pricing, quality and farm inputs lack consequent enforcement and do not sufficiently promote farm quality
Strengthening of market demandOrganization of the production base
• A large and increasing share of smallholders in unorganized impeding efficient and fair service provision, FFB trade and monitoring of practices
• Increased efforts in traceability do not yet reach ISH
• Market discipline lacks to exclude worst practices
• Building long-term relationship with ISH is not a priority
Strengthening the service sector
• There is a structural lack in service providers, despite potential farmer capacity to pay for services
• There is a sector-wide lack of access to long-term finance for smallholders to rehabilitate or replant plantations
• Farm quality and sector quality are not consistently monitored, and current efforts focus on large-scale plantations.
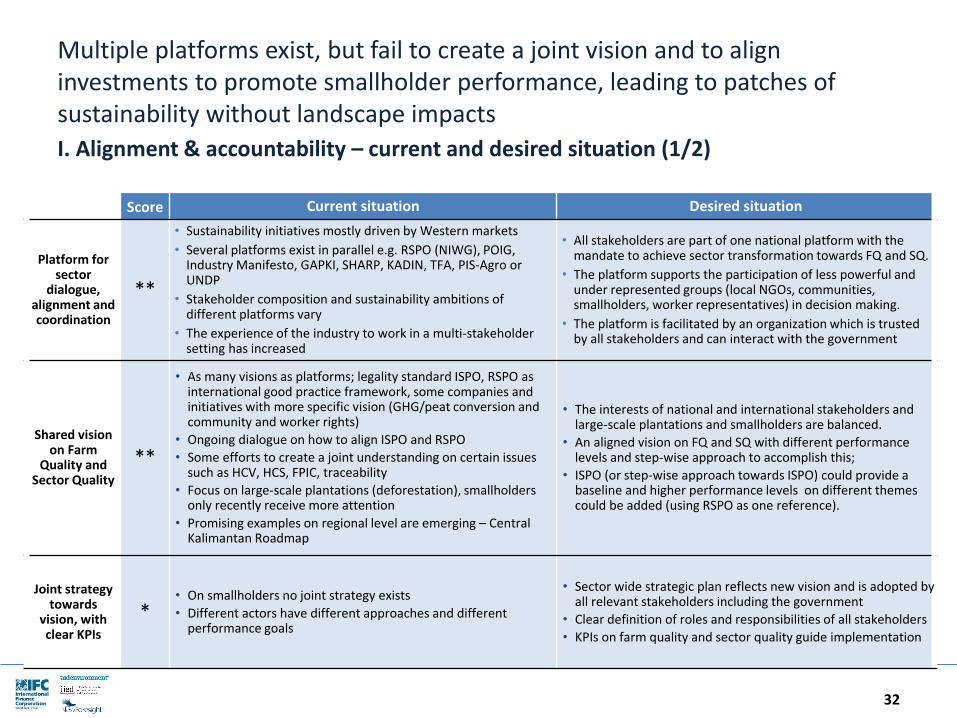
Multiple platforms exist, but fail to create a joint vision and to align investments to promote smallholder performance, leading to patches of sustainability without landscape impacts
32
I. Alignment & accountability – current and desired situation (1/2)
Score Current situation Desired situation
Platform for sector
dialogue, alignment and coordination
**
• Sustainability initiatives mostly driven by Western markets
• Several platforms exist in parallel e.g. RSPO (NIWG), POIG, Industry Manifesto, GAPKI, SHARP, KADIN, TFA, PIS-Agro or UNDP
• Stakeholder composition and sustainability ambitions of different platforms vary
• The experience of the industry to work in a multi-stakeholder setting has increased
• All stakeholders are part of one national platform with the mandate to achieve sector transformation towards FQ and SQ.
• The platform supports the participation of less powerful and under represented groups (local NGOs, communities, smallholders, worker representatives) in decision making.
• The platform is facilitated by an organization which is trusted by all stakeholders and can interact with the government
Shared vision on Farm
Quality and Sector Quality
**
• As many visions as platforms; legality standard ISPO, RSPO as international good practice framework, some companies and initiatives with more specific vision (GHG/peat conversion and community and worker rights)
• Ongoing dialogue on how to align ISPO and RSPO
• Some efforts to create a joint understanding on certain issues such as HCV, HCS, FPIC, traceability
• Focus on large-scale plantations (deforestation), smallholders only recently receive more attention
• Promising examples on regional level are emerging – Central Kalimantan Roadmap
• The interests of national and international stakeholders and large-scale plantations and smallholders are balanced.
• An aligned vision on FQ and SQ with different performance levels and step-wise approach to accomplish this;
• ISPO (or step-wise approach towards ISPO) could provide a baseline and higher performance levels on different themes could be added (using RSPO as one reference).
Joint strategy towards
vision, with clear KPIs
*• On smallholders no joint strategy exists
• Different actors have different approaches and different performance goals
• Sector wide strategic plan reflects new vision and is adopted by all relevant stakeholders including the government
• Clear definition of roles and responsibilities of all stakeholders
• KPIs on farm quality and sector quality guide implementation
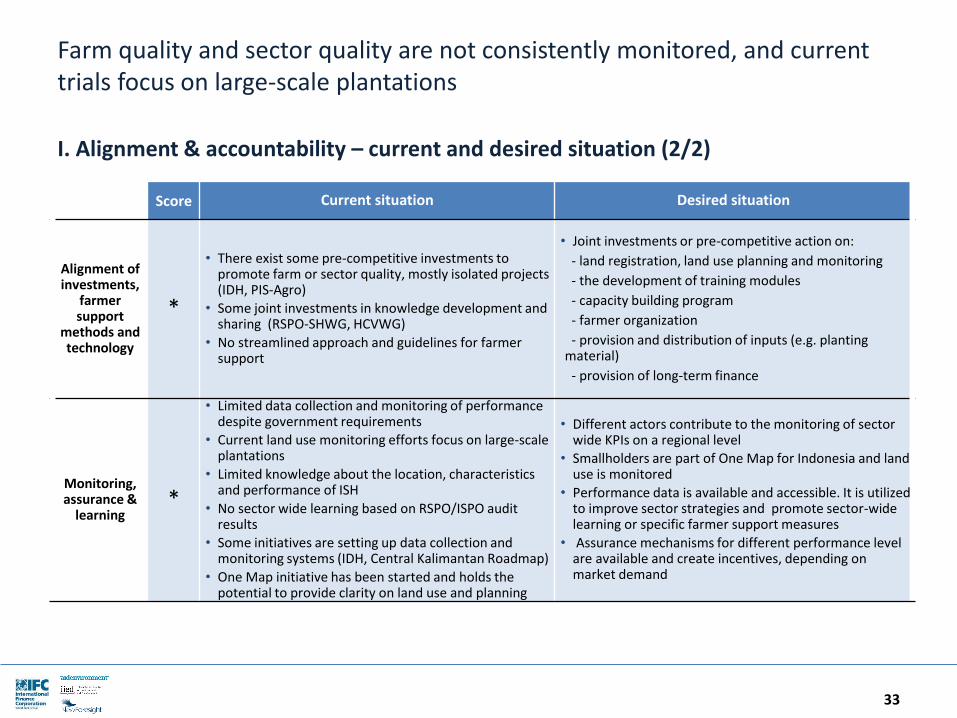
Farm quality and sector quality are not consistently monitored, and current trials focus on large-scale plantations
33
I. Alignment & accountability – current and desired situation (2/2)
Score Current situation Desired situation
Alignment of investments,
farmer support
methods and technology
*
• There exist some pre-competitive investments to promote farm or sector quality, mostly isolated projects (IDH, PIS-Agro)
• Some joint investments in knowledge development and sharing (RSPO-SHWG, HCVWG)
• No streamlined approach and guidelines for farmer support
• Joint investments or pre-competitive action on:
- land registration, land use planning and monitoring
- the development of training modules
- capacity building program
- farmer organization
- provision and distribution of inputs (e.g. planting material)
- provision of long-term finance
Monitoring, assurance &
learning*
• Limited data collection and monitoring of performance despite government requirements
• Current land use monitoring efforts focus on large-scale plantations
• Limited knowledge about the location, characteristics and performance of ISH
• No sector wide learning based on RSPO/ISPO audit results
• Some initiatives are setting up data collection and monitoring systems (IDH, Central Kalimantan Roadmap)
• One Map initiative has been started and holds the potential to provide clarity on land use and planning
• Different actors contribute to the monitoring of sector wide KPIs on a regional level
• Smallholders are part of One Map for Indonesia and land use is monitored
• Performance data is available and accessible. It is utilized to improve sector strategies and promote sector-wide learning or specific farmer support measures
• Assurance mechanisms for different performance level are available and create incentives, depending on market demand
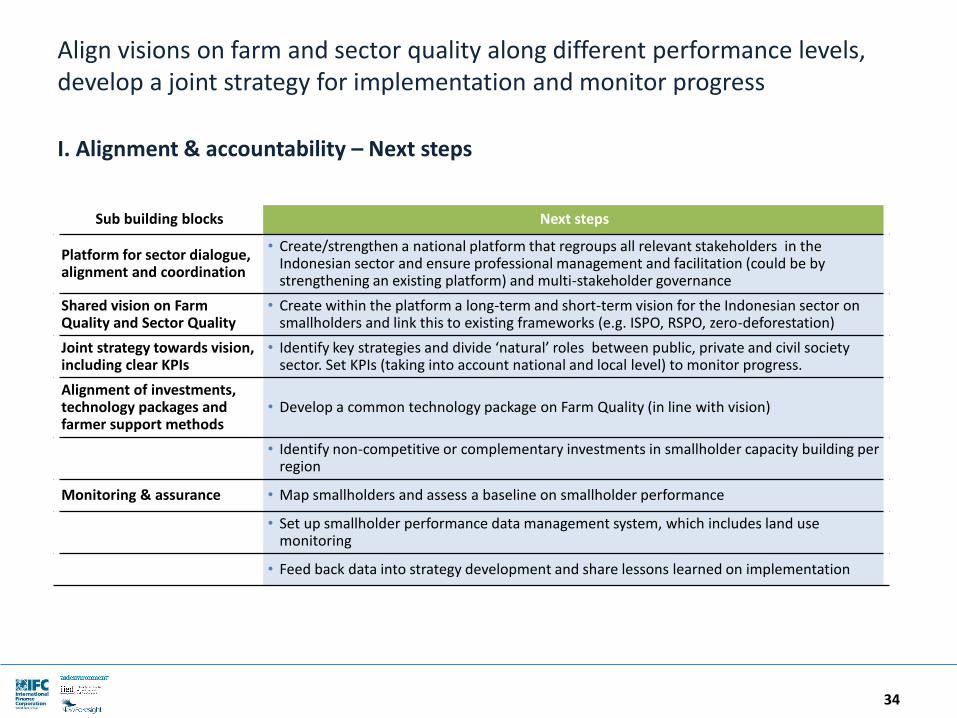
Align visions on farm and sector quality along different performance levels, develop a joint strategy for implementation and monitor progress
34
I. Alignment & accountability – Next steps
Sub building blocks Next steps
Platform for sector dialogue, alignment and coordination
• Create/strengthen a national platform that regroups all relevant stakeholders in the Indonesian sector and ensure professional management and facilitation (could be by strengthening an existing platform) and multi-stakeholder governance
Shared vision on Farm Quality and Sector Quality
• Create within the platform a long-term and short-term vision for the Indonesian sector on smallholders and link this to existing frameworks (e.g. ISPO, RSPO, zero-deforestation)
Joint strategy towards vision, including clear KPIs
• Identify key strategies and divide ‘natural’ roles between public, private and civil society sector. Set KPIs (taking into account national and local level) to monitor progress.
Alignment of investments, technology packages and farmer support methods
• Develop a common technology package on Farm Quality (in line with vision)
• Identify non-competitive or complementary investments in smallholder capacity building per region
Monitoring & assurance • Map smallholders and assess a baseline on smallholder performance
• Set up smallholder performance data management system, which includes land use monitoring
• Feed back data into strategy development and share lessons learned on implementation
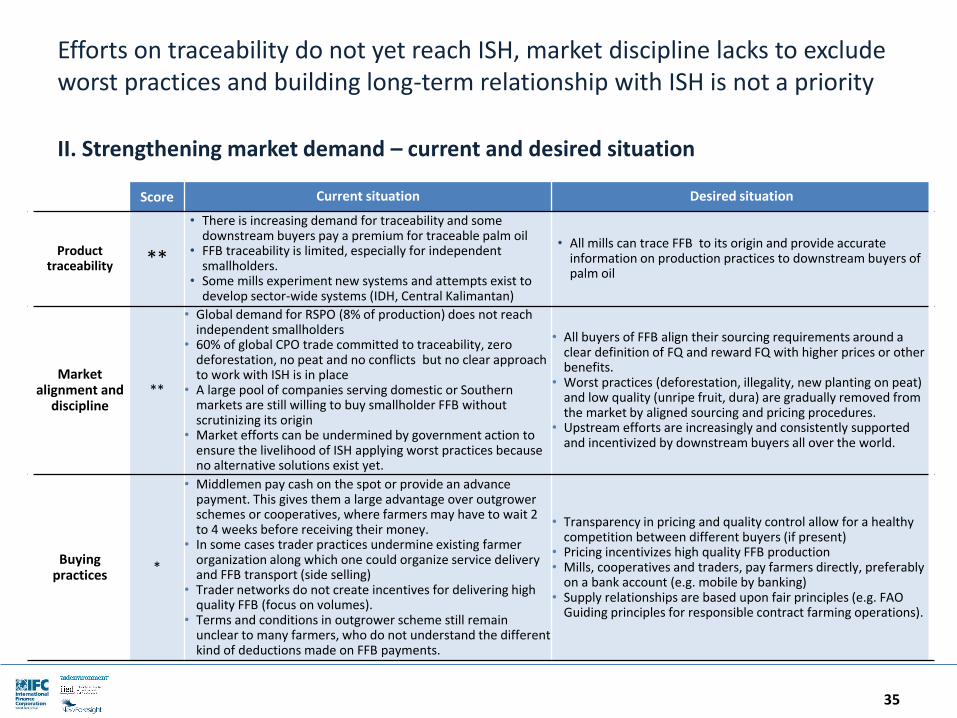
Efforts on traceability do not yet reach ISH, market discipline lacks to exclude worst practices and building long-term relationship with ISH is not a priority
35
II. Strengthening market demand – current and desired situation
Score Current situation Desired situation
Product traceability **
• There is increasing demand for traceability and some downstream buyers pay a premium for traceable palm oil
• FFB traceability is limited, especially for independent smallholders.
• Some mills experiment new systems and attempts exist to develop sector-wide systems (IDH, Central Kalimantan)
• All mills can trace FFB to its origin and provide accurate information on production practices to downstream buyers of palm oil
Market alignment and
discipline**
• Global demand for RSPO (8% of production) does not reach independent smallholders
• 60% of global CPO trade committed to traceability, zero deforestation, no peat and no conflicts but no clear approach to work with ISH is in place
• A large pool of companies serving domestic or Southern markets are still willing to buy smallholder FFB without scrutinizing its origin
• Market efforts can be undermined by government action to ensure the livelihood of ISH applying worst practices because no alternative solutions exist yet.
• All buyers of FFB align their sourcing requirements around a clear definition of FQ and reward FQ with higher prices or other benefits.
• Worst practices (deforestation, illegality, new planting on peat) and low quality (unripe fruit, dura) are gradually removed from the market by aligned sourcing and pricing procedures.
• Upstream efforts are increasingly and consistently supported and incentivized by downstream buyers all over the world.
Buying practices
*
• Middlemen pay cash on the spot or provide an advance payment. This gives them a large advantage over outgrowerschemes or cooperatives, where farmers may have to wait 2 to 4 weeks before receiving their money.
• In some cases trader practices undermine existing farmer organization along which one could organize service delivery and FFB transport (side selling)
• Trader networks do not create incentives for delivering high quality FFB (focus on volumes).
• Terms and conditions in outgrower scheme still remain unclear to many farmers, who do not understand the different kind of deductions made on FFB payments.
• Transparency in pricing and quality control allow for a healthy competition between different buyers (if present)
• Pricing incentivizes high quality FFB production• Mills, cooperatives and traders, pay farmers directly, preferably
on a bank account (e.g. mobile by banking)• Supply relationships are based upon fair principles (e.g. FAO
Guiding principles for responsible contract farming operations).
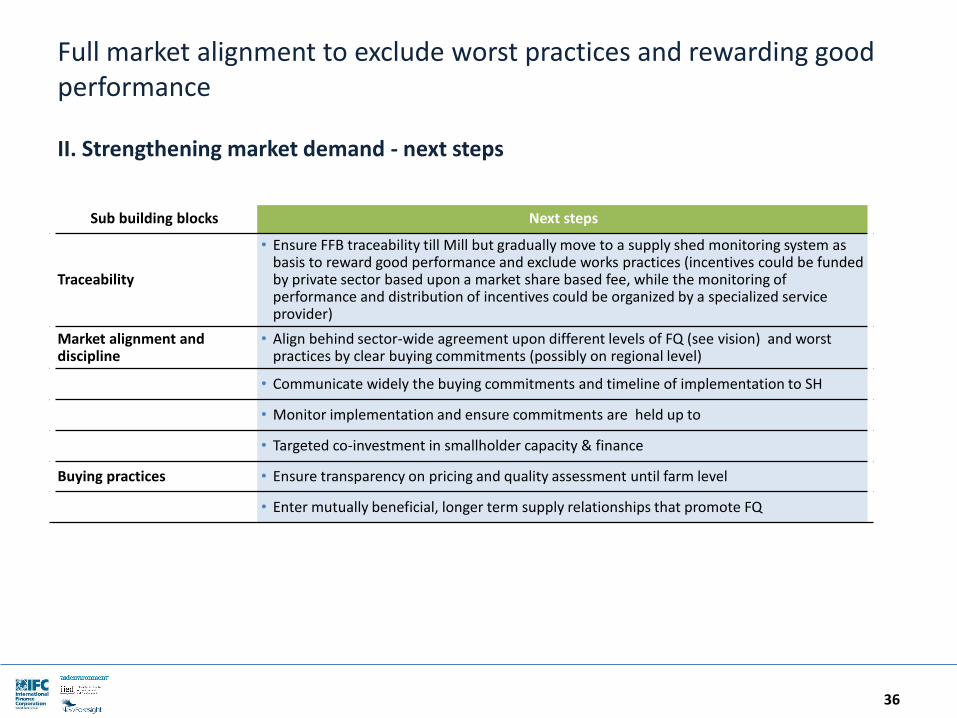
Full market alignment to exclude worst practices and rewarding good performance
36
II. Strengthening market demand - next steps
Sub building blocks Next steps
Traceability
• Ensure FFB traceability till Mill but gradually move to a supply shed monitoring system as basis to reward good performance and exclude works practices (incentives could be funded by private sector based upon a market share based fee, while the monitoring of performance and distribution of incentives could be organized by a specialized service provider)
Market alignment and discipline
• Align behind sector-wide agreement upon different levels of FQ (see vision) and worst practices by clear buying commitments (possibly on regional level)
• Communicate widely the buying commitments and timeline of implementation to SH
• Monitor implementation and ensure commitments are held up to
• Targeted co-investment in smallholder capacity & finance
Buying practices • Ensure transparency on pricing and quality assessment until farm level
• Enter mutually beneficial, longer term supply relationships that promote FQ
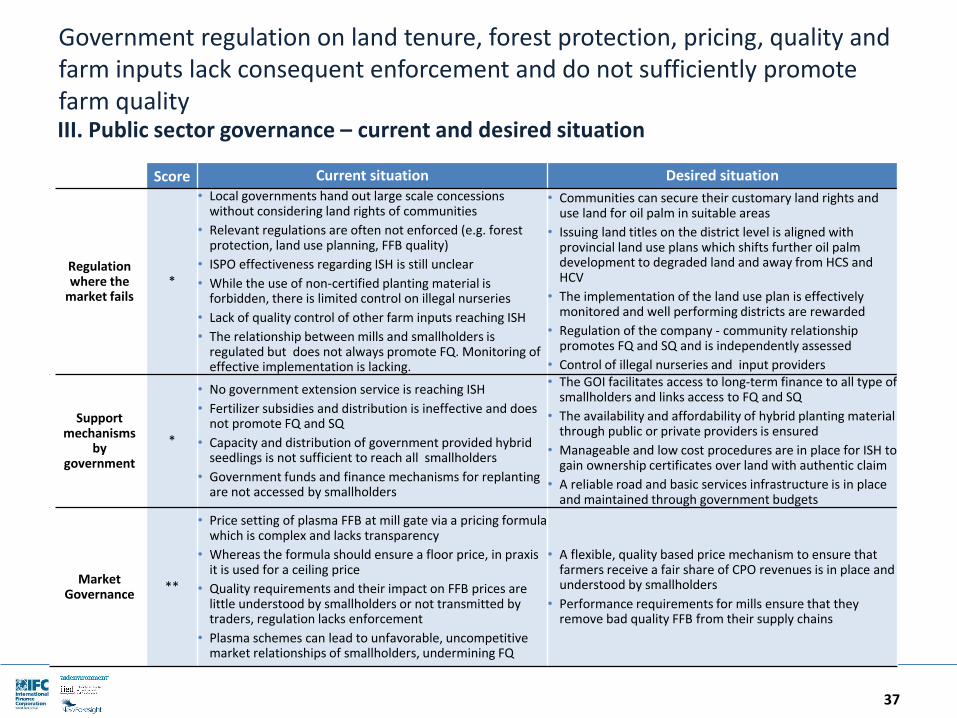
Government regulation on land tenure, forest protection, pricing, quality and farm inputs lack consequent enforcement and do not sufficiently promote farm quality
37
III. Public sector governance – current and desired situation
Score Current situation Desired situation
Regulation where the
market fails *
• Local governments hand out large scale concessions without considering land rights of communities
• Relevant regulations are often not enforced (e.g. forest protection, land use planning, FFB quality)
• ISPO effectiveness regarding ISH is still unclear
• While the use of non-certified planting material is forbidden, there is limited control on illegal nurseries
• Lack of quality control of other farm inputs reaching ISH
• The relationship between mills and smallholders is regulated but does not always promote FQ. Monitoring of effective implementation is lacking.
• Communities can secure their customary land rights and use land for oil palm in suitable areas
• Issuing land titles on the district level is aligned with provincial land use plans which shifts further oil palm development to degraded land and away from HCS and HCV
• The implementation of the land use plan is effectively monitored and well performing districts are rewarded
• Regulation of the company - community relationshippromotes FQ and SQ and is independently assessed
• Control of illegal nurseries and input providers
Support mechanisms
by government
*
• No government extension service is reaching ISH
• Fertilizer subsidies and distribution is ineffective and does not promote FQ and SQ
• Capacity and distribution of government provided hybrid seedlings is not sufficient to reach all smallholders
• Government funds and finance mechanisms for replanting are not accessed by smallholders
• The GOI facilitates access to long-term finance to all type of smallholders and links access to FQ and SQ
• The availability and affordability of hybrid planting material through public or private providers is ensured
• Manageable and low cost procedures are in place for ISH to gain ownership certificates over land with authentic claim
• A reliable road and basic services infrastructure is in place and maintained through government budgets
Market Governance
**
• Price setting of plasma FFB at mill gate via a pricing formula which is complex and lacks transparency
• Whereas the formula should ensure a floor price, in praxis it is used for a ceiling price
• Quality requirements and their impact on FFB prices are little understood by smallholders or not transmitted by traders, regulation lacks enforcement
• Plasma schemes can lead to unfavorable, uncompetitive market relationships of smallholders, undermining FQ
• A flexible, quality based price mechanism to ensure that farmers receive a fair share of CPO revenues is in place and understood by smallholders
• Performance requirements for mills ensure that they remove bad quality FFB from their supply chains
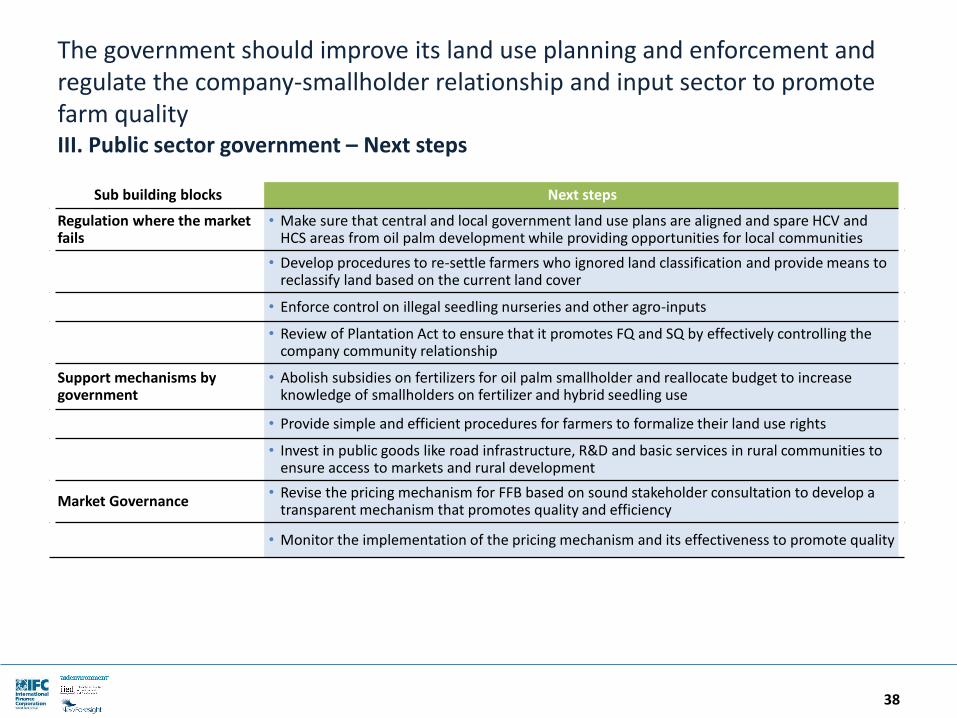
The government should improve its land use planning and enforcement and regulate the company-smallholder relationship and input sector to promote farm quality
38
III. Public sector government – Next steps
Sub building blocks Next steps
Regulation where the market fails
• Make sure that central and local government land use plans are aligned and spare HCV and HCS areas from oil palm development while providing opportunities for local communities
• Develop procedures to re-settle farmers who ignored land classification and provide means to reclassify land based on the current land cover
• Enforce control on illegal seedling nurseries and other agro-inputs
• Review of Plantation Act to ensure that it promotes FQ and SQ by effectively controlling the company community relationship
Support mechanisms by government
• Abolish subsidies on fertilizers for oil palm smallholder and reallocate budget to increase knowledge of smallholders on fertilizer and hybrid seedling use
• Provide simple and efficient procedures for farmers to formalize their land use rights
• Invest in public goods like road infrastructure, R&D and basic services in rural communities to ensure access to markets and rural development
Market Governance• Revise the pricing mechanism for FFB based on sound stakeholder consultation to develop a
transparent mechanism that promotes quality and efficiency
• Monitor the implementation of the pricing mechanism and its effectiveness to promote quality
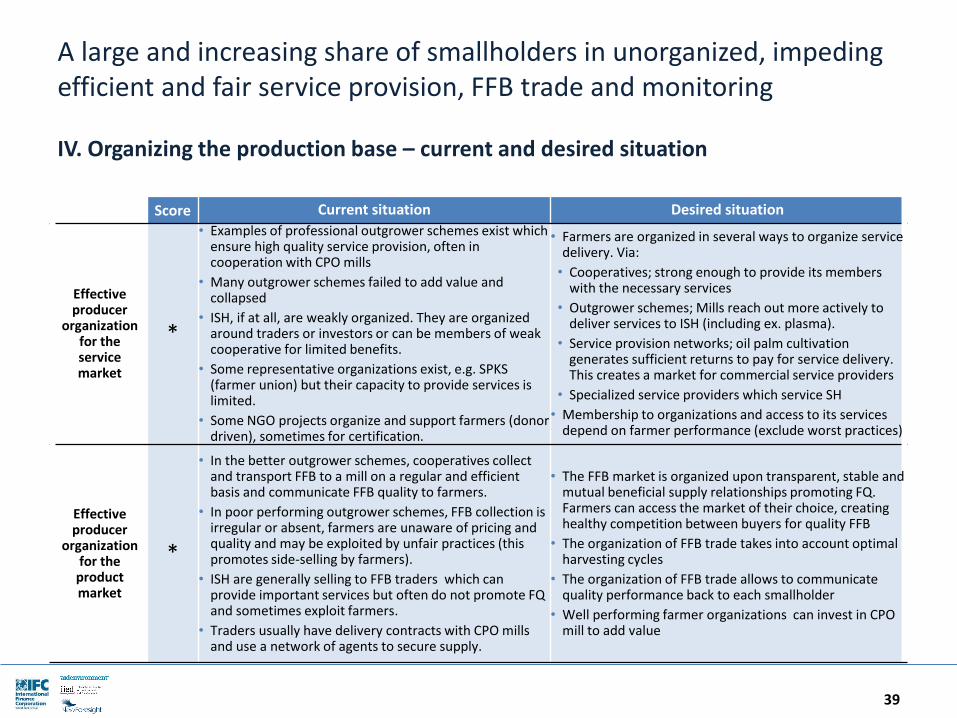
A large and increasing share of smallholders in unorganized, impeding efficient and fair service provision, FFB trade and monitoring
39
IV. Organizing the production base – current and desired situation
Score Current situation Desired situation
Effective producer
organization for the service market
*
• Examples of professional outgrower schemes exist which ensure high quality service provision, often in cooperation with CPO mills
• Many outgrower schemes failed to add value and collapsed
• ISH, if at all, are weakly organized. They are organized around traders or investors or can be members of weak cooperative for limited benefits.
• Some representative organizations exist, e.g. SPKS (farmer union) but their capacity to provide services is limited.
• Some NGO projects organize and support farmers (donor driven), sometimes for certification.
• Farmers are organized in several ways to organize service delivery. Via:
• Cooperatives; strong enough to provide its members with the necessary services
• Outgrower schemes; Mills reach out more actively to deliver services to ISH (including ex. plasma).
• Service provision networks; oil palm cultivation generates sufficient returns to pay for service delivery. This creates a market for commercial service providers
• Specialized service providers which service SH
• Membership to organizations and access to its services depend on farmer performance (exclude worst practices)
Effective producer
organization for the
product market
*
• In the better outgrower schemes, cooperatives collectand transport FFB to a mill on a regular and efficient basis and communicate FFB quality to farmers.
• In poor performing outgrower schemes, FFB collection is irregular or absent, farmers are unaware of pricing and quality and may be exploited by unfair practices (this promotes side-selling by farmers).
• ISH are generally selling to FFB traders which can provide important services but often do not promote FQ and sometimes exploit farmers.
• Traders usually have delivery contracts with CPO mills and use a network of agents to secure supply.
• The FFB market is organized upon transparent, stable and mutual beneficial supply relationships promoting FQ. Farmers can access the market of their choice, creating healthy competition between buyers for quality FFB
• The organization of FFB trade takes into account optimal harvesting cycles
• The organization of FFB trade allows to communicate quality performance back to each smallholder
• Well performing farmer organizations can invest in CPO mill to add value
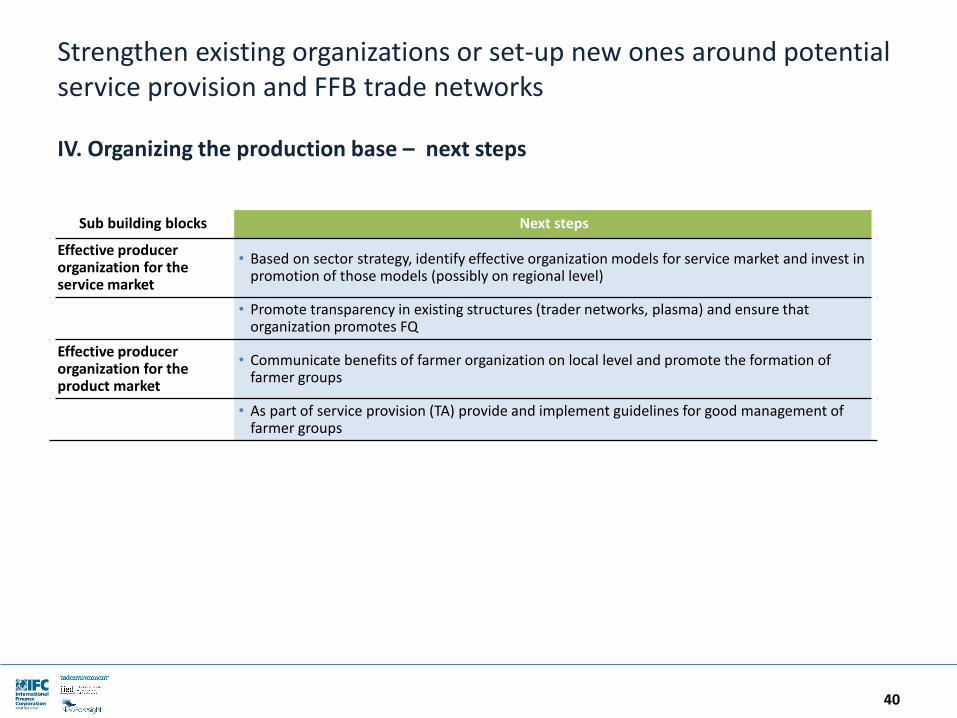
Strengthen existing organizations or set-up new ones around potential service provision and FFB trade networks
40
IV. Organizing the production base – next steps
Sub building blocks Next steps
Effective producer organization for the service market
• Based on sector strategy, identify effective organization models for service market and invest in promotion of those models (possibly on regional level)
• Promote transparency in existing structures (trader networks, plasma) and ensure that organization promotes FQ
Effective producer organization for the product market
• Communicate benefits of farmer organization on local level and promote the formation of farmer groups
• As part of service provision (TA) provide and implement guidelines for good management of farmer groups
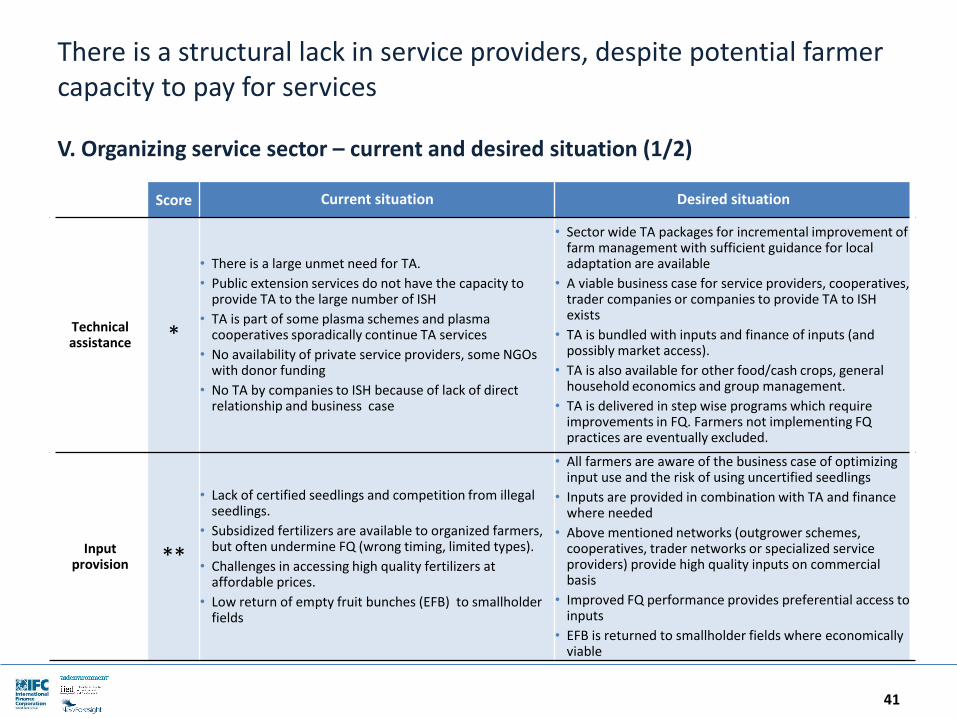
There is a structural lack in service providers, despite potential farmer capacity to pay for services
41
V. Organizing service sector – current and desired situation (1/2)
Score Current situation Desired situation
Technical assistance *
• There is a large unmet need for TA.
• Public extension services do not have the capacity to provide TA to the large number of ISH
• TA is part of some plasma schemes and plasma cooperatives sporadically continue TA services
• No availability of private service providers, some NGOs with donor funding
• No TA by companies to ISH because of lack of direct relationship and business case
• Sector wide TA packages for incremental improvement of farm management with sufficient guidance for local adaptation are available
• A viable business case for service providers, cooperatives, trader companies or companies to provide TA to ISH exists
• TA is bundled with inputs and finance of inputs (and possibly market access).
• TA is also available for other food/cash crops, general household economics and group management.
• TA is delivered in step wise programs which require improvements in FQ. Farmers not implementing FQ practices are eventually excluded.
Input provision **
• Lack of certified seedlings and competition from illegal seedlings.
• Subsidized fertilizers are available to organized farmers, but often undermine FQ (wrong timing, limited types).
• Challenges in accessing high quality fertilizers at affordable prices.
• Low return of empty fruit bunches (EFB) to smallholder fields
• All farmers are aware of the business case of optimizing input use and the risk of using uncertified seedlings
• Inputs are provided in combination with TA and finance where needed
• Above mentioned networks (outgrower schemes, cooperatives, trader networks or specialized service providers) provide high quality inputs on commercial basis
• Improved FQ performance provides preferential access to inputs
• EFB is returned to smallholder fields where economically viable
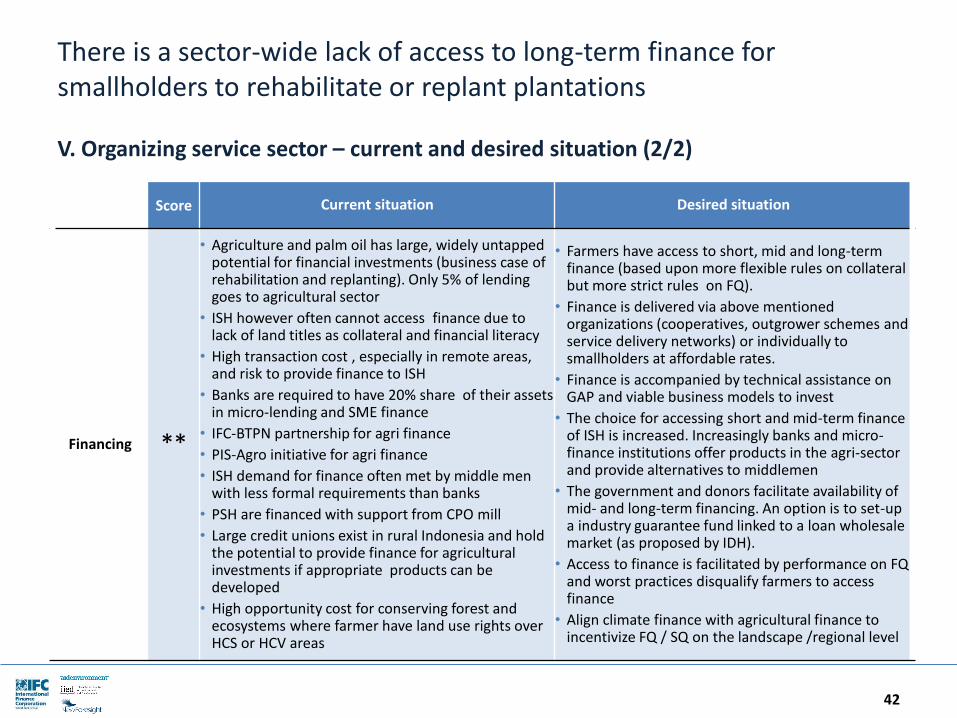
There is a sector-wide lack of access to long-term finance for smallholders to rehabilitate or replant plantations
42
V. Organizing service sector – current and desired situation (2/2)
Score Current situation Desired situation
Financing **
• Agriculture and palm oil has large, widely untapped potential for financial investments (business case of rehabilitation and replanting). Only 5% of lending goes to agricultural sector
• ISH however often cannot access finance due to lack of land titles as collateral and financial literacy
• High transaction cost , especially in remote areas, and risk to provide finance to ISH
• Banks are required to have 20% share of their assets in micro-lending and SME finance
• IFC-BTPN partnership for agri finance
• PIS-Agro initiative for agri finance
• ISH demand for finance often met by middle men with less formal requirements than banks
• PSH are financed with support from CPO mill
• Large credit unions exist in rural Indonesia and hold the potential to provide finance for agricultural investments if appropriate products can be developed
• High opportunity cost for conserving forest and ecosystems where farmer have land use rights over HCS or HCV areas
• Farmers have access to short, mid and long-term finance (based upon more flexible rules on collateral but more strict rules on FQ).
• Finance is delivered via above mentioned organizations (cooperatives, outgrower schemes and service delivery networks) or individually to smallholders at affordable rates.
• Finance is accompanied by technical assistance on GAP and viable business models to invest
• The choice for accessing short and mid-term finance of ISH is increased. Increasingly banks and micro-finance institutions offer products in the agri-sector and provide alternatives to middlemen
• The government and donors facilitate availability of mid- and long-term financing. An option is to set-up a industry guarantee fund linked to a loan wholesale market (as proposed by IDH).
• Access to finance is facilitated by performance on FQ and worst practices disqualify farmers to access finance
• Align climate finance with agricultural finance to incentivize FQ / SQ on the landscape /regional level
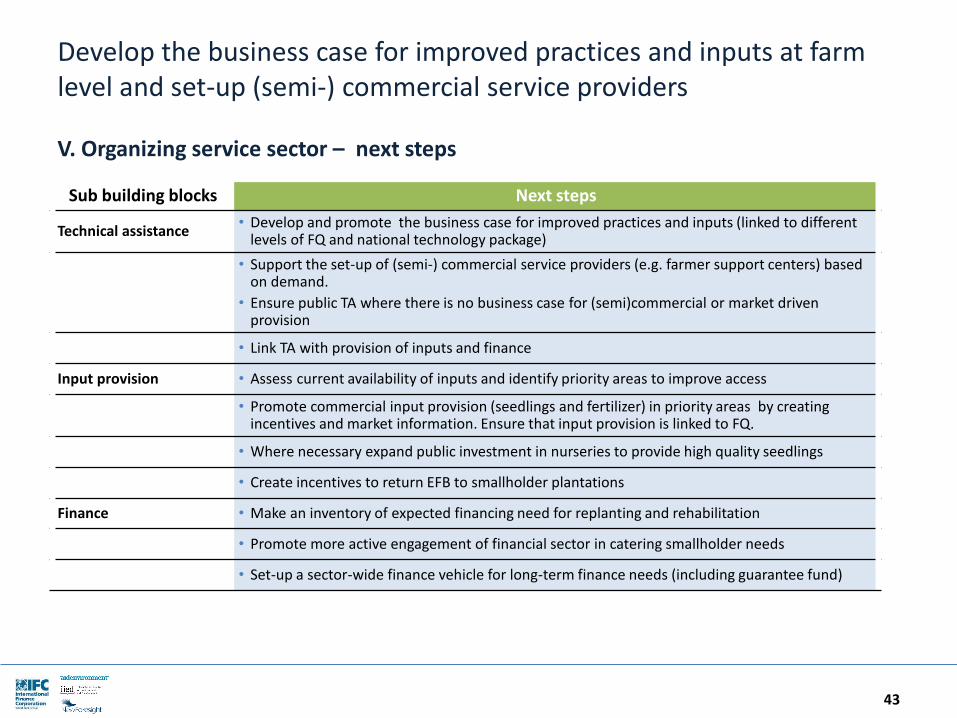
Develop the business case for improved practices and inputs at farm level and set-up (semi-) commercial service providers
43
V. Organizing service sector – next steps
Sub building blocks Next steps
Technical assistance• Develop and promote the business case for improved practices and inputs (linked to different
levels of FQ and national technology package)
• Support the set-up of (semi-) commercial service providers (e.g. farmer support centers) based on demand.
• Ensure public TA where there is no business case for (semi)commercial or market driven provision
• Link TA with provision of inputs and finance
Input provision • Assess current availability of inputs and identify priority areas to improve access
• Promote commercial input provision (seedlings and fertilizer) in priority areas by creating incentives and market information. Ensure that input provision is linked to FQ.
• Where necessary expand public investment in nurseries to provide high quality seedlings
• Create incentives to return EFB to smallholder plantations
Finance • Make an inventory of expected financing need for replanting and rehabilitation
• Promote more active engagement of financial sector in catering smallholder needs
• Set-up a sector-wide finance vehicle for long-term finance needs (including guarantee fund)
Table of contents
44
Introduction
The Sustainable Sector Transformation Model
Case study – Palm oil in Indonesia
Sector profile
Gap analysis
Priority steps & business case
Appendix – the Sustainable Sector Scorecard
Rapid transformation of the market will affect smallholders but initiatives to improve their performance on a large scale are lacking
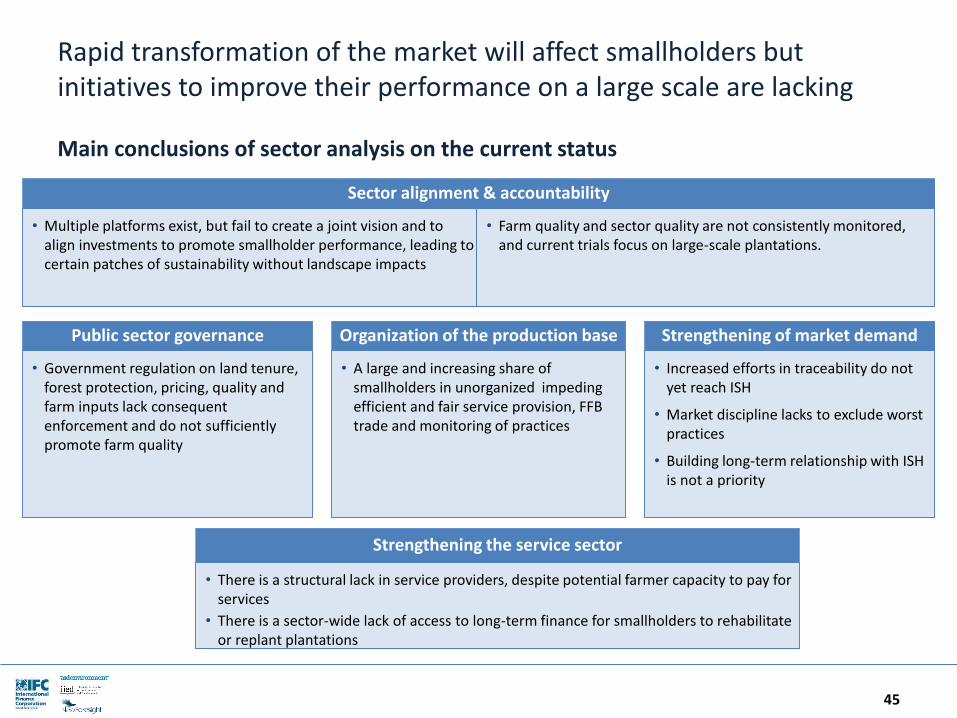
45
Main conclusions of sector analysis on the current status
Sector alignment & accountability
• Multiple platforms exist, but fail to create a joint vision and to align investments to promote smallholder performance, leading to certain patches of sustainability without landscape impacts
Public sector governance
• Government regulation on land tenure, forest protection, pricing, quality and farm inputs lack consequent enforcement and do not sufficiently promote farm quality
Strengthening of market demandOrganization of the production base
• A large and increasing share of smallholders in unorganized impeding efficient and fair service provision, FFB trade and monitoring of practices
• Increased efforts in traceability do not yet reach ISH
• Market discipline lacks to exclude worst practices
• Building long-term relationship with ISH is not a priority
Strengthening the service sector
• There is a structural lack in service providers, despite potential farmer capacity to pay for services
• There is a sector-wide lack of access to long-term finance for smallholders to rehabilitate or replant plantations
• Farm quality and sector quality are not consistently monitored, and current trials focus on large-scale plantations.
The sector needs to align itself behind a common agenda, invest in service provision and to materialize the business case for farm quality
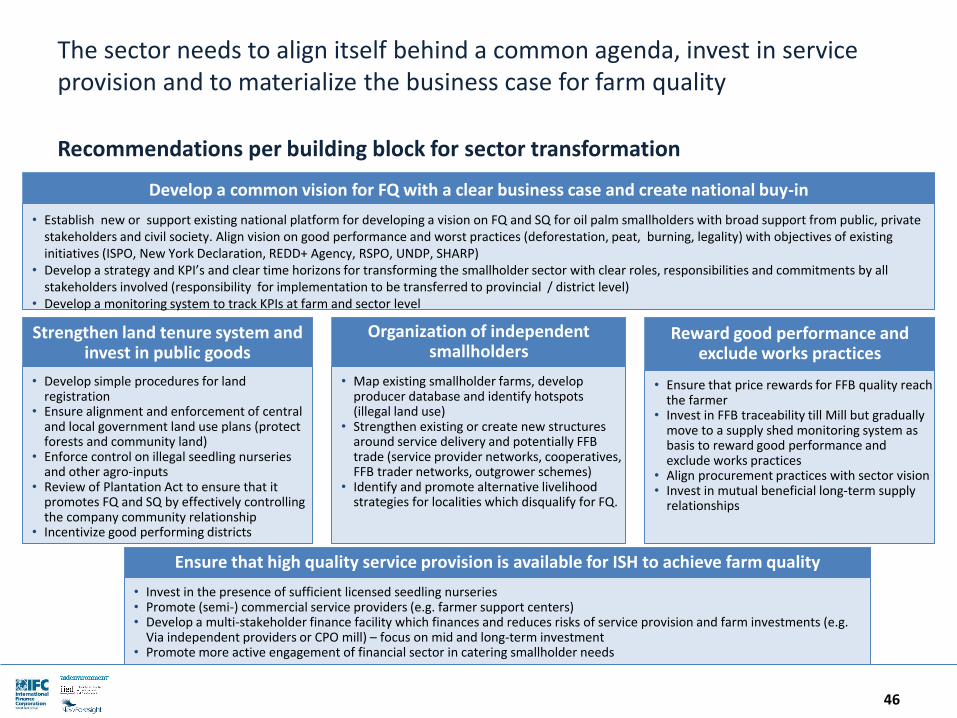
46
Develop a common vision for FQ with a clear business case and create national buy-in
• Establish new or support existing national platform for developing a vision on FQ and SQ for oil palm smallholders with broad support from public, private stakeholders and civil society. Align vision on good performance and worst practices (deforestation, peat, burning, legality) with objectives of existing initiatives (ISPO, New York Declaration, REDD+ Agency, RSPO, UNDP, SHARP)
• Develop a strategy and KPI’s and clear time horizons for transforming the smallholder sector with clear roles, responsibilities and commitments by all stakeholders involved (responsibility for implementation to be transferred to provincial / district level)
• Develop a monitoring system to track KPIs at farm and sector level
Strengthen land tenure system and invest in public goods
• Develop simple procedures for land registration
• Ensure alignment and enforcement of central and local government land use plans (protect forests and community land)
• Enforce control on illegal seedling nurseries and other agro-inputs
• Review of Plantation Act to ensure that it promotes FQ and SQ by effectively controlling the company community relationship
• Incentivize good performing districts
Reward good performance and exclude works practices
Organization of independent smallholders
• Map existing smallholder farms, develop producer database and identify hotspots (illegal land use)
• Strengthen existing or create new structures around service delivery and potentially FFB trade (service provider networks, cooperatives, FFB trader networks, outgrower schemes)
• Identify and promote alternative livelihood strategies for localities which disqualify for FQ.
• Ensure that price rewards for FFB quality reach the farmer
• Invest in FFB traceability till Mill but gradually move to a supply shed monitoring system as basis to reward good performance and exclude works practices
• Align procurement practices with sector vision• Invest in mutual beneficial long-term supply
relationships
Ensure that high quality service provision is available for ISH to achieve farm quality
• Invest in the presence of sufficient licensed seedling nurseries • Promote (semi-) commercial service providers (e.g. farmer support centers) • Develop a multi-stakeholder finance facility which finances and reduces risks of service provision and farm investments (e.g.
Via independent providers or CPO mill) – focus on mid and long-term investment• Promote more active engagement of financial sector in catering smallholder needs
Recommendations per building block for sector transformation
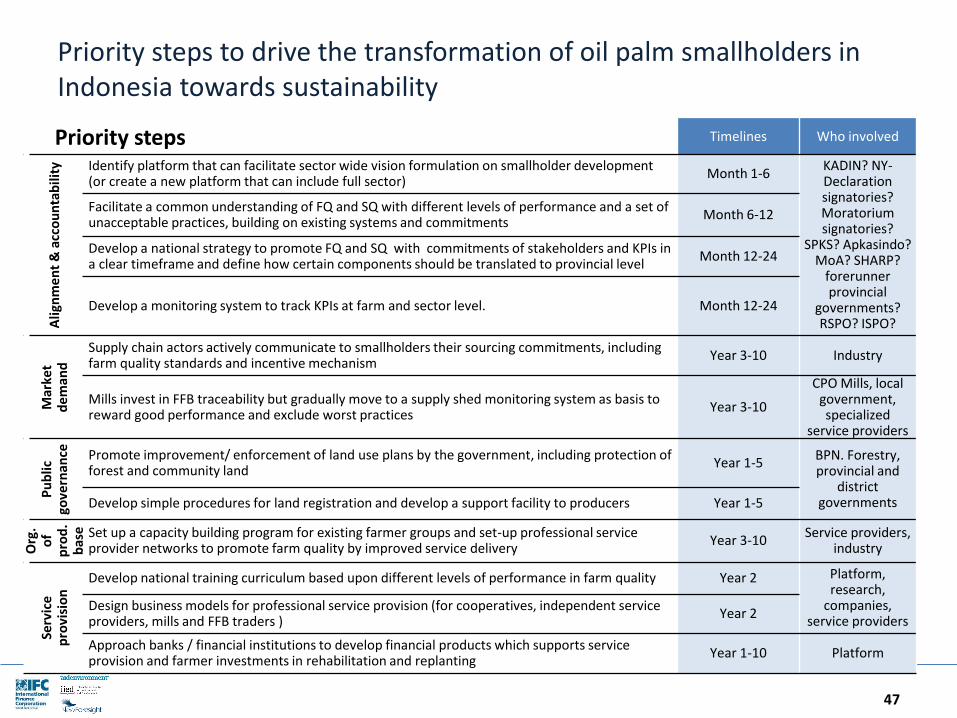
Priority steps to drive the transformation of oil palm smallholders in Indonesia towards sustainability
47
Timelines Who involved
Ali
gnm
en
t &
acc
ou
nta
bili
ty Identify platform that can facilitate sector wide vision formulation on smallholder development (or create a new platform that can include full sector)
Month 1-6KADIN? NY-Declarationsignatories? Moratorium signatories?
SPKS? Apkasindo? MoA? SHARP?
forerunner provincial
governments? RSPO? ISPO?
Facilitate a common understanding of FQ and SQ with different levels of performance and a set of unacceptable practices, building on existing systems and commitments
Month 6-12
Develop a national strategy to promote FQ and SQ with commitments of stakeholders and KPIs in a clear timeframe and define how certain components should be translated to provincial level
Month 12-24
Develop a monitoring system to track KPIs at farm and sector level. Month 12-24
Mar
ket
dem
and
Supply chain actors actively communicate to smallholders their sourcing commitments, including farm quality standards and incentive mechanism
Year 3-10 Industry
Mills invest in FFB traceability but gradually move to a supply shed monitoring system as basis to reward good performance and exclude worst practices
Year 3-10
CPO Mills, local government, specialized
service providers
Pu
blic
go
vern
ance Promote improvement/ enforcement of land use plans by the government, including protection of
forest and community landYear 1-5
BPN. Forestry, provincial and
district governmentsDevelop simple procedures for land registration and develop a support facility to producers Year 1-5
Org
. o
f p
rod
. b
ase Set up a capacity building program for existing farmer groups and set-up professional service
provider networks to promote farm quality by improved service deliveryYear 3-10
Service providers, industry
Serv
ice
p
rovi
sio
n
Develop national training curriculum based upon different levels of performance in farm quality Year 2 Platform, research,
companies,service providers
Design business models for professional service provision (for cooperatives, independent service providers, mills and FFB traders )
Year 2
Approach banks / financial institutions to develop financial products which supports service provision and farmer investments in rehabilitation and replanting
Year 1-10 Platform
Priority steps
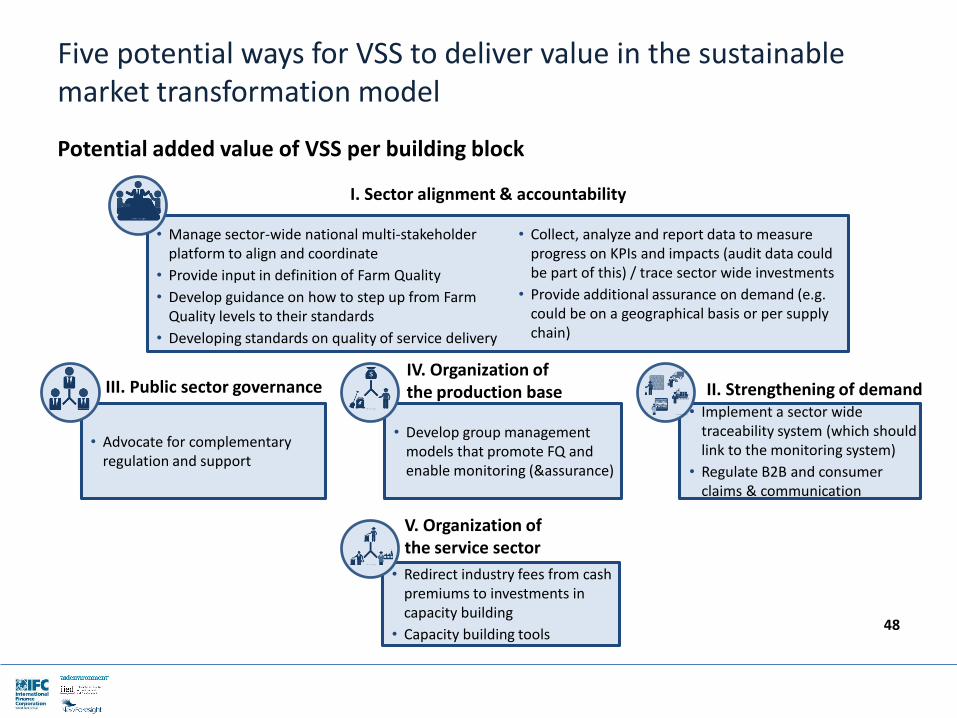
Five potential ways for VSS to deliver value in the sustainable market transformation model
48
Potential added value of VSS per building block
• Advocate for complementary regulation and support
• Develop group management models that promote FQ and enable monitoring (&assurance)
• Implement a sector wide traceability system (which should link to the monitoring system)
• Regulate B2B and consumer claims & communication
III. Public sector governance
• Redirect industry fees from cash premiums to investments in capacity building
• Capacity building tools
V. Organization of the service sector
I. Sector alignment & accountability
• Manage sector-wide national multi-stakeholder platform to align and coordinate
• Provide input in definition of Farm Quality
• Develop guidance on how to step up from Farm Quality levels to their standards
• Developing standards on quality of service delivery
• Collect, analyze and report data to measure progress on KPIs and impacts (audit data could be part of this) / trace sector wide investments
• Provide additional assurance on demand (e.g. could be on a geographical basis or per supply chain)
II. Strengthening of demandIV. Organization ofthe production base
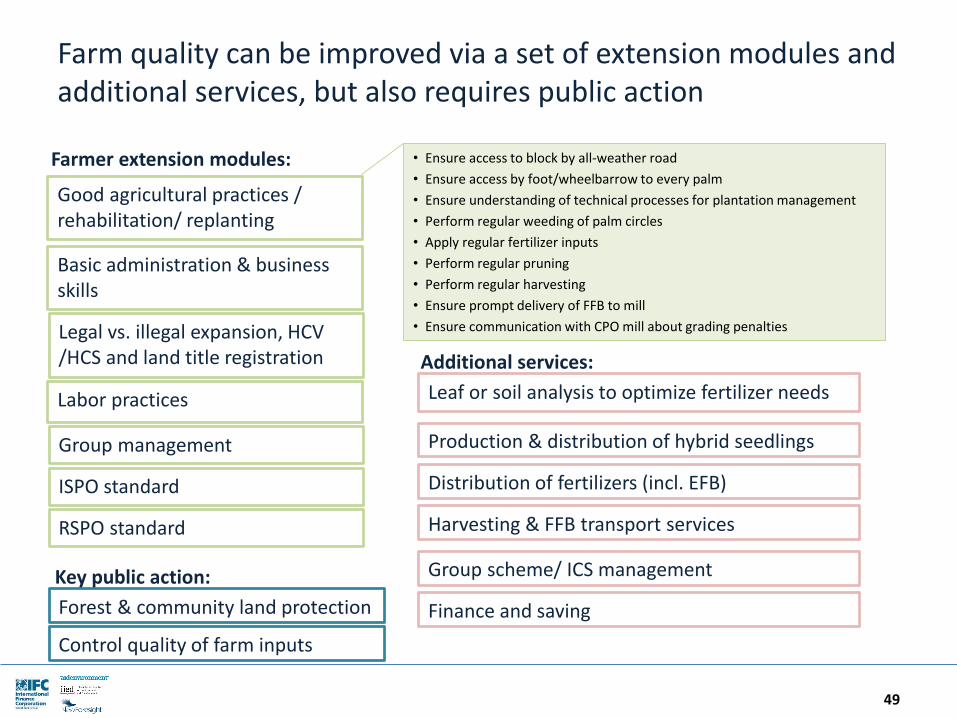
Farm quality can be improved via a set of extension modules and additional services, but also requires public action
• Ensure access to block by all-weather road
• Ensure access by foot/wheelbarrow to every palm
• Ensure understanding of technical processes for plantation management
• Perform regular weeding of palm circles
• Apply regular fertilizer inputs
• Perform regular pruning
• Perform regular harvesting
• Ensure prompt delivery of FFB to mill
• Ensure communication with CPO mill about grading penalties
49
Good agricultural practices / rehabilitation/ replanting
Basic administration & business skills
Labor practices
Legal vs. illegal expansion, HCV /HCS and land title registration
Farmer extension modules:
Leaf or soil analysis to optimize fertilizer needs
Production & distribution of hybrid seedlings
ISPO standard
RSPO standard
Forest & community land protection
Group scheme/ ICS management
Distribution of fertilizers (incl. EFB)
Harvesting & FFB transport services
Additional services:
Key public action:
Control quality of farm inputs
Group management
Finance and saving
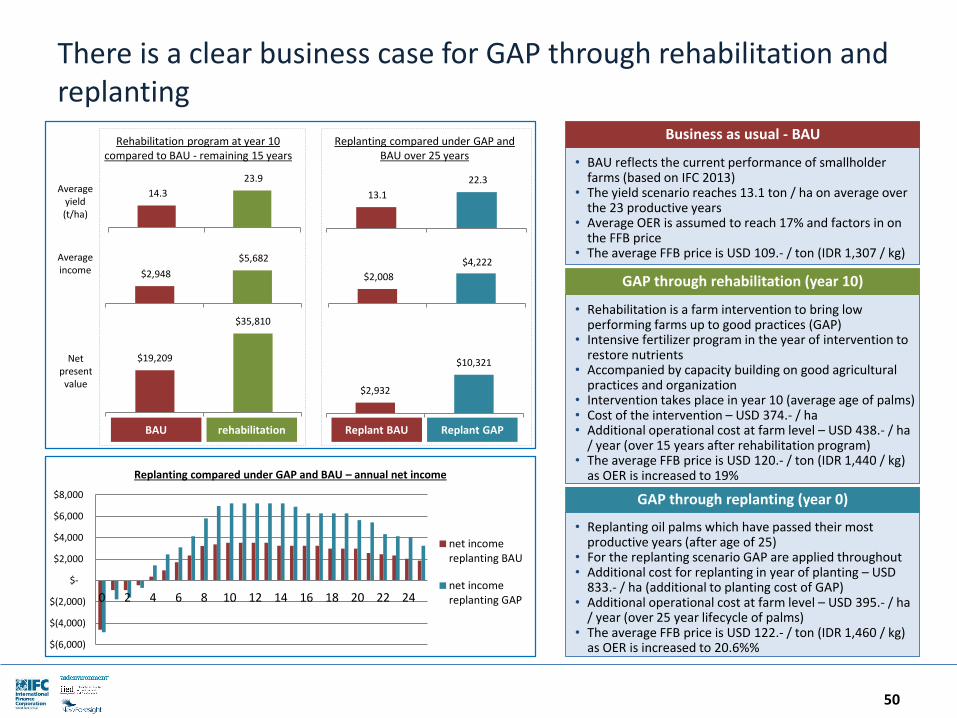
There is a clear business case for GAP through rehabilitation and replanting
50
• Rehabilitation is a farm intervention to bring low performing farms up to good practices (GAP)
• Intensive fertilizer program in the year of intervention to restore nutrients
• Accompanied by capacity building on good agricultural practices and organization
• Intervention takes place in year 10 (average age of palms)• Cost of the intervention – USD 374.- / ha• Additional operational cost at farm level – USD 438.- / ha
/ year (over 15 years after rehabilitation program)• The average FFB price is USD 120.- / ton (IDR 1,440 / kg)
as OER is increased to 19%
GAP through rehabilitation (year 10)
• BAU reflects the current performance of smallholder farms (based on IFC 2013)
• The yield scenario reaches 13.1 ton / ha on average over the 23 productive years
• Average OER is assumed to reach 17% and factors in on the FFB price
• The average FFB price is USD 109.- / ton (IDR 1,307 / kg)
Business as usual - BAU
• Replanting oil palms which have passed their most productive years (after age of 25)
• For the replanting scenario GAP are applied throughout• Additional cost for replanting in year of planting – USD
833.- / ha (additional to planting cost of GAP)• Additional operational cost at farm level – USD 395.- / ha
/ year (over 25 year lifecycle of palms)• The average FFB price is USD 122.- / ton (IDR 1,460 / kg)
as OER is increased to 20.6%%
GAP through replanting (year 0)
BAU rehabilitation
Average yield (t/ha)
Average income
Net present
value
$19,209
$35,810
$2,948
$5,682
14.3
23.9
Rehabilitation program at year 10 compared to BAU - remaining 15 years
Replanting compared under GAP and BAU over 25 years
Replant BAU Replant GAP
$2,932
$10,321
$2,008
$4,222
13.1
22.3
$(6,000)
$(4,000)
$(2,000)
$-
$2,000
$4,000
$6,000
$8,000
0 2 4 6 8 10 12 14 16 18 20 22 24
Replanting compared under GAP and BAU – annual net income
net incomereplanting BAU
net incomereplanting GAP
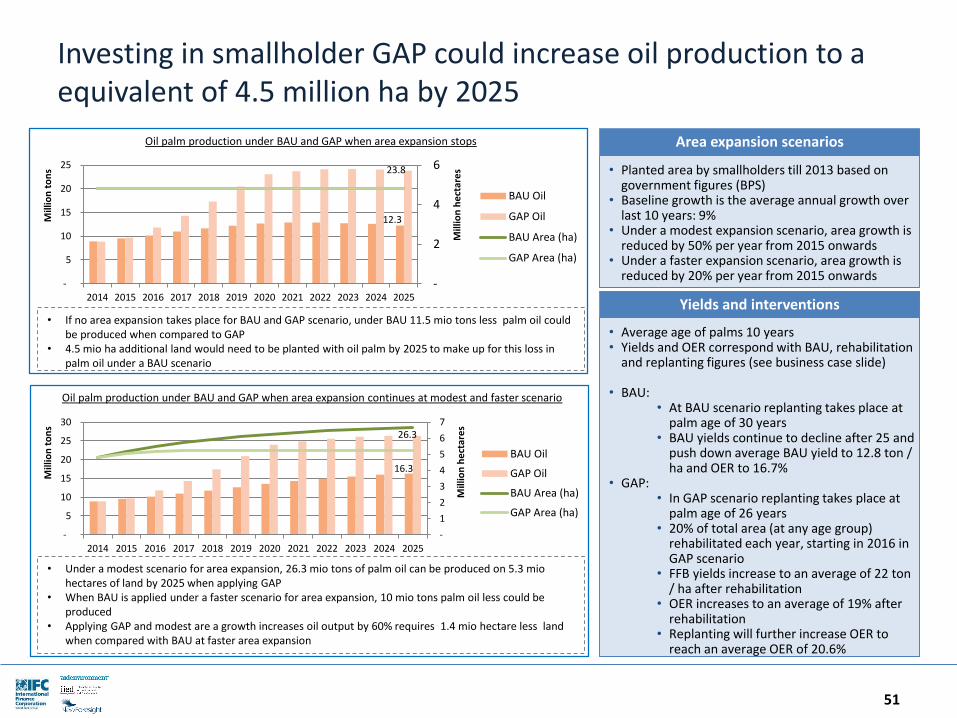
Investing in smallholder GAP could increase oil production to a equivalent of 4.5 million ha by 2025
51
Area expansion scenarios
• Planted area by smallholders till 2013 based on government figures (BPS)
• Baseline growth is the average annual growth over last 10 years: 9%
• Under a modest expansion scenario, area growth is reduced by 50% per year from 2015 onwards
• Under a faster expansion scenario, area growth is reduced by 20% per year from 2015 onwards
Yields and interventions
• Average age of palms 10 years• Yields and OER correspond with BAU, rehabilitation
and replanting figures (see business case slide)
• BAU:• At BAU scenario replanting takes place at
palm age of 30 years• BAU yields continue to decline after 25 and
push down average BAU yield to 12.8 ton / ha and OER to 16.7%
• GAP:• In GAP scenario replanting takes place at
palm age of 26 years• 20% of total area (at any age group)
rehabilitated each year, starting in 2016 in GAP scenario
• FFB yields increase to an average of 22 ton / ha after rehabilitation
• OER increases to an average of 19% after rehabilitation
• Replanting will further increase OER to reach an average OER of 20.6%
• Under a modest scenario for area expansion, 26.3 mio tons of palm oil can be produced on 5.3 miohectares of land by 2025 when applying GAP
• When BAU is applied under a faster scenario for area expansion, 10 mio tons palm oil less could be produced
• Applying GAP and modest are a growth increases oil output by 60% requires 1.4 mio hectare less land when compared with BAU at faster area expansion
-
1
2
3
4
5
6
7
-
5
10
15
20
25
30
2014 2015 2016 2017 2018 2019 2020 2021 2022 2023 2024 2025
Mill
ion
he
ctar
es
Mill
ion
to
ns
BAU Oil
GAP Oil
BAU Area (ha)
GAP Area (ha)
26.3
16.3
• If no area expansion takes place for BAU and GAP scenario, under BAU 11.5 mio tons less palm oil could be produced when compared to GAP
• 4.5 mio ha additional land would need to be planted with oil palm by 2025 to make up for this loss in palm oil under a BAU scenario
-
2
4
6
-
5
10
15
20
25
2014 2015 2016 2017 2018 2019 2020 2021 2022 2023 2024 2025
Mill
ion
he
ctar
es
Mill
ion
to
ns
BAU Oil
GAP Oil
BAU Area (ha)
GAP Area (ha)
23.8
12.3
Oil palm production under BAU and GAP when area expansion stops
Oil palm production under BAU and GAP when area expansion continues at modest and faster scenario
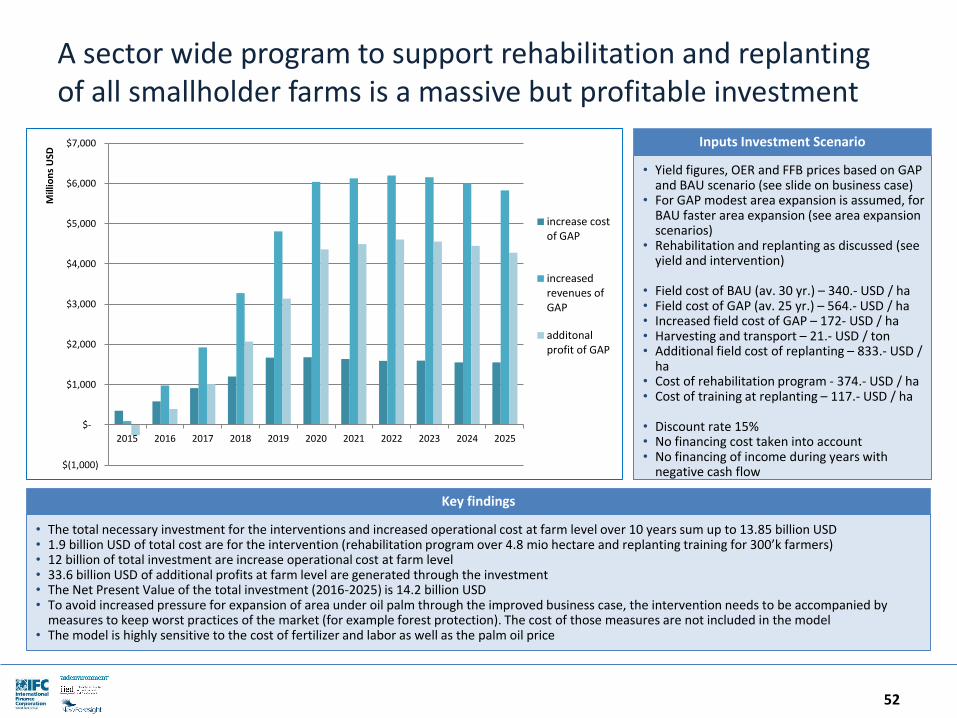
A sector wide program to support rehabilitation and replanting of all smallholder farms is a massive but profitable investment
52
Inputs Investment Scenario
• Yield figures, OER and FFB prices based on GAP and BAU scenario (see slide on business case)
• For GAP modest area expansion is assumed, for BAU faster area expansion (see area expansion scenarios)
• Rehabilitation and replanting as discussed (see yield and intervention)
• Field cost of BAU (av. 30 yr.) – 340.- USD / ha• Field cost of GAP (av. 25 yr.) – 564.- USD / ha• Increased field cost of GAP – 172- USD / ha• Harvesting and transport – 21.- USD / ton• Additional field cost of replanting – 833.- USD /
ha • Cost of rehabilitation program - 374.- USD / ha• Cost of training at replanting – 117.- USD / ha
• Discount rate 15%• No financing cost taken into account• No financing of income during years with
negative cash flow
• The total necessary investment for the interventions and increased operational cost at farm level over 10 years sum up to 13.85 billion USD• 1.9 billion USD of total cost are for the intervention (rehabilitation program over 4.8 mio hectare and replanting training for 300’k farmers) • 12 billion of total investment are increase operational cost at farm level• 33.6 billion USD of additional profits at farm level are generated through the investment• The Net Present Value of the total investment (2016-2025) is 14.2 billion USD• To avoid increased pressure for expansion of area under oil palm through the improved business case, the intervention needs to be accompanied by
measures to keep worst practices of the market (for example forest protection). The cost of those measures are not included in the model• The model is highly sensitive to the cost of fertilizer and labor as well as the palm oil price
Key findings
$(1,000)
$-
$1,000
$2,000
$3,000
$4,000
$5,000
$6,000
$7,000
2015 2016 2017 2018 2019 2020 2021 2022 2023 2024 2025
Mill
ion
s U
SD
increase costof GAP
increasedrevenues ofGAP
additonalprofit of GAP
Table of contents
53
Introduction
The Sustainable Sector Transformation Model
Case study – Palm oil in Indonesia
Appendix – the Sustainable Sector Scorecard
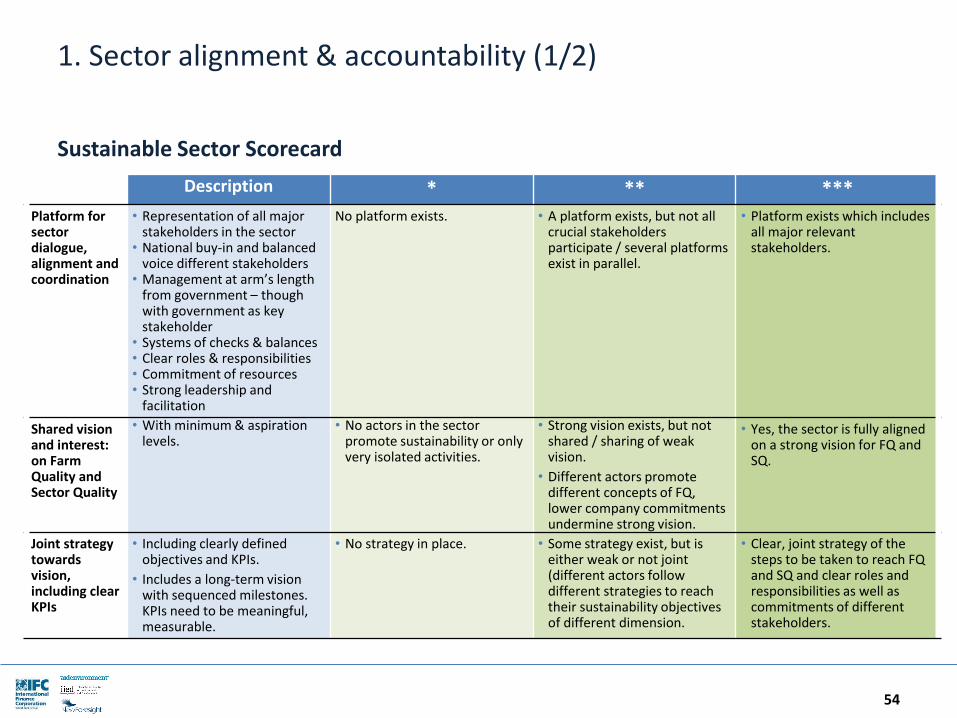
1. Sector alignment & accountability (1/2)
54
Sustainable Sector Scorecard
Description * ** ***Platform for sector dialogue, alignment and coordination
• Representation of all major stakeholders in the sector
• National buy-in and balanced voice different stakeholders
• Management at arm’s length from government – though with government as key stakeholder
• Systems of checks & balances• Clear roles & responsibilities • Commitment of resources• Strong leadership and
facilitation
No platform exists. • A platform exists, but not all crucial stakeholders participate / several platforms exist in parallel.
• Platform exists which includes all major relevant stakeholders.
Shared vision and interest: on Farm Quality and Sector Quality
• With minimum & aspiration levels.
• No actors in the sector promote sustainability or only very isolated activities.
• Strong vision exists, but not shared / sharing of weak vision.
• Different actors promote different concepts of FQ, lower company commitments undermine strong vision.
• Yes, the sector is fully aligned on a strong vision for FQ and SQ.
Joint strategy towards vision, including clear KPIs
• Including clearly defined objectives and KPIs.
• Includes a long-term vision with sequenced milestones. KPIs need to be meaningful, measurable.
• No strategy in place. • Some strategy exist, but is either weak or not joint (different actors follow different strategies to reach their sustainability objectives of different dimension.
• Clear, joint strategy of the steps to be taken to reach FQ and SQ and clear roles and responsibilities as well as commitments of different stakeholders.
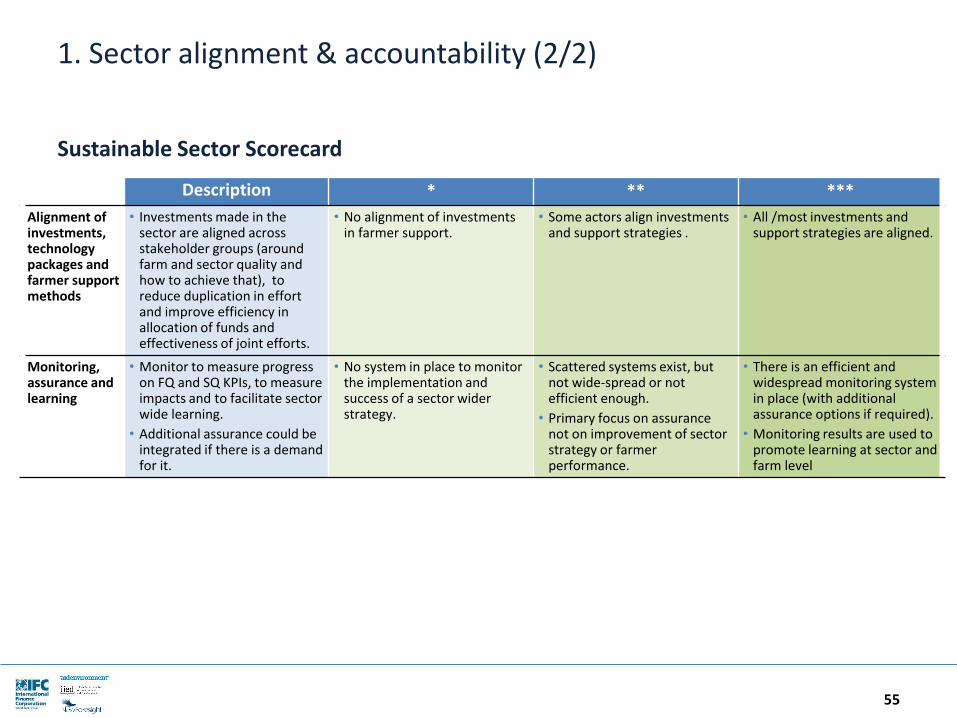
1. Sector alignment & accountability (2/2)
55
Sustainable Sector Scorecard
Description * ** ***
Alignment of investments, technology packages and farmer support methods
• Investments made in the sector are aligned across stakeholder groups (around farm and sector quality and how to achieve that), to reduce duplication in effort and improve efficiency in allocation of funds and effectiveness of joint efforts.
• No alignment of investments in farmer support.
• Some actors align investments and support strategies .
• All /most investments and support strategies are aligned.
Monitoring, assurance and learning
• Monitor to measure progress on FQ and SQ KPIs, to measure impacts and to facilitate sector wide learning.
• Additional assurance could be integrated if there is a demand for it.
• No system in place to monitor the implementation and success of a sector wider strategy.
• Scattered systems exist, but not wide-spread or not efficient enough.
• Primary focus on assurance not on improvement of sector strategy or farmer performance.
• There is an efficient and widespread monitoring system in place (with additional assurance options if required).
• Monitoring results are used to promote learning at sector and farm level
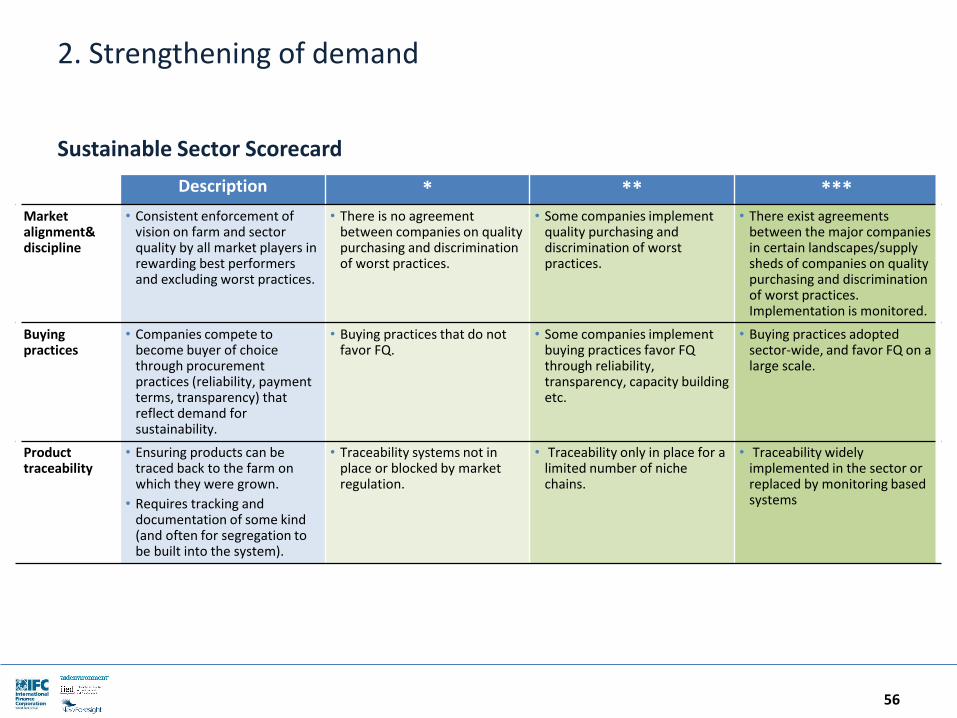
2. Strengthening of demand
56
Sustainable Sector Scorecard
Description * ** ***Market alignment& discipline
• Consistent enforcement of vision on farm and sector quality by all market players in rewarding best performers and excluding worst practices.
• There is no agreement between companies on quality purchasing and discrimination of worst practices.
• Some companies implement quality purchasing and discrimination of worst practices.
• There exist agreements between the major companies in certain landscapes/supply sheds of companies on quality purchasing and discrimination of worst practices. Implementation is monitored.
Buying practices
• Companies compete to become buyer of choice through procurement practices (reliability, payment terms, transparency) that reflect demand for sustainability.
• Buying practices that do not favor FQ.
• Some companies implement buying practices favor FQ through reliability, transparency, capacity building etc.
• Buying practices adopted sector-wide, and favor FQ on a large scale.
Product traceability
• Ensuring products can be traced back to the farm on which they were grown.
• Requires tracking and documentation of some kind (and often for segregation to be built into the system).
• Traceability systems not in place or blocked by market regulation.
• Traceability only in place for a limited number of niche chains.
• Traceability widely implemented in the sector or replaced by monitoring based systems
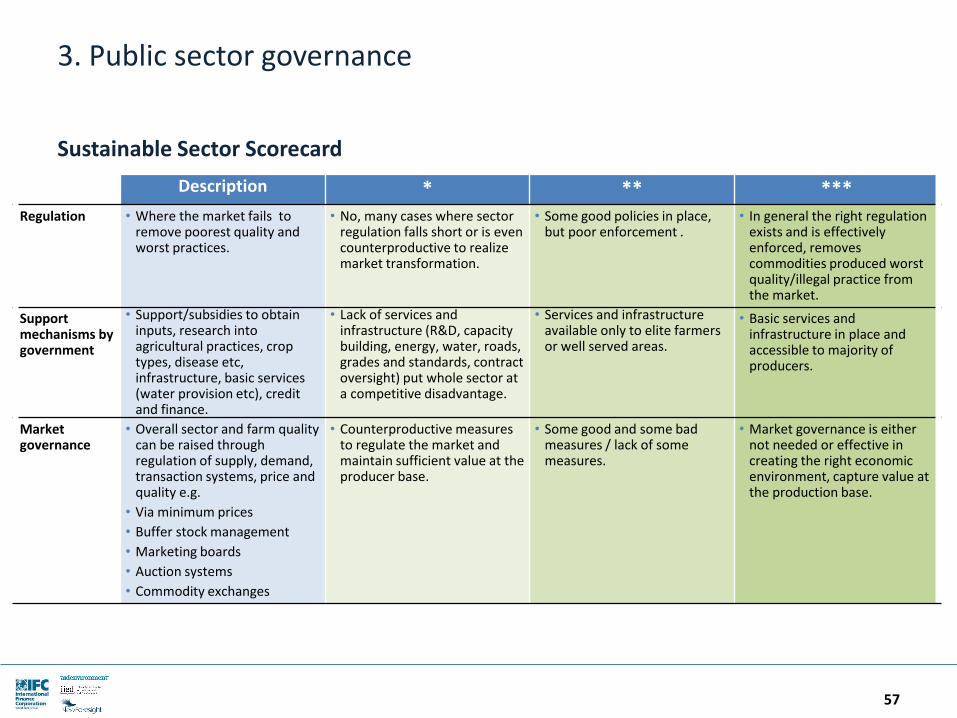
3. Public sector governance
57
Sustainable Sector Scorecard
Description * ** ***Regulation • Where the market fails to
remove poorest quality and worst practices.
• No, many cases where sector regulation falls short or is even counterproductive to realize market transformation.
• Some good policies in place, but poor enforcement .
• In general the right regulation exists and is effectively enforced, removes commodities produced worst quality/illegal practice from the market.
Support mechanisms by government
• Support/subsidies to obtain inputs, research into agricultural practices, crop types, disease etc, infrastructure, basic services (water provision etc), credit and finance.
• Lack of services and infrastructure (R&D, capacity building, energy, water, roads, grades and standards, contract oversight) put whole sector at a competitive disadvantage.
• Services and infrastructure available only to elite farmers or well served areas.
• Basic services and infrastructure in place and accessible to majority of producers.
Market governance
• Overall sector and farm quality can be raised through regulation of supply, demand, transaction systems, price and quality e.g.
• Via minimum prices
• Buffer stock management
• Marketing boards
• Auction systems
• Commodity exchanges
• Counterproductive measures to regulate the market and maintain sufficient value at the producer base.
• Some good and some bad measures / lack of some measures.
• Market governance is either not needed or effective in creating the right economic environment, capture value at the production base.
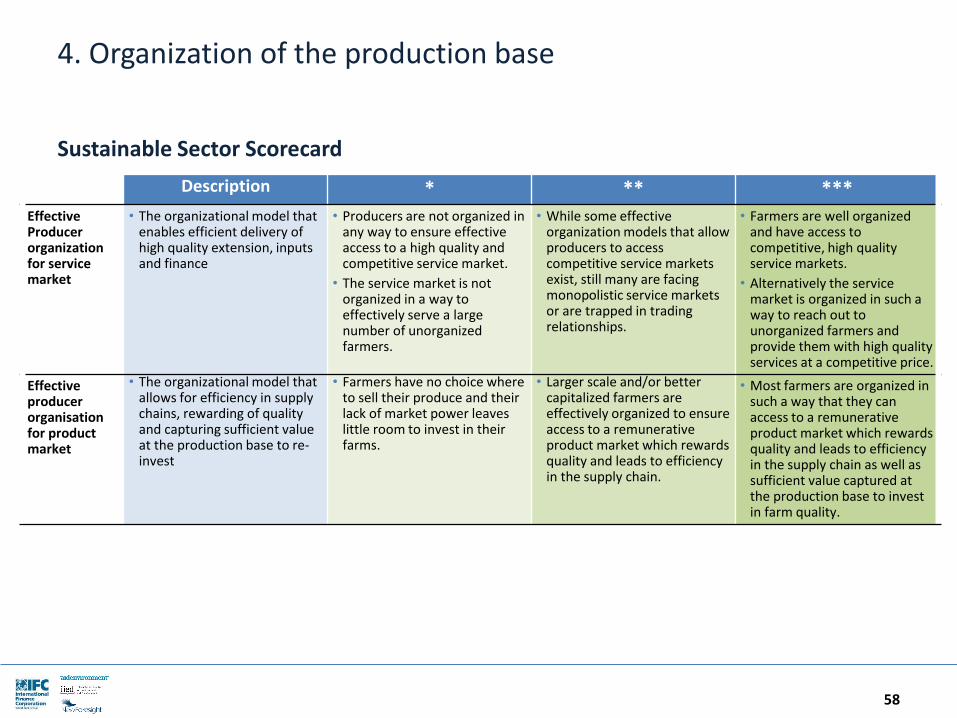
4. Organization of the production base
58
Sustainable Sector Scorecard
Description * ** ***Effective Producer organization for service market
• The organizational model that enables efficient delivery of high quality extension, inputs and finance
• Producers are not organized in any way to ensure effective access to a high quality and competitive service market.
• The service market is not organized in a way to effectively serve a large number of unorganized farmers.
• While some effective organization models that allow producers to access competitive service markets exist, still many are facing monopolistic service markets or are trapped in trading relationships.
• Farmers are well organized and have access to competitive, high quality service markets.
• Alternatively the service market is organized in such a way to reach out to unorganized farmers and provide them with high quality services at a competitive price.
Effective producer organisation for product market
• The organizational model that allows for efficiency in supply chains, rewarding of quality and capturing sufficient value at the production base to re-invest
• Farmers have no choice where to sell their produce and their lack of market power leaves little room to invest in their farms.
• Larger scale and/or better capitalized farmers are effectively organized to ensure access to a remunerative product market which rewards quality and leads to efficiency in the supply chain.
• Most farmers are organized in such a way that they can access to a remunerativeproduct market which rewards quality and leads to efficiency in the supply chain as well as sufficient value captured at the production base to invest in farm quality.
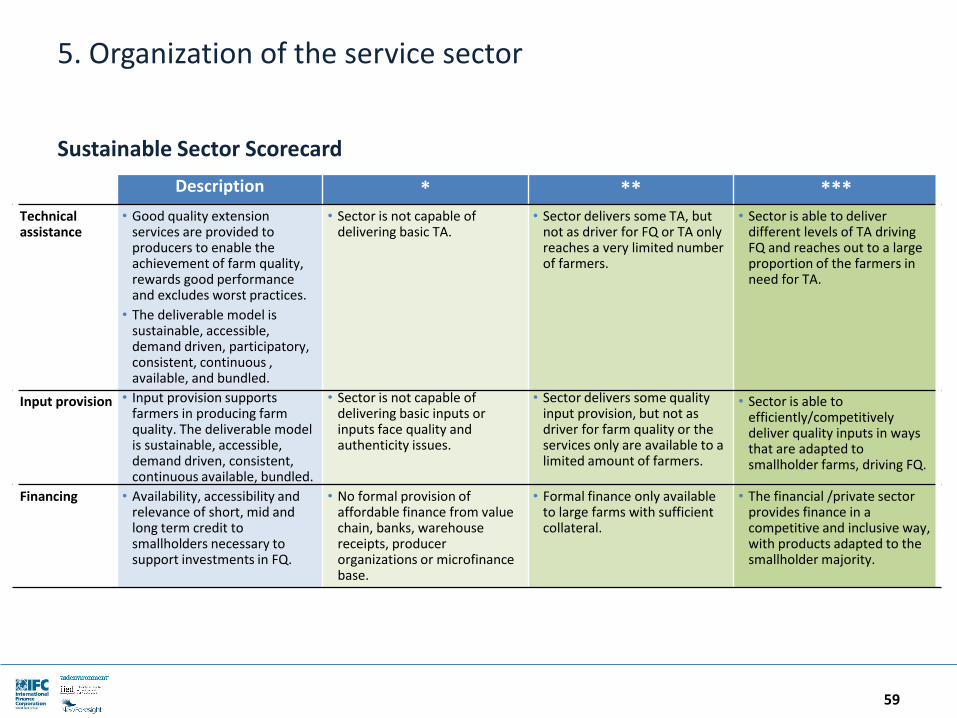
5. Organization of the service sector
59
Sustainable Sector Scorecard
Description * ** ***Technical assistance
• Good quality extension services are provided to producers to enable the achievement of farm quality, rewards good performance and excludes worst practices.
• The deliverable model is sustainable, accessible, demand driven, participatory, consistent, continuous , available, and bundled.
• Sector is not capable of delivering basic TA.
• Sector delivers some TA, but not as driver for FQ or TA only reaches a very limited number of farmers.
• Sector is able to deliver different levels of TA driving FQ and reaches out to a large proportion of the farmers in need for TA.
Input provision • Input provision supports farmers in producing farm quality. The deliverable model is sustainable, accessible, demand driven, consistent, continuous available, bundled.
• Sector is not capable of delivering basic inputs or inputs face quality and authenticity issues.
• Sector delivers some quality input provision, but not as driver for farm quality or the services only are available to a limited amount of farmers.
• Sector is able to efficiently/competitivelydeliver quality inputs in ways that are adapted to smallholder farms, driving FQ.
Financing • Availability, accessibility and relevance of short, mid and long term credit to smallholders necessary to support investments in FQ.
• No formal provision of affordable finance from value chain, banks, warehouse receipts, producer organizations or microfinance base.
• Formal finance only available to large farms with sufficient collateral.
• The financial /private sector provides finance in a competitive and inclusive way, with products adapted to the smallholder majority.