panel data and tracking -...
TRANSCRIPT
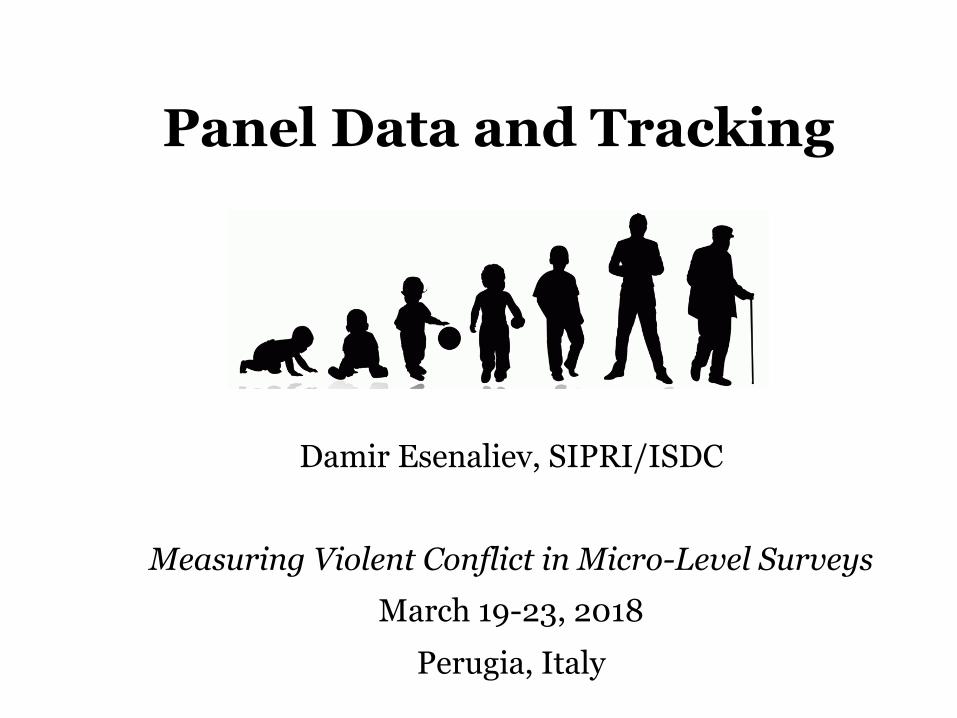
Panel Data and Tracking
Damir Esenaliev, SIPRI/ISDC
Measuring Violent Conflict in Micro-Level SurveysMarch 19-23, 2018
Perugia, Italy

Overview
2
1. Features of panel data2. Tracking principles 3. Young Lives Study 4. Life in Kyrgyzstan Study
1. Features of panel data
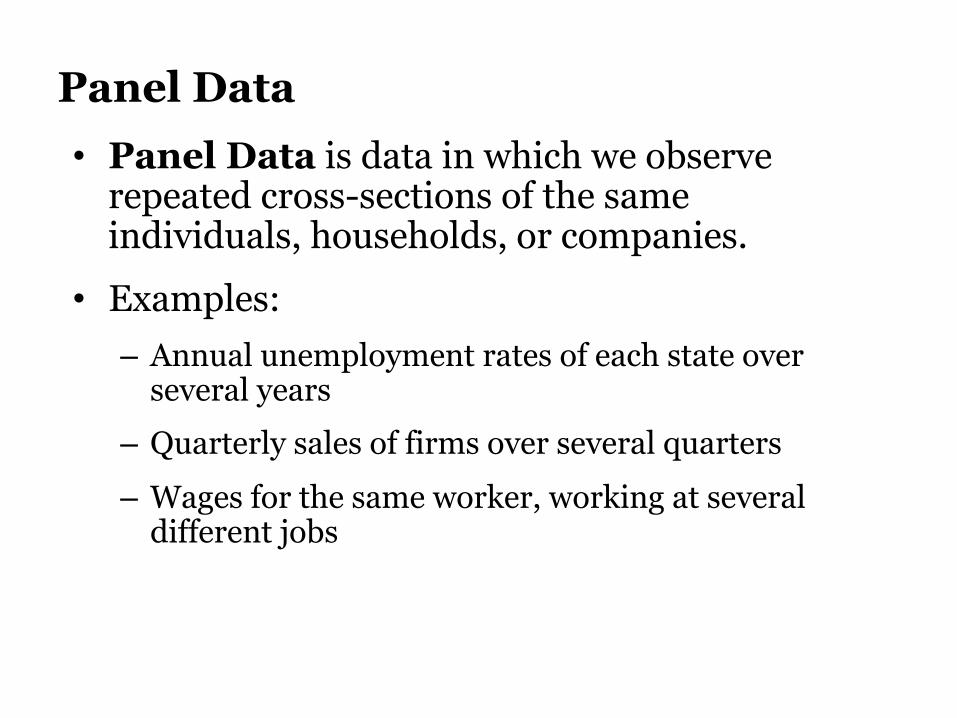
Panel Data• Panel Data is data in which we observe
repeated cross-sections of the same individuals, households, or companies.
• Examples:– Annual unemployment rates of each state over
several years– Quarterly sales of firms over several quarters– Wages for the same worker, working at several
different jobs
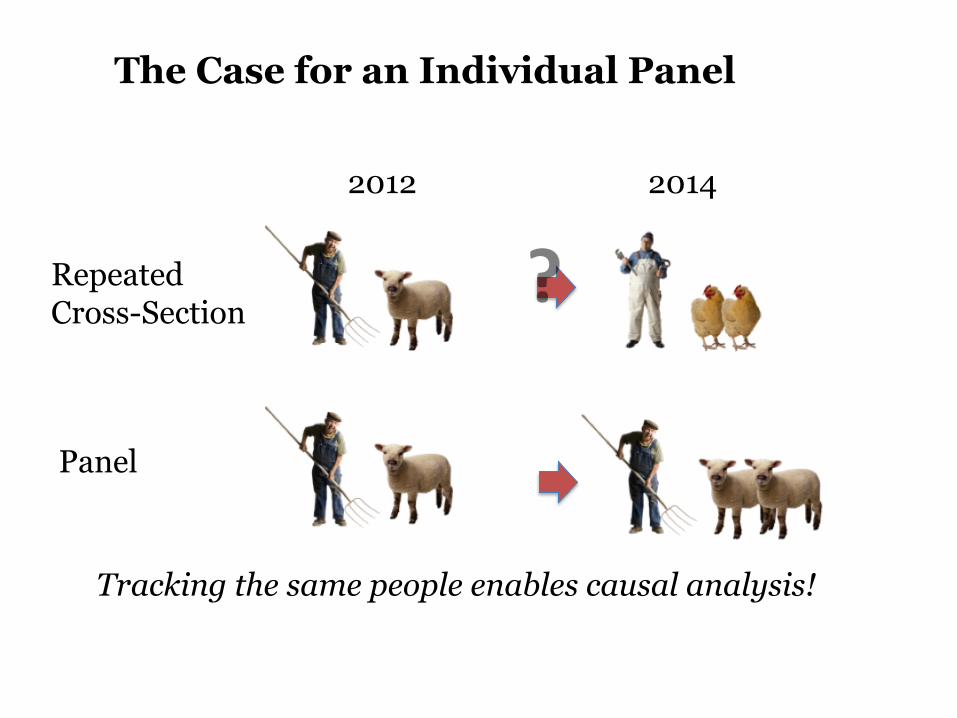
The Case for an Individual Panel
2012 2014
RepeatedCross-Section
Panel
Tracking the same people enables causal analysis!

Panel Data Advantages • The key feature of panel data is that we observe the
same individual in more than one condition.– not so much “Who is unemployed?”, but rather “Will people
who are unemployed ever find a job?”
• Panel data is better suited for studying the dynamics of change and understanding transition behavior, for example: – migration of a household member – company bankruptcy or merger – technological change or economic shocks
• Omitted variables that are fixed will take on the same values each time we observe the same individual.– A person’s upbringing, family characteristics, innate ability,
and demographics (except age) do not change.

Panel Data Advantages-2
• Capturing rare life events – getting (grand) children, choosing a mortgage, being a victim
of a crime.
• Practical considerations – Use a sub-sample of panel for focusing on certain topics: ask
about mortgage– only HHs who own houses
• Methodological benefits – Test measurement instruments for reliability over time.
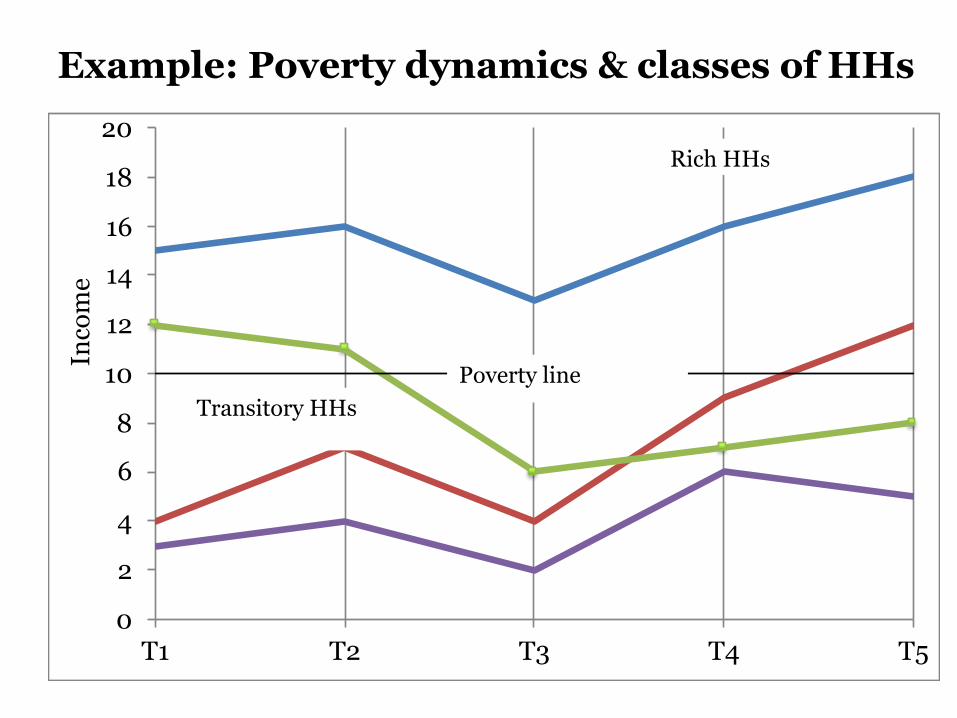
Example: Poverty dynamics & classes of HHs
0
2
4
6
8
10
12
14
16
18
20
T1 T2 T3 T4 T5
Inco
me
Rich HHs
Poverty lineTransitory HHs
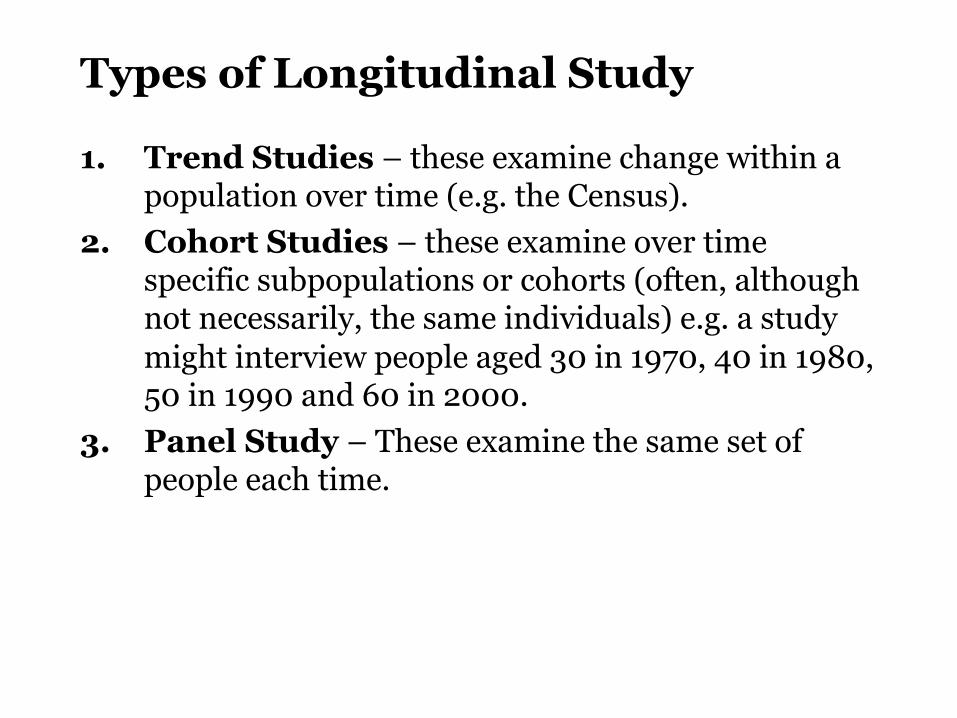
Types of Longitudinal Study
1. Trend Studies – these examine change within a population over time (e.g. the Census).
2. Cohort Studies – these examine over time specific subpopulations or cohorts (often, although not necessarily, the same individuals) e.g. a study might interview people aged 30 in 1970, 40 in 1980, 50 in 1990 and 60 in 2000.
3. Panel Study – These examine the same set of people each time.
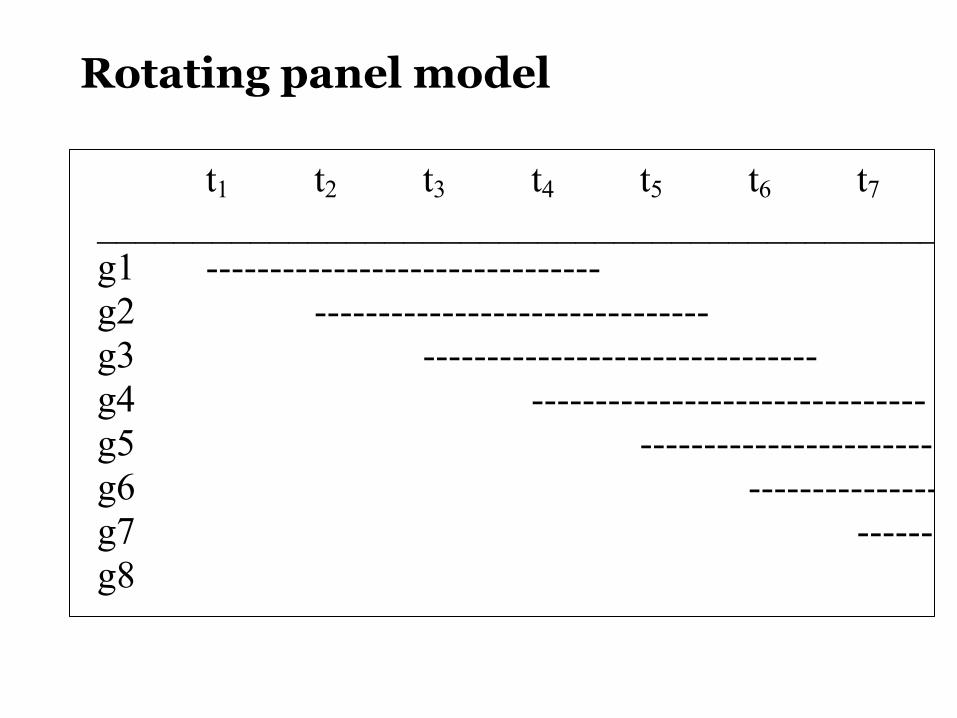
Rotating panel model
Dirk Sikkel, Adriaan Hoogendoorn
484
a simple rotation scheme. At t1 measurements are based only on group g1. At t2 statistics are estimated using group g1 and g2. At t4, four groups are being used: g1, g2, g3 and g4. Then group g1 leaves the panel. At t5 groups g2, g3, g4 and g5 are used for estimation. Note that an estimate for the difference between t1 and t5 is based on the dependent estimates on the groups g2, g3, g4 and the independent estimates of groups g1 and g5. Rotation is also helpful to reduce response burden and time-in-sample bias. t1 t2 t3 t4 t5 t6 t7 t8 t9 t10 t11 ________________________________________________________________ g1 ------------------------------- g2 ------------------------------- g3 ------------------------------- g4 ------------ ------------------------------- g5 ------------------------------- g6 ------------------------------- g7 ------------------------------- g8 ---------------------------- ________________________________________________________________
Figure 25.1. Scheme for a rotating panel Different types of panel are, for example:
1. Volunteer opt-in panels (Harris Interactive, Greenfield, NFO) 2. Pre-recruited panels of Internet users (Pew Research Center) 3. Pre-recruited panels of full population (Knowledge Networks,
CentERdata) 4. Direct access panels, Internet access panels 5. Special purpose panels: scatter panel, people-meter panel (AC Nielsen) 6. Rotating panels 7. Cohort studies
25.4 HOW TO SET UP AND MAINTAIN A PANEL SURVEY Already in the planning stages, it is very important to realise that a panel needs maintenance. In fact, you will need some effective panel management tools to prevent you from drowning in management problems (if not in data). The panel management system becomes more critical as the time between waves gets shorter. Setting up a panel survey is basically not much different from setting up a cross-sectional survey, except that you need to keep the address of the respondent for a future contact. However, as soon as you collected the data in the first wave, the time until the next wave is ticking away, and you had better be prepared. Maintaining a panel survey requires that you are in control of the information flow and that you are able to react adequately if necessary. To illustrate that controlling the information flow in a panel survey is not straightforward consider the simple question, “How many respondents are in the panel?” or “What is the response rate?” in the case of an Internet access
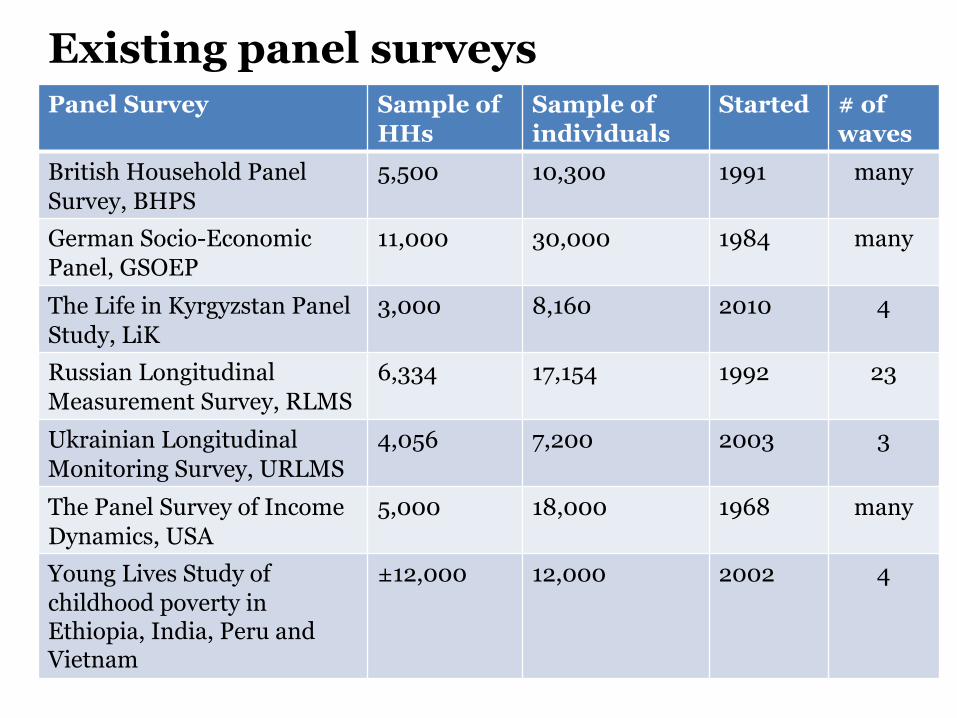
Existing panel surveysPanel Survey Sample of
HHsSample of individuals
Started # of waves
British Household Panel Survey, BHPS
5,500 10,300 1991 many
German Socio-Economic Panel, GSOEP
11,000 30,000 1984 many
The Life in Kyrgyzstan Panel Study, LiK
3,000 8,160 2010 4
Russian Longitudinal Measurement Survey, RLMS
6,334 17,154 1992 23
Ukrainian Longitudinal Monitoring Survey, URLMS
4,056 7,200 2003 3
The Panel Survey of Income Dynamics, USA
5,000 18,000 1968 many
Young Lives Study of childhood poverty in Ethiopia, India, Peru and Vietnam
±12,000 12,000 2002 4
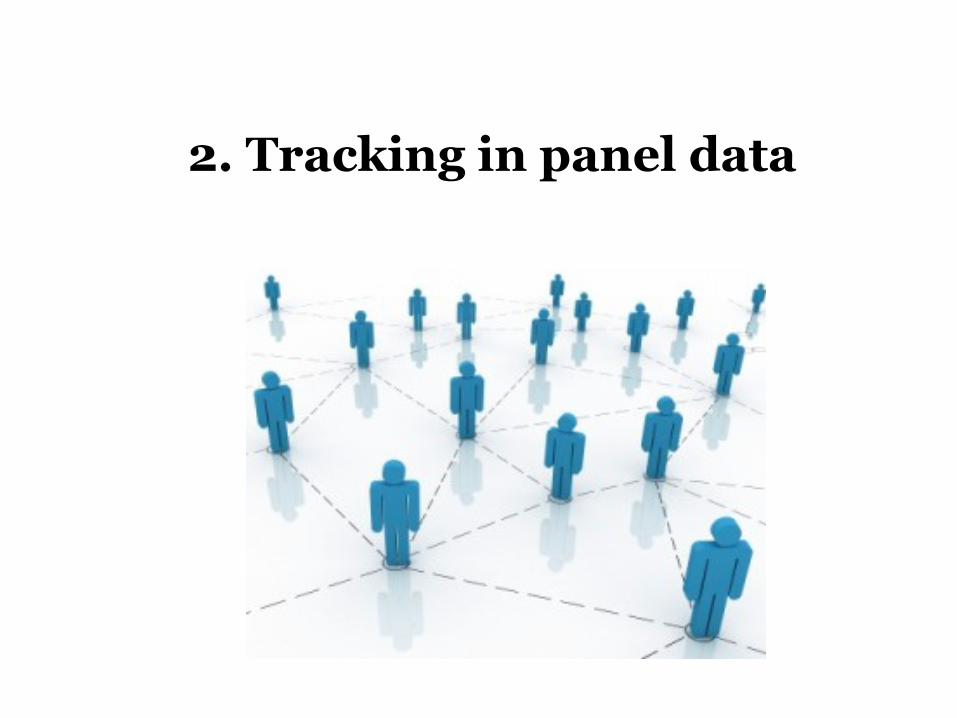
2. Tracking in panel data
Attrition in panel surveys• Sample attrition – loss of a respondent in a panel - is one
of the challenges for panel surveys due to – Migration– Refusal – Absence – Death
• The number of respondents who do not participate in each round of data collection is likely to cumulate over time.
• Attrition makes the initial panel sample less representative as the attrition can be non-random
• Thus, preventing high attrition maximizes the precision of an analysis based on panel data and strengthens its statistical validity.
Tracking in panel surveys
• Tracking respondents is to follow respondents who moved from the location where they were interviewed the last time.
• Tracking individuals and households can entail significant costs and may require specific focus by the organization conducting the survey.
• The survey planners make decisions – what is the panel unit: dwelling, household, individual. – about whether to follow households and individuals who left
their baseline location – to what degree with respect to time, distance, and cost.
Panel sample maintenance system
• PANEL NEEDS MAINTENANCE• Has a dedicated tracking team • Keeps addresses and contact information of respondents
– Not only from a respondent, but also from two additional contacts of people who may know about location of a respondent
• Ensures the frequent contact with the respondents and builds rapport
• Has the protocols to follow the movers • Has the optional ways of providing data from the
respondents who refuse • Has information to show to respondents about
usefulness of the data and underlying research

3. Tracking in Young Lives Study
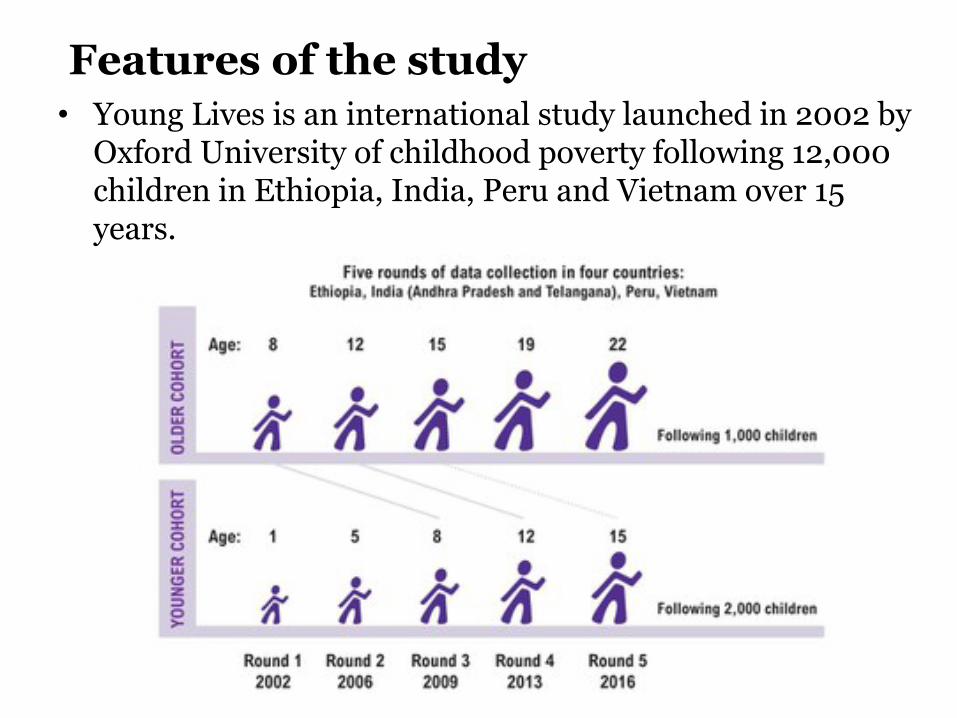
Features of the study• Young Lives is an international study launched in 2002 by
Oxford University of childhood poverty following 12,000 children in Ethiopia, India, Peru and Vietnam over 15 years.
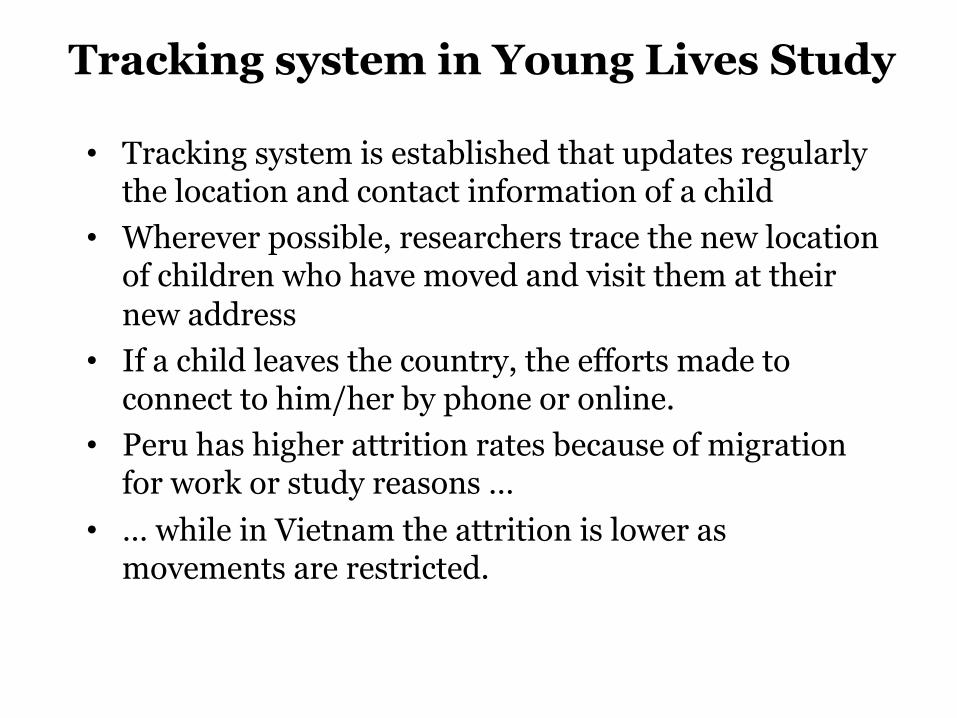
Tracking system in Young Lives Study
• Tracking system is established that updates regularly the location and contact information of a child
• Wherever possible, researchers trace the new location of children who have moved and visit them at their new address
• If a child leaves the country, the efforts made to connect to him/her by phone or online.
• Peru has higher attrition rates because of migration for work or study reasons …
• … while in Vietnam the attrition is lower as movements are restricted.
Attrition in the Young Lives Study
Young Lives Methods Guide Cohort Maintenance: Tracking and Attrition Page 2
Patterns of attrition in the early rounds ofYoung Lives
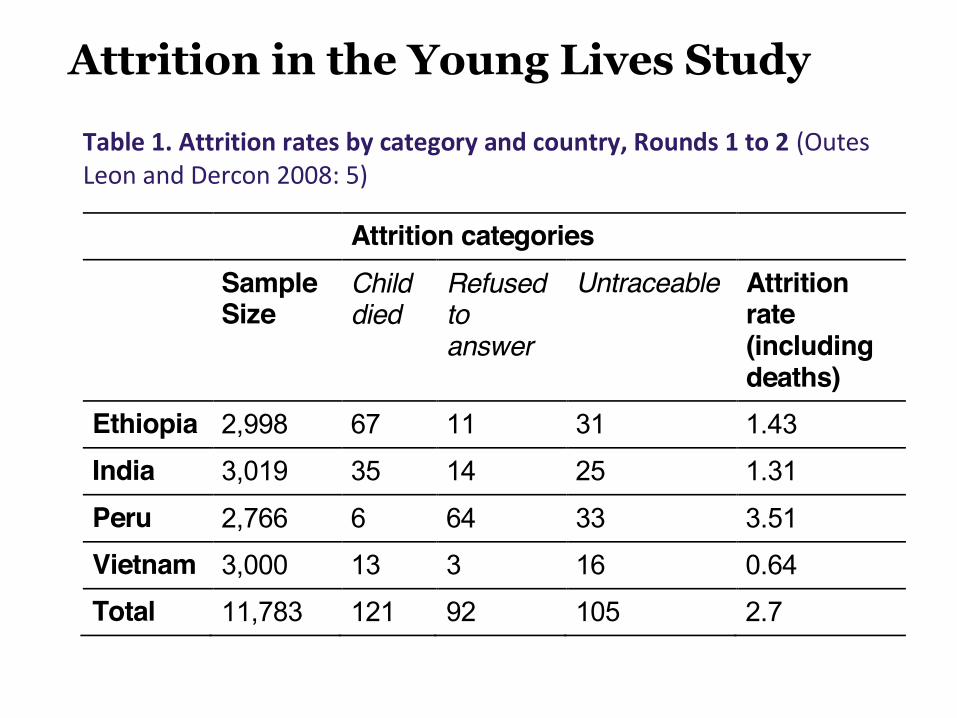
Young Lives had an attrition rate of 2.8% across the wholesample between Rounds 1 and 3. This is not only low inabsolute terms, but also when compared with attrition ratesfor other longitudinal studies in developing countries (OutesLeon and Dercon 2008). Table 1 illustrates the causes of thisattrition between Rounds 1 and 2, showing the distribution ofnon-response across three categories of attrition for each ofthe study countries.
Table 1. Attrition rates by category and country, Rounds 1 to 2 (OutesLeon and Dercon 2008: 5)
Attrition categoriesSampleSize
Childdied
Refusedtoanswer
Untraceable Attritionrate(includingdeaths)
Ethiopia 2,998 67 11 31 1.43
India 3,019 35 14 25 1.31
Peru 2,766 6 64 33 3.51
Vietnam 3,000 13 3 16 0.64
Total 11,783 121 92 105 2.7
Feedback from the tracking process suggests that relativelyhigh rates of refusals in Peru compared with the othercountries was in some cases linked to poor communityunderstanding of the study’s purpose. A member of the Peruteam reflected that not enough work had been done in thefirst round of the survey to avoid giving the impression thatthe study was a project from which respondents would gaindirect benefit. The same researcher also attributed therelatively high attrition rate to family break-ups, and to arelatively empowered urban population who did not facecultural barriers in refusing to continue participating if theychose not to.
Child death accounts for a significant proportion of attrition,especially in Ethiopia, which is to be expected. In particular,the younger cohort can be expected to experience higherdeath rates than the older cohort. Attrition rates become moresimilar across cohorts when child deaths are excluded. Table2 shows attrition rates excluding deaths for the younger andolder cohorts across all three survey rounds. It illustrates bothwave non-response and similar levels of attrition across thetwo cohorts once deaths have been excluded.
Table 2. Attrition as % of whole sample, excluding deaths
Round 1 to 2 Round 2 to 3 Round 1 to 3Older Cohort 1.8 1.2 3
Younger Cohort 1.9 0.8 2.7
Both Cohorts 1.9 1.0 2.8
Attrition bias arises when sample attrition is non-random.Attrition between Round 1 and Round 2 has been assessedfor attrition bias using two attrition probit tests, statistical
processes which search for patterns in outcome variables andhousehold characteristics of attriting households (Outes Leonand Dercon 2008). This analysis showed that there weresome non-random patterns across most countries:
• child deaths correlated with households in lower wealthindex, and in rural areas
• refusing and untraceable households were mostly at thehigher end of the wealth index
• untraceable households were more likely to be in urbanareas.
Despite following these non-random patterns, the probit testsshow that attrition between Round 1 and Round 2 was anoverwhelmingly random phenomenon.
Forthcoming challenges for cohortmaintenance
One of the major challenges of maintaining the cohort of alongitudinal study is the need to follow the life-cycle events ofthe participants. For this reason, tracking between Rounds 3and 4 will be particularly important for the Young Lives teams,as the older cohort begin to reach the age when many arelikely to leave home and school. Among the Young Liveschildren there will be culturally diverse ways of meeting thismilestone, and some have particular implications for tracking.In Ethiopia, for example, there are likely to be instances ofolder children making several short migrations betweenrounds, during which they could easily become lost to thestudy.
Although originally scheduled for 2012, Round 4 will now takeplace in 2013, when the younger cohort will be the same agethat the older cohort children were in Round 2. A longerperiod between survey rounds adds to the possibilities forattrition and will demand increased vigilance in tracking.
A key challenge as the study approaches its later rounds isthe issue of potential respondent fatigue. While all children inthe sample participate in the survey at regular intervals,others are also part of the sub-sample for the qualitativeresearch rounds, and yet others are involved in a range ofsub-studies focused on particular issues ranging from socialprotection to early childhood care and education. It is theresponsibility of the Principal Investigator in each country toensure that no single respondent is overloaded by the study.Maintaining effective tracking systems is essential to this.
References and Further reading
Moffitt, R., J. Fitzgerald and P. Gottschalk (1999) ‘SampleAttrition in Panel Data: The Role of Selection Observables’,Annales d’Economie et de Statistique 55-56: 129-52
Outes-Leon, I. and S. Dercon (2008) Survey Attrition andAttrition Bias in Young Lives, Technical Note 5, Oxford:Young Lives http://www.younglives.org.uk/files/technical-notes/survey-attrition-and-attrition-bias-in-young-lives
.
Young Lives is a 15-year study of childhood poverty in Ethiopia, India, Peru and Vietnam core-funded by UK aid from theDepartment for International Development (DFID) and co-funded from 2010 to 2014 by The Netherlands Ministry of Foreign Affairs.Young Lives, Oxford Department of International Development, 3 Mansfield Road, Oxford OX1 3TB, UK • www.younglives.org.uk
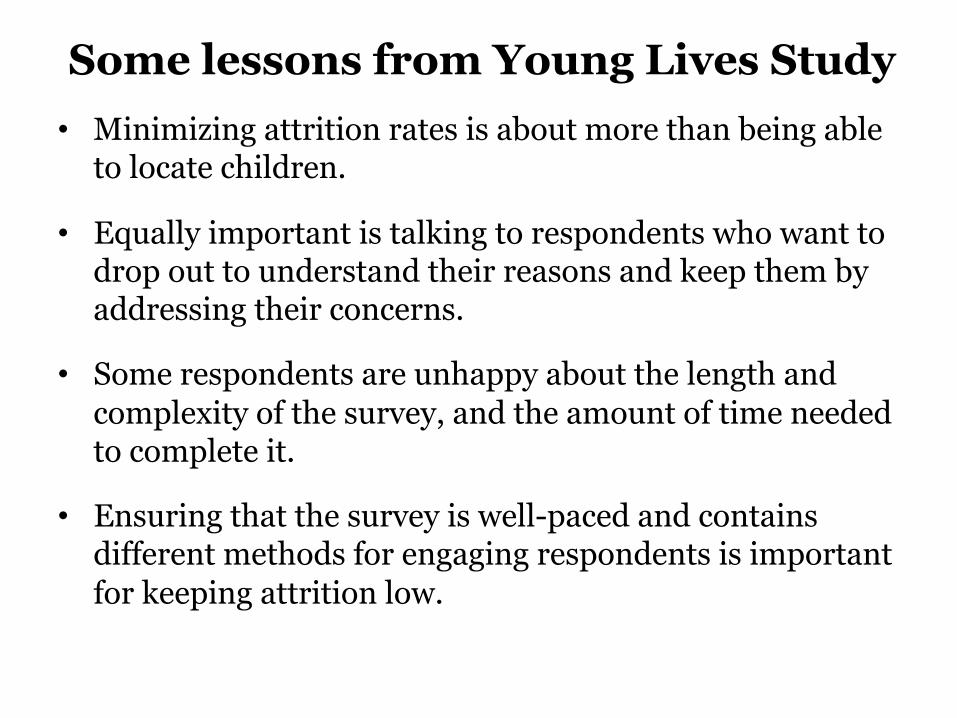
Some lessons from Young Lives Study• Minimizing attrition rates is about more than being able
to locate children.
• Equally important is talking to respondents who want to drop out to understand their reasons and keep them by addressing their concerns.
• Some respondents are unhappy about the length and complexity of the survey, and the amount of time needed to complete it.
• Ensuring that the survey is well-paced and contains different methods for engaging respondents is important for keeping attrition low.

4. Life in Kyrgyzstan Panel Study

LiK panel design • The LiK is an individual panel, not a household panel. • All adult members of the households, not just one
respondent, are interviewed and tracked over time. • In principle, all persons who took part in the first wave
of the survey in 2010 are to be surveyed in the following waves.
• If a individual moves within Kyrgyzstan, the individual is followed (though, not students); if he/she moves abroad, the individual is dropped from the sample.
• In a case of in-country move, other members (e.g. spouse and children) of the new household are then included in the sample as well.

LiK sample attrition
Table1:SampleevolutionoftheLifeinKyrgyzstanSurvey
Wave #ofHHs #ofindividuals #ofhouseholdsas%to2010
#ofindividualsas%to2010
2010 3,000 8,160 100 1002011 2,862 8,065 95 992012 2,816 8,177 94 1002013 2,586 7,681 86 942016 2,529 8,094 84 99

Lessons from LiK Study
• Has been quite successful in retaining the sample of individuals
• No dedicated tracking system between waves, but the tracking protocols are embedded into the field work cycles
• Main reason for attrition is migration abroad
• Difficult to persuade the movers to stay, as in most cases the move was related to unfortunate life events

Summary • Panel data – when we observe the same objects over
time - have beneficial features compared to cross-sectional data
• Attrition is an inevitable feature of panel data
• The tracking efforts are important to keep the representativeness of the panel sample
• Many panel studies do successfully maintain their sample, but at the cost of greater dedicated efforts and costs
• In-conflict and post-conflict areas represent a greater challenge for panel studies

Part 3
26
References to panel studies
• Firman Witoelar, Tracking in Longitudinal HouseholdSurveys, WB LSMS-ISA Paper, 2011.
• The British Household Panel Survey; https://www.iser.essex.ac.uk/bhps
• Ukrainian Longitudinal Monitoring Survey; https://datasets.iza.org/dataset/56/ukrainian-longitudinal-monitoring-survey
• The Panel Study of Income Dynamics (PSID), USA; https://psidonline.isr.umich.edu/default.aspx
• Young Lives Study; http://younglives.qeh.ox.ac.uk/.