paper 2005 casadei 2.pdf
TRANSCRIPT

with theduled ford reinforcedformingd testingd
his allowedboth slabsollapse, avidence on
cilities
In Situ Load Testing of Parking Garage Reinforced ConcreteSlabs: Comparison between 24 h and Cyclic Load TestingPaolo Casadei, S.M.ASCE1; Renato Parretti, A.M.ASCE2; Antonio Nanni, F.ASCE3; and Tom Heinze4
Abstract: This paper reports on the results obtained on the applicability of the diagnostic cyclic load test method in comparisonexisting 24 h test procedure adopted in ACI-318. A parking garage, owned by St. Louis County, St. Louis, Missouri, schedemolition during the summer of 2002 was used as a research test bed before demolition. This structure, a two-story steel anconcrete(RC) frame with one-way RC slabs built in 1970’s, was ideal, in terms of size and construction system, for percomparative field experimentation on load testing. Investigation and validity of acceptance criteria of existing and proposemethods were performed. Two identical RC slabs were tested, according to both the standard procedure(ACI-318-02) and the proposediagnostic load testing. In both instances, the applied total test load was such that the slab did not pass the load test. Tcharacterizing the critical test parameters that govern acceptability and draw conclusions on their values. After load testing,were loaded until partial collapse was reached. This allowed making observations on the margin of safety with respect to cdetermination that is not generally possible in a proof test. The analysis of the experimental data provides professionals with ethe validity of in situ assessment for the adequacy of structural members.
DOI: 10.1061/(ASCE)1084-0680(2005)10:1(40)
CE Database subject headings: Load tests; Cyclic loads; In situ tests; Slabs; Concrete, reinforced; Assessment; Parking fa.
eine ifor forck ofele-ns toh a
theenedech-uild-
dnnia
f the
Mt al.dponsee test-ol re-ponsecond,mentsor de-
studywere
anthe
osticed toteria.
usedcturest beriticall test
t be
arch
St.,
ring
and
mustoneitor.sible. This
n-80/
Introduction
A large number of old reinforced concrete(RC) structures in thUnited States are in a need of structural evaluation to determupgrade and renovation are needed for their specific useaccommodating higher loads due to a change in use. The larecords, such as “as-built” drawings, details of structuralments, and properties of materials, often implies assumptiodevelop analytical models that may require validation witproof test.
Another field of application of the in situ load testing isvalidation of the performance of structural members strengthwith emerging materials where the novelty of the upgrade tnique raises doubts in the mind of owners, engineers, and bing officials. Experiences in buildings(Bick 1998; Nanni anGold 1998; Gold and Nanni 1998; Hogue et al. 1999; Naand Mettemeyer 2001) and bridges have already shown howproof test can be helpful to determine the effectiveness ostrengthening.
1PhD Candidate in Civil Engineering, 220 Engineering ReseLaboratory, Univ. of Missouri-Rolla, Rolla, MO 65409.
2Structural Engineer, Co-Force America, Inc., 800 West 14thRolla, MO 65401.
3V&M Jones Professor, Dept. of Civil Engineering, 224 EngineeResearch Laboratory, Univ. of Missouri-Rolla, Rolla, MO 65409.
4Project Manager, St. Louis County, Division of DesignConstruction, 41 South Central, Clayton, MO 63105.
Note. Discussion open until July 1, 2005. Separate discussionsbe submitted for individual papers. To extend the closing date bymonth, a written request must be filed with the ASCE Managing EdThe manuscript for this paper was submitted for review and pospublication on September 1, 2003; approved on December 2, 2003paper is part of thePractice Periodical on Structural Design and Costruction, Vol. 10, No. 1, February 1, 2005. ©ASCE, ISSN 1084-06
2005/1-40–48/$25.00.40 / PRACTICE PERIODICAL ON STRUCTURAL DESIGN AND CONSTRUC
Several researchers(FitzSimons and Longinow 1975; RILETechnical Recommendations 1984; Bungey 1989; Fling e1989; Hall and Tsai 1989; Mettemeyer 1999) have investigatemethods for applying test loads and measuring structural resparameters. These investigations have attempted to refine thing procedures over the years, but the fundamental protocmains unchanged: First, measurements of the structural resparameters are taken prior to any load application; and, sethe structure is loaded up to a certain level and the measureare again recorded. There are several acceptance criteria ftermining the outcome of the in situ load test.
In this paper, the writers present and discuss a casewhere two identical real-size RC slabs in a parking garagetested according to the standard procedure[ACI 318-02 (ACI2002)] and the proposed diagnostic cyclic load testing[CIASRep. No. 00-1(CIAS 2001)]. Test loads were set to simulateincrease in load of approximately 40–45% with respect tooriginal design. Once both the conventional and the diagncyclic load tests were concluded, both members were loadfailure to establish the margin of safety for the acceptance cri
Load Test Protocols
24 h Load Test—ACI 318
In situ load testing adopted by ACI 318-02 Ch.20(ACI 2002) isbased on a relatively long-term duration of loading and it isonly to evaluate whether a structure or a portion of a strusatisfies the safety requirements of the code. The load muarranged to maximize the deflection and stresses in the cregions of the structural elements to be investigated. The totaload TTL, including the dead load already in place, shall no
less thanTION © ASCE / FEBRUARY 2005
tionseachppli-loadcre-set or loadt loadaforebe ree 24
rentestedaramte andcom-otherof the
ry
t sat-butd as
comele or
rains
oadber
on-t thao thees of
andse ofctricf sec-s upsaferearity
orma-thatwer.pre-are
weend on
aulics
bearia-rise
n ofmem-yclesd as a-1
kenanyline
achectedil the50%
loaduraladingstged.theed in
andwayd B
simi-
d Fthe
uldhouldload,been
e de-
e areest ine proof
tedse of
uringtabil-re’sected
TTL = 0.853 s1.4D + 1.7Ld s1d
Once the structure is adequately instrumented, at the locawhere the maximum response is expected, initial values ofinstrument shall be recorded not more than 1 h before the acation of the first load increment. After the test is started, themust be applied in not less than four approximately equal inments. If the measurements are not recorded continuously, aresponse readings should be registered at each of the fouincrements until reaching the total test load and after the teshas been applied on the structure for at least 24 h. Once thementioned readings have been taken, the test load mustmoved immediately and a set of final readings must be madmore hours after the test load is removed.
The evaluation of the structure is based on the two diffesets of acceptance criteria to certify whether the member thas passed the load test. On one side was a set of visual peters, such as no spalling or crushing of compressed concreevidence of excessive deflections that would obviously be inpatible with the safety requirements of the structure. On thehand, the measured maximum deflections shall satisfy onefollowing two equations:
Dmaxø,t
2
20,000hs2d
DrmaxøDmax
4s3d
It has to be noted that Eq.(2) is especially relevant for vestiff structural members.
If the measured maximum and residual deflections do noisfy Eqs.(2) or (3), it shall be permitted to repeat the load testnot earlier than 72 h after the removal of the first test loaspecified in ACI 318-02 Section 20.5.2(ACI 2002).
Even though this load test protocol has been used and bepart of engineering practice, there appears to be no rationaexperimental evidence to substantiate its validity. Time constand costs can make the use of this test prohibitive.
Diagnostic Cyclic Load Test—CIAS Report 00-1
Among one of the first applications of the diagnostic cyclic l(DCL) testing was the proof testing of externally bonded fireinforced polymer(FRP) laminates to strengthen structural ccrete members. From this experience, it becomes apparenthis testing technology could be used as a valid alternative t24 h load test protocol since it can overcome the disadvantagthis method.
The main difference between the protocol of the DCL testthe 24 h load test is that the load is applied in cycles by the uhydraulic jacks which are easily controlled by hand or elepumps assuring that the load could be removed in matter oonds. Utilizing both increasing loading and unloading cycleto a predetermined maximum load allow the engineer areal-time assessment of member characteristics, such as linand repeatability of response, as well as permanency of deftions. The duration of the DCL is considerably reduced fromof the 24 h load test and, consequently, its overall cost is lo
The preliminary steps in planning the load test includingliminary investigation, structural analysis, and load definitionthe same as for the 24 h load test. The main difference betthese two protocols relies on the test setup configuration an
the procedure by which the load is applied.PRACTICE PERIODICAL ON STRUCTUR
f
--
-
t
Test Method
There are several ways to provide the reaction to the hydrjacks [see CIAS Rep. No. 00-1(CIAS 2001)]. Each method idifferent from the other and their individual differences canseen in the setup time, minimum equipment required, load vtion, source of reaction, and finally the limitations that compeach method.
Load Test Procedure
The procedure of a cyclic load test consists of the applicatioconcentrated loads in a quasi-static manner to the structuralber, in at least six loading/unloading cycles. The number of cand the number of steps, as described, should be considereminimum requirement[for more details see CIAS Rep. No. 00(CIAS 2001)]:• Benchmark: The initial reading of the instrumentation is ta
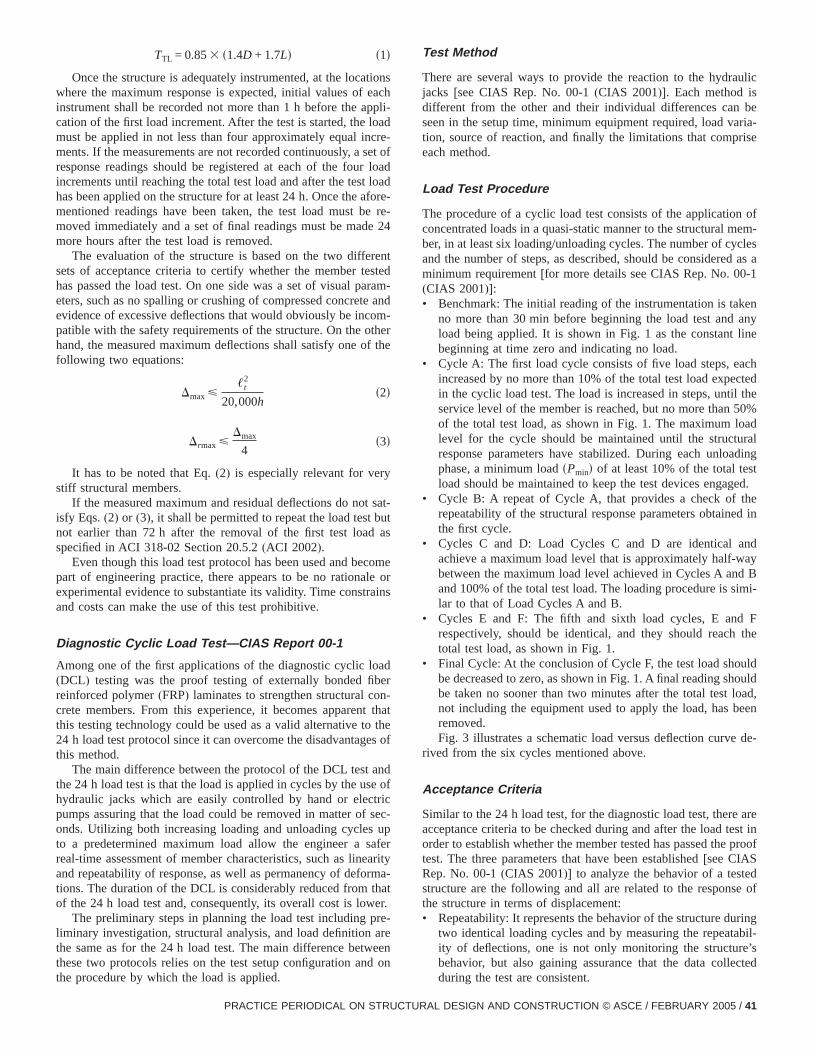
no more than 30 min before beginning the load test andload being applied. It is shown in Fig. 1 as the constantbeginning at time zero and indicating no load.
• Cycle A: The first load cycle consists of five load steps, eincreased by no more than 10% of the total test load expin the cyclic load test. The load is increased in steps, untservice level of the member is reached, but no more thanof the total test load, as shown in Fig. 1. The maximumlevel for the cycle should be maintained until the structresponse parameters have stabilized. During each unlophase, a minimum loadsPmind of at least 10% of the total teload should be maintained to keep the test devices enga
• Cycle B: A repeat of Cycle A, that provides a check ofrepeatability of the structural response parameters obtainthe first cycle.
• Cycles C and D: Load Cycles C and D are identicalachieve a maximum load level that is approximately half-between the maximum load level achieved in Cycles A anand 100% of the total test load. The loading procedure islar to that of Load Cycles A and B.
• Cycles E and F: The fifth and sixth load cycles, E anrespectively, should be identical, and they should reachtotal test load, as shown in Fig. 1.
• Final Cycle: At the conclusion of Cycle F, the test load shobe decreased to zero, as shown in Fig. 1. A final reading sbe taken no sooner than two minutes after the total testnot including the equipment used to apply the load, hasremoved.Fig. 3 illustrates a schematic load versus deflection curv
rived from the six cycles mentioned above.
Acceptance Criteria
Similar to the 24 h load test, for the diagnostic load test, theracceptance criteria to be checked during and after the load torder to establish whether the member tested has passed thtest. The three parameters that have been established[see CIASRep. No. 00-1(CIAS 2001)] to analyze the behavior of a tesstructure are the following and all are related to the responthe structure in terms of displacement:• Repeatability: It represents the behavior of the structure d
two identical loading cycles and by measuring the repeaity of deflections, one is not only monitoring the structubehavior, but also gaining assurance that the data coll
during the test are consistent.AL DESIGN AND CONSTRUCTION © ASCE / FEBRUARY 2005 / 41
to
of
angesec-
0%a-
atede anctural
non-r be-comease.
tocantad–
g thethanThe
theed byd by
tioniven
hasuntilr, asmayave in
s
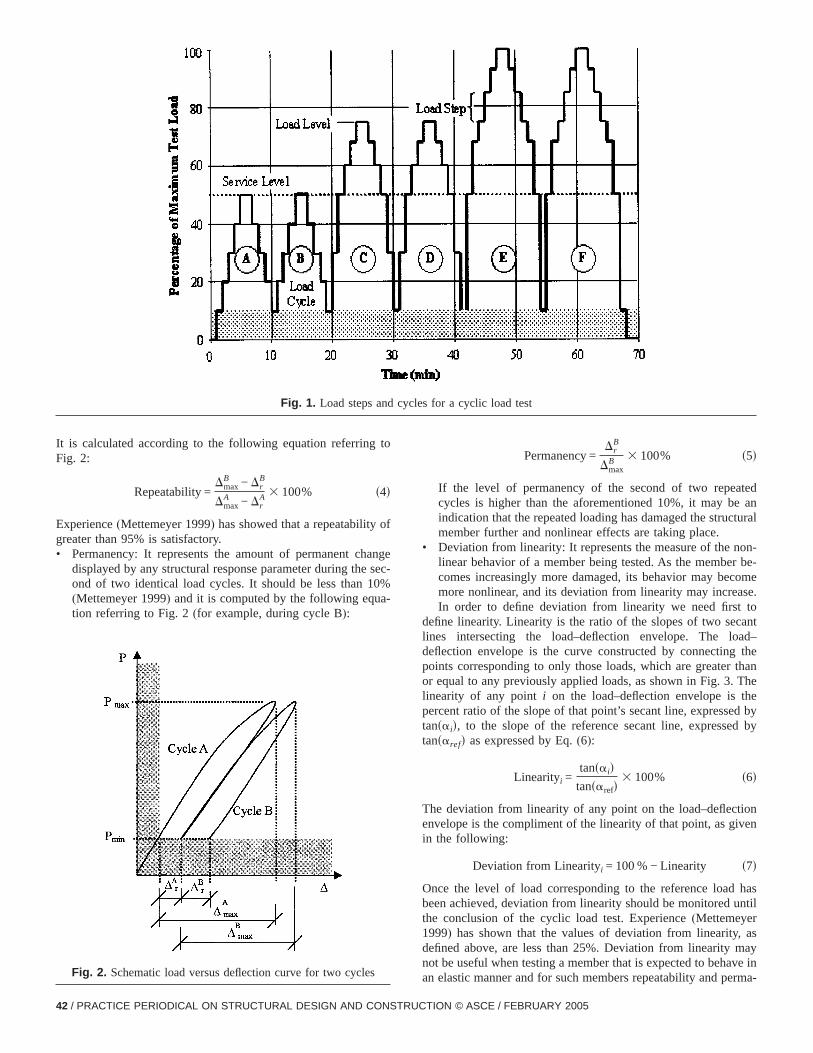
It is calculated according to the following equation referringFig. 2:
Repeatability =Dmax
B − DrB
DmaxA − Dr
A 3 100% s4d
Experience(Mettemeyer 1999) has showed that a repeatabilitygreater than 95% is satisfactory.• Permanency: It represents the amount of permanent ch
displayed by any structural response parameter during theond of two identical load cycles. It should be less than 1(Mettemeyer 1999) and it is computed by the following eqution referring to Fig. 2(for example, during cycle B):
Fig. 1. Load steps an
Fig. 2. Schematic load versus deflection curve for two cycle
42 / PRACTICE PERIODICAL ON STRUCTURAL DESIGN AND CONSTRUC
Permanency =Dr
B
DmaxB 3 100% s5d
If the level of permanency of the second of two repecycles is higher than the aforementioned 10%, it may bindication that the repeated loading has damaged the strumember further and nonlinear effects are taking place.
• Deviation from linearity: It represents the measure of thelinear behavior of a member being tested. As the membecomes increasingly more damaged, its behavior may bemore nonlinear, and its deviation from linearity may increIn order to define deviation from linearity we need first
define linearity. Linearity is the ratio of the slopes of two selines intersecting the load–deflection envelope. The lodeflection envelope is the curve constructed by connectinpoints corresponding to only those loads, which are greateror equal to any previously applied loads, as shown in Fig. 3.linearity of any point i on the load–deflection envelope ispercent ratio of the slope of that point’s secant line, expresstansaid, to the slope of the reference secant line, expressetansarefd as expressed by Eq.(6):
Linearityi =tansaid
tansarefd3 100% s6d
The deviation from linearity of any point on the load–deflecenvelope is the compliment of the linearity of that point, as gin the following:
Deviation from Linearityi = 100 % − Linearity s7d
Once the level of load corresponding to the reference loadbeen achieved, deviation from linearity should be monitoredthe conclusion of the cyclic load test. Experience(Mettemeye1999) has shown that the values of deviation from linearitydefined above, are less than 25%. Deviation from linearitynot be useful when testing a member that is expected to beh
les for a cyclic load test
d cycan elastic manner and for such members repeatability and perma-
TION © ASCE / FEBRUARY 2005

mage
withframe
anduis,r of
fromtion,rebar
n,
in theeter
edbars
PRACTICE PERIODICAL ON STRUCTUR
nency, as previously defined, may be better indicators of dain the tested structure.
Case Study
Building Geometries and Material Characterization
The parking garage was constructed in the early 1950’s,masonry exterior walls around a concrete-encased steelsupporting a RC floor system[see Fig. 4(a)]. The floor systemconsisted of one-way RC slabs supported by steel girdersjoists[see Fig. 4(b)]. The parking garage was located in St. LoMissouri, and was scheduled for demolition in the summe2002.
No construction or maintenance records were availablethe St. Louis County, owner of the garage. A field investigabased on visual inspection and the use of an electromagneticlocator, showed that the typical RC slab was 14 cms5.5 in.dthick, 512 cms16.8 ftd long, and 255 cms8.38 ftd wide. The mainreinforcement consisted of one layer of 12 mm diameter(No. 4)steel bars spaced 30 cms12 in.d center to center at midspaand 12 mm diameter steel bars spaced 30 cms12 in.d center tocenter at the support, in correspondence of the steel joists,east–west direction. In the north–south direction, 12 mm diamsteel bars, spaced 45.7 cms18 in.d center to center were usas temperature and shrinkage reinforcement. All six steeltested showed an average yield strength offy=415 N/mm2 sfy
arking garage
Fig. 3. Schematic load versus deflection curve for six cycles
Fig. 4. “Clayton” p
AL DESIGN AND CONSTRUCTION © ASCE / FEBRUARY 2005 / 43

oresan
mineTheforuiva-
ieldry5.slabtedst.
rkingne al-ed to
lntact
-ig. 6.
ofulicoints
hichs ex-lifted, twodOnce, the
raulicwood
to pro-steel-0 kNtemntem-con-
=60 ksid. Concrete properties were evaluated using six ctaken from different locations in the slab prior to testing andaverage concrete cylinder strength offc8=31 N/mm2 sfc8=4,500 psid was found.
Structural Analysis
A detailed structural analysis was performed in order to deterthe magnitude of the load to be applied to the structure.objective was to find the ultimate factored distributed loadwhich the slab was designed and then back calculate an eqlent point load. A limit design was adopted by adopting the “yline method” (MacGregor 1997). Based on the field boundaconditions, the yield line pattern chosen is as shown in Fig.
It was found that the new distributed design load for thewas 5.13 kN/m2 s0.97 ksfd corresponding to a total concentraload of 533 kNs120 kipd to be applied during the in situ load te
Fig. 5. Yield lines pattern(U.S. units; 1 in.=2.54 cm.)
Fig. 6. “Clos
44 / PRACTICE PERIODICAL ON STRUCTURAL DESIGN AND CONSTRUC
On-Site Safety
Safety procedures were adopted for both load tests. The pagarage areas affected by each test were fenced and no olowed within such areas. Shoring was provided and designcarry the weight of the portion of slab tested(multiplied by asafety factor equal to 2.0 to account for impact) and the additionaweight of the testing equipment. Shoring was not in direct cowith the slab soffitt to allow unobstructed deflection.
Load Test Setup and Instrumentation
The load test was conducted using aclosed-looploading configuration, where no external reaction is required, as shown in FThe load was applied in cycles by two hydraulic jacks2,200 kNs500 kipd each, connected simultaneously to a hydrahand pump, that transferred the load to the RC slab in eight pthrough four spreader steel beams(see Fig. 7), simulating anequivalent uniformaly distributed load. The steel joists, on wthe slab rests, supplied the reaction. As the hydraulic jacktended, they pulled on the high strength steel bars, whichthe reaction beams below the slab: The reaction beamsdoubleC 15350 304.8 cms10 ftd long, were properly designeto carry the load necessary to resists the test load planned.the reaction beams came into contact with the steel joistsresulting reactions were a downward force under each hydjack transferred to the slab by the spreader steel beams. Plywas placed under the spreader steel beams[see Fig. 7(b)] andbetween the steel joists and the reaction beams were usedtect the concrete from any localized damage and to avoidto-steel contact. The load was measured using only a 89s200 kipd load cell on top of one jack since the hydraulic sysassured that both jacks applied the same amount of load coporarily. For this phase, the only preparation work needed
p” test setup
ed-looTION © ASCE / FEBRUARY 2005

con-tribu-sre-
ievedfrom
onents
de-
main-eeling,fully
load,
raulicationunds
c-loadwere
waswere
outonse20.4
nedortedaulic.tocol,
theon
sisted in drilling the two holes of small diameter[,5 cm (2 in.)]necessary for letting the high-strength steel bars through thecrete slab. Since the diameter of the bar was small, the contion of the drilled holes to the behavior of the slab was digarded.
Real-time measurement of structural response was achusing an electronic data acquisition system acquiring dataten linear variable differential transducers(LVDTs) all with anaccuracy of 0.00254 mms0.0001 in.d, used to measure deflectiat chosen locations where maximum and critical displacemwere expected[see Fig. 8(a)]. Four LVDTs with a ±5.08 cms2 in.d stroke were placed along midspan, where maximumflections were expected; three LVDTs with a ±2.54 cms1 in.dstroke were placed under the load’s patches and the two reing ±1.27 cms0.5 in.d stroke LVDTs were placed under the stjoist and girder to verify that the no deformation was occurrproving that all the load was being carried by the slab as careshown in Fig. 8(b).
Analysis of Load Test Results
24 h Load Test
After recording initial readings from each device, the testwas applied in four equal increments of 133 kNs30 kipd each
Fig. 7. Test load distribu
Fig. 8. On site instrumen
PRACTICE PERIODICAL ON STRUCTUR
and the structure inspected at each load step. Since the hydjack was controlled by a hand pump, this assured the applicof the load at increments of no more than a few hundreds po(less than 1 kN per load increment) at a time, allowing the struture enough time to come a steady loaded state after eachincrement. Test measurements of the member’s responsesrecorded 10-min intervals apart. Once the maximum loadachieved, it was kept constant for 24 h and measurementsrecorded(see Fig. 9). The structure was then unloaded withremoving any of the loading equipment, and the final respwas recorded after 24 h as specified by ACI 318-02 Section(ACI 2002). Maximum and residual deflections were obtaifrom test data as graphically shown in Fig. 10. The load repin all graphs represents the total load applied by both hydrjacks and distributed in the eight patches on top of the slab
To evaluate acceptance criteria according to the 24 h proEqs. (2) and (3) are evaluated assuming for each variablefollowing values(U.S. units) as defined by ACI 318-02 Secti20.5.2(ACI 2002):
l t = 275.6 cm s108.5 in.d
h = 14 cm s5.5 in.d
obtained from in situ observations and from Fig. 10:
Dmax= 4.7 cm s1.85 in.d
.S. units; 1 in.=2.54 cm.)
.S. units; 1 in.=2.54 cm.)
tion(U
tation(U
AL DESIGN AND CONSTRUCTION © ASCE / FEBRUARY 2005 / 45

eto
ing:
d byble to
loade thanoadoad,ndload
st forwasfor atch
eat of
Cde-
two
t was
re-s nott
s forem-wn in
ulti-loadad–f the
d and
iled a
Drmax= 1.25 cm s0.49 in.d
It follows that:
l t2
20,000 ·h=
108.52 in.2
20,000s5.5 in.d= 0.272 cms0.107 in.d s8d
Since the maximum vertical deflectionDmax exceeds the valuexpressed in Eq.(8), according to the protocol, it is necessarycheck the recovery deflection and compare it with the follow
Dmax
4=
1.85 in.
4= 0.209 cms0.87 in.d s9d
Also this check is not satisfactory, being
Dr,maxùDmax
4s10d
It was opted not to repeat the load test after 72 h as allowethe code and considering that the structure was not caparesist the new test load.
Fig. 9. Load versus time plot for 24 h load test
Fig. 10. Load versus displacement plot for 24 h load test
46 / PRACTICE PERIODICAL ON STRUCTURAL DESIGN AND CONSTRUC
Diagnostic Cyclic Load Test
The slab was tested in a total of six load cycles. The firstcycle consisted of five load steps, each increased by no mor53.4 kN s12 kipd, corresponding to the 10% of the total test ldecided and without exceeding 50% of the total test l266.7 kNs60 kipd (see Fig. 11). At the end of each load step aonce the maximum load level for the cycle was reached, thewas maintained until deflections have stabilized, and at lea2 min as prescribed. During the unloading phase, the loadheld constant at the same load levels as for the loading stepsleast 2 min(see Fig. 11). During the last unloading step of eacycle, the load was maintained to 53 kNs12 kipd in order to leavethe test devices engaged. The second load cycle was a repthe previous one.
The third and fourth load cycles, indicated in Fig. 11 withand D, were performed according to the protocol previouslyscribed and achieved a maximum load level of 400 kNs90 kipd,following the same loading–unloading procedure. The lastcycles, E and F, reached the total test load of 534 kNs120 kipdfollowing the same procedure as for the other cycles. The tesperformed in a total time of 2 h and 30 min.
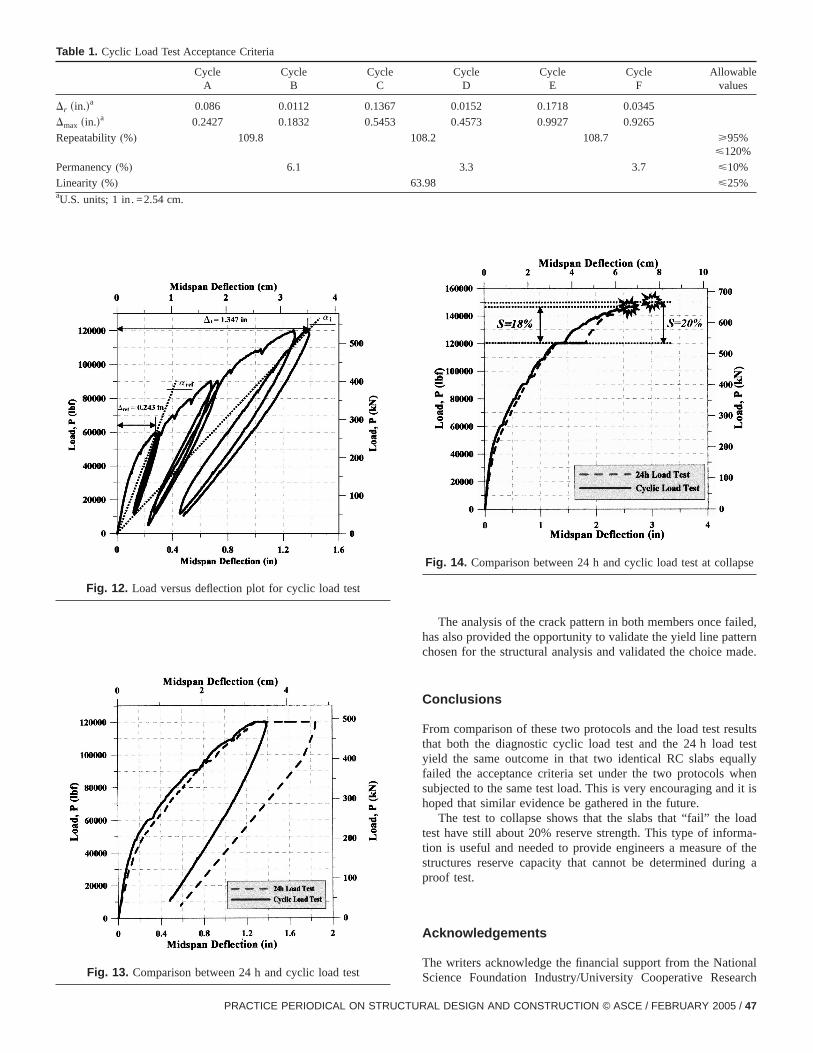
All three acceptance criteria for the cyclic load test areported for all cycles in Table 1. The only parameter that doerespect the limits set isDeviation from Linearity, leading to tesfailure (see Fig. 12).
Fig. 13 shows a comparison of load–deflection envelopethe two load tests. When the test load is held for 24 h, the mber experiences a larger deflection compared to the one shothe cyclic load test.
Ultimate Collapse Load Analysis
The slabs were loaded to failure in order to determine theirmate capacity, and the safety margin between the ultimateand the maximum test load. Fig. 14 shows the two lodeflection envelopes and the last cycle till partial collapse omember is clearly indicated.
As expected both slabs reached the same ultimate loacollapsed with the same failure mode.
A safety margin, defined as
Ss%d = S1 +PTLoad
Pu-failureD 3 100%< H18% cyclic
20% 24 hs11d
indicates that the strength reserve of a system that has fa
Fig. 11. Load versus time plot for cyclic load test
load test is still appreciable.
TION © ASCE / FEBRUARY 2005
iled,ttern
ade.
sultstest
uallywhend it is
loadrma-of thering a
onal
pse
PRACTICE PERIODICAL ON STRUCTUR
The analysis of the crack pattern in both members once fahas also provided the opportunity to validate the yield line pachosen for the structural analysis and validated the choice m
Conclusions
From comparison of these two protocols and the load test rethat both the diagnostic cyclic load test and the 24 h loadyield the same outcome in that two identical RC slabs eqfailed the acceptance criteria set under the two protocolssubjected to the same test load. This is very encouraging anhoped that similar evidence be gathered in the future.
The test to collapse shows that the slabs that “fail” thetest have still about 20% reserve strength. This type of infotion is useful and needed to provide engineers a measurestructures reserve capacity that cannot be determined duproof test.
Acknowledgements
The writers acknowledge the financial support from the Nati
CycleD
CycleE
CycleF
Allowablevalues
0.0152 0.1718 0.0345
0.4573 0.9927 0.9265
8.2 108.7 ù95%ø120%
3.3 3.7 ø10%
.98 ø25%
Fig. 14. Comparison between 24 h and cyclic load test at colla
Table 1. Cyclic Load Test Acceptance Criteria
CycleA
CycleB
CycleC
Dr sin.da 0.086 0.0112 0.1367
Dmax sin.da 0.2427 0.1832 0.5453
Repeatability(%) 109.8 10
Permanency(%) 6.1
Linearity (%) 63aU.S. units; 1 in. =2.54 cm.
Fig. 12. Load versus deflection plot for cyclic load test
Fig. 13. Comparison between 24 h and cyclic load test
Science Foundation Industry/University Cooperative ResearchAL DESIGN AND CONSTRUCTION © ASCE / FEBRUARY 2005 / 47

uisthe
ts
eck
itutelifor-
,
.
of
tri-
went
n ofnd
d6,
P
n.”
s.”lla,
ys-air
as.
nsituUse
Center at the Univ. of Missouri-Rolla and thank the St. LoCounty for providing the opportunity for the testing ofstructure.
Notation
The following symbols are used in this paper:D 5 dead loads already in place;
Dmax 5 measured maximum deflection;Drmax 5 measured maximum residual deflection;
h 5 overall thickness of the member(in.);L 5 live loads applied;l t 5 span of the member under load test(in.);
Pmax 5 maximum test load for one cycle;Pmin 5 minimum test load for one cycle to maintain
engaged the testing equipment;PTLoad 5 total test load applied to the member;Pu-failure5 total test load applied at partial collapse of the
member;TTL 5 total test load applied during the load test;
DmaxB 5 maximum deflection in Cycle B under a load of
Pmax;Dr
B 5 residual deflection after Cycle B under a load ofPmin;
DmaxA 5 maximum deflection in Cycle A under a load of
Pmax; andDr
A 5 residual deflection after Cycle A under a load ofPmin.
References
American Concrete Institute(ACI). (2002). “Building code requiremenfor structural concrete and commentary.”ACI 318R-02, FarmingtonHills, Mich.
Bick, R. R. (1998). “Ocean Vista power generation station turbine d
48 / PRACTICE PERIODICAL ON STRUCTURAL DESIGN AND CONSTRUC
rehabilitation project.” 1998 International Concrete Repair InstAward for Outstanding Concrete Repair Recipient, Southern Cania Edison, 26.
Bungey, J. H.(1989). The testing of concrete in structures, 2nd Ed.Chapman and Hall, New York.
Concrete Innovation Appraisal Service(CIAS). (2001). “Guidelines forthe rapid load testing of concrete structural members.”CIAS Rep. No00-1, ACI International, Farmington Hills, Mich.
FitzSimons, N., and Longinow, A.(1975). “Guidance for load testsbuildings” J. Struct. Div. ASCE, 101(7), 1367–1380.
Fling, R. S., McCrate, T. E., and Doncaster, C. W.(1989). Load tescompared to earlier structure failure, Concrete International, Amecan Concrete Institute, Vol. 18, No. 11, 22–27.
Gold, W. J., and Nanni, A.(1998). “In situ load testing to evaluate nerepair techniques.”Proc., NIST Workshop on Standards Developmfor the Use of Fiber Reinforced Polymers for the RehabilitatioConcrete and Masonry Structures, National Institute of Standards aTechnology, Gaithersburg, Md., 102–112.
Hall, W. B., and Tsai, M.(1989). “Load testing, structural reliability antest evaluation.”Structural safety, Elsevier Science, New York, Vol.285–302.
Hogue, T., Conforth, R. C., and Nanni, A.(1999). “Myriad conventioncenter floor system: Issues and needs.”Proc., 4th Int. Symp. on FRfor Reinforcement of Concrete Structures (FRPRCS4).
MacGregor, J. G.(1997). “Reinforced concrete: Mechanics and desig3rd Ed., Prentice–Hall, Englewood, N.J.
Mettemeyer, M.(1999). “In situ rapid load testing of concrete structureMS thesis, Dept. of Civil Engineering, Univ. of Missouri-Rolla, RoMo.
Nanni, A., and Gold, W. J.(1998). “Evaluating CFRP strengthening stems in situ.”Concrete Repair Bull., International Concrete RepInstitute, 11(1), 12–14.
Nanni, A., and Mettemeyer, M.(2001). “Diagnostic load testing oftwo-way postensioned concrete slab.”Pract. Period. Struct. DeConstr. 6(2), 73–82.
RILEM Technical Committee 20-TBS.(1984). “General recommendatiofor static loading test of load-bearing concrete structures in(TBS2).” RILEM Technical Recommendations for the Testing andof Construction Materials, E & FN Spon, London, 379–385.
TION © ASCE / FEBRUARY 2005