parametric optimization of wire cut edm using grey
TRANSCRIPT

PARAMETRIC OPTIMIZATION OF WIRE CUT
EDM USING GREY RELATIONAL ANALYSIS Dr. N.E. Arun kumar*, Dr. R.Sathish* , M.Ganesh**
* Associate Professor, Dept of Mechanical Engg, St.Joseph‟s college of Engineering, Chennai, TN, INDIA
**Assistant Professor, Dept of Mechanical Engg, St.Joseph‟s college of Engineering, Chennai, TN, INDIA
Abstract- The main objectives of this study is to investigate and evaluate the effect of different input process
parameters (pulse on time, pulse off time, wire feed rate, current and wire material) on WEDM
responses.Material removal rate, kerf width, surface roughness have been considered as response parameters for
the Experiment. Experimentation was planned as per Taguchi‟s L27 Orthogonal array during machining of
Monel 400 work material. Molybdenum wire, Brass wire and Cryogenic treated Brass wire electrodes with
0.18mm diameter was used as tool in the experiment.The Effects of input parameters on the responses are
analyzed. This parametric analysis shows thepredominant contribution of parameters on responses individually.
Grey Relational analyses(GRA) are applied to determine the suitable selection of machining parameters for wire
cut EDM process. A grey relational grade obtained from the grey relational analysis is used to optimize the
process parameters. By analyzing the grade we find the optimum parameters and the best wire material to be
machined on Monel 400 material.Further the results were confirmed with confirmation experiments.
Index Terms-GRA,Taguchi method, MRR, SR, KW, Monel 400, WEDM
I. Introduction
One of the most widely used Non-Conventional Machining process in industry is Wire Electrical Discharge
Machining (WEDM) which is used to machine difficult to machine materials. WEDM involves complex
physical and chemical process including heating and cooling. Increased use of newer and harder materials like
titanium, hardened steel, high strength temperature resistant alloys, fiber-reinforced composites and ceramics in
aerospace, nuclear, missile, turbine, automobile, tool and die making industries, a different class of modern
machining techniques such as Wire Electrical Discharge Machining (WEDM) have emerged. These techniques
satisfy the present demands of the manufacturing industries such as better finish, low tolerance, higher
production rate, miniaturization etc.
WEDM is considered as a unique adoption of the conventional EDM process which comprises of a main
worktable, wire drive mechanism, a CNC controller, working fluid tank and attachments. The work piece is
placed on the fixture table and fixed securely by clamps and bolts. The table moves along X and Y-axis and it is
driven by the DC servo motors. Wire electrode usually made of thin copper, brass, molybdenum or tungsten of
diameter 0.05-0.30 mm, which transforms electrical energy to thermal energy, is used for cutting materials
During the WEDM process, the material is eroded ahead of the wire and there is no direct contact between the
work piece and the wire, eliminating the mechanical stresses during machining. Also the work piece and the
wire electrode (tool) are separated by a thin film of dielectric fluid that is continuously fed to the machining
zone to flush away the eroded particles. The movement of table is controlled numerically to achieve the desired
three-dimensional shape and accuracy of the work piece.
In this work, the investigation is proceeded on Monel 400 alloy. In WEDM, various process parameters are set
in the machine and these parameters are varied at different levels. For this an experimental table has been made
using the taguchi design of experiment. L27 orthogonal array is used to conduct experiment at different levels.
Here 5 input factors are varied in 3 levels and 3 response factors are obtained i.e. MRR, SR and kerf width. With
the obtained output factors grey relation is used to analyze these output and to determine the most optimized
parameter in WEDM.
GEDRAG & ORGANISATIE REVIEW - ISSN:0921-5077
VOLUME 33 : ISSUE 02 - 2020
http://lemma-tijdschriften.nl/
Page No:389

II. Literature survey
Jaydeep J.Patel conducted experiments by taking WEDM process parameters are Pulse on-time, Pulse off-time,
wire feed, current, servo voltage and flushing pressure. Experiments were carried out on High Carbon High
Chromium Die Steel (HCHCR) using Molybdenum wire 0.25 mm on Electronica Sprint Cut Model – ELPLPLS
– 40ADLX. The Response parameters noticed for each experiment were MRR, Surface Roughness & Kerf
Width. Grey Relational Analysis has been utilized to evaluate optimal parameter combination to achieve
maximum MRR, minimum roughness value & minimum width of cut; with selected experiment domains.
ANOVA Analysis was conducted to know the percentage contribution of the input parameters on output
parameters. It has been found that Pulse on-time plays most significant parameter in all response.[1]
Nilesh P.Butaniconducted experiments on pure Titanium using WEDM, by taking input process parameters as
wire feed rate, Pulse on-time, Pulse off-time, Peak Current & Servo Voltage and output parameters are MRR,
Kerf width, Surface Roughness & SEM for surface was measured. He used two different wire materials like
Half Hard Brass wire and Zn – Coated Brass wire. For design of experiment, Taguchi methodology of L18
orthogonal array was used & for optimization, Grey Relational Analysis was used. It has been found that Zn-
Coated Brass wire is desirable for maximum MRR and minimum SR with good surface integrity, but Half Hard
Brass wire is desirable for minimum Kerf width. From the SEM photographs, results are that uncoated wire
produces a surface finish with more cracks, craters and melted drops compare to Zn- Coated brass wire. The
tendency of wire breakage is more in case of Half Hard Brass wire. Zn- Coated Brass wires are free from wire
breakage which gives continuous machining without any delay. An excellent combination of better flush ability,
high mechanical strength and good electrical conductivity are the advantages of Zn-Coated Brass wires in
contrast to Half Hard Brass wire.[2]
N.Tosun et.al. employed Taguchi‟s approach to investigate and optimize the effects of dielectric flushing
pressure, pulse duration, wire speed and open circuit voltage on kerf and MRR for AISI 4140 steel and inferred
that the highly significant factors for both, the MRR and the kerf, are open voltage and pulse duration whereas
dielectric flushing pressure and wire speed are less effective factors. It has also concluded that confirmation tests
indicated that it is possible to decrease kerf and increase MRR significantly by using the proposed statistical
technique.[3]
Atul kumar and Dr D.K. Singh have study variation of cutting performance with pulse on time, pulse off time,
open voltage, feed rate override, wire feed, servo voltage, wire tension and flushing pressure were experiment
investigated in wire electric discharge machining processes. Brass wire with 0.25 mm diameter and SKD 61
alloys steel with 10 mm thickness were used as tool and work materials. The output considered has been MRR
and surface roughness. Experimentation has been competed by using Taguchi‟s L18 (21×37) orthogonal array
under different conditions of parameters. Finally it concluded that the MRR increases with the increase in pulse
on time and decrease with increase in pulse off time and open voltage.[4] The effect of feed rate overdrive, wire
feed, servo voltage, wire tension and flushing pressure on MRR is not very significant. For the surface
roughness it decrease with increase of pulse off time open voltage and wire feed and increases with increase in
feed rate override and servo voltage. The effect of other parameter is not significant.[5]
Pujari Srinivasa Rao, Koona Ramji, Beela Satyanarayanastudied Wire- cut electric discharge machining of
Aluminum-24345. Experimentation has been done by using Taguchi‟s L18 (21x37) orthogonal array under
different conditions of parameters. The response of surface roughness is considered for improving the
machining efficiency. Optimal combinations of parameters were obtained by this method. The confirmation
experiment shows, the significant improvement in surface finish (1.03μm) was obtained with this method. The
study shows that with the minimum number of experiments the stated problem can be solved when compared to
full factorial design. All the experiments were conducted on Ultra Cut 843/ ULTRA CUT f2 CNC Wire-cut
EDM machine. The size of the work piece considered for experimentation on the wire-cut EDM is 25 mm x 20
mm x 10 mm. Increasing the discharge energy generally increases surface irregularities due to much more
melting and re-solidification of materials. Hence, it is found that SR tends to decrease significantly with
decrease in IP and TON. The parameters wire tension and spark gap voltage are observed as significant
parameters in obtaining better surface finish.[6,7]
GEDRAG & ORGANISATIE REVIEW - ISSN:0921-5077
VOLUME 33 : ISSUE 02 - 2020
http://lemma-tijdschriften.nl/
Page No:390

Kuriachen Basil, Dr. Josephkunju Paul, Dr. JeojuM.Issac investigates the effect of voltage, dielectric pressure,
pulse on-time and pulse off-time on spark gap of Ti6AL4V alloy. It has been found that pulse on time and pulse
off time have the more impact on the spark gap. The minimum spark gap was obtained as 0.040407mm. The
WEDM experiments were conducted in Electronic Ultracut S1 machine using 0.25 mm brass wire as the tool
electrode. Pulse on time, pulse off time, voltage and dielectric pressure are the four WEDM parameters that
were selected for investigations. In this experimental study two level full factorial experiment is adopted
because this gives allpossible combinations of machine parameters. It can be noticed from that corresponding to
minimum value of pulse off time the spark gap decreases with increase in dielectric pressure, whereas the spark
gap increases with increase in dielectric pressure corresponding to maximum value of pulse off time.[8]
Saurav Datta, Siba Sankar Mahapatra experimented with six process parameters are discharge current, pulse
duration, pulse frequency, wire speed, wire tension and dielectric flow rate; to be varied in three different levels.
D2 tool steel was used as workpiece. Data related to the process responses are material removal rate (MRR),
roughness value of the worked surface and kerf has been measured for each of the experimental runs. It has been
found that that the spark gap increases with increase in pulse on time, whereas spark gap decreases with increase
in pulse off time.[9]
III. SELECTION OF MATERIAL AND MACHINE
Work Material and tool/cutting toolmaterial
Monel 400 superalloy is selected for this work is.Monel is a Nickel-Copper alloy increasingly used in Heat
exchangers in a variety of industries. It has the hardness value of 75 HRB.It is resistant to sea water and steam
at high temperatures as well as to salt and caustic solutions. It is characterized by good general corrosion
resistance, good weldability and moderate to high strength. Corrosion resistance in an extensive range of
marine and chemical environments. From pure water to non oxidizing mineral acids, salts and alkalis. This
alloy is more resistant to nickel under reducing conditions and more resistant than copper under oxidizing
conditions, it does show however better resistance to reducing media than oxidizing. Good mechanical
properties from subzero temperatures up to about 480C.Three cutting tools were used in this work namely
brass, molybdenum and cryogenic treated brass. Cryogenic treatment was done for 24hours at -196oC. These wires are considered as one of the parameter in the work
Table 1: Chemical Composition of Monel 400
ELEMENT C Si Mn P S Cr Mo Ni Fe
WIEGHT % 0.085 0.038 0.85 0.003 0.01 0.051 0.005 62.78 2.10
Schematic of machining
The experimental setup and the experiment is designed and carried out in Concord wire cut electro discharge
machine DK7732 of Monel 400 material by varying machining parameters. The economical type Concord wire
cutting EDM DK7732 is unique, it is widely used in mold, accurate components industry. DK7732 uses
molybdenum wire as electrode wire. This type wire cut EDM is different from brass wire cut EDM which is
widely known in the world. The di-electric fluid (de-ionized water) is continuously flashed through the gap
along the wire, to the sparking area to remove the debris produced during the erosion. A collection tank is
located at the bottom to collect the used wire erosions and then is discarded. The wires once used cannot be
reused again, due to the variation in dimensional accuracy.
Process parameters and output responses
The main goals of WEDM are to achieve a better stability and higher productivity. However, due to a large
number of variables in WEDM, it is difficult to achieve the optimal performance of WEDM processes and the
effective way of solving this problem is to establish the relationship between the response variables of the
process and its controllable input parameters.Throughout this dissertation work input parameters considered for
Wire cut EDM are machining parameters are pulse on time, pulse off time,wire feed rate, current and type of
wire
GEDRAG & ORGANISATIE REVIEW - ISSN:0921-5077
VOLUME 33 : ISSUE 02 - 2020
http://lemma-tijdschriften.nl/
Page No:391

Table: 2 wire EDM input parameters and their levels
In this study most important output performances in WEDM such as Material Removal Rate (MRR), Surface
Roughness (Ra) and kerf width were considered for optimizing machining parameters. The surface finish value
(in μm) was obtained by measuring the mean absolute deviation, Ra (surface roughness) from the average
surface level using Inspex IPX-104 Surface Roughness Tester. The Material Removal Rate (MRR) is
calculated as, MRR (mm3/min) = (L× KW× t× ρ)/ tm where, L=Length of cut (mm), KW=Kerf width (mm),
t=Thickness of plate(mm) tm=Machining time (min) , ρ=Density of Monel 400=8.8×e-3 kg/mm3. Kerf width
has been measured using OPUS Video Measuring Machine Model C-2010.It is measured in millimeters (mm)
IV. DESIGN OF EXPERIMENT
Taguchi method
In this study Taguchi method is used. Dr. Taguchi of Nippon Telephones and Telegraph Company, Japan has
developed a method based on “ORTHOGONAL ARRAY” experiments which gives much reduced “variance”
for the experiment with “optimum settings” of control parameters. “Orthogonal Arrays” (OA) provide a set of
well balanced (minimum) experiments. Signal-to- Noise ratios, which are log functions of desired output, serve
as objective functions for optimization, help in data analysis and prediction of optimum results. According to
Taguchi method, the S/N ratio is the ratio of Signal to Noise where signal represent the desirable value noise
represent undesirable value. Therefore S/N ratio is the ratio of the mean to square deviation. The Taguchi
method aims to find an optimal combination of parameters that have the smallest variance in performance.[7]
The signal-to noise (S/N) ratio measures how the response varies relative to the nominal or target value under
different noise conditions. Taguchi‟s emphasis on minimizing deviation from target to develop measures of the
process output that incorporate both the location of the output as well as the variation. These measures are called
signal to noise ratios. The signal to noise ratio provides a measure of the impact of noise factors on
performance.[10]
V. EXPERIMENTAL DATA
Minitab software help to create the taguchi orthogonal array-L27 and to calculate S/N Ratio based on required
response and provide Analysis of variance table and response plot for deciding significant parameter and to find
(%) percentage contribution of each parameter. Mean S/N ratio plot gives idea about the optimum level for the
factor. It is preferred to do S/N analysis as mean sum of square may be too small in case of mean analysis. It is
very accurate to judge the optimum parameter based on S/N Ratio analysis. Also Minitab assigns rank based on
delta values; rank 1 to the highest delta value, rank 2 to the second highest, and so on. The ranks indicate the
relative importance of each factor to the responses.
S.No MACHINING PROCESS
PARAMETERS
LEVEL 1
LEVEL 2
LEVEL 3
1 Pulse on 35 25 20
2 Pulse off 12 10 8
3 Wire feed rate 0 1 2
4 Current 3 4 5
5 Wire material molybdenum Plain brass Cryogenic
treated brass
GEDRAG & ORGANISATIE REVIEW - ISSN:0921-5077
VOLUME 33 : ISSUE 02 - 2020
http://lemma-tijdschriften.nl/
Page No:392
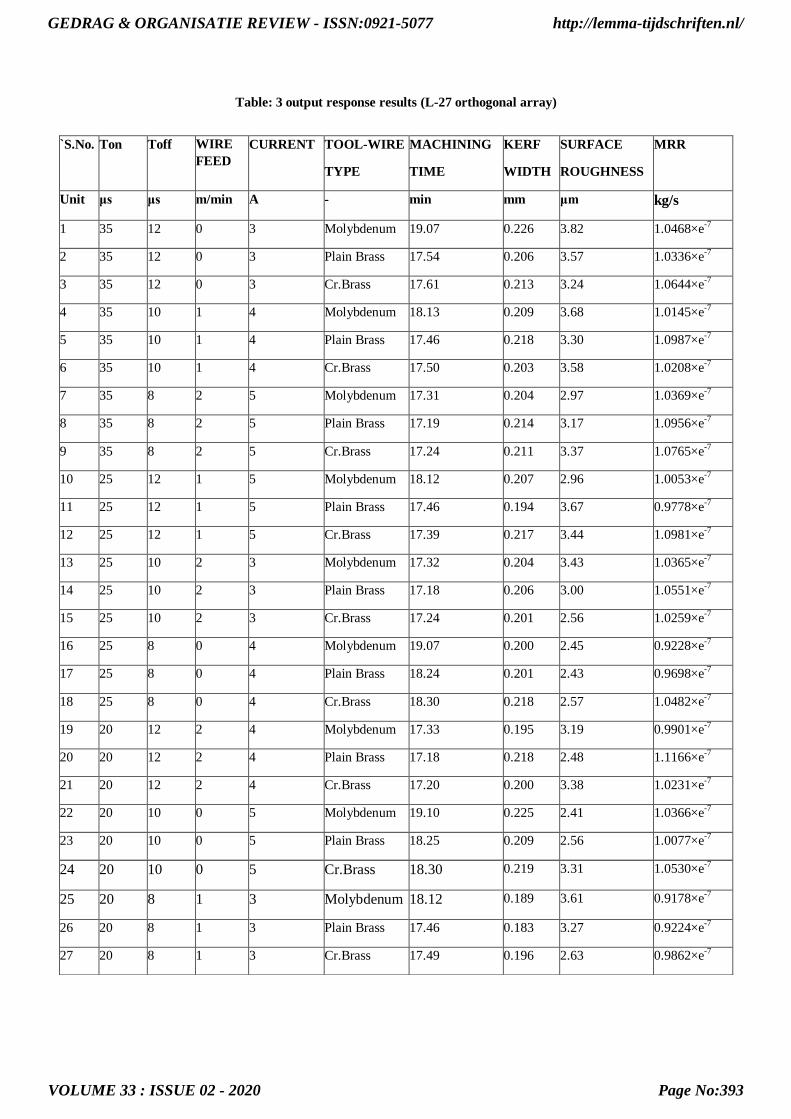
Table: 3 output response results (L-27 orthogonal array)
`S.No. Ton Toff WIRE
FEED
CURRENT TOOL-WIRE
TYPE
MACHINING
TIME
KERF
WIDTH
SURFACE
ROUGHNESS
MRR
Unit μs μs m/min A - min mm μm kg/s
1 35 12 0 3 Molybdenum 19.07 0.226 3.82 1.0468×e-7
2 35 12 0 3 Plain Brass 17.54 0.206 3.57 1.0336×e-7
3 35 12 0 3 Cr.Brass 17.61 0.213 3.24 1.0644×e-7
4 35 10 1 4 Molybdenum 18.13 0.209 3.68 1.0145×e-7
5 35 10 1 4 Plain Brass 17.46 0.218 3.30 1.0987×e-7
6 35 10 1 4 Cr.Brass 17.50 0.203 3.58 1.0208×e-7
7 35 8 2 5 Molybdenum 17.31 0.204 2.97 1.0369×e-7
8 35 8 2 5 Plain Brass 17.19 0.214 3.17 1.0956×e-7
9 35 8 2 5 Cr.Brass 17.24 0.211 3.37 1.0765×e-7
10 25 12 1 5 Molybdenum 18.12 0.207 2.96 1.0053×e-7
11 25 12 1 5 Plain Brass 17.46 0.194 3.67 0.9778×e-7
12 25 12 1 5 Cr.Brass 17.39 0.217 3.44 1.0981×e-7
13 25 10 2 3 Molybdenum 17.32 0.204 3.43 1.0365×e-7
14 25 10 2 3 Plain Brass 17.18 0.206 3.00 1.0551×e-7
15 25 10 2 3 Cr.Brass 17.24 0.201 2.56 1.0259×e-7
16 25 8 0 4 Molybdenum 19.07 0.200 2.45 0.9228×e-7
17 25 8 0 4 Plain Brass 18.24 0.201 2.43 0.9698×e-7
18 25 8 0 4 Cr.Brass 18.30 0.218 2.57 1.0482×e-7
19 20 12 2 4 Molybdenum 17.33 0.195 3.19 0.9901×e-7
20 20 12 2 4 Plain Brass 17.18 0.218 2.48 1.1166×e-7
21 20 12 2 4 Cr.Brass 17.20 0.200 3.38 1.0231×e-7
22 20 10 0 5 Molybdenum 19.10 0.225 2.41 1.0366×e-7
23 20 10 0 5 Plain Brass 18.25 0.209 2.56 1.0077×e-7
24 20 10 0 5 Cr.Brass 18.30 0.219 3.31 1.0530×e-7
25 20 8 1 3 Molybdenum 18.12 0.189 3.61 0.9178×e-7
26 20 8 1 3 Plain Brass 17.46 0.183 3.27 0.9224×e-7
27 20 8 1 3 Cr.Brass 17.49 0.196 2.63 0.9862×e-7
GEDRAG & ORGANISATIE REVIEW - ISSN:0921-5077
VOLUME 33 : ISSUE 02 - 2020
http://lemma-tijdschriften.nl/
Page No:393

Signal to Noise ratio
The signal to noise ratio provides a measure of the impact of noise factors on performance.The Signal to Noise
ratio measure how the response varies relative to the nominal or target value under different noise conditions.
Depending on the required objective characteristics, there are three types of S/N ratio- the lower- the better and
the higher-the-better.
Larger is better: Choose when the goal is to maximize the response.
For higher-the-better type problems
S/N Ratio = -10log10{(1/r)*(r∑i=1 (1/yij)2)} ---------------------------------------------------------------------------(1)
Smaller is better: choose when the goal is to minimize the response.
For lower-the-better type problems
S/N Ratio == -10log10{(1/r)*(r∑i=1 (yij)2)} ---------------------------------------------------------------------------(2)
However, according to Taguchi based methodology, the characteristic that a larger value represents the better
machining performance, such as Material removal rate is called larger-the-better type problem. On the other
hand, the characteristic that smaller value indicates better machining performance such as Surface roughness
and Kerf width is addressed as smaller- the-better type problem.
Table: 4 S/N ratio for all output response
Exp Material Kerf Surface
No. Removal Rate Width Roughness
1 -139.603 12.917837min
-11.64127min
2 -139.7132 13.72266 -11.05336
3 -139.4582 13.4324 -10.2109002
4 -139.87496 13.59707 -11.316956
5 -139.18258 13.23087 -10.37028
6 -139.82119 13.85008 -11.07766
7 -139.68501 13.8074 -9.45513
8 -139.20696 13.39172 -10.02118
9 -139.35948 13.51435 -10.5526
10 -139.95452 13.68059 -9.42583
11 -140.19482 14.24397 -11.293321
12 -139.18724 13.27081 -10.731169
13 -139.68869 13.8074 -10.705882
14 -139.53396 13.72266 -9.54243
15 -139.7779 13.93608 -8.1648
16 -140.69766 13.9794 -7.78332
17 -140.26671 13.93608 -7.71212
18 -140.59095 13.23087 -8.19866
19 -140.08607 14.19931 -10.07581
20 -139.04228max
13.23087 -7.889
21 -139.80121 13.9794 -10.57833
22 -139.68744 12.95635 -7.64034max
23 -139.93337 13.59707 -8.1648
24 -139.55143 13.191117 -10.39656
25 -140.74466min
14.47076 -11.15014
26 -140.70161 14.75097max
-10.29095
27 -140.1207 14.15488 -8.399115
GEDRAG & ORGANISATIE REVIEW - ISSN:0921-5077
VOLUME 33 : ISSUE 02 - 2020
http://lemma-tijdschriften.nl/
Page No:394

Normalisation of S/N ratio
In this research work, normalization of S/N Ratio of material removal rate, surface roughness and kerf width is
done between 0 and 1. Here for material removal rate surface roughness and kerf width, normalization equation
larger-the-better, smaller-the-better is used
For Higher the better
ᵡi(k)=[ᵡi(k)–minᵡi(k)]/[maxᵡi(k)-minᵡi(k)] -------------------------------------------------------------------(3)
For Lower the better
ᵡi(k)=[maxᵡi(k)–ᵡi(k)]/[maxᵡi(k)-minᵡi(k)] ------------------------------------------------------------------(4)
Table 5 Normalization S/N Ratio
Exp No.
Material Removal
Rate
Kerf
Width
Surface
Roughness
1 0.67063 1 1
2 0.60589 0.56095 0.85306
3 0.75568 0.71929 0.64249
4 0.51087 0.62947 0.91894
5 0.91758 0.82923 0.68233
6 0.54246 0.49145 0.85913
7 0.62245 0.51473 0.45359
8 0.90327 0.74149 0.59507
9 0.81367 0.67459 0.72789
10 0.46414 0.58391 0.44627
11 0.32298 0.27657 0.91303
12 0.91485 0.80745 0.77253
13 0.62029 0.51473 0.76621
14 0.71118 0.56096 0.47541
15 0.56789 0.44453 0.13108
16 0.02761 0.4209 0.03574
17 0.28075 0.44453 0.01794
18 0.6777 0.82923 0.13955
19 0.38686 0.30094 0.60873
20 1 0.82923 0.06215
21 0.55419 0.4209 0.73433
22 0.62102 0.97899 0
23 0.47656 0.62947 0.13108
24 0.70092 0.85092 0.68889
25 0 0.15286 0.87725
26 0.02529 0 0.66249
27 0.36652 0.32517 0.18965
GEDRAG & ORGANISATIE REVIEW - ISSN:0921-5077
VOLUME 33 : ISSUE 02 - 2020
http://lemma-tijdschriften.nl/
Page No:395

Calculation of Deviation Sequence
In this work, to find out grey relation coefficient, one has to calculate deviation sequence using equation (6.4)
shown in table 6.3.The deviation sequences Δoi, Δmax (k), and Δmin (k), for i=1-27 and k=1-3 can be
calculated as follows:
Δ0i (k) = ǀxo(k)−xi(k)ǀ ---------------------------------------------------------------------------(5)
In the above formula the value of xo(k) = 1 for all calculations
Table 6 Deviation sequence
Exp
No.
Material
Removal Rate
Kerf
Width
Surface
Roughness
1. 0.32937 0.00000 0.00000
2. 0.39411 0.43904 0.14694
3. 0.24432 0.28071 0.35751
4. 0.48913 0.37053 0.08106
5. 0.08242 0.17077 0.31767
6. 0.45754 0.50855 0.14087
7. 0.37755 0.48527 0.54641
8. 0.09674 0.25851 0.40493
9. 0.18633 0.32541 0.27211
10. 0.53586 0.41609 0.55373
11. 0.67702 0.72343 0.08697
12. 0.08515 0.19255 0.22747
13. 0.37971 0.48527 0.52459
14. 0.28882 0.43904 0.86892
15. 0.43211 0.55547 0.96426
16. 0.97239 0.57910 0.96426
17. 0.71925 0.55547 0.98206
18. 0.32230 0.17077 0.86045
19. 0.61314 0.69906 0.39127
20. 0.00000 0.17077 0.93785
21. 0.44581 0.57910 0.26567
22. 0.37898 0.02101 1.00000
23. 0.52344 0.37053 0.86892
24. 0.29908 0.14908 0.31111
25. 1.00000 0.84714 0.12275
26. 0.97471 1.00000 0.33751
27. 0.63348 0.67483 0.81035
GEDRAG & ORGANISATIE REVIEW - ISSN:0921-5077
VOLUME 33 : ISSUE 02 - 2020
http://lemma-tijdschriften.nl/
Page No:396

Δ0i(k)+ψΔmax
Calculation of grey relational coefficient and grey relational grade
Grey relational coefficient
Following data pre-processing, a grey relational coefficient is calculated to express the relationship between the
ideal and actual normalized experimental results. The Grey relation coefficient can be expressed as follows.
Δmin + ψΔmax ζi(k) = ------------------------------------------------------------------------(6)
In the above formula the value of ψΔmax = 0.5 for all calculations carried out and the value of Δ0i(k) is
obtained from the previous table and the value of Δmin is always 0.
Grey relational grade
γi = [{1/3}*{ ζi(1) + ζi(2) + ζi(3) }]---------------------------------------------------------------------------------------(7)
The value of ζi(k) is obtained from previous table.
In Grey relation analysis, the grey relation grade is used to show the relationship among the sequences. If the
two sequences are identical, then the value of Grey relation grade is equal to 1.The Grey relation grade also
indicates the degree of influence that the comparability sequence could exert over the reference sequence.
Therefore, if a particular comparability sequence is more important than the other comparability sequence to
reference sequence will be higher than other grey relation grades. Table 7 lists the grey relational coefficient and
grade for each experiment of the L27 orthogonal array.
Table 8 Calculation of Grey relational coefficient & Grey relational grade
S.No.
GREY RELATIONAL COEFFICIENT
GREY
RELATIONAL
GRADE
MRR
KERF
WIDTH
SURFACE
ROUGHNESS
1 0.60287 1 1 0.86762
2 0.55922 0.53246 0.77287 0.62152
3 0.67175 0.64044 0.58308 0.63176
4 0.50549 0.57436 0.86049 0.64678
5 0.85849 0.74541 0.61149 0.73846
6 0.52217 0.49576 0.78019 0.59937
7 0.56977 0.50748 0.47782 0.51836
8 0.83789 0.65919 0.55253 0.6832
9 0.72852 0.60576 0.64758 0.66062
10 0.48269 0.5458 0.4745 0.50099
11 0.4248 0.40869 0.85183 0.56177
12 0.85448 0.72197 0.68731 0.75459
13 0.56837 0.50748 0.68139 0.58575
14 0.63386 0.53246 0.488 0.55144
15 0.53642 0.47372 0.36525 0.45846
16 0.33958 0.46335 0.34147 0.38147
17 0.41009 0.47372 0.33737 0.40706
18 0.60805 0.74541 0.36753 0.57366
19 0.44918 0.41699 0.56099 0.47572
20 1 0.74541 0.34774 0.69772
21 0.52865 0.46335 0.65302 0.54834
22 0.56884 0.95967 0.33333 0.62061
23 0.48855 0.57436 0.36525 0.47605
24 0.62572 0.77032 0.61644 0.67083
25 0.33333 0.37116 0.80289 0.50246
26 0.33905 0.33333 0.59701 0.42313
27 0.44112 0.42559 0.38158 0.4161
GEDRAG & ORGANISATIE REVIEW - ISSN:0921-5077
VOLUME 33 : ISSUE 02 - 2020
http://lemma-tijdschriften.nl/
Page No:397

Response tables
Table 9 Response table for grey relational grade
It is found that the values that are in „*‟ indicates that corresponding value is the highest among the
corresponding parameter. The corresponding level is the optimized value for the above machining parameters.
The optimized parameter value for Pulse on, Pulse off, Wire feed, Current and Wire material is 35(μs),12(μs),0
(m/min),5(A),Plain brass respectively.
Individual response table
The following tables gives the Individual Response Table for each performance characteristics
MRR
Table 10 Individual Response table for MRR
Wire material > Wire feed > Ton> Toff> Current
The above table shows that MRR is affected mostly by the wire material.
MACHINING
PARAMETERS AVERAGE GREY RELATIONAL GRADE BY
FACTOR LEVEL
Level 1 Level 2 Level 3
Ton 0.66308* 0.53058 0.53677
Toff 0.62889* 0.59419 0.50734
Wire feed 0.58339* 0.57152 0.57551
Current 0.56203 0.56317 0.60522*
Wire material 0.56664 0.59041* 0.57337
MACHINING
PARAMETERS
AVERAGE GREY RELATIONAL
COEFFICIENT OF MRR BY FACTOR LEVEL
Difference
between max.
and
min. factor
levels Level 1 Level 2 Level 3
Ton 0.65068 0.53982 0.53049 0.12019
Toff 0.61929 0.58977 0.51193 0.10736
Wire feed 0.54163 0.52907 0.65030 0.12123
Current 0.52067 0.58019 0.62014 0.09947
Wire material 0.49112 0.61688 0.61299 0.12576
GEDRAG & ORGANISATIE REVIEW - ISSN:0921-5077
VOLUME 33 : ISSUE 02 - 2020
http://lemma-tijdschriften.nl/
Page No:398

Kerf Width
Table 11 Individual Response table for Kerf Width
MACHINING
PARAMETERS
AVERAGE GREY RELATIONAL
COEFFICIENT OF KERF WIDTH BY
FACTOR LEVEL
Difference
between max.
and min. factor
levels Level 1 Level 2 Level 3
Ton 0.64009 0.54140 0.56224 0.09869
Toff 0.60835 0.62595 0.50944 0.11651
Wire feed 0.68441 0.51356 0.54576 0.17085
Current 0.53518 0.56931 0.63925 0.10407
Wire material 0.59403 0.55611 0.59359 0.03792
Wire feed > Toff> Current > Ton>Wire material
The above table shows that Kerf Width is affected mostly by the wire feed.
Surface roughness
Table 12 Individual Response table for Surface Roughness
MACHINING
PARAMETERS
AVERAGE GREY RELATIONAL
COEFFICIENT OF SURFACE
ROUGHNESS BY FACTOR LEVEL
Difference
between max.
and min. factor
levels Level 1 Level 2 Level 3
Ton 0.69845 0.51052 0.51758 0.18793
Toff 0.65904 0.56687 0.50064 0.15840
Wire feed 0.52415 0.67192 0.53048 0.14777
Current 0.63023 0.54003 0.55629 0.09020
Wire material 0.61476 0.54712 0.56466 0.06764
Ton> Toff> Wire feed > Current > Wire material
The above table shows that Surface Roughness is affected mostly by the Pulse on time.
Confirmation test
The purpose of the confirmation runs is to validate the conclusion drawn during the analysis phases. In
addition, the confirmation tests need to be carried out in order to ensure that the theoretical predicted parameter
combination for optimum results using the software is acceptable or not. The parameters used in the
confirmation test are suggested by grey relational analysis. The confirmation test with optimal process
parameters is performed for Wire cut EDM of Monel 400 at levels A1 (35 μs Pulse on time), B1 (12 μs Pulse off
GEDRAG & ORGANISATIE REVIEW - ISSN:0921-5077
VOLUME 33 : ISSUE 02 - 2020
http://lemma-tijdschriften.nl/
Page No:399

time), C1 (0 Wire feed), D1 (5 A Current), E1(plain brass wire material) , and it gives material removal rate of
1.0876×e-7 kg/s, surface roughness of 2.60 μm and kerf width of 0.216 mm.
VI. RESULTS AND DISCUSSION
After performing the experiment for all 27 runs and measuring the output parameters like kerf width, surface
roughness and material removal rate for wire cut EDM of Monel 400, the results generated are discussed in this
chapter.
Main effect plot for kerf width, surface roughness and MRR
Fig 1Main effect plot for kerf width Fig 2Main effect plot for Surface roughness
Fig 3Main effect plot for MRR
From the Fig.1 the first graph shows the effect of pulse on time on kerf width. From Fig1, it is clearly shown
that with increase in pulse on time, kerf width increases.The second graph indicate the effect of pulse off time
on kerf width. It is clearly shown that with increase in pulse off time, kerfwidth increases and then decreases.
The third graph presents the effect of wire feed rate on kerf width. It presents that when wire feed rate increases
then kerf width suddenly decreases.[11] When wire feed further increases then kerf width also increases in small
amount.The fourth graph indicates the effect of current on kerf width. It states that if current increases then kerf
width increases.It is found from the fourth graph that kerf width increases linearly with increase in current.The
fifth graph shows the effect of wire material on kerf width. It is shown that when the molybdenum wire is used
the value of kerf width is 0.2069mm. When the plain brass wire is used then kerf width is 0.2056mm. When the
cryogenic treated wire is used then kerf width is 0.2086mm.
From Fig.2, the first graph shows the effect of pulse on time on surface roughness. It is shown that with increase
in pulse on time, surface roughness first gradually decreases and then suddenly increases.[12] The second graph
indicate the effect of pulse off time on surface roughness. It is shown that with increase in pulse off time,
surface roughness increases. The third graph presents the effect of wire feed rate on surface roughness. It
presents that when wire feed rate increases then surface roughness increases in large amount.[13] When it
further increases then surface roughness value decreases.In the fourth graph indicate the effect of current on
surface roughness. It states that if current increases then surface roughness decreases. Now, if current further
GEDRAG & ORGANISATIE REVIEW - ISSN:0921-5077
VOLUME 33 : ISSUE 02 - 2020
http://lemma-tijdschriften.nl/
Page No:400

increases then there is increase in surface roughness.The fifth graph shows the effect of wire material on Surface
roughness. It is shown that when the molybdenum wire is used the value of Surface roughness is 3.168 μm.
When the plain brass wire is used then Surface roughness is 3.05 μm. When the cryogenic treated wire is used
then Surface roughness is 3.12 μm.
From Fig.3 the first graph shows the effect of pulse on time on material removal rate. It is shown that with
increase in pulse on time, material removal rate increases.[14]The second graph indicate the effect of pulse off
time on material removal rate. It is clearly shown that with increase in pulse off time, material removal rate also
increases. The third graph presents the effect of wire feed rate on material removal rate. It present that when
wire feed rate increases then material removal rate decreases.[15] When it further then material removal rate
increases. The fourth graph indicate the effect of current on material removal rate. It states that if current
increases then material removal rate increases. The fifth graph shows the effect of wire material on material
removal rate. It is shown that when the molybdenum wire is used the value of material removal rate is
1.0008×e-7 kg/s. When the plain brass wire is used then material removal rate is 1.0308×e-7 kg/s. When the
cryogenic treated wire is used then material removal rate is 1.044×e-7 kg/s.
Surface morphology
Surface morphology plays an important part in understanding the characteristics of machined surfaces. During
WEDM process, the discharged energy produces very high temperature spark, causing a minute part of the
specimen to melt and vaporize. With each discharge, a crater is formed on the machined surface. SEM was
conducted in order to compare the surface integrity for the low surface roughness value, high surface roughness
value and optimal value obtained from grey relational analysis of Monel 400.
Fig.4Magnification of 100x Fig.5Magnification of 1000x Fig.6Magnification of 2000x
Machined surface having low surface roughness
Fig.7Magnification of 100x Fig.8Magnification of 1000x Fig.9Magnification of 2000x
Machined surface having high surface roughness
Fig.10Magnification of 100x Fig.11Magnification of 1000x Fig.12Magnification of 2000x
Surface machined with optimized parameters
GEDRAG & ORGANISATIE REVIEW - ISSN:0921-5077
VOLUME 33 : ISSUE 02 - 2020
http://lemma-tijdschriften.nl/
Page No:401
The above Figures shows the SEM images for Low SR, High SR and optimized result at different
magnificationFrom the examination of the surface characteristics that are showed in the above figures, it is
observed that the surface with low roughness has less recast layer than the surface with high surface
roughness.[16] Fig 4, 5, 6 shows that small round particles are the re-solidified particles and are evenly
distributed. Fig.7, 8, 9 shows the uneven distribution of re-solidified particles, more recast layers and cracks
somewhere these causes the surface to be rough. Fig 10, 11, 12 shows the small particles and the recast layer has
been distributed in very small places. The re-solidified particles are less in this fig when compared with the
above two surfaces, it confirms that the optimized result has the better surface finish.
VII. CONCLUSION
In the presented work, experiments are carried out for material removal rate, surface roughness and kerf width
with variables as pulse on time, pulse off time, flushing pressure, wire tension, servo voltage and wire feed rate.
There are 27 experimental readings taken for all variables to conduct the parametric study.
Finally it can be concluded that:
•Grey relational analysis is done to find out optimal parameter levels. After grey relational analysis, it is found
that optimal parameter levels are pulse on time at level 1 (35 μs), pulse off time at level 1 (12 μs), wire feed at
level 1 (0), Current (5 A) and wire material (plain brass wire). And it gives material removal rate of 1.0876×e-7
kg/s, surface roughness of 2.60 μm and kerf width of 0.216 mm.
•Increase of Pulse on time generates more spark energy as the length of time that electricity supply increases.
MRR, Kerf width and SR all response increasing with pulse on time. Pulse on time found most significant
parameter in all response. Surface roughness also increases with increase of pulse on time because the increases
of pulse on time produce crater with broader and deeper characteristic.
•Pulse off time has opposite effect to pulse on time.MRR decrease with increase of pulse off time, while surface
roughness reduces. During off time removed material flushed away. More the off time better the flushing
•Wire feed, Current and wire material has the least effect when compared to the pulse on time and pulse off
time.
REFERENCES
1. Jaydeep J. Patel, V.D.Patel “Optimization of WEDM process parameter by Grey relational analysis”
International Journal of Research in Engineering and Technology, Volume: 05 Special Issues: 11
NCAMESHE – 2014, June-2014
2. Nilesh P Butani, “An Experimental investigation of electrode material on MRR, kerf width and SR in
wire EDM of pure titanium” International Journal for Scientific Research and Development, Volume
2,Issue 10,December 2014.
3. Tosun Nihat, Cogun Can, Tosun Gul “A study on kerf and material removal rate in wire electrical
discharge machining based on Taguchi method” Journal of Materials Processing Technology 152
(2004) 316– 322.
4. Balasubramanian S. Dr. Ganapathy S. “Grey Relational Analysis to determine optimum process
parameters for Wire Electro Discharge Machining (WEDM)” International Journal of Engineering
Science and Technology (IJEST) Vol. 3 No. 1 Jan 2011.
5. Ramakrishnana R., Karunamoorthy L. “Modeling and multi-response optimization of Inconel 718 on
machining of CNC WEDM process” journal of materials processing technology 207 (2008) 343–349.
6. Pujari Srinivasa Rao, Dr. KoonaRamji, prof. BeelaSatyanarayana, Prediction of Material removal rate
for Aluminium BIS-24345 Alloy in wire-cut EDM, International Journal of Engineering Science and
Technology Vol. 2 (12), 2010, 7729-7739.
7. Gaurav Sachdeva, Ravinder Khanna, Parveen Yadav, Amit Nara and Narender Singh,“Experimental
study of H-21 punching dies on wire-cut electric discharge machine using Taguchi‟s method”,
International Journal of Scientific & Engineering Research, 4(5), 559-567 (2013).
GEDRAG & ORGANISATIE REVIEW - ISSN:0921-5077
VOLUME 33 : ISSUE 02 - 2020
http://lemma-tijdschriften.nl/
Page No:402

8. Kuriachen Basil, Dr. Josephkunju Paul, Dr. JeojuM.Issac, Spark Gap Optimization of WEDM Process
on Ti6Al4V, International Journal of Engineering Science and Innovative Technology (IJESIT)
Volume 2, Issue 1, January 2013
9. S. Datta and S. S. Mahapatra, “Modeling, Simulation and Parametric Optimization of Wire EDM
Process Using Response Surface Methodology Coupled with Grey Taguchi Technique”, International
Journal of Engineering, Science and Technology,162-183 (2010).
10. S.Mahapatra and A. Patnaik, “Optimization of Wire Electrical Discharge Machining (WEDM) Process
Parameters Using Taguchi Methods”, International Journal of Advance Manufacturing Technology, 34,
911- 925(2006).
11. Atul J Patel ,Prof.Satyam P Patel, “Parametric Optimization of Wire Cut EDM Machine on Hard Steel
Alloy with Multiple Quality Characteristics”, 4(2), 74-77(2013).
12. Gaurav Sachdeva, Ravinder Khanna, Parveen Yadav, Amit Nara and Narender Singh, “Experimental
study of H-21 punching dies on wire-cut electric discharge machine using Taguchi‟s method”,
International Journal of Scientific & Engineering Research, 4(5), 559-567 (2013).
13. S.B. Prajapati and N. S. Patel, “Effect of Process Parameters on Performance Measures of Wire EDM
for AISI A2 Tool Steel”, International Journal of Computational Engineering Research, 03, 274- 278
(2013).
14. Lokesh Goyat, Rajesh Dudi and Neeraj Sharma , “Investigation of Process Parameters Contribution
and their Modeling in WEDM for D-2 Tool Steel Using ANOVA”, Global Journal of Enginering,
Design andTechnology,2(3),41-46(2013).
15. K.P.Rajurkar, FarnazNourbakhsh, A.P.Malshe, Jian Cao,“Wire electro-discharge machining of
titanium alloy”, The Authors. Published by Elsevier B.V., 2212-8271, (2013).
16. N. E. Arun Kumar & A. Suresh Babu (2018) ,Influence of input parameters on the near-dry WEDM of
Monel alloy, Materials and Manufacturing Processes, 33:1, 85
92, DOI: 10.1080/10426914.2017.1279297(2018)
GEDRAG & ORGANISATIE REVIEW - ISSN:0921-5077
VOLUME 33 : ISSUE 02 - 2020
http://lemma-tijdschriften.nl/
Page No:403