parametric study of hip fracture risk using qct-based
TRANSCRIPT

echT PressScienceComputers, Materials & ContinuaDOI:10.32604/cmc.2022.018262
Article
Parametric Study of Hip Fracture Risk Using QCT-Based Finite ElementAnalysis
Hossein Bisheh1,2, Yunhua Luo1,3 and Timon Rabczuk2,*
1Department of Mechanical Engineering, University of Manitoba, Winnipeg, R3T 5V6, Canada2Institute of Structural Mechanics, Bauhaus-Universität Weimar, Weimar, 99423, Germany
3Department of Biomedical Engineering, University of Manitoba, Winnipeg, R3T 5V6, Canada*Corresponding Author: Timon Rabczuk. Email: [email protected]
Received: 03 March 2021; Accepted: 14 September 2021
Abstract:Various parameters such as age, height, weight, and bodymass index(BMI) influence the hip fracture risk in the elderly which is the most commoninjury during the sideways fall. This paper presents a parametric study of hipfracture risk based on the gender, age, height, weight, and BMI of subjectsusing the subject-specific QCT-based finite element modelling and simulationof single-leg stance and sideways fall loadings. Hip fracture risk is estimatedusing the strain energy failure criterion as a combination of bone stresses andstrains leading to more accurate and reasonable results based on the bonefailure mechanism. Understanding the effects of various parameters on hipfracture risk can help to prescribe more accurate preventive and treatmentplans for a community based on the gender, age, height, weight, and BMI ofthe population. Results of this study show an increase in hip fracture risk withthe increase of age, body height, weight, and BMI in both women and menunder the single-leg stance and the sideways fall configurations.
Keywords: Hip fracture risk; finite element model; strain energy; parametricstudy
1 Introduction
Hip fracture is one of the common injuries during the sideways fall especially for the elderlieswhere it may cause long-term disability and even death of individuals [1]. Due to the increasingtrend of hip fracture over the world [2], especial attention should be paid to this issue to considerproper preventive and treatment actions. Precise hip fracture risk prediction and study on theeffective parameters on hip fracture occurrence in the elderlies assist surgeons and specialists todesign appropriate treatment plans and effective hip protectors.
In the past decades, developments and advances in imaging technologies, i.e., Dual-EnergyX-ray Absorptiometry (DXA) and Quantitative Computed Tomography (QCT), and numericalmethods such as the finite element (FE) method could create a reliable tool for accurate hip frac-ture risk assessment without the limitations of the statistical models depending on measuring bonemineral density (BMD). A combination of QCT imaging and FE modelling has been employed
This work is licensed under a Creative Commons Attribution 4.0 International License,which permits unrestricted use, distribution, and reproduction in any medium, providedthe original work is properly cited.
1350 CMC, 2022, vol.71, no.1
in many studies to predict hip fracture risk, high stress and strain regions, and failure loadsof human femur. For example, Kheirollahi et al. [3–6] proposed studies estimating hip fracturerisk index and determining high-risk regions of the human femur using the strain energy failurecriterion via QCT-based FE modelling. A comparative study was presented by Bisheh et al. [7]to assess hip fracture risk based on different failure criteria using QCT-based FE modelling.Dragomir-Daescu et al. [8] presented a robust QCT-based FE model which can calculate proximalfemur stiffness and hip fracture load during a sideways fall. Gong et al. [9] studied on the relationbetween femoral strength and BMD, and also the relation between a material distribution andgeometric morphology by nonlinear FE analysis. Koivumäki et al. [10] presented a CT-based FEmodel to estimate experimentally measured failure loads in the proximal femur. Luo et al. [11]estimated hip fracture risk using DXA-based patient-specific FE modelling according to the stresscriterion. In another study by Mirzaei et al. [12], the strength and failure patterns of the humanproximal femur were obtained using the QCT-based FE method.
In addition to imaging technologies and numerical methods, human body parameters suchas age, height, weight, and body mass index (BMI) have great effects on the hip fracture riskassessment. Hence, a study considering various body parameters can be useful to prevent probablehip fracture in the elderly and propose an appropriate treatment for the case of hip fractureoccurrence. Parametric studies of hip fracture risk based on the gender, age, height, weight, andBMI of subjects lead to a precise estimation of hip fracture in relation to the specificationsand lifestyle of a community. To the authors’ knowledge, there is no study in the literatureconsidering various human body parameters on hip fracture risk using QCT-based FE modellingand strain energy criterion. The main objective of this study is to find the relation of human bodyparameters with the hip fracture occurrence by integration of QCT imaging technology and FEsimulation based on the strain energy criterion which is a combination of both stress and straineffects leading to a more accurate assessment of hip fracture risk [4].
In this paper, the correlations between the hip fracture risk and different human body param-eters such as age, body height, body weight, and BMI are investigated and attained for 30 females(totally 60 right and left femurs) and 30 males (totally 60 right and left femurs). To this purpose,we construct a subject-specific QCT-based FE model of the femur using Mimics and ANSYSsoftware based on the QCT data of subjects and then hip fracture risk index is calculated basedon the strain energy criterion using MATLAB codes at the critical regions of the femur, locationsusually receiving higher stress and strain within sideways fall [5,6]. The hip fracture risk indexvariations with age, body height, body weight, and BMI (representative of body shape) at thethree critical cross-sections of the femur during the single-leg stance and the sideways fall for 30females and 30 males are shown in the scattered plots. The correlation coefficients (r) and thecorresponding statistical significance (p-value) are calculated using in-house MATLAB codes forthe parameters considered in this study.
2 Materials and Method
In this section, the calculation of hip fracture index based on the integration of QCT imagingand FE modelling using the strain energy criterion is explained in detail.
2.1 Finite Element Modeling Based on the QCT Image2.1.1 QCT Scanning
The QCT image is used to construct three dimensional (3D) model of the subject’s femur.To this purpose, the QCT images should be saved in the Digital Imaging and Communications in

CMC, 2022, vol.71, no.1 1351
Medicine (DICOM) format and then an appropriate segmentation should be applied to separatethe femur from the soft tissue. The intensity of the QCT image voxel is defined as HounsfieldUnit (HU) which is used to determine bone density [13,14]. QCT images of 30 females (totally 60right and left femurs) and 30 males (totally 60 right and left femurs), attained from the WinnipegHealth Science Centre, are used for the parametric study. The age scope of chosen cases is between50 and 82 years (average of 65 years) with a height range of 149–193.2 centimeters and a bodyweight range of 51.7–126.6 kilograms. The statistical information of the subjects is given in Tab. 1.
Table 1: Statistical information of 60 clinical cases
Age (years) Height (cm) Body weight (kg) BMI (kg/m2)
Range 50–82 149–193.2 51.7–126.6 18.83–43.36Average 65 169.86 81.94 28.36
2.1.2 Construction of Finite Element MeshTo construct the femur 3D model from the subject’s QCT image, Mimics software (Materi-
alise, Leuven, Belgium) is employed. QCT image, in DICOM format, is imported to Mimics forthe required segmentation and manipulation (Fig. 1a) and then the construction of the 3D model(Fig. 1b). By using the 3-Matic module of Mimics, FE mesh is generated (Fig. 1c) with the 4-nodelinear tetrahedral element SOLID72 acceptable by ANSYS. For the convergence study, FE modelswith different maximum element edge lengths are employed. The maximum von Mises stress iscalculated for FE models with different maximum element edge lengths under the same loadingand boundary conditions and then the maximum element edge length, providing converged results,is determined and used throughout the FE simulations and numerical analyses.
2.1.3 Assignment of Material PropertiesBy using the relation between CT numbers and bone material properties, inhomogeneous
isotropic material properties of the femur can be obtained from the QCT image data. The boneash density (ρash) is given as a function of HU number as follows [8,15],
ρash= 0.04162+ 0.000854 HU (g/cm3) (1)
Young’s modulus (E), the yield stress (σY ), and the yield strain (εY ) of the bone as a functionof the bone ash density are given, respectively, by [16],
E = 10500ρ2.29ash (MPa) (2)
σY = 116ρ2.03ash (MPa) (3)
εY = 0.011ρ−0.26ash (4)
and Poisson’s ratio (ν) of the bone is assumed 0.4 [17,18].
To apply continuous distribution of inhomogeneous bone mechanical properties, elements arecategorized into several discrete material bins via Mimics (Materialise, Leuven, Belgium). We needa convergence study to assign the required number of material bins. The maximum von Mises

1352 CMC, 2022, vol.71, no.1
stress is calculated for models with different material bins under the same loading and boundaryconditions to find the maximum number of material bins leading to the converged results foruse in all FE simulations and numerical analyses. Fig. 1d displays an isotropic inhomogeneousdistribution of the bone material properties.
Figure 1: QCT-based FE simulation of the human femur: (a) femur QCT scanning, (b) femur3D model constructed from the QCT scanning, (c) 3D FE model of the femur, (d) assignmentof inhomogeneous isotropic material properties, (e) single-leg stance loading and boundary con-ditions, and (f) sideways fall loading and boundary conditions. (Color should be used for thisfigure)
2.2 Finite Element Analysis3D FE model of the femur with the assigned material properties, obtained from Mimics,
is imported to ANSYS for further simulations and analyses. Single-leg stance and sideways fallconfigurations are simulated in the FE analysis. To simulate the single-leg stance, 2.5 times of the

CMC, 2022, vol.71, no.1 1353
subject’s body weight, as a distributed load, is applied on the femoral head [19] and the distalend of the femur is assumed constrained in all directions [17,20] (see Fig. 1e),
FStance = 2.5w (N) (5)
where w is the subject’s body weight in Newton (N).
To simulate the sideways fall condition, the distal end of the femur is assumed completelyfixed and the femur head is considered constrained in the loading direction (see Fig. 1f) [10,21].The impact force, due to the sideways fall, is applied on the greater trochanter of the femur(Fig. 1f) and given by [19,22],
FImpact= 8.25w(
h170
) 12
(N) (6)
where h is the height of the subject in centimeter.
Throughout this study, all FE simulations and analyses are done automatically using ANSYSParametric Design Language (APDL) codes by applying all loading and boundary conditions toa group of nodes at the corresponding locations of the femur (see Figs. 1e and 1f).
2.3 Femur Critical RegionsFemoral neck, intertrochanteric, and subtrochanteric fractures are three common types of hip
fracture (Fig. 2) which constitute, respectively, 37%, 49%, and 14% of the total hip fractures [23].In this study, the smallest femoral neck cross-section (SFN CS), the intertrochanteric cross-section(IntT CS), and the subtrochanteric cross-section (SubT CS) are considered as the critical cross-sections of the femur as shown in Fig. 2 and are determined using the approach presented in ourprevious studies [3,4].
Figure 2: Critical femoral cross-sections: the smallest femoral neck cross-section (section A–A), theintertrochanteric cross-section (section B–B), and the subtrochanteric cross-section (section C–C)[3,4]

1354 CMC, 2022, vol.71, no.1
2.4 Hip Fracture Risk Index DefinitionWe define the hip fracture risk index based on the strain energy criterion. The strain energy
at the three critical cross-sections of the femur is calculated using MATLAB codes and based onthe data obtained from the FE solutions. To generate a two-dimensional (2D) mesh for computingthe cross-section strain energy, the plane boundaries of the three critical cross-sections, obtainedfrom the FE mesh, are imported to MATLAB codes. The generated triangle elements over thethree critical cross-sections are shown in Fig. 3.
Figure 3: Generated triangle elements over (a) the smallest femoral neck cross-section, (b) theintertrochanteric cross-section, and (c) the subtrochanteric cross-section [3,4]
The strain energy at the three critical cross-sections of the femur due to the applied forcesis obtained as the sum of the strain energy of all triangle elements generated over the cross-section, i.e.,
U =m∑i=1
Ue (7)
where U represents the strain energy at the three critical cross-sections of the femur, Ue standsfor the strain energy of triangle element e of the proposed cross-section due to the applied forces,and m is the number of triangle elements generated over the cross-sections.
Gaussian integration method is employed to compute the strain energy of triangle elemente of the proposed cross-section. Integration points in each triangle element are assigned usingin-house MATLAB codes. By using the Gaussian integration method, the strain energy of triangleelement e due to the applied forces is computed by,
Ue =∫ ∫
Ue dA≈n∑i=1
Wi|J|Ui (8)
where Ue denotes the strain energy density of triangle element e, Ui represents the strain energydensity at integration point i of triangle element e, Wi is the weight at integration point i, |J| isdeterminant of the Jacobean matrix of the triangle element e, and n is the number of integrationpoints over the triangle element (integration domain). The strain energy density at the integrationpoint i is obtained using the FE solution, i.e.,
Ui = 12{σ }T{ε} (9)

CMC, 2022, vol.71, no.1 1355
where {σ } = [D]{ε} and {ε} = [B]{d}. The strain energy density at the integration point i is obtainedfrom the FE solution as follows,
Ui = 12{d}Te [B]Te [D]e[B]e{d}e (10)
where {d} denotes the displacement vector including displacements at element nodes of the tetra-hedral element where integration point i is located, matrix [B] indicates the derivatives of shapefunctions of the tetrahedral element, and [D] is the material property matrix of the tetrahedralelement which is given by,
[D]e = E(1+ ν)(1− 2ν)
⎡⎢⎢⎢⎢⎢⎢⎣
1− v v v 0 0 0v 1− v v 0 0 0v v 1− v 0 0 00 0 0 1
2 − v 0 00 0 0 0 1
2 − v 00 0 0 0 0 1
2 − v
⎤⎥⎥⎥⎥⎥⎥⎦
(11)
where Poisson’s ratio (ν) is assumed 0.4 and Young’s modulus is given by Eq. (2) as a function ofthe bone density. Young’s modulus of integration point i is calculated based on the bone densityat point i, which is the density of the tetrahedral element where integration point i is located.
The maximum allowable strain energy or yield strain energy of the three critical cross-sectionsof the femur is also calculated using in-house MATLAB codes and the data obtained by theAPDL codes from the FE solutions. The yield strain energy of the three critical cross-sections isobtained as the sum of the yield strain energy of all triangle elements generated over the cross-section, i.e.,
UY =m∑i=1
UeY (12)
where UeY is the yield strain energy of triangle element e. The Gaussian integration method is
also utilized to compute the yield strain energy of triangle element e as follows,
UeY =
∫ ∫UeY dA≈
n∑i=1
Wi|J|UYi (13)
where UeY represents the yield strain energy density of triangle element e, and UYi denotes the
yield strain energy density at integration point i of triangle element e of the proposed cross-sectionwhich is given by,
UYi = 12σYiεYi =
σ 2Yi
2Ei(14)
where Ei, σYi, and εYi are, respectively, Young’s modulus, the yield stress, and the yield strainat integration point i as a function of the bone density which is the density of the tetrahedralelement where integration point i is located, as given by Eqs. (2)–(4).
Hip fracture risk index (FRI) at the three critical cross-sections of the femur using the strainenergy criterion is defined as the ratio of the strain energy (U) induced by the applied forces to
1356 CMC, 2022, vol.71, no.1
the yield (maximum allowable) strain energy (UY ) of the femur over the proposed cross-sectionsas,
η = UUY
(15)
where η represents the FRI at the proposed critical cross-sections of the femur, and U and UYare attained, respectively, from Eqs. (7) and (12).
3 Numerical Results and Discussions
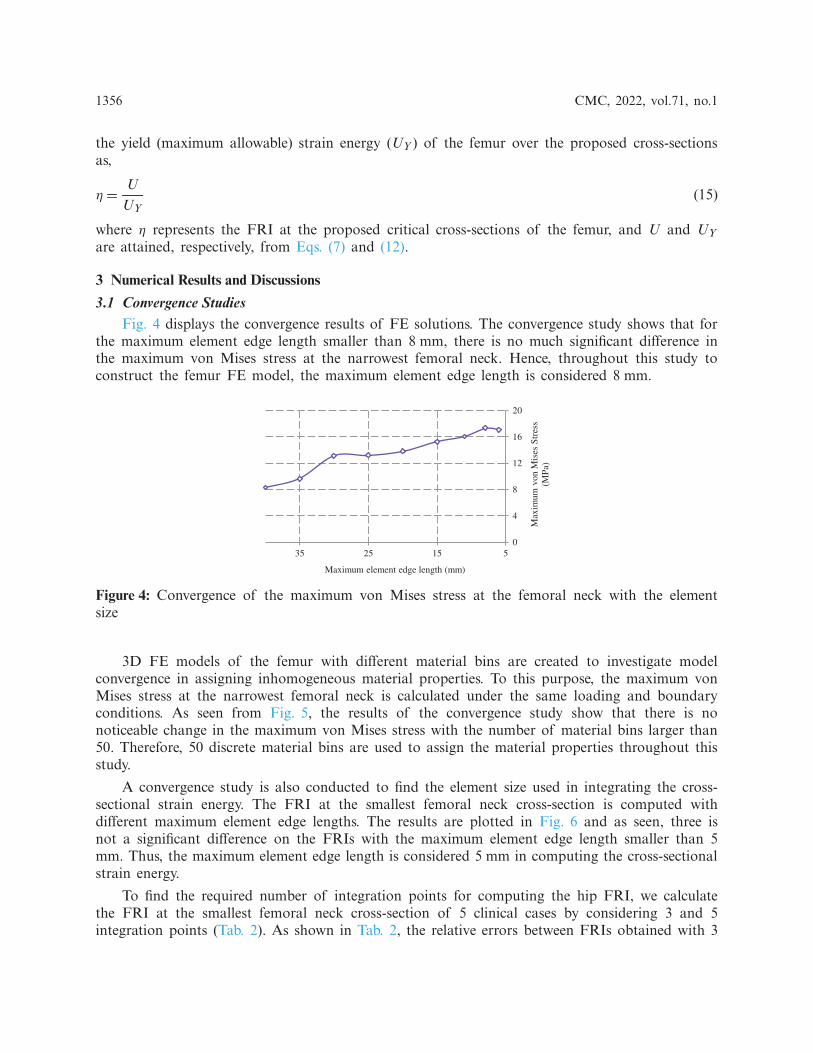
3.1 Convergence StudiesFig. 4 displays the convergence results of FE solutions. The convergence study shows that for
the maximum element edge length smaller than 8 mm, there is no much significant difference inthe maximum von Mises stress at the narrowest femoral neck. Hence, throughout this study toconstruct the femur FE model, the maximum element edge length is considered 8 mm.
0
4
8
12
16
20
5152535
Max
imum
von
Mis
es S
tres
s (M
Pa)
Maximum element edge length (mm)
Figure 4: Convergence of the maximum von Mises stress at the femoral neck with the elementsize
3D FE models of the femur with different material bins are created to investigate modelconvergence in assigning inhomogeneous material properties. To this purpose, the maximum vonMises stress at the narrowest femoral neck is calculated under the same loading and boundaryconditions. As seen from Fig. 5, the results of the convergence study show that there is nonoticeable change in the maximum von Mises stress with the number of material bins larger than50. Therefore, 50 discrete material bins are used to assign the material properties throughout thisstudy.
A convergence study is also conducted to find the element size used in integrating the cross-sectional strain energy. The FRI at the smallest femoral neck cross-section is computed withdifferent maximum element edge lengths. The results are plotted in Fig. 6 and as seen, three isnot a significant difference on the FRIs with the maximum element edge length smaller than 5mm. Thus, the maximum element edge length is considered 5 mm in computing the cross-sectionalstrain energy.
To find the required number of integration points for computing the hip FRI, we calculatethe FRI at the smallest femoral neck cross-section of 5 clinical cases by considering 3 and 5integration points (Tab. 2). As shown in Tab. 2, the relative errors between FRIs obtained with 3

CMC, 2022, vol.71, no.1 1357
and 7 integration points are not much significant. Hence, the 3-point integration rule is consideredin this study with lower computational time.
20
24
28
32
36
40
10 20 30 40 50 60 70 80 90 100
Max
imum
von
Mis
es S
tres
s (M
Pa)
Number of materials
Figure 5: Convergence of the maximum von Mises stress at the femoral neck with the materialbins
0.2
0.21
0.22
0.23
0.24
246810FR
I
Maximum element edge length of triangle elements (mm)
Figure 6: Convergence of FRI with the maximum element edge length of triangle elementsgenerated over the smallest femoral neck cross-section
Table 2: FRI at the smallest femoral neck cross-section with different numbers of integrationpoints
FRI
Case No. 3 integration points 7 integration points Relative error (%)
1 0.239 0.2416 1.072 0.6898 0.6975 1.13 0.2966 0.2976 0.334 0.8885 0.899 1.165 1.1482 1.1701 1.87
3.2 Parametric Study of Hip Fracture RiskIn this study, the correlations between the hip fracture risk and various human body parame-
ters such as age, body height, weight, and BMI are investigated using 30 females (totally 60 rightand left femurs) and 30 males (totally 60 right and left femurs). The correlation coefficients (r) and

1358 CMC, 2022, vol.71, no.1
the corresponding statistical significance (p-value) are calculated using in-house MATLAB codes.The obtained results are presented in Tabs. 3–6 and Figs. 7–14.
Table 3: Correlations (coefficient r, p-value) between FRIs and various body parameters (age,height, body weight, and BMI) in 30 females during the single-leg stance
r(p)
Age Height Body weight BMI
Smallest femoralneck cross-section
−0.0535(0.6844)
0.0153(0.9072)
0.2933(0.0229)
0.3338(0.0091)
Intertrochantericcross-section
0.0422(0.7484)
−0.0805(0.5405)
0.2757(0.0329)
0.3338(0.0091)
Subtrochantericcross-section
0.0398(0.7625)
−0.0201(0.8783)
0.546(0.000006)
0.6108(0.0000002)
Table 4: Correlations (coefficient r, p-value) between FRIs and various body parameters (age,height, body weight, and BMI) in 30 females during the sideways fall
r(p)
Age Height Body weight BMI
Smallest femoralneck cross-section
−0.0473(0.7194)
0.0082(0.9498)
0.2133(0.1017)
0.2554(0.0488)
Intertrochantericcross-section
0.0379(0.7734)
−0.0576(0.6616)
0.0964(0.4636)
0.1383(0.2919)
Subtrochantericcross-section
−0.0989(0.452)
0.1332(0.31)
0.1344(0.3056)
0.103(0.4332)
Table 5: Correlations (coefficient r, p-value) between FRIs and various body parameters (age,height, body weight, and BMI) in 30 males during the single-leg stance
r(p)
Age Height Body weight BMI
Smallest femoralneck cross-section
0.1464(0.264)
0.0946(0.472)
0.5372(0.000009)
0.5038(0.00004)
Intertrochantericcross-section
−0.0358(0.7859)
0.2242(0.085)
0.4496(0.0003)
0.3788(0.0028)
Subtrochantericcross-section
−0.1778(0.174)
−0.0119(0.928)
0.5681(0.000002)
0.6028(0.0000003)

CMC, 2022, vol.71, no.1 1359
Table 6: Correlations (coefficient r, p-value) between FRIs and various body parameters (age,height, body weight, and BMI) in 30 males during the sideways fall
r(p)
Age Height Body weight BMI
Smallest femoralneck cross-section
0.0697(0.5964)
0.2566(0.047)
0.4582(0.0002)
0.3504(0.006)
Intertrochantericcross-section
−0.0475(0.7179)
0.4446(0.0003)
0.1485(0.2573)
−0.0192(0.8839)
Subtrochantericcross-section
0.0059(0.9637)
0.2678(0.038)
0.5059(0.00003)
0.4041(0.0013)
The FRI variations vs. age at the three critical cross-sections of the femur during the single-leg stance and the sideways fall for 30 females and 30 males are shown in the scattered plots inFigs. 7 and 8, respectively. It is seen that the hip fracture risk has a positive correlation with theage at the three critical cross-sections, but as shown in Tabs. 3–6, this correlation is not strong(p> 0.05).
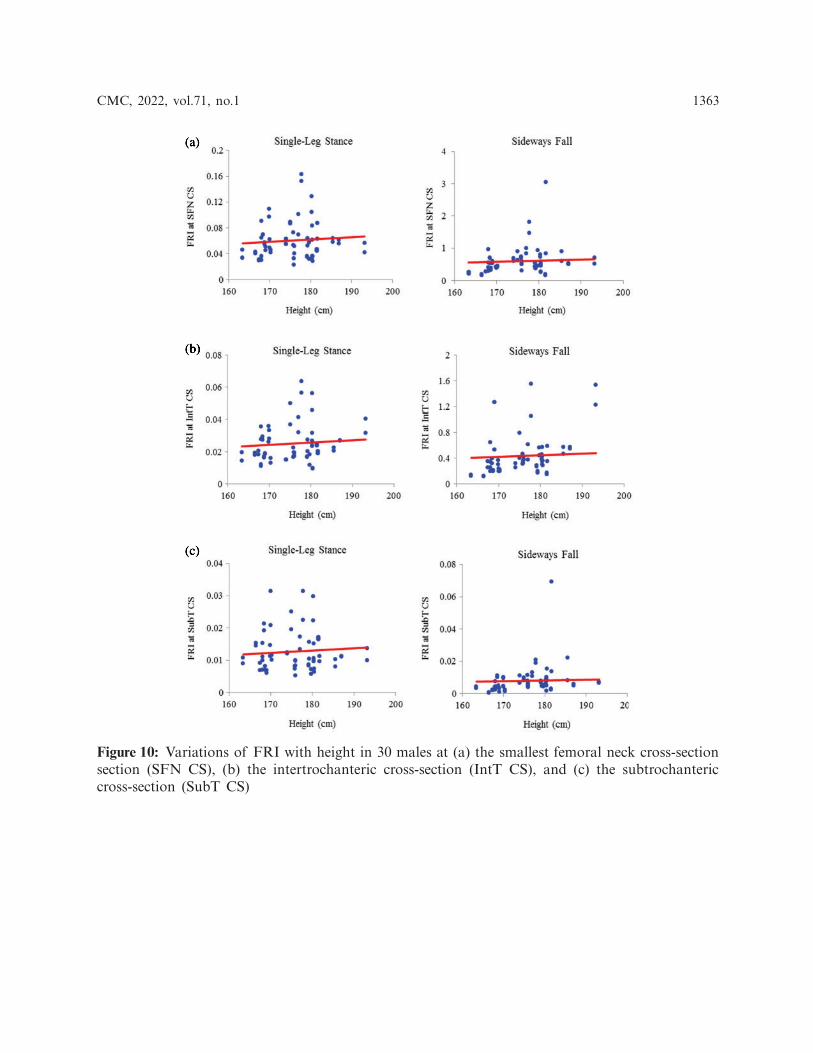
The scattered plots of FRI vs. height at the three critical cross-sections of the femur duringthe single-leg stance and the sideways fall for 30 females and 30 males are also shown, respectively,in Figs. 9 and 10. The hip fracture risk also has a positive correlation with the height, but thiscorrelation for females during both the single-leg stance and the sideways fall and males duringthe single-leg stance is weak (p> 0.05) (see Tabs. 3–5), while there is a strong correlation (p< 0.05)between the hip fracture risk and height for males during the sideways fall (Tab. 6).
As seen in Figs. 11 and 12, there is an increasing trend of FRI versus body weight. There isa strong correlation (p< 0.05) between the hip fracture risk and body weight at the three criticalcross-sections of the femur for both females and males during the single-leg stance and also atthe smallest femoral neck cross-section and the subtrochanteric cross-section of males during thesideways fall (see Tabs. 3, 5, and 6). While this correlation is not strong (p > 0.05) at the threecritical cross-sections of the femur for females, and the intertrochanteric cross-section of malesduring the sideways fall (Tabs. 4 and 6).
The correlation between FRI and BMI (representative of body shape) is also positive (seeFigs. 13 and 14). This correlation is strong (p < 0.05) at the three critical cross-sections of thefemur for both females and males during the single-leg stance, the smallest femoral neck cross-section of females and males during the sideways fall, and the subtrochanteric cross-section ofmales during the sideways fall (Tabs. 3–6). While there is a weak correlation (p> 0.05) betweenFRI and BMI at the intertrochanteric cross-section of both females and males during the sidewaysfall and the subtrochanteric cross-section of females during the sideways fall (Tabs. 4 and 6).

1360 CMC, 2022, vol.71, no.1
Figure 7: Variations of FRI with age in 30 females at (a) the smallest femoral neck cross-section(SFN CS), (b) the intertrochanteric cross-section (IntT CS), and (c) the subtrochanteric cross-section (SubT CS)

CMC, 2022, vol.71, no.1 1361
Figure 8: Variations of FRI with age in 30 males at (a) the smallest femoral neck cross-section(SFN CS), (b) the intertrochanteric cross-section (IntT CS), and (c) the subtrochanteric cross-section (SubT CS)

1362 CMC, 2022, vol.71, no.1
Figure 9: Variations of FRI with height in 30 females at (a) the smallest femoral neck cross-section (SFN CS), (b) the intertrochanteric cross-section (IntT CS), and (c) the subtrochantericcross-section (SubT CS)
CMC, 2022, vol.71, no.1 1363
Figure 10: Variations of FRI with height in 30 males at (a) the smallest femoral neck cross-sectionsection (SFN CS), (b) the intertrochanteric cross-section (IntT CS), and (c) the subtrochantericcross-section (SubT CS)

1364 CMC, 2022, vol.71, no.1
Figure 11: Variations of FRI with body weight in 30 females at (a) the smallest femoral neckcross-section section (SFN CS), (b) the intertrochanteric cross-section (IntT CS), and (c) thesubtrochanteric cross-section (SubT CS)

CMC, 2022, vol.71, no.1 1365
Figure 12: Variations of FRI with body weight in 30 males at (a) the smallest femoral neck cross-section section (SFN CS), (b) the intertrochanteric cross-section section (IntT CS), and (c) thesubtrochanteric cross-section section (SubT CS)

1366 CMC, 2022, vol.71, no.1
Figure 13: Variations of FRI with BMI in 30 females at (a) the smallest femoral neck cross-section section (SFN CS), (b) the intertrochanteric cross-section section (IntT CS), and (c) thesubtrochanteric cross-section section (SubT CS)

CMC, 2022, vol.71, no.1 1367
Figure 14: Variations of FRI versus BMI in 30 males at (a) the smallest femoral neck cross-section section (SFN CS), (b) the intertrochanteric cross-section section (IntT CS), and (c) thesubtrochanteric cross-section section (SubT CS)
4 Conclusion
Different human body parameters such as age, height, weight, and BMI influence hip fracturerisk in the elderly. Therefore, the correlations of hip fracture risk with age, body height, bodyweight, and BMI are investigated in this study and the corresponding correlation coefficients areobtained. Generally, there is an increasing trend of hip fracture risk with age, body height, bodyweight, and BMI at the three critical regions of the femur in both women and men during thesingle-leg stance and the sideways fall configurations.

1368 CMC, 2022, vol.71, no.1
The correlations of hip fracture risk with age and height are not significant (p> 0.05) for theclinical cases investigated in this study. It means that at least for the clinical cases investigatedin this study, we cannot conclude that the hip fracture risk strongly increases with age and itmay depend on the individual’s health status and lifestyle. Since we have not had any informationabout the subjects’ other health status, lifestyle, medication, etc., we are not able to consider theeffects of these factors.
The results of this study also show that to some extent there is a strong correlation betweenthe hip fracture risk and body weight and BMI (p< 0.05). It indicates that subjects with higherbody weight and BMI (overweight and obese subjects) are more prone to hip fracture risk.However, the number of cases used in this study is small. To draw a stronger conclusion aboutthe effects of different body parameters on hip fracture risk in the elderlies, a large number ofclinical cohorts is needed, while in this study we only investigated 60 clinical cases.
Acknowledgement: The authors thank the Winnipeg Health Science Centre for providing the QCTimages of clinical cases.
Funding Statement: The reported research was supported financially by the Natural Sciences andEngineering Research Council (NSERC) and Research Manitoba of Canada, which are gratefullyacknowledged.
Conflicts of Interest: The authors declare that they have no conflicts of interest to report regardingthe present study.
Ethical Approval: The QCT images used in this study were acquired from Health Science Centrelocated at Winnipeg under an Ethical Approval issued by the Research Ethics Board (REB) ofthe University of Manitoba.
References[1] N. M. Resnick and S. L. Greenspan, “Senile’ osteoporosis reconsidered,” Journal of the American
Medical Association, vol. 261, no. 7, pp. 1025–1029, 1989.[2] B. Gullberg, O. Johnell and J. A. Kanis, “World-wide projections for hip fracture,” Osteoporosis
International, vol. 7, no. 5, pp. 407–413, 1997.[3] H. Kheirollahi Nataj Bisheh, “Assessment of hip fracture risk using cross-section strain energy
determined from QCT-based finite element model,” M.Sc. thesis, University of Manitoba, Canada,2015.
[4] H. Kheirollahi and Y. Luo, “Assessment of hip fracture risk using cross-section strain energy deter-mined by QCT-based finite element modeling,” BioMed Research International, vol. 2015, Article ID413839, 2015.
[5] H. Kheirollahi and Y. Luo, “Identification of high stress and strain regions in proximal femur duringsingle-leg stance and sideways fall using QCT-based finite element model,” International Journal ofBiomedical and Biological Engineering, vol. 9, no. 8, pp. 633–640, 2015.
[6] H. Kheirollahi and Y. Luo, “Understanding hip fracture by QCT-based finite element modeling,”Journal of Medical and Biological Engineering, vol. 37, no. 5, pp. 686–694, 2017.
[7] H. Bisheh, Y. Luo and T. Rabczuk, “Hip fracture risk assessment based on different failure criteriausing QCT-based finite element modeling,” Computers,Materials &Continua, vol. 63, no. 2, pp. 567–591,2020.
[8] D. Dragomir-Daescu, J. O. D. Buijs, S. McEligot, Y. Dai, R. C. Entwistle et al., “Robust QCT/FEAmodels of proximal femur stiffness and fracture load during a sideways fall on the hip,” Annals ofBiomedical Engineering, vol. 39, no. 2, pp. 742–755, 2010.

CMC, 2022, vol.71, no.1 1369
[9] H. Gong, M. Zhang, Y. Fan, W. L. Kwok and P. C. Leung, “Relationships between femoralstrength evaluated by nonlinear finite element analysis and BMD, material distribution and geometricmorphology,” Annals of Biomedical Engineering, vol. 40, no. 7, pp. 1575–1585, 2012.
[10] J. E. M. Koivumäki, J. Thevenot, P. Pulkkinen, V. Kuhn, T. M. Link et al., “CT-Based finite elementmodels can be used to estimate experimentally measured failure loads in the proximal femur,” Bone,vol. 50, no. 4, pp. 824–829, 2012.
[11] Y. Luo, Z. Ferdous and W. D. Leslie, “Precision study of DXA-based patient-specific finite elementmodeling for assessing hip fracture risk,” International Journal for Numerical Methods in BiomedicalEngineering, vol. 29, no. 5, pp. 615–629, 2013.
[12] M. Mirzaei, M. Keshavarzian and V. Naeini, “Analysis of strength and failure pattern of humanproximal femur using quantitative computed tomography (QCT)-based finite element method,” Bone,vol. 64, pp. 108–114, 2014.
[13] J. H. Keyak, J. M. Meagher, H. B. Skinner and C. D. Mote Jr., “Automated three-dimensional finiteelement modelling of bone: A new method,” Journal of Biomedical Engineering, vol. 12, no. 5, pp.389–397, 1990.
[14] T. M. Keaveny, R. E. Borchers, L. J. Gibson and W. C. Hayes, “Trabecular bone modulus and strengthcan depend on specimen geometry,” Journal of Biomechanics, vol. 26, no. 8, pp. 991–1000, 1993.
[15] C. M. Les, J. H. Keyak, S. M. Stover, K. T. Taylor and A. J. Kaneps, “Estimation of material proper-ties in the equine metacarpus with use of quantitative computed tomography,” Journal of OrthopaedicResearch, vol. 12, no. 6, pp. 822–833, 1994.
[16] T. S. Keller, “Predicting the compressive mechanical behavior of bone,” Journal of Biomechanics, vol.27, no. 9, pp. 1159–1168, 1994.
[17] J. H. Keyak, S. A. Rossi, K. A. Jones and H. B. Skinner, “Prediction of femoral fracture load usingautomated finite element modeling,” Journal of Biomechanics, vol. 31, no. 2, pp. 125–133, 1997.
[18] D. T. Reilly and A. H. Burstein, “The elastic and ultimate properties of compact bone tissue,” Journalof Biomechanics, vol. 8, no. 6, pp. 393–405, 1975.
[19] T. Yoshikawa, C. H. Turner, M. Peacock, C. W. Slemenda, C. M. Weaver et al., “Geometric structureof the femoral neck measured using dual-energy X-ray absorptiometry,” Journal of Bone and MineralResearch, vol. 9, no. 7, pp. 1053–1064, 1994.
[20] M. Bessho, I. Ohnishi, T. Matsumoto, S. Ohashi, J. Matsuyama et al., “Prediction of proximal femurstrength using a CT-based nonlinear finite element method: Differences in predicted fracture load andsite with changing load and boundary conditions,” Bone, vol. 45, no. 2, pp. 226–231, 2009.
[21] K. K. Nishiyama, S. Gilchrist, P. Guy, P. Cripton and S. K. Boyd, “Proximal femur bone strengthestimated by a computationally fast finite element analysis in a sideways fall configuration,” Journal ofBiomechanics, vol. 46, no. 7, pp. 1231–1236, 2013.
[22] S. N. Robinovitch, W. C. Hayes and T. A. McMahon, “Prediction of femoral impact forces in falls onthe hip,” Journal of Biomechanical Engineering, vol. 113, no. 4, pp. 366–374, 1991.
[23] J. D. Michelson, A. Myers, R. Jinnah, Q. Cox and M. Van Natta, “Epidemiology of hip fracturesamong the elderly. risk factors for fracture type,” Clinical Orthopaedics and Related Research, vol. Feb,no. 311, pp. 129–135, 1995.