paramics plugin - swarmlchu/documents/paramics plugin - swarm.pdf · paramics plugin document –...
TRANSCRIPT

PATH ATMS Center SWARM Ramp metering control Plugin
1
PARAMICS Plugin Document – SWARM Ramp metering control Lianyu Chu, Henry X. Liu PATH ATMS Center University of California, Irvine Plugin Compatibility: V4 Release date: 3/20/2003
522 Social Science Tower Irvine, CA 92697-3600
URL: http://www.its.uci.edu/

PATH ATMS Center SWARM Ramp metering control Plugin
2
Table of Contents
Table of Contents.............................................................................................................2 1. Introduction..................................................................................................................3 2 Plugin implementation..................................................................................................4
2.1 Algorithm description............................................................................................4 2.2 Development framework........................................................................................5 2.3 Pseudo codes..........................................................................................................6
3. Step-by-step user manual.............................................................................................9 3.1 Adding detectors ....................................................................................................9 3.2 Preparation of “swarm_global”............................................................................10 3.3 Preparation of “vds_control” ...............................................................................12 3.4 Preparation of “swarm_control” ..........................................................................13 3.5 Loading plugin .....................................................................................................14 3.6 Output files...........................................................................................................15 3.7 Error checking......................................................................................................17 3.8 Fine-tuning parameters of SWARM ....................................................................17
4 Technical Supports......................................................................................................19 4.1 Limitations of this plugin .....................................................................................19 4.2 Contact information .............................................................................................20 4.3 References ............................................................................................................20
APPENDIX 1 An example of the “infrastructure layout” obtained from Caltrans .......21

PATH ATMS Center SWARM Ramp metering control Plugin
3
1. Introduction The purpose of this plugin is to allow users to implement the System Wide Adaptive Ramp Metering System (SWARM) of Caltrans in the PARAMICS simulation environment. This plugin is developed based on source codes of SWARM, obtained from Caltrans.

PATH ATMS Center SWARM Ramp metering control Plugin
4
2 Plugin implementation
2.1 Algorithm description SWARM is a coordinated traffic responsive ramp metering operation strategy, which is developed as a component of the Advanced Transportation Management System (ATMS) at Traffic Management Center (TMC) by National Engineering Technologies’ (NET) System. It has drawn wide interests because of the introduction of traffic flow forecasting in the algorithm. The initial field tests were attempted in the Field Operational Test (FOT) of an integrated corridor- level adaptive control system from fall 1994 through spring 1999 in the City of Irvine, California. The system is currently tested in the I-210 freeway within the Los Angeles transportation network. The SWARM algorithm actually consists of two independent algorithms, SWARM 1 and SWARM 2. SWARM 1 is a forecasting and system-wide apportioning algorithm us ing a forecasting methodology. SWARM 2 includes two local traffic-responsive ramp metering algorithms, SWARM 2a and SWARM 2b. We provide a brief description of these three algorithms below. Details about them can be found in the listed references. 2.1.1 SWARM 1 SWARM 1 forecasts the traffic state at predetermined problem points (bottlenecks), and adjusts metering rates based on forecasts. It treats the freeway network as sections. Each section is defined as the two adjacent detectors that have reliable data outputs. The operation of SWARM 1 is based on traffic density, with the goal of maintaining real-time density below a pre-determined saturation density for each section of freeway. The linear regression and a Kalman filtering process are applied to pass detector data to forecast a density trend at each detector location for each control interval. The time into the future to forecast is a tunable parameter named Tcrit. Once the forecast density trend is obtained, it can be combined with Tcrit to calculate the excess density (the portion above the saturation density in the following Figure 1). Excess density is used to calculate the target density for the next metering cycle:
Target Density = (Current Density) - (1/Tcrit) * (Excess Density) Then the volume reduction at each detector is:
Volume Reduction = (Local Density - Target Density) * (Number of lanes)* (Distance to next Station)
These volume reduction values are then distributed to upstream ramps within the defined area of influence for each site using pre-defined weighting factors at each ramp based on ramp demand, queue storage capacity, etc. The most restrictive volume reduction is then utilized at each ramp location.

PATH ATMS Center SWARM Ramp metering control Plugin
5
Figure 1 SWARM forecasting
2.1.2 SWARM 2 SWARM 2a uses a density function to compute local metering rates based on headway theory. Theoretically, it attempts to maintain headway at the detector station upstream of metered ramp by optimizing density to maintain maximum flow. SWARM 2b introduces a concept of storage zone, which starts from the mainline upstream VDS to the next downstream mainline VDS. The number of vehicles storing within this storage zone will be calculated. Then, SWARM 2b computes metering rates to maintain demand such that LOS D as along as possible. If there are on-ramps and off-ramps between the two VDSs, detectors are required to be placed at on-ramps and off-ramps for counting traffic volumes. This algorithm depends on accurate loop detector data.
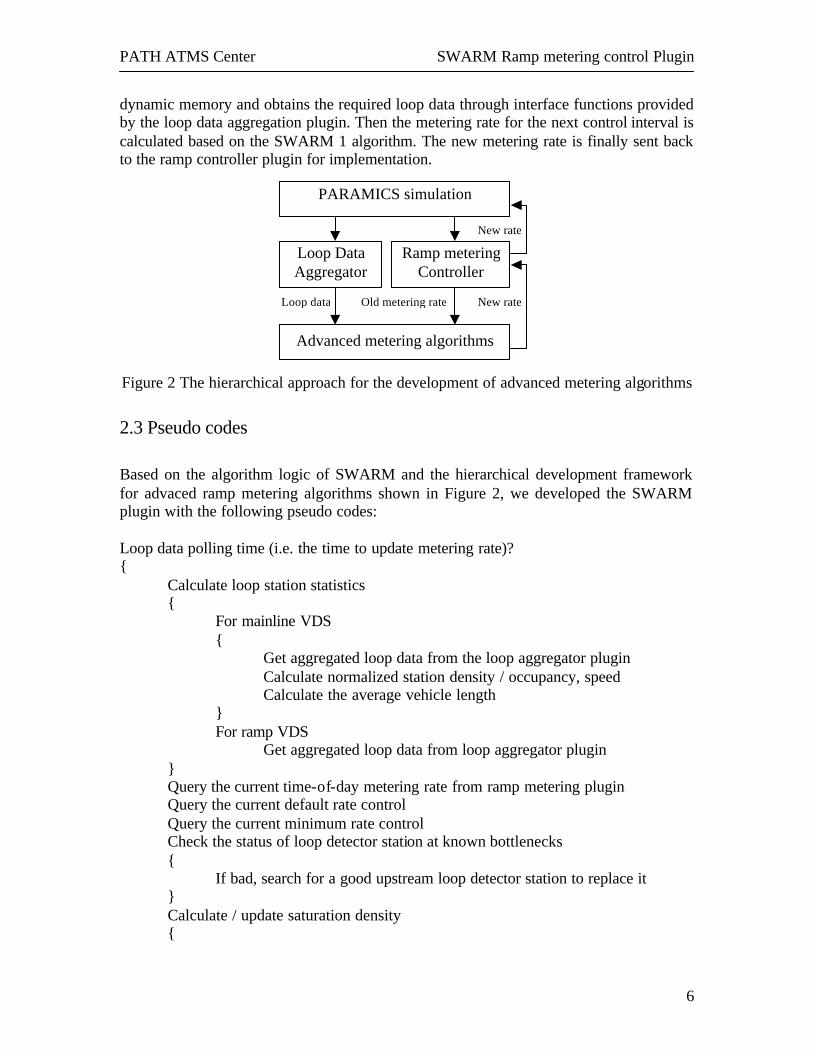
2.2 Development framework Figure 2 illustrates our hierarchical framework to develop advanced ramp-metering algorithm plugins in PARAMICS. The SWARM plugin is built based on two basic plugin modules, i.e., ramp metering controller and loop data aggregator. The on-ramp signals in the simulation network are controlled by the ramp metering plugin, through which metering rates can be queried and set by the SWARM plugin. The loop data aggregator emulates the real-world loop data collection, typically with a thirty-second polling interval, and broadcast the latest loop data to the dynamic memory. At each time increment, the SWARM plugin accesses the
PATH ATMS Center SWARM Ramp metering control Plugin
6
dynamic memory and obtains the required loop data through interface functions provided by the loop data aggregation plugin. Then the metering rate for the next control interval is calculated based on the SWARM 1 algorithm. The new metering rate is finally sent back to the ramp controller plugin for implementation.
New rate
New rate Old metering rate Loop data
PARAMICS simulation
Advanced metering algorithms
Ramp metering Controller
Loop Data Aggregator
Figure 2 The hierarchical approach for the development of advanced metering algorithms
2.3 Pseudo codes Based on the algorithm logic of SWARM and the hierarchical development framework for advaced ramp metering algorithms shown in Figure 2, we developed the SWARM plugin with the following pseudo codes: Loop data polling time (i.e. the time to update metering rate)? { Calculate loop station statistics { For mainline VDS
{ Get aggregated loop data from the loop aggregator plugin Calculate normalized station density / occupancy, speed Calculate the average vehicle length
} For ramp VDS
Get aggregated loop data from loop aggregator plugin } Query the current time-of-day metering rate from ramp metering plugin Query the current default rate control Query the current minimum rate control Check the status of loop detector station at known bottlenecks { If bad, search for a good upstream loop detector station to replace it } Calculate / update saturation density {

PATH ATMS Center SWARM Ramp metering control Plugin
7
For each mainline VDS {
Collect enough VDS data in one day If (enough VDS data = SAMPLE_SIZE_SAT_DENSITY)
Calculate the saturation density for the VDS }
} SWARM 2a {
For each on-ramp (Starting from the furthest downstream ramp on the freeway) {
Calculate station speed at upstream loop station (ft/sec) Calculate time headway from upstream loop to downstream loop Calculate the speed reduction per mile Calculate the desired metering rate Minimum rate control Maximum rate control Rate smoothing Startup/shutdown strategy
} } SWARM 2b {
For each on ramp on freeway (Starting from the furthest downstream ramp on the freeway) {
Calculate estimated storage in the storage zone based on density values of upstream and downstream loop stations Calculate volume change of the storage zone Calculate cumulative storage Calculate storage within a zone Calculate critical storage Calculate maximum available capacity Calculate desired available capacity Calculate metering rate for this ramp Minimum rate control Maximum rate control Rate smoothing Startup/shutdown strategy
} Kalman Filtering {
For each bottleneck ramp { Update observations

PATH ATMS Center SWARM Ramp metering control Plugin
8
Time update Measurement update Forecast the density ahead of time (FORECAST_LEAD_TIME).
} } Determine local_max as the upper limit of calculation of SWARM_1 rate (Based on the metering mode, such as SWARM_2A_2B) Traffic apportionment () { If (excess volume at a bottleneck)
Assign desired reduced traffic to related meters Calculate metering rate for related meters
Minimum rate control Maximum rate control Rate smoothing Startup/shutdown strategy
} Check SWARM’s start_up_strategy Find the metering rate based on SWARM’s metering mode Queue control is required? Implement new metering rate to meters through ramp metering plugin
}

PATH ATMS Center SWARM Ramp metering control Plugin
9
3. Step-by-step user manual The SWARM plugin has three input files:
(1) “swarm_global”, containing global parameters of SWARM. (2) “vds_control”, containing information of network, detector stations, and
bottlenecks. (3) “swarm_control”, containing the initial setup of SWARM to the target network.
Unlike the parser system of PARAMICS, which allows flexible grammars, the formats of these input files are rigid and thus any problem may cause that the SWARM plugin cannot be loaded. As a result, we hope users can use the example input files we provide with this plugin as the starting point to make your own input files for avoiding editing problems. In order to correctly use this plugin in a target network, the “infrastructure layout” of the target freeway network needs to be obtained from the proper government agency, such as Caltrans. The “infrastructure layout” includes the number of lanes and locations of loop detector stations. This layout is also the basic information required for network coding in PARAMICS. An example of this “infrastructure layout” can be found in APPENDIX 1.
3.1 Adding detectors 3.1.1 Real world ramp metering system The configuration of a typical ramp metering system in California is shown in Figure 3.
Figure 3 Typical ramp metering configuration

PATH ATMS Center SWARM Ramp metering control Plugin
10
Five types detectors can be possibly installed fo r a ramp meter, including on-ramp detector, demand detector, passage detector, queue detector, and ramp HOV detector. The on-ramp detector is used for counting total number of vehicles entering freeway from entrance ramps. The demand and passage detectors (i.e. corresponding to the check- in and check-out detectors) are used for the operation of on-ramp signals. The demand detector employs to initiate green and the passage detector employs to return the signal to red. The queue detector is located at the upstream end of the entrance ramp, used for detecting the excessive queue length in order to avoid interference with the arterial traffic. The ramp HOV detector is used for counting the number of carpool vehicles entering freeway from entrance ramps. Caltrans currently has three ramp metering systems, SATMS, SDRMS, and SJRMS / TOS. All of them use the 170 type controllers as hardware. SATMS, SDRMS, and SJRMS / TOS are names of their software algorithms installed in the 170 controllers. The SWARM algorithm is designed for the ramp metering system of SATMS, used in District 7 and 12. The local controller and its ramp metering software of SATMS support centralized metering control, i.e. the application of the requested metering rate from TMC. 3.1.2 Detectors required for this plugin The demand detector has been used in the ramp metering control plugin, which is a supporting module of the SWARM plugin. The ramp metering control plugin acts like the local controller in the real world. In order to make this plugin work, three additional detectors or detector stations are required to be put to the simulation network. They are the on-ramp detector, queue detector, and the mainline (detector) station, shown in Figure 3. If your simulated network in the real world does not have the required detector configuration for the SWARM control, please add demand detector, on-ramp detector, mainline detector, and queue detector to the simulation network based on Figure 3 in order to correctly use this plugin.
3.2 Preparation of “swarm_global” SWARM has several global parameters. They are defined in the “swarm_global” file. Totally, there are 27 parameters. The first part of this file is about loop data acquisition. Please see Section 2.6 of reference 1 for more detailed description. The value shown on the leftmost side of each line is actually the recommended value.
25.0 "Ave_veh_length for the right lane (10.0 - 30.0)" range 10.0 to 30.0 precision 1 22.0 "Ave_veh_length for the 2nd right lane (10.0 - 30.0)" range 10.0 to 30.0 precision 1 18.0 "Ave_veh_length for other ML and HOV lanes (10.0 - 30.0)" range 10.0 to 30.0 precision 1

PATH ATMS Center SWARM Ramp metering control Plugin
11
9.0 "Absolute maximum effective loop length (6.0 - 10.0)" range 6.0 to 10.0 precision 1 9 "Volume threshold to compute a new effective loop length (4 - 14)" range 4 to 14 precision 0 3.0 "Absolute minimum effective loop length (2.0 - 6.0)" range 2.0 to 6.0 precision 1 55 "Speed threshold to compute a new effective loop length (50 - 90)" range 50 to 90 precision 0 0.02 "Smoothing factor for the effective loop length (0.0 - 1.0)" range 0.0 to 1.0 precision 2 65.0 "Free speed (55.0 - 85.0)" range 55.0 to 85.0 precision 1
The second part includes parameters used for the calculation of the saturation density for each loop station.
2200 "Maximum hourly lane volume (1800 - 2500)" range 1800 to 2500 precision 0 200 "Sample size required to compute saturation density (6 - 1200)" range 6 to 1200 precision 0 0.05 "Smoothing factor for saturation density computation (0.0 - 1.0)" range 0.0 to 1.0 precision 2
The third part includes parameters of Kalman filtering used in the SWARM 1 algorithm.
1 "Max number of VDSs to search if bottleneck VDS is failed (1 - 4)" range 1 to 4 precision 0 30 "Number of previous time intervals used for the forecast (2 - 60)" range 2 to 60 precision 0 6 "Number of points used to estimate slope for Kalman filter (2 - 9)" range 2 to 9 precision 0 30 "Number of time intervals into the future to forecast (1 - 60)" range 1 to 60 precision 0 0.04 "Variation in the accuracy of the density measurements (0.02 - 0.5)" range 0.02 to 0.5 precision 2 1.0 "Variance representing the inaccuracy of the model (0.5 - 10)" range 0.5 to 10 precision 1
The fourth part includes parameters of apportionment algorithm used in the SWARM 1 algorithm.
1.0 "Fraction of excess traffic to propagate within a section (0.0 - 1.0)" range 0.0 to 1.0 precision 1 0.85 "Fraction of excess traffic to propagate between sections (0.0 - 1.0)" range 0.0 to 1.0 precision 1
The fifth part includes parameters of the SWARM 2a algorithm.
1.0 "Target speed reduction (0.1 - 20.0)" range 0.1 to 20.0 precision 1 The sixth part includes parameters of the SWARM 2b algorithm.
0.1 "Smoothing factor for the final storage computation (0.0 - 1.0)" range 0.0 to 1.0 precision 2 0.85 "Fraction of saturation density equivalent to LOS D (0.0 - 1.0)" range 0.0 to 1.0 precision 2
The seventh part includes parameters of Phase 2 failure management, used to decide if the detector data at a detector station can be used in SWARM.
0.66 "Fraction of good lanes required for station statistics (0.0 - 1.0)" range 0.0 to 1.0 precision 2 The eighth part includes parameters of the startup and shutdown strategy.
6 "Start metering counter (1 - 20)" range 1 to 20 precision 0 20 "Stop metering counter (1 - 30)" range 1 to 30 precision 0

PATH ATMS Center SWARM Ramp metering control Plugin
12
The parameter in the last part is not a parameter of the real-world SWARM, but a parameter of the SWARM in the simulation world.
1 "Using speed estimation (0) or PARAMICS speed(1) (0 - 1)" range 0 to 1 precision 0 These parameters are universal parameters used in SWARM. If you want to know more about the functionality of any a parameter in SWARM, please find related information from the references listed at the end of this document.
3.3 Preparation of “vds_control” “vds_control” includes the information of loop detector stations in the simulation network. The format of this file is:
number of freeways 1 polling cycle 30 number of mainline detectors 9 405n5.74ml 405 N N 5.74 5 45 yes 405n5.55ml 405 N N 5.55 4 45 no … number of off- ramp detectors 5 405n5.55fr 405 N N 5.55 …
There are three parts in “vds_control”. The first part includes the general information, i.e. the number of freeways and the loop detector aggregation cycle, i.e., “polling cycle”. “polling cycle” should be the same as “report cycle” in the “loop_control” file, and “metering rate update interval” in the “swarm_control” file. The format for mainline detectors is
The format for off- ramp detectors is:
The VDSs listed in the “vds_control” file are ordered by freeway id, direction, from downstream to upstream. “direction” can be one of N, S, W, and E. “pri-direction” refers to the direction of post-mile, and thus can also be one of N, S, W, and E. For example, if the post-mile at downstream is higher than that at upstream, “pri-direction” is the same as “direction”. “saturation density” refers to the density of the loop detector station at
Freeway ID, direction, pri-direction, loop name, post-mile, number of lanes, saturation density, whether this loop station is a bottleneck
Freeway ID, direction, pri-direction, loop name, post-mile

PATH ATMS Center SWARM Ramp metering control Plugin
13
capacity. It can be a value between 40-45. The SWARM plugin provides capabilities to calculate the saturation density of mainline detector station based on simulation results and report to an output file named “Log-sat_density”. Since the network model may not be calibrated well, the saturation density calculated based on real world loop data might not be the same as that calculated based on simulation.
3.4 Preparation of “swarm_control” This file includes the design of the SWARM algorithm to the target network.
total number of SWARM controlled ramps is 8 metering rate update interval 30 report metering rate yes
ramp 92 freeway 405 direction N postmile 5.74 mainline detector 405n5.74ml upstream ramp 95 N/A N/A N/A apportionment factor 1.0 0.0 0.0 0.0 onramp detector 405n5.74orb queue detector 405n5.74orspill HOV 0 metering mode SWARM_1 minimum rate control ABS_MIN default rate control ABS_MAX swarm startup strategy RUN_SWARM_DURING_TOD_ONLY rate restriction 6 30 …
The unit of the metering rate in “swarm_control” is veh/minute. The on-ramps (such as “92”) listed in “swarm_control” are ordered by freeway id, direction, from downstream to upstream. The furthest downstream ramp on a freeway is input first. “mainline detector” is the corresponding mainline detector of a “ramp”. “postmile” can be obtained from Caltrans, which is a basic input of SWARM. In general, a ramp’s postmile is the same as the postmile of the corresponding mainline detector of the ramp. “upstream ramp” and “apportionment factor” are used for metering rate apportionment, the second part of the SWARM 1 algorithm. “metering mode” can be one of has the following: DISABLED_MODE, SWARM_1, SWARM_2A, SWARM_2B, SWARM_1_2B, SWARM_2A_2B, SWARM_1_2A, SWARM_1_2A_2B, LOCAL_TOD, and LOCAL_LMR.

PATH ATMS Center SWARM Ramp metering control Plugin
14
All ramps should be included in “swarm_control”. If it is a freeway-to-freeway or unmetered ramp, the metering mode can be set as DISABLED_MODE. “minimum rate control” is one of the following two: “TOD_TABLE_MIN”, “ABS_MIN”. “default rate control” is one of “TOD_TABLE_DEFAULT” and “ABS_MAX”. “swarm startup strategy” is one of “RUN_SWARM_ANYTIME” and “RUN_SWARM_DURING_TOD_ONLY”.
3.5 Loading plugin The names of this plugin files are:
swarm.dll: Modeller Plugin swarm-p.dll: Processor Plugin
The SWARM plugin depends on other two plugins, ramp metering control and loop data aggregator. These two plugins should be specified earlier than this plugin in the “plugins” or “programming” file, i.e.:
loop_agg.dll ramp_controller.dll swarm.dll
If you want to implement SWARM with a queue override strategy, you will need to disable the queue override strategy in the SWARM plugin through specifying queue detector as “N/A” in “swarm_control”. Then you need to add on-ramp queue control plugin to the “plugins” or “programming” file with the following sequence:
loop_agg.dll ramp_controller.dll queue_control.dll swarm.dll
In addition, in order to correctly load and run this plugin, please satisfy the following requirements: (1) For ramp metering plugin: on-ramp signals controlled by the SWARM algorithm should be specified in “ramp_control”. For example, if the on-ramp signal 33 is under SWARM control, on-ramp signal 33 also needs to be specified in “ramp_control” as the following format:
on-ramp signal 33 name 405N & ICD 1 @ 0.93
PATH ATMS Center SWARM Ramp metering control Plugin
15
demand detector 405n0.93orb number of control plans 2 from 6:0 to 9:0 METER_ON with 1 veh per 6 sec from 15:0 to 19:0 METER_ON with 1 veh per 6 sec
If an on-ramp signal is specified in “swarm_control” but not in “ramp_control”, this on-ramp signal will be regarded as a “METER_OFF” meter. (2) For the loop data aggregator plugin: all detectors used by SWARM should be specified in “loop_control” for the aggregated data collection. In addition, the “metering rate update interval” specified in the second row of “swarm_control” must be the same as the “report cycle” in “loop_control”.
3.6 Output files Each simulation run will generate two output files, “Log_meteringRate” and “Log-sat_density”. They can be found in the subdirectory:
network/Log/run-xxx
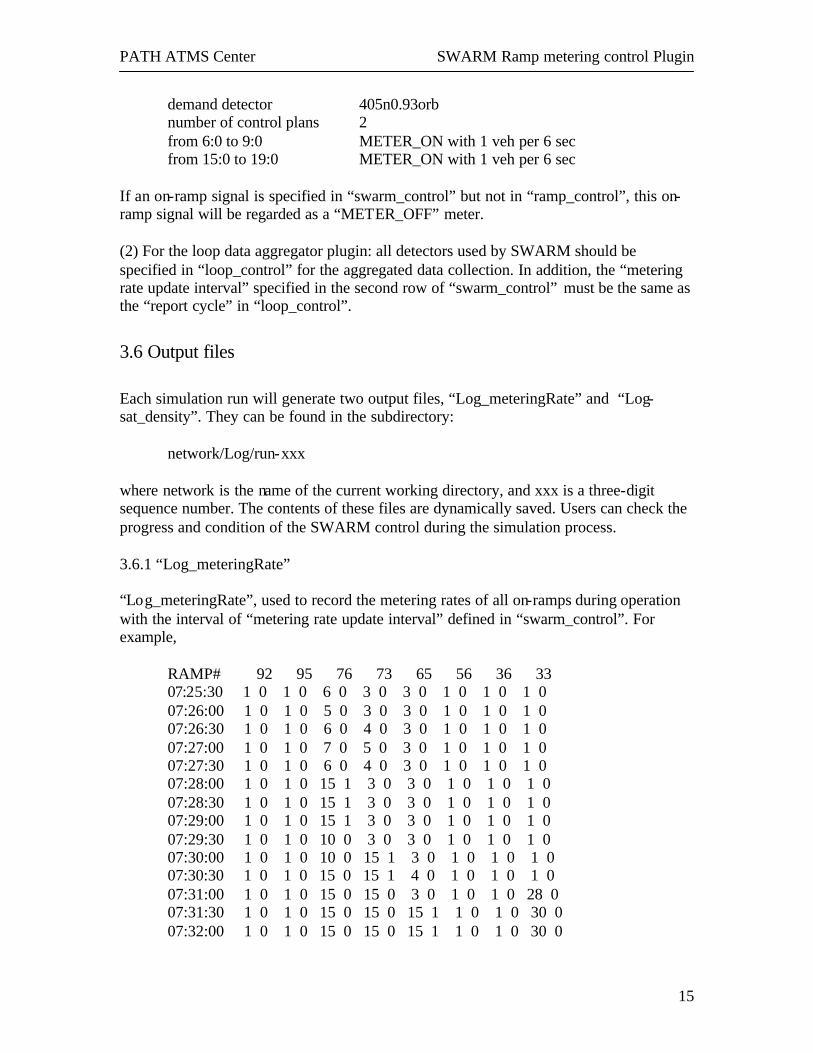
where network is the name of the current working directory, and xxx is a three-digit sequence number. The contents of these files are dynamically saved. Users can check the progress and condition of the SWARM control during the simulation process. 3.6.1 “Log_meteringRate” “Log_meteringRate”, used to record the metering rates of all on-ramps during operation with the interval of “metering rate update interval” defined in “swarm_control”. For example,
RAMP# 92 95 76 73 65 56 36 33 07:25:30 1 0 1 0 6 0 3 0 3 0 1 0 1 0 1 0 07:26:00 1 0 1 0 5 0 3 0 3 0 1 0 1 0 1 0 07:26:30 1 0 1 0 6 0 4 0 3 0 1 0 1 0 1 0 07:27:00 1 0 1 0 7 0 5 0 3 0 1 0 1 0 1 0 07:27:30 1 0 1 0 6 0 4 0 3 0 1 0 1 0 1 0 07:28:00 1 0 1 0 15 1 3 0 3 0 1 0 1 0 1 0 07:28:30 1 0 1 0 15 1 3 0 3 0 1 0 1 0 1 0 07:29:00 1 0 1 0 15 1 3 0 3 0 1 0 1 0 1 0 07:29:30 1 0 1 0 10 0 3 0 3 0 1 0 1 0 1 0 07:30:00 1 0 1 0 10 0 15 1 3 0 1 0 1 0 1 0 07:30:30 1 0 1 0 15 0 15 1 4 0 1 0 1 0 1 0 07:31:00 1 0 1 0 15 0 15 0 3 0 1 0 1 0 28 0 07:31:30 1 0 1 0 15 0 15 0 15 1 1 0 1 0 30 0 07:32:00 1 0 1 0 15 0 15 0 15 1 1 0 1 0 30 0

PATH ATMS Center SWARM Ramp metering control Plugin
16
07:32:30 1 0 1 0 10 0 10 0 15 1 1 0 1 0 30 0 …
For each on-ramp, there are a metering rate and a queue override flag outputs. The unit of the metering rate is vehicle per minute. If the value of the metering rate is 1, it means there is no metering at the on-ramp (or called greenball). The queue override flag can be a value of either “1” or “0”. “1” represents that the metering at the on-ramp is under the default queue override strategy control. The default queue override strategy can be described as follows:
If the occupancy value of the queue detector exceeds a threshold, i.e. 50%, the maximum metering rate will be applied to the corresponding meter in order to release more vehicles to freeway
The corresponding metering rate of the on-ramp will be the maximum rate defined in the “swarm_control”. 3.6.2 “Log-sat_density” “Log-sat_density”, used to store the calculated saturation density at each mainline detector station. The following is an example of the resulting “Log-sat_density” file:
time 405n5.74ml 405n5.55ml 405n4.03ml 405n3.86ml 405n2.99ml 405n1.93ml 405n1.11ml 405n0.93ml 405n0.6ml 06:30:00 45 45 45 45 45 45 35 45 45 time vds_name old_sat new_sat smoothed_sat 08:13:30 405n0.93ml 45 45 45 08:15:00 405n2.99ml 45 44 45 08:16:30 405n4.03ml 45 52 45 08:17:00 405n3.86ml 45 45 45 08:19:30 405n1.93ml 45 47 45 08:28:00 405n1.11ml 35 34 35
There are two parts in “Log-sat_density”. In the first part, the first row listed names of all mainline loop detector stations. The second row shows the saturation density values of these stations obtained from “vds_control”. The second part shows the calculated saturation densities of mainline detector stations. The "Sample size required to compute saturation density" is a user-specified variable ranging from 6 to 1200. Its default value is 200. The second part has 5 columns, i.e., the time of calculation, name of detector station, original saturation density, calculated saturation density, and the smoothed saturation density. The calculation of the smoothed saturation density uses a parameter, i.e.

PATH ATMS Center SWARM Ramp metering control Plugin
17
“Smoothing factor for saturation density computation”, defined in the second part of “swarm_global”. The default value of this parameter is 0.05.
αα *_)1(*__ satnewsatoldsatsmoothed +−= If you do not know the saturation density at a detector station, we strongly recommend users to use the first simulation run to calculate saturation density values at all detector stations. The value shown in the column of “new_sat” is a good value of the saturation density because it does not involve the use of the smoothing factor. Then you can update the saturation density values in “vds_control”. For a following simulation run, the saturation density values shown in “vds_control” are applied before enough data are collected for the calculation of new saturation density values. If a new saturation density is calculated, the smoothed saturation density will be applied instead of the va lue shown in “vds_control”. As a result, the first simulation run will help users know what the saturation density is at mainline detector stations. In order to update an inaccurate saturation density, users need to edit the “vds_control” file manually.
3.7 Error checking Under network directory, a file named “Log-swarm.txt” is generated for storing all temporary calculations and outputs of SWARM control. This file employs two purposes:
(1) It can be used to check if there is any problem in the “global_control”, “vds_control”, and “swarm_control” files.
(2) It can be used to check if SWARM is operated as expected or if the implementation of SWARM in the target network is proper. At each time step, the detailed metering rate calculations (including SWARM 2a, SWARM 2b, SWARM 1) are recorded.
Since this file is saved to the network directory, the file is generated based on the latest simulation run.
3.8 Fine-tuning parameters of SWARM There are many parameters in SWARM. During the testing process, users can modify all parameters. A parameter or the combination of a set of parameters may be appropriate for a network, but may not be appropriate for another network.

PATH ATMS Center SWARM Ramp metering control Plugin
18
Some performance measures are needed to fine-tune parameters of SWARM. Users can use the “measurements” file to collect statistical data or use the freeway MOE plugin we developed to collect these measures. The saturation density is an important parameter of SWARM. The goodness of this parameter affects the performance of SWARM. Users can start the first simulation run with the SWARM control with a series of assumed saturation values. Then you can check the “Log-sat_density” file under Log directory, which is used to record the saturation density values of all mainline loop detector stations in the network, calculated based on the second degree polynomial method. The value in the column of “new_sat” might be a better value of saturation density that can be used to replace your assumed values.

PATH ATMS Center SWARM Ramp metering control Plugin
19
4 Technical Supports
4.1 Limitations of this plugin 1. Failure management SWARM in the real world considers the situation that loop detector data are missing or deficient. However, in the simulation world, detector data are obtained based on another plugin module, loop data aggregator, which provides aggregated detector data as accurately as possible. As a result, this developed SWARM plugin works with good loop detector data all the time. The failure management part of SWARM never has chance to be used. 2. Queuing strategies Based on the design document of SWARM, the central SWARM system will have four options about queuing control:
(1) Use local controller strategy, i.e., when a queue is detected, go to maximum rate (2) Gradually increase rate to maximum (3) Ignore queuing for a fixed number of periods then switch to gradual rate increase (4) Totally ignore queuing
However, the source code shows that there are only two options, using the local strategy and disable queue strategy. See the following for reference. In the Traffic Engineer’s manual of District 7, there is another description of queuing strategy. “Local queuing strategies, such as forcing maximum rates when a queue is detected, affect SWARM 1 operations. The final SWARM 1 metering rate will have a lower bound equal to the rate selected by the queuing strategy. The difference between the forced rate (due to local queuing strategies) and the desired SWARM 1 rate will be propagated by SWARM (apportionment) to upstream metered ramps.” Therefore, we can judge that the earlier design of SWARM was not implemented. If this description is right, the queuing strategies should be operated before the calculation of SWARM 1 rate. However, we cannot find any code in the source code. As a result, we only implement the “local controller strategy” in this SWARM plugin. 3. Kalman filtering
typedef enum RMS_queue_strat { QUEUE_STRAT_UNKNOWN = 0, DISABLED_QUEUE_STRATEGY, LOCAL_CONTROLLER } RMS_queue_strat_enum;

PATH ATMS Center SWARM Ramp metering control Plugin
20
The default forecast lead time is 15 minutes, or 30 intervals ahead. The number of points used to estimate density slope as input to the Kalman filter is 6. The accumulated density is used in Kalman filtering, which has a typical trend like the following: However, the variation in the accuracy of the density measurements is 0.04 (allowed range is from 0.02 to 0.5); the variance representing the inaccuracy of the model is 1.0 (allowed range is from 0.5 to 10). We think these two default values need to be calibrated.
4.2 Contact information Any comments and suggestions are welcome. Please contact us at the email address: [email protected].
4.3 References
(1) “Advanced Transportation Management System Traffic Engineer’s Manual”, Revision 1, Prepared by NET for Caltrans District 7, June 2000.
(2) “Integrated Ramp Meter / Arterial Signal Control Project - Detailed Design: System Wide Adaptive Ramp Metering”, Prepared by NET for FHWA FOT, City of Irvine, and Caltrans Distrct 12, August 30, 1996.
(3) “System Wide Adaptive Ramp Metering - High Level Design”, Final Draft, Prepared by NET for Caltrans and FHWA, June 19, 1996.
29 60 87 119 150 …

PATH ATMS Center SWARM Ramp metering control Plugin
21
APPENDIX 1 An example of the “infrastructure layout” obtained from Caltrans