paraquat (057) - food and agriculture organization€¦ · 533 paraquat (057) first draft prepared...
TRANSCRIPT
533
PARAQUAT (057)
First draft prepared by Dr. Yukiko Yamada, National Food Research Institute, Tsukuba, Japan
EXPLANATION Paraquat, a non-selective contact herbicide, was first evaluated in 1970 for toxicology and residues. Subsequently, it was reviewed for toxicology in 1972, 1976, 1982, 1985 and 1986, and for residues in 1972, 1976, 1978 and 1981. The 2003 JMPRMeeting reviewed paraquat toxicologically under the Periodic Review Programme and the current ADI of 0-0.005 mg paraquat cation/kg bw and acute RfD of 0.006 mg paraquat cation/kg bw were recommended. by the 2003 JMPR. The residue evaluation was postponed to the present Meeting. Currently there are 22 Codex MRLs for plant commodities, their derived products, and animal commodities.
The 32nd Session of the CCPR identified paraquat as a priority compound for Periodic Re-evaluation by the 2002 JMPR but residue evaluation was postponed to the present Meeting.
Paraquat is normally available in the form of the dichloride or bis(methyl sulfate) salt. The Meeting received data on metabolism, environmental fate, analytical methods, storage stability, supervised field trials and processing and information on use pattern. IDENTITY ISO common name: paraquat Chemical name IUPAC: 1,1�-dimethyl-4,4�-bipyridinium CAS: 1,1�-dimethyl-4,4�-bipyridinium CAS Registry No.: 1910-42-5 (paraquat dichloride)
4685-14-7 (paraquat) CIPAC No.: 56 The properties listed below refer to the dichloride Synonyms and trade names:
N,N'-dimethyl-4,4'-bi-pyridinium chloride, Gramoxone, Gramoxon, PP148, etc.
Structural formula:
N NH3C CH3 2Cl
Molecular formula: C12H14N2Cl2 Molecular weight: 257.2
(Molecular weight of paraquat ion is 186.3)
paraquat 534
Physical and chemical properties Pure active ingredient (Husband, 2001) Purity: 99.5% Appearance: Off-white hygroscopic solid without characteristic odour Vapour pressure: << 1x10⁻⁵ Pa at 25°C Melting point: No melting below 400°C; decomposition at around 340°C (613°K) Boiling point: Boiling point of pure paraquat dichloride not measurable; decomposition at
~340°C (613°K) Relative density: 1.55 at 25°C Surface tension: 73.4 mN/m at 20°C (at concentration of 0.02 M) Henry’s law constant: 4x10⁻⁹ Pa m3/mol Octanol-water partition coefficient:
Log Pow -4.5 at 25°C
Solubility at 20ºC: Water: 618 g/l at pH 5.2
620 g/l at pH 7.2
620 g/l at pH 9.2 Methanol: 143 g/l Acetone: <0.1 g/l Hexane: <0.1 g/l Dichloromethane: <0.1 g/l Toluene: <0.1 g/l Ethyl acetate: <0.01 g/l
pH at 20°C 6.4 Stability: ≥14 days at 54°C Hydrolysis: No hydrolysis was observed at pH 5, 7 or 9 (91 mg/l; 25 or 40°C for 30 days) Photolysis: In aqueous solution, photochemically decomposed by UV radiation Technical material (Wollerton. 1987)
Purity: Minimum 362 g/l (tested material: 529 g/l) Appearance: Dark red-brown clear liquid Odour: Earthy odour Density: 1.13 g/cm3 at 25°C
paraquat 535
pH: 3.95 at approximately 20 °C Flash point: > 90 °C Surface tension: 58.6 mN/m at 20 °C Storage stability: ≥2 years at 25 °C in polythene Formulations: SL (in various concentrations alone or in combination with diquat) METABOLISM AND ENVIRONMENTAL FATE
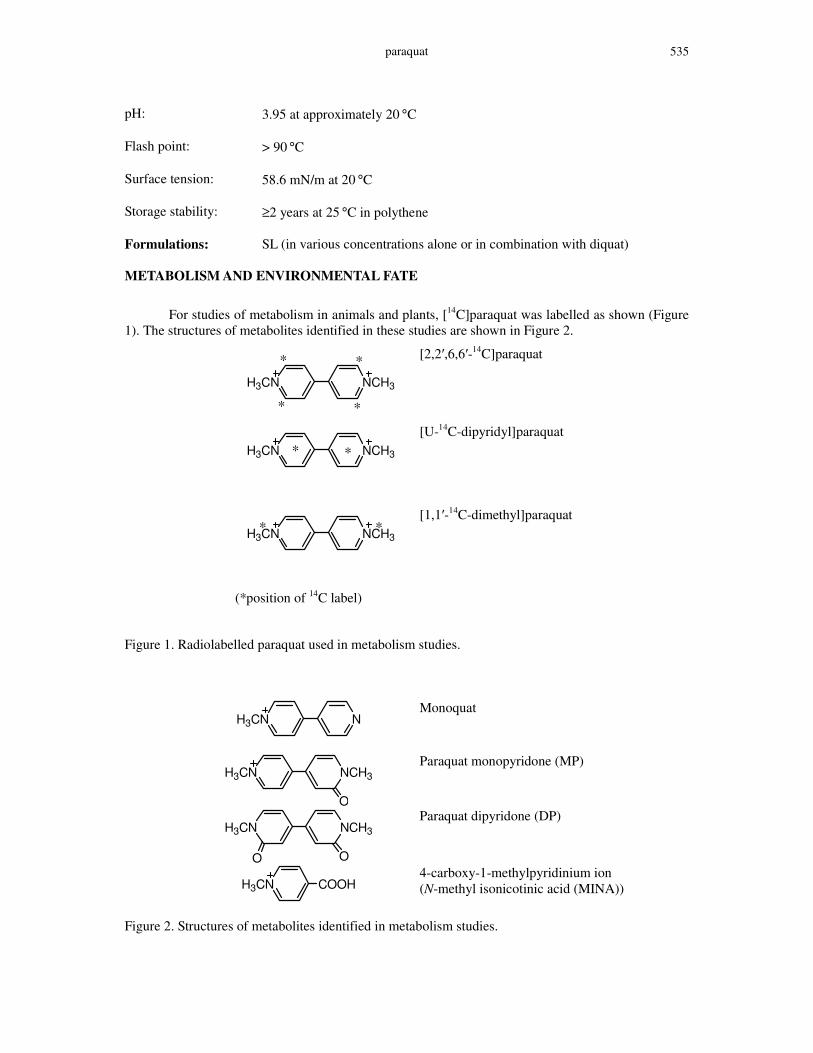
For studies of metabolism in animals and plants, [14C]paraquat was labelled as shown (Figure 1). The structures of metabolites identified in these studies are shown in Figure 2.
H3CN NCH3
*
**
*
[2,2�,6,6�-14C]paraquat
H3CN NCH3* *
[U-14C-dipyridyl]paraquat
H3CN NCH3* *
(*position of 14C label)
[1,1�-14C-dimethyl]paraquat
Figure 1. Radiolabelled paraquat used in metabolism studies.
H3CN N
Monoquat
H3CN NCH3
O
Paraquat monopyridone (MP)
H3CN NCH3
OO
Paraquat dipyridone (DP)
H3CN COOH
4-carboxy-1-methylpyridinium ion (N-methyl isonicotinic acid (MINA))
Figure 2. Structures of metabolites identified in metabolism studies.

paraquat 536
Animal metabolism The Meeting received information on the fate of orally-dosed paraquat in rats, sheep, pigs, a lactating cow and goat, and laying hens. Rats. The excretion balance of paraquat in male and female Alpk:ApfSD rats which were given a single dose (at either 1 mg/kg bw or 50 mg/kg bw of [1,1�-14C-dimethyl]paraquat dichloride) or repeated doses (1 mg/kg bw of radiolabelled paraquat dichloride following 14 daily doses of 1 mg/kg unlabelled compound) (Lythgoe & Howard, 1995 a-c, reported in Macpharson, 1995) was evaluated by the WHO Core Assessment Group of the 2003 JMPR. It concluded that paraquat was not well absorbed when administered orally. After oral administration of radiolabelled paraquat to rats, more than half the dose (60-70%) appeared in the faeces and a small proportion (10-20%) in the urine. Excretion was rapid: about 90% within 72 h. The biotransformation of paraquat was studied by Macpherson (1995) who analysed urine and tissue samples of rats administered the same doses of radiolabelled paraquat as above by TLC and HPLC. This was also reviewed by the WHO Core Assessment Group of the 2003 JMPR together with other rat metabolism and toxicity studies. It was concluded that paraquat is largely eliminated unchanged - approximately 90-95% of radiolabelled paraquat in the urine was excreted as the parent. In some studies no metabolites were identified after oral administration of paraquat, while in others a small degree of metabolism probably occurring in the gut as a result of microbial metabolism was observed. Paraquat was not found in the bile.
Sheep. In a study by Hemmingway et al. (1972) on two sheep [1,1�-14C-dimethyl]paraquat dichloride was administered via a rumen fistula to one sheep weighing 73.5 kg (7.14 mg of radiolabelled+1.7035 g unlabelled paraquat in 30 ml of water) and to another weighing 60.5 kg via subcutaneous injection (0.87 mg of radiolabelled+54.5 mg unlabelled paraquat in 4 ml of water). Urine and faeces from these sheep were collected for 10 days. For spectrophotometric determination of paraquat, 100 g of faeces were boiled with 500 ml of 2N H2SO2 for three hours, the digest was filtered, and the filtrate diluted with an equal volume of water. An aliquot of urine or an aliquot of faeces sample processed as above was percolated separately through a column of cation-exchange resin. The column was washed with 2.5% ammonium chloride solution and the paraquat eluted with saturated ammonium chloride solution. A portion of the column effluent was treated with sodium dithionite in an alkali solution, which reduces paraquat to a free radical whose absorption was measured photometrically at 396 nm with background correction.
It appeared that via rumen fistula, all administered radioactivity was recovered within 10 days in urine and faeces: approximately 4% from the urine and the remainder from the faeces (Table 1). Most of the radioactivity was excreted in the faeces on days 2-5. These results indicate that residues of paraquat do not remain or accumulate in the tissues of sheep when the dose is administered orally.
Table 1. Residues in the urine and faeces of sheep given radiolabelled paraquat via rumen fistula (Hemmingway et al., 1972).
% of administered radioactivity
% of paraquat in excreted radioactivity*
% of radioactivity on paper chromatogram (faeces) Day
Urine Faeces Urine Faeces Paraquat Other bands** 1 1.66 0.8 74 (83) 81 (93) - - 2 1.13 22 87 (95) 89 (90) 99 1 3 0.68 22 78 (88) 85 (101) 99 1 4 0.20 27 77 (80) 86 (89) 99 1 5 0.12 15 72 (80) 94 (103) 98 2 6 0.057 7.5 69 (78) 79 (97) 97 3 7 0.034 4.3 80 (82) 84 (88) - - 8 0.029 1.3 76 (87) 59 (87) - - 9 0.020 0.53 66 (79) 55 (77) - -

paraquat 537
% of administered radioactivity
% of paraquat in excreted radioactivity*
% of radioactivity on paper chromatogram (faeces) Day
Urine Faeces Urine Faeces Paraquat Other bands** 10 0.016 0.23 78 (95) 47 (70) - -
Total 3.9 100.7 - - - - * Percentage of paraquat in the saturated ammonium chloride eluate from a cation-exchange column in parentheses. ** MP + MINA + DP + solvent front area + origin area (solvent system: iso-propanol:ethanol:NH4Cl 3:3:2)
The urine and faeces samples, after fractionation on a cation-exchange column, were analysed by paper chromatography (solvent system: iso-propanol:ethanol:NH4Cl 3:3:2; and n-butanol:acetic acid:water 4:1:2). The chromatograms showed that most of the radioactivity in these samples was unchanged paraquat, and about 2-3% MP. A trace (<1%) can be accounted for as MINA and DP in the iso-propanol:ethanol:NH4Cl solvent system, and monoquat in the n-butanol:acetic acid:water solvent system. The results of paper chromatography (solvent system of iso-propanol:ethanol:NH4Cl 3:3:2) of the faecal samples are also shown in Table 1.
Subcutaneously administered paraquat was also excreted very rapidly. Over 80% of the administered radioactivity was excreted in the urine; 69% one day after the treatment. Unchanged paraquat accounted for most of the radioactivity, MP for 2-3%, and monoquat was a trace metabolite. This pattern is virtually identical to that seen in urine after administration via the rumen fistula.
Pigs. In a trial in 1976 Leahey et al. dosed one pig weighing about 40 kg twice daily with [1,1�-14C-dimethyl]paraquat ion in the diet at a rate of about 100 mg a day, equivalent to 50 mg/kg in the diet for 7 days. Another pig was used as a control. After the first dose, blood was sampled at hourly intervals and the radioactivity measured to determine when peak levels were reached. On subsequent days, a blood sample was taken after the morning dose after an interval corresponding to the time taken to reach the maximum blood level. The faeces and urine were collected from the day before the first administration and the pig was slaughtered two hours after the morning dose on the seventh day and, after bleeding, samples of liver, kidney, muscle, fat, heart, blood, lung and brain were taken. The content of paraquat in the tissues was determined by reverse-isotope dilution.
The radioactivity levels in blood samples increased after the morning dose on the first day, reaching a maximum within two hours of dosing, and then decreased very slowly. The radioactivity in blood did not increase significantly after the second day.
At the time of slaughter 69% of the administered radioactivity had been excreted in the faeces and 3.4% in the urine, and 13.4% was found in the stomach contents and viscera.
The distribution of radioactivity in the tissues All the radioactivity found in all tissues except the liver could be accounted for as paraquat. In the liver about 70% was determined as paraquat, 7% as the monoquat ion and a trace (c.0.6%) of MP ion.
Table 2. Distribution of radioactivity in the tissues of a pig dosed with [1,1�-14C-dimethyl]paraquat for 7 days (Leahey et al., 1976).
Sample Radioactivity as paraquat ion equivalents mg/kg % of radioactivity as paraquat
Hindquarter muscle 0.03 94
Forequarter muscle 0.06 106
Subcutaneous fat 0.02 115
Peritoneal fat 0.06 102

paraquat 538
Sample Radioactivity as paraquat ion equivalents mg/kg % of radioactivity as paraquat
Liver 0.20 73
Kidney 0.46 109
Heart 0.12 104
Lung 0.12 105
Brain 0.02 108
Blood 0.07 104
Spinks et al. in 1976 conducted a similar study except that [2,2�,6,6�-14C]paraquat was used instead of [1,1�-14C-dimethyl]paraquat ion. At slaughter, 72.5% of the administered radioactivity had been excreted in the faeces and 2.8% in the urine.
The distribution of radioactivity in the tissues at the time of slaughter is shown in Table 3. There was no significant metabolism of paraquat in most of the tissues. In the liver, approximately 70% of the radioactivity was accounted for as paraquat with 4% as monoquat.
Table 3. Distribution of radioactivity in tissues of pig dosed with [2,2�,6,6�-14C]paraquat ion for 7 days (Spinks et al., 1976).
Sample Radioactivity as paraquat ion equivalents mg/kg
% of radioactivity as paraquat
Hindquarter muscle 0.05 93
Forequarter muscle 0.05 95
Subcutaneous fat 0.01 105
Peritoneal fat 0.01 106
Liver 0.10 70
Kidney 0.38 101
Heart 0.08 81
Lung 0.10 94
Brain 0.03 62
Blood 0.06 71
Lactating cow. In a study by Leahey et al. (1972), [1,1�-14C-dimethyl]paraquat dichloride was administered using a balling gun to a Friesian cow (475 kg) in a single dose equivalent to approximately 8 mg/kg paraquat ion. The faeces and urine were thereafter collected for nine days, and the milk collected each day in the morning and afternoon (each day of the experiment started at afternoon milking). Faeces and urine samples were processed as in the study on sheep above for spectrophotometric analysis. For the milk samples, five g of cation-exchange resin were added to two l of day-2 pm milk in a polythene bottle which was placed on mechanical rollers for 2.75 hours. After removal of the milk, the resin was transferred to a burette with glass wool above the stopcock. The resin
paraquat 539
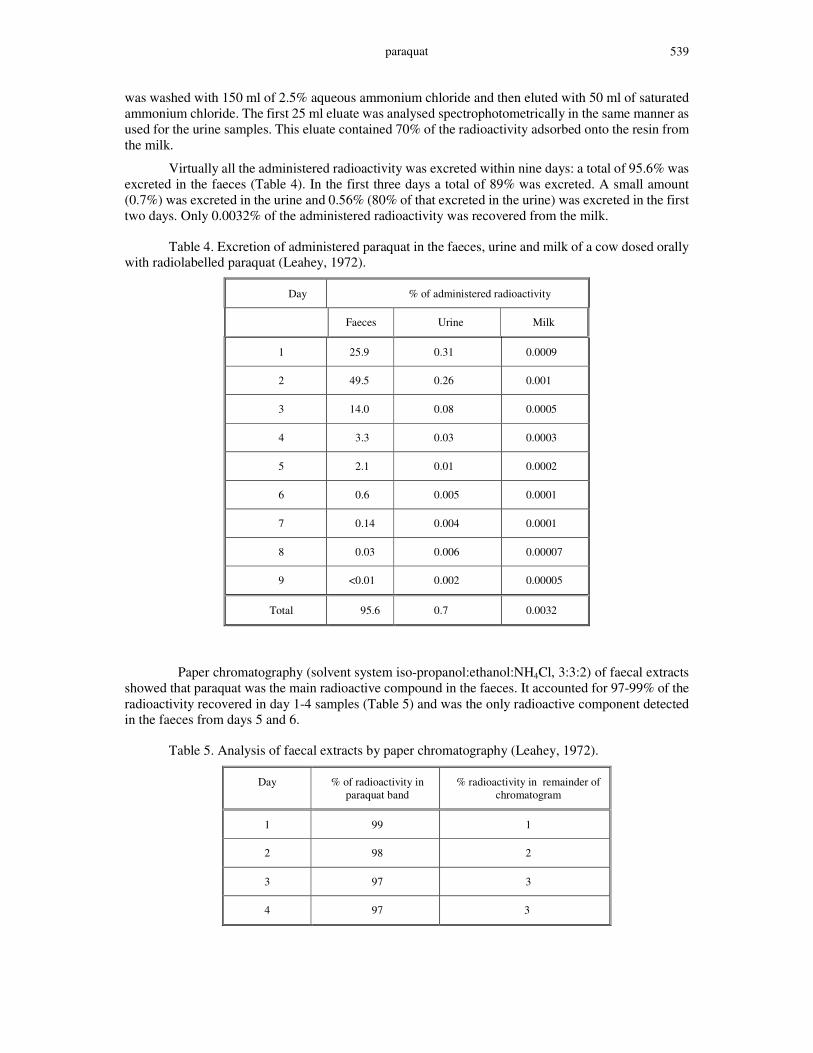
was washed with 150 ml of 2.5% aqueous ammonium chloride and then eluted with 50 ml of saturated ammonium chloride. The first 25 ml eluate was analysed spectrophotometrically in the same manner as used for the urine samples. This eluate contained 70% of the radioactivity adsorbed onto the resin from the milk.
Virtually all the administered radioactivity was excreted within nine days: a total of 95.6% was excreted in the faeces (Table 4). In the first three days a total of 89% was excreted. A small amount (0.7%) was excreted in the urine and 0.56% (80% of that excreted in the urine) was excreted in the first two days. Only 0.0032% of the administered radioactivity was recovered from the milk.
Table 4. Excretion of administered paraquat in the faeces, urine and milk of a cow dosed orally with radiolabelled paraquat (Leahey, 1972).
Day % of administered radioactivity
Faeces Urine Milk
1 25.9 0.31 0.0009
2 49.5 0.26 0.001
3 14.0 0.08 0.0005
4 3.3 0.03 0.0003
5 2.1 0.01 0.0002
6 0.6 0.005 0.0001
7 0.14 0.004 0.0001
8 0.03 0.006 0.00007
9 <0.01 0.002 0.00005
Total 95.6 0.7 0.0032
Paper chromatography (solvent system iso-propanol:ethanol:NH4Cl, 3:3:2) of faecal extracts showed that paraquat was the main radioactive compound in the faeces. It accounted for 97-99% of the radioactivity recovered in day 1-4 samples (Table 5) and was the only radioactive component detected in the faeces from days 5 and 6.
Table 5. Analysis of faecal extracts by paper chromatography (Leahey, 1972).
Day % of radioactivity in paraquat band
% radioactivity in remainder of chromatogram
1 99 1
2 98 2
3 97 3
4 97 3
paraquat 540
Paraquat accounted for 90, 70 and 62% of the radioactivity in the urine from days 1, 3 and 5, respectively. The remaining activity was accounted for as MP and monoquat.
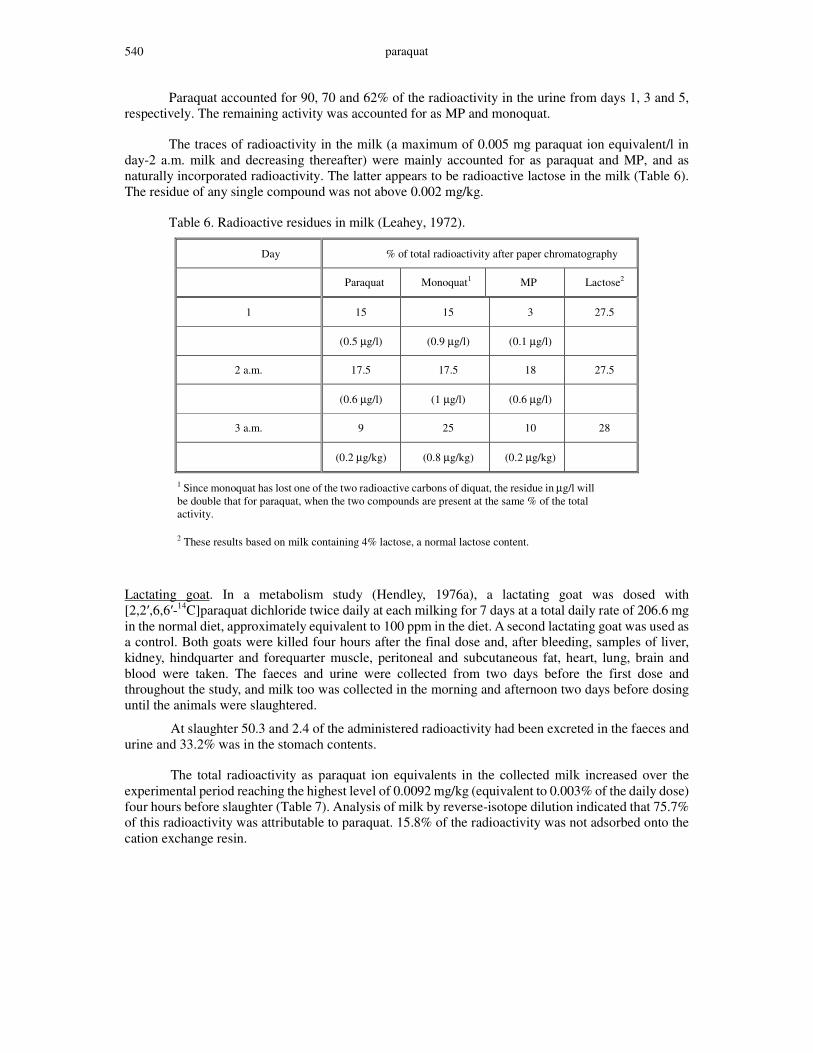
The traces of radioactivity in the milk (a maximum of 0.005 mg paraquat ion equivalent/l in day-2 a.m. milk and decreasing thereafter) were mainly accounted for as paraquat and MP, and as naturally incorporated radioactivity. The latter appears to be radioactive lactose in the milk (Table 6). The residue of any single compound was not above 0.002 mg/kg.
Table 6. Radioactive residues in milk (Leahey, 1972).
Day % of total radioactivity after paper chromatography
Paraquat Monoquat1 MP Lactose2
1 15 15 3 27.5
(0.5 µg/l) (0.9 µg/l) (0.1 µg/l)
2 a.m. 17.5 17.5 18 27.5
(0.6 µg/l) (1 µg/l) (0.6 µg/l)
3 a.m. 9 25 10 28
(0.2 µg/kg) (0.8 µg/kg) (0.2 µg/kg)
1 Since monoquat has lost one of the two radioactive carbons of diquat, the residue in µg/l will be double that for paraquat, when the two compounds are present at the same % of the total activity.
2 These results based on milk containing 4% lactose, a normal lactose content.
Lactating goat. In a metabolism study (Hendley, 1976a), a lactating goat was dosed with [2,2�,6,6�-14C]paraquat dichloride twice daily at each milking for 7 days at a total daily rate of 206.6 mg in the normal diet, approximately equivalent to 100 ppm in the diet. A second lactating goat was used as a control. Both goats were killed four hours after the final dose and, after bleeding, samples of liver, kidney, hindquarter and forequarter muscle, peritoneal and subcutaneous fat, heart, lung, brain and blood were taken. The faeces and urine were collected from two days before the first dose and throughout the study, and milk too was collected in the morning and afternoon two days before dosing until the animals were slaughtered.
At slaughter 50.3 and 2.4 of the administered radioactivity had been excreted in the faeces and urine and 33.2% was in the stomach contents.
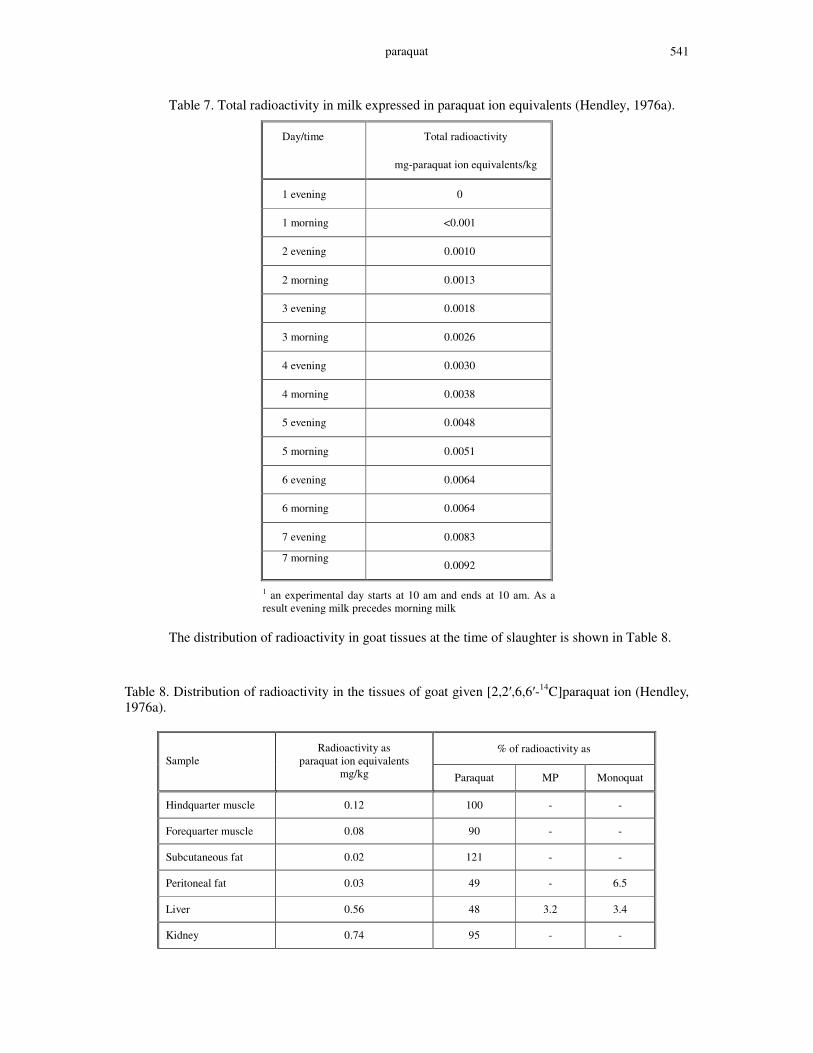
The total radioactivity as paraquat ion equivalents in the collected milk increased over the experimental period reaching the highest level of 0.0092 mg/kg (equivalent to 0.003% of the daily dose) four hours before slaughter (Table 7). Analysis of milk by reverse-isotope dilution indicated that 75.7% of this radioactivity was attributable to paraquat. 15.8% of the radioactivity was not adsorbed onto the cation exchange resin.
paraquat 541
Table 7. Total radioactivity in milk expressed in paraquat ion equivalents (Hendley, 1976a).
Day/time Total radioactivity
mg-paraquat ion equivalents/kg
1 evening 0
1 morning <0.001
2 evening 0.0010
2 morning 0.0013
3 evening 0.0018
3 morning 0.0026
4 evening 0.0030
4 morning 0.0038
5 evening 0.0048
5 morning 0.0051
6 evening 0.0064
6 morning 0.0064
7 evening 0.0083
7 morning 0.0092
1 an experimental day starts at 10 am and ends at 10 am. As a result evening milk precedes morning milk
The distribution of radioactivity in goat tissues at the time of slaughter is shown in Table 8.
Table 8. Distribution of radioactivity in the tissues of goat given [2,2�,6,6�-14C]paraquat ion (Hendley, 1976a).
% of radioactivity as Sample
Radioactivity as paraquat ion equivalents
mg/kg Paraquat MP Monoquat
Hindquarter muscle 0.12 100 - -
Forequarter muscle 0.08 90 - -
Subcutaneous fat 0.02 121 - -
Peritoneal fat 0.03 49 - 6.5
Liver 0.56 48 3.2 3.4
Kidney 0.74 95 - -
paraquat 542
% of radioactivity as Sample
Radioactivity as paraquat ion equivalents
mg/kg Paraquat MP Monoquat
Heart 0.16 118 - -
Brain 0.13 106 - -
Blood 0.06 82 - -
NB: no reliable result could be obtained for lung, possibly due to vomiting at the time of slaughter and regurgitated diet containing radiolabelled paraquat entering the lungs.
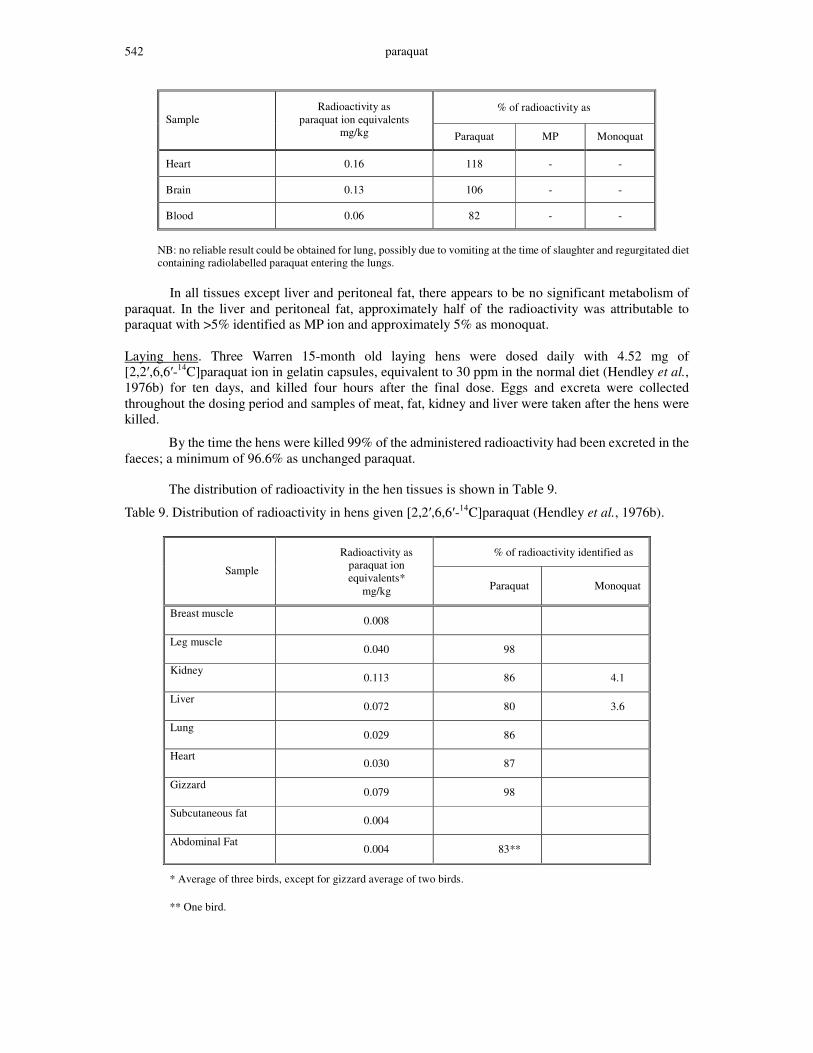
In all tissues except liver and peritoneal fat, there appears to be no significant metabolism of paraquat. In the liver and peritoneal fat, approximately half of the radioactivity was attributable to paraquat with >5% identified as MP ion and approximately 5% as monoquat. Laying hens. Three Warren 15-month old laying hens were dosed daily with 4.52 mg of [2,2�,6,6�-14C]paraquat ion in gelatin capsules, equivalent to 30 ppm in the normal diet (Hendley et al., 1976b) for ten days, and killed four hours after the final dose. Eggs and excreta were collected throughout the dosing period and samples of meat, fat, kidney and liver were taken after the hens were killed.
By the time the hens were killed 99% of the administered radioactivity had been excreted in the faeces; a minimum of 96.6% as unchanged paraquat.
The distribution of radioactivity in the hen tissues is shown in Table 9.
Table 9. Distribution of radioactivity in hens given [2,2�,6,6�-14C]paraquat (Hendley et al., 1976b).
% of radioactivity identified as
Sample
Radioactivity as paraquat ion equivalents*
mg/kg Paraquat Monoquat
Breast muscle 0.008
Leg muscle 0.040 98
Kidney 0.113 86 4.1
Liver 0.072 80 3.6
Lung 0.029 86
Heart 0.030 87
Gizzard 0.079 98
Subcutaneous fat 0.004
Abdominal Fat 0.004 83**
* Average of three birds, except for gizzard average of two birds.
** One bird.
paraquat 543
In eggs the radioactivity in the albumen was never above 0.0014 mg/kg paraquat ion equivalents and in the yolks was <0.001 mg/kg paraquat ion equivalents on day 1, gradually increasing to 0.18 mg/kg (one bird) on day 8, the last day eggs were collected. All of the radioactivity in the yolks was identified as paraquat.
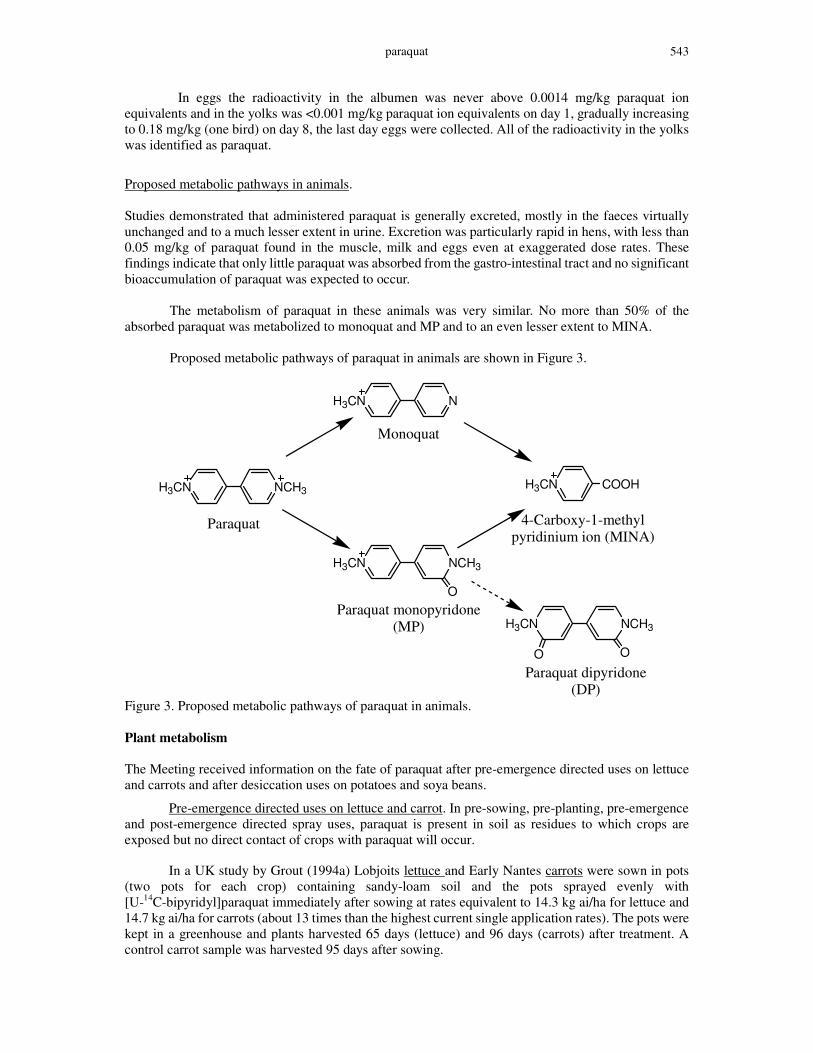
Proposed metabolic pathways in animals. Studies demonstrated that administered paraquat is generally excreted, mostly in the faeces virtually unchanged and to a much lesser extent in urine. Excretion was particularly rapid in hens, with less than 0.05 mg/kg of paraquat found in the muscle, milk and eggs even at exaggerated dose rates. These findings indicate that only little paraquat was absorbed from the gastro-intestinal tract and no significant bioaccumulation of paraquat was expected to occur. The metabolism of paraquat in these animals was very similar. No more than 50% of the absorbed paraquat was metabolized to monoquat and MP and to an even lesser extent to MINA. Proposed metabolic pathways of paraquat in animals are shown in Figure 3.
H3CN NCH3
H3CN N
H3CN NCH3
O
H3CN NCH3
OO
H3CN COOH
Paraquat
Monoquat
Paraquat monopyridone(MP)
4-Carboxy-1-methylpyridinium ion (MINA)
Paraquat dipyridone(DP)
Figure 3. Proposed metabolic pathways of paraquat in animals. Plant metabolism The Meeting received information on the fate of paraquat after pre-emergence directed uses on lettuce and carrots and after desiccation uses on potatoes and soya beans.
Pre-emergence directed uses on lettuce and carrot. In pre-sowing, pre-planting, pre-emergence and post-emergence directed spray uses, paraquat is present in soil as residues to which crops are exposed but no direct contact of crops with paraquat will occur.
In a UK study by Grout (1994a) Lobjoits lettuce and Early Nantes carrots were sown in pots (two pots for each crop) containing sandy-loam soil and the pots sprayed evenly with [U-14C-bipyridyl]paraquat immediately after sowing at rates equivalent to 14.3 kg ai/ha for lettuce and 14.7 kg ai/ha for carrots (about 13 times than the highest current single application rates). The pots were kept in a greenhouse and plants harvested 65 days (lettuce) and 96 days (carrots) after treatment. A control carrot sample was harvested 95 days after sowing.

paraquat 544
The radioactivity in the lettuce leaves and carrots was very low (0.0034 and 0.0048 mg/kg paraquat ion equivalent). This result demonstrates that there is no significant translocation of residues of paraquat from treated soil to lettuce leaves or carrot roots.
Post-emergence uses on potato and soya beans. Paraquat can be used as a crop desiccant and harvest aid. In these uses, paraquat contacts crops directly. In a greenhouse trial by Grout (1994b) in the UK potatoes and soya beans were grown in pots. To maximize residues the foliage was treated with [14C]paraquat at rates equivalent to 8.7 or 8.8 kg ai/ha for potatoes, and 8.2 kg ai/ha soya plants. These rates were 14-15 times the highest current use for desiccation on potato plants and 16 times that on soya bean plants. Plants were harvested 4 days after treatment, except that a control soya plant which was harvested 3 days after the day of treatment. The plants were separated into foliage and tubers (potato) or pods, foliage and root (soya beans) with soil carefully removed. The potato tubers, soya beans and soya foliage were analysed for radioactivity and metabolites (TLC). The total radioactive residue (TRR) in the potato tubers, soya beans and foliage was determined by combustion analysis. For characterization of radioactive residues, potato tubers, soya beans and soya foliage were extracted with a series of solvents (shown below) and the radioactivity of the obtained extracts was measured by liquid scintillation counting and of the remaining debris by combustion.
Potato tuber: Acetonitrile � 2M HCl � 6M HCl (refluxing for 4 h)
Soya beans: Hexane � Dichloromethane � Water (Extraction of the remaining debris: 2M HCl � 6M HCl (refluxing for 4 h))
Soya foliage: Dichloromethane � 2M HCl � 6M HCl (refluxing for 4 h)
The TRR in the samples was calculated as a sum of the radioactivity in the extracts and in the debris. Extracts were analysed by TLC (solvent system I, acetonitrile:water:acetic acid, 5:4:1; and solvent system II, 2M HCl:iso-propanol, 19:1) and the results confirmed with reverse-phase HPLC (column, S5 ODS2, 25 cm x 4.6 mm i.d.; flow rate, 2.0 mgl/min; detection wavelength, 290 nm; mobile phase, water:methanol 3:1 plus 12.7 ml of orthophosphoric acid, 10.3 ml of diethylamine and 2.29 g of sodium octanesulphonate acid per l). The 2M HCl extract and of soya foliage sample was further analysed by HPLC with two different solvent systems (system III, water:methanol 19:1 plus 12.7 ml of orthophosphoric acid, 10.3 ml of diethylamine and 2.29 g of sodium octanesulphonate acid per l, followed by water:methanol 3:1 plus 12.7 ml of orthophosphoric acid, 10.3 ml of diethylamine and 2.29 g of sodium octanesulphonate acid per l; and sytem IV, deionized water followed by 7.4% trifluoroacetic acid in deionized water) for confirmation of the presence of monoquat and MINA. The average TRRs expressed as paraquat ion equivalents in soya foliage and beans was 638 and 0.747 mg/kg and in potato tubers 0.082 mg/kg. In the potato tubers, soya beans and soya foliage, 90.2%, 88.9% and 93.8% of the TRR (sum of radioactivity in extracts and debris combined) of each sample respectively was identified as paraquat. The remainder consisted of 2 or 3 fractions, none of which exceeded 10% (Table 8). In soya foliage extracts, a small proportion of MINA (0.3% of the TRR of extracts and debris combined), a known phododegradation product of paraquat, and monoquat (0.3 % of the TRR of extracts and debris combined) were found.

paraquat 545
Table 10. TRR in potato and soya beans (Grout, 1994b).
TRR as paraquat ion equivalents, mg/kg Sample Potato tuber Soya beans Soya foliage
Plant parts from treated plants (2)
0.089 0.0751
0.8411 0.652
506 7691
Plant parts from control plant (1)
<0.0012 <0.0034 <0.0035
Extracts + debris 0.088 0.793 844 Sample Fraction % of
TRR2 Residue as paraquat ion
equivalent, mg/kg Identified as paraquat ion 90.2 0.079 Aqueous fraction after reflux with 6M HCL
7.5 0.007
Unextracted 1.0 <0.001 TLC remainder3 2.4 0.002 Loss on work-up (-1.1) (-0.001)
Potato tuber
Total 100.0 - Identified as paraquat ion 88.9 0.705 Hexane extract 0.4 0.003 Unextracted 0.9 0.007 TLC remainder3 4.4 0.035 Loss on work-up 5.4 0.043
Soya beans
Total 100.0 - Identified as paraquat ion 93.8 792 Identified as MINA 0.3 2.5 Identified as monoquat 0.3 2.5 Unextracted 1.0 8.4 TLC remainder4 5.1 43.1 Loss on work-up (-0.5) (-4.2)
Soya foliage
Total 100.0 -
1 Sample used for extraction and TLC analysis. 2 Extracts and debris combined. 3 Consists of background noise between regions of interest from TLC. 4 Consists of background noise, an unknown from TLC analysis (Unknown 1, 1.2% of TRR) and some streaking between regions of interest from TLC, plus low levels of activity between regions of interest from HPLC.
Proposed metabolic pathway in plants
Pre-emergence and post-emergence directed use of paraquat does not cause crops to have direct contact with paraquat. Since paraquat is well adsorbed by soil, its uptake by the plant is insignificant even at exaggerated application rates. When paraquat was applied as a desiccant to potato and soya beans at a rate >10 times the highest recommended application rate, with a 4 day PHI, the predominant component in potato tubers, soya beans and soya foliage was paraquat. In soya foliage, monoquat and MINA were also found. Although MINA is a known photodegradation product and it was not found in soya beans or potato tuber, a possibility of biotransformation cannot be excluded because the TRR in them were too low for reliable identification. Since the fate of paraquat in soya foliage seems to involve photodegradation, its fate is considered to be common among plants.
The proposed metabolic pathways of paraquat in plants are shown in Figure 4.
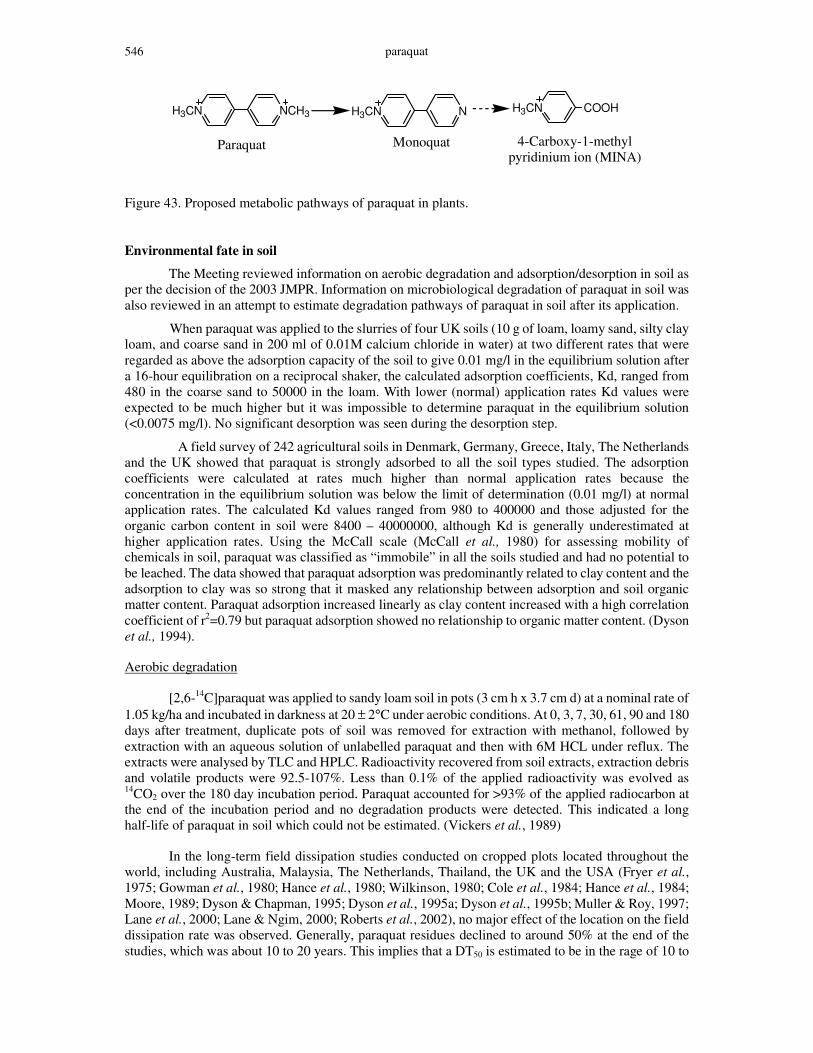
paraquat 546
H3CN NCH3 H3CN N H3CN COOH
Paraquat Monoquat 4-Carboxy-1-methylpyridinium ion (MINA)
Figure 43. Proposed metabolic pathways of paraquat in plants. Environmental fate in soil
The Meeting reviewed information on aerobic degradation and adsorption/desorption in soil as per the decision of the 2003 JMPR. Information on microbiological degradation of paraquat in soil was also reviewed in an attempt to estimate degradation pathways of paraquat in soil after its application.
When paraquat was applied to the slurries of four UK soils (10 g of loam, loamy sand, silty clay loam, and coarse sand in 200 ml of 0.01M calcium chloride in water) at two different rates that were regarded as above the adsorption capacity of the soil to give 0.01 mg/l in the equilibrium solution after a 16-hour equilibration on a reciprocal shaker, the calculated adsorption coefficients, Kd, ranged from 480 in the coarse sand to 50000 in the loam. With lower (normal) application rates Kd values were expected to be much higher but it was impossible to determine paraquat in the equilibrium solution (<0.0075 mg/l). No significant desorption was seen during the desorption step.
A field survey of 242 agricultural soils in Denmark, Germany, Greece, Italy, The Netherlands and the UK showed that paraquat is strongly adsorbed to all the soil types studied. The adsorption coefficients were calculated at rates much higher than normal application rates because the concentration in the equilibrium solution was below the limit of determination (0.01 mg/l) at normal application rates. The calculated Kd values ranged from 980 to 400000 and those adjusted for the organic carbon content in soil were 8400 – 40000000, although Kd is generally underestimated at higher application rates. Using the McCall scale (McCall et al., 1980) for assessing mobility of chemicals in soil, paraquat was classified as “immobile” in all the soils studied and had no potential to be leached. The data showed that paraquat adsorption was predominantly related to clay content and the adsorption to clay was so strong that it masked any relationship between adsorption and soil organic matter content. Paraquat adsorption increased linearly as clay content increased with a high correlation coefficient of r2=0.79 but paraquat adsorption showed no relationship to organic matter content. (Dyson et al., 1994).
Aerobic degradation
[2,6-14C]paraquat was applied to sandy loam soil in pots (3 cm h x 3.7 cm d) at a nominal rate of 1.05 kg/ha and incubated in darkness at 20 ± 2°C under aerobic conditions. At 0, 3, 7, 30, 61, 90 and 180 days after treatment, duplicate pots of soil was removed for extraction with methanol, followed by extraction with an aqueous solution of unlabelled paraquat and then with 6M HCL under reflux. The extracts were analysed by TLC and HPLC. Radioactivity recovered from soil extracts, extraction debris and volatile products were 92.5-107%. Less than 0.1% of the applied radioactivity was evolved as 14CO2 over the 180 day incubation period. Paraquat accounted for >93% of the applied radiocarbon at the end of the incubation period and no degradation products were detected. This indicated a long half-life of paraquat in soil which could not be estimated. (Vickers et al., 1989)
In the long-term field dissipation studies conducted on cropped plots located throughout the world, including Australia, Malaysia, The Netherlands, Thailand, the UK and the USA (Fryer et al., 1975; Gowman et al., 1980; Hance et al., 1980; Wilkinson, 1980; Cole et al., 1984; Hance et al., 1984; Moore, 1989; Dyson & Chapman, 1995; Dyson et al., 1995a; Dyson et al., 1995b; Muller & Roy, 1997; Lane et al., 2000; Lane & Ngim, 2000; Roberts et al., 2002), no major effect of the location on the field dissipation rate was observed. Generally, paraquat residues declined to around 50% at the end of the studies, which was about 10 to 20 years. This implies that a DT50 is estimated to be in the rage of 10 to

paraquat 547
20 years after applying single large treatments of paraquat to soil. However, a DT90 could not be estimated as time points after 90% degradation was not available.
Microbiological degradation in soil
Conventional laboratory studies could not provide useful information on the degradation route and rate of paraquat in soil because of its strong adsorption. Although paraquat is readily degraded by certain selected soil microorganisms when in a soil solution, its extremely strong adsorption to soil minerals and organic matter, accounting for its rapid biological deactivation, limits the rate at which degradation occurs. Alternative studies were therefore carried out to determine the route and rate of degradation of paraquat in soil.
The route of degradation has been elucidated from studies with paraquat in cultures of soil microorganisms, whilst the rate of degradation has been established from long-term field trials.
Baldwin found that the most effective organism for decomposing paraquat was a yeast, isolated from several soils and identified as Lipomyces starkeyi. This yeast can utilize paraquat as a sole source of nitrogen. When incubated with [1,1�-14C]paraquat or [2,2�,3,3�-14C]paraquat, it decomposed 95% of 20 mg/kg paraquat in the culture in 2 weeks and 82-84% of the radioactivity was released as CO2 during 4 weeks at 24°C. No intermediate degradation products were detected in the culture medium (Baldwin et al., 1966).
A large-scale incubation of Lipomyces starkeyi was carried out in 7 l of sucrose mineral salts medium with 100 mg/kg paraquat as the sole nitrogen source. After 4 weeks of incubation at 25 °C with continuous air agitation, the medium was acidified to pH 1 and heated to 100°C. The volume was then reduceds to 2 l and was extracted with ether. After two days crystals were formed in the ether extract, which were identified as oxalic acid after purification. When [1,1�-14C]paraquat was added at the beginning of the incubation, oxalic acid formed after 12 days of incubation contained only 2% of the original radioactivity, but when [2,2�,3,3�-14C]paraquat was added, the oxalic acid retained 25% of the original radioactivity. It was speculated that pyridine-ring carbons are liberated and then incorporated into the normal metabolic pathway. All the paraquat added to the medium was decomposed in 7 days and about 80% of the radioactivity was lost as 14CO2 in 12 days (Baldwin, 1971).
[U-14C-dipyridyl]paraquat was added at 10 or 100 mg/kg to incubation vessels containing either Lipomyces starkeyi cultures or cultures originating from two sandy loam soils taken from Frensham and Broadricks sites. This mixture was incubated at 20°C, in the absence of light and under aerobic conditions, for 20–36 days. Paraquat was extensively metabolized with the rapid production of 14CO2. Typical mineralization to CO2 was around 40, 50 and 55% for the Lipomyces culture, the Broadricks culture and the Frensham culture incubations respectively. TLC analysis of the incubation solutions showed almost identical radiolabelled metabolite profiles among the cultures. A major metabolite consisting >85% of the remaining radiochemical in the incubation solution, a minor metabolite (<5%) and a metabolite which was incorporated in the degrading microbial cultures (<10%) were characterized. The major metabolite was identified by HPLC, capillary electrophoresis and mass spectrometry as oxalic acid. No paraquat was identified in any of the incubation solutions where mineralization had taken place (Rickets, 1997).
An unidentified bacterium isolated from soil was incubated with [1,1�-14C]paraquat. The radioautography of the thin-layer chromatogram of the culture filtrate after 4 days incubation showed two new radioactive spots in addition to paraquat. These were tentatively identified as monoquat and MINA (Funderburk and Bozarth, 1967).
The degradation of MINA was studied by incubating the extract of Achromobacter D with 4-carboxy-1-methylpyridinium chloride which was labelled with 14C at the N-methyl, carboxyl or pyridine ring (positions 2 & 3) moiety. The results showed that the extracts of Achromobacter D produced CO2, methylamine, succinate and formate as metabolic end-products of MINA. The CO2 was
paraquat 548
demonstrated to originate from the carboxyl group and methylamine from the N-methyl group by the experiments using carboxy-labelled paraquat and N-methyl labelled paraquat respectively. The carbon skeletons of formate and succinate were shown to arise from the C-2 and C-3-C-6 atoms of the pyridine ring respectively by the experiment using pyridine-labelled paraquat. The latter results indicated the cleavage of pyridine between C-2 and C-3 (Wright and Cain, 1972).
In order to determine the degradation rate of paraquat in soil, [U-14C-dipyridyl]paraquat was incubated at 10 mg/kg with pure cultures of Lipomyces and mixed cultures derived from two soils (Frensham loamy sand and 18 Acres sandy clay loam). The aqueous soil extracts from these were used for both the mixed and pure cultures to represent typical chemical conditions in soil pore water with respect to the supply of minerals. In these culture systems, the degradation of paraquat was rapid, with DT50 values between 0.02 and 1.3 days following a lag phase of about 2 days. Degradation of the parent compound was also accompanied by rapid mineralization to CO2, reaching a maximum of 71.6% 7 days after treatment. Several minor polar metabolites were found although not identified. These results confirmed that paraquat is biodegradable (Kuet et al., 2001).
Photolysis on a soil surface The photolysis of [2,2�,6,6�-14C]paraquat was studied in the UK. Radiolabelled paraquat was added to the surface of a very sandy soil. Paraquat was exposed to natural sunlight for periods up to 85 weeks. Some samples were mixed at regular intervals while others were not mixed. Dark controls were stored at -12°C and analysed simultaneously with exposed samples. The proportion of radioactivity identified as paraquat declined throughout the 85 weeks in samples; and at the end of the study it represented less than 89.5% and 86.6% of the total radioactivity found in the unmixed soil and the mixed soil respectively. Paraquat accounted for 95.0% of the total activity in the dark control sample after 85 weeks. TLC analysis of the 6M HCl extracts of both mixed and unmixed soils showed monoquat ion and MP ion. After 85 weeks of experiment, monoquat ion and MP ion were 1.4% and 1.3% respectively of the total radioactivity in the unmixed soil; and 2.4% and 1.2% respectively in the mixed soil. A third, uncharacterized compound accounted for 1.8% (unmixed soil) or 2.4% (mixed soil) of the total radioactivity after 85 weeks. Photodegradation on the soil surface is not therefore considered to be a major environmental degradation process for paraquat and no reliable estimates of the half-life of paraquat could be made (Day and Hemingway, 1981). Environmental fate in water/sediment systems Hydrolysis
Paraquat was dissolved in sterilized aqueous buffer solutions at pH 5, 7 and 9 to make a final concentration of approximately 91 mg/l and kept at 25 or 40°C in the absence of light. After 30 days, no significant decrease in concentration of paraquat was observed, indicating that under these conditions, paraquat was stable to hydrolysis (Upton et al., 1985).
Aqueous photolysis
Aqueous photolysis of paraquat was examined by maintaining ring-labelled paraquat in sterilized 0.01 M phosphate buffer solution (28 mg/l) at 25°C and exposing it to a Xenon lamp equivalent to Florida summer sunlight (latitude 25-35°N) for 36 days. Duplicate samples were removed at intervals, together with duplicate dark control samples and 0-time samples. All the samples were analysed by TLC and HPLC. After 36 days of irradiation, the irradiated solution showed that 94% to 95% of the recovered radioactivity was due to unchanged paraquat. No radioactive photodegradation products were detected in the solutions but 0.13% of the original radioactivity was recovered as 14CO2. It was therefore concluded that paraquat is relatively stable to photolysis in solution at pH 7 (Parker and Leahey, 1988).

paraquat 549
In other study designed to determine the possible route of degradation of paraquat, solutions of [14C]methyl- and [14C]pyridyl-labelled paraquat were exposed to unfiltered UV light from a medium-pressure mercury lamp. Degradation was rapid and no paraquat remained after a 3-day irradiation. Carbon dioxide, methylamine and MINA were identified; MINA was shown to be degraded to carbon dioxide and methylamine when it was further irradiated (Slade, 1965).
Degradation in water/sediment systems
Degradation was studied using [U-14C-dipyridyl]paraquat and two different water/sediment systems collected in Virginia Water (sandy loam) and Old Basing (loam) in England (Long et al., 1996). Both systems were set up in cylindrical polycarbonate vessels in the dark at 20±2°C. Following acclimatization of the test systems, [14C]paraquat in deionized water was applied to the water surface of each vessel at a rate equivalent to 1.1 kg/ha uniformly distributed in a 30 cm depth of water. Each test system was continuously aerated from above the air-water interface by drawing CO2-free, humidified air through the system. Duplicate incubation units were removed for analysis at intervals of 0, 0.25, 1, 2, 7, 14, 30, 54 and 100 days after test substance application. Sediment was separated from the aqueous phase and extracted by digesting it with sulfuric acid at 130-150°C.
Even immediately after treatment, paraquat was strongly adsorbed to the sediment in the both systems. The distribution of radioactivity expressed as a percentage of the applied radioactivity in the two systems after 100 days incubation iwas shown in Table 11.
Table 11. Distribution of radioactivity in sediment and water after treatment with [U-14C]pyridine-labelled paraquat (Long et al., 1996).
% of the applied radioactivity* Fraction
Virginia Water
Old Basing
Aqueous phase 0.2 0.1
Sediment, extracted 92.9 94.9
Sediment, unextracted 4.5 4.2
Volatile products <0.1 <0.1
Total recovery 97.5 99.2
Paraquat found in sediment extract and aqueous phase
92.1 94.3
* Average values of the duplicate units.

paraquat 550
Most of the radioactivity recovered from the aqueous phase and sediment extract was attributed to paraquat. No degradation products were detected. DT50 or DT90 could not be estimated as no significant degradation of paraquat was observed during the experiment.
Proposed degradation pathways in soil and water
When paraquat is applied to soil, it is strongly adsorbed and only gradually degraded. Some microorganisms, such as Lipomyces starkeyi, isolated from soils can degrade free paraquat completely. Unfiltered UV light also degrades paraquat to CO2 and methylamine through MINA. Degradation first involves demethylation or oxidation of one pyridine ring, which leads to bridge cleavage and then ring cleavage of the remaining ring. Cleavage of the second ring results in the formation of methylamine and CO2 by both microbial and photolytic routes. Hydrolysis was not considered to be a significant degradation process for paraquat.
The proposed degradation pathways of paraquat in soil and water are presented in Figure 5.
H3CN NCH3
H3CN N
H3CN NCH3
O
H3CN COOH
Paraquat
Monoquat
Paraquat monopyridone
4-Carboxy-1-methylpyridinium ion
microorganismslight
light light
microorganismslight
microorganismslight
light
CO2 + CH3NH2
CH3NH2 + CO2 + formate + oxalate + succinate
NH3 + CO2 + H2O Figure 5. Proposed degradation pathways of paraquat by light and isolated microorganisms under laboratory conditions
Residues in succeeding crops
The Meeting received information on the uptake of paraquat by rotational crops.
A study was conducted in the UK to determine the nature and amount of paraquat residue uptake in rotational crops planted 0, 30, 120 and 360 days after soil treatment with paraquat (Vickers et al., 1990). Seeds of wheat, lettuce and carrot were sown into individual pots containing a sandy loam soil 0, 30, 120 and 360 days after treating the soil in the pots with [2,2�,6,6�-14C]paraquat at an application rate equivalent to 1.05 kg/ha. Seeds were also sown in control pots. At treatment, sowing and harvesting, cores of soil were taken to determine the magnitude and nature of the residues in the
paraquat 551
soil. The pots were maintained in a glasshouse until the plants grew to maturity. Immature wheat and mature plants were harvested and the total radioactive residues were determined.
Over the course of the study, the total radioactive residues in the soil represented an average of 99.2% of that applied on the basis of combustion and liquid scintillation counting. TLC analysis of soil extracts accounted for 72.7-99.3% of the total radioactive residues as [14C]paraquat, whose identity was confirmed by HPLC, but no other radioactive compounds were detected in any soil samples.
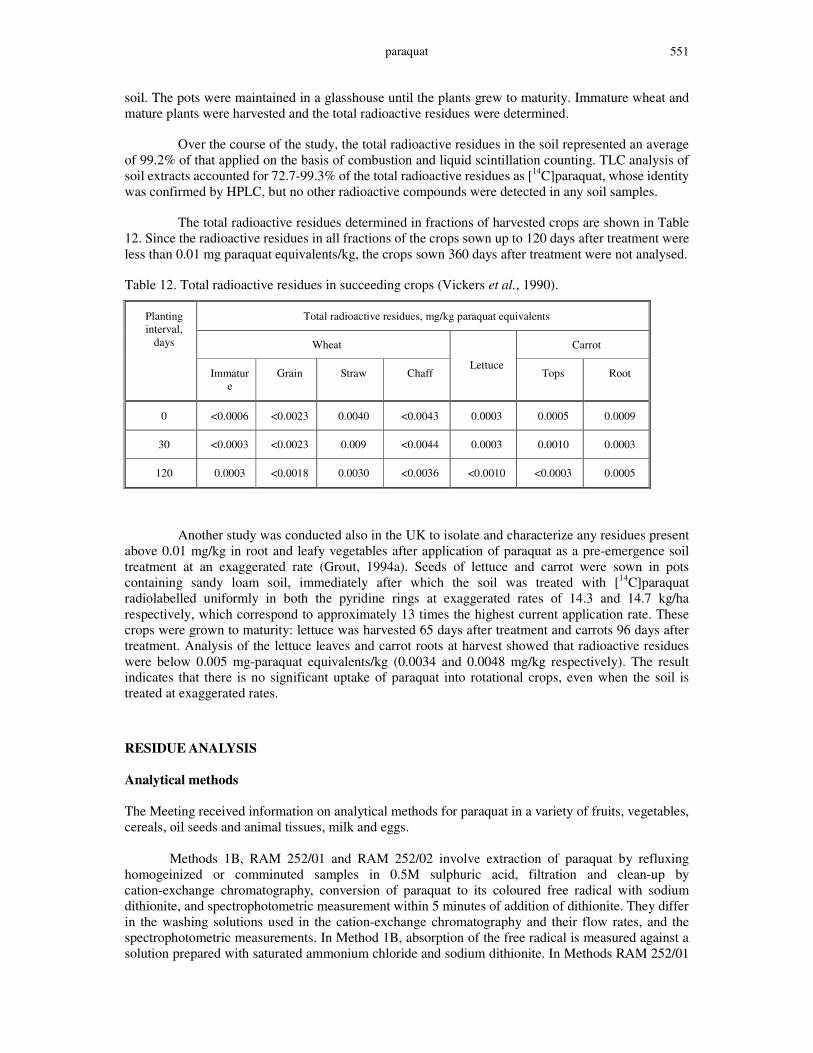
The total radioactive residues determined in fractions of harvested crops are shown in Table 12. Since the radioactive residues in all fractions of the crops sown up to 120 days after treatment were less than 0.01 mg paraquat equivalents/kg, the crops sown 360 days after treatment were not analysed.
Table 12. Total radioactive residues in succeeding crops (Vickers et al., 1990).
Total radioactive residues, mg/kg paraquat equivalents
Wheat Carrot
Planting interval,
days
Immature
Grain Straw Chaff Lettuce
Tops Root
0 <0.0006 <0.0023 0.0040 <0.0043 0.0003 0.0005 0.0009
30 <0.0003 <0.0023 0.009 <0.0044 0.0003 0.0010 0.0003
120 0.0003 <0.0018 0.0030 <0.0036 <0.0010 <0.0003 0.0005
Another study was conducted also in the UK to isolate and characterize any residues present above 0.01 mg/kg in root and leafy vegetables after application of paraquat as a pre-emergence soil treatment at an exaggerated rate (Grout, 1994a). Seeds of lettuce and carrot were sown in pots containing sandy loam soil, immediately after which the soil was treated with [14C]paraquat radiolabelled uniformly in both the pyridine rings at exaggerated rates of 14.3 and 14.7 kg/ha respectively, which correspond to approximately 13 times the highest current application rate. These crops were grown to maturity: lettuce was harvested 65 days after treatment and carrots 96 days after treatment. Analysis of the lettuce leaves and carrot roots at harvest showed that radioactive residues were below 0.005 mg-paraquat equivalents/kg (0.0034 and 0.0048 mg/kg respectively). The result indicates that there is no significant uptake of paraquat into rotational crops, even when the soil is treated at exaggerated rates.
RESIDUE ANALYSIS Analytical methods The Meeting received information on analytical methods for paraquat in a variety of fruits, vegetables, cereals, oil seeds and animal tissues, milk and eggs. Methods 1B, RAM 252/01 and RAM 252/02 involve extraction of paraquat by refluxing homogeinized or comminuted samples in 0.5M sulphuric acid, filtration and clean-up by cation-exchange chromatography, conversion of paraquat to its coloured free radical with sodium dithionite, and spectrophotometric measurement within 5 minutes of addition of dithionite. They differ in the washing solutions used in the cation-exchange chromatography and their flow rates, and the spectrophotometric measurements. In Method 1B, absorption of the free radical is measured against a solution prepared with saturated ammonium chloride and sodium dithionite. In Methods RAM 252/01
paraquat 552
and RAM 252/02, absorption is measured in second derivative mode against a paraquat standard. Second derivative spectrometry consists of calculating the first, second, or higher order derivatives of a spectrum with respect to wavelength or frequency and plotting this derivative rather than the spectrum itself. Usually the derivative is obtained by the spectrophotometer or associated electronics and plotted as the spectrum is scanned. A scanning spectrophotometer in the second derivative mode gives an enhanced response and increase selectivity, allowing the quantification of paraquat. Since paraquat has been registered for many years, many analytical methods have been used for measuring its residues in plant and animal samples. Because paraquat has proved to be very stable in plants and animals, all the submitted methods are for determining paraquat only. These methods involve acid extraction of paraquat (not liquid samples), filtration and clean-up by cation-exchange chromatography from which paraquat is eluted with saturated ammonium chloride. Five methods further involve conversion of paraquat to its coloured free radical form using 0.2% (w/v) sodium dithionite in 0.3 M NaOH and spectrophotometric measurement. Three other methods determine paraquat in the cleaned up sample solution by reverse phase ion pair HPLC with UV detection at 258 nm. Analytical methods for determining paraquat in plant and animal commodities for which MRLs may be set are presented below. The limits of quantification, recoveries and some other details of each method are summarized in Tables 11, 12 and 13. Samples of plant origin Kennedy (1986) developed a spectrophotometric method (Method 1B) for the determination of paraquat in vegetables, fruits, cereals and sugar cane juice. A diced, chopped or crushed plant sample (50–250 g) was refluxed in 0.5M sulphuric acid solution (total volume 500 ml in a 2 l capacity vessel) for 5 hours (one hour for sugar cane juice). The filtered digest was percolated through a column of cation-exchange resin (Duolite C225 (SRC 14), 52-100 mesh, sodium form, in a 25 ml burette) which retains paraquat and some of the natural crop constituents. The column was washed at a flow rate of 3-4 ml/min successively with deionized water (25 ml) 2.5% ammonium chloride solution (100 ml) and deionized water (25 ml). Paraquat was eluted with saturated ammonium chloride solution at a flow rate of about 1 ml/min and the first 50 ml of eluate was collected. A flow rate above 1.0 ml/min would adversely affect the recovery of paraquat. 10 ml of the eluate was treated with 2 ml of 0.2% sodium dithionite in 0.3M NaOH, which reduces paraquat to a free radical. The reaction mixture was inverted and rolled once or twice. Within 5 minutes of addition of sodium dithionite, the absorption in the range 360-430 nm was measured with a spectrophotometer against a solution prepared with saturated ammonium chloride and sodium dithionite, and a calibration curve relating the peak height at 396 nm to the concentration of paraquat in mg/l was drawn. The limit of quantification ranged between 0.01 and 0.05 mg/kg depending on crops and weight. The mean recovery was reported to be 60-95% but the fortification level was not reported although it was stated that the added amount should be similar to the amounts expected in the treated samples. Grout validated the method by analysing soya beans from soya plant treated at 8.2 kg ai/ha and potato tubers from a potato plant treated at 8.7 kg ai/ha, previously analysed in the metabolism study (Grout, 1994b; Grout, 1996) by Method 1B. The results from the two separate extraction methods, one in the soya/potato metabolism study (see above) and the other by Method 1B, gave equivalent residue levels: 0.705 and 0.840 mg/kg for the soya beans, and 0.079 and 0.072 mg/kg for the potato tuber, respectively. These results verify the extraction efficiency of Method 1B for these samples. Method RAM 252/01, a second derivative spectrophotometric method, for potatoes, peas, beans, rape seed oil and oil cake was described by Anderson (year not specified) and validated by Coombe (1994b) and by Reichert (1996). Samples were processed as in Method 1B until the spectrophotometric analysis, except that the cation-exchange column was washed successively by deionized water (25 ml), 2M HCl (100 ml), deionized water (25 ml), 2.5% ammonium chloride solution (100 ml) and then deionized water (25 ml) at a flow rate of 5-10 ml/min. Oil seeds must be pulverized before analysis. The concentrations of the radical are measured by second derivative spectrophotometry
paraquat 553
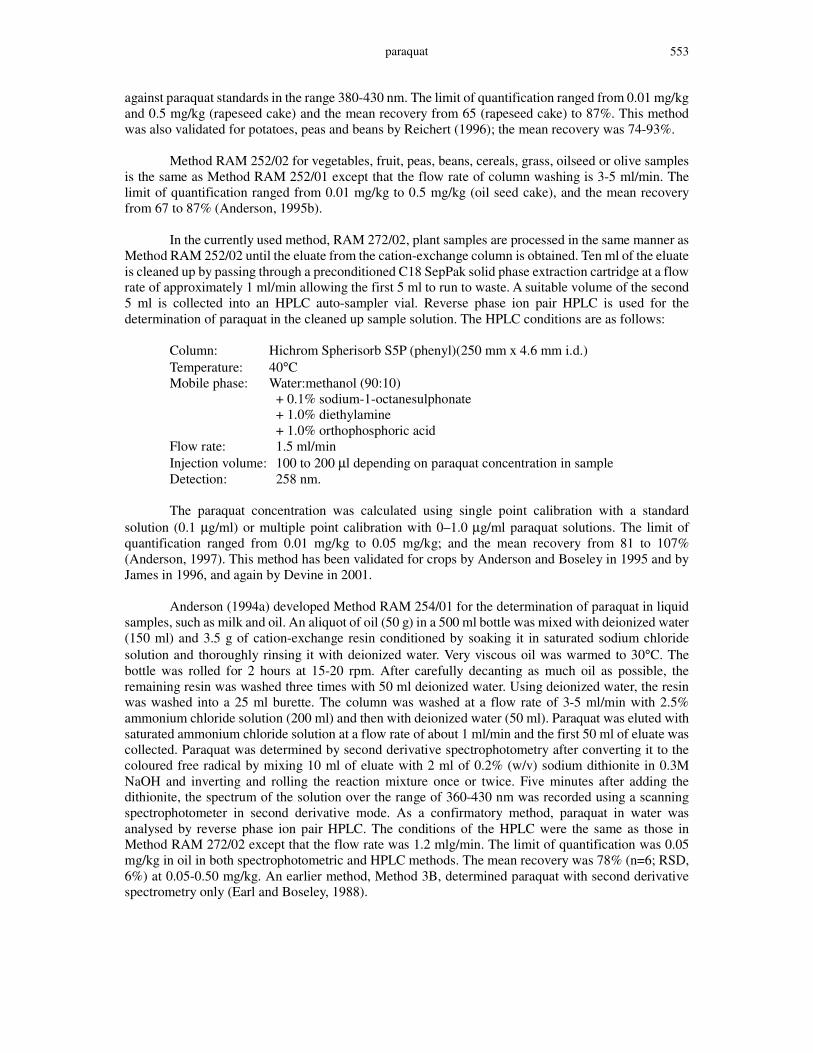
against paraquat standards in the range 380-430 nm. The limit of quantification ranged from 0.01 mg/kg and 0.5 mg/kg (rapeseed cake) and the mean recovery from 65 (rapeseed cake) to 87%. This method was also validated for potatoes, peas and beans by Reichert (1996); the mean recovery was 74-93%. Method RAM 252/02 for vegetables, fruit, peas, beans, cereals, grass, oilseed or olive samples is the same as Method RAM 252/01 except that the flow rate of column washing is 3-5 ml/min. The limit of quantification ranged from 0.01 mg/kg to 0.5 mg/kg (oil seed cake), and the mean recovery from 67 to 87% (Anderson, 1995b). In the currently used method, RAM 272/02, plant samples are processed in the same manner as Method RAM 252/02 until the eluate from the cation-exchange column is obtained. Ten ml of the eluate is cleaned up by passing through a preconditioned C18 SepPak solid phase extraction cartridge at a flow rate of approximately 1 ml/min allowing the first 5 ml to run to waste. A suitable volume of the second 5 ml is collected into an HPLC auto-sampler vial. Reverse phase ion pair HPLC is used for the determination of paraquat in the cleaned up sample solution. The HPLC conditions are as follows:
Column: Hichrom Spherisorb S5P (phenyl)(250 mm x 4.6 mm i.d.) Temperature: 40°C Mobile phase: Water:methanol (90:10) + 0.1% sodium-1-octanesulphonate + 1.0% diethylamine + 1.0% orthophosphoric acid Flow rate: 1.5 ml/min Injection volume: 100 to 200 µl depending on paraquat concentration in sample Detection: 258 nm.
The paraquat concentration was calculated using single point calibration with a standard solution (0.1 µg/ml) or multiple point calibration with 0–1.0 µg/ml paraquat solutions. The limit of quantification ranged from 0.01 mg/kg to 0.05 mg/kg; and the mean recovery from 81 to 107% (Anderson, 1997). This method has been validated for crops by Anderson and Boseley in 1995 and by James in 1996, and again by Devine in 2001. Anderson (1994a) developed Method RAM 254/01 for the determination of paraquat in liquid samples, such as milk and oil. An aliquot of oil (50 g) in a 500 ml bottle was mixed with deionized water (150 ml) and 3.5 g of cation-exchange resin conditioned by soaking it in saturated sodium chloride solution and thoroughly rinsing it with deionized water. Very viscous oil was warmed to 30°C. The bottle was rolled for 2 hours at 15-20 rpm. After carefully decanting as much oil as possible, the remaining resin was washed three times with 50 ml deionized water. Using deionized water, the resin was washed into a 25 ml burette. The column was washed at a flow rate of 3-5 ml/min with 2.5% ammonium chloride solution (200 ml) and then with deionized water (50 ml). Paraquat was eluted with saturated ammonium chloride solution at a flow rate of about 1 ml/min and the first 50 ml of eluate was collected. Paraquat was determined by second derivative spectrophotometry after converting it to the coloured free radical by mixing 10 ml of eluate with 2 ml of 0.2% (w/v) sodium dithionite in 0.3M NaOH and inverting and rolling the reaction mixture once or twice. Five minutes after adding the dithionite, the spectrum of the solution over the range of 360-430 nm was recorded using a scanning spectrophotometer in second derivative mode. As a confirmatory method, paraquat in water was analysed by reverse phase ion pair HPLC. The conditions of the HPLC were the same as those in Method RAM 272/02 except that the flow rate was 1.2 mlg/min. The limit of quantification was 0.05 mg/kg in oil in both spectrophotometric and HPLC methods. The mean recovery was 78% (n=6; RSD, 6%) at 0.05-0.50 mg/kg. An earlier method, Method 3B, determined paraquat with second derivative spectrometry only (Earl and Boseley, 1988).
paraquat 554
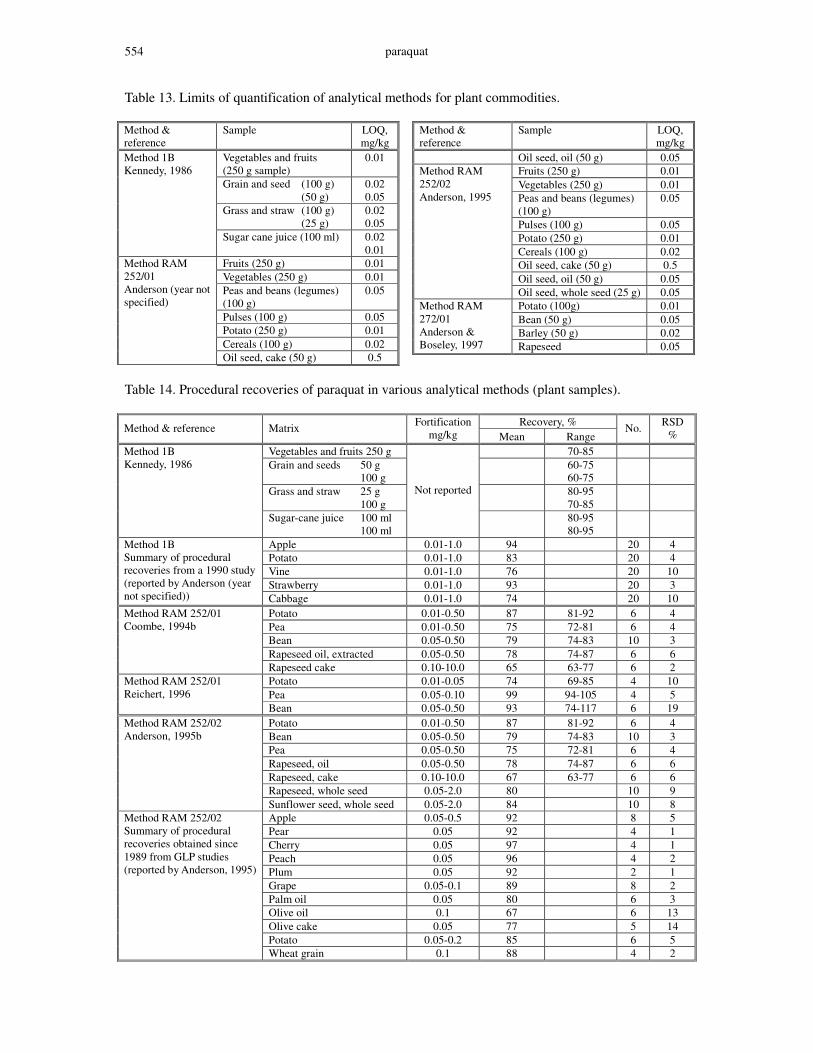
Table 13. Limits of quantification of analytical methods for plant commodities.
Method & reference
Sample LOQ, mg/kg
Vegetables and fruits (250 g sample)
0.01
Grain and seed (100 g) (50 g)
0.02 0.05
Grass and straw (100 g) (25 g)
0.02 0.05
Method 1B Kennedy, 1986
Sugar cane juice (100 ml) 0.02 0.01
Fruits (250 g) 0.01 Vegetables (250 g) 0.01 Peas and beans (legumes) (100 g)
0.05
Pulses (100 g) 0.05 Potato (250 g) 0.01 Cereals (100 g) 0.02
Method RAM 252/01 Anderson (year not specified)
Oil seed, cake (50 g) 0.5
Method & reference
Sample LOQ, mg/kg
Oil seed, oil (50 g) 0.05 Fruits (250 g) 0.01 Vegetables (250 g) 0.01 Peas and beans (legumes) (100 g)
0.05
Pulses (100 g) 0.05 Potato (250 g) 0.01 Cereals (100 g) 0.02 Oil seed, cake (50 g) 0.5 Oil seed, oil (50 g) 0.05
Method RAM 252/02 Anderson, 1995
Oil seed, whole seed (25 g) 0.05 Potato (100g) 0.01 Bean (50 g) 0.05 Barley (50 g) 0.02
Method RAM 272/01 Anderson & Boseley, 1997 Rapeseed 0.05
Table 14. Procedural recoveries of paraquat in various analytical methods (plant samples).
Recovery, % Method & reference Matrix Fortification mg/kg Mean Range
No. RSD %
Vegetables and fruits 250 g 70-85 Grain and seeds 50 g 100 g
60-75 60-75
Grass and straw 25 g 100 g
80-95 70-85
Method 1B Kennedy, 1986
Sugar-cane juice 100 ml 100 ml
Not reported
80-95 80-95
Apple 0.01-1.0 94 20 4 Potato 0.01-1.0 83 20 4 Vine 0.01-1.0 76 20 10 Strawberry 0.01-1.0 93 20 3
Method 1B Summary of procedural recoveries from a 1990 study (reported by Anderson (year not specified)) Cabbage 0.01-1.0 74 20 10
Potato 0.01-0.50 87 81-92 6 4 Pea 0.01-0.50 75 72-81 6 4 Bean 0.05-0.50 79 74-83 10 3 Rapeseed oil, extracted 0.05-0.50 78 74-87 6 6
Method RAM 252/01 Coombe, 1994b
Rapeseed cake 0.10-10.0 65 63-77 6 2 Potato 0.01-0.05 74 69-85 4 10 Pea 0.05-0.10 99 94-105 4 5
Method RAM 252/01 Reichert, 1996
Bean 0.05-0.50 93 74-117 6 19 Potato 0.01-0.50 87 81-92 6 4 Bean 0.05-0.50 79 74-83 10 3 Pea 0.05-0.50 75 72-81 6 4 Rapeseed, oil 0.05-0.50 78 74-87 6 6 Rapeseed, cake 0.10-10.0 67 63-77 6 6 Rapeseed, whole seed 0.05-2.0 80 10 9
Method RAM 252/02 Anderson, 1995b
Sunflower seed, whole seed 0.05-2.0 84 10 8 Apple 0.05-0.5 92 8 5 Pear 0.05 92 4 1 Cherry 0.05 97 4 1 Peach 0.05 96 4 2 Plum 0.05 92 2 1 Grape 0.05-0.1 89 8 2 Palm oil 0.05 80 6 3 Olive oil 0.1 67 6 13 Olive cake 0.05 77 5 14 Potato 0.05-0.2 85 6 5
Method RAM 252/02 Summary of procedural recoveries obtained since 1989 from GLP studies (reported by Anderson, 1995)
Wheat grain 0.1 88 4 2
paraquat 555
Recovery, % Method & reference Matrix Fortification mg/kg Mean Range
No. RSD %
Wheat straw 0.1-0.2 78 3 6 Rice grain 0.05-0.1 89 2 2 Rice straw 0.05 87 2 3 Maize cob 0.05-0.1 86 2 3 Maize silage 0.05-0.1 80 2 0 Cocoa bean 0.05-0.1 80 14 9 Coffee bean 0.05-0.5 61 4 8
Lucerne 5.0-30 99 6 4 Potato 0.01-0.05 87 78-94 10 7 Barley 0.02-1.0 81 74-93 10 8 Broad bean 0.05-0.50 95 82-93 10 10
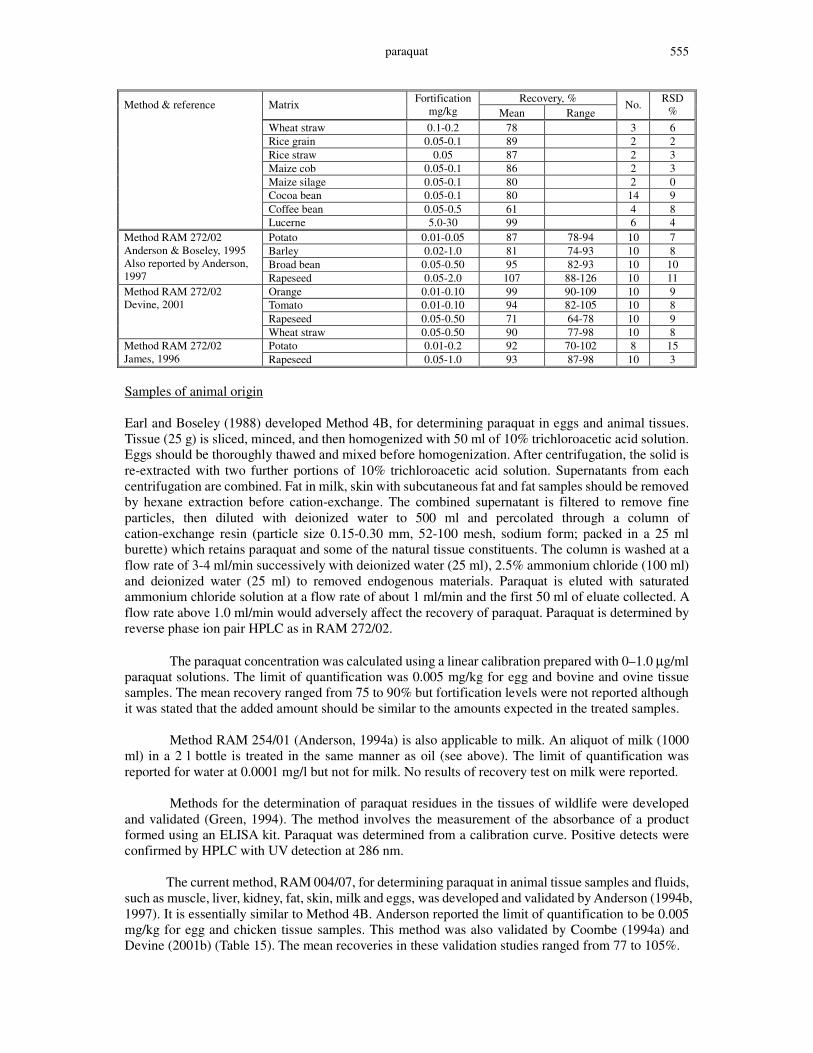
Method RAM 272/02 Anderson & Boseley, 1995 Also reported by Anderson, 1997 Rapeseed 0.05-2.0 107 88-126 10 11
Orange 0.01-0.10 99 90-109 10 9 Tomato 0.01-0.10 94 82-105 10 8 Rapeseed 0.05-0.50 71 64-78 10 9
Method RAM 272/02 Devine, 2001
Wheat straw 0.05-0.50 90 77-98 10 8 Potato 0.01-0.2 92 70-102 8 15 Method RAM 272/02
James, 1996 Rapeseed 0.05-1.0 93 87-98 10 3
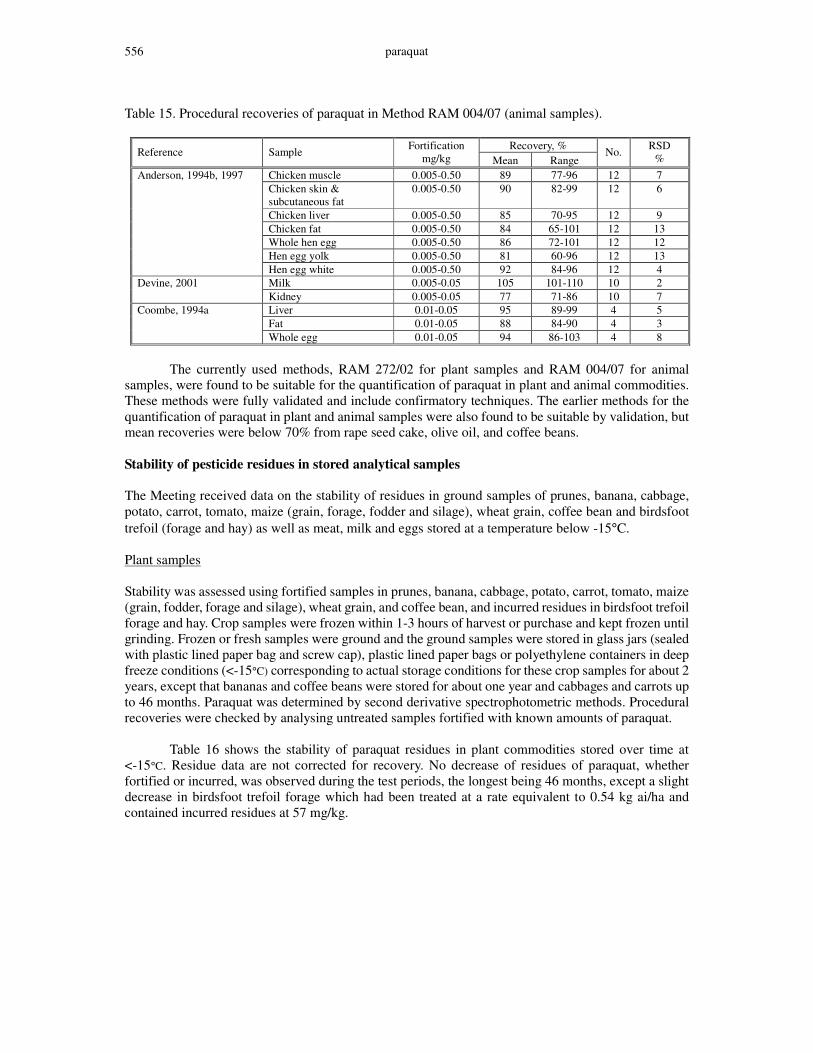
Samples of animal origin Earl and Boseley (1988) developed Method 4B, for determining paraquat in eggs and animal tissues. Tissue (25 g) is sliced, minced, and then homogenized with 50 ml of 10% trichloroacetic acid solution. Eggs should be thoroughly thawed and mixed before homogenization. After centrifugation, the solid is re-extracted with two further portions of 10% trichloroacetic acid solution. Supernatants from each centrifugation are combined. Fat in milk, skin with subcutaneous fat and fat samples should be removed by hexane extraction before cation-exchange. The combined supernatant is filtered to remove fine particles, then diluted with deionized water to 500 ml and percolated through a column of cation-exchange resin (particle size 0.15-0.30 mm, 52-100 mesh, sodium form; packed in a 25 ml burette) which retains paraquat and some of the natural tissue constituents. The column is washed at a flow rate of 3-4 ml/min successively with deionized water (25 ml), 2.5% ammonium chloride (100 ml) and deionized water (25 ml) to removed endogenous materials. Paraquat is eluted with saturated ammonium chloride solution at a flow rate of about 1 ml/min and the first 50 ml of eluate collected. A flow rate above 1.0 ml/min would adversely affect the recovery of paraquat. Paraquat is determined by reverse phase ion pair HPLC as in RAM 272/02. The paraquat concentration was calculated using a linear calibration prepared with 0–1.0 µg/ml paraquat solutions. The limit of quantification was 0.005 mg/kg for egg and bovine and ovine tissue samples. The mean recovery ranged from 75 to 90% but fortification levels were not reported although it was stated that the added amount should be similar to the amounts expected in the treated samples. Method RAM 254/01 (Anderson, 1994a) is also applicable to milk. An aliquot of milk (1000 ml) in a 2 l bottle is treated in the same manner as oil (see above). The limit of quantification was reported for water at 0.0001 mg/l but not for milk. No results of recovery test on milk were reported. Methods for the determination of paraquat residues in the tissues of wildlife were developed and validated (Green, 1994). The method involves the measurement of the absorbance of a product formed using an ELISA kit. Paraquat was determined from a calibration curve. Positive detects were confirmed by HPLC with UV detection at 286 nm. The current method, RAM 004/07, for determining paraquat in animal tissue samples and fluids, such as muscle, liver, kidney, fat, skin, milk and eggs, was developed and validated by Anderson (1994b, 1997). It is essentially similar to Method 4B. Anderson reported the limit of quantification to be 0.005 mg/kg for egg and chicken tissue samples. This method was also validated by Coombe (1994a) and Devine (2001b) (Table 15). The mean recoveries in these validation studies ranged from 77 to 105%.
paraquat 556
Table 15. Procedural recoveries of paraquat in Method RAM 004/07 (animal samples).
Recovery, % Reference Sample Fortification mg/kg Mean Range
No. RSD %
Chicken muscle 0.005-0.50 89 77-96 12 7 Chicken skin & subcutaneous fat
0.005-0.50 90 82-99 12 6
Chicken liver 0.005-0.50 85 70-95 12 9 Chicken fat 0.005-0.50 84 65-101 12 13 Whole hen egg 0.005-0.50 86 72-101 12 12 Hen egg yolk 0.005-0.50 81 60-96 12 13
Anderson, 1994b, 1997
Hen egg white 0.005-0.50 92 84-96 12 4 Milk 0.005-0.05 105 101-110 10 2 Devine, 2001 Kidney 0.005-0.05 77 71-86 10 7 Liver 0.01-0.05 95 89-99 4 5 Fat 0.01-0.05 88 84-90 4 3
Coombe, 1994a
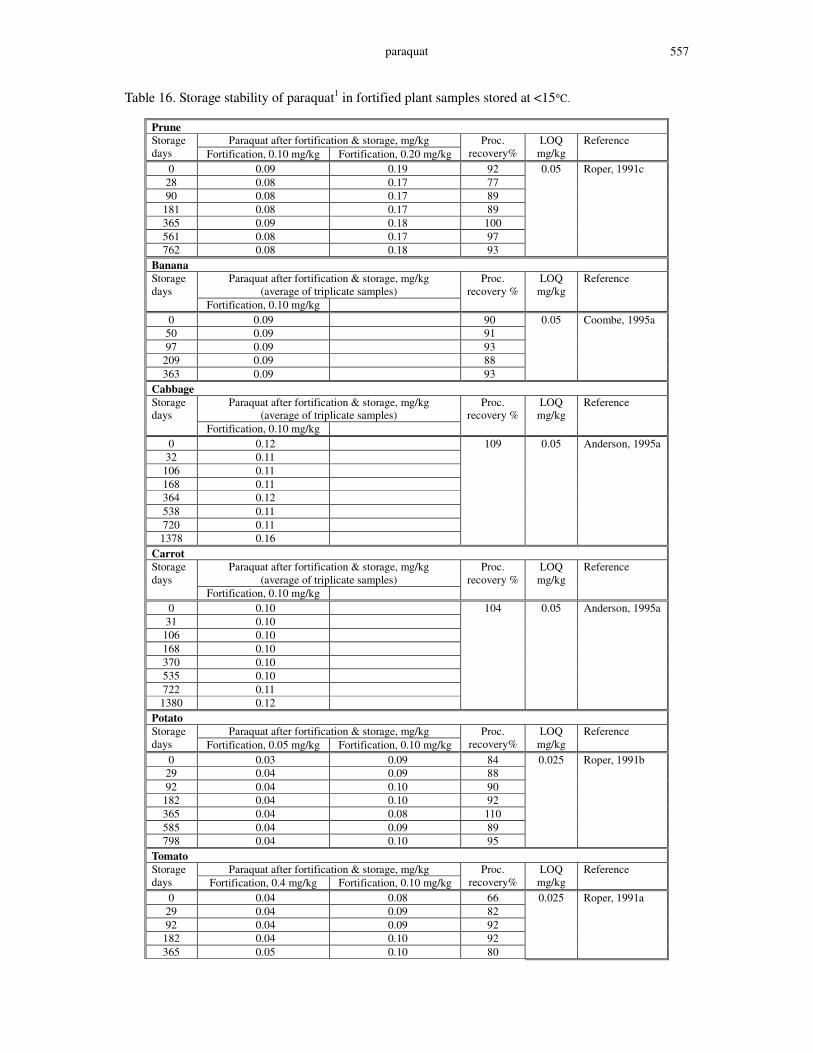
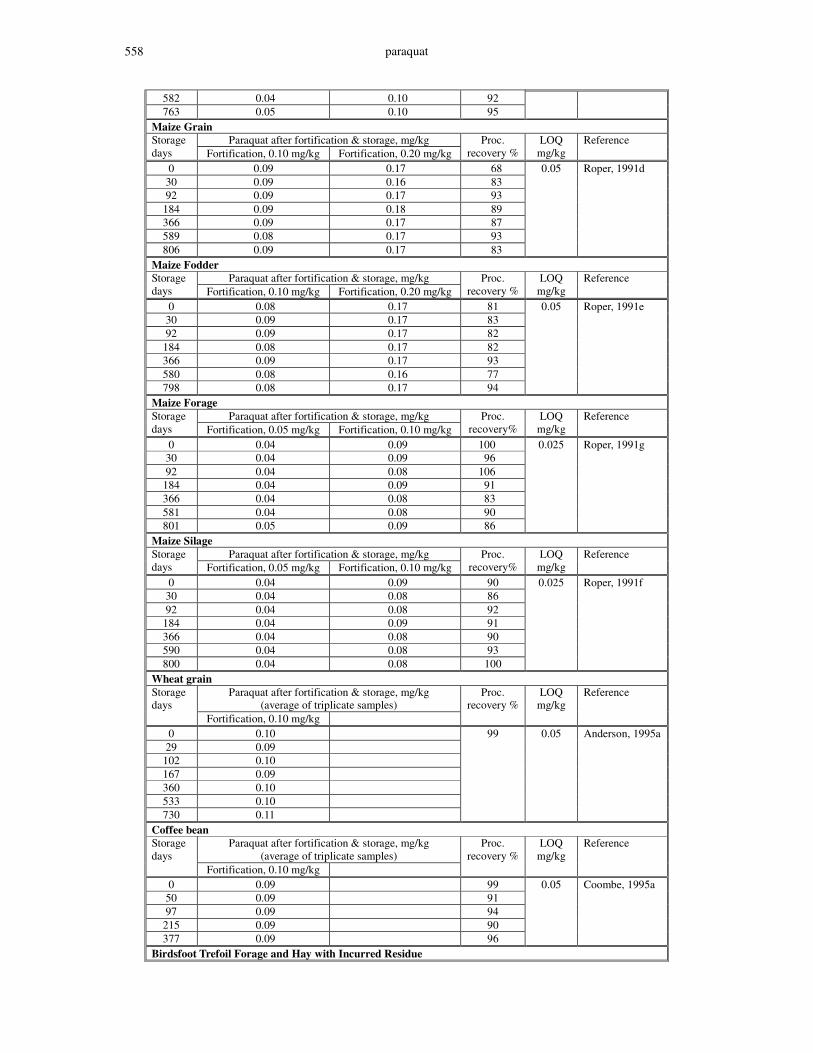
Whole egg 0.01-0.05 94 86-103 4 8 The currently used methods, RAM 272/02 for plant samples and RAM 004/07 for animal samples, were found to be suitable for the quantification of paraquat in plant and animal commodities. These methods were fully validated and include confirmatory techniques. The earlier methods for the quantification of paraquat in plant and animal samples were also found to be suitable by validation, but mean recoveries were below 70% from rape seed cake, olive oil, and coffee beans. Stability of pesticide residues in stored analytical samples The Meeting received data on the stability of residues in ground samples of prunes, banana, cabbage, potato, carrot, tomato, maize (grain, forage, fodder and silage), wheat grain, coffee bean and birdsfoot trefoil (forage and hay) as well as meat, milk and eggs stored at a temperature below -15°C. Plant samples Stability was assessed using fortified samples in prunes, banana, cabbage, potato, carrot, tomato, maize (grain, fodder, forage and silage), wheat grain, and coffee bean, and incurred residues in birdsfoot trefoil forage and hay. Crop samples were frozen within 1-3 hours of harvest or purchase and kept frozen until grinding. Frozen or fresh samples were ground and the ground samples were stored in glass jars (sealed with plastic lined paper bag and screw cap), plastic lined paper bags or polyethylene containers in deep freeze conditions (<-15°C) corresponding to actual storage conditions for these crop samples for about 2 years, except that bananas and coffee beans were stored for about one year and cabbages and carrots up to 46 months. Paraquat was determined by second derivative spectrophotometric methods. Procedural recoveries were checked by analysing untreated samples fortified with known amounts of paraquat. Table 16 shows the stability of paraquat residues in plant commodities stored over time at <-15°C. Residue data are not corrected for recovery. No decrease of residues of paraquat, whether fortified or incurred, was observed during the test periods, the longest being 46 months, except a slight decrease in birdsfoot trefoil forage which had been treated at a rate equivalent to 0.54 kg ai/ha and contained incurred residues at 57 mg/kg.
paraquat 557
Table 16. Storage stability of paraquat1 in fortified plant samples stored at <15°C.
Prune Paraquat after fortification & storage, mg/kg Storage
days Fortification, 0.10 mg/kg Fortification, 0.20 mg/kg Proc.
recovery% LOQ
mg/kg Reference
0 0.09 0.19 92 28 0.08 0.17 77 90 0.08 0.17 89
181 0.08 0.17 89 365 0.09 0.18 100 561 0.08 0.17 97 762 0.08 0.18 93
0.05 Roper, 1991c
Banana Paraquat after fortification & storage, mg/kg
(average of triplicate samples) Storage days
Fortification, 0.10 mg/kg
Proc. recovery %
LOQ mg/kg
Reference
0 0.09 90 50 0.09 91 97 0.09 93
209 0.09 88 363 0.09 93
0.05 Coombe, 1995a
Cabbage Paraquat after fortification & storage, mg/kg
(average of triplicate samples) Storage days
Fortification, 0.10 mg/kg
Proc. recovery %
LOQ mg/kg
Reference
0 0.12 32 0.11
106 0.11 168 0.11 364 0.12 538 0.11 720 0.11 1378 0.16
109 0.05 Anderson, 1995a
Carrot Paraquat after fortification & storage, mg/kg
(average of triplicate samples) Storage days
Fortification, 0.10 mg/kg
Proc. recovery %
LOQ mg/kg
Reference
0 0.10 31 0.10
106 0.10 168 0.10 370 0.10 535 0.10 722 0.11 1380 0.12
104 0.05 Anderson, 1995a
Potato Paraquat after fortification & storage, mg/kg Storage
days Fortification, 0.05 mg/kg Fortification, 0.10 mg/kg Proc.
recovery% LOQ
mg/kg Reference
0 0.03 0.09 84 29 0.04 0.09 88 92 0.04 0.10 90
182 0.04 0.10 92 365 0.04 0.08 110 585 0.04 0.09 89 798 0.04 0.10 95
0.025 Roper, 1991b
Tomato Paraquat after fortification & storage, mg/kg Storage
days Fortification, 0.4 mg/kg Fortification, 0.10 mg/kg Proc.
recovery% LOQ
mg/kg Reference
0 0.04 0.08 66 29 0.04 0.09 82 92 0.04 0.09 92
182 0.04 0.10 92 365 0.05 0.10 80
0.025 Roper, 1991a
paraquat 558
582 0.04 0.10 92 763 0.05 0.10 95
Maize Grain Paraquat after fortification & storage, mg/kg Storage
days Fortification, 0.10 mg/kg Fortification, 0.20 mg/kg Proc.
recovery % LOQ
mg/kg Reference
0 0.09 0.17 68 30 0.09 0.16 83 92 0.09 0.17 93
184 0.09 0.18 89 366 0.09 0.17 87 589 0.08 0.17 93 806 0.09 0.17 83
0.05 Roper, 1991d
Maize Fodder Paraquat after fortification & storage, mg/kg Storage
days Fortification, 0.10 mg/kg Fortification, 0.20 mg/kg Proc.
recovery % LOQ
mg/kg Reference
0 0.08 0.17 81 30 0.09 0.17 83 92 0.09 0.17 82
184 0.08 0.17 82 366 0.09 0.17 93 580 0.08 0.16 77 798 0.08 0.17 94
0.05 Roper, 1991e
Maize Forage Paraquat after fortification & storage, mg/kg Storage
days Fortification, 0.05 mg/kg Fortification, 0.10 mg/kg Proc.
recovery% LOQ
mg/kg Reference
0 0.04 0.09 100 30 0.04 0.09 96 92 0.04 0.08 106
184 0.04 0.09 91 366 0.04 0.08 83 581 0.04 0.08 90 801 0.05 0.09 86
0.025 Roper, 1991g
Maize Silage Paraquat after fortification & storage, mg/kg Storage
days Fortification, 0.05 mg/kg Fortification, 0.10 mg/kg Proc.
recovery% LOQ
mg/kg Reference
0 0.04 0.09 90 30 0.04 0.08 86 92 0.04 0.08 92
184 0.04 0.09 91 366 0.04 0.08 90 590 0.04 0.08 93 800 0.04 0.08 100
0.025 Roper, 1991f
Wheat grain Paraquat after fortification & storage, mg/kg
(average of triplicate samples) Storage days
Fortification, 0.10 mg/kg
Proc. recovery %
LOQ mg/kg
Reference
0 0.10 29 0.09
102 0.10 167 0.09 360 0.10 533 0.10 730 0.11
99 0.05 Anderson, 1995a
Coffee bean Paraquat after fortification & storage, mg/kg
(average of triplicate samples) Storage days
Fortification, 0.10 mg/kg
Proc. recovery %
LOQ mg/kg
Reference
0 0.09 99 50 0.09 91 97 0.09 94
215 0.09 90 377 0.09 96
0.05 Coombe, 1995a
Birdsfoot Trefoil Forage and Hay with Incurred Residue

paraquat 559
Paraquat in treated crop sample after storage, mg/kg Storage weeks Incurred, 57 mg/kg
(Forage) Incurred, 200 mg/kg
(Hay)
Proc. recovery%
LOQ mg/kg
Reference
0 57 200 104 12 55 178 89 25 52 167 86 57 48 207 91
104 41 234 84
5 Roper, 1991h
1 Residues in Birdsfoor Trefoil forageand hay were incurred Animal samples
The storage stability of paraquat was examined in meat, milk, and eggs. Samples of chicken muscle after mincing, and eggs after thorough mixing were fortified with paraquat at 0.10 mg/kg and stored at <-18°C for up to 863 days (28 months). Milk was fortified at 0.1 mg/l and stored for 391 days. These conditions represent actual storage conditions of animal commodities subject to residue analysis. At predetermined intervals, triplicate samples were taken out for analysis. Hen muscle and egg samples were analysed by Method 4B and milk samples by a second derivative spectrophotometric method. The limit of quantification was 0.005 mg/kg.
Table 17 shows the results. Residue data are not corrected for recovery. No decrease of residues of paraquat was observed under storage for up to 28 months. These test matrices represent a diverse selection of animal tissues and demonstrate the stability of paraquat under various fortified animal sample storage conditions. However, the chicken egg and milk samples showed relatively low procedural recoveries. Table 17. Storage stability of paraquat in animal samples fortified with paraquat and stored at <-18°C.
Chicken muscle
fortified at 0.10 mg/kg Chicken eggs
fortified at 0.10 mg/kg Milk
fortified at 0.01 mg/l Storage Days
Paraquat, mg/kg1 Proc. recovery, %
Paraquat, mg/kg1 Proc. recovery, %
Paraquat, mg/l1 Proc. recovery, %
0 0.08 83 0.08 75 0.010 80 31 0.10 83 0.07 75 42 0.007 76 89 0.008 75 91 0.08 75 92 0.08 83
161 0.07 83 178 0.07 75 202 0.007 75 276 0.09 83 391 0.007 73 405 0.09 83 426 0.08 75 560 0.09 83 581 0.08 75 843 0.08 83 863 0.09 75
- Ref: Anderson et al., 1991a Ref: Anderson et al., 1991b Ref : Coombe, 1995b
1 Not adjusted for procedural recovery. USE PATTERN
Paraquat, normally available as the dichloride or bis(methyl sulfate) salt, is registered in many countries to control weeds and permitted for use on a wide range of crops, including orchard and plantation uses,
paraquat 560
row crops and pasture, pre-plant, pre-emergence or post-emergence. The main uses of paraquat in food crops in many countries are as a non-selective herbicide. It is also registered for use as a pre-harvest desiccant (or harvest aid).
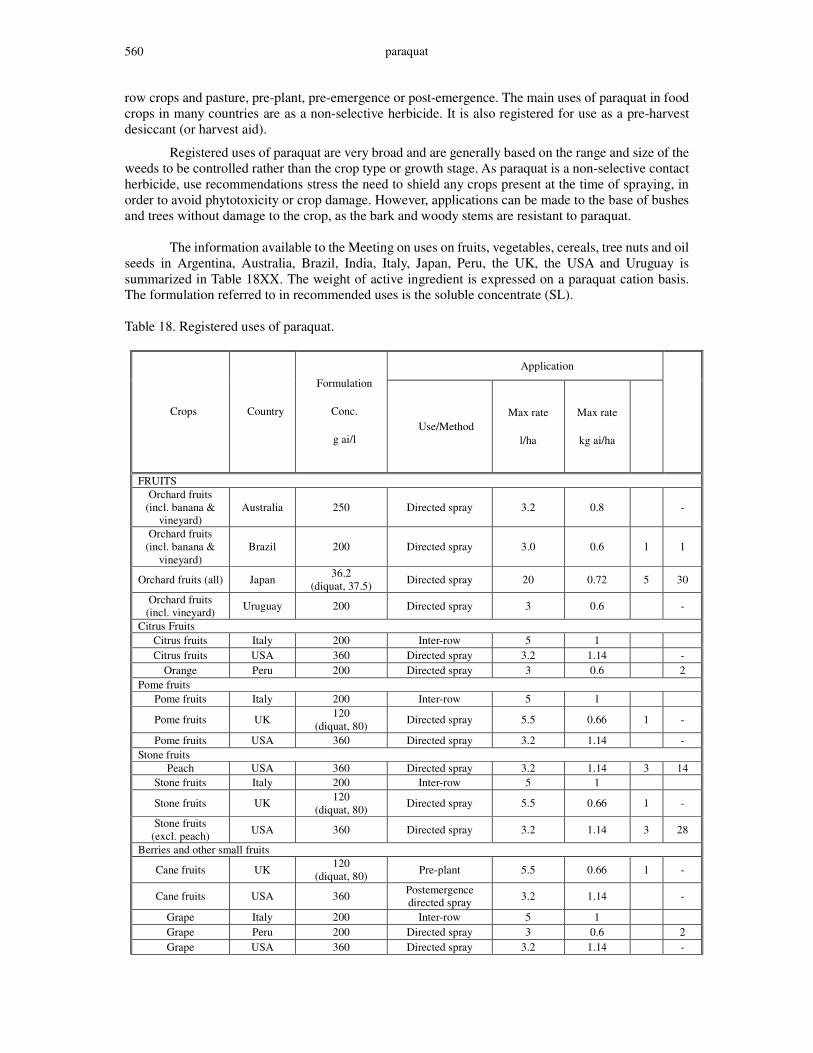
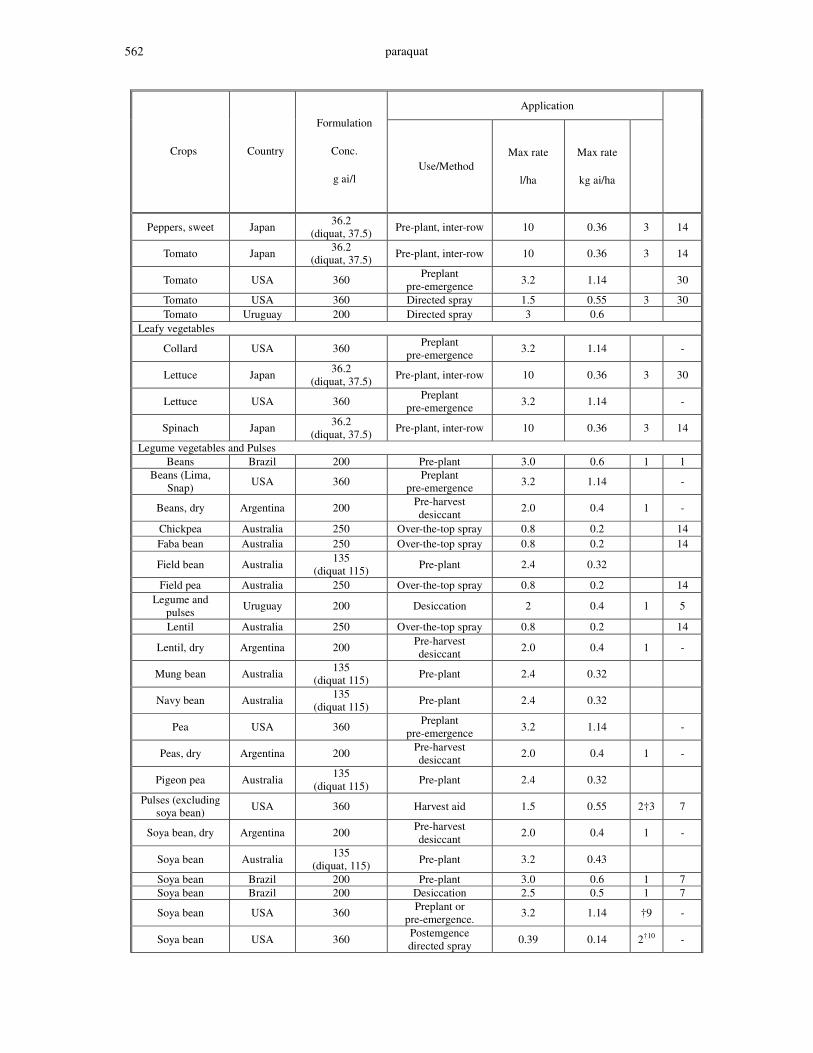
Registered uses of paraquat are very broad and are generally based on the range and size of the weeds to be controlled rather than the crop type or growth stage. As paraquat is a non-selective contact herbicide, use recommendations stress the need to shield any crops present at the time of spraying, in order to avoid phytotoxicity or crop damage. However, applications can be made to the base of bushes and trees without damage to the crop, as the bark and woody stems are resistant to paraquat. The information available to the Meeting on uses on fruits, vegetables, cereals, tree nuts and oil seeds in Argentina, Australia, Brazil, India, Italy, Japan, Peru, the UK, the USA and Uruguay is summarized in Table 18XX. The weight of active ingredient is expressed on a paraquat cation basis. The formulation referred to in recommended uses is the soluble concentrate (SL). Table 18. Registered uses of paraquat.
Application
Crops Country
Formulation
Conc.
g ai/l Use/Method
Max rate
l/ha
Max rate
kg ai/ha
FRUITS Orchard fruits
(incl. banana & vineyard)
Australia 250 Directed spray 3.2 0.8 -
Orchard fruits (incl. banana &
vineyard) Brazil 200 Directed spray 3.0 0.6 1 1
Orchard fruits (all) Japan 36.2 (diquat, 37.5) Directed spray 20 0.72 5 30
Orchard fruits (incl. vineyard) Uruguay 200 Directed spray 3 0.6 -
Citrus Fruits Citrus fruits Italy 200 Inter-row 5 1 Citrus fruits USA 360 Directed spray 3.2 1.14 -
Orange Peru 200 Directed spray 3 0.6 2 Pome fruits
Pome fruits Italy 200 Inter-row 5 1
Pome fruits UK 120 (diquat, 80) Directed spray 5.5 0.66 1 -
Pome fruits USA 360 Directed spray 3.2 1.14 - Stone fruits
Peach USA 360 Directed spray 3.2 1.14 3 14 Stone fruits Italy 200 Inter-row 5 1
Stone fruits UK 120 (diquat, 80) Directed spray 5.5 0.66 1 -
Stone fruits (excl. peach) USA 360 Directed spray 3.2 1.14 3 28
Berries and other small fruits
Cane fruits UK 120 (diquat, 80) Pre-plant 5.5 0.66 1 -
Cane fruits USA 360 Postemergence directed spray 3.2 1.14 -
Grape Italy 200 Inter-row 5 1 Grape Peru 200 Directed spray 3 0.6 2 Grape USA 360 Directed spray 3.2 1.14 -

paraquat 561
Application
Crops Country
Formulation
Conc.
g ai/l Use/Method
Max rate
l/ha
Max rate
kg ai/ha
Strawberry Japan 36.2 (diquat, 37.5) Pre-plant 10 0.36 1
Strawberry UK 120 (diquat, 80) Directed spray 5.5 0.66 1 -
Strawberry USA 360 Postemergence directed spray 1.5 0.55 3 21
Other fruits Olive Brazil 200 Directed spray 3.0 0.6 1 7
Olive Italy 200 Inter-row, harvesting aid 5 1 40
Olive USA 360 Directed spray 3.2 1.14 4 13 Banana Peru 200 Directed spray 3 0.6 2 Banana USA 360 Directed spray 3.2 1.14 - Guava USA 360 Directed spray 2.9 1.05 - Kiwi USA 360 Directed spray 3.2 1.14 3 14
Passion fruit USA 360 Directed spray 2.9 1.05 - VEGETABLES
Vegetables (except potato,
legumes & pulses) Australia 250 Directed spray 2.4 0.6 -
Bulb vegetables
Garlic USA 360 Preplant/ pre-emergence 3.2 1.14 1 60†5
Onion USA 360 Preplant/ pre-emergence 3.2 1.14 1 60†5
Onion, bulb Japan 36.2 (diquat, 37.5) Pre-plant, inter-row 10 0.36 3 30
Welsh onion Japan 36.2 (diquat, 37.5) Pre-plant, inter-row 10 0.36 3 30
Brassica vegetables Brassica
vegetables USA 360 Preplant pre-emergence 3.2 1.14 -
Broccoli Japan 36.2 (diquat, 37.5) Pre-plant, inter-row 10 0.36 3 30
Cabbage Brazil 200 Pre-plant 3.0 0.6 1 1
Cabbage Japan 36.2 (diquat, 37.5) Pre-plant, inter-row 10 0.36 3 30
Cauliflower Japan 36.2 (diquat, 37.5) Pre-plant, inter-row 10 0.36 3 30
Chinese cabbage Japan 36.2 (diquat, 37.5) Pre-plant, inter-row 10 0.36 3 30
Fruiting vegetables Fruiting
vegetables (excl. tomato and
peppers)
USA 360 Preplant pre-emergence 3.2 1.14 -
Cucumber Japan 36.2 (diquat, 37.5) Pre-plant, inter-row 10 0.36 3 14
Melon Japan 36.2 (diquat, 37.5) Pre-plant 10 0.36 1
(3)
Pumpkin Japan 36.2 (diquat, 37.5) Pre-plant, inter-row 10 0.36 3 14
Watermelon Japan 36.2 (diquat, 37.5) Pre-plant, inter-row 10 0.36 1
(3) -
Peppers USA 360 Directed spray 1.5 0.55 3 -
paraquat 562
Application
Crops Country
Formulation
Conc.
g ai/l Use/Method
Max rate
l/ha
Max rate
kg ai/ha
Peppers, sweet Japan 36.2 (diquat, 37.5) Pre-plant, inter-row 10 0.36 3 14
Tomato Japan 36.2 (diquat, 37.5) Pre-plant, inter-row 10 0.36 3 14
Tomato USA 360 Preplant pre-emergence 3.2 1.14 30
Tomato USA 360 Directed spray 1.5 0.55 3 30 Tomato Uruguay 200 Directed spray 3 0.6
Leafy vegetables
Collard USA 360 Preplant pre-emergence 3.2 1.14 -
Lettuce Japan 36.2 (diquat, 37.5) Pre-plant, inter-row 10 0.36 3 30
Lettuce USA 360 Preplant pre-emergence 3.2 1.14 -
Spinach Japan 36.2 (diquat, 37.5) Pre-plant, inter-row 10 0.36 3 14
Legume vegetables and Pulses Beans Brazil 200 Pre-plant 3.0 0.6 1 1
Beans (Lima, Snap) USA 360 Preplant
pre-emergence 3.2 1.14 -
Beans, dry Argentina 200 Pre-harvest desiccant 2.0 0.4 1 -
Chickpea Australia 250 Over-the-top spray 0.8 0.2 14 Faba bean Australia 250 Over-the-top spray 0.8 0.2 14
Field bean Australia 135 (diquat 115) Pre-plant 2.4 0.32
Field pea Australia 250 Over-the-top spray 0.8 0.2 14 Legume and
pulses Uruguay 200 Desiccation 2 0.4 1 5
Lentil Australia 250 Over-the-top spray 0.8 0.2 14
Lentil, dry Argentina 200 Pre-harvest desiccant 2.0 0.4 1 -
Mung bean Australia 135 (diquat 115) Pre-plant 2.4 0.32
Navy bean Australia 135 (diquat 115) Pre-plant 2.4 0.32
Pea USA 360 Preplant pre-emergence 3.2 1.14 -
Peas, dry Argentina 200 Pre-harvest desiccant 2.0 0.4 1 -
Pigeon pea Australia 135 (diquat 115) Pre-plant 2.4 0.32
Pulses (excluding soya bean) USA 360 Harvest aid 1.5 0.55 2†3 7
Soya bean, dry Argentina 200 Pre-harvest desiccant 2.0 0.4 1 -
Soya bean Australia 135 (diquat, 115) Pre-plant 3.2 0.43
Soya bean Brazil 200 Pre-plant 3.0 0.6 1 7 Soya bean Brazil 200 Desiccation 2.5 0.5 1 7
Soya bean USA 360 Preplant or pre-emergence. 3.2 1.14 †9 -
Soya bean USA 360 Postemgence directed spray 0.39 0.14 2†10 -
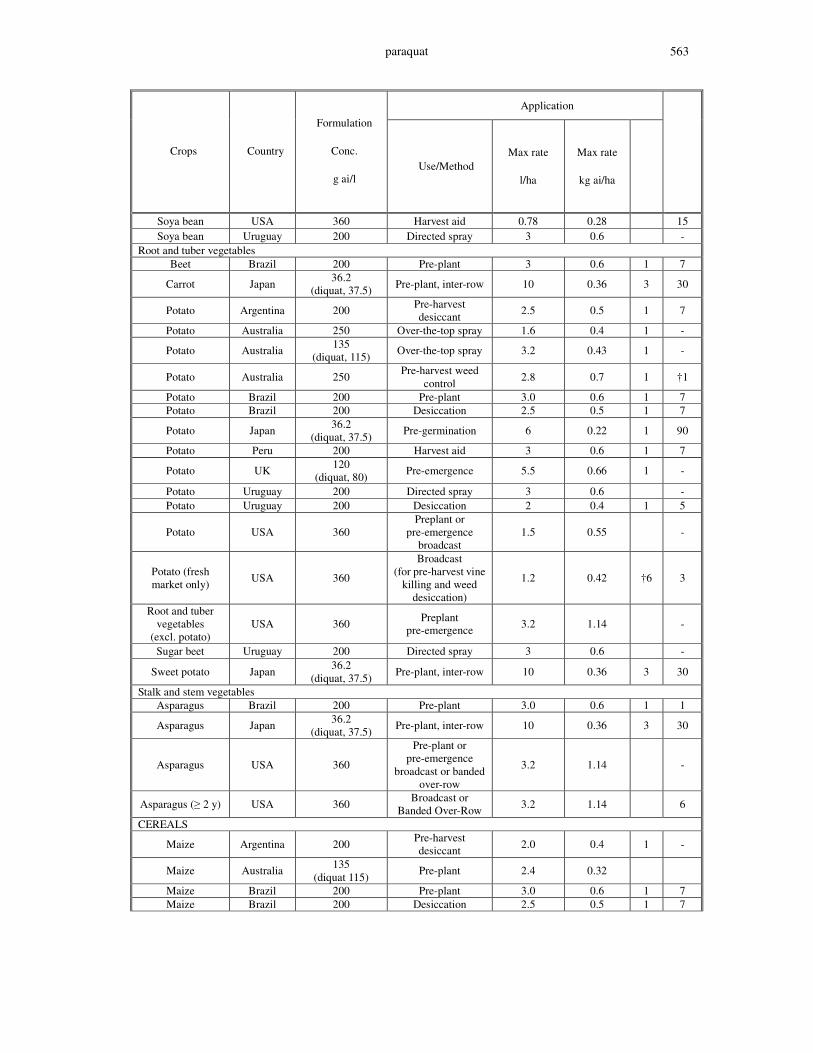
paraquat 563
Application
Crops Country
Formulation
Conc.
g ai/l Use/Method
Max rate
l/ha
Max rate
kg ai/ha
Soya bean USA 360 Harvest aid 0.78 0.28 15 Soya bean Uruguay 200 Directed spray 3 0.6 -
Root and tuber vegetables Beet Brazil 200 Pre-plant 3 0.6 1 7
Carrot Japan 36.2 (diquat, 37.5) Pre-plant, inter-row 10 0.36 3 30
Potato Argentina 200 Pre-harvest desiccant 2.5 0.5 1 7
Potato Australia 250 Over-the-top spray 1.6 0.4 1 -
Potato Australia 135 (diquat, 115) Over-the-top spray 3.2 0.43 1 -
Potato Australia 250 Pre-harvest weed control 2.8 0.7 1 †1
Potato Brazil 200 Pre-plant 3.0 0.6 1 7 Potato Brazil 200 Desiccation 2.5 0.5 1 7
Potato Japan 36.2 (diquat, 37.5) Pre-germination 6 0.22 1 90
Potato Peru 200 Harvest aid 3 0.6 1 7
Potato UK 120 (diquat, 80) Pre-emergence 5.5 0.66 1 -
Potato Uruguay 200 Directed spray 3 0.6 - Potato Uruguay 200 Desiccation 2 0.4 1 5
Potato USA 360 Preplant or
pre-emergence broadcast
1.5 0.55 -
Potato (fresh market only) USA 360
Broadcast (for pre-harvest vine
killing and weed desiccation)
1.2 0.42 †6 3
Root and tuber vegetables
(excl. potato) USA 360 Preplant
pre-emergence 3.2 1.14 -
Sugar beet Uruguay 200 Directed spray 3 0.6 -
Sweet potato Japan 36.2 (diquat, 37.5) Pre-plant, inter-row 10 0.36 3 30
Stalk and stem vegetables Asparagus Brazil 200 Pre-plant 3.0 0.6 1 1
Asparagus Japan 36.2 (diquat, 37.5) Pre-plant, inter-row 10 0.36 3 30
Asparagus USA 360
Pre-plant or pre-emergence
broadcast or banded over-row
3.2 1.14 -
Asparagus (� 2 y) USA 360 Broadcast or Banded Over-Row 3.2 1.14 6
CEREALS
Maize Argentina 200 Pre-harvest desiccant 2.0 0.4 1 -
Maize Australia 135 (diquat 115) Pre-plant 2.4 0.32
Maize Brazil 200 Pre-plant 3.0 0.6 1 7 Maize Brazil 200 Desiccation 2.5 0.5 1 7
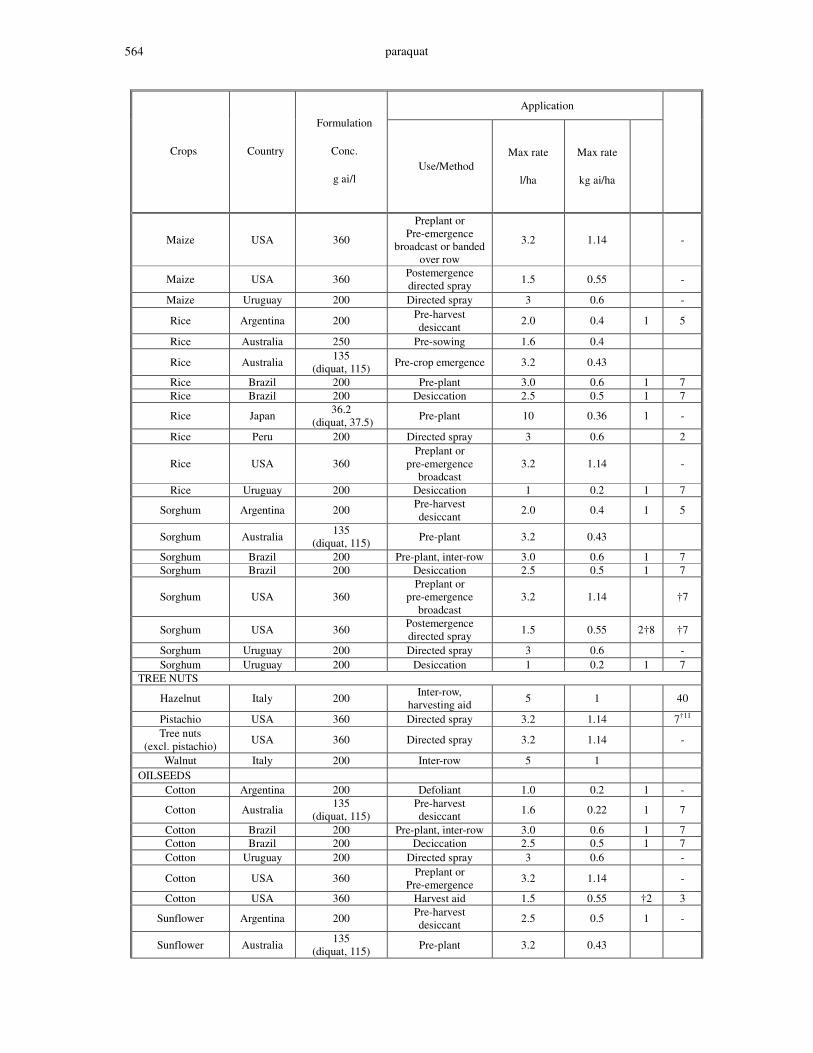
paraquat 564
Application
Crops Country
Formulation
Conc.
g ai/l Use/Method
Max rate
l/ha
Max rate
kg ai/ha
Maize USA 360
Preplant or Pre-emergence
broadcast or banded over row
3.2 1.14 -
Maize USA 360 Postemergence directed spray 1.5 0.55 -
Maize Uruguay 200 Directed spray 3 0.6 -
Rice Argentina 200 Pre-harvest desiccant 2.0 0.4 1 5
Rice Australia 250 Pre-sowing 1.6 0.4
Rice Australia 135 (diquat, 115) Pre-crop emergence 3.2 0.43
Rice Brazil 200 Pre-plant 3.0 0.6 1 7 Rice Brazil 200 Desiccation 2.5 0.5 1 7
Rice Japan 36.2 (diquat, 37.5) Pre-plant 10 0.36 1 -
Rice Peru 200 Directed spray 3 0.6 2
Rice USA 360 Preplant or
pre-emergence broadcast
3.2 1.14 -
Rice Uruguay 200 Desiccation 1 0.2 1 7
Sorghum Argentina 200 Pre-harvest desiccant 2.0 0.4 1 5
Sorghum Australia 135 (diquat, 115) Pre-plant 3.2 0.43
Sorghum Brazil 200 Pre-plant, inter-row 3.0 0.6 1 7 Sorghum Brazil 200 Desiccation 2.5 0.5 1 7
Sorghum USA 360 Preplant or
pre-emergence broadcast
3.2 1.14 †7
Sorghum USA 360 Postemergence directed spray 1.5 0.55 2†8 †7
Sorghum Uruguay 200 Directed spray 3 0.6 - Sorghum Uruguay 200 Desiccation 1 0.2 1 7
TREE NUTS
Hazelnut Italy 200 Inter-row, harvesting aid 5 1 40
Pistachio USA 360 Directed spray 3.2 1.14 7†11 Tree nuts
(excl. pistachio) USA 360 Directed spray 3.2 1.14 -
Walnut Italy 200 Inter-row 5 1 OILSEEDS
Cotton Argentina 200 Defoliant 1.0 0.2 1 -
Cotton Australia 135 (diquat, 115)
Pre-harvest desiccant 1.6 0.22 1 7
Cotton Brazil 200 Pre-plant, inter-row 3.0 0.6 1 7 Cotton Brazil 200 Deciccation 2.5 0.5 1 7 Cotton Uruguay 200 Directed spray 3 0.6 -
Cotton USA 360 Preplant or Pre-emergence 3.2 1.14 -
Cotton USA 360 Harvest aid 1.5 0.55 †2 3
Sunflower Argentina 200 Pre-harvest desiccant 2.5 0.5 1 -
Sunflower Australia 135 (diquat, 115) Pre-plant 3.2 0.43
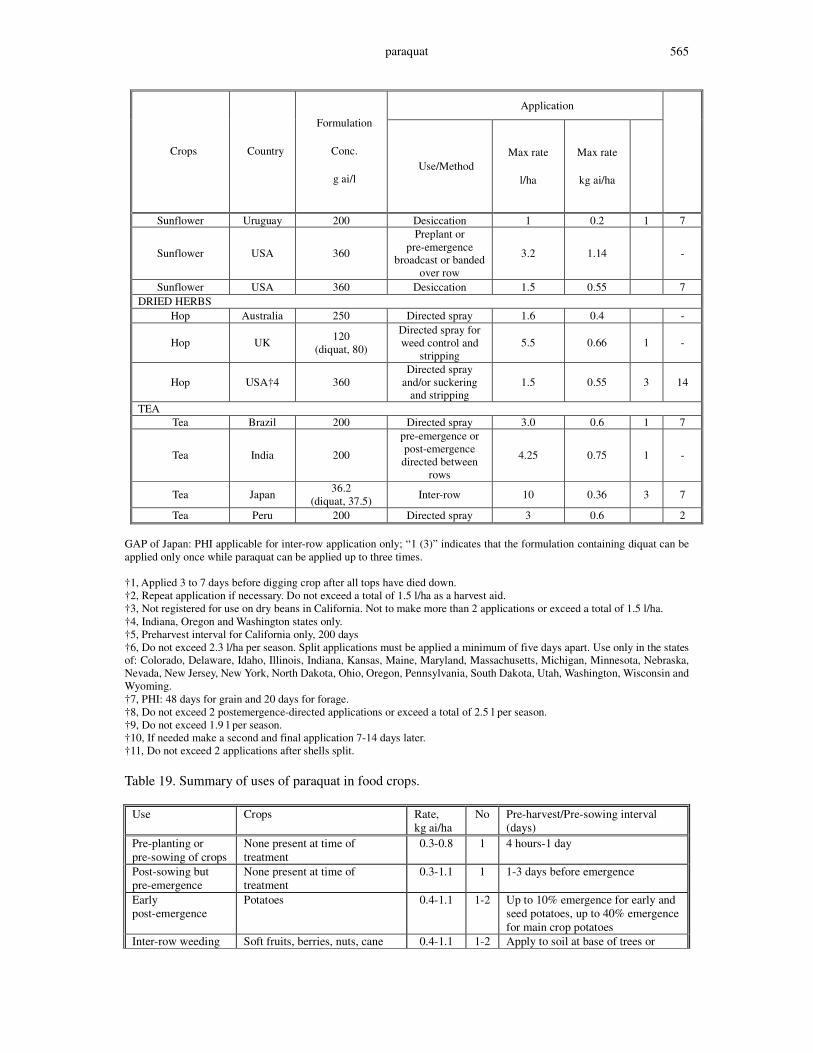
paraquat 565
Application
Crops Country
Formulation
Conc.
g ai/l Use/Method
Max rate
l/ha
Max rate
kg ai/ha
Sunflower Uruguay 200 Desiccation 1 0.2 1 7
Sunflower USA 360
Preplant or pre-emergence
broadcast or banded over row
3.2 1.14 -
Sunflower USA 360 Desiccation 1.5 0.55 7 DRIED HERBS
Hop Australia 250 Directed spray 1.6 0.4 -
Hop UK 120 (diquat, 80)
Directed spray for weed control and
stripping 5.5 0.66 1 -
Hop USA†4 360 Directed spray
and/or suckering and stripping
1.5 0.55 3 14
TEA Tea Brazil 200 Directed spray 3.0 0.6 1 7
Tea India 200
pre-emergence or post-emergence directed between
rows
4.25 0.75 1 -
Tea Japan 36.2 (diquat, 37.5) Inter-row 10 0.36 3 7
Tea Peru 200 Directed spray 3 0.6 2 GAP of Japan: PHI applicable for inter-row application only; “1 (3)” indicates that the formulation containing diquat can be applied only once while paraquat can be applied up to three times. †1, Applied 3 to 7 days before digging crop after all tops have died down. †2, Repeat application if necessary. Do not exceed a total of 1.5 l/ha as a harvest aid. †3, Not registered for use on dry beans in California. Not to make more than 2 applications or exceed a total of 1.5 l/ha. †4, Indiana, Oregon and Washington states only. †5, Preharvest interval for California only, 200 days †6, Do not exceed 2.3 l/ha per season. Split applications must be applied a minimum of five days apart. Use only in the states of: Colorado, Delaware, Idaho, Illinois, Indiana, Kansas, Maine, Maryland, Massachusetts, Michigan, Minnesota, Nebraska, Nevada, New Jersey, New York, North Dakota, Ohio, Oregon, Pennsylvania, South Dakota, Utah, Washington, Wisconsin and Wyoming. †7, PHI: 48 days for grain and 20 days for forage. †8, Do not exceed 2 postemergence-directed applications or exceed a total of 2.5 l per season. †9, Do not exceed 1.9 l per season. †10, If needed make a second and final application 7-14 days later. †11, Do not exceed 2 applications after shells split. Table 19. Summary of uses of paraquat in food crops.
Use Crops Rate, kg ai/ha
No Pre-harvest/Pre-sowing interval (days)
Pre-planting or pre-sowing of crops
None present at time of treatment
0.3-0.8 1 4 hours-1 day
Post-sowing but pre-emergence
None present at time of treatment
0.3-1.1 1 1-3 days before emergence
Early post-emergence
Potatoes 0.4-1.1 1-2 Up to 10% emergence for early and seed potatoes, up to 40% emergence for main crop potatoes
Inter-row weeding Soft fruits, berries, nuts, cane 0.4-1.1 1-2 Apply to soil at base of trees or
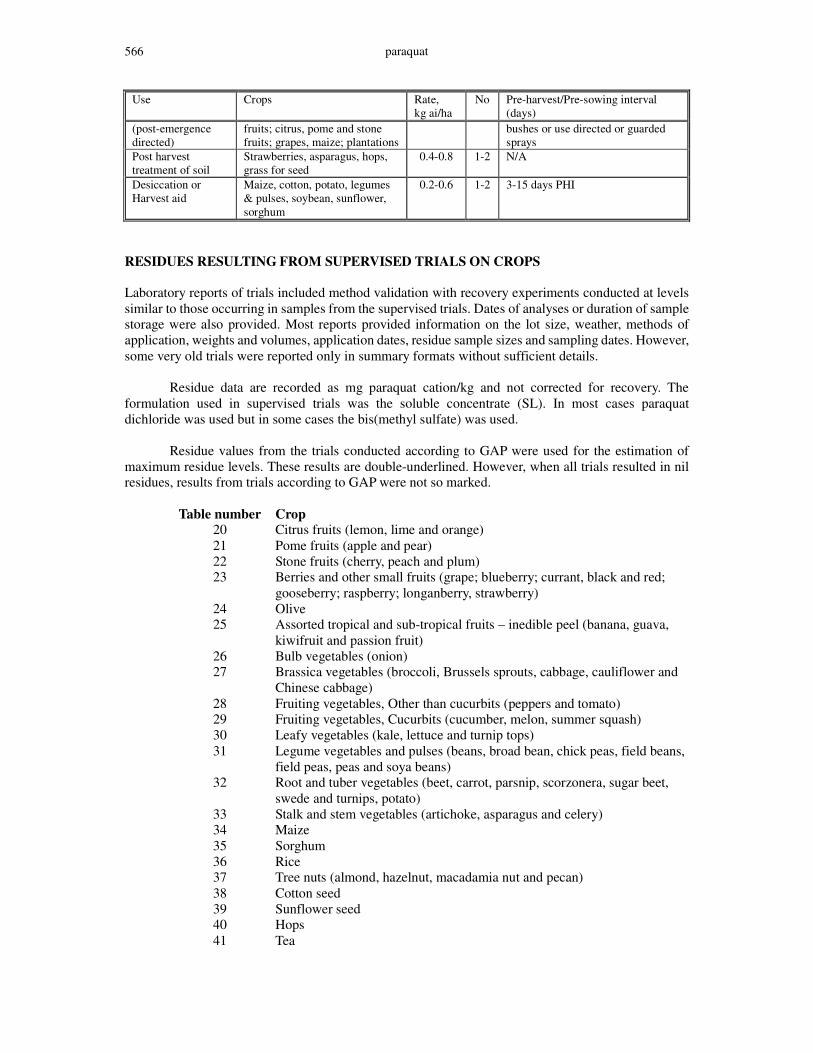
paraquat 566
Use Crops Rate, kg ai/ha
No Pre-harvest/Pre-sowing interval (days)
(post-emergence directed)
fruits; citrus, pome and stone fruits; grapes, maize; plantations
bushes or use directed or guarded sprays
Post harvest treatment of soil
Strawberries, asparagus, hops, grass for seed
0.4-0.8 1-2 N/A
Desiccation or Harvest aid
Maize, cotton, potato, legumes & pulses, soybean, sunflower, sorghum
0.2-0.6 1-2 3-15 days PHI
RESIDUES RESULTING FROM SUPERVISED TRIALS ON CROPS Laboratory reports of trials included method validation with recovery experiments conducted at levels similar to those occurring in samples from the supervised trials. Dates of analyses or duration of sample storage were also provided. Most reports provided information on the lot size, weather, methods of application, weights and volumes, application dates, residue sample sizes and sampling dates. However, some very old trials were reported only in summary formats without sufficient details. Residue data are recorded as mg paraquat cation/kg and not corrected for recovery. The formulation used in supervised trials was the soluble concentrate (SL). In most cases paraquat dichloride was used but in some cases the bis(methyl sulfate) was used. Residue values from the trials conducted according to GAP were used for the estimation of maximum residue levels. These results are double-underlined. However, when all trials resulted in nil residues, results from trials according to GAP were not so marked.
Table number Crop 20 Citrus fruits (lemon, lime and orange) 21 Pome fruits (apple and pear) 22 Stone fruits (cherry, peach and plum) 23 Berries and other small fruits (grape; blueberry; currant, black and red;
gooseberry; raspberry; longanberry, strawberry) 24 Olive 25 Assorted tropical and sub-tropical fruits – inedible peel (banana, guava,
kiwifruit and passion fruit) 26 Bulb vegetables (onion) 27 Brassica vegetables (broccoli, Brussels sprouts, cabbage, cauliflower and
Chinese cabbage) 28 Fruiting vegetables, Other than cucurbits (peppers and tomato) 29 Fruiting vegetables, Cucurbits (cucumber, melon, summer squash) 30 Leafy vegetables (kale, lettuce and turnip tops) 31 Legume vegetables and pulses (beans, broad bean, chick peas, field beans,
field peas, peas and soya beans) 32 Root and tuber vegetables (beet, carrot, parsnip, scorzonera, sugar beet,
swede and turnips, potato) 33 Stalk and stem vegetables (artichoke, asparagus and celery) 34 Maize 35 Sorghum 36 Rice 37 Tree nuts (almond, hazelnut, macadamia nut and pecan) 38 Cotton seed 39 Sunflower seed 40 Hops 41 Tea
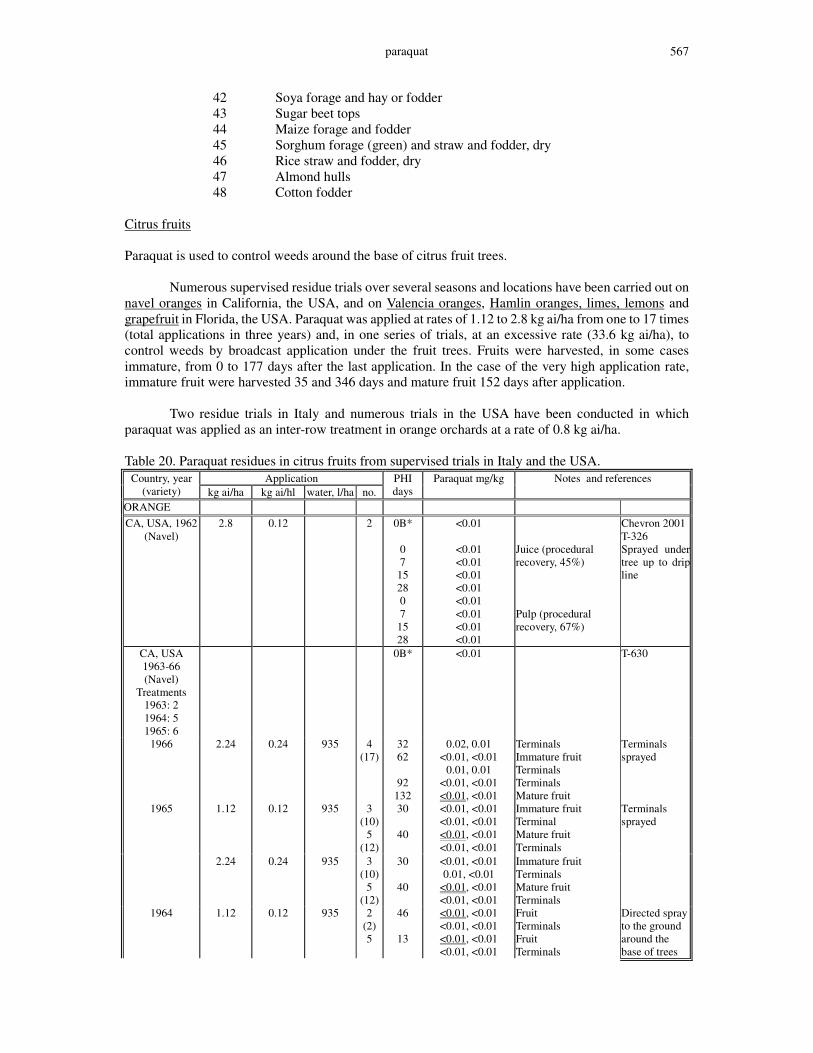
paraquat 567
42 Soya forage and hay or fodder 43 Sugar beet tops 44 Maize forage and fodder 45 Sorghum forage (green) and straw and fodder, dry 46 Rice straw and fodder, dry 47 Almond hulls 48 Cotton fodder
Citrus fruits Paraquat is used to control weeds around the base of citrus fruit trees. Numerous supervised residue trials over several seasons and locations have been carried out on navel oranges in California, the USA, and on Valencia oranges, Hamlin oranges, limes, lemons and grapefruit in Florida, the USA. Paraquat was applied at rates of 1.12 to 2.8 kg ai/ha from one to 17 times (total applications in three years) and, in one series of trials, at an excessive rate (33.6 kg ai/ha), to control weeds by broadcast application under the fruit trees. Fruits were harvested, in some cases immature, from 0 to 177 days after the last application. In the case of the very high application rate, immature fruit were harvested 35 and 346 days and mature fruit 152 days after application. Two residue trials in Italy and numerous trials in the USA have been conducted in which paraquat was applied as an inter-row treatment in orange orchards at a rate of 0.8 kg ai/ha. Table 20. Paraquat residues in citrus fruits from supervised trials in Italy and the USA.
Application Country, year (variety) kg ai/ha kg ai/hl water, l/ha no.
PHI days
Paraquat mg/kg Notes and references
ORANGE CA, USA, 1962
(Navel) 2.8 0.12 2 0B*
0 7
15 28 0 7
15 28
<0.01
<0.01 <0.01 <0.01 <0.01 <0.01 <0.01 <0.01 <0.01
Juice (procedural recovery, 45%) Pulp (procedural recovery, 67%)
Chevron 2001 T-326 Sprayed under tree up to drip line
CA, USA 1963-66 (Navel)
Treatments 1963: 2 1964: 5 1965: 6
0B*
<0.01 T-630
1966 2.24 0.24 935 4 (17)
32 62
92
132
0.02, 0.01 <0.01, <0.01
0.01, 0.01 <0.01, <0.01 <0.01, <0.01
Terminals Immature fruit Terminals Terminals Mature fruit
Terminals sprayed
1.12 0.12 935 3 (10)
5 (12)
30
40
<0.01, <0.01 <0.01, <0.01 <0.01, <0.01 <0.01, <0.01
Immature fruit Terminal Mature fruit Terminals
Terminals sprayed
1965
2.24 0.24 935 3 (10)
5 (12)
30
40
<0.01, <0.01 0.01, <0.01
<0.01, <0.01 <0.01, <0.01
Immature fruit Terminals Mature fruit Terminals
1964 1.12 0.12 935 2 (2) 5
46
13
<0.01, <0.01 <0.01, <0.01 <0.01, <0.01 <0.01, <0.01
Fruit Terminals Fruit Terminals
Directed spray to the ground around the base of trees
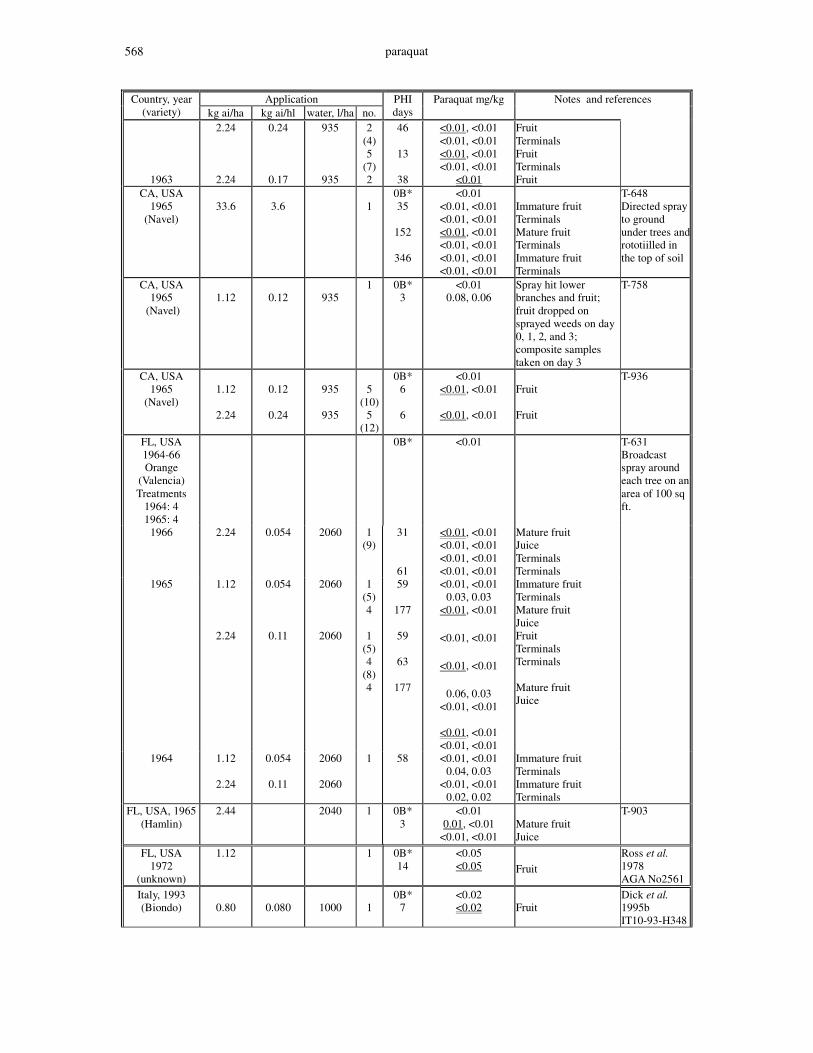
paraquat 568
Application Country, year (variety) kg ai/ha kg ai/hl water, l/ha no.
PHI days
Paraquat mg/kg Notes and references
2.24 0.24 935 2 (4) 5
(7)
46
13
<0.01, <0.01 <0.01, <0.01 <0.01, <0.01 <0.01, <0.01
Fruit Terminals Fruit Terminals
1963 2.24 0.17 935 2 38 <0.01 Fruit CA, USA
1965 (Navel)
33.6
3.6
1
0B* 35
152
346
<0.01 <0.01, <0.01 <0.01, <0.01 <0.01, <0.01 <0.01, <0.01 <0.01, <0.01 <0.01, <0.01
Immature fruit Terminals Mature fruit Terminals Immature fruit Terminals
T-648 Directed spray to ground under trees and rototiilled in the top of soil
CA, USA 1965
(Navel)
1.12
0.12
935
1 0B* 3
<0.01 0.08, 0.06
Spray hit lower branches and fruit; fruit dropped on sprayed weeds on day 0, 1, 2, and 3; composite samples taken on day 3
T-758
CA, USA 1965
(Navel)
1.12
2.24
0.12
0.24
935
935
5
(10) 5
(12)
0B* 6
6
<0.01 <0.01, <0.01
<0.01, <0.01
Fruit Fruit
T-936
FL, USA 1964-66 Orange
(Valencia) Treatments
1964: 4 1965: 4
0B*
<0.01
T-631 Broadcast spray around each tree on an area of 100 sq ft.
1966 2.24 0.054 2060 1 (9)
31
61
<0.01, <0.01 <0.01, <0.01 <0.01, <0.01 <0.01, <0.01
Mature fruit Juice Terminals Terminals
1965 1.12
2.24
0.054
0.11
2060
2060
1 (5) 4
1 (5) 4
(8) 4
59
177
59
63
177
<0.01, <0.01 0.03, 0.03
<0.01, <0.01
<0.01, <0.01
<0.01, <0.01
0.06, 0.03 <0.01, <0.01
<0.01, <0.01 <0.01, <0.01
Immature fruit Terminals Mature fruit Juice Fruit Terminals Terminals Mature fruit Juice
1964 1.12
2.24
0.054
0.11
2060
2060
1 58 <0.01, <0.01 0.04, 0.03
<0.01, <0.01 0.02, 0.02
Immature fruit Terminals Immature fruit Terminals
FL, USA, 1965 (Hamlin)
2.44 2040 1 0B* 3
<0.01 0.01, <0.01
<0.01, <0.01
Mature fruit Juice
T-903
FL, USA 1972
(unknown)
1.12 1 0B* 14
<0.05 <0.05
Fruit
Ross et al. 1978 AGA No2561
Italy, 1993 (Biondo)
0.80
0.080
1000
1
0B* 7
<0.02 <0.02
Fruit
Dick et al. 1995b IT10-93-H348

paraquat 569
Application Country, year (variety) kg ai/ha kg ai/hl water, l/ha no.
PHI days
Paraquat mg/kg Notes and references
(Navelina) 0.80
0.080
1000
1
0B* 7
<0.02 <0.02
Fruit
IT10-93-H349
GRAPEFRUIT USA, 1970 Grapefruit (unknown)
1.12 - 1 0B* 3
35
<0.05 <0.05 <0.05
Fruit
Anon 1970 Summary only
LEMON USA, 1970 (unknown)
1.12 1
0B* 3
<0.05 <0.05
Fruit
Anon 1970 Summary only
CA, USA 1972
(unknown)
1.12 1 0B* 49
<0.05 <0.05
Fruit
Ross et al. 1978
LIME FL, USA
1966 (Tahiti)
1.12
1870
5
0B* 1
<0.01 <0.01, <0.01
Fruit
Chevron 2001 T-1110
*B: control Immature fruit 1-5 cm in diameter (size varies from trial to trial) Numbers in parentheses are the cumulative application number since 1963 in T-630 and T- 936 (higher dose) or since 1964 in T-631 and T-936 (lower dose). Pome fruits Paraquat is used to control weeds around the base of pome fruit trees. Trials were carried out in Canada, Germany and the UK using rates from 1.12 to 4.5 kg ai/ha and even a highly exaggerated rate of 12.3 kg ai/ha. In the last case, paraquat was applied directly to the bark of the tree to simulate worst-case conditions. In some cases, two applications were made, either in the same or subsequent years. Apples were harvested from 0 to 780 days, and pears 0-77 after the last application. Table 21. Paraquat residues in pome fruits from supervised trials in Canada, Germany and the UK.
Application Country, year (variety) kg ai/ha kg ai/hl water, l/ha no.
PHI days
Paraquat mg/kg Notes and references
APPLE Ontario, Canada,
1962 (Delicious)
2.24
935
1
0B* 14
<0.01 <0.01
Calderbank & Yuen 1963 Cambellville
(Spy) 1.68 1.12
935
1
0B* 14
<0.01 <0.01
Cambellville
(Delicious) 2.24
935
1
0B* 14
<0.01 <0.01
Inglewood
(Spy) 2.24
935
1
0B* 14
<0.01 <0.01
Inglewood
(McIntosh) 2.24 2.80
935
1 1
0B* 6 11
<0.01 <0.01 x 4
<0.01
Guelph
NS, Canada, 1962
(McIntosh)
2.24
374
1
0B* 12
<0.01 <0.01, <0.01
Kentville
BC, Canada, 1962
(Seedlings)
2.24
1871
1
0B* 13
<0.01 <0.01
Summerland

paraquat 570
Application Country, year (variety) kg ai/ha kg ai/hl water, l/ha no.
PHI days
Paraquat mg/kg Notes and references
Fernhurst, UK 1962
(Laxton Superb)
1.12 11.2
12.32
935
1 1 1 1
0B* 12 12 12 12
<0.01 <0.01 <0.01 <0.01 <0.01
Sprayed to: Base of trees Base of trees Bark of trees Bark of trees
Ontario, Canada, 1961
(McIntosh)
2.24 5610 1 0B* 16
<0.01 <0.01
Kemptville
Ontario, Canada, 1963
(McIntosh)
2.24 4.48 2.24 4.48
935
1 1 2 2
0B* 85 85 5 5
<0.01 <0.01, <0.01 <0.01, <0.01 <0.01, <0.01 <0.01, <0.01
Calderbank & McKenna 1964Carlisle
(Winesap) 1.12
234
1 131 <0.01 Guelph
(McIntosh) 1.12
234
1
0B* 131
<0.01 <0.01
Guelph
(Delicious) 2.24 4.48 2.24 4.48 2.24 4.48 2.24 4.48
935
1 1 2 1
0B* 5
27
27
122
<0.01 <0.01 <0.01 <0.01 <0.01 <0.01 <0.01 <0.01 <0.01
(McIntosh) 2.24 4.48 2.24 4.48
935
1 2
0B* 20 20 20 20
<0.01 <0.01 <0.01 <0.01 <0.01
Carlisle
Fernhurst, UK 1963
(Laxton Superb)
0.56
702
2
0B* 780
<0.01 <0.01
Second year treatment
Germany 1990
(Golden delicious)
1.0
1000
1
0B* 0 14
<0.01 <0.01 <0.01 0.19
Fruit from tree Fruit from tree Fruit on ground
Earl & Anderson 1992a Rs9023B3
(Gloster) 1.0
1000
1
0B* 0 14
<0.01 <0.01 <0.01 0.05
Fruit from tree Fruit from tree Fruit on ground
Rs9023B4
(Idared) 1.0
1000
1
0B* 0 14
<0.01 <0.01 <0.01 0.03
Fruit from tree Fruit from tree Fruit on ground
Rs9023E1
(Cox orange) 1.0
1000
1
0B* 0 14
<0.01 <0.01 <0.01 0.02
Fruit from tree Fruit from tree Fruit on ground
Rs9023G1
PEAR Ontario, Canada,
1963 (Clapp)
2.24 4.48 2.24 4.48 2.24 4.48 2.24 4.48
935
1 1 2 1
0B* 9
17
17
77
<0.01 <0.01 <0.01 <0.01 <0.01 <0.01 <0.01 <0.01 <0.01
Calderbank & McKenna 1964Winona
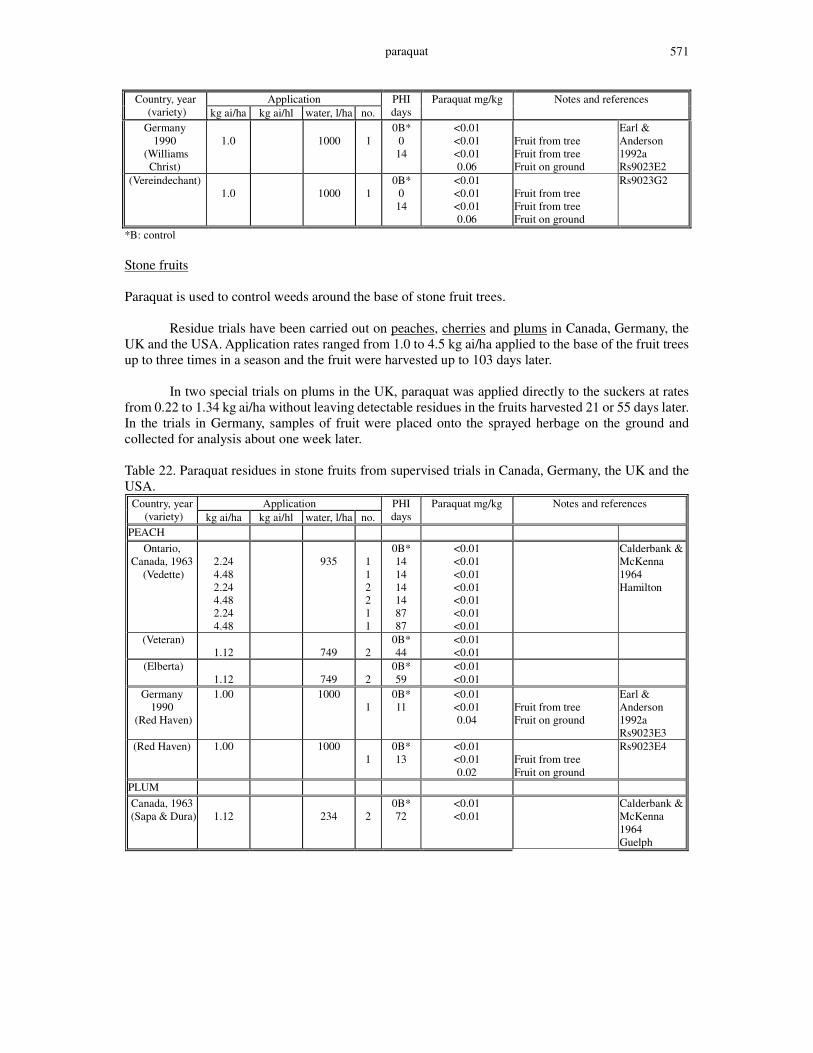
paraquat 571
Application Country, year (variety) kg ai/ha kg ai/hl water, l/ha no.
PHI days
Paraquat mg/kg Notes and references
Germany 1990
(Williams Christ)
1.0
1000
1
0B* 0 14
<0.01 <0.01 <0.01 0.06
Fruit from tree Fruit from tree Fruit on ground
Earl & Anderson 1992a Rs9023E2
(Vereindechant) 1.0
1000
1
0B* 0 14
<0.01 <0.01 <0.01 0.06
Fruit from tree Fruit from tree Fruit on ground
Rs9023G2
*B: control Stone fruits Paraquat is used to control weeds around the base of stone fruit trees. Residue trials have been carried out on peaches, cherries and plums in Canada, Germany, the UK and the USA. Application rates ranged from 1.0 to 4.5 kg ai/ha applied to the base of the fruit trees up to three times in a season and the fruit were harvested up to 103 days later. In two special trials on plums in the UK, paraquat was applied directly to the suckers at rates from 0.22 to 1.34 kg ai/ha without leaving detectable residues in the fruits harvested 21 or 55 days later. In the trials in Germany, samples of fruit were placed onto the sprayed herbage on the ground and collected for analysis about one week later. Table 22. Paraquat residues in stone fruits from supervised trials in Canada, Germany, the UK and the USA.
Application Country, year (variety) kg ai/ha kg ai/hl water, l/ha no.
PHI days
Paraquat mg/kg Notes and references
PEACH Ontario,
Canada, 1963 (Vedette)
2.24 4.48 2.24 4.48 2.24 4.48
935
1 1 2 2 1 1
0B* 14 14 14 14 87 87
<0.01 <0.01 <0.01 <0.01 <0.01 <0.01 <0.01
Calderbank & McKenna 1964 Hamilton
(Veteran) 1.12
749
2
0B* 44
<0.01 <0.01
(Elberta) 1.12
749
2
0B* 59
<0.01 <0.01
Germany 1990
(Red Haven)
1.00 1000 1
0B* 11
<0.01 <0.01 0.04
Fruit from tree Fruit on ground
Earl & Anderson 1992a Rs9023E3
(Red Haven) 1.00 1000 1
0B* 13
<0.01 <0.01 0.02
Fruit from tree Fruit on ground
Rs9023E4
PLUM Canada, 1963
(Sapa & Dura)
1.12
234
2
0B* 72
<0.01 <0.01
Calderbank & McKenna 1964 Guelph
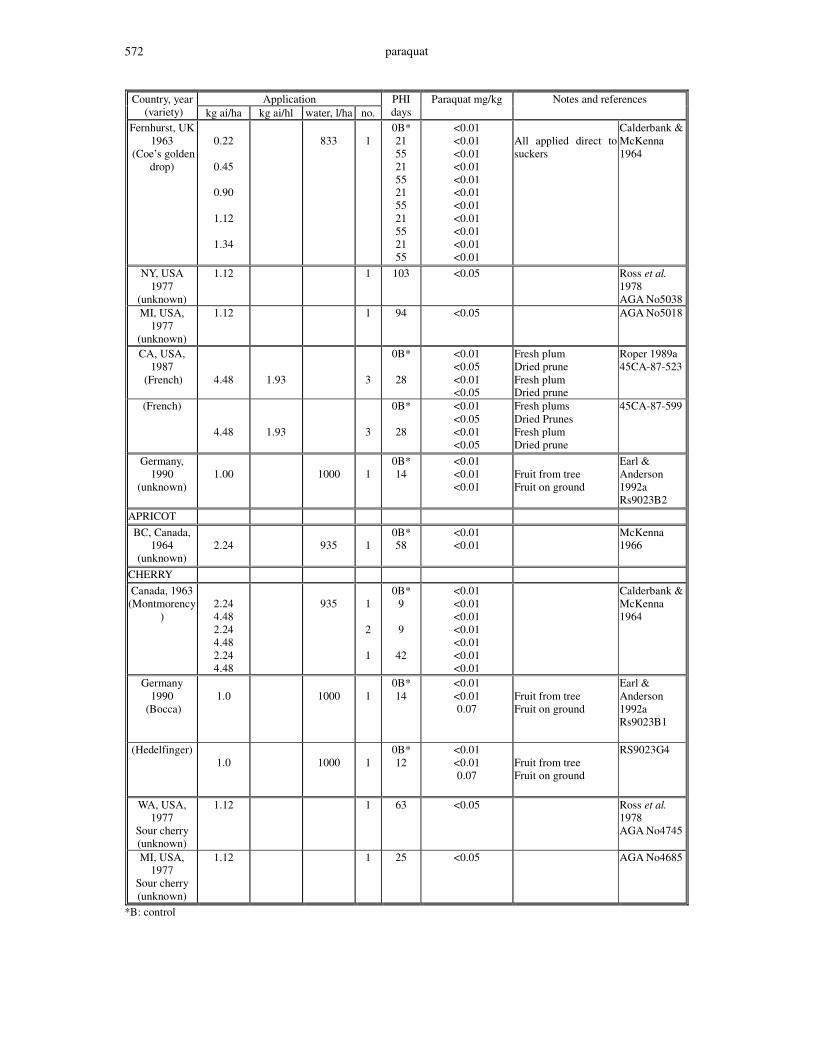
paraquat 572
Application Country, year (variety) kg ai/ha kg ai/hl water, l/ha no.
PHI days
Paraquat mg/kg Notes and references
Fernhurst, UK 1963
(Coe’s golden drop)
0.22
0.45
0.90
1.12
1.34
833
1
0B* 21 55 21 55 21 55 21 55 21 55
<0.01 <0.01 <0.01 <0.01 <0.01 <0.01 <0.01 <0.01 <0.01 <0.01 <0.01
All applied direct to suckers
Calderbank & McKenna 1964
NY, USA 1977
(unknown)
1.12 1 103 <0.05 Ross et al. 1978 AGA No5038
MI, USA, 1977
(unknown)
1.12 1 94 <0.05 AGA No5018
CA, USA, 1987
(French)
4.48
1.93
3
0B*
28
<0.01 <0.05 <0.01 <0.05
Fresh plum Dried prune Fresh plum Dried prune
Roper 1989a 45CA-87-523
(French)
4.48
1.93
3
0B*
28
<0.01 <0.05 <0.01 <0.05
Fresh plums Dried Prunes Fresh plum Dried prune
45CA-87-599
Germany, 1990
(unknown)
1.00
1000
1
0B* 14
<0.01 <0.01 <0.01
Fruit from tree Fruit on ground
Earl & Anderson 1992a Rs9023B2
APRICOT BC, Canada,
1964 (unknown)
2.24
935
1
0B* 58
<0.01 <0.01
McKenna 1966
CHERRY Canada, 1963 (Montmorency
)
2.24 4.48 2.24 4.48 2.24 4.48
935
1
2
1
0B* 9 9
42
<0.01 <0.01 <0.01 <0.01 <0.01 <0.01 <0.01
Calderbank & McKenna 1964
Germany 1990
(Bocca)
1.0
1000
1
0B* 14
<0.01 <0.01 0.07
Fruit from tree Fruit on ground
Earl & Anderson 1992a Rs9023B1
(Hedelfinger) 1.0
1000
1
0B* 12
<0.01 <0.01 0.07
Fruit from tree Fruit on ground
RS9023G4
WA, USA, 1977
Sour cherry (unknown)
1.12 1 63 <0.05
Ross et al. 1978 AGA No4745
MI, USA, 1977
Sour cherry (unknown)
1.12 1 25 <0.05 AGA No4685
*B: control
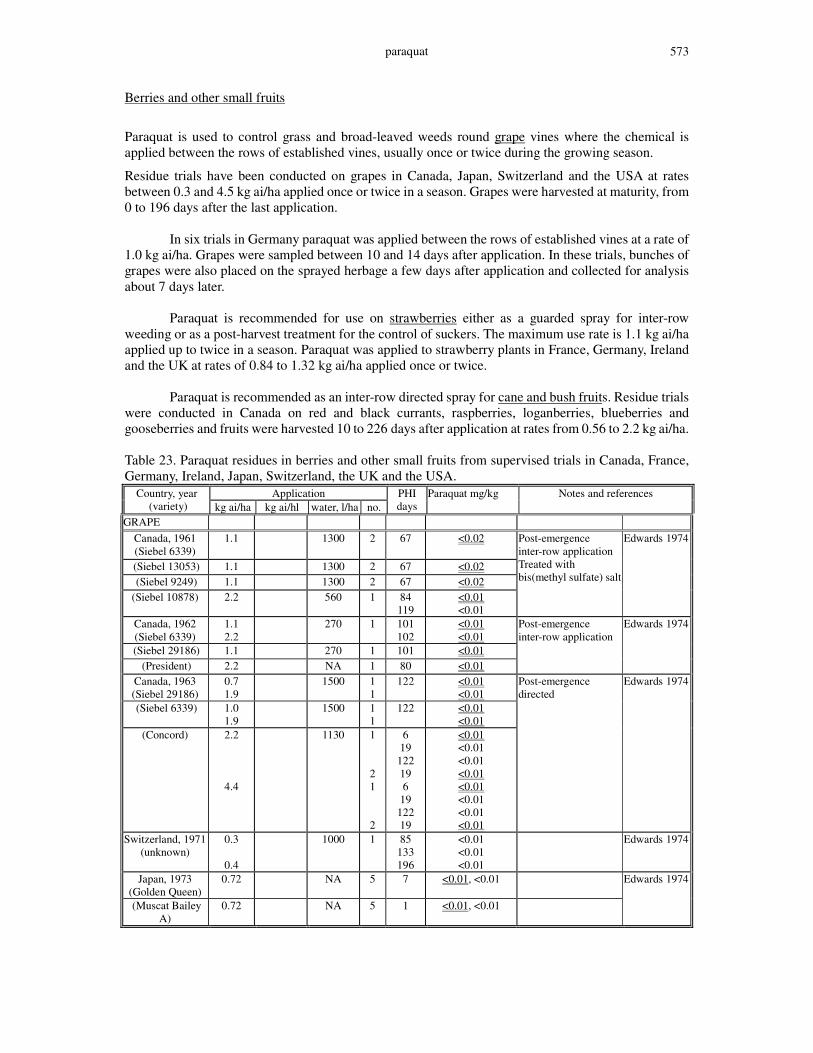
paraquat 573
Berries and other small fruits
Paraquat is used to control grass and broad-leaved weeds round grape vines where the chemical is applied between the rows of established vines, usually once or twice during the growing season.
Residue trials have been conducted on grapes in Canada, Japan, Switzerland and the USA at rates between 0.3 and 4.5 kg ai/ha applied once or twice in a season. Grapes were harvested at maturity, from 0 to 196 days after the last application. In six trials in Germany paraquat was applied between the rows of established vines at a rate of 1.0 kg ai/ha. Grapes were sampled between 10 and 14 days after application. In these trials, bunches of grapes were also placed on the sprayed herbage a few days after application and collected for analysis about 7 days later. Paraquat is recommended for use on strawberries either as a guarded spray for inter-row weeding or as a post-harvest treatment for the control of suckers. The maximum use rate is 1.1 kg ai/ha applied up to twice in a season. Paraquat was applied to strawberry plants in France, Germany, Ireland and the UK at rates of 0.84 to 1.32 kg ai/ha applied once or twice. Paraquat is recommended as an inter-row directed spray for cane and bush fruits. Residue trials were conducted in Canada on red and black currants, raspberries, loganberries, blueberries and gooseberries and fruits were harvested 10 to 226 days after application at rates from 0.56 to 2.2 kg ai/ha. Table 23. Paraquat residues in berries and other small fruits from supervised trials in Canada, France, Germany, Ireland, Japan, Switzerland, the UK and the USA.
Application Country, year (variety) kg ai/ha kg ai/hl water, l/ha no.
PHI days
Paraquat mg/kg Notes and references
GRAPE Canada, 1961 (Siebel 6339)
1.1
1300
2
67
<0.02
(Siebel 13053) 1.1 1300 2 67 <0.02 (Siebel 9249) 1.1 1300 2 67 <0.02 (Siebel 10878) 2.2 560 1 84
119 <0.01 <0.01
Post-emergence inter-row application Treated with bis(methyl sulfate) salt
Edwards 1974
Canada, 1962 (Siebel 6339)
1.1 2.2
270 1 101 102
<0.01 <0.01
(Siebel 29186) 1.1 270 1 101 <0.01 (President) 2.2 NA 1 80 <0.01
Post-emergence inter-row application
Edwards 1974
Canada, 1963 (Siebel 29186)
0.7 1.9
1500 1 1
122 <0.01 <0.01
(Siebel 6339) 1.0 1.9
1500 1 1
122 <0.01 <0.01
(Concord) 2.2
4.4
1130 1
2 1
2
6 19
122 19 6
19 122 19
<0.01 <0.01 <0.01 <0.01 <0.01 <0.01 <0.01 <0.01
Post-emergence directed
Edwards 1974
Switzerland, 1971 (unknown)
0.3
0.4
1000 1 85 133 196
<0.01 <0.01 <0.01
Edwards 1974
Japan, 1973 (Golden Queen)
0.72 NA 5 7 <0.01, <0.01
(Muscat Bailey A)
0.72 NA 5 1 <0.01, <0.01
Edwards 1974
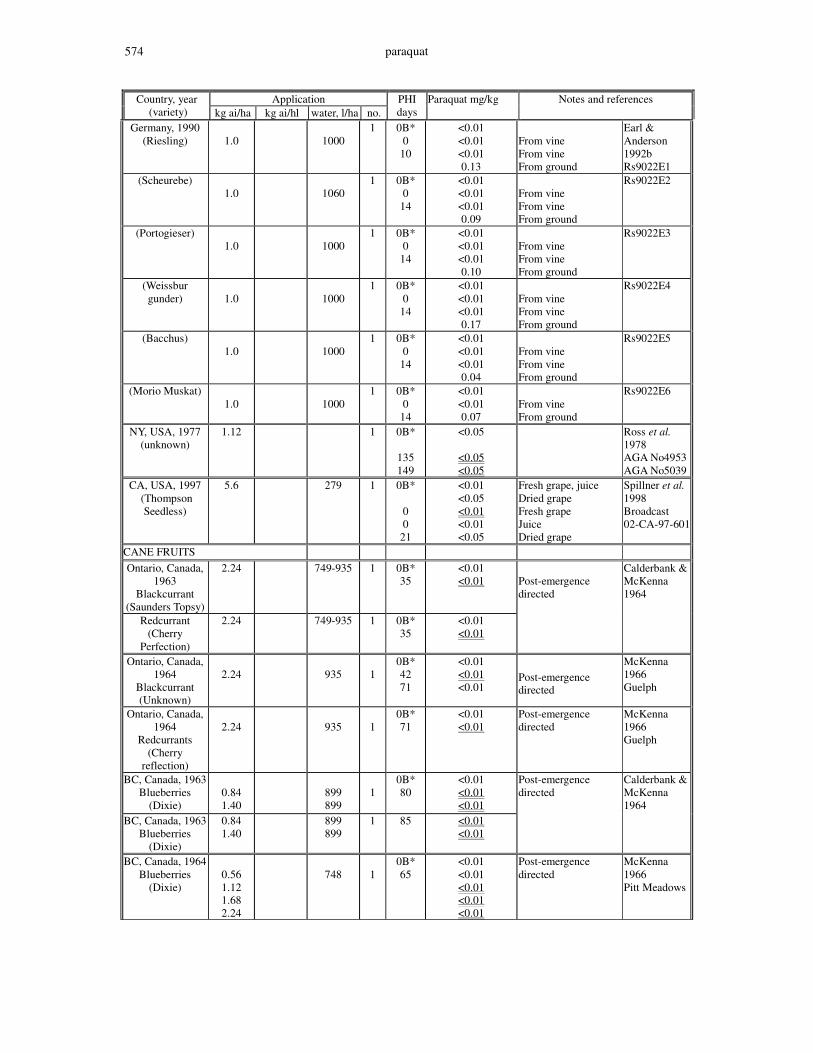
paraquat 574
Application Country, year (variety) kg ai/ha kg ai/hl water, l/ha no.
PHI days
Paraquat mg/kg Notes and references
Germany, 1990 (Riesling)
1.0
1000
1
0B* 0
10
<0.01 <0.01 <0.01 0.13
From vine From vine From ground
Earl & Anderson 1992b Rs9022E1
(Scheurebe) 1.0
1060
1
0B* 0
14
<0.01 <0.01 <0.01 0.09
From vine From vine From ground
Rs9022E2
(Portogieser)
1.0
1000
1
0B* 0
14
<0.01 <0.01 <0.01 0.10
From vine From vine From ground
Rs9022E3
(Weissbur gunder)
1.0
1000
1
0B* 0
14
<0.01 <0.01 <0.01 0.17
From vine From vine From ground
Rs9022E4
(Bacchus) 1.0
1000
1
0B* 0
14
<0.01 <0.01 <0.01 0.04
From vine From vine From ground
Rs9022E5
(Morio Muskat) 1.0
1000
1
0B* 0
14
<0.01 <0.01 0.07
From vine From ground
Rs9022E6
NY, USA, 1977 (unknown)
1.12 1 0B*
135 149
<0.05
<0.05 <0.05
Ross et al. 1978 AGA No4953 AGA No5039
CA, USA, 1997 (Thompson
Seedless)
5.6 279 1 0B*
0 0
21
<0.01 <0.05 <0.01 <0.01 <0.05
Fresh grape, juice Dried grape Fresh grape Juice Dried grape
Spillner et al. 1998 Broadcast 02-CA-97-601
CANE FRUITS Ontario, Canada,
1963 Blackcurrant
(Saunders Topsy)
2.24 749-935 1 0B* 35
<0.01 <0.01
Redcurrant (Cherry
Perfection)
2.24 749-935 1 0B* 35
<0.01 <0.01
Post-emergence directed
Calderbank & McKenna 1964
Ontario, Canada, 1964
Blackcurrant (Unknown)
2.24
935
1
0B* 42 71
<0.01 <0.01 <0.01
Post-emergence directed
McKenna 1966 Guelph
Ontario, Canada, 1964
Redcurrants (Cherry
reflection)
2.24
935
1
0B* 71
<0.01 <0.01
Post-emergence directed
McKenna 1966 Guelph
BC, Canada, 1963 Blueberries
(Dixie)
0.84 1.40
899 899
1
0B* 80
<0.01 <0.01 <0.01
BC, Canada, 1963 Blueberries
(Dixie)
0.84 1.40
899 899
1
85
<0.01 <0.01
Post-emergence directed
Calderbank & McKenna 1964
BC, Canada, 1964 Blueberries
(Dixie)
0.56 1.12 1.68 2.24
748
1
0B* 65
<0.01 <0.01 <0.01 <0.01 <0.01
Post-emergence directed
McKenna 1966 Pitt Meadows
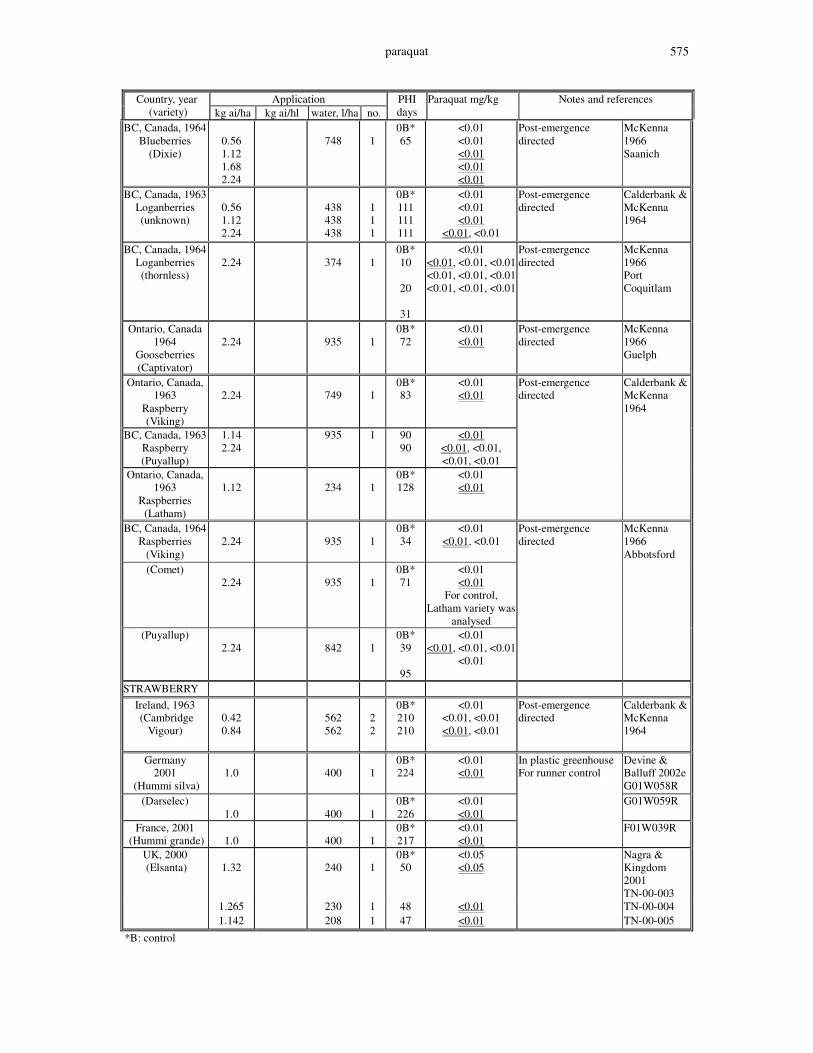
paraquat 575
Application Country, year (variety) kg ai/ha kg ai/hl water, l/ha no.
PHI days
Paraquat mg/kg Notes and references
BC, Canada, 1964 Blueberries
(Dixie)
0.56 1.12 1.68 2.24
748
1
0B* 65
<0.01 <0.01 <0.01 <0.01 <0.01
Post-emergence directed
McKenna 1966 Saanich
BC, Canada, 1963 Loganberries (unknown)
0.56 1.12 2.24
438 438 438
1 1 1
0B* 111 111 111
<0.01 <0.01 <0.01
<0.01, <0.01
Post-emergence directed
Calderbank & McKenna 1964
BC, Canada, 1964 Loganberries (thornless)
2.24
374
1
0B* 10
20
31
<0.01 <0.01, <0.01, <0.01 <0.01, <0.01, <0.01 <0.01, <0.01, <0.01
Post-emergence directed
McKenna 1966 Port Coquitlam
Ontario, Canada 1964
Gooseberries (Captivator)
2.24
935
1
0B* 72
<0.01 <0.01
Post-emergence directed
McKenna 1966 Guelph
Ontario, Canada, 1963
Raspberry (Viking)
2.24
749
1
0B* 83
<0.01 <0.01
BC, Canada, 1963 Raspberry (Puyallup)
1.14 2.24
935 1 90 90
<0.01 <0.01, <0.01, <0.01, <0.01
Ontario, Canada, 1963
Raspberries (Latham)
1.12
234
1
0B* 128
<0.01 <0.01
Post-emergence directed
Calderbank & McKenna 1964
BC, Canada, 1964 Raspberries
(Viking)
2.24
935
1
0B* 34
<0.01 <0.01, <0.01
(Comet) 2.24
935
1
0B* 71
<0.01 <0.01
For control, Latham variety was
analysed (Puyallup)
2.24
842
1
0B* 39
95
<0.01 <0.01, <0.01, <0.01
<0.01
Post-emergence directed
McKenna 1966 Abbotsford
STRAWBERRY Ireland, 1963 (Cambridge
Vigour)
0.42 0.84
562 562
2 2
0B* 210 210
<0.01 <0.01, <0.01 <0.01, <0.01
Post-emergence directed
Calderbank & McKenna 1964
Germany 2001
(Hummi silva)
1.0
400
1
0B* 224
<0.01 <0.01
Devine & Balluff 2002e G01W058R
(Darselec) 1.0
400
1
0B* 226
<0.01 <0.01
G01W059R
France, 2001 (Hummi grande)
1.0
400
1
0B* 217
<0.01 <0.01
In plastic greenhouse For runner control
F01W039R
UK, 2000 (Elsanta)
1.32
240
1
0B* 50
<0.05 <0.05
Nagra & Kingdom 2001 TN-00-003
1.265 230 1 48 <0.01 TN-00-004 1.142 208 1 47 <0.01 TN-00-005
*B: control
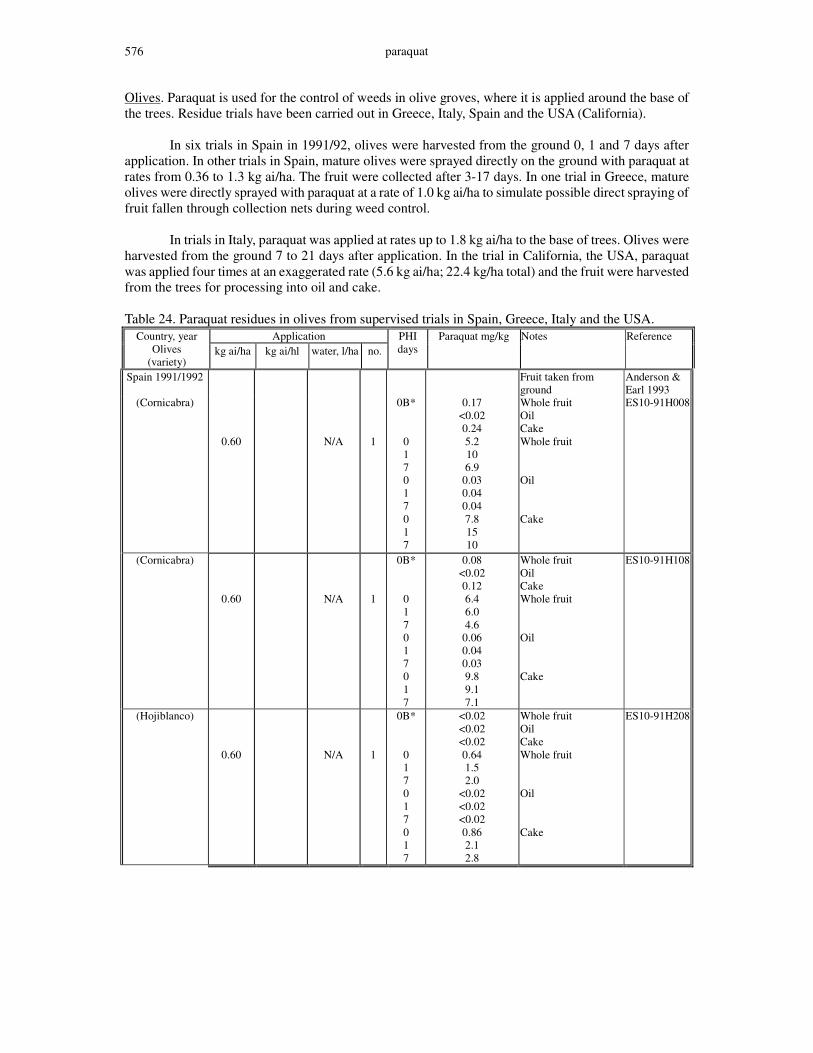
paraquat 576
Olives. Paraquat is used for the control of weeds in olive groves, where it is applied around the base of the trees. Residue trials have been carried out in Greece, Italy, Spain and the USA (California). In six trials in Spain in 1991/92, olives were harvested from the ground 0, 1 and 7 days after application. In other trials in Spain, mature olives were sprayed directly on the ground with paraquat at rates from 0.36 to 1.3 kg ai/ha. The fruit were collected after 3-17 days. In one trial in Greece, mature olives were directly sprayed with paraquat at a rate of 1.0 kg ai/ha to simulate possible direct spraying of fruit fallen through collection nets during weed control. In trials in Italy, paraquat was applied at rates up to 1.8 kg ai/ha to the base of trees. Olives were harvested from the ground 7 to 21 days after application. In the trial in California, the USA, paraquat was applied four times at an exaggerated rate (5.6 kg ai/ha; 22.4 kg/ha total) and the fruit were harvested from the trees for processing into oil and cake. Table 24. Paraquat residues in olives from supervised trials in Spain, Greece, Italy and the USA.
Application Country, year Olives
(variety) kg ai/ha kg ai/hl water, l/ha no.
PHI days
Paraquat mg/kg Notes Reference
Spain 1991/1992 Fruit taken from ground
Anderson & Earl 1993
(Cornicabra)
0.60
N/A
1
0B* 0 1 7 0 1 7 0 1 7
0.17 <0.02 0.24 5.2 10 6.9
0.03 0.04 0.04 7.8 15 10
Whole fruit Oil Cake Whole fruit Oil Cake
ES10-91H008
(Cornicabra)
0.60
N/A
1
0B* 0 1 7 0 1 7 0 1 7
0.08 <0.02 0.12 6.4 6.0 4.6
0.06 0.04 0.03 9.8 9.1 7.1
Whole fruit Oil Cake Whole fruit Oil Cake
ES10-91H108
(Hojiblanco)
0.60
N/A
1
0B* 0 1 7 0 1 7 0 1 7
<0.02 <0.02 <0.02 0.64 1.5 2.0
<0.02 <0.02 <0.02 0.86 2.1 2.8
Whole fruit Oil Cake Whole fruit Oil Cake
ES10-91H208
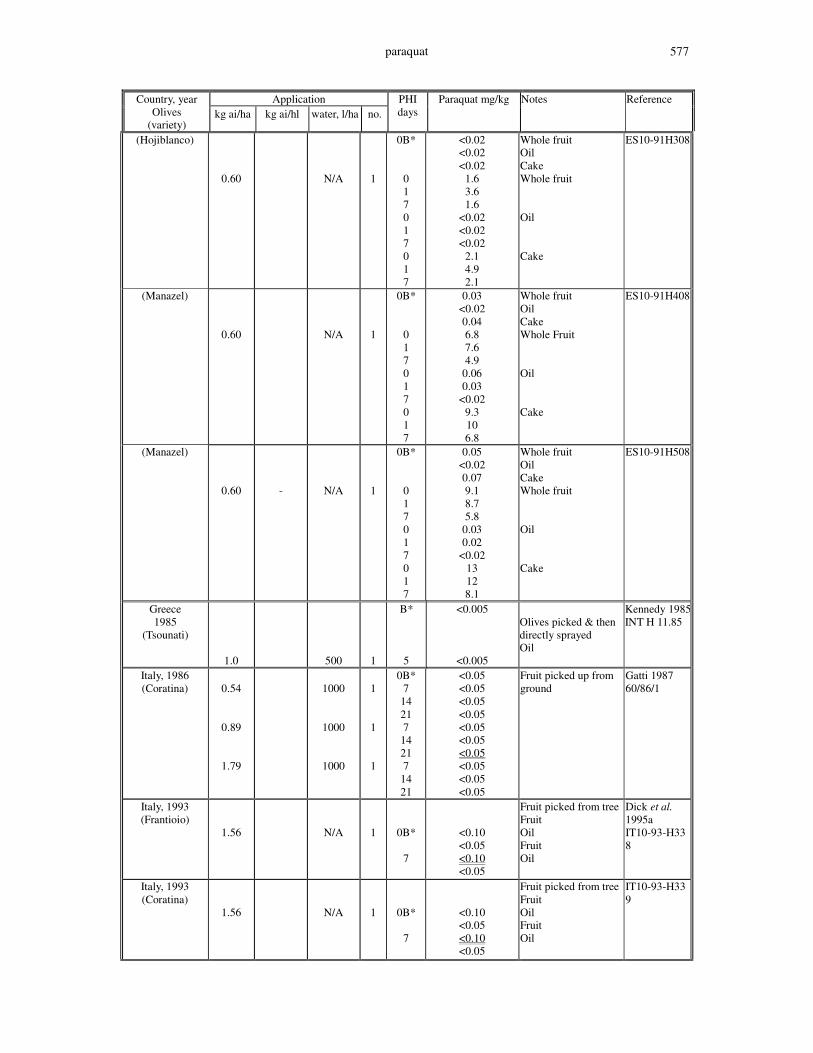
paraquat 577
Application Country, year Olives
(variety) kg ai/ha kg ai/hl water, l/ha no.
PHI days
Paraquat mg/kg Notes Reference
(Hojiblanco)
0.60
N/A
1
0B* 0 1 7 0 1 7 0 1 7
<0.02 <0.02 <0.02
1.6 3.6 1.6
<0.02 <0.02 <0.02
2.1 4.9 2.1
Whole fruit Oil Cake Whole fruit Oil Cake
ES10-91H308
(Manazel)
0.60
N/A
1
0B* 0 1 7 0 1 7 0 1 7
0.03 <0.02 0.04 6.8 7.6 4.9
0.06 0.03
<0.02 9.3 10 6.8
Whole fruit Oil Cake Whole Fruit Oil Cake
ES10-91H408
(Manazel)
0.60
-
N/A
1
0B* 0 1 7 0 1 7 0 1 7
0.05 <0.02 0.07 9.1 8.7 5.8
0.03 0.02
<0.02 13 12 8.1
Whole fruit Oil Cake Whole fruit Oil Cake
ES10-91H508
Greece 1985
(Tsounati)
1.0
500
1
B* 5
<0.005
<0.005
Olives picked & then directly sprayed Oil
Kennedy 1985INT H 11.85
Italy, 1986 (Coratina)
0.54
0.89
1.79
1000
1000
1000
1
1
1
0B* 7
14 21 7
14 21 7
14 21
<0.05 <0.05 <0.05 <0.05 <0.05 <0.05 <0.05 <0.05 <0.05 <0.05
Fruit picked up from ground
Gatti 1987 60/86/1
Italy, 1993 (Frantioio)
1.56
N/A
1
0B* 7
<0.10 <0.05 <0.10 <0.05
Fruit picked from tree Fruit Oil Fruit Oil
Dick et al. 1995a IT10-93-H338
Italy, 1993 (Coratina)
1.56
N/A
1
0B* 7
<0.10 <0.05 <0.10 <0.05
Fruit picked from tree Fruit Oil Fruit Oil
IT10-93-H339
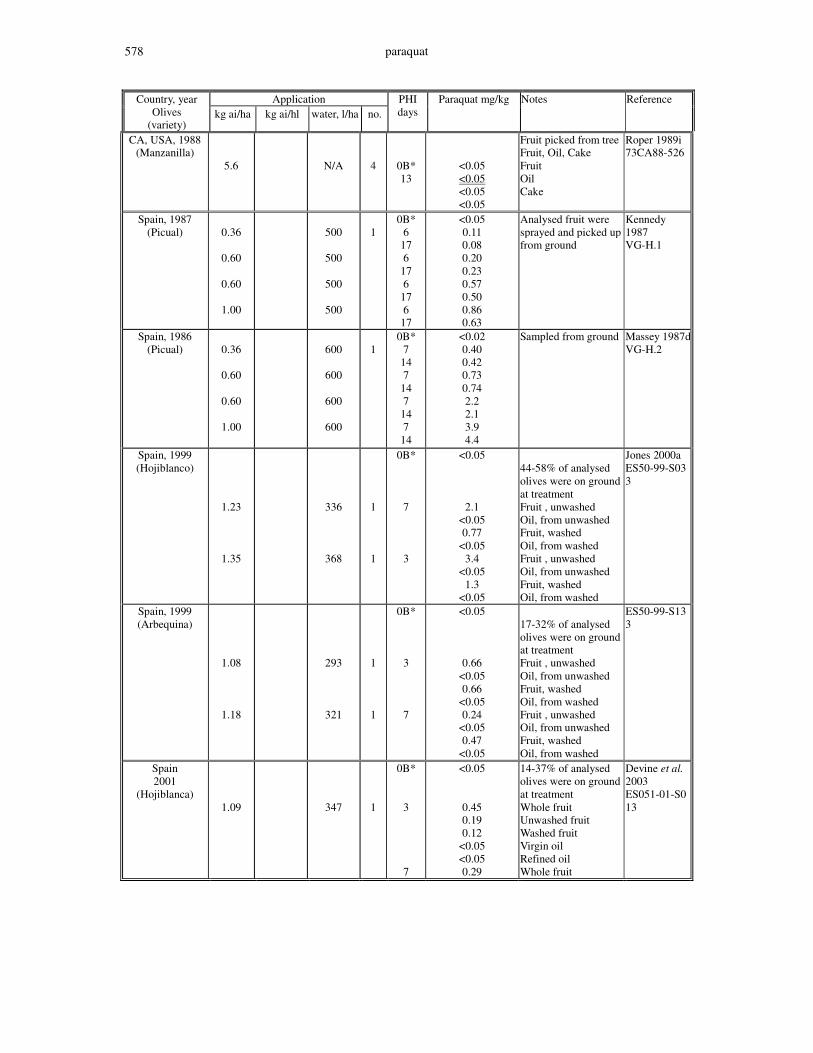
paraquat 578
Application Country, year Olives
(variety) kg ai/ha kg ai/hl water, l/ha no.
PHI days
Paraquat mg/kg Notes Reference
CA, USA, 1988 (Manzanilla)
5.6
N/A
4
0B* 13
<0.05 <0.05 <0.05 <0.05
Fruit picked from tree Fruit, Oil, Cake Fruit Oil Cake
Roper 1989i 73CA88-526
Spain, 1987 (Picual)
0.36
0.60
0.60
1.00
500
500
500
500
1
0B* 6
17 6
17 6
17 6
17
<0.05 0.11 0.08 0.20 0.23 0.57 0.50 0.86 0.63
Analysed fruit were sprayed and picked up from ground
Kennedy 1987 VG-H.1
Spain, 1986 (Picual)
0.36
0.60
0.60
1.00
600
600
600
600
1
0B* 7
14 7
14 7
14 7
14
<0.02 0.40 0.42 0.73 0.74 2.2 2.1 3.9 4.4
Sampled from ground
Massey 1987dVG-H.2
Spain, 1999 (Hojiblanco)
1.23
1.35
336
368
1
1
0B* 7 3
<0.05
2.1 <0.05 0.77
<0.05 3.4
<0.05 1.3
<0.05
44-58% of analysed olives were on ground at treatment Fruit , unwashed Oil, from unwashed Fruit, washed Oil, from washed Fruit , unwashed Oil, from unwashed Fruit, washed Oil, from washed
Jones 2000a ES50-99-S033
Spain, 1999 (Arbequina)
1.08
1.18
293
321
1
1
0B* 3 7
<0.05
0.66 <0.05 0.66
<0.05 0.24
<0.05 0.47
<0.05
17-32% of analysed olives were on ground at treatment Fruit , unwashed Oil, from unwashed Fruit, washed Oil, from washed Fruit , unwashed Oil, from unwashed Fruit, washed Oil, from washed
ES50-99-S133
Spain 2001
(Hojiblanca)
1.09
347
1
0B* 3 7
<0.05
0.45 0.19 0.12
<0.05 <0.05 0.29
14-37% of analysed olives were on ground at treatment Whole fruit Unwashed fruit Washed fruit Virgin oil Refined oil Whole fruit
Devine et al. 2003 ES051-01-S013
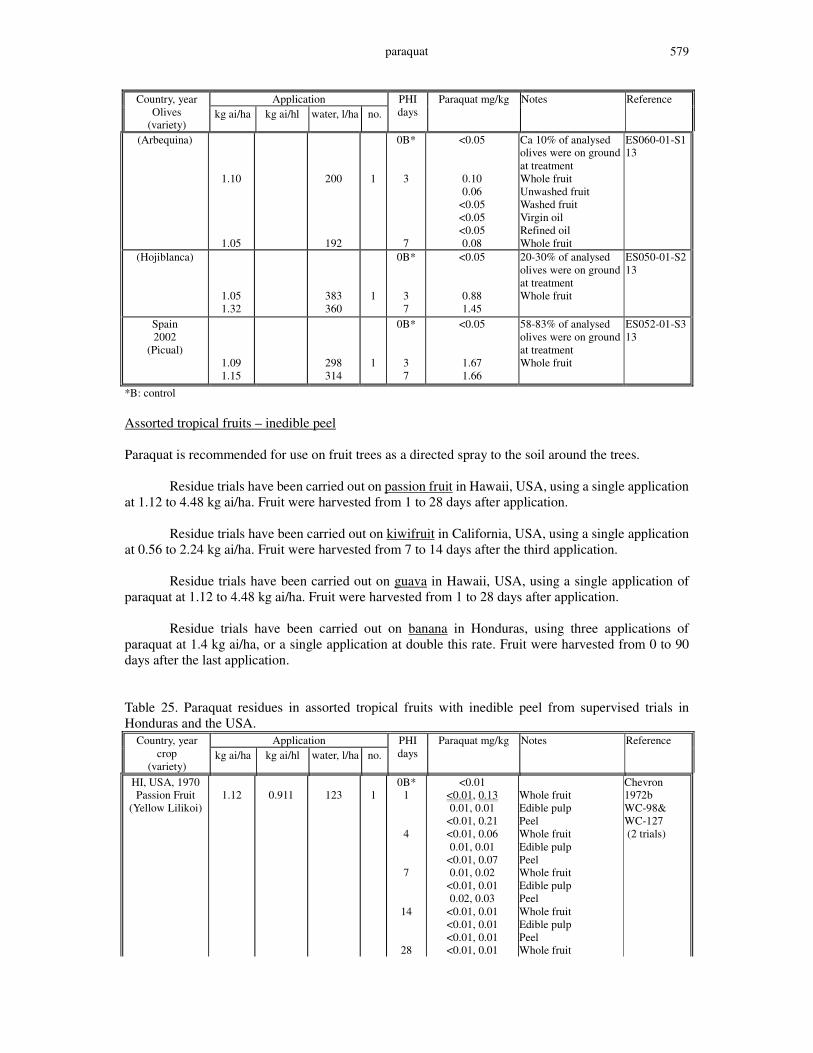
paraquat 579
Application Country, year Olives
(variety) kg ai/ha kg ai/hl water, l/ha no.
PHI days
Paraquat mg/kg Notes Reference
(Arbequina)
1.10
1.05
200
192
1
0B* 3 7
<0.05
0.10 0.06
<0.05 <0.05 <0.05 0.08
Ca 10% of analysed olives were on ground at treatment Whole fruit Unwashed fruit Washed fruit Virgin oil Refined oil Whole fruit
ES060-01-S113
(Hojiblanca)
1.05 1.32
383 360
1
0B* 3 7
<0.05
0.88 1.45
20-30% of analysed olives were on ground at treatment Whole fruit
ES050-01-S213
Spain 2002
(Picual)
1.09 1.15
298 314
1
0B* 3 7
<0.05
1.67 1.66
58-83% of analysed olives were on ground at treatment Whole fruit
ES052-01-S313
*B: control Assorted tropical fruits – inedible peel Paraquat is recommended for use on fruit trees as a directed spray to the soil around the trees. Residue trials have been carried out on passion fruit in Hawaii, USA, using a single application at 1.12 to 4.48 kg ai/ha. Fruit were harvested from 1 to 28 days after application. Residue trials have been carried out on kiwifruit in California, USA, using a single application at 0.56 to 2.24 kg ai/ha. Fruit were harvested from 7 to 14 days after the third application. Residue trials have been carried out on guava in Hawaii, USA, using a single application of paraquat at 1.12 to 4.48 kg ai/ha. Fruit were harvested from 1 to 28 days after application. Residue trials have been carried out on banana in Honduras, using three applications of paraquat at 1.4 kg ai/ha, or a single application at double this rate. Fruit were harvested from 0 to 90 days after the last application. Table 25. Paraquat residues in assorted tropical fruits with inedible peel from supervised trials in Honduras and the USA.
Application Country, year crop
(variety) kg ai/ha kg ai/hl water, l/ha no.
PHI days
Paraquat mg/kg Notes Reference
HI, USA, 1970 Passion Fruit
(Yellow Lilikoi)
1.12
0.911
123
1
0B* 1
4
7
14
28
<0.01 <0.01, 0.13 0.01, 0.01
<0.01, 0.21 <0.01, 0.06 0.01, 0.01
<0.01, 0.07 0.01, 0.02
<0.01, 0.01 0.02, 0.03
<0.01, 0.01 <0.01, 0.01 <0.01, 0.01 <0.01, 0.01
Whole fruit Edible pulp Peel Whole fruit Edible pulp Peel Whole fruit Edible pulp Peel Whole fruit Edible pulp Peel Whole fruit
Chevron 1972b WC-98& WC-127 (2 trials)
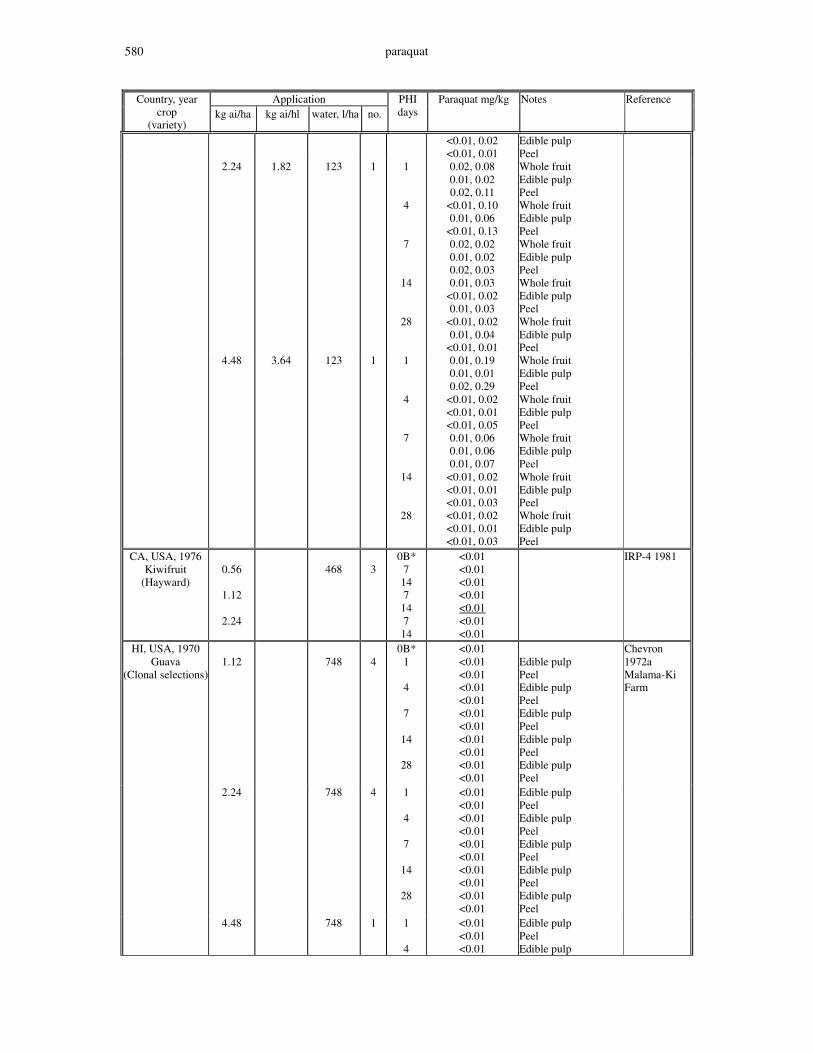
paraquat 580
Application Country, year crop
(variety) kg ai/ha kg ai/hl water, l/ha no.
PHI days
Paraquat mg/kg Notes Reference
<0.01, 0.02 <0.01, 0.01
Edible pulp Peel
2.24 1.82 123 1 1
4
7
14
28
0.02, 0.08 0.01, 0.02 0.02, 0.11
<0.01, 0.10 0.01, 0.06
<0.01, 0.13 0.02, 0.02 0.01, 0.02 0.02, 0.03 0.01, 0.03
<0.01, 0.02 0.01, 0.03
<0.01, 0.02 0.01, 0.04
<0.01, 0.01
Whole fruit Edible pulp Peel Whole fruit Edible pulp Peel Whole fruit Edible pulp Peel Whole fruit Edible pulp Peel Whole fruit Edible pulp Peel
4.48 3.64 123 1 1
4
7
14
28
0.01, 0.19 0.01, 0.01 0.02, 0.29
<0.01, 0.02 <0.01, 0.01 <0.01, 0.05 0.01, 0.06 0.01, 0.06 0.01, 0.07
<0.01, 0.02 <0.01, 0.01 <0.01, 0.03 <0.01, 0.02 <0.01, 0.01 <0.01, 0.03
Whole fruit Edible pulp Peel Whole fruit Edible pulp Peel Whole fruit Edible pulp Peel Whole fruit Edible pulp Peel Whole fruit Edible pulp Peel
CA, USA, 1976 Kiwifruit
(Hayward)
0.56
1.12
2.24
468
3
0B* 7 14 7 14 7 14
<0.01 <0.01 <0.01 <0.01 <0.01 <0.01 <0.01
IRP-4 1981
HI, USA, 1970 Guava
(Clonal selections)
1.12
748
4
0B* 1
4
7
14
28
<0.01 <0.01 <0.01 <0.01 <0.01 <0.01 <0.01 <0.01 <0.01 <0.01 <0.01
Edible pulp Peel Edible pulp Peel Edible pulp Peel Edible pulp Peel Edible pulp Peel
Chevron 1972a Malama-Ki Farm
2.24 748 4 1
4
7
14
28
<0.01 <0.01 <0.01 <0.01 <0.01 <0.01 <0.01 <0.01 <0.01 <0.01
Edible pulp Peel Edible pulp Peel Edible pulp Peel Edible pulp Peel Edible pulp Peel
4.48 748 1 1
4
<0.01 <0.01 <0.01
Edible pulp Peel Edible pulp
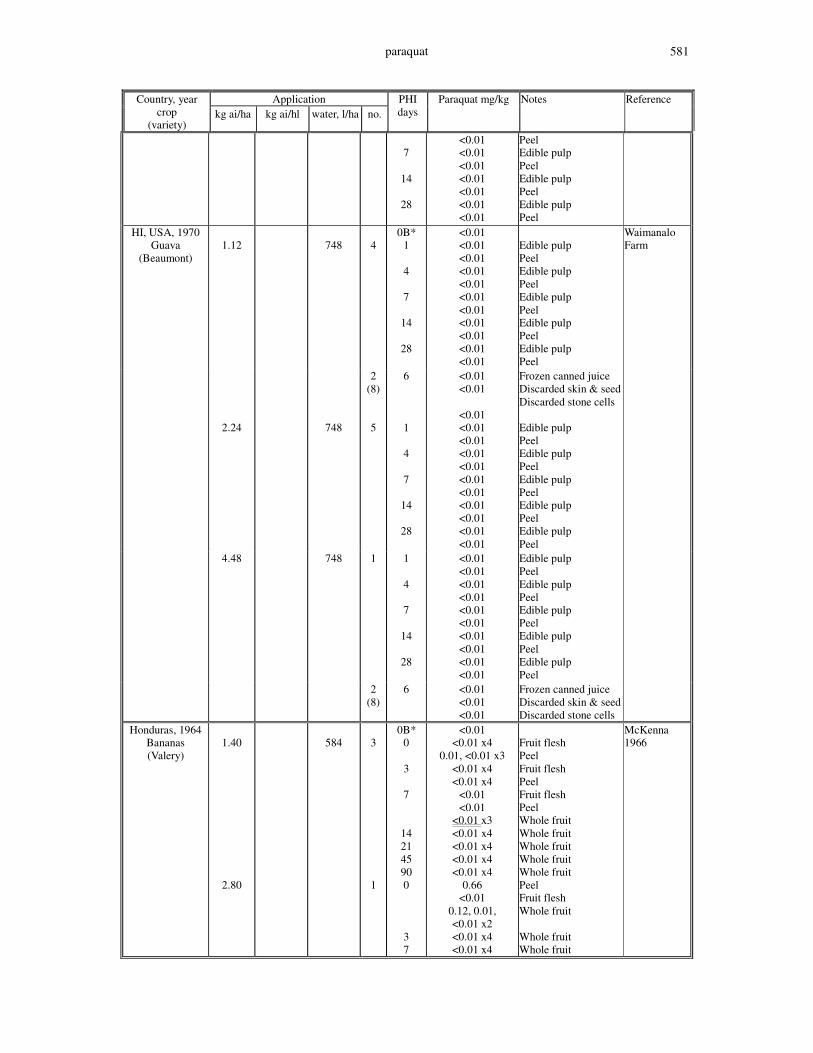
paraquat 581
Application Country, year crop
(variety) kg ai/ha kg ai/hl water, l/ha no.
PHI days
Paraquat mg/kg Notes Reference
7
14
28
<0.01 <0.01 <0.01 <0.01 <0.01 <0.01 <0.01
Peel Edible pulp Peel Edible pulp Peel Edible pulp Peel
HI, USA, 1970 Guava
(Beaumont)
1.12
748
4
0B* 1
4
7
14
28
<0.01 <0.01 <0.01 <0.01 <0.01 <0.01 <0.01 <0.01 <0.01 <0.01 <0.01
Edible pulp Peel Edible pulp Peel Edible pulp Peel Edible pulp Peel Edible pulp Peel
Waimanalo Farm
2 (8)
6 <0.01 <0.01
<0.01
Frozen canned juice Discarded skin & seed Discarded stone cells
2.24 748 5 1
4
7
14
28
<0.01 <0.01 <0.01 <0.01 <0.01 <0.01 <0.01 <0.01 <0.01 <0.01
Edible pulp Peel Edible pulp Peel Edible pulp Peel Edible pulp Peel Edible pulp Peel
4.48 748 1 1
4
7
14
28
<0.01 <0.01 <0.01 <0.01 <0.01 <0.01 <0.01 <0.01 <0.01 <0.01
Edible pulp Peel Edible pulp Peel Edible pulp Peel Edible pulp Peel Edible pulp Peel
2 (8)
6 <0.01 <0.01 <0.01
Frozen canned juice Discarded skin & seed Discarded stone cells
Honduras, 1964 Bananas (Valery)
1.40
2.80
584
3
1
0B* 0
3
7
14 21 45 90 0
3 7
<0.01 <0.01 x4
0.01, <0.01 x3 <0.01 x4 <0.01 x4
<0.01 <0.01
<0.01 x3 <0.01 x4 <0.01 x4 <0.01 x4 <0.01 x4
0.66 <0.01
0.12, 0.01, <0.01 x2 <0.01 x4 <0.01 x4
Fruit flesh Peel Fruit flesh Peel Fruit flesh Peel Whole fruit Whole fruit Whole fruit Whole fruit Whole fruit Peel Fruit flesh Whole fruit Whole fruit Whole fruit
McKenna 1966
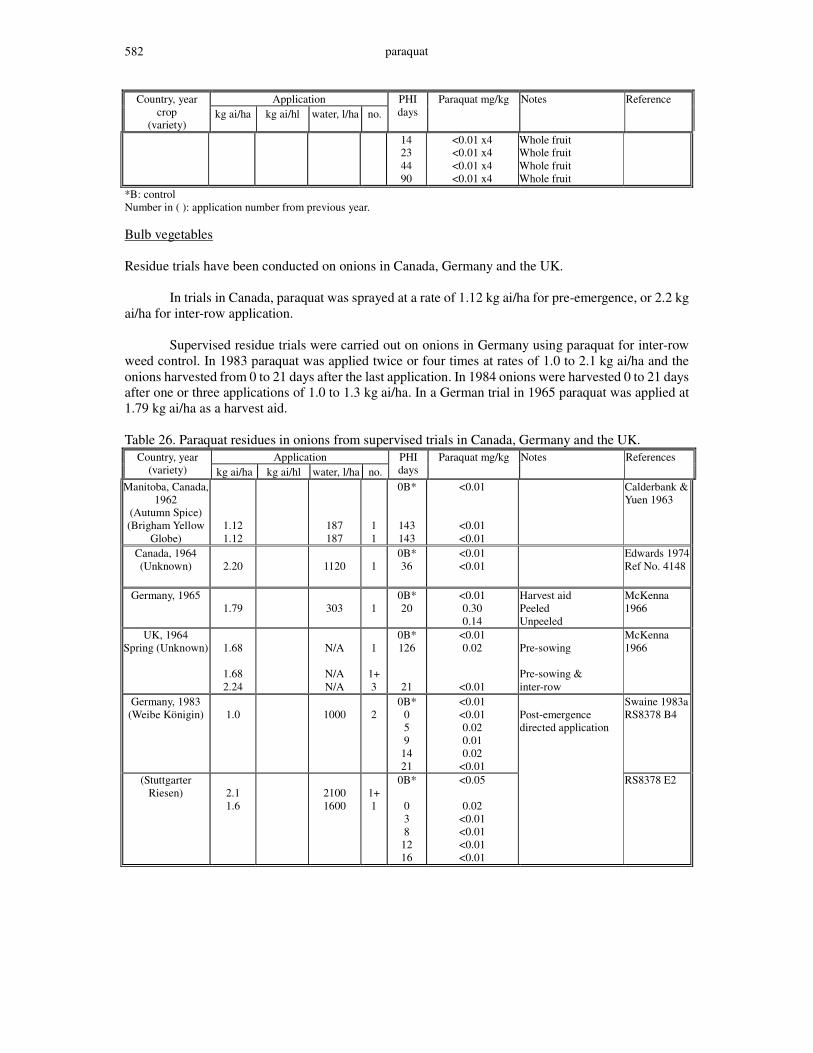
paraquat 582
Application Country, year crop
(variety) kg ai/ha kg ai/hl water, l/ha no.
PHI days
Paraquat mg/kg Notes Reference
14 23 44 90
<0.01 x4 <0.01 x4 <0.01 x4 <0.01 x4
Whole fruit Whole fruit Whole fruit Whole fruit
*B: control Number in ( ): application number from previous year. Bulb vegetables Residue trials have been conducted on onions in Canada, Germany and the UK. In trials in Canada, paraquat was sprayed at a rate of 1.12 kg ai/ha for pre-emergence, or 2.2 kg ai/ha for inter-row application. Supervised residue trials were carried out on onions in Germany using paraquat for inter-row weed control. In 1983 paraquat was applied twice or four times at rates of 1.0 to 2.1 kg ai/ha and the onions harvested from 0 to 21 days after the last application. In 1984 onions were harvested 0 to 21 days after one or three applications of 1.0 to 1.3 kg ai/ha. In a German trial in 1965 paraquat was applied at 1.79 kg ai/ha as a harvest aid. Table 26. Paraquat residues in onions from supervised trials in Canada, Germany and the UK.
Application Country, year (variety) kg ai/ha kg ai/hl water, l/ha no.
PHI days
Paraquat mg/kg Notes References
Manitoba, Canada, 1962
(Autumn Spice) (Brigham Yellow
Globe)
1.12 1.12
187 187
1 1
0B*
143 143
<0.01
<0.01 <0.01
Calderbank & Yuen 1963
Canada, 1964 (Unknown)
2.20
1120
1
0B* 36
<0.01 <0.01
Edwards 1974 Ref No. 4148
Germany, 1965
1.79
303
1
0B* 20
<0.01 0.30 0.14
Harvest aid Peeled Unpeeled
McKenna 1966
UK, 1964 Spring (Unknown)
1.68
1.68 2.24
N/A
N/A N/A
1
1+ 3
0B* 126
21
<0.01 0.02
<0.01
Pre-sowing Pre-sowing & inter-row
McKenna 1966
Germany, 1983 (Weibe Königin)
1.0
1000
2
0B* 0 5 9
14 21
<0.01 <0.01 0.02 0.01 0.02
<0.01
Post-emergence directed application
Swaine 1983a RS8378 B4
(Stuttgarter Riesen)
2.1 1.6
2100 1600
1+ 1
0B*
0 3 8
12 16
<0.05
0.02 <0.01 <0.01 <0.01 <0.01
RS8378 E2
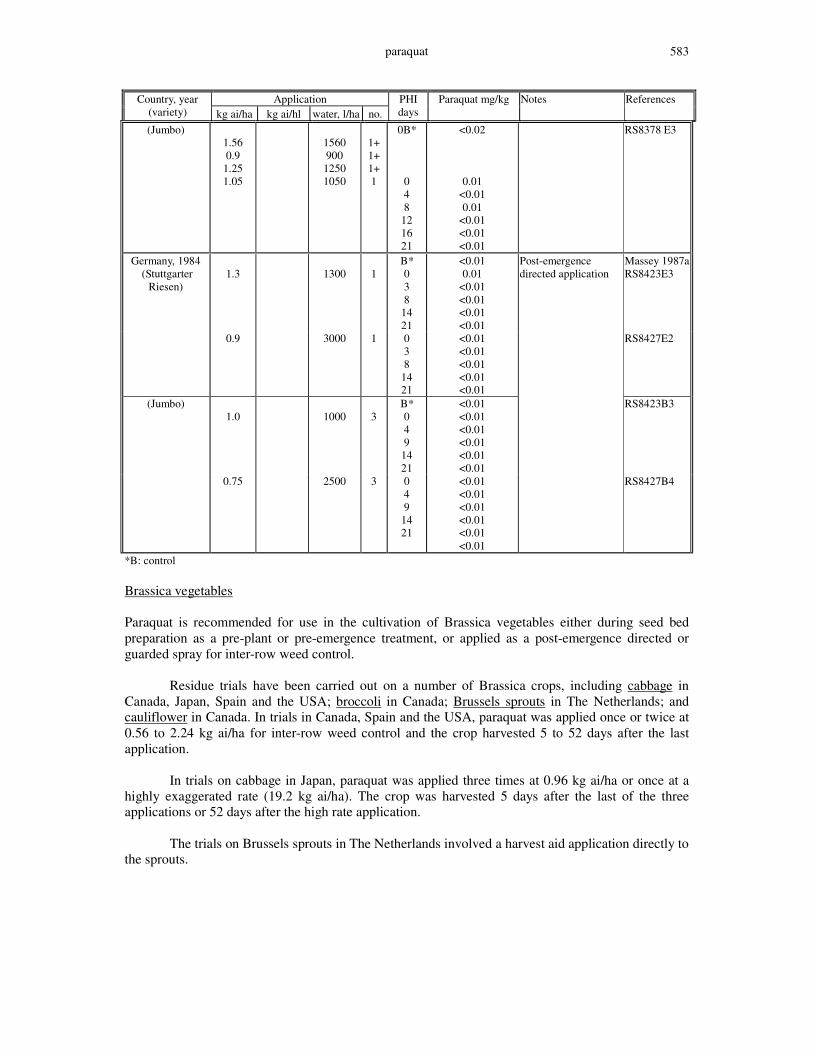
paraquat 583
Application Country, year (variety) kg ai/ha kg ai/hl water, l/ha no.
PHI days
Paraquat mg/kg Notes References
(Jumbo) 1.56 0.9
1.25 1.05
1560 900 1250 1050
1+ 1+ 1+ 1
0B*
0 4 8
12 16 21
<0.02
0.01 <0.01 0.01
<0.01 <0.01 <0.01
RS8378 E3
Germany, 1984 (Stuttgarter
Riesen)
1.3
1300
1
B* 0 3 8
14 21
<0.01 0.01
<0.01 <0.01 <0.01 <0.01
Post-emergence directed application
Massey 1987a RS8423E3
0.9 3000 1 0 3 8
14 21
<0.01 <0.01 <0.01 <0.01 <0.01
RS8427E2
(Jumbo) 1.0
1000
3
B* 0 4 9
14 21
<0.01 <0.01 <0.01 <0.01 <0.01 <0.01
RS8423B3
0.75 2500 3 0 4 9
14 21
<0.01 <0.01 <0.01 <0.01 <0.01 <0.01
RS8427B4
*B: control Brassica vegetables Paraquat is recommended for use in the cultivation of Brassica vegetables either during seed bed preparation as a pre-plant or pre-emergence treatment, or applied as a post-emergence directed or guarded spray for inter-row weed control. Residue trials have been carried out on a number of Brassica crops, including cabbage in Canada, Japan, Spain and the USA; broccoli in Canada; Brussels sprouts in The Netherlands; and cauliflower in Canada. In trials in Canada, Spain and the USA, paraquat was applied once or twice at 0.56 to 2.24 kg ai/ha for inter-row weed control and the crop harvested 5 to 52 days after the last application. In trials on cabbage in Japan, paraquat was applied three times at 0.96 kg ai/ha or once at a highly exaggerated rate (19.2 kg ai/ha). The crop was harvested 5 days after the last of the three applications or 52 days after the high rate application. The trials on Brussels sprouts in The Netherlands involved a harvest aid application directly to the sprouts.

paraquat 584
Table 27. Paraquat residues in Brassica vegetables from supervised trials in Canada, Japan, Netherlands, Spain and the USA.
Application Country, year Brassica (variety)
kg ai/ha kg ai/hl water, l/ha no. PHI days
Paraquat mg/kg Notes References
Ontario, Canada, 1964
Broccoli (Unknown)
2.2 1 0B* 36
<0.01 <0.01
McKenna 1966
Japan, 1973 Cabbage
(Taibyo Ace)
0.96 19.2
3 1
0B* 5
52
<0.03 <0.03, <0.03 <0.03, <0.03
Edwards 1974
Japan, 1973 Cabbage
(Wase Syuho)
0.96 19.2
3 1
0B* 5
52
<0.03 <0.03, <0.03 <0.03, <0.03
Spain, 1998 Cabbage
(Savoy Prince)
1.0
197
1
0B* 15
<0.05 <0.05
Coombe & Gallardo 1999 ES10-98-SH015
Spain, 1998 Cabbage
(Savoy King)
1.0
290
1
0B* 16
<0.05 <0.05
Post-emergence directed
ES10-98-SH115
Ontario, Canada, 1964
Cabbage (Copenhagen
bald)
2.2
1
0B* 51
<0.01 0.06
McKenna 1966
FL, USA, 1989 Chinese cabbage
(Joi choy)
1.05 pre
0.56
1.05 pre 0.56
280
1+ 3
1+ 3
0B*
21
21
<0.05
<0.05, <0.05, <0.05, <0.05
<0.05, <0.05,
0.06, 0.07
1 pre & 3 post-emergence directed applications
Choban 1991
Ontario, Canada, 1964
Cauliflower (unknown)
2.2 1 0B* 45
<0.01 <0.01
McKenna 1966
Netherlands, 1965 Brussel spout (Unknown)
1.2
1
0B* 31 31
<0.01 1.6 7.3
Harvest aid Peeled spouts Unpeeled sprouts
McKenna 1966
*B: control Fruiting vegetables Paraquat is recommended for use in the cultivation of fruiting vegetables, either during seed bed preparation as a pre-plant or pre-emergence treatment, or applied as a post-emergence directed or guarded spray for inter-row weed control. Numerous residue trials have been carried out on cucumbers, melons and summer squash in the USA, on tomatoes in Canada and the USA, and on peppers in Canada and the USA. In residue trials on cucumbers, melons and squash in California, USA, paraquat was applied at 1.12 kg ai/ha pre-emergence followed by three inter-row applications at 0.56 kg ai/ha. The trials in Canada on tomatoes were for pre-emergence (or pre-planting) weed control in which paraquat was used at a low rate (0.11 kg ai/ha) in combination with residual herbicides. The trials on tomatoes in the USA were generally with post-emergence directed application at 0.56 to 2.24 kg/ha, but also involved an exaggerated single high rate (11.2 kg ai/ha) pre-emergence or applications of 1.12
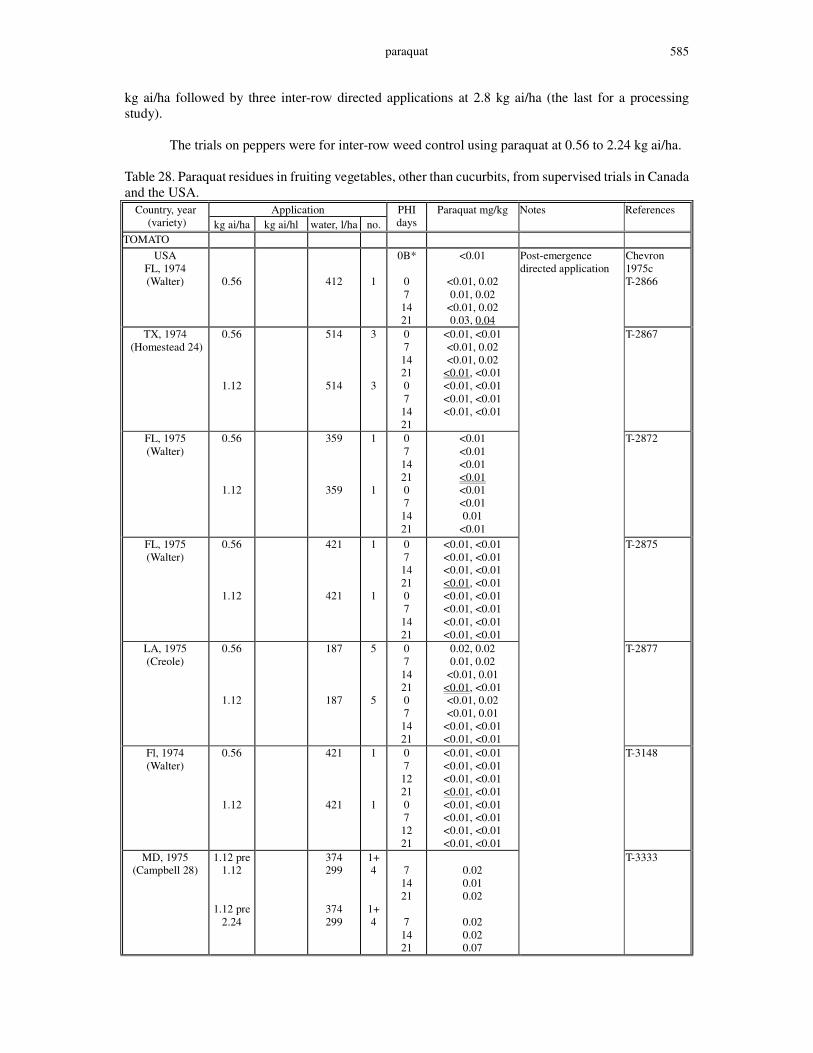
paraquat 585
kg ai/ha followed by three inter-row directed applications at 2.8 kg ai/ha (the last for a processing study). The trials on peppers were for inter-row weed control using paraquat at 0.56 to 2.24 kg ai/ha. Table 28. Paraquat residues in fruiting vegetables, other than cucurbits, from supervised trials in Canada and the USA.
Application Country, year (variety) kg ai/ha kg ai/hl water, l/ha no.
PHI days
Paraquat mg/kg Notes References
TOMATO USA
FL, 1974 (Walter)
0.56
412
1
0B*
0 7 14 21
<0.01
<0.01, 0.02 0.01, 0.02
<0.01, 0.02 0.03, 0.04
Post-emergence directed application
Chevron 1975c T-2866
TX, 1974 (Homestead 24)
0.56
1.12
514
514
3 3
0 7 14 21 0 7 14 21
<0.01, <0.01 <0.01, 0.02 <0.01, 0.02
<0.01, <0.01 <0.01, <0.01 <0.01, <0.01 <0.01, <0.01
T-2867
FL, 1975 (Walter)
0.56
1.12
359
359
1 1
0 7 14 21 0 7 14 21
<0.01 <0.01 <0.01 <0.01 <0.01 <0.01 0.01
<0.01
T-2872
FL, 1975 (Walter)
0.56
1.12
421
421
1 1
0 7 14 21 0 7 14 21
<0.01, <0.01 <0.01, <0.01 <0.01, <0.01 <0.01, <0.01 <0.01, <0.01 <0.01, <0.01 <0.01, <0.01 <0.01, <0.01
T-2875
LA, 1975 (Creole)
0.56
1.12
187
187
5 5
0 7 14 21 0 7 14 21
0.02, 0.02 0.01, 0.02
<0.01, 0.01 <0.01, <0.01 <0.01, 0.02 <0.01, 0.01
<0.01, <0.01 <0.01, <0.01
T-2877
Fl, 1974 (Walter)
0.56
1.12
421
421
1 1
0 7 12 21 0 7 12 21
<0.01, <0.01 <0.01, <0.01 <0.01, <0.01 <0.01, <0.01 <0.01, <0.01 <0.01, <0.01 <0.01, <0.01 <0.01, <0.01
T-3148
MD, 1975 (Campbell 28)
1.12 pre 1.12
1.12 pre 2.24
374 299
374 299
1+ 4
1+ 4
7 14 21
7 14 21
0.02 0.01 0.02
0.02 0.02 0.07
T-3333

paraquat 586
Application Country, year (variety) kg ai/ha kg ai/hl water, l/ha no.
PHI days
Paraquat mg/kg Notes References
CA, USA, 1988 (Jack Pot)
1 pre+3 post-emergence directed applications
Roper 1989q 18CA88-789
1.12pre 2.8
1+ 3
B*
30
<0.005 <0.005 <0.025 <0.025 <0.05
<0.005 <0.005 <0.025 <0.025 <0.05
Unwashed tomato Juice Catsup Wet pomace Dry Pomace Unwashed tomato Juice Ketchup Wet pomace Dry Pomace
(Jack Pot)
1.12pre 2.8
1+ 3
B*
30
<0.005 <0.005 <0.025 <0.025 <0.05
<0.005 <0.005 <0.025 <0.025 <0.05
Unwashed tomato Juice Catsup Wet pomace Dry Pomace Unwashed tomato Juice Catsup Wet pomace Dry Pomace
18CA88-790
Ontario, Canada, 1963
(Heinz 1350)
0.11 0.22
1348 1122
1
0B* 69 69
<0.01 <0.01 <0.01
(Heinz 1350) 0.11
1122
1
0B* 71
<0.01 <0.01, <0.01, <0.01
Post-emergence directed application
Calderbank McKenna 1964
FL, USA 1987
(Unknown)
11.2 1 0B* 76
<0.01 <0.01
Roper 1989h 75FL-87-517E
CA, USA 1987
(Unknown)
11.2 1 0B* 87
<0.01 <0.01
Pre-emergence application
45CA-87-518
PEPPERS USA
FL, 1975 Sweet pepper
(Early Cal Wonder)
0.56
1.12
421
421
1 1
0B*
0 7 12 21 0 7 12 21
<0.01
<0.01, <0.01 <0.01, <0.01 <0.01, <0.01 <0.01, <0.01 <0.01, <0.01 <0.01, <0.01 <0.01, <0.01 <0.01, <0.01
Chevron 1975c T-2868
TX, 1974 Sweet pepper
(Yolo Wonder 34)
0.56
1.12
514
514
3 3
0 7 12 21 0 7 12 21
<0.01, <0.01 <0.01, <0.01 <0.01, <0.01
0.01, 0.01 0.01, 0.03
<0.01, <0.01 <0.01, <0.01 <0.01, 0.02
Post-emergence directed application
T-2869
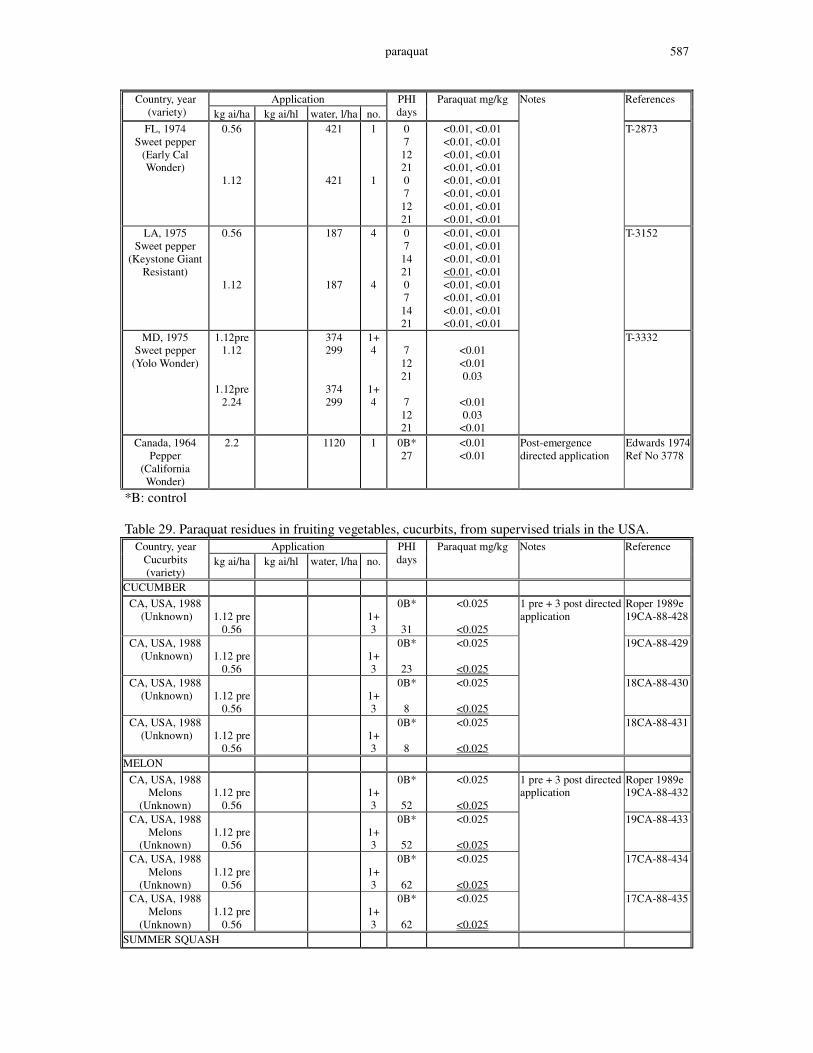
paraquat 587
Application Country, year (variety) kg ai/ha kg ai/hl water, l/ha no.
PHI days
Paraquat mg/kg Notes References
FL, 1974 Sweet pepper
(Early Cal Wonder)
0.56
1.12
421
421
1 1
0 7 12 21 0 7 12 21
<0.01, <0.01 <0.01, <0.01 <0.01, <0.01 <0.01, <0.01 <0.01, <0.01 <0.01, <0.01 <0.01, <0.01 <0.01, <0.01
T-2873
LA, 1975 Sweet pepper
(Keystone Giant Resistant)
0.56
1.12
187
187
4 4
0 7 14 21 0 7 14 21
<0.01, <0.01 <0.01, <0.01 <0.01, <0.01 <0.01, <0.01 <0.01, <0.01 <0.01, <0.01 <0.01, <0.01 <0.01, <0.01
T-3152
MD, 1975 Sweet pepper
(Yolo Wonder)
1.12pre 1.12
1.12pre 2.24
374 299
374 299
1+ 4
1+ 4
7 12 21
7 12 21
<0.01 <0.01 0.03
<0.01 0.03
<0.01
T-3332
Canada, 1964 Pepper
(California Wonder)
2.2 1120 1 0B* 27
<0.01 <0.01
Post-emergence directed application
Edwards 1974 Ref No 3778
*B: control Table 29. Paraquat residues in fruiting vegetables, cucurbits, from supervised trials in the USA.
Application Country, year Cucurbits (variety)
kg ai/ha kg ai/hl water, l/ha no. PHI days
Paraquat mg/kg Notes Reference
CUCUMBER CA, USA, 1988
(Unknown)
1.12 pre 0.56
1+ 3
0B*
31
<0.025
<0.025
Roper 1989e 19CA-88-428
CA, USA, 1988 (Unknown)
1.12 pre
0.56
1+ 3
0B*
23
<0.025
<0.025
19CA-88-429
CA, USA, 1988 (Unknown)
1.12 pre
0.56
1+ 3
0B*
8
<0.025
<0.025
18CA-88-430
CA, USA, 1988 (Unknown)
1.12 pre
0.56
1+ 3
0B*
8
<0.025
<0.025
1 pre + 3 post directed application
18CA-88-431
MELON CA, USA, 1988
Melons (Unknown)
1.12 pre
0.56
1+ 3
0B*
52
<0.025
<0.025
Roper 1989e 19CA-88-432
CA, USA, 1988 Melons
(Unknown)
1.12 pre
0.56
1+ 3
0B*
52
<0.025
<0.025
19CA-88-433
CA, USA, 1988 Melons
(Unknown)
1.12 pre
0.56
1+ 3
0B*
62
<0.025
<0.025
17CA-88-434
CA, USA, 1988 Melons
(Unknown)
1.12 pre
0.56
1+ 3
0B*
62
<0.025
<0.025
1 pre + 3 post directed application
17CA-88-435
SUMMER SQUASH

paraquat 588
Application Country, year Cucurbits (variety)
kg ai/ha kg ai/hl water, l/ha no. PHI days
Paraquat mg/kg Notes Reference
CA, USA, 1988 Summer Squash
(Unknown)
1.12 pre
0.56
1+ 3
0B*
8
<0.025
<0.025
Roper 1989e 18CA-88-436
CA, USA, 1988 Summer Squash
(Unknown)
1.12 pre
0.56
1+ 3
0B*
8
<0.025
<0.025
18CA-88-437
CA, USA, 1988 Summer Squash
(Unknown)
1.12 pre
0.56
1+ 3
0B*
8
<0.025
<0.025
18CA-88-438
CA, USA, 1988 Summer Squash
(Unknown)
1.12 pre
0.56
1+ 3
0B*
33
<0.025
<0.025
1 pre + 3 post directed application
17CA-88-439
*B: control Leafy vegetables Paraquat is recommended for use in the cultivation of leafy vegetables either during seed bed preparation as a pre-plant or pre-emergence treatment, or applied as a post-emergence directed or guarded spray for inter-row weed control. Residue trials on lettuce have been carried out in Canada, Germany, Spain, the UK and the USA at rates of 0.42 to 2.24 kg/ha, and lettuce was sampled 0 to 147 days after application. In most of these trials, the whole lettuce head was analysed without removal of the outer wrapper leaves. Residue trials on kale have been carried out in France, Italy and the UK at rates of 1.0 to 2.24 kg/ha, and kale was sampled 0 to 147 days after application. In trials in France and Italy, the residue levels of paraquat immediately after spray drying (0 days) represent a worst-case situation. Six trials on turnip greens were carried out in the USA at a rate of 1.12 kg/ha pre-emergence and tops were sampled 55 to 128 days after application. Table 30. Paraquat residues in leafy vegetables from supervised trials in Canada, France, Germany, Italy, Spain, the UK and the USA.
Application Country, year (variety) kg ai/ha kg ai/hl water, l/ha no.
PHI days
Paraquat mg/kg
Notes and references
LETTUCE Ontario, Canada,
1964 (Mixed)
2.24 2.24 1.12 2.24 1.12 0.49 0.97
935 935 935 935 935 468 468
1 1 1 1 1 1 1
0B* 36 55 55 55 55 71 71
<0.01 <0.01 0.08 0.05 0.05 0.04 0.01 0.01
UK, 1965 (Unknown)
0.841
0.841
0.841
N/A
N/A
N/A
1
1
1
0B*
39
58
72
<0.01 <0.01 0.01
<0.01 0.02
<0.01 <0.01 <0.01
Head, unwashed Head, washed Head, unwashed Head, washed Head, unwashed Head, washed Head, unwashed Head, washed
UK, 1964 (Unknown)
1.68 pre
2.24
N/A N/A
1+ 2
0B*
46
<0.01
0.02, 0.03
Head
McKenna 1966 Pre-emergence
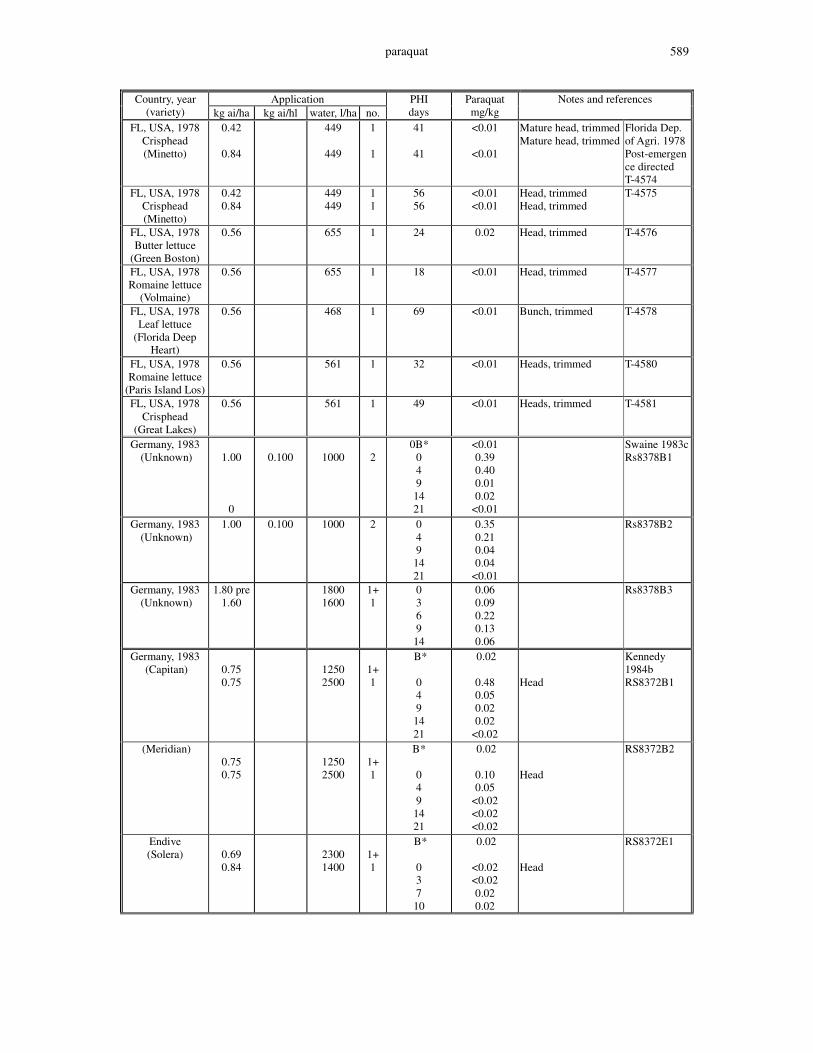
paraquat 589
Application Country, year (variety) kg ai/ha kg ai/hl water, l/ha no.
PHI days
Paraquat mg/kg
Notes and references
FL, USA, 1978 Crisphead (Minetto)
0.42
0.84
449
449
1
1
41
41
<0.01
<0.01
Mature head, trimmed Mature head, trimmed
Florida Dep. of Agri. 1978 Post-emergence directed T-4574
FL, USA, 1978 Crisphead (Minetto)
0.42 0.84
449 449
1 1
56 56
<0.01 <0.01
Head, trimmed Head, trimmed
T-4575
FL, USA, 1978 Butter lettuce
(Green Boston)
0.56 655 1 24 0.02 Head, trimmed T-4576
FL, USA, 1978 Romaine lettuce
(Volmaine)
0.56 655 1 18 <0.01 Head, trimmed T-4577
FL, USA, 1978 Leaf lettuce
(Florida Deep Heart)
0.56 468 1 69 <0.01 Bunch, trimmed T-4578
FL, USA, 1978 Romaine lettuce
(Paris Island Los)
0.56 561 1 32 <0.01 Heads, trimmed T-4580
FL, USA, 1978 Crisphead
(Great Lakes)
0.56 561 1 49 <0.01 Heads, trimmed T-4581
Germany, 1983 (Unknown)
1.00
0
0.100
1000
2
0B* 0 4 9 14 21
<0.01 0.39 0.40 0.01 0.02
<0.01
Swaine 1983c Rs8378B1
Germany, 1983 (Unknown)
1.00
0.100
1000
2
0 4 9 14 21
0.35 0.21 0.04 0.04
<0.01
Rs8378B2
Germany, 1983 (Unknown)
1.80 pre 1.60
1800 1600
1+ 1
0 3 6 9 14
0.06 0.09 0.22 0.13 0.06
Rs8378B3
Germany, 1983 (Capitan)
0.75 0.75
1250 2500
1+ 1
B*
0 4 9 14 21
0.02
0.48 0.05 0.02 0.02
<0.02
Head
Kennedy 1984b RS8372B1
(Meridian) 0.75 0.75
1250 2500
1+ 1
B*
0 4 9 14 21
0.02
0.10 0.05
<0.02 <0.02 <0.02
Head
RS8372B2
Endive (Solera)
0.69 0.84
2300 1400
1+ 1
B*
0 3 7 10
0.02
<0.02 <0.02 0.02 0.02
Head
RS8372E1
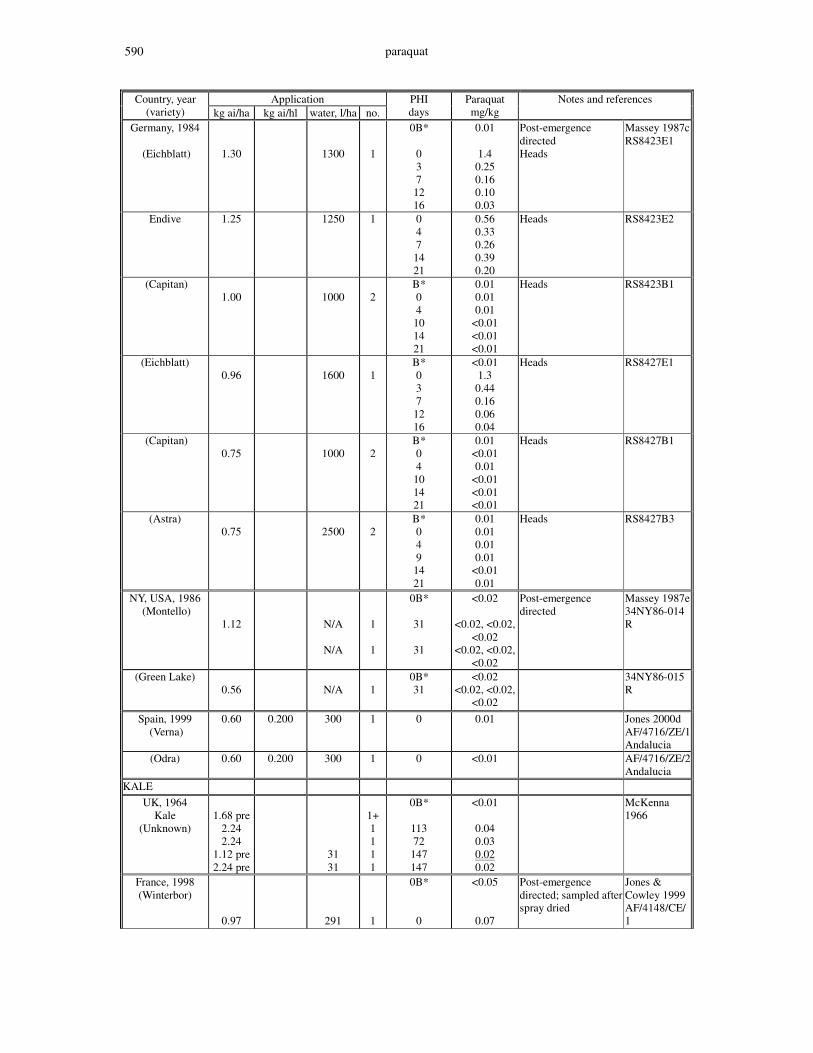
paraquat 590
Application Country, year (variety) kg ai/ha kg ai/hl water, l/ha no.
PHI days
Paraquat mg/kg
Notes and references
Germany, 1984
(Eichblatt)
1.30
1300
1
0B*
0 3 7 12 16
0.01
1.4 0.25 0.16 0.10 0.03
Post-emergence directed Heads
Massey 1987c RS8423E1
Endive
1.25
1250
1 0 4 7 14 21
0.56 0.33 0.26 0.39 0.20
Heads
RS8423E2
(Capitan) 1.00
1000
2
B* 0 4 10 14 21
0.01 0.01 0.01
<0.01 <0.01 <0.01
Heads
RS8423B1
(Eichblatt)
0.96
1600
1
B* 0 3 7 12 16
<0.01 1.3 0.44 0.16 0.06 0.04
Heads
RS8427E1
(Capitan)
0.75
1000
2
B* 0 4 10 14 21
0.01 <0.01 0.01
<0.01 <0.01 <0.01
Heads
RS8427B1
(Astra)
0.75
2500
2
B* 0 4 9 14 21
0.01 0.01 0.01 0.01
<0.01 0.01
Heads
RS8427B3
NY, USA, 1986 (Montello)
1.12
N/A
N/A
1
1
0B*
31
31
<0.02
<0.02, <0.02, <0.02
<0.02, <0.02, <0.02
Post-emergence directed
Massey 1987e 34NY86-014R
(Green Lake) 0.56
N/A
1
0B* 31
<0.02 <0.02, <0.02,
<0.02
34NY86-015R
Spain, 1999 (Verna)
0.60 0.200 300 1 0 0.01 Jones 2000d AF/4716/ZE/1 Andalucia
(Odra) 0.60 0.200 300 1 0 <0.01 AF/4716/ZE/2 Andalucia
KALE UK, 1964
Kale (Unknown)
1.68 pre
2.24 2.24
1.12 pre 2.24 pre
31 31
1+ 1 1 1 1
0B*
113 72
147 147
<0.01
0.04 0.03 0.02 0.02
McKenna 1966
France, 1998 (Winterbor)
0.97
291
1
0B*
0
<0.05
0.07
Post-emergence directed; sampled after spray dried
Jones & Cowley 1999 AF/4148/CE/1
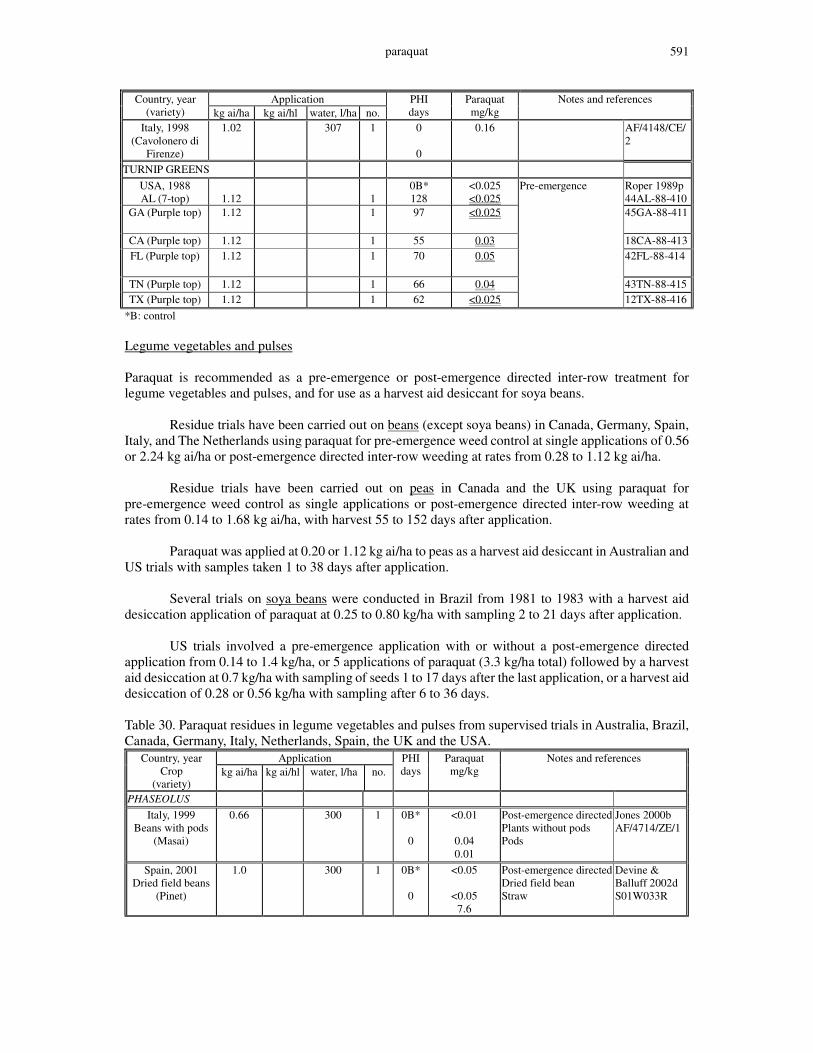
paraquat 591
Application Country, year (variety) kg ai/ha kg ai/hl water, l/ha no.
PHI days
Paraquat mg/kg
Notes and references
Italy, 1998 (Cavolonero di
Firenze)
1.02 307 1
0
0
0.16 AF/4148/CE/2
TURNIP GREENS USA, 1988 AL (7-top)
1.12
1
0B* 128
<0.025 <0.025
Roper 1989p 44AL-88-410
GA (Purple top) 1.12 1 97
<0.025 45GA-88-411
CA (Purple top) 1.12 1 55 0.03 18CA-88-413 FL (Purple top) 1.12 1 70
0.05 42FL-88-414
TN (Purple top) 1.12 1 66 0.04 43TN-88-415 TX (Purple top) 1.12 1 62 <0.025
Pre-emergence
12TX-88-416 *B: control Legume vegetables and pulses Paraquat is recommended as a pre-emergence or post-emergence directed inter-row treatment for legume vegetables and pulses, and for use as a harvest aid desiccant for soya beans. Residue trials have been carried out on beans (except soya beans) in Canada, Germany, Spain, Italy, and The Netherlands using paraquat for pre-emergence weed control at single applications of 0.56 or 2.24 kg ai/ha or post-emergence directed inter-row weeding at rates from 0.28 to 1.12 kg ai/ha. Residue trials have been carried out on peas in Canada and the UK using paraquat for pre-emergence weed control as single applications or post-emergence directed inter-row weeding at rates from 0.14 to 1.68 kg ai/ha, with harvest 55 to 152 days after application. Paraquat was applied at 0.20 or 1.12 kg ai/ha to peas as a harvest aid desiccant in Australian and US trials with samples taken 1 to 38 days after application. Several trials on soya beans were conducted in Brazil from 1981 to 1983 with a harvest aid desiccation application of paraquat at 0.25 to 0.80 kg/ha with sampling 2 to 21 days after application. US trials involved a pre-emergence application with or without a post-emergence directed application from 0.14 to 1.4 kg/ha, or 5 applications of paraquat (3.3 kg/ha total) followed by a harvest aid desiccation at 0.7 kg/ha with sampling of seeds 1 to 17 days after the last application, or a harvest aid desiccation of 0.28 or 0.56 kg/ha with sampling after 6 to 36 days. Table 30. Paraquat residues in legume vegetables and pulses from supervised trials in Australia, Brazil, Canada, Germany, Italy, Netherlands, Spain, the UK and the USA.
Application Country, year Crop
(variety) kg ai/ha kg ai/hl water, l/ha no.
PHI days
Paraquat mg/kg
Notes and references
PHASEOLUS Italy, 1999
Beans with pods (Masai)
0.66 300 1 0B*
0
<0.01
0.04 0.01
Post-emergence directed Plants without pods Pods
Jones 2000b AF/4714/ZE/1
Spain, 2001 Dried field beans
(Pinet)
1.0 300 1 0B*
0
<0.05
<0.05 7.6
Post-emergence directed Dried field bean Straw
Devine & Balluff 2002d S01W033R
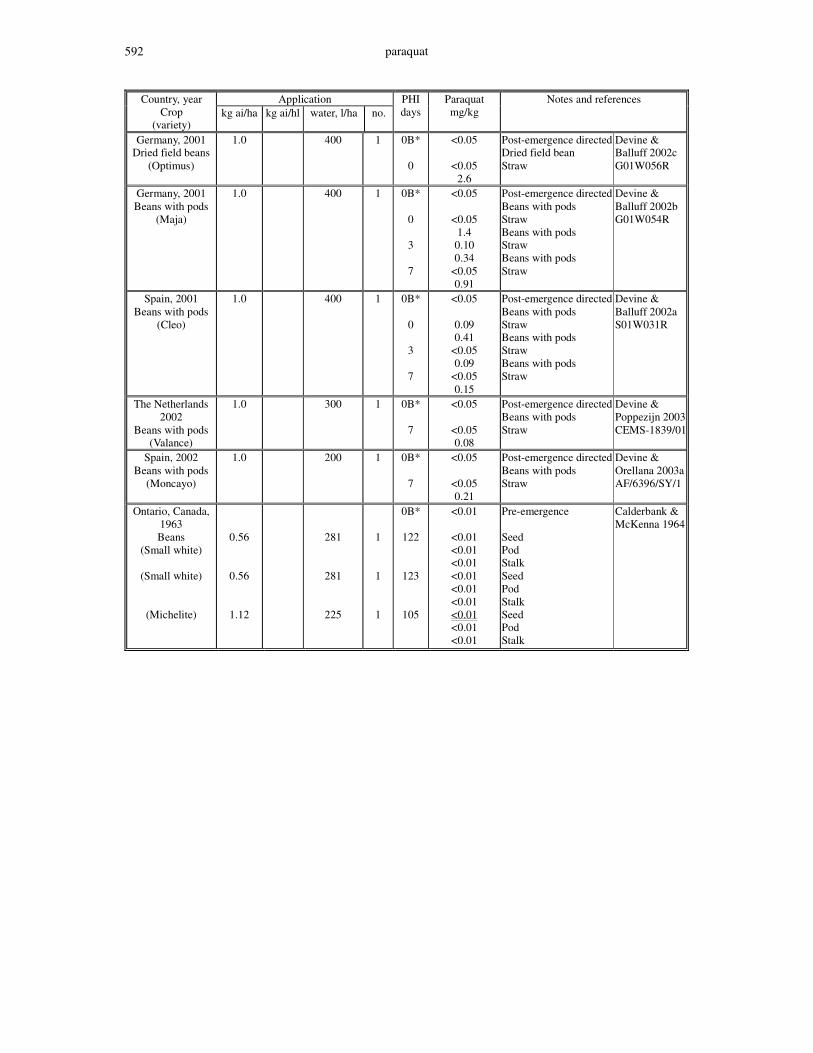
paraquat 592
Application Country, year Crop
(variety) kg ai/ha kg ai/hl water, l/ha no.
PHI days
Paraquat mg/kg
Notes and references
Germany, 2001 Dried field beans
(Optimus)
1.0 400 1 0B*
0
<0.05
<0.05 2.6
Post-emergence directed Dried field bean Straw
Devine & Balluff 2002c G01W056R
Germany, 2001 Beans with pods
(Maja)
1.0 400 1 0B*
0
3
7
<0.05
<0.05 1.4 0.10 0.34
<0.05 0.91
Post-emergence directed Beans with pods Straw Beans with pods Straw Beans with pods Straw
Devine & Balluff 2002b G01W054R
Spain, 2001 Beans with pods
(Cleo)
1.0 400 1 0B*
0
3
7
<0.05
0.09 0.41
<0.05 0.09
<0.05 0.15
Post-emergence directed Beans with pods Straw Beans with pods Straw Beans with pods Straw
Devine & Balluff 2002a S01W031R
The Netherlands 2002
Beans with pods (Valance)
1.0 300 1 0B*
7
<0.05
<0.05 0.08
Post-emergence directed Beans with pods Straw
Devine & Poppezijn 2003 CEMS-1839/01
Spain, 2002 Beans with pods
(Moncayo)
1.0 200 1 0B*
7
<0.05
<0.05 0.21
Post-emergence directed Beans with pods Straw
Devine & Orellana 2003a AF/6396/SY/1
Ontario, Canada, 1963 Beans
(Small white)
(Small white)
(Michelite)
0.56
0.56
1.12
281
281
225
1
1
1
0B*
122
123
105
<0.01
<0.01 <0.01 <0.01 <0.01 <0.01 <0.01 <0.01 <0.01 <0.01
Pre-emergence Seed Pod Stalk Seed Pod Stalk Seed Pod Stalk
Calderbank & McKenna 1964

paraquat 593
Application Country, year Crop
(variety) kg ai/ha kg ai/hl water, l/ha no.
PHI days
Paraquat mg/kg
Notes and references
Ontario, Canada, 1963 Beans
(Small white)
0.28
0.56
1.12
0.56
0.56
1.12
0.28
281
281
281
561
NA
NA
281
1
1
1
1
1
1
1
0B*
107
119
55 68 72
71
68
86 68
86
101
118
<0.01
<0.01 <0.01 <0.01 <0.01 <0.01 <0.01 <0.01 <0.01 <0.01 <0.01 <0.01 <0.01 <0.01 <0.01 <0.01 <0.01 <0.01 <0.01 <0.01 <0.01 <0.01 <0.01 <0.01 <0.01 <0.01
Post-emergence directed Seed Pods Stalk Seed Pods Stalk Seed Seed Seed Stalk Seed Pods Stalk Seed Pods Stalk Seed Pods Stalk Seed Podd Stalk Seed Pods Stalk
Calderbank & McKenna 1964 Edwards 1974
Ontario, Canada, 1964 Beans
(Small white)
1.12
468
1
0B* 60
<0.01 <0.01
Pre-emergence Seed
McKenna 1966
VICIA UK, 1964
Broad beans (unknown)
1.68pre
2.24
N/A N/A
1+ 1
0B*
71
85
<0.01
<0.01 <0.01 <0.01 0.01
Pre+post-emergence Seed Pod Seed Pod
McKenna 1966
Spain, 2000 Broad beans (Reina Mora)
0.69 314 1 0B*
0
<0.01
<0.01 <0.01
Post-emergence directed Seed Pod
Jones 2000c AF/4715/ZE/1
Spain, 2002 Fresh broad bean
(Muchamiel)
1.0 200 1 0B*
0
<0.05
<0.05 1.5
Post-emergence directed Fresh broad bean Straw with empty pods
Devine & Orellana 2003b AF/6397/SY/1
PEAS Ontario, Canada,
1963 (Lincoln)
0.56 38 1 0B* 123
<0.01 <0.01
Pre-emergence Vines
Calderbank & McKenna 1964
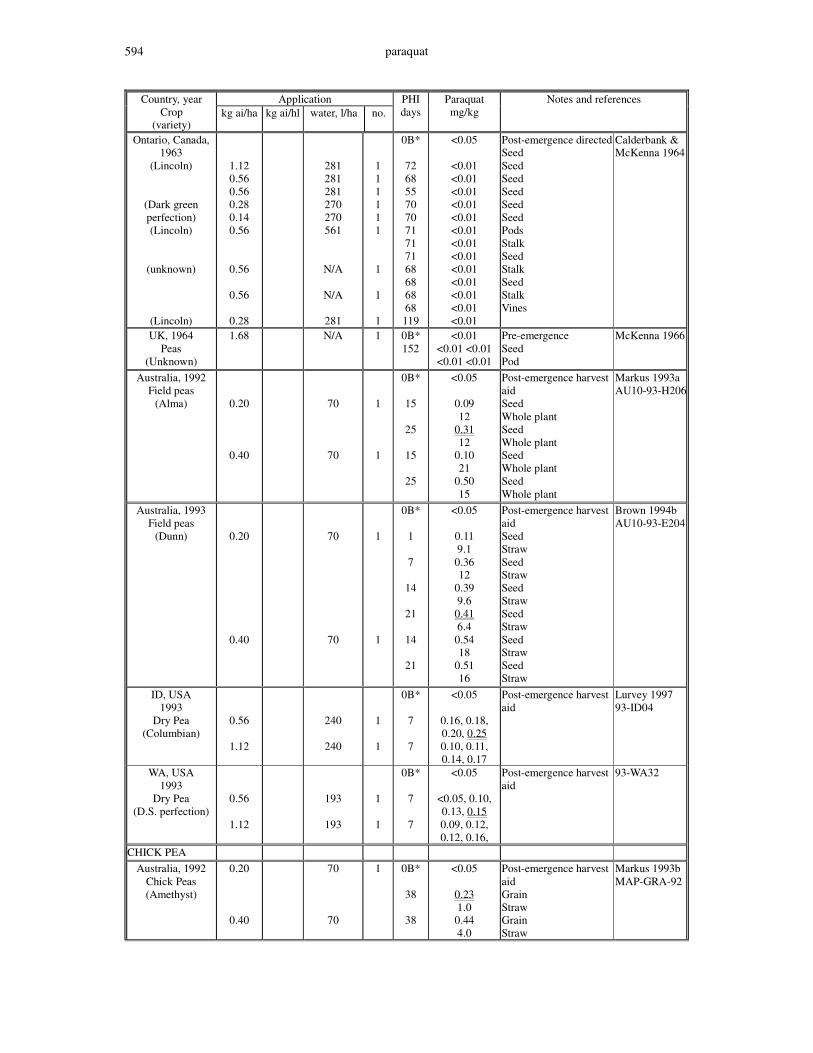
paraquat 594
Application Country, year Crop
(variety) kg ai/ha kg ai/hl water, l/ha no.
PHI days
Paraquat mg/kg
Notes and references
Ontario, Canada, 1963
(Lincoln)
(Dark green perfection) (Lincoln)
(unknown)
(Lincoln)
1.12 0.56 0.56 0.28 0.14 0.56
0.56
0.56
0.28
281 281 281 270 270 561
N/A
N/A
281
1 1 1 1 1 1
1
1
1
0B*
72 68 55 70 70 71 71 71 68 68 68 68 119
<0.05
<0.01 <0.01 <0.01 <0.01 <0.01 <0.01 <0.01 <0.01 <0.01 <0.01 <0.01 <0.01 <0.01
Post-emergence directed Seed Seed Seed Seed Seed Seed Pods Stalk Seed Stalk Seed Stalk Vines
Calderbank & McKenna 1964
UK, 1964 Peas
(Unknown)
1.68 N/A 1 0B* 152
<0.01 <0.01 <0.01 <0.01 <0.01
Pre-emergence Seed Pod
McKenna 1966
Australia, 1992 Field peas
(Alma)
0.20
0.40
70
70
1
1
0B*
15
25
15
25
<0.05
0.09 12
0.31 12
0.10 21
0.50 15
Post-emergence harvest aid Seed Whole plant Seed Whole plant Seed Whole plant Seed Whole plant
Markus 1993a AU10-93-H206
Australia, 1993 Field peas
(Dunn)
0.20
0.40
70
70
1
1
0B*
1
7
14
21
14
21
<0.05
0.11 9.1 0.36 12
0.39 9.6 0.41 6.4 0.54 18
0.51 16
Post-emergence harvest aid Seed Straw Seed Straw Seed Straw Seed Straw Seed Straw Seed Straw
Brown 1994b AU10-93-E204
ID, USA 1993
Dry Pea (Columbian)
0.56
1.12
240
240
1
1
0B*
7
7
<0.05
0.16, 0.18, 0.20, 0.25 0.10, 0.11, 0.14, 0.17
Post-emergence harvest aid
Lurvey 1997 93-ID04
WA, USA 1993
Dry Pea (D.S. perfection)
0.56
1.12
193
193
1
1
0B*
7
7
<0.05
<0.05, 0.10, 0.13, 0.15 0.09, 0.12, 0.12, 0.16,
Post-emergence harvest aid
93-WA32
CHICK PEA Australia, 1992
Chick Peas (Amethyst)
0.20
0.40
70
70
1 0B*
38
38
<0.05
0.23 1.0 0.44 4.0
Post-emergence harvest aid Grain Straw Grain Straw
Markus 1993b MAP-GRA-92
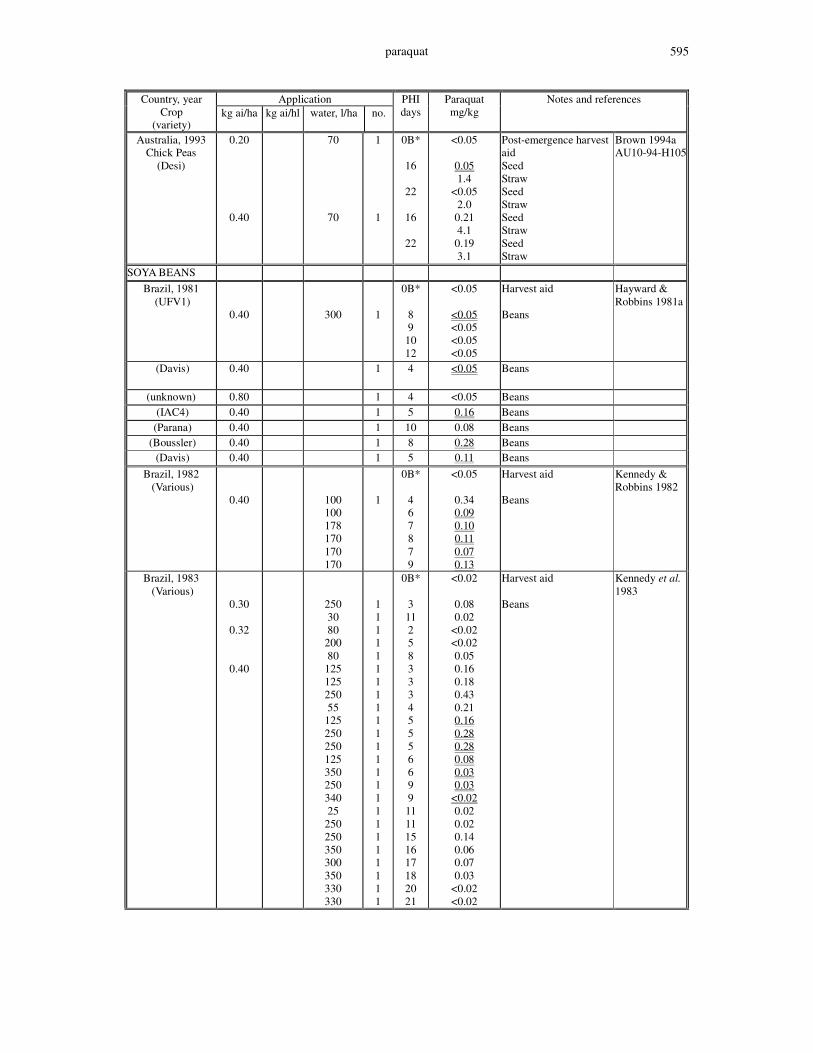
paraquat 595
Application Country, year Crop
(variety) kg ai/ha kg ai/hl water, l/ha no.
PHI days
Paraquat mg/kg
Notes and references
Australia, 1993 Chick Peas
(Desi)
0.20
0.40
70
70
1
1
0B*
16
22
16
22
<0.05
0.05 1.4
<0.05 2.0 0.21 4.1 0.19 3.1
Post-emergence harvest aid Seed Straw Seed Straw Seed Straw Seed Straw
Brown 1994a AU10-94-H105
SOYA BEANS Brazil, 1981
(UFV1)
0.40
300
1
0B*
8 9
10 12
<0.05
<0.05 <0.05 <0.05 <0.05
Harvest aid Beans
Hayward & Robbins 1981a
(Davis) 0.40
1 4 <0.05 Beans
(unknown) 0.80 1 4 <0.05 Beans (IAC4) 0.40 1 5 0.16 Beans
(Parana) 0.40 1 10 0.08 Beans (Boussler) 0.40 1 8 0.28 Beans
(Davis) 0.40 1 5 0.11 Beans Brazil, 1982 (Various)
0.40
100 100 178 170 170 170
1
0B*
4 6 7 8 7 9
<0.05
0.34 0.09 0.10 0.11 0.07 0.13
Harvest aid Beans
Kennedy & Robbins 1982
Brazil, 1983 (Various)
0.30
0.32
0.40
250 30 80
200 80
125 125 250 55
125 250 250 125 350 250 340 25
250 250 350 300 350 330 330
1 1 1 1 1 1 1 1 1 1 1 1 1 1 1 1 1 1 1 1 1 1 1 1
0B*
3 11 2 5 8 3 3 3 4 5 5 5 6 6 9 9 11 11 15 16 17 18 20 21
<0.02
0.08 0.02
<0.02 <0.02 0.05 0.16 0.18 0.43 0.21 0.16 0.28 0.28 0.08 0.03 0.03
<0.02 0.02 0.02 0.14 0.06 0.07 0.03
<0.02 <0.02
Harvest aid Beans
Kennedy et al. 1983
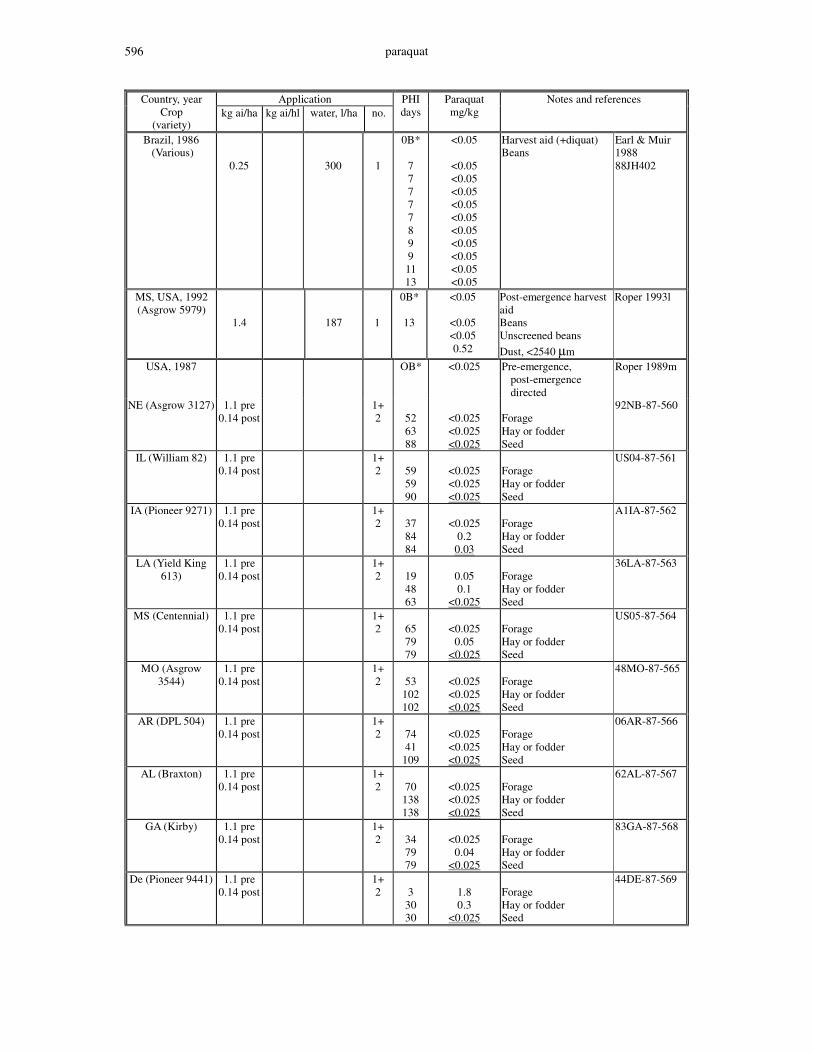
paraquat 596
Application Country, year Crop
(variety) kg ai/ha kg ai/hl water, l/ha no.
PHI days
Paraquat mg/kg
Notes and references
Brazil, 1986 (Various)
0.25
300
1
0B*
7 7 7 7 7 8 9 9 11 13
<0.05
<0.05 <0.05 <0.05 <0.05 <0.05 <0.05 <0.05 <0.05 <0.05 <0.05
Harvest aid (+diquat) Beans
Earl & Muir 1988 88JH402
MS, USA, 1992 (Asgrow 5979)
1.4
187
1
0B*
13
<0.05
<0.05 <0.05 0.52
Post-emergence harvest aid Beans Unscreened beans Dust, <2540 µm
Roper 1993l
USA, 1987 OB* <0.025 Pre-emergence, post-emergence directed
Roper 1989m
NE (Asgrow 3127) 1.1 pre 0.14 post
1+ 2
52 63 88
<0.025 <0.025 <0.025
Forage Hay or fodder Seed
92NB-87-560
IL (William 82) 1.1 pre 0.14 post
1+ 2
59 59 90
<0.025 <0.025 <0.025
Forage Hay or fodder Seed
US04-87-561
IA (Pioneer 9271) 1.1 pre 0.14 post
1+ 2
37 84 84
<0.025
0.2 0.03
Forage Hay or fodder Seed
A1IA-87-562
LA (Yield King 613)
1.1 pre 0.14 post
1+ 2
19 48 63
0.05 0.1
<0.025
Forage Hay or fodder Seed
36LA-87-563
MS (Centennial) 1.1 pre 0.14 post
1+ 2
65 79 79
<0.025
0.05 <0.025
Forage Hay or fodder Seed
US05-87-564
MO (Asgrow 3544)
1.1 pre 0.14 post
1+ 2
53
102 102
<0.025 <0.025 <0.025
Forage Hay or fodder Seed
48MO-87-565
AR (DPL 504) 1.1 pre 0.14 post
1+ 2
74 41
109
<0.025 <0.025 <0.025
Forage Hay or fodder Seed
06AR-87-566
AL (Braxton) 1.1 pre 0.14 post
1+ 2
70
138 138
<0.025 <0.025 <0.025
Forage Hay or fodder Seed
62AL-87-567
GA (Kirby) 1.1 pre 0.14 post
1+ 2
34 79 79
<0.025
0.04 <0.025
Forage Hay or fodder Seed
83GA-87-568
De (Pioneer 9441) 1.1 pre 0.14 post
1+ 2
3
30 30
1.8 0.3
<0.025
Forage Hay or fodder Seed
44DE-87-569
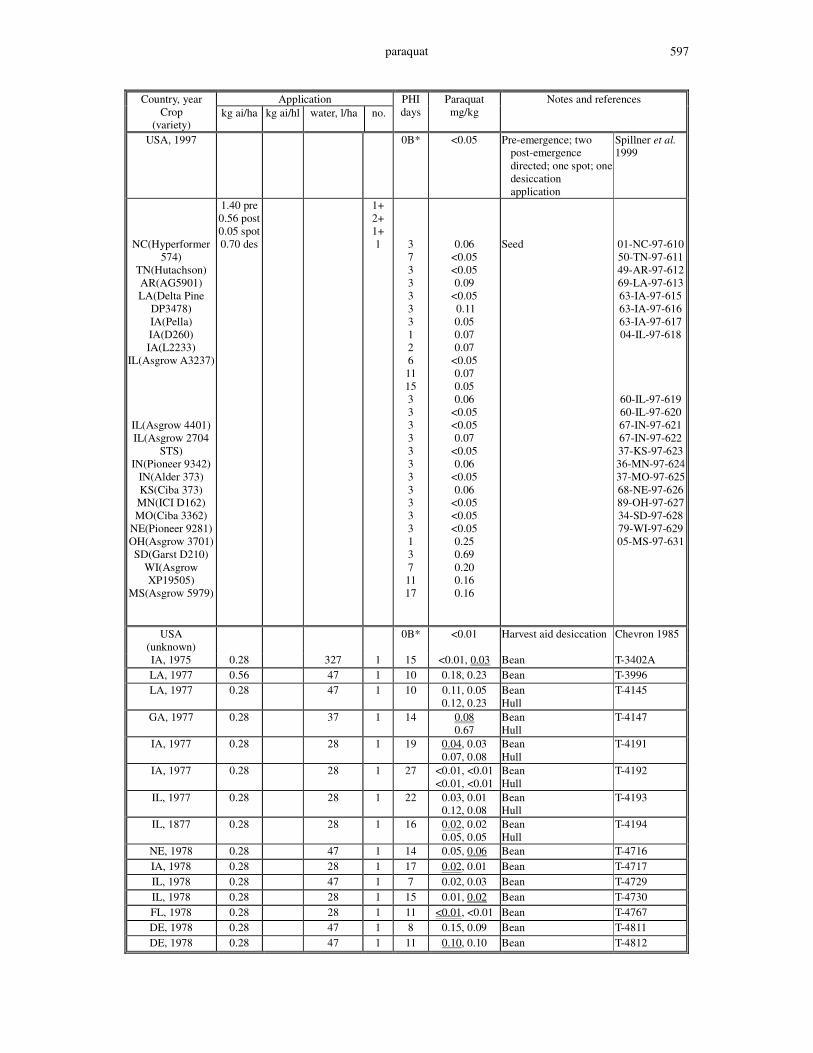
paraquat 597
Application Country, year Crop
(variety) kg ai/ha kg ai/hl water, l/ha no.
PHI days
Paraquat mg/kg
Notes and references
USA, 1997 0B* <0.05 Pre-emergence; two post-emergence directed; one spot; one desiccation application
Spillner et al. 1999
NC(Hyperformer 574)
TN(Hutachson) AR(AG5901) LA(Delta Pine
DP3478) IA(Pella) IA(D260) IA(L2233)
IL(Asgrow A3237)
IL(Asgrow 4401) IL(Asgrow 2704
STS) IN(Pioneer 9342)
IN(Alder 373) KS(Ciba 373) MN(ICI D162) MO(Ciba 3362)
NE(Pioneer 9281) OH(Asgrow 3701) SD(Garst D210)
WI(Asgrow XP19505)
MS(Asgrow 5979)
1.40 pre 0.56 post 0.05 spot 0.70 des
1+ 2+ 1+ 1
3 7 3 3 3 3 3 1 2 6 11 15 3 3 3 3 3 3 3 3 3 3 3 1 3 7 11 17
0.06 <0.05 <0.05 0.09
<0.05 0.11 0.05 0.07 0.07
<0.05 0.07 0.05 0.06
<0.05 <0.05 0.07
<0.05 0.06
<0.05 0.06
<0.05 <0.05 <0.05 0.25 0.69 0.20 0.16 0.16
Seed
01-NC-97-610 50-TN-97-611 49-AR-97-612 69-LA-97-613 63-IA-97-615 63-IA-97-616 63-IA-97-617 04-IL-97-618
60-IL-97-619 60-IL-97-620 67-IN-97-621 67-IN-97-622 37-KS-97-623 36-MN-97-624 37-MO-97-625 68-NE-97-626 89-OH-97-627 34-SD-97-628 79-WI-97-629 05-MS-97-631
USA (unknown)
0B* <0.01 Harvest aid desiccation Chevron 1985
IA, 1975 0.28 327 1 15 <0.01, 0.03 Bean T-3402A LA, 1977 0.56 47 1 10 0.18, 0.23 Bean T-3996 LA, 1977 0.28 47 1 10 0.11, 0.05
0.12, 0.23 Bean Hull
T-4145
GA, 1977 0.28 37 1 14 0.08 0.67
Bean Hull
T-4147
IA, 1977 0.28 28 1 19 0.04, 0.03 0.07, 0.08
Bean Hull
T-4191
IA, 1977 0.28 28 1 27 <0.01, <0.01 <0.01, <0.01
Bean Hull
T-4192
IL, 1977 0.28 28 1 22 0.03, 0.01 0.12, 0.08
Bean Hull
T-4193
IL, 1877 0.28 28 1 16 0.02, 0.02 0.05, 0.05
Bean Hull
T-4194
NE, 1978 0.28 47 1 14 0.05, 0.06 Bean T-4716 IA, 1978 0.28 28 1 17 0.02, 0.01 Bean T-4717 IL, 1978 0.28 47 1 7 0.02, 0.03 Bean T-4729 IL, 1978 0.28 28 1 15 0.01, 0.02 Bean T-4730 FL, 1978 0.28 28 1 11 <0.01, <0.01 Bean T-4767 DE, 1978 0.28 47 1 8 0.15, 0.09 Bean T-4811 DE, 1978 0.28 47 1 11 0.10, 0.10 Bean T-4812
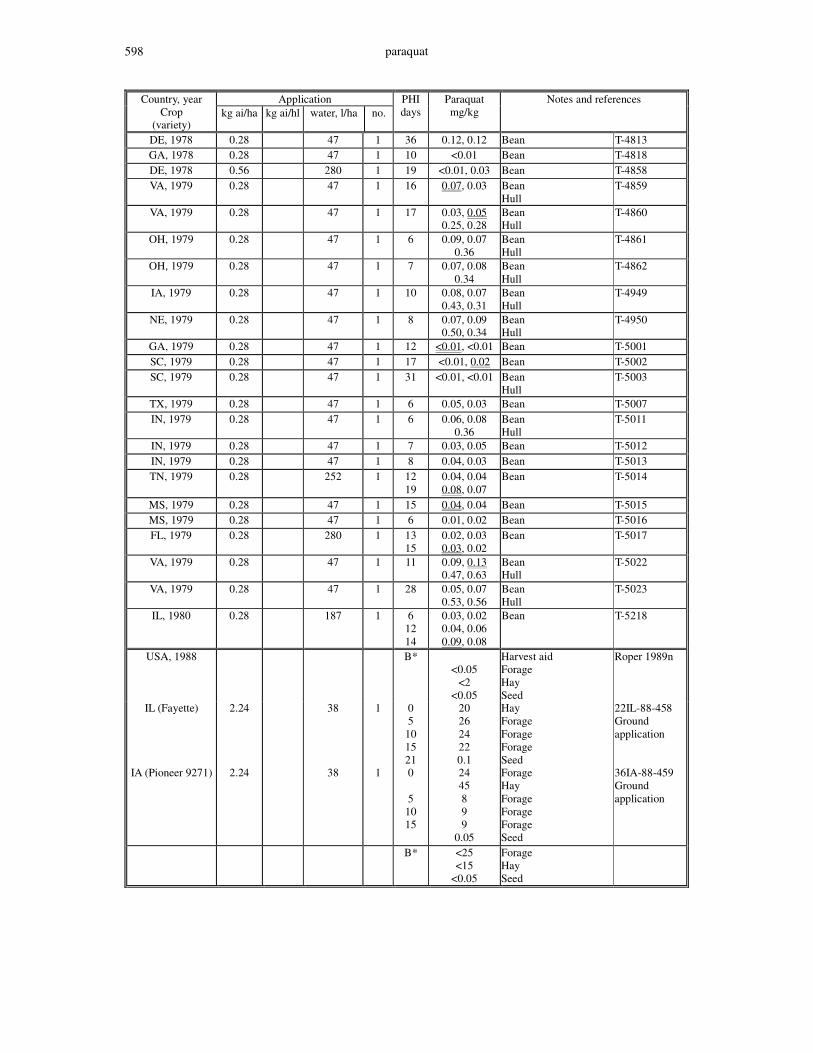
paraquat 598
Application Country, year Crop
(variety) kg ai/ha kg ai/hl water, l/ha no.
PHI days
Paraquat mg/kg
Notes and references
DE, 1978 0.28 47 1 36 0.12, 0.12 Bean T-4813 GA, 1978 0.28 47 1 10 <0.01 Bean T-4818 DE, 1978 0.56 280 1 19 <0.01, 0.03 Bean T-4858 VA, 1979 0.28 47 1 16 0.07, 0.03 Bean
Hull T-4859
VA, 1979 0.28 47 1 17 0.03, 0.05 0.25, 0.28
Bean Hull
T-4860
OH, 1979 0.28 47 1 6 0.09, 0.07 0.36
Bean Hull
T-4861
OH, 1979 0.28 47 1 7 0.07, 0.08 0.34
Bean Hull
T-4862
IA, 1979 0.28 47 1 10 0.08, 0.07 0.43, 0.31
Bean Hull
T-4949
NE, 1979 0.28 47 1 8 0.07, 0.09 0.50, 0.34
Bean Hull
T-4950
GA, 1979 0.28 47 1 12 <0.01, <0.01 Bean T-5001 SC, 1979 0.28 47 1 17 <0.01, 0.02 Bean T-5002 SC, 1979 0.28 47 1 31 <0.01, <0.01 Bean
Hull T-5003
TX, 1979 0.28 47 1 6 0.05, 0.03 Bean T-5007 IN, 1979 0.28 47 1 6 0.06, 0.08
0.36 Bean Hull
T-5011
IN, 1979 0.28 47 1 7 0.03, 0.05 Bean T-5012 IN, 1979 0.28 47 1 8 0.04, 0.03 Bean T-5013 TN, 1979 0.28 252 1 12
19 0.04, 0.04 0.08, 0.07
Bean
T-5014
MS, 1979 0.28 47 1 15 0.04, 0.04 Bean T-5015 MS, 1979 0.28 47 1 6 0.01, 0.02 Bean T-5016 FL, 1979 0.28 280 1 13
15 0.02, 0.03 0.03, 0.02
Bean T-5017
VA, 1979 0.28 47 1 11 0.09, 0.13 0.47, 0.63
Bean Hull
T-5022
VA, 1979 0.28 47 1 28 0.05, 0.07 0.53, 0.56
Bean Hull
T-5023
IL, 1980 0.28 187 1 6 12 14
0.03, 0.02 0.04, 0.06 0.09, 0.08
Bean T-5218
USA, 1988 B* <0.05
<2 <0.05
Harvest aid Forage Hay Seed
Roper 1989n
IL (Fayette)
2.24 38 1 0 5
10 15 21
20 26 24 22 0.1
Hay Forage Forage Forage Seed
22IL-88-458 Ground application
IA (Pioneer 9271) 2.24 38 1 0
5 10 15
24 45 8 9 9
0.05
Forage Hay Forage Forage Forage Seed
36IA-88-459 Ground application
B*
<25 <15
<0.05
Forage Hay Seed
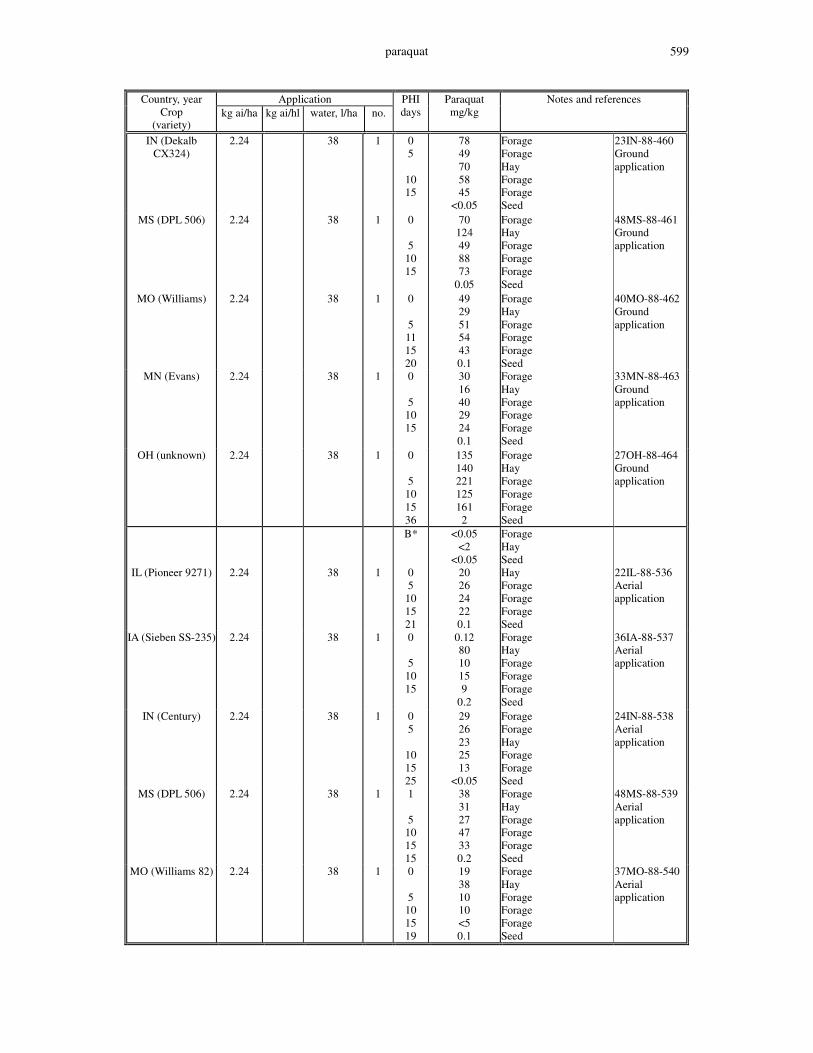
paraquat 599
Application Country, year Crop
(variety) kg ai/ha kg ai/hl water, l/ha no.
PHI days
Paraquat mg/kg
Notes and references
IN (Dekalb CX324)
2.24 38 1 0 5
10 15
78 49 70 58 45
<0.05
Forage Forage Hay Forage Forage Seed
23IN-88-460 Ground application
MS (DPL 506) 2.24 38 1 0
5 10 15
70 124 49 88 73
0.05
Forage Hay Forage Forage Forage Seed
48MS-88-461 Ground application
MO (Williams) 2.24 38 1 0
5 11 15 20
49 29 51 54 43 0.1
Forage Hay Forage Forage Forage Seed
40MO-88-462 Ground application
MN (Evans) 2.24 38 1 0
5 10 15
30 16 40 29 24 0.1
Forage Hay Forage Forage Forage Seed
33MN-88-463 Ground application
OH (unknown) 2.24 38 1 0
5 10 15 36
135 140 221 125 161 2
Forage Hay Forage Forage Forage Seed
27OH-88-464 Ground application
B* <0.05 <2
<0.05
Forage Hay Seed
IL (Pioneer 9271) 2.24 38 1 0 5
10 15 21
20 26 24 22 0.1
Hay Forage Forage Forage Seed
22IL-88-536 Aerial application
IA (Sieben SS-235) 2.24 38 1 0
5 10 15
0.12 80 10 15 9
0.2
Forage Hay Forage Forage Forage Seed
36IA-88-537 Aerial application
IN (Century) 2.24 38 1 0 5
10 15 25
29 26 23 25 13
<0.05
Forage Forage Hay Forage Forage Seed
24IN-88-538 Aerial application
MS (DPL 506) 2.24 38 1 1
5 10 15 15
38 31 27 47 33 0.2
Forage Hay Forage Forage Forage Seed
48MS-88-539 Aerial application
MO (Williams 82) 2.24 38 1 0
5 10 15 19
19 38 10 10 <5 0.1
Forage Hay Forage Forage Forage Seed
37MO-88-540 Aerial application
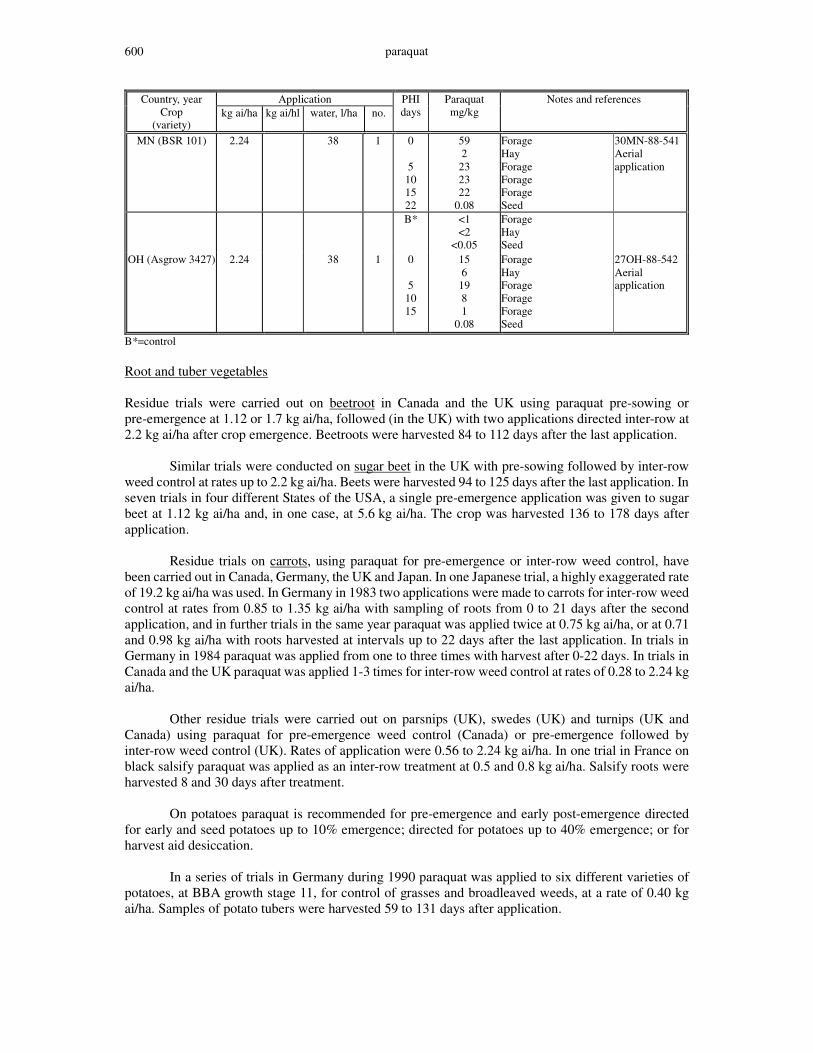
paraquat 600
Application Country, year Crop
(variety) kg ai/ha kg ai/hl water, l/ha no.
PHI days
Paraquat mg/kg
Notes and references
MN (BSR 101) 2.24 38 1 0
5 10 15 22
59 2
23 23 22
0.08
Forage Hay Forage Forage Forage Seed
30MN-88-541 Aerial application
B*
<1 <2
<0.05
Forage Hay Seed
OH (Asgrow 3427) 2.24 38 1 0
5 10 15
15 6
19 8 1
0.08
Forage Hay Forage Forage Forage Seed
27OH-88-542 Aerial application
B*=control Root and tuber vegetables Residue trials were carried out on beetroot in Canada and the UK using paraquat pre-sowing or pre-emergence at 1.12 or 1.7 kg ai/ha, followed (in the UK) with two applications directed inter-row at 2.2 kg ai/ha after crop emergence. Beetroots were harvested 84 to 112 days after the last application. Similar trials were conducted on sugar beet in the UK with pre-sowing followed by inter-row weed control at rates up to 2.2 kg ai/ha. Beets were harvested 94 to 125 days after the last application. In seven trials in four different States of the USA, a single pre-emergence application was given to sugar beet at 1.12 kg ai/ha and, in one case, at 5.6 kg ai/ha. The crop was harvested 136 to 178 days after application. Residue trials on carrots, using paraquat for pre-emergence or inter-row weed control, have been carried out in Canada, Germany, the UK and Japan. In one Japanese trial, a highly exaggerated rate of 19.2 kg ai/ha was used. In Germany in 1983 two applications were made to carrots for inter-row weed control at rates from 0.85 to 1.35 kg ai/ha with sampling of roots from 0 to 21 days after the second application, and in further trials in the same year paraquat was applied twice at 0.75 kg ai/ha, or at 0.71 and 0.98 kg ai/ha with roots harvested at intervals up to 22 days after the last application. In trials in Germany in 1984 paraquat was applied from one to three times with harvest after 0-22 days. In trials in Canada and the UK paraquat was applied 1-3 times for inter-row weed control at rates of 0.28 to 2.24 kg ai/ha. Other residue trials were carried out on parsnips (UK), swedes (UK) and turnips (UK and Canada) using paraquat for pre-emergence weed control (Canada) or pre-emergence followed by inter-row weed control (UK). Rates of application were 0.56 to 2.24 kg ai/ha. In one trial in France on black salsify paraquat was applied as an inter-row treatment at 0.5 and 0.8 kg ai/ha. Salsify roots were harvested 8 and 30 days after treatment. On potatoes paraquat is recommended for pre-emergence and early post-emergence directed for early and seed potatoes up to 10% emergence; directed for potatoes up to 40% emergence; or for harvest aid desiccation. In a series of trials in Germany during 1990 paraquat was applied to six different varieties of potatoes, at BBA growth stage 11, for control of grasses and broadleaved weeds, at a rate of 0.40 kg ai/ha. Samples of potato tubers were harvested 59 to 131 days after application.
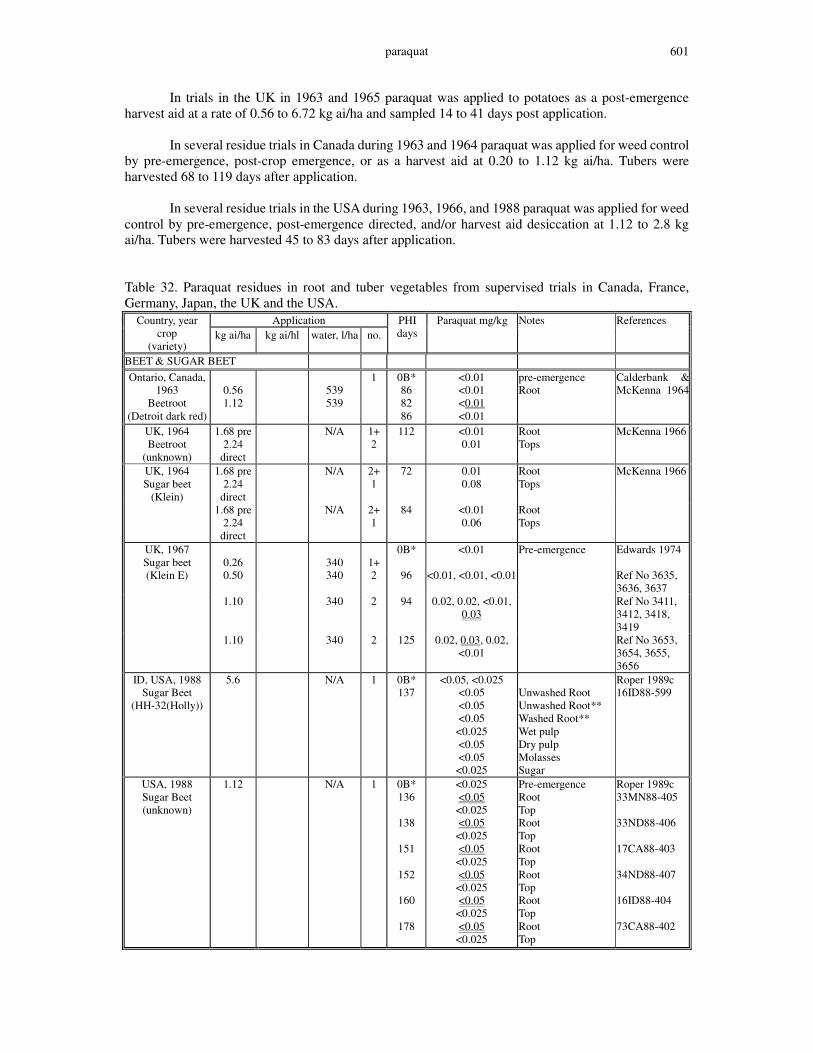
paraquat 601
In trials in the UK in 1963 and 1965 paraquat was applied to potatoes as a post-emergence harvest aid at a rate of 0.56 to 6.72 kg ai/ha and sampled 14 to 41 days post application. In several residue trials in Canada during 1963 and 1964 paraquat was applied for weed control by pre-emergence, post-crop emergence, or as a harvest aid at 0.20 to 1.12 kg ai/ha. Tubers were harvested 68 to 119 days after application. In several residue trials in the USA during 1963, 1966, and 1988 paraquat was applied for weed control by pre-emergence, post-emergence directed, and/or harvest aid desiccation at 1.12 to 2.8 kg ai/ha. Tubers were harvested 45 to 83 days after application. Table 32. Paraquat residues in root and tuber vegetables from supervised trials in Canada, France, Germany, Japan, the UK and the USA.
Application Country, year crop
(variety) kg ai/ha kg ai/hl water, l/ha no.
PHI days
Paraquat mg/kg Notes References
BEET & SUGAR BEET Ontario, Canada,
1963 Beetroot
(Detroit dark red)
0.56 1.12
539 539
1 0B* 86 82 86
<0.01 <0.01 <0.01 <0.01
pre-emergence Root
Calderbank & McKenna 1964
UK, 1964 Beetroot
(unknown)
1.68 pre 2.24
direct
N/A 1+ 2
112 <0.01 0.01
Root Tops
McKenna 1966
UK, 1964 Sugar beet
(Klein)
1.68 pre 2.24
direct
N/A 2+ 1
72 0.01 0.08
Root Tops
McKenna 1966
1.68 pre 2.24
direct
N/A 2+ 1
84 <0.01 0.06
Root Tops
UK, 1967 Sugar beet (Klein E)
0.26 0.50
340 340
1+ 2
0B*
96
<0.01
<0.01, <0.01, <0.01
Pre-emergence
Edwards 1974 Ref No 3635, 3636, 3637
1.10 340 2 94 0.02, 0.02, <0.01, 0.03
Ref No 3411, 3412, 3418, 3419
1.10 340 2 125 0.02, 0.03, 0.02, <0.01
Ref No 3653, 3654, 3655, 3656
ID, USA, 1988 Sugar Beet
(HH-32(Holly))
5.6 N/A 1 0B* 137
<0.05, <0.025 <0.05 <0.05 <0.05 <0.025 <0.05 <0.05 <0.025
Unwashed Root Unwashed Root** Washed Root** Wet pulp Dry pulp Molasses Sugar
Roper 1989c 16ID88-599
USA, 1988 Sugar Beet (unknown)
1.12 N/A 1 0B* 136
138
151
152
160
178
<0.025 <0.05 <0.025 <0.05 <0.025 <0.05 <0.025 <0.05 <0.025 <0.05 <0.025 <0.05 <0.025
Pre-emergence Root Top Root Top Root Top Root Top Root Top Root Top
Roper 1989c 33MN88-405 33ND88-406 17CA88-403 34ND88-407 16ID88-404 73CA88-402

paraquat 602
Application Country, year crop
(variety) kg ai/ha kg ai/hl water, l/ha no.
PHI days
Paraquat mg/kg Notes References
CARROT NB, Canada, 1963
(Gold Pak)
0.28
0.56
674
674
1
0B* 104
104
<0.01 <0.01 <0.01 <0.01 <0.01
pre-emergence Root Tops Root Tops
Calderbank & McKenna 1964
UK, 1963 (unknown)
0.56 0.84
1210 1210
1 1
0B 26 26
<0.01 0.03 0.08
Harvest aid Root
Calderbank & McKenna 1964
Ontario, Canada, 1964
(Long Hyperator)
2.24
935
1
0B* 36
<0.01 <0.01
Root McKenna 1966
UK, 1964 (unknown)
1.68
1
0B* 144
<0.01 0.02 0.14
Pre-sowing Root Tops
McKenna 1966
1.68 pre
2.24 direct
1+ 2
63
0.02 0.22
Pre-emergence & inter-row Root Tops
Japan, 1973 (Karuda Gosun)
0.96
19.2
N/A
N/A
2 3 3 1
0B* 113 5 5 11
140
<0.03 <0.03 <0.03 <0.03 <0.03 <0.03
Edwards 1974
Germany, 1983
(Caramba)
(Elfie)
(Karotan)
1.00
0.85 0.95
1.35 1.10
1000
850 950
1350 1000
2
1+ 1
1+ 1
0B* 4 9 14 22
0 4 9 14 21
0 3 7 11 15
<0.01 <0.01 <0.01 <0.01 <0.01
0.14
<0.01 <0.01 <0.01 <0.01
0.02 0.02
<0.01 <0.01 0.01
Post-emergence Root Root Root
Swaine 1983b RS8378B2 RS8378E4 RS8378E5
Germany, 1983
(Nantaise)
(Caramba)
(Caramba)
0.98 0.71
0.75 0.75
0.75 0.75
3250 2350
2500 1250
2500 1250
1+ 1
1+ 1
1+ 1
0B* 0 4 9 14 21 0 4 9 14 22 0 4 9 14 22
<0.02 <0.02 <0.02 0.02
<0.02 <0.02 <0.02 <0.02 <0.02 <0.02 <0.02 <0.02 <0.02 <0.02 <0.02 <0.02
Kennedy 1984b RS8372E4 RS8372B3 RS8372B4

paraquat 603
Application Country, year crop
(variety) kg ai/ha kg ai/hl water, l/ha no.
PHI days
Paraquat mg/kg Notes References
Germany, 1984
(Lange Rote)
(Tip-top)
0.75
0.75
2500
1200
3
1
0 4 9 14 0 4 8 13 19
<0.01 <0.01 <0.01 <0.01 <0.01 0.01
<0.01 <0.01 0.01
RS8427B5 RS8427E4
Germany, 1984
(Tip-top)
(Minota)
(Nantaise)
1.00 1000 1
2
3
0 4 8 13 19 4 10 14 22 0 4 9 14 21
0.01 0.02 0.01 0.03 0.01
<0.01 <0.01 <0.01 <0.01 0.01 0.01
<0.01 <0.01 <0.01
Massey 1987b RS8423E5 RS8423B2 RS8423B4
POTATO Germany, 1990
(Hansa) 0.40 400 1 0B*
71 93
<0.01
<0.01 <0.01
Post-emergence directed Tuber
Earl & Anderson 1991 Rs9024B1
Germany, 1990 (Cilena)
0.40 400 1 0B*
76 100
<0.01
<0.01 <0.01
Post-emergence directed Tuber
Earl & Anderson 1991 Rs9024B2
Germany, 1990 (Hela)
0.40 400 1 0B*
59 77
<0.01
<0.01 <0.01
Post-emergence directed Tuber
Earl & Anderson 1991 Rs9024B3
Germany, 1990 (Rebecca)
0.40 400 1 0B*
71 131
<0.01
<0.01 <0.01
Post-emergence directed Tuber
Earl & Anderson 1991 Rs9024G1
Germany, 1990 (Agria)
0.40 400 1 0B*
73 115
<0.01
<0.01 <0.01
Post-emergence directed Tuber
Earl & Anderson 1991 Rs9024G2
Germany, 1990 (Nicola)
0.40 400 1 0B*
74
<0.01
<0.01
Post-emergence directed Tuber
Earl & Anderson 1991 Rs9024G3
Ontario, Canada, 1963
(Sebago)
0.56 0.56 1.12 1.12 1.12
281 281 281 281 281
1 1 1 1 1
0B* 122 123 100 101 108
<0.01 <0.01 <0.01 <0.01 <0.01 <0.01
Pre-emergence Tuber
Calderbank & McKenna 1964
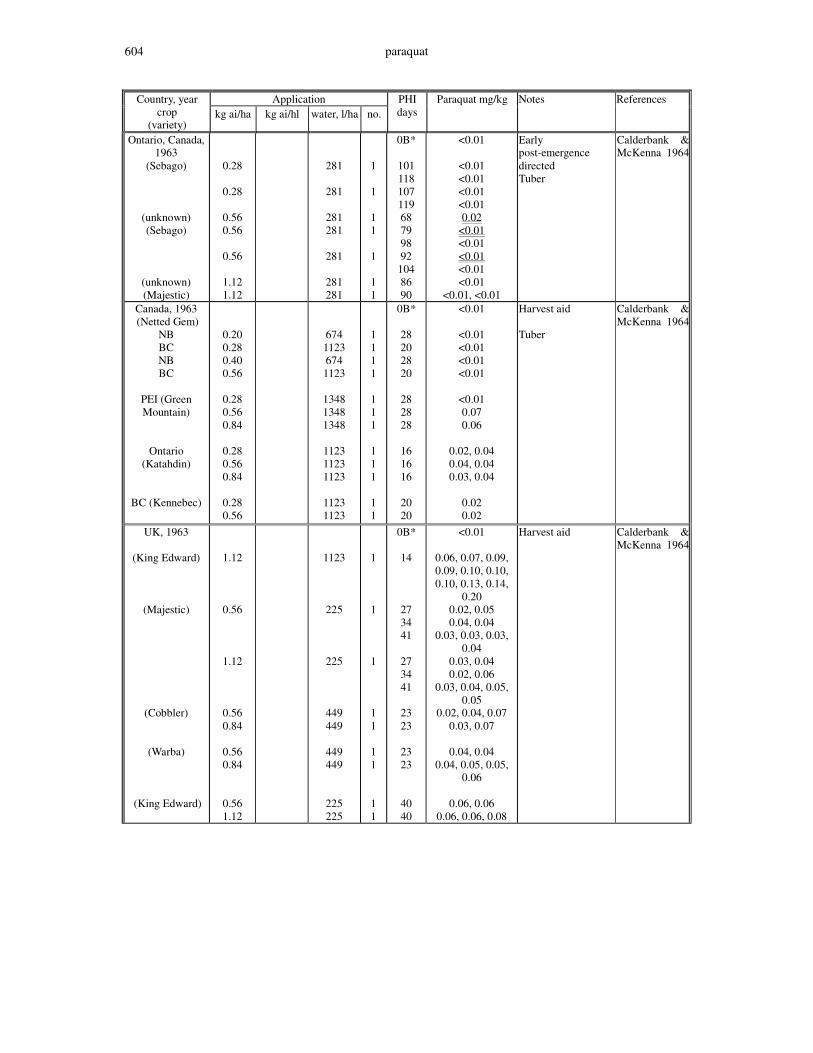
paraquat 604
Application Country, year crop
(variety) kg ai/ha kg ai/hl water, l/ha no.
PHI days
Paraquat mg/kg Notes References
Ontario, Canada, 1963
(Sebago)
(unknown) (Sebago)
(unknown) (Majestic)
0.28
0.28
0.56 0.56
0.56
1.12 1.12
281
281
281 281
281
281 281
1
1
1 1
1
1 1
0B*
101 118 107 119 68 79 98 92
104 86 90
<0.01
<0.01 <0.01 <0.01 <0.01 0.02
<0.01 <0.01 <0.01 <0.01 <0.01
<0.01, <0.01
Early post-emergence directed Tuber
Calderbank & McKenna 1964
Canada, 1963 (Netted Gem)
NB BC NB BC
PEI (Green Mountain)
Ontario (Katahdin)
BC (Kennebec)
0.20 0.28 0.40 0.56
0.28 0.56 0.84
0.28 0.56 0.84
0.28 0.56
674 1123 674 1123
1348 1348 1348
1123 1123 1123
1123 1123
1 1 1 1
1 1 1
1 1 1
1 1
0B*
28 20 28 20
28 28 28
16 16 16
20 20
<0.01
<0.01 <0.01 <0.01 <0.01
<0.01 0.07 0.06
0.02, 0.04 0.04, 0.04 0.03, 0.04
0.02 0.02
Harvest aid Tuber
Calderbank & McKenna 1964
UK, 1963
(King Edward)
(Majestic)
(Cobbler)
(Warba)
(King Edward)
1.12
0.56
1.12
0.56 0.84
0.56 0.84
0.56 1.12
1123
225
225
449 449
449 449
225 225
1
1
1
1 1
1 1
1 1
0B*
14
27 34 41
27 34 41
23 23
23 23
40 40
<0.01
0.06, 0.07, 0.09, 0.09, 0.10, 0.10, 0.10, 0.13, 0.14,
0.20 0.02, 0.05 0.04, 0.04
0.03, 0.03, 0.03, 0.04
0.03, 0.04 0.02, 0.06
0.03, 0.04, 0.05, 0.05
0.02, 0.04, 0.07 0.03, 0.07
0.04, 0.04
0.04, 0.05, 0.05, 0.06
0.06, 0.06
0.06, 0.06, 0.08
Harvest aid Calderbank & McKenna 1964

paraquat 605
Application Country, year crop
(variety) kg ai/ha kg ai/hl water, l/ha no.
PHI days
Paraquat mg/kg Notes References
Ontario, Canada, 1964
(Kennebec)
(Norland)
(Sebago)
0.56 1.12
0.28 0.56 0.56
0.56 1.12
234 234
75.8 75.8 75.8
234 234
1 1
1 1 1
1 1
0B*
110 108
84 84 98
117 106
<0.01
<0.01 <0.01
<0.01 <0.01 <0.01
<0.01 <0.01
Early post-emergence directed
McKenna 1966
Ontario, Canada, 1964
(Netted Gem)
(Norland) (Katahdin)
(Kennebec) (Sebago)
2.24 4.48 0.42 0.42 0.42 0.42 0.42
468 468 468 468
1 1 1 1 1 1 1
30 30 30 22 14 14 12
0.03 0.04 0.05
<0.01 0.02 0.02 0.11
Harvest aid McKenna 1966
UK, 1965 (Maris Peer)
0.84
1.68
3.36
6.73
562
562
562
562
1
1
1
1
0B*
31
31
31
31
<0.01
0.04, 0.06, 0.04, 0.08, 0.04, 0.06
0.05, 0.04, 0.07, 0.04, 0.08, 0.14,
0.04, 0.07
0.07, 0.07, 0.07, 0.09, 0.04, 0.06
0.09, 0.06, 0.10, 0.09, 0.08, 0.05,
0.10, 0.08
Harvest aid
McKenna 1966
USA, 1963 NJ (Green Mountain)
FL (unknown)
1.12
1.12
468
468
1
1
0B* 45 95 52 72
<0.01 <0.01 <0.01 <0.01 <0.01
Pre-emergence Tuber
Chevron 1967 T-387 T-388
USA, 1966
NJ (Katahdin) NJ (Katahdin)
1.12 1.12
321 277
1 1
0B*
83 82
<0.01
<0.01 <0.01
Early post-emergence Tuber
T-1193 T-1194
NJ (Katahdin) 1.12 1.12
321-331 277-331
2 2
56 62
0.01 0.01
Post-emergence Tuber
Chevron 1967 T-1195 T-1196
NJ (Katahdin)
CA (CA long white)
1.12
1.12
1.12
321-556
277-556
468
2+ 1
2+ 1
2+ 1
3 3 3
0.01
0.02
0.04
Post-emergence; then harvest aid Tuber
T-1197 T-1198 T-1174
ID, USA, 1988 (Russet Burbank)
2.8
1
0B*
7
<0.05 <0.025 <0.05
<0.05
0.05
Harvest aid Unwashed tuber Washed tuber Unwashed tuber from field Unwashed tuber from processor Washed tuber from processor
Roper 1989b 16ID88-400
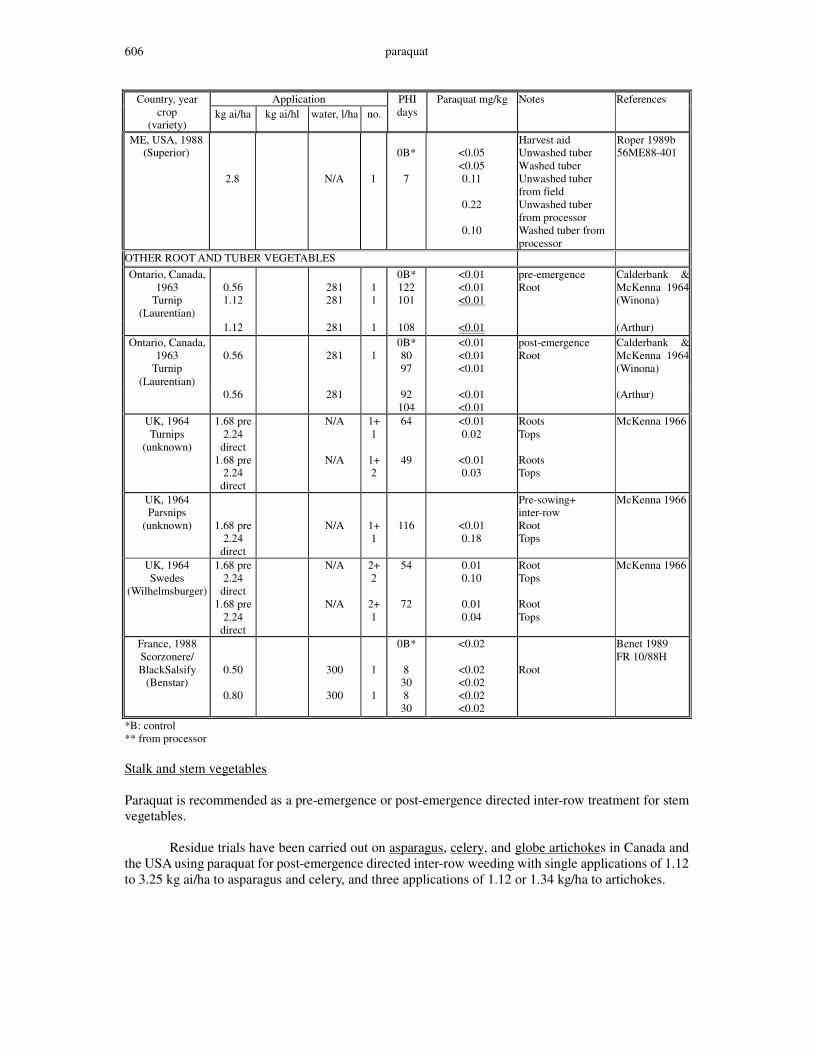
paraquat 606
Application Country, year crop
(variety) kg ai/ha kg ai/hl water, l/ha no.
PHI days
Paraquat mg/kg Notes References
ME, USA, 1988 (Superior)
2.8
N/A
1
0B*
7
<0.05 <0.05 0.11
0.22
0.10
Harvest aid Unwashed tuber Washed tuber Unwashed tuber from field Unwashed tuber from processor Washed tuber from processor
Roper 1989b 56ME88-401
OTHER ROOT AND TUBER VEGETABLES Ontario, Canada,
1963 Turnip
(Laurentian)
0.56 1.12
281 281
1 1
0B* 122 101
<0.01 <0.01 <0.01
pre-emergence Root
Calderbank & McKenna 1964(Winona)
1.12 281 1 108 <0.01 (Arthur) Ontario, Canada,
1963 Turnip
(Laurentian)
0.56
281
1
0B* 80 97
<0.01 <0.01 <0.01
post-emergence Root
Calderbank & McKenna 1964(Winona)
0.56 281 92 104
<0.01 <0.01
(Arthur)
UK, 1964 Turnips
(unknown)
1.68 pre 2.24
direct 1.68 pre
2.24 direct
N/A
N/A
1+ 1
1+ 2
64
49
<0.01 0.02
<0.01 0.03
Roots Tops Roots Tops
McKenna 1966
UK, 1964 Parsnips
(unknown)
1.68 pre 2.24
direct
N/A
1+ 1
116
<0.01 0.18
Pre-sowing+ inter-row Root Tops
McKenna 1966
UK, 1964 Swedes
(Wilhelmsburger)
1.68 pre 2.24
direct 1.68 pre
2.24 direct
N/A
N/A
2+ 2
2+ 1
54
72
0.01 0.10
0.01 0.04
Root Tops Root Tops
McKenna 1966
France, 1988 Scorzonere/ BlackSalsify
(Benstar)
0.50
0.80
300
300
1
1
0B*
8 30 8 30
<0.02
<0.02 <0.02 <0.02 <0.02
Root
Benet 1989 FR 10/88H
*B: control ** from processor Stalk and stem vegetables Paraquat is recommended as a pre-emergence or post-emergence directed inter-row treatment for stem vegetables. Residue trials have been carried out on asparagus, celery, and globe artichokes in Canada and the USA using paraquat for post-emergence directed inter-row weeding with single applications of 1.12 to 3.25 kg ai/ha to asparagus and celery, and three applications of 1.12 or 1.34 kg/ha to artichokes.

paraquat 607
Table 33. Paraquat residues in stalk and stem vegetables from supervised trials in Canada and the USA. Application Country, year
Crop (variety) kg ai/ha kg ai/hl water, l/ha no. PHI days
Paraquat mg/kg Notes References
Ontario, Canada, 1963
Asparagus (Waltham)
1.12 281 1 0B*
103
<0.05
<0.05 <0.05
Pre-emergence directed Stalk Fern
Calderbank & McKenna 1964
Ontario, Canada, 1964
Asparagus (Waltham)
1.12 234 1 0B*
70
<0.02
<0.02
Pre-emergence
Chevron 1970 T-1403
USA, 1969 Asparagus
MI (California 711) CA (U-72) CA (U-72)
1.12 2.24 3.25
337 1870 1870
1 1 1
0B*
25 8 8
<0.02
<0.02, <0.02 <0.02, 0.02
<0.03, <0.03
Pre-emergence Chevron 1970 T-1839 T-1838 T-1837
Ontario, Canada, 1964
Celery (Mixed)
2.24
935
1 0B*
36
<0.05
<0.05
Post-emergence Stalk
McKenna 1966
CA, USA 1992
Globe Artichoke (unknown)
1.12 1.35
187 627
3 3
0B* 1 1
<0.05 <0.05 <0.05
Post-emergence directed
Lurvey 1996 92:CA:126 92:CA:125
*B: control Cereals Maize. Paraquat is recommended for use in the cultivation of maize during pre-plant or pre-emergence treatment, post-emergence directed or guarded spray for inter-row weed control, or as a harvest aid desiccation. Two residue trials were conducted on maize in Italy in 1993 in which paraquat was applied at a rate of 0.92 kg ai/ha to the seed bed one day before sowing. Maize silage and cobs were sampled 104 and 136 days after treatment respectively.
Residue trials were carried out in Canada in 1963 on pre-emergence weed control using a rate of 1.12 kg ai/ha, with harvest after 101 to 107 days, and post-emergence at 0.28-1.12 kg ai/ha (harvest 68-122 days). In the following year, similar trials on post-emergence weed control were at 0.56 to 2.2 kg ai/ha. Cobs were harvested 25 to 63 days after application. A trial was carried out in the UK in 1964 with two pre-sowing applications of 1.7 kg ai/ha followed by a similar directed application of 2.2 kg ai/ha after crop emergence. Maize grain was harvested 84 days after the last application. Several trials were conducted over several years in several locations in the USA. In 1987 paraquat was applied as a pre-emergence spray at 1.12 kg/ha followed by two post-emergence directed spays at 0.31 kg/ha and sampled after 28 to 95 days. In 1998 one or two post-emergence sprays were used at 0.56 kg ai/ha. In 1972-74 paraquat was applied as a harvest aid desiccation at rates of 0.56 to 1.12 kg/ha and sampled 3 to 27 days after application. Residue levels of paraquat in fodder, cob, grain, oil, and other processed fractions were measured.
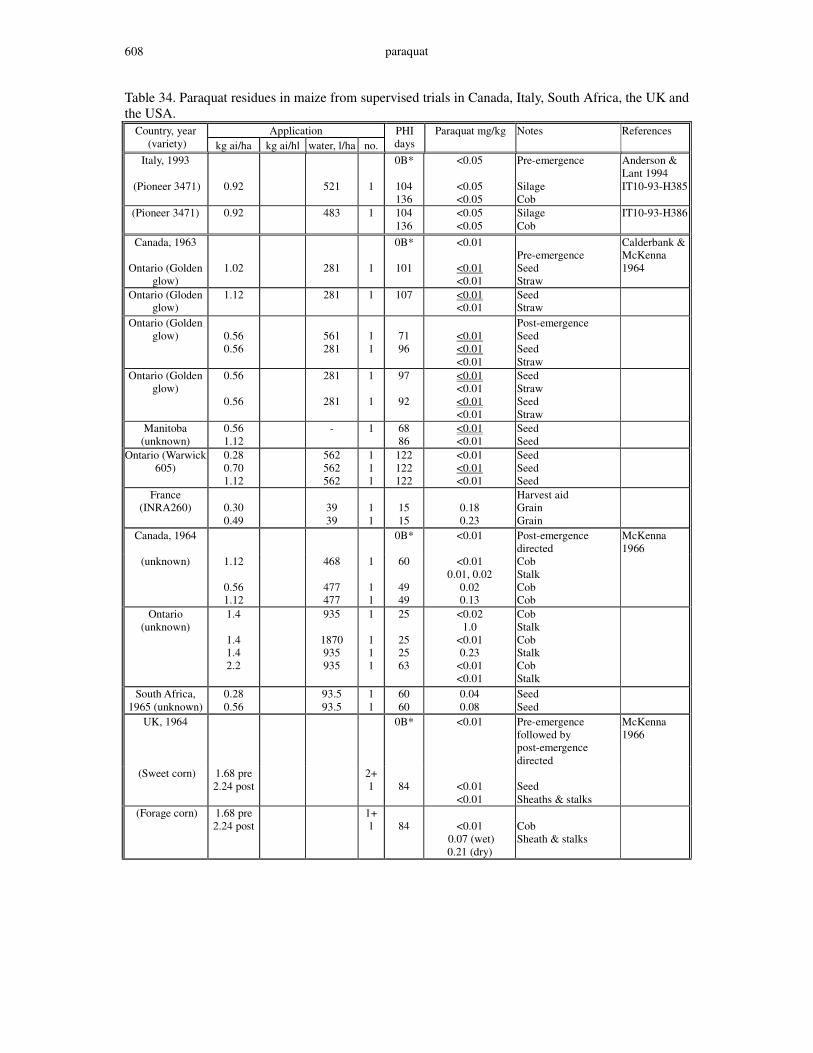
paraquat 608
Table 34. Paraquat residues in maize from supervised trials in Canada, Italy, South Africa, the UK and the USA.
Application Country, year (variety) kg ai/ha kg ai/hl water, l/ha no.
PHI days
Paraquat mg/kg Notes References
Italy, 1993
(Pioneer 3471)
0.92
521
1
0B*
104 136
<0.05
<0.05 <0.05
Pre-emergence Silage Cob
Anderson & Lant 1994 IT10-93-H385
(Pioneer 3471)
0.92 483 1 104 136
<0.05 <0.05
Silage Cob
IT10-93-H386
Canada, 1963
Ontario (Golden glow)
1.02
281
1
0B*
101
<0.01
<0.01 <0.01
Pre-emergence Seed Straw
Calderbank & McKenna 1964
Ontario (Gloden glow)
1.12
281 1 107 <0.01 <0.01
Seed Straw
Ontario (Golden glow)
0.56 0.56
561 281
1 1
71 96
<0.01 <0.01 <0.01
Post-emergence Seed Seed Straw
Ontario (Golden glow)
0.56
0.56
281
281
1 1
97
92
<0.01 <0.01 <0.01 <0.01
Seed Straw Seed Straw
Manitoba (unknown)
0.56 1.12
- 1 68 86
<0.01 <0.01
Seed Seed
Ontario (Warwick 605)
0.28 0.70 1.12
562 562 562
1 1 1
122 122 122
<0.01 <0.01 <0.01
Seed Seed Seed
France (INRA260)
0.30 0.49
39 39
1 1
15 15
0.18 0.23
Harvest aid Grain Grain
Canada, 1964 0B* <0.01 Post-emergence directed
McKenna 1966
(unknown) 1.12
0.56 1.12
468
477 477
1 1 1
60
49 49
<0.01 0.01, 0.02
0.02 0.13
Cob Stalk Cob Cob
Ontario (unknown)
1.4
1.4 1.4 2.2
935
1870 935 935
1 1 1 1
25
25 25 63
<0.02 1.0
<0.01 0.23
<0.01 <0.01
Cob Stalk Cob Stalk Cob Stalk
South Africa, 1965 (unknown)
0.28 0.56
93.5 93.5
1 1
60 60
0.04 0.08
Seed Seed
UK, 1964
0B*
<0.01
Pre-emergence followed by post-emergence directed
McKenna 1966
(Sweet corn) 1.68 pre 2.24 post
2+ 1
84
<0.01 <0.01
Seed Sheaths & stalks
(Forage corn) 1.68 pre 2.24 post
1+ 1
84
<0.01
0.07 (wet) 0.21 (dry)
Cob Sheath & stalks
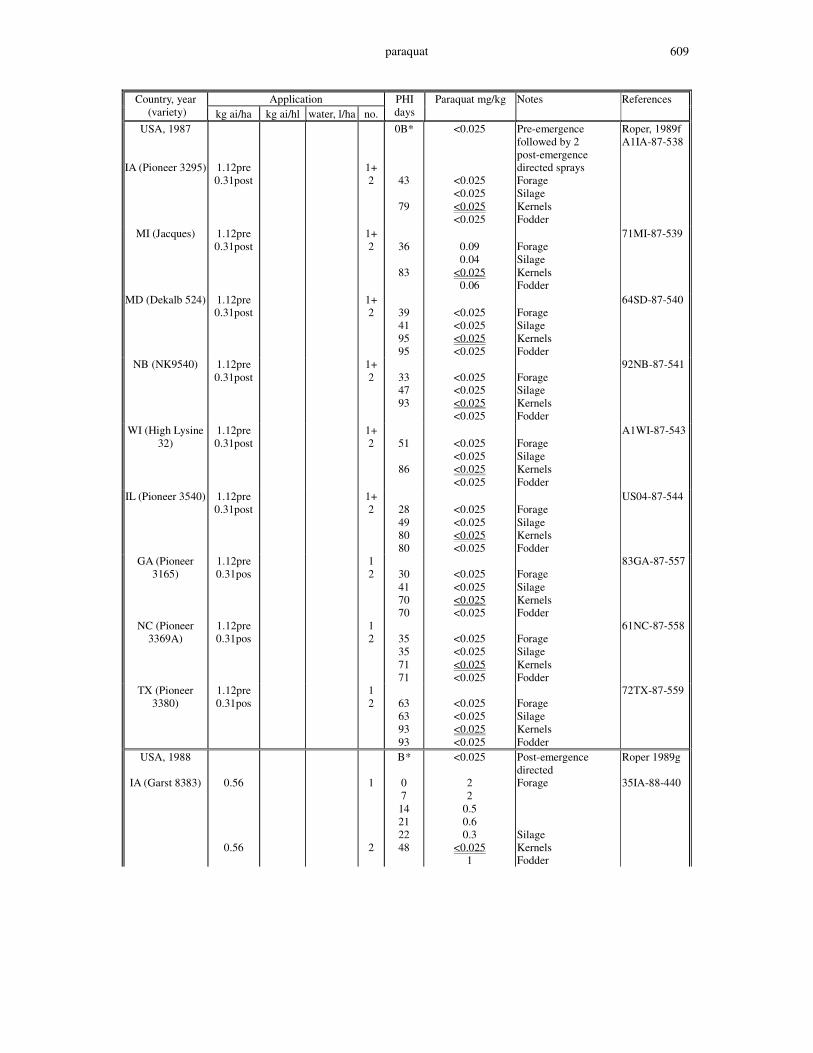
paraquat 609
Application Country, year (variety) kg ai/ha kg ai/hl water, l/ha no.
PHI days
Paraquat mg/kg Notes References
USA, 1987
IA (Pioneer 3295)
1.12pre 0.31post
1+ 2
0B*
43
79
<0.025
<0.025 <0.025 <0.025 <0.025
Pre-emergence followed by 2 post-emergence directed sprays Forage Silage Kernels Fodder
Roper, 1989f A1IA-87-538
MI (Jacques) 1.12pre 0.31post
1+ 2
36
83
0.09 0.04
<0.025 0.06
Forage Silage Kernels Fodder
71MI-87-539
MD (Dekalb 524) 1.12pre 0.31post
1+ 2
39 41 95 95
<0.025 <0.025 <0.025 <0.025
Forage Silage Kernels Fodder
64SD-87-540
NB (NK9540) 1.12pre 0.31post
1+ 2
33 47 93
<0.025 <0.025 <0.025 <0.025
Forage Silage Kernels Fodder
92NB-87-541
WI (High Lysine 32)
1.12pre 0.31post
1+ 2
51
86
<0.025 <0.025 <0.025 <0.025
Forage Silage Kernels Fodder
A1WI-87-543
IL (Pioneer 3540) 1.12pre 0.31post
1+ 2
28 49 80 80
<0.025 <0.025 <0.025 <0.025
Forage Silage Kernels Fodder
US04-87-544
GA (Pioneer 3165)
1.12pre 0.31pos
1 2
30 41 70 70
<0.025 <0.025 <0.025 <0.025
Forage Silage Kernels Fodder
83GA-87-557
NC (Pioneer 3369A)
1.12pre 0.31pos
1 2
35 35 71 71
<0.025 <0.025 <0.025 <0.025
Forage Silage Kernels Fodder
61NC-87-558
TX (Pioneer 3380)
1.12pre 0.31pos
1 2
63 63 93 93
<0.025 <0.025 <0.025 <0.025
Forage Silage Kernels Fodder
72TX-87-559
USA, 1988
IA (Garst 8383)
0.56
0.56
1 2
B*
0 7 14 21 22 48
<0.025
2 2
0.5 0.6 0.3
<0.025 1
Post-emergence directed Forage Silage Kernels Fodder
Roper 1989g 35IA-88-440
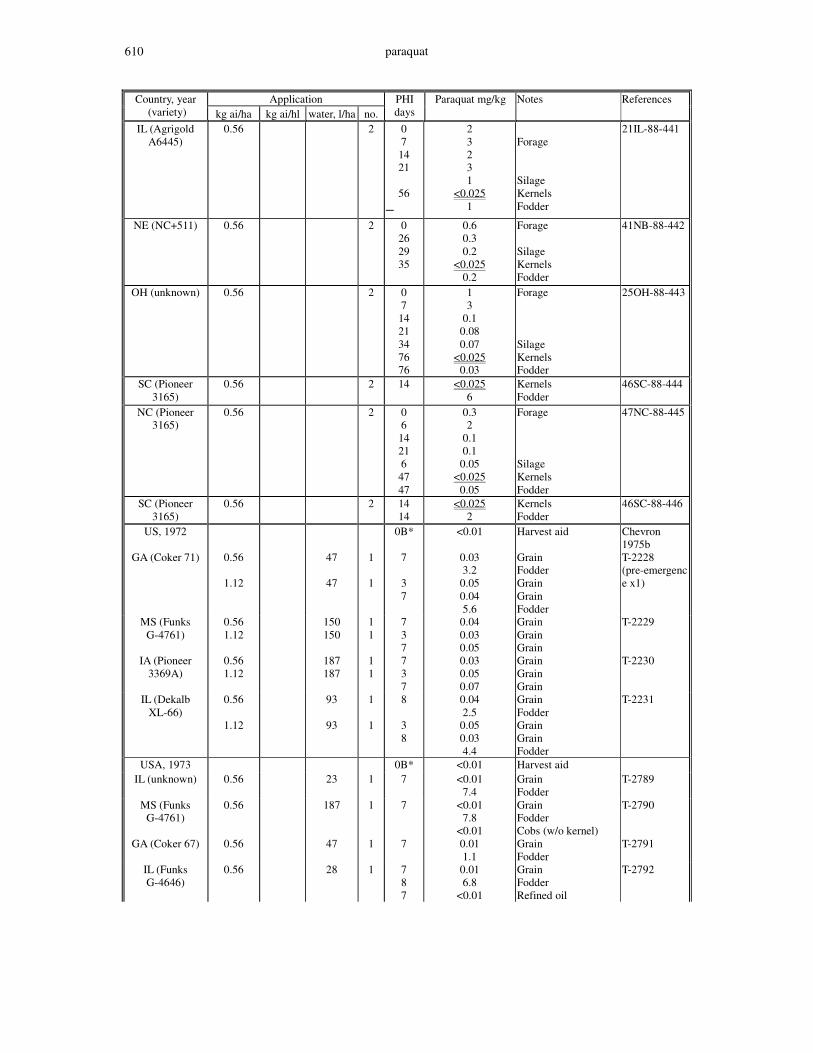
paraquat 610
Application Country, year (variety) kg ai/ha kg ai/hl water, l/ha no.
PHI days
Paraquat mg/kg Notes References
IL (Agrigold A6445)
0.56 2 0 7 14 21
56
−
2 3 2 3 1
<0.025 1
Forage Silage Kernels Fodder
21IL-88-441
NE (NC+511) 0.56 2 0 26 29 35
0.6 0.3 0.2
<0.025 0.2
Forage Silage Kernels Fodder
41NB-88-442
OH (unknown) 0.56 2 0 7 14 21 34 76 76
1 3
0.1 0.08 0.07
<0.025 0.03
Forage Silage Kernels Fodder
25OH-88-443
SC (Pioneer 3165)
0.56 2 14
<0.025 6
Kernels Fodder
46SC-88-444
NC (Pioneer 3165)
0.56 2 0 6 14 21 6 47 47
0.3 2
0.1 0.1
0.05 <0.025
0.05
Forage Silage Kernels Fodder
47NC-88-445
SC (Pioneer 3165)
0.56 2 14 14
<0.025 2
Kernels Fodder
46SC-88-446
US, 1972
GA (Coker 71)
0.56
1.12
47
47
1 1
0B*
7
3 7
<0.01
0.03 3.2
0.05 0.04 5.6
Harvest aid Grain Fodder Grain Grain Fodder
Chevron 1975b T-2228 (pre-emergence x1)
MS (Funks G-4761)
0.56 1.12
150 150
1 1
7 3 7
0.04 0.03 0.05
Grain Grain Grain
T-2229
IA (Pioneer 3369A)
0.56 1.12
187 187
1 1
7 3 7
0.03 0.05 0.07
Grain Grain Grain
T-2230
IL (Dekalb XL-66)
0.56
1.12
93
93
1 1
8
3 8
0.04 2.5
0.05 0.03 4.4
Grain Fodder Grain Grain Fodder
T-2231
USA, 1973 0B* <0.01 Harvest aid IL (unknown) 0.56 23 1 7 <0.01
7.4 Grain Fodder
T-2789
MS (Funks G-4761)
0.56 187 1 7 <0.01 7.8
<0.01
Grain Fodder Cobs (w/o kernel)
T-2790
GA (Coker 67) 0.56 47 1 7 0.01 1.1
Grain Fodder
T-2791
IL (Funks G-4646)
0.56 28 1 7 8 7
0.01 6.8
<0.01
Grain Fodder Refined oil
T-2792
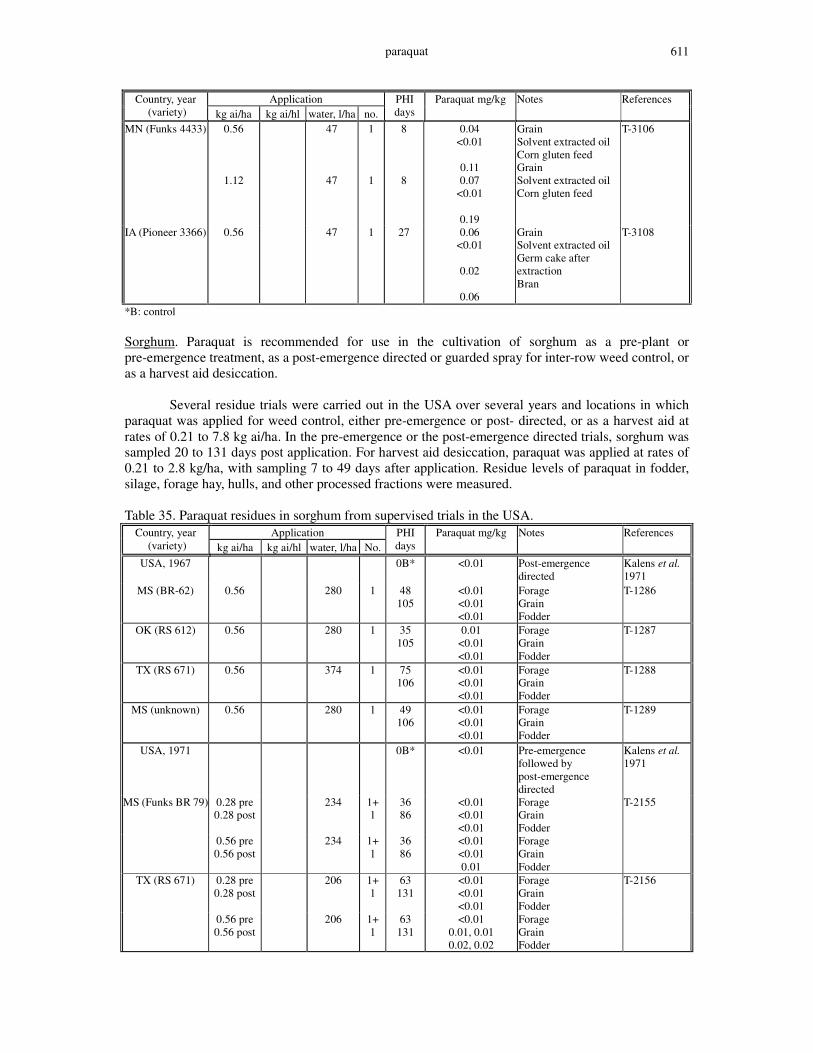
paraquat 611
Application Country, year (variety) kg ai/ha kg ai/hl water, l/ha no.
PHI days
Paraquat mg/kg Notes References
MN (Funks 4433) 0.56
1.12
47
47
1 1
8
8
0.04 <0.01
0.11 0.07
<0.01
0.19
Grain Solvent extracted oil Corn gluten feed Grain Solvent extracted oil Corn gluten feed
T-3106
IA (Pioneer 3366) 0.56 47 1 27 0.06 <0.01
0.02
0.06
Grain Solvent extracted oil Germ cake after extraction Bran
T-3108
*B: control Sorghum. Paraquat is recommended for use in the cultivation of sorghum as a pre-plant or pre-emergence treatment, as a post-emergence directed or guarded spray for inter-row weed control, or as a harvest aid desiccation. Several residue trials were carried out in the USA over several years and locations in which paraquat was applied for weed control, either pre-emergence or post- directed, or as a harvest aid at rates of 0.21 to 7.8 kg ai/ha. In the pre-emergence or the post-emergence directed trials, sorghum was sampled 20 to 131 days post application. For harvest aid desiccation, paraquat was applied at rates of 0.21 to 2.8 kg/ha, with sampling 7 to 49 days after application. Residue levels of paraquat in fodder, silage, forage hay, hulls, and other processed fractions were measured. Table 35. Paraquat residues in sorghum from supervised trials in the USA.
Application Country, year (variety) kg ai/ha kg ai/hl water, l/ha No.
PHI days
Paraquat mg/kg Notes References
USA, 1967
0B*
<0.01
Post-emergence directed
Kalens et al. 1971
MS (BR-62) 0.56 280 1 48 105
<0.01 <0.01 <0.01
Forage Grain Fodder
T-1286
OK (RS 612) 0.56 280 1 35 105
0.01 <0.01 <0.01
Forage Grain Fodder
T-1287
TX (RS 671) 0.56 374 1 75 106
<0.01 <0.01 <0.01
Forage Grain Fodder
T-1288
MS (unknown) 0.56 280 1 49 106
<0.01 <0.01 <0.01
Forage Grain Fodder
T-1289
USA, 1971 0B* <0.01 Pre-emergence followed by post-emergence directed
Kalens et al. 1971
MS (Funks BR 79) 0.28 pre 0.28 post
234 1+ 1
36 86
<0.01 <0.01 <0.01
Forage Grain Fodder
T-2155
0.56 pre 0.56 post
234 1+ 1
36 86
<0.01 <0.01 0.01
Forage Grain Fodder
TX (RS 671) 0.28 pre 0.28 post
206 1+ 1
63 131
<0.01 <0.01 <0.01
Forage Grain Fodder
T-2156
0.56 pre 0.56 post
206 1+ 1
63 131
<0.01 0.01, 0.01 0.02, 0.02
Forage Grain Fodder
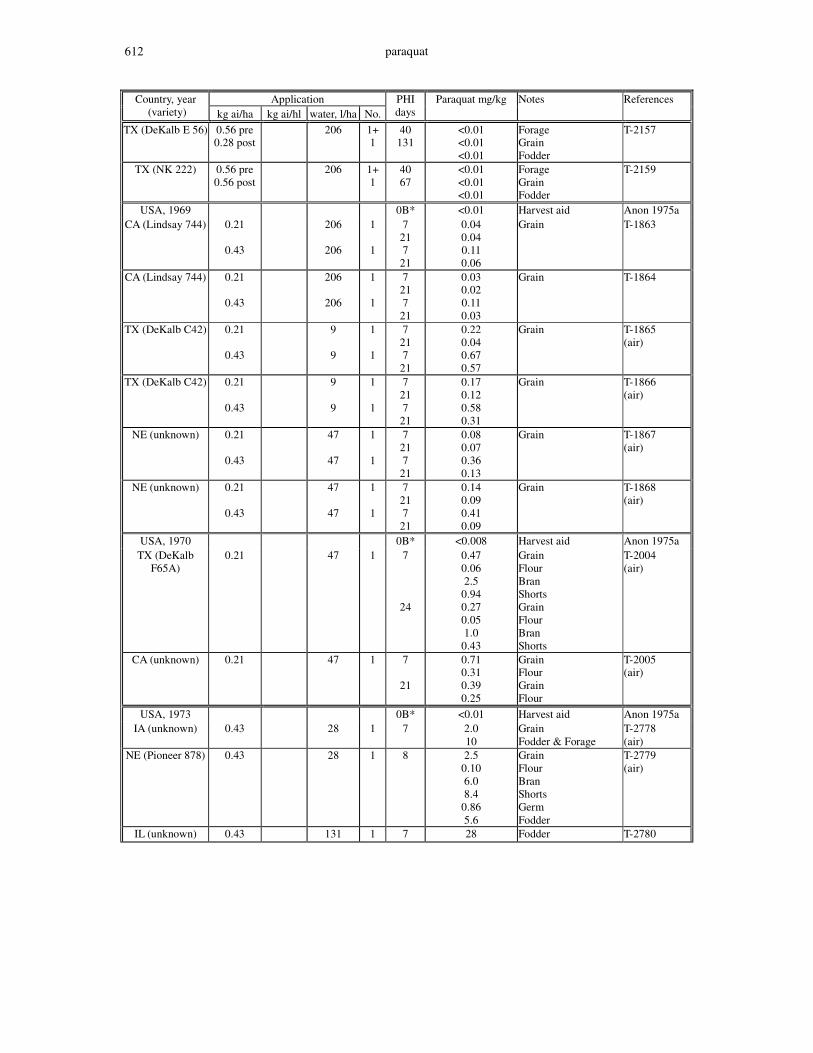
paraquat 612
Application Country, year (variety) kg ai/ha kg ai/hl water, l/ha No.
PHI days
Paraquat mg/kg Notes References
TX (DeKalb E 56) 0.56 pre 0.28 post
206 1+ 1
40 131
<0.01 <0.01 <0.01
Forage Grain Fodder
T-2157
TX (NK 222) 0.56 pre 0.56 post
206 1+ 1
40 67
<0.01 <0.01 <0.01
Forage Grain Fodder
T-2159
USA, 1969 0B* <0.01 Harvest aid Anon 1975a CA (Lindsay 744) 0.21
0.43
206
206
1
1
7 21 7
21
0.04 0.04 0.11 0.06
Grain T-1863
CA (Lindsay 744) 0.21
0.43
206
206
1
1
7 21 7
21
0.03 0.02 0.11 0.03
Grain T-1864
TX (DeKalb C42) 0.21
0.43
9
9
1
1
7 21 7
21
0.22 0.04 0.67 0.57
Grain T-1865 (air)
TX (DeKalb C42) 0.21
0.43
9
9
1
1
7 21 7
21
0.17 0.12 0.58 0.31
Grain T-1866 (air)
NE (unknown) 0.21
0.43
47
47
1
1
7 21 7
21
0.08 0.07 0.36 0.13
Grain T-1867 (air)
NE (unknown) 0.21
0.43
47
47
1
1
7 21 7
21
0.14 0.09 0.41 0.09
Grain T-1868 (air)
USA, 1970 0B* <0.008 Harvest aid Anon 1975a TX (DeKalb
F65A) 0.21
47
1
7
24
0.47 0.06 2.5
0.94 0.27 0.05 1.0
0.43
Grain Flour Bran Shorts Grain Flour Bran Shorts
T-2004 (air)
CA (unknown) 0.21 47 1 7
21
0.71 0.31 0.39 0.25
Grain Flour Grain Flour
T-2005 (air)
USA, 1973 0B* <0.01 Harvest aid Anon 1975a IA (unknown) 0.43 28 1 7 2.0
10 Grain Fodder & Forage
T-2778 (air)
NE (Pioneer 878) 0.43 28 1 8 2.5 0.10 6.0 8.4
0.86 5.6
Grain Flour Bran Shorts Germ Fodder
T-2779 (air)
IL (unknown) 0.43 131 1 7 28 Fodder T-2780
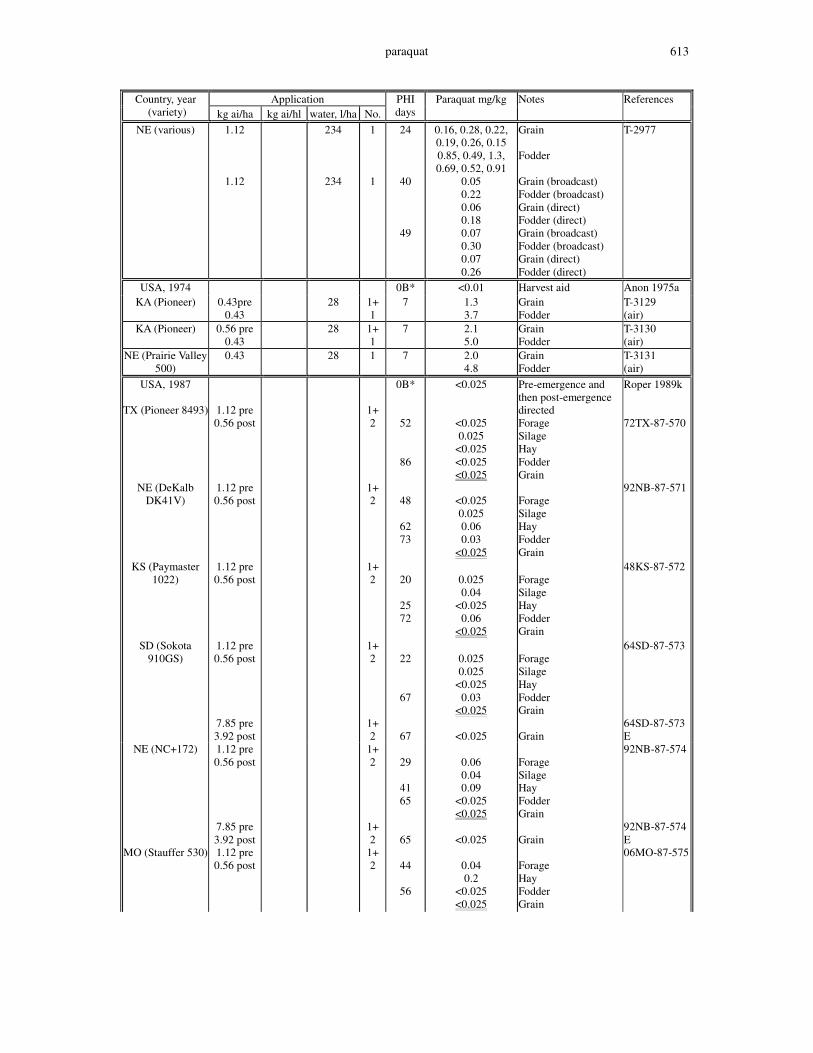
paraquat 613
Application Country, year (variety) kg ai/ha kg ai/hl water, l/ha No.
PHI days
Paraquat mg/kg Notes References
NE (various) 1.12
1.12
234
234
1
1
24
40
49
0.16, 0.28, 0.22, 0.19, 0.26, 0.15 0.85, 0.49, 1.3, 0.69, 0.52, 0.91
0.05 0.22 0.06 0.18 0.07 0.30 0.07 0.26
Grain Fodder Grain (broadcast) Fodder (broadcast) Grain (direct) Fodder (direct) Grain (broadcast) Fodder (broadcast) Grain (direct) Fodder (direct)
T-2977
USA, 1974 0B* <0.01 Harvest aid Anon 1975a KA (Pioneer) 0.43pre
0.43 28 1+
1 7 1.3
3.7 Grain Fodder
T-3129 (air)
KA (Pioneer) 0.56 pre 0.43
28 1+ 1
7 2.1 5.0
Grain Fodder
T-3130 (air)
NE (Prairie Valley 500)
0.43 28 1 7 2.0 4.8
Grain Fodder
T-3131 (air)
USA, 1987
TX (Pioneer 8493)
1.12 pre 0.56 post
1+ 2
0B*
52
86
<0.025
<0.025 0.025
<0.025 <0.025 <0.025
Pre-emergence and then post-emergence directed Forage Silage Hay Fodder Grain
Roper 1989k 72TX-87-570
NE (DeKalb DK41V)
1.12 pre 0.56 post
1+ 2
48
62 73
<0.025 0.025 0.06 0.03
<0.025
Forage Silage Hay Fodder Grain
92NB-87-571
KS (Paymaster 1022)
1.12 pre 0.56 post
1+ 2
20
25 72
0.025 0.04
<0.025 0.06
<0.025
Forage Silage Hay Fodder Grain
48KS-87-572
SD (Sokota 910GS)
1.12 pre 0.56 post
7.85 pre 3.92 post
1+ 2
1+ 2
22
67
67
0.025 0.025
<0.025 0.03
<0.025
<0.025
Forage Silage Hay Fodder Grain Grain
64SD-87-573 64SD-87-573E
NE (NC+172) 1.12 pre 0.56 post
7.85 pre 3.92 post
1+ 2
1+ 2
29
41 65
65
0.06 0.04 0.09
<0.025 <0.025
<0.025
Forage Silage Hay Fodder Grain Grain
92NB-87-574 92NB-87-574E
MO (Stauffer 530) 1.12 pre 0.56 post
1+ 2
44
56
0.04 0.2
<0.025 <0.025
Forage Hay Fodder Grain
06MO-87-575
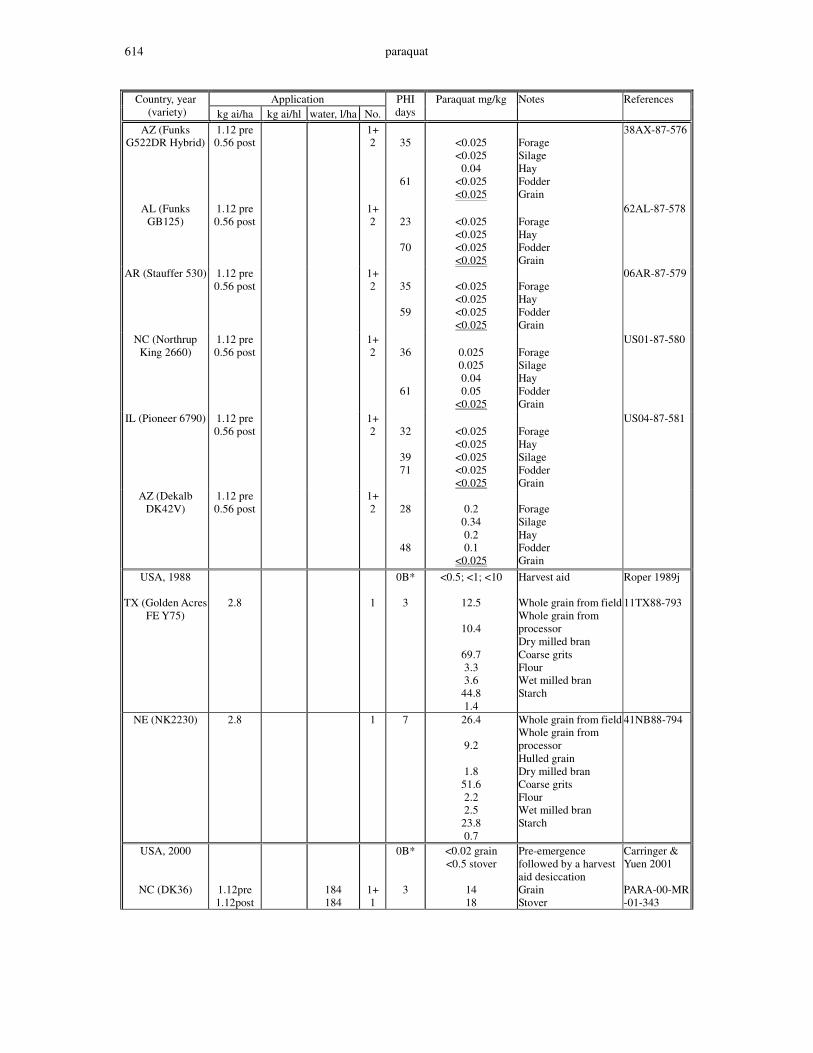
paraquat 614
Application Country, year (variety) kg ai/ha kg ai/hl water, l/ha No.
PHI days
Paraquat mg/kg Notes References
AZ (Funks G522DR Hybrid)
1.12 pre 0.56 post
1+ 2
35
61
<0.025 <0.025
0.04 <0.025 <0.025
Forage Silage Hay Fodder Grain
38AX-87-576
AL (Funks GB125)
1.12 pre 0.56 post
1+ 2
23
70
<0.025 <0.025 <0.025 <0.025
Forage Hay Fodder Grain
62AL-87-578
AR (Stauffer 530) 1.12 pre 0.56 post
1+ 2
35
59
<0.025 <0.025 <0.025 <0.025
Forage Hay Fodder Grain
06AR-87-579
NC (Northrup King 2660)
1.12 pre 0.56 post
1+ 2
36
61
0.025 0.025 0.04 0.05
<0.025
Forage Silage Hay Fodder Grain
US01-87-580
IL (Pioneer 6790) 1.12 pre 0.56 post
1+ 2
32
39 71
<0.025 <0.025 <0.025 <0.025 <0.025
Forage Hay Silage Fodder Grain
US04-87-581
AZ (Dekalb DK42V)
1.12 pre 0.56 post
1+ 2
28
48
0.2
0.34 0.2 0.1
<0.025
Forage Silage Hay Fodder Grain
USA, 1988
TX (Golden Acres FE Y75)
2.8
1
0B*
3
<0.5; <1; <10
12.5
10.4
69.7 3.3 3.6
44.8 1.4
Harvest aid Whole grain from field Whole grain from processor Dry milled bran Coarse grits Flour Wet milled bran Starch
Roper 1989j 11TX88-793
NE (NK2230) 2.8 1 7 26.4
9.2
1.8 51.6 2.2 2.5
23.8 0.7
Whole grain from field Whole grain from processor Hulled grain Dry milled bran Coarse grits Flour Wet milled bran Starch
41NB88-794
USA, 2000 0B* <0.02 grain <0.5 stover
Pre-emergence followed by a harvest aid desiccation
Carringer & Yuen 2001
NC (DK36) 1.12pre 1.12post
184 184
1+ 1
3 14 18
Grain Stover
PARA-00-MR-01-343
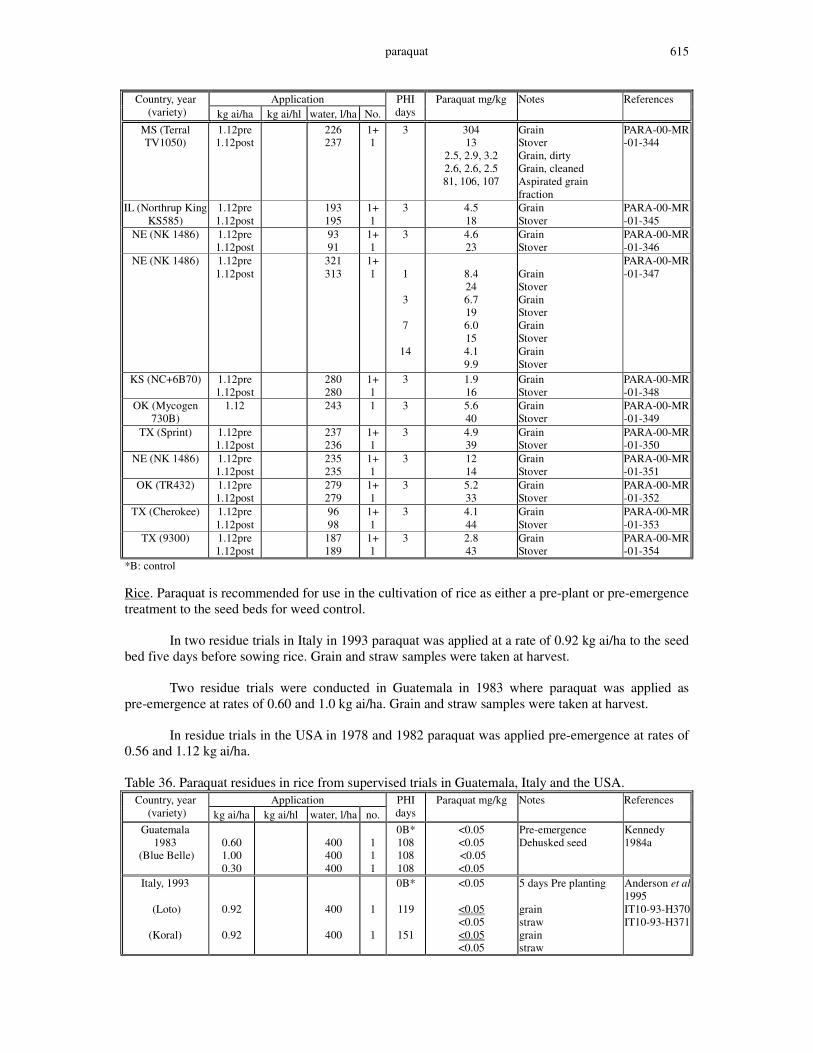
paraquat 615
Application Country, year (variety) kg ai/ha kg ai/hl water, l/ha No.
PHI days
Paraquat mg/kg Notes References
MS (Terral TV1050)
1.12pre 1.12post
226 237
1+ 1
3 304 13
2.5, 2.9, 3.2 2.6, 2.6, 2.5 81, 106, 107
Grain Stover Grain, dirty Grain, cleaned Aspirated grain fraction
PARA-00-MR-01-344
IL (Northrup King KS585)
1.12pre 1.12post
193 195
1+ 1
3 4.5 18
Grain Stover
PARA-00-MR-01-345
NE (NK 1486) 1.12pre 1.12post
93 91
1+ 1
3 4.6 23
Grain Stover
PARA-00-MR-01-346
NE (NK 1486) 1.12pre 1.12post
321 313
1+ 1
1
3
7
14
8.4 24 6.7 19 6.0 15 4.1 9.9
Grain Stover Grain Stover Grain Stover Grain Stover
PARA-00-MR-01-347
KS (NC+6B70) 1.12pre 1.12post
280 280
1+ 1
3 1.9 16
Grain Stover
PARA-00-MR-01-348
OK (Mycogen 730B)
1.12 243 1 3 5.6 40
Grain Stover
PARA-00-MR-01-349
TX (Sprint) 1.12pre 1.12post
237 236
1+ 1
3 4.9 39
Grain Stover
PARA-00-MR-01-350
NE (NK 1486) 1.12pre 1.12post
235 235
1+ 1
3 12 14
Grain Stover
PARA-00-MR-01-351
OK (TR432) 1.12pre 1.12post
279 279
1+ 1
3 5.2 33
Grain Stover
PARA-00-MR-01-352
TX (Cherokee) 1.12pre 1.12post
96 98
1+ 1
3 4.1 44
Grain Stover
PARA-00-MR-01-353
TX (9300) 1.12pre 1.12post
187 189
1+ 1
3 2.8 43
Grain Stover
PARA-00-MR-01-354
*B: control Rice. Paraquat is recommended for use in the cultivation of rice as either a pre-plant or pre-emergence treatment to the seed beds for weed control. In two residue trials in Italy in 1993 paraquat was applied at a rate of 0.92 kg ai/ha to the seed bed five days before sowing rice. Grain and straw samples were taken at harvest. Two residue trials were conducted in Guatemala in 1983 where paraquat was applied as pre-emergence at rates of 0.60 and 1.0 kg ai/ha. Grain and straw samples were taken at harvest. In residue trials in the USA in 1978 and 1982 paraquat was applied pre-emergence at rates of 0.56 and 1.12 kg ai/ha. Table 36. Paraquat residues in rice from supervised trials in Guatemala, Italy and the USA.
Application Country, year (variety) kg ai/ha kg ai/hl water, l/ha no.
PHI days
Paraquat mg/kg Notes References
Guatemala 1983
(Blue Belle)
0.60 1.00 0.30
400 400 400
1 1 1
0B* 108 108 108
<0.05 <0.05 <0.05 <0.05
Pre-emergence Dehusked seed
Kennedy 1984a
Italy, 1993
(Loto)
(Koral)
0.92
0.92
400
400
1
1
0B*
119
151
<0.05
<0.05 <0.05 <0.05 <0.05
5 days Pre planting grain straw grain straw
Anderson et al1995 IT10-93-H370 IT10-93-H371

paraquat 616
Application Country, year (variety) kg ai/ha kg ai/hl water, l/ha no.
PHI days
Paraquat mg/kg Notes References
CA, USA, 1978
(Calrose)
0.56
187
1
0B*
217
<0.01 grain <0.02 straw
<0.01 <0.06
Pre-emergence Grain Straw
Anon 1985 M209-4642
(Calrose) 0.56 187 1 230 <0.01 <0.05
Grain Straw
M209-4641
CA, USA, 1982 0B*
<0.01 grain <0.02, <0.03 straw
Pre-emergence
Anon 1985
(M-9) 0.56 93.5 1 163 <0.01 <0.03
Grain Straw
M209-5650
(M-301) 0.56
1.12
93.5
187
1
1
166
166
<0.01 <0.02 <0.01 <0.02
Grain Straw Grain Straw
M209-5651
(M-101) 0.56
1.12
93.5
187
1
1
167
167
<0.01 0.04
<0.01 <0.03
Grain Straw Grain Straw
M209-5649
(Labelle) 1.12 187 1
106
<0.01 <0.02
Grain Straw
M209-5583
*B: control Tree nuts Paraquat is registered to control weeds around the base of nut trees. Supervised residue trials were carried out over a number of years in Italy on hazelnuts, and in the USA on almonds (California), macadamia nuts (Hawaii), pecans (Alabama and Texas), pistachio (California) and walnuts (California). In trials in Italy hazelnuts were harvested from the ground between 1 and 10 days after treatment around the base of the trees at rates between 0.4 and 1.8 kg ai/ha. In the USA, paraquat was applied at rates between 0.56 and 9.0 kg ai/ha from one to ten times, to control weeds under mature nut trees. In some cases applications were made over two years. Nuts were harvested, in some cases immature, from 1 to 171 days after the last application. In a worst-case situation, almonds were knocked off the tree and harvested from the ground only one day after the last application. Table 37. Paraquat residues in tree nuts from supervised trials in Italy and the USA.
Application Country, year Crop
(variety) kg ai/ha kg ai/hl water, l/ha no.
PHI days
Paraquat mg/kg Notes References
Italy, 1986 Hazelnuts
(Gentile Romana)
0.54
0.89
1.8
1000
1000
1000
1
1
1
0B* 1 3 7
10 1 3 7
10 1 3 7
10
<0.05 <0.05 <0.05 <0.05 <0.05 <0.05 <0.05 <0.05 <0.05 <0.05 <0.05 <0.05 <0.05
Shelled nut analysed (picked from ground)
Gatti 1987
CA, USA Almonds
0B* <0.01 Chevron 2001
1964
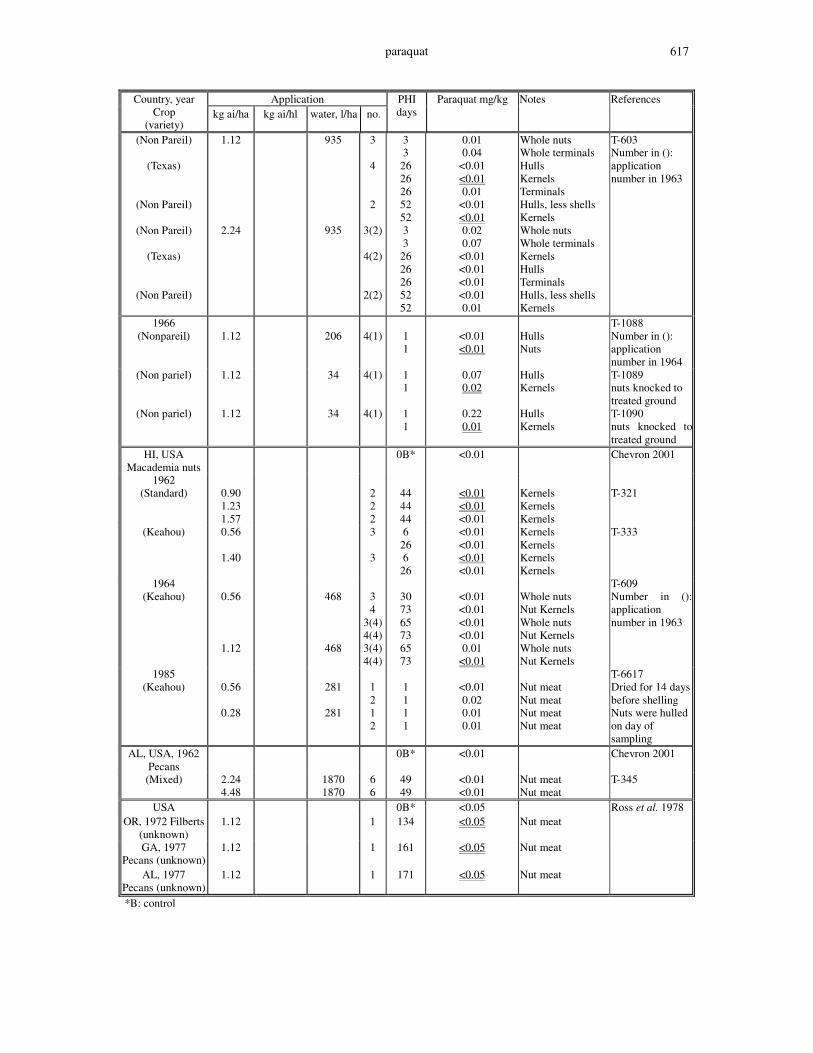
paraquat 617
Application Country, year Crop
(variety) kg ai/ha kg ai/hl water, l/ha no.
PHI days
Paraquat mg/kg Notes References
(Non Pareil)
(Texas)
(Non Pareil)
(Non Pareil)
(Texas)
(Non Pareil)
1.12
2.24
935
935
3
4
2
3(2)
4(2)
2(2)
3 3
26 26 26 52 52 3 3
26 26 26 52 52
0.01 0.04
<0.01 <0.01 0.01
<0.01 <0.01 0.02 0.07
<0.01 <0.01 <0.01 <0.01 0.01
Whole nuts Whole terminals Hulls Kernels Terminals Hulls, less shells Kernels Whole nuts Whole terminals Kernels Hulls Terminals Hulls, less shells Kernels
T-603 Number in (): application number in 1963
1966 (Nonpareil)
1.12
206
4(1)
1 1
<0.01 <0.01
Hulls Nuts
T-1088 Number in (): application number in 1964
(Non pariel) 1.12 34 4(1) 1 1
0.07 0.02
Hulls Kernels
T-1089 nuts knocked to treated ground
(Non pariel) 1.12 34 4(1) 1 1
0.22 0.01
Hulls Kernels
T-1090 nuts knocked to treated ground
HI, USA Macademia nuts
0B* <0.01 Chevron 2001
1962 (Standard)
0.90 1.23 1.57
2 2 2
44 44 44
<0.01 <0.01 <0.01
Kernels Kernels Kernels
T-321
(Keahou) 0.56
1.40
3
3
6 26 6
26
<0.01 <0.01 <0.01 <0.01
Kernels Kernels Kernels Kernels
T-333
1964 (Keahou)
0.56
1.12
468
468
3 4
3(4) 4(4) 3(4) 4(4)
30 73 65 73 65 73
<0.01 <0.01 <0.01 <0.01 0.01
<0.01
Whole nuts Nut Kernels Whole nuts Nut Kernels Whole nuts Nut Kernels
T-609 Number in (): application number in 1963
1985 (Keahou)
0.56
0.28
281
281
1 2 1 2
1 1 1 1
<0.01 0.02 0.01 0.01
Nut meat Nut meat Nut meat Nut meat
T-6617 Dried for 14 days before shelling Nuts were hulled on day of sampling
AL, USA, 1962 Pecans
0B* <0.01 Chevron 2001
(Mixed) 2.24 4.48
1870 1870
6 6
49 49
<0.01 <0.01
Nut meat Nut meat
T-345
USA 0B* <0.05 Ross et al. 1978 OR, 1972 Filberts
(unknown) 1.12 1 134 <0.05 Nut meat
GA, 1977 Pecans (unknown)
1.12 1 161 <0.05
Nut meat
AL, 1977 Pecans (unknown)
1.12 1 171 <0.05 Nut meat
*B: control

paraquat 618
Oil seed Paraquat is recommended for use in the cultivation of cotton and sunflowers as a pre-plant or pre-emergence treatment, a post-emergence directed or guarded spray for inter-row weed control, and for harvest aid desiccation. Several trials were conducted for over several years and locations in the USA on cotton involving pre-emergence applications at 0.14 to 1.12 kg/ha with harvest 4 to 176 days post application. In numerous trials with a pre-emergence followed by a harvest aid desiccation application, cotton was harvested after 3 to 11 days. In 1988 trials in the USA, paraquat was applied pre-emergence to sunflowers at 1.12 or 5.6 kg/ha and with sampling 41 to 131 days post application. In other US trials in various years and locations, paraquat was applied for harvest aid desiccation at 0.28 to 1.12 kg/ha with sampling 7 to 21 days post application. Table 38. Paraquat residues in cotton and sunflowers from supervised trials in the USA.
Application Location, year (variety) kg ai/ha kg ai/hl water, l/ha no.
PHI days
Paraquat mg/kg Notes References
CA, 1963 (Acala
4-42)
1.12
468
1
0B*
121
<0.01
<0.01 <0.01 <0.01
Pre-emergence Seed Trash Lint
Chevron 1967 T-383
CA, 1964 (Acala 4-42)
1.12 468 1 30 60
154
<0.01, <0.01 <0.01, <0.01 <0.01, <0.01
Whole plant T-614
CA, 1965 (Acala 4-42)
1.12 187 1 0B* 147
<0.02 0.02, 0.04
Fuzzy seed
T-771
MS, 1966 (Stoneville 213)
1.12 187 1 172 <0.01, <0.01 Fuzzy seed T-1123
LA, 1966 (DPL smootleaf)
1.12 187 1 176 <0.01, <0.01 Fuzzy seed T-1124
AR, 1966 (Rex) 1.12 374 1 171 <0.01, <0.01 Fuzzy seed T-1125 1971
MS (Delta pine
land 16)
0.56 pre 0.14 post
187 187
1+ 1
0B*
4
<0.01
0.21, 0.25
Pre-emergence followed by harvest aid desiccation Fuzzy seed
Whipp & Kalens 1972 T-2151
MS (Stoneville 213)
0.56 pre 0.14 post
187 187
1+ 1
7
0.12, 0.12
Fuzzy seed
T-2152
LA (Coker 201) 0.56 pre 0.14 post
187 187
1+ 1
7
0.07, 0.12
Fuzzy seed
T-2153
LA (Rex smooth leaf 66)
0.56 pre 0.14 post
187 187
1+ 1
4
0.11, 0.18
Fuzzy seed
T-2154
1964
TX (Delta pine)
0.28
0.56
1 1
0B*
9.5
9.5
<0.01
0.02, 0.02, 0.03, 0.04
0.03, 0.07, 0.14, 0.17
Harvest aid desiccation Fuzzy seed Fuzzy seed
Chevron 1966 T-655
MS (DPL15) 0.28
0.56
1 1
10
10
<0.01, <0.01, 0.06, 0.07
0.02, 0.02, 0.02, 0.03
Fuzzy seed Fuzzy seed
T-656
CA (Acala 4-42) 0.28
0.56
1 1
11
11
<0.01, <0.01, <0.01, <0.01 <0.01, <0.01, <0.01, <0.01
Fuzzy seed Fuzzy seed
T-657
CA (Acala 4-42) 0.14
1
5 11
<0.01, <0.01 <0.01, <0.01
Fuzzy seed
T-659

paraquat 619
Application Location, year (variety) kg ai/ha kg ai/hl water, l/ha no.
PHI days
Paraquat mg/kg Notes References
TX (Blightmaster) 0.56
1
9
9
9
9
9
9
9
0.97, 0.97, 1.28, 1.76
0.08, 0.09, 0.10, 0.18
<0.01, <0.01, <0.01, <0.01 <0.01, <0.01,
<0.01, 0.01 <0.01, <0.01, <0.01, 0.01
<0.01, <0.01, <0.01, <0.01 <0.01, <0.01, <0.01, <0.01
Cotton (including trash & bolls) Fuzzy seed Acid-delinted seed Mechanically delinted seed Hulls Crude oil Meal
T-654
TX (Rex)
0.56
1 1 5 10 5 10 10 10
10 10 10 10
15, 15 2.1, 2.6 2.0, 2.1
0.11, 0.13 0.18, 0.18
0.05, 0.051 0.08, 0.08
2.8, 3.3
0.13, 0.13 <0.01, <0.01
0.02, 0.02
Cotton (including trash & bolls) Fuzzy seed Acid-delinted seed Mechanically delinted seed Lint cotton Hulls Crude oil Meal
T-653
1965 0B*
<0.01
Harvest aid desiccation
Chevron 1966
TX (Stoneville 7A)
0.28 1 10 0.03, 0.04 Fuzzy seed T-742
TX (Stoneville 7A)
0.28 1 10 0.10, 0.15 Fuzzy seed T-743
OK (Lankart 23-3) 0.28 1 9 0.03, 0.13 Fuzzy seed T-745 TX (Stoneville
7A) 0.28
2
10 0.28, 0.31 Fuzzy seed T-746
TX (Stoneville 7A)
0.28 2 7 0.13, 0.16 Fuzzy seed T-747
OK (Lankart 23-3) 0.28 2 7 0.33, 0.40 Fuzzy seed T-749 CA (Acala 4-42) 0.56 1 3
5 0.09, 0.12 0.18, 0.30
Fuzzy seed T-938
CA (Acala 4-42) 0.56
1 3 5
0.11, 0.11 0.12, 0.15
Fuzzy seed T-939
TX (Lankart 57) 0.42 0.28
0.56 0.28
0.90
1+ 1
1+ 1 1
4
5
6
0.10, 0.18
0.34
0.62
Fuzzy seed Fuzzy seed Fuzzy seed
T-786
1993 0B* <0.05 Pre-emergence followed by post-emergence, harvest aid
Roper 1994
NM (Paymaster 792)
1.4pre 0.14post 0.56post
1.4pre
0.84post
1+ 2+ 1
1+ 1
3 5
3 5
0.16 0.11
0.26 0.34
Seed Seed
13-NM-93-371
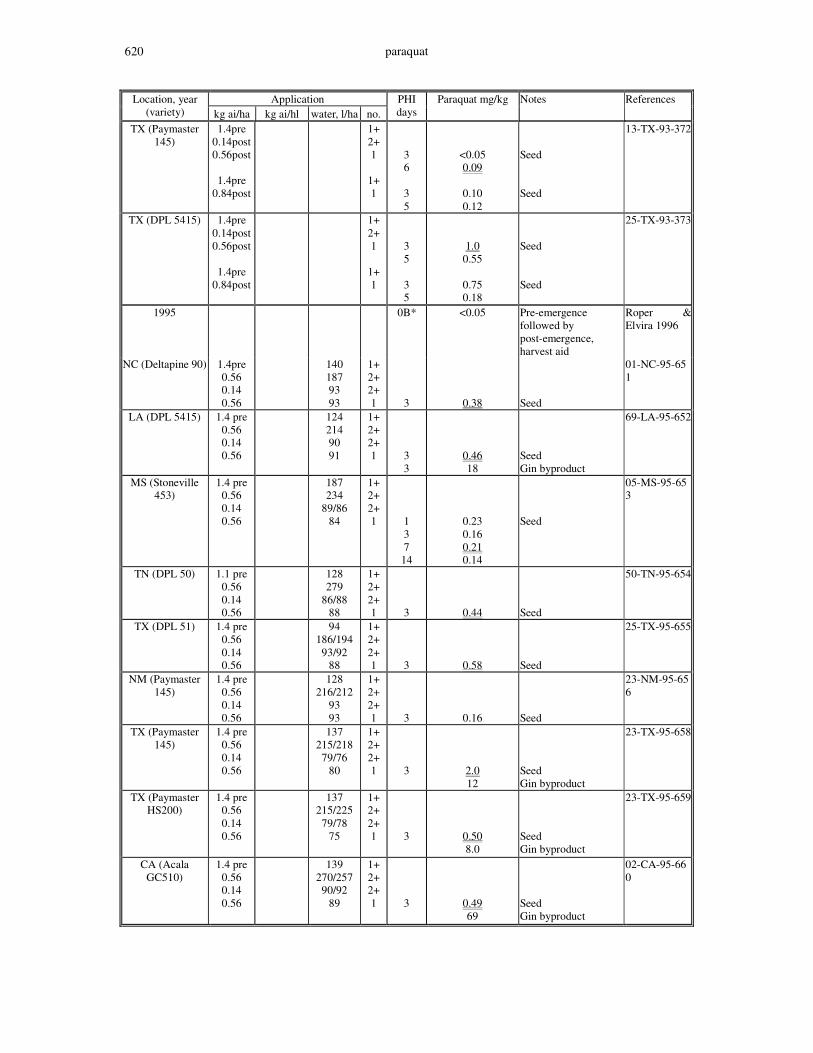
paraquat 620
Application Location, year (variety) kg ai/ha kg ai/hl water, l/ha no.
PHI days
Paraquat mg/kg Notes References
TX (Paymaster 145)
1.4pre 0.14post 0.56post
1.4pre
0.84post
1+ 2+ 1
1+ 1
3 6
3 5
<0.05 0.09
0.10 0.12
Seed Seed
13-TX-93-372
TX (DPL 5415) 1.4pre 0.14post 0.56post
1.4pre
0.84post
1+ 2+ 1
1+ 1
3 5
3 5
1.0 0.55
0.75 0.18
Seed Seed
25-TX-93-373
1995 0B* <0.05 Pre-emergence followed by post-emergence, harvest aid
Roper & Elvira 1996
NC (Deltapine 90) 1.4pre 0.56 0.14 0.56
140 187 93 93
1+ 2+ 2+ 1
3
0.38
Seed
01-NC-95-651
LA (DPL 5415) 1.4 pre 0.56 0.14 0.56
124 214 90 91
1+ 2+ 2+ 1
3 3
0.46 18
Seed Gin byproduct
69-LA-95-652
MS (Stoneville 453)
1.4 pre 0.56 0.14 0.56
187 234
89/86 84
1+ 2+ 2+ 1
1 3 7 14
0.23 0.16 0.21 0.14
Seed
05-MS-95-653
TN (DPL 50) 1.1 pre 0.56 0.14 0.56
128 279
86/88 88
1+ 2+ 2+ 1
3
0.44
Seed
50-TN-95-654
TX (DPL 51) 1.4 pre 0.56 0.14 0.56
94 186/194 93/92
88
1+ 2+ 2+ 1
3
0.58
Seed
25-TX-95-655
NM (Paymaster 145)
1.4 pre 0.56 0.14 0.56
128 216/212
93 93
1+ 2+ 2+ 1
3
0.16
Seed
23-NM-95-656
TX (Paymaster 145)
1.4 pre 0.56 0.14 0.56
137 215/218 79/76
80
1+ 2+ 2+ 1
3
2.0 12
Seed Gin byproduct
23-TX-95-658
TX (Paymaster HS200)
1.4 pre 0.56 0.14 0.56
137 215/225 79/78
75
1+ 2+ 2+ 1
3
0.50 8.0
Seed Gin byproduct
23-TX-95-659
CA (Acala GC510)
1.4 pre 0.56 0.14 0.56
139 270/257 90/92
89
1+ 2+ 2+ 1
3
0.49 69
Seed Gin byproduct
02-CA-95-660

paraquat 621
Application Location, year (variety) kg ai/ha kg ai/hl water, l/ha no.
PHI days
Paraquat mg/kg Notes References
CA (DP 5461) 1.4 pre 0.56 0.14 0.56
150 187/222 77/78
80
1+ 2+ 2+ 1
3
0.07
Seed
14-CA-95-661
AZ (DPL 20) 1.4 pre 0.56 0.14 0.56
104 126/127 79/80
80
1+ 2+ 2+ 1
3
0.23 23
Seed Gin byproduct
14-AZ-95-662
OK (Paymaster HS200)
1.4 pre 0.56 0.14 0.56
136 185/192 69/68
67
1+ 2+ 2+ 1
3
0.35 5.3
Seed Gin byproduct
23-OK-95-663
B=control Table 39. Paraquat residues in sunflower seed from supervised trials in the USA.
Application Year, location (variety) kg ai/ha kg ai/hl water,
l/ha no.
PHI days
Paraquat mg/kg Notes References
1988 0B* <0.05 Pre-emergence Roper 1989o SD (Interstate 893) 5.6 1 84
131 <0.05 <0.05
Forage Seed
31SD-88-475
ND (Pioneer 6445) 5.6 215 1 B* 74
122
<0.05 <0.05 <0.05
Forage Seed
34ND-88-476
ND (Pioneer 6440) 1.1 1 74 122
<0.05 <0.05
Forage Seed
34ND-88-528
SD (unknown) 1.1 1 84 131
<0.05 <0.05
Forage Seed
31SD-88-529
MN (NK285) 1.1 1 76 111
<0.05 <0.05
Forage Seed
33MN-88-530
TX (Texas Triumph 565)
1.1 210 1 41 118
<0.05 <0.05
Forage Seed
10TX-88-531
1994 0B* <0.05 Pre-emergence; post directed; & harvest aid
Roper 1995
ND (Pioneer DO 827)
1.12 0.70 0.56
142 59
142
1+ 1+ 1
7
0.93
Seed 34ND-94-202
SD, (Cargill 100) 1.12 0.70 0.56
142 59
142
1+ 1+ 1
7
0.74
Seed
34SD-94-203
1971 0B* <0.01 Harvest aid Chevron 1975a CA (Peredovik) 0.28
0.56
374
374
1
1
0 7
14 0 7
14
0.08, 0.08 0.10, 0.11 0.23, 0.27 0.17, 0.12
<0.01, <0.01 0.11, 0.11 0.16, 0.16 0.35, 0.35 0.57, 0.67 0.54, 0.55
<0.01, <0.01 0.23, 0.23
Seed Seed Hull Meal Oil Seed Seed Seed Hull Meal Oil Seed
T-2185
MS (NK-HO1) 0.28
0.56
46
46
1
1
0 7
14 0
0.05, 0.11 0.10, 0.31 1.3, 2.4
0.64, 1.2 <0.01, <0.01
0.38, 0.52 0.19, 0.19
Seed Seed Hull Meal Oil Seed Seed
T-2186
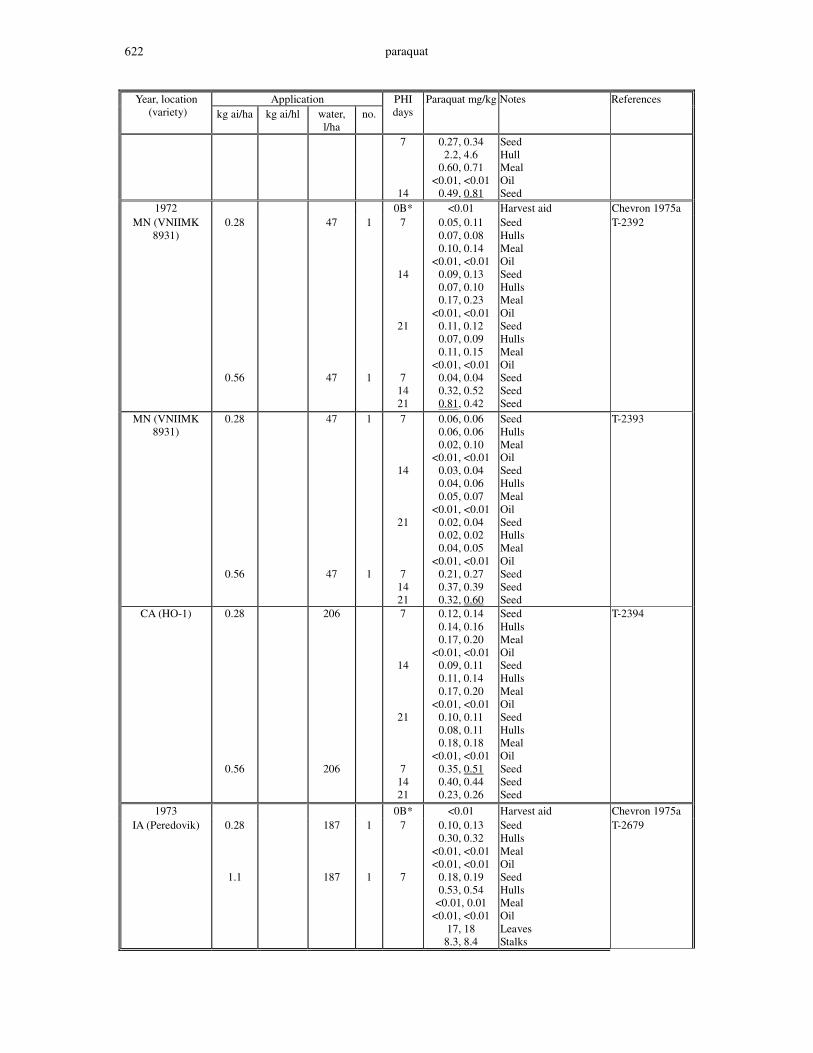
paraquat 622
Application Year, location (variety) kg ai/ha kg ai/hl water,
l/ha no.
PHI days
Paraquat mg/kg Notes References
7
14
0.27, 0.34 2.2, 4.6
0.60, 0.71 <0.01, <0.01
0.49, 0.81
Seed Hull Meal Oil Seed
1972 0B* <0.01 Harvest aid Chevron 1975a MN (VNIIMK
8931) 0.28
0.56
47
47
1
1
7
14
21
7 14 21
0.05, 0.11 0.07, 0.08 0.10, 0.14
<0.01, <0.01 0.09, 0.13 0.07, 0.10 0.17, 0.23
<0.01, <0.01 0.11, 0.12 0.07, 0.09 0.11, 0.15
<0.01, <0.01 0.04, 0.04 0.32, 0.52 0.81, 0.42
Seed Hulls Meal Oil Seed Hulls Meal Oil Seed Hulls Meal Oil Seed Seed Seed
T-2392
MN (VNIIMK 8931)
0.28
0.56
47
47
1
1
7
14
21
7 14 21
0.06, 0.06 0.06, 0.06 0.02, 0.10
<0.01, <0.01 0.03, 0.04 0.04, 0.06 0.05, 0.07
<0.01, <0.01 0.02, 0.04 0.02, 0.02 0.04, 0.05
<0.01, <0.01 0.21, 0.27 0.37, 0.39 0.32, 0.60
Seed Hulls Meal Oil Seed Hulls Meal Oil Seed Hulls Meal Oil Seed Seed Seed
T-2393
CA (HO-1) 0.28
0.56
206
206
7
14
21
7 14 21
0.12, 0.14 0.14, 0.16 0.17, 0.20
<0.01, <0.01 0.09, 0.11 0.11, 0.14 0.17, 0.20
<0.01, <0.01 0.10, 0.11 0.08, 0.11 0.18, 0.18
<0.01, <0.01 0.35, 0.51 0.40, 0.44 0.23, 0.26
Seed Hulls Meal Oil Seed Hulls Meal Oil Seed Hulls Meal Oil Seed Seed Seed
T-2394
1973 0B* <0.01 Harvest aid Chevron 1975a IA (Peredovik) 0.28
1.1
187
187
1
1
7
7
0.10, 0.13 0.30, 0.32
<0.01, <0.01 <0.01, <0.01
0.18, 0.19 0.53, 0.54
<0.01, 0.01 <0.01, <0.01
17, 18 8.3, 8.4
Seed Hulls Meal Oil Seed Hulls Meal Oil Leaves Stalks
T-2679
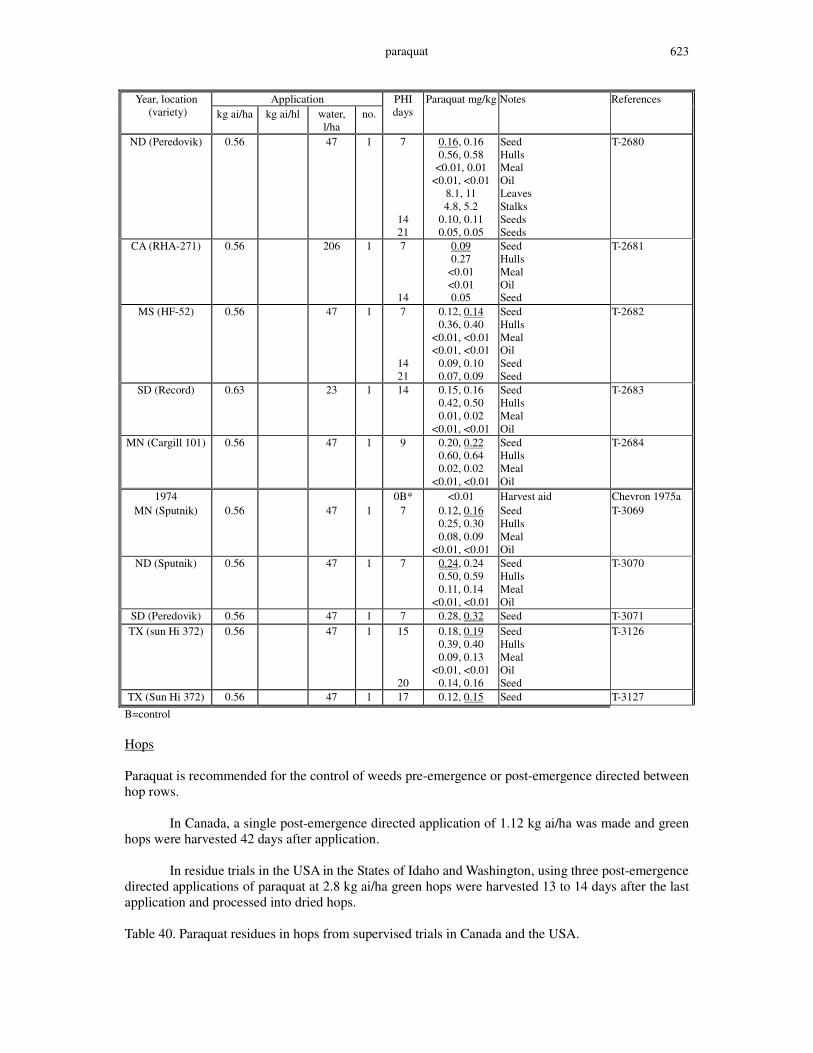
paraquat 623
Application Year, location (variety) kg ai/ha kg ai/hl water,
l/ha no.
PHI days
Paraquat mg/kg Notes References
ND (Peredovik) 0.56 47 1 7
14 21
0.16, 0.16 0.56, 0.58
<0.01, 0.01 <0.01, <0.01
8.1, 11 4.8, 5.2
0.10, 0.11 0.05, 0.05
Seed Hulls Meal Oil Leaves Stalks Seeds Seeds
T-2680
CA (RHA-271) 0.56 206
1 7
14
0.09 0.27
<0.01 <0.01 0.05
Seed Hulls Meal Oil Seed
T-2681
MS (HF-52) 0.56 47 1 7
14 21
0.12, 0.14 0.36, 0.40
<0.01, <0.01 <0.01, <0.01
0.09, 0.10 0.07, 0.09
Seed Hulls Meal Oil Seed Seed
T-2682
SD (Record) 0.63 23 1 14 0.15, 0.16 0.42, 0.50 0.01, 0.02
<0.01, <0.01
Seed Hulls Meal Oil
T-2683
MN (Cargill 101) 0.56 47 1 9 0.20, 0.22 0.60, 0.64 0.02, 0.02
<0.01, <0.01
Seed Hulls Meal Oil
T-2684
1974 0B* <0.01 Harvest aid Chevron 1975a MN (Sputnik) 0.56 47 1 7 0.12, 0.16
0.25, 0.30 0.08, 0.09
<0.01, <0.01
Seed Hulls Meal Oil
T-3069
ND (Sputnik) 0.56 47 1 7 0.24, 0.24 0.50, 0.59 0.11, 0.14
<0.01, <0.01
Seed Hulls Meal Oil
T-3070
SD (Peredovik) 0.56 47 1 7 0.28, 0.32 Seed T-3071 TX (sun Hi 372) 0.56 47 1 15
20
0.18, 0.19 0.39, 0.40 0.09, 0.13
<0.01, <0.01 0.14, 0.16
Seed Hulls Meal Oil Seed
T-3126
TX (Sun Hi 372) 0.56 47 1 17 0.12, 0.15 Seed T-3127
B=control Hops Paraquat is recommended for the control of weeds pre-emergence or post-emergence directed between hop rows. In Canada, a single post-emergence directed application of 1.12 kg ai/ha was made and green hops were harvested 42 days after application. In residue trials in the USA in the States of Idaho and Washington, using three post-emergence directed applications of paraquat at 2.8 kg ai/ha green hops were harvested 13 to 14 days after the last application and processed into dried hops. Table 40. Paraquat residues in hops from supervised trials in Canada and the USA.
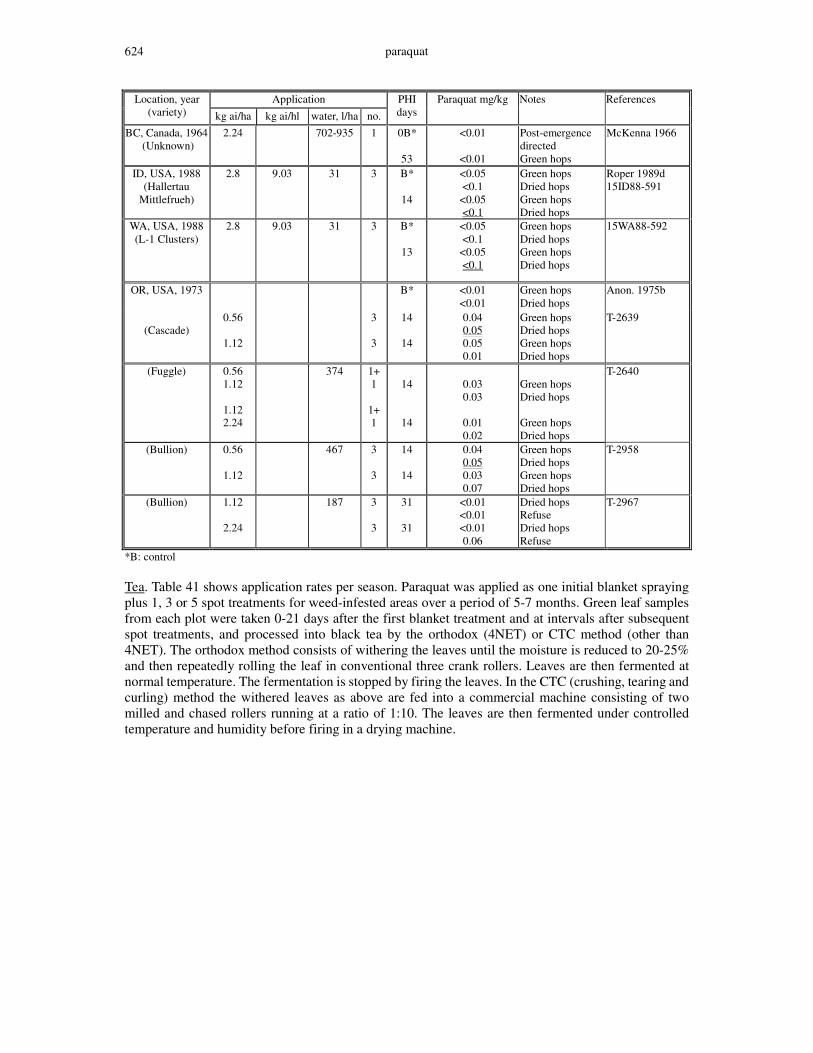
paraquat 624
Application Location, year (variety) kg ai/ha kg ai/hl water, l/ha no.
PHI days
Paraquat mg/kg Notes References
BC, Canada, 1964 (Unknown)
2.24 702-935 1 0B*
53
<0.01
<0.01
Post-emergence directed Green hops
McKenna 1966
ID, USA, 1988 (Hallertau
Mittlefrueh)
2.8 9.03 31 3 B*
14
<0.05 <0.1
<0.05 <0.1
Green hops Dried hops Green hops Dried hops
Roper 1989d 15ID88-591
WA, USA, 1988 (L-1 Clusters)
2.8 9.03 31 3 B*
13
<0.05 <0.1
<0.05 <0.1
Green hops Dried hops Green hops Dried hops
15WA88-592
OR, USA, 1973 B*
<0.01 <0.01
Green hops Dried hops
Anon. 1975b
(Cascade)
0.56
1.12
3
3
14
14
0.04 0.05 0.05 0.01
Green hops Dried hops Green hops Dried hops
T-2639
(Fuggle) 0.56 1.12
1.12 2.24
374 1+ 1
1+ 1
14
14
0.03 0.03
0.01 0.02
Green hops Dried hops Green hops Dried hops
T-2640
(Bullion) 0.56
1.12
467 3
3
14
14
0.04 0.05 0.03 0.07
Green hops Dried hops Green hops Dried hops
T-2958
(Bullion) 1.12
2.24
187 3
3
31
31
<0.01 <0.01 <0.01 0.06
Dried hops Refuse Dried hops Refuse
T-2967
*B: control Tea. Table 41 shows application rates per season. Paraquat was applied as one initial blanket spraying plus 1, 3 or 5 spot treatments for weed-infested areas over a period of 5-7 months. Green leaf samples from each plot were taken 0-21 days after the first blanket treatment and at intervals after subsequent spot treatments, and processed into black tea by the orthodox (4NET) or CTC method (other than 4NET). The orthodox method consists of withering the leaves until the moisture is reduced to 20-25% and then repeatedly rolling the leaf in conventional three crank rollers. Leaves are then fermented at normal temperature. The fermentation is stopped by firing the leaves. In the CTC (crushing, tearing and curling) method the withered leaves as above are fed into a commercial machine consisting of two milled and chased rollers running at a ratio of 1:10. The leaves are then fermented under controlled temperature and humidity before firing in a drying machine.
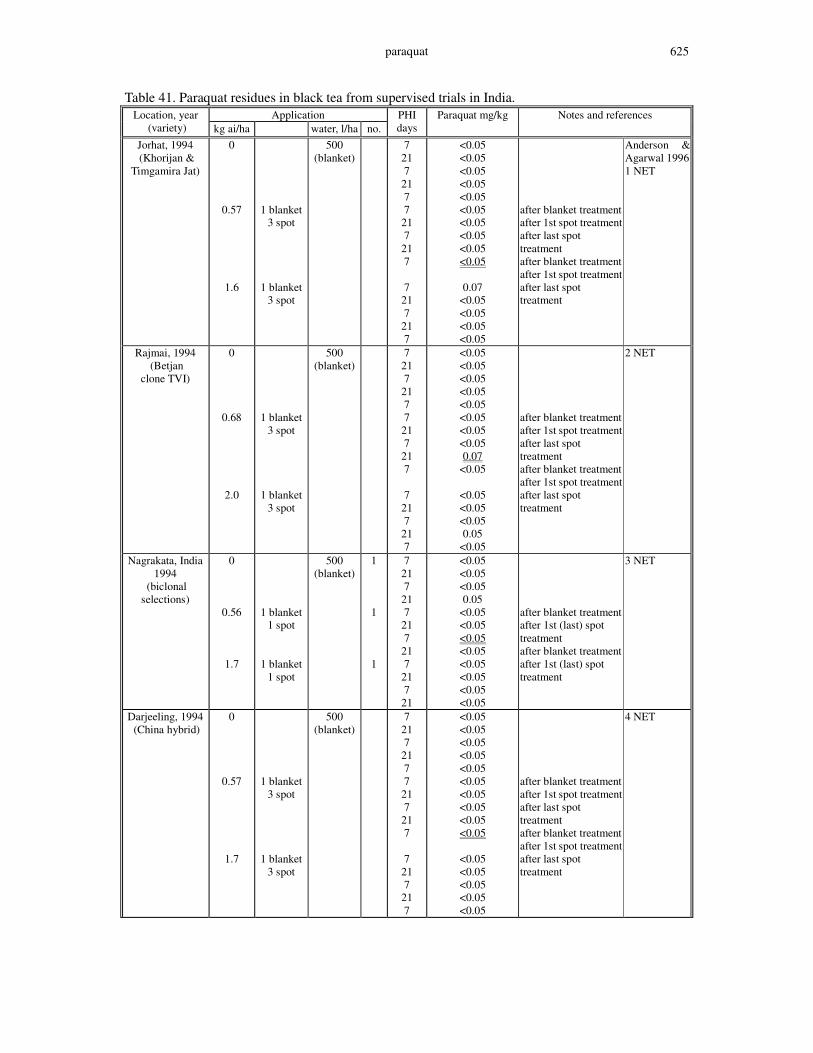
paraquat 625
Table 41. Paraquat residues in black tea from supervised trials in India. Application Location, year
(variety) kg ai/ha water, l/ha no. PHI days
Paraquat mg/kg Notes and references
Jorhat, 1994 (Khorijan &
Timgamira Jat)
0
0.57
1.6
1 blanket 3 spot
1 blanket 3 spot
500 (blanket)
7 21 7
21 7 7
21 7
21 7
7 21 7
21 7
<0.05 <0.05 <0.05 <0.05 <0.05 <0.05 <0.05 <0.05 <0.05 <0.05
0.07
<0.05 <0.05 <0.05 <0.05
after blanket treatment after 1st spot treatment after last spot treatment after blanket treatment after 1st spot treatment after last spot treatment
Anderson & Agarwal 1996 1 NET
Rajmai, 1994 (Betjan
clone TVI)
0
0.68
2.0
1 blanket 3 spot
1 blanket 3 spot
500 (blanket)
7 21 7
21 7 7
21 7
21 7
7 21 7
21 7
<0.05 <0.05 <0.05 <0.05 <0.05 <0.05 <0.05 <0.05 0.07
<0.05
<0.05 <0.05 <0.05 0.05
<0.05
after blanket treatment after 1st spot treatment after last spot treatment after blanket treatment after 1st spot treatment after last spot treatment
2 NET
Nagrakata, India 1994
(biclonal selections)
0
0.56
1.7
1 blanket 1 spot
1 blanket 1 spot
500 (blanket)
1
1
1
7 21 7
21 7
21 7
21 7
21 7
21
<0.05 <0.05 <0.05 0.05
<0.05 <0.05 <0.05 <0.05 <0.05 <0.05 <0.05 <0.05
after blanket treatment after 1st (last) spot treatment after blanket treatment after 1st (last) spot treatment
3 NET
Darjeeling, 1994 (China hybrid)
0
0.57
1.7
1 blanket 3 spot
1 blanket 3 spot
500 (blanket)
7 21 7
21 7 7
21 7
21 7
7 21 7
21 7
<0.05 <0.05 <0.05 <0.05 <0.05 <0.05 <0.05 <0.05 <0.05 <0.05
<0.05 <0.05 <0.05 <0.05 <0.05
after blanket treatment after 1st spot treatment after last spot treatment after blanket treatment after 1st spot treatment after last spot treatment
4 NET

paraquat 626
Application Location, year (variety) kg ai/ha water, l/ha no.
PHI days
Paraquat mg/kg Notes and references
Valpari, India 1994
(Upasi-17 clone)
0
0.56
1.7
1 blanket 5 spot
1 blanket 5 spot
500 (blanket)
7 21 7 7
21 7
7 21 7
<0.05 <0.05 0.13 0.09 0.08 0.07
0.09 0.08 0.07
after blanket treatment after last spot treatment after blanket treatment after last spot treatment
5 ST
Munnar, India 1994
(China hybrid)
0
0.56
1.7
1 blanket 3 spot
1 blanket 3 spot
500 (blanket)
7 21 7 7
21 5
7 21 5
<0.05 <0.05 <0.05 <0.05 0.12
<0.05
<0.05 <0.05 <0.05
after blanket treatment after last spot treatment after blanket treatment after last spot treatment
6 ST
Assam, India (Clone T3E3)
Site I
0.25 0.06 400 1 5 7
0.05 <0.05
Indian submission, 2004
0.19 0.05 400 1 5 7
<0.05 <0.05
0.19 0.05 400 1 5 7
<0.05 <0.05
0.19 0.05 400 1 5 7
<0.05 <0.05
Animal feedingstuffs Soya forage and hay or fodder Table 42. Paraquat residues in soya beans from supervised trials in the USA.
Application Year (variety) kg ai/ha kg
ai/hl water, l/ha
no PHI days
Paraquat mg/kg Notes References
1988 0B* <0.025, <0.05 Pre-emergence Roper 1989l IN (Decalb CX324) 1.1 79
96 <0.025 <0.05
Forage Hay
23IN-88-584
MS (Asgrow) 1.1 113 113
<0.025 <0.05
Forage Hay
48MS-88-585
MN (Evans) 1.1 132 147
<0.025 <0.05
Forage Hay
38MN-88-787
OH (unknown) 1.1 106 106
<0.025 <0.05
Forage Hay
27OH-88-788
1987 OB* <0.025 Pre-emergence, post-emergence directed
Roper 1989m
NE (Asgrow 3127) 1.1 pre 0.14 post
1+ 2
52 63 88
<0.025 <0.025 <0.025
Forage Hay or fodder Seed
92NB-87-560
IL (William 82) 1.1 pre 0.14 post
1+ 2
59 59 90
<0.025 <0.025 <0.025
Forage Hay or fodder Seed
US04-87-561

paraquat 627
Application Year (variety) kg ai/ha kg
ai/hl water, l/ha
no PHI days
Paraquat mg/kg Notes References
IA (Pioneer 9271) 1.1 pre 0.14 post
1+ 2
37 84 84
<0.025
0.2 0.03
Forage Hay or fodder Seed
A1IA-87-562
LA (Yield King 613) 1.1 pre 0.14 post
1+ 2
19 48 63
0.05 0.1
<0.025
Forage Hay or fodder Seed
36LA-87-563
MS (Centennial) 1.1 pre 0.14 post
1+ 2
65 79 79
<0.025
0.05 <0.025
Forage Hay or fodder Seed
US05-87-564
MO (Asgrow 3544) 1.1 pre 0.14 post
1+ 2
53
102 102
<0.025 <0.025 <0.025
Forage Hay or fodder Seed
48MO-87-565
AR (DPL 504) 1.1 pre 0.14 post
1+ 2
74 41
109
<0.025 <0.025 <0.025
Forage Hay or fodder Seed
06AR-87-566
AL (Braxton) 1.1 pre 0.14 post
1+ 2
70
138 138
<0.025 <0.025 <0.025
Forage Hay or fodder Seed
62AL-87-567
GA (Kirby) 1.1 pre 0.14 post
1+ 2
34 79 79
<0.025
0.04 <0.025
Forage Hay or fodder Seed
83GA-87-568
De (Pioneer 9441) 1.1 pre 0.14 post
1+ 2
3
30 30
1.8 0.3
<0.025
Forage Hay or fodder Seed
44DE-87-569
1997 0B* <0.05 Pre-emergence Spillner et al. 1999
NC(Hyperformer 574) TN(Hutachson) AR(AG5901) LA(Delta Pine
DP3478) IA(Pella) IA(D260) IA(L2233)
IL(Asgrow A3237) IL(Asgrow 4401)
IL(Asgrow 2704 STS) IN(Pioneer 9342)
IN(Alder 373) KS(Ciba 373)
MN(ICI D162) MO(Ciba 3362)
OH(Asgrow 3701) SD(Garst D210)
WI(Asgrow XP19505) MS(Asgrow 5979) NE(Pioneer 9281)
WI(Asgrow AG-2501)
1.4 1 36 30 23 29 36 36 42 44 42 44 53 47 36 40 42 50 47 36 27 30 36
0.08 0.28
<0.05 <0.05 0.07 0.15
<0.05 <0.05 0.06
<0.05 0.06
<0.05 <0.05 <0.05 <0.05 <0.05 <0.05 <0.05 0.06 0.06
<0.05
Forage 01-NC-97-610 50-TN-97-611 49-AR-97-612 69-LA-97-613 63-IA-97-615 63-IA-97-616 63-IA-97-617 04-IL-97-618 60-IL-97-619 60-IL-97-620 67-IN-97-621 67-IN-97-622 37-KS-97-623 36-MN-97-624 37-MO-97-625 89-OH-97-627 34-SD-97-628 79-WI-97-629 05-MS-97-631 68-NE-97-632
79-WI-97-633
0B* <0.05 Pre-emergence, then two post-emergence directed then one spot application
Spillner et al. 1999
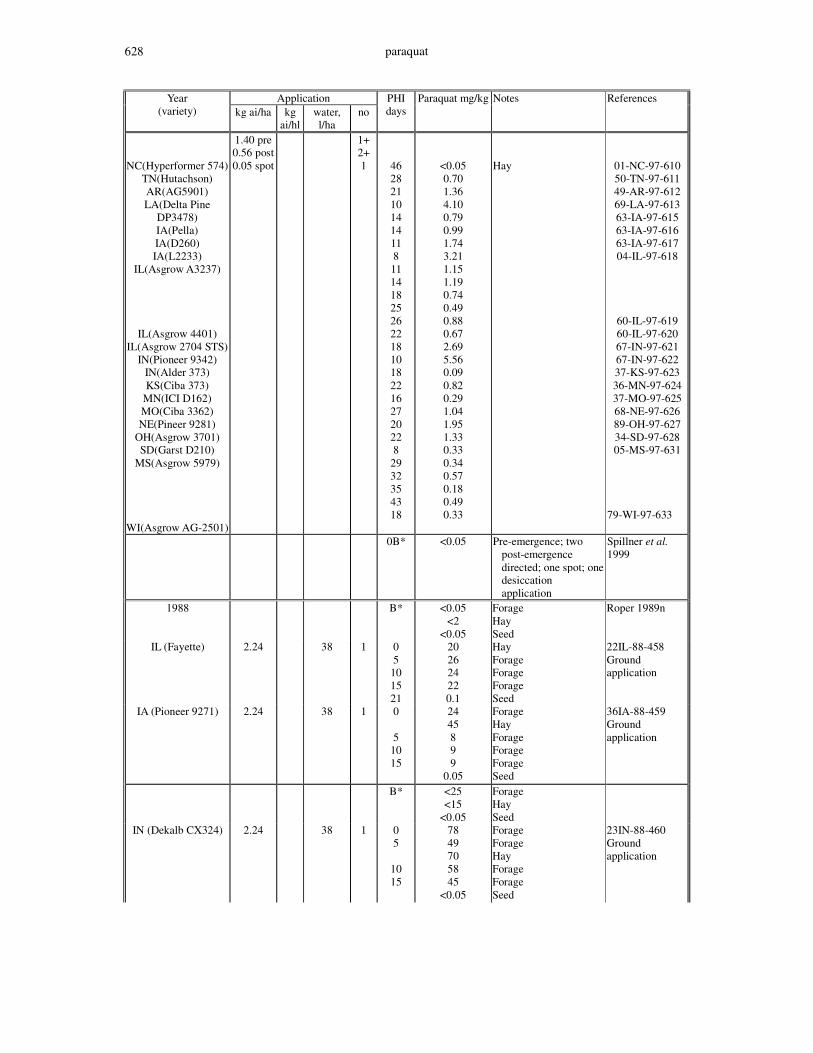
paraquat 628
Application Year (variety) kg ai/ha kg
ai/hl water, l/ha
no PHI days
Paraquat mg/kg Notes References
NC(Hyperformer 574) TN(Hutachson) AR(AG5901) LA(Delta Pine
DP3478) IA(Pella) IA(D260) IA(L2233)
IL(Asgrow A3237)
IL(Asgrow 4401) IL(Asgrow 2704 STS)
IN(Pioneer 9342) IN(Alder 373) KS(Ciba 373)
MN(ICI D162) MO(Ciba 3362) NE(Pineer 9281)
OH(Asgrow 3701) SD(Garst D210)
MS(Asgrow 5979)
WI(Asgrow AG-2501)
1.40 pre 0.56 post 0.05 spot
1+ 2+ 1
46 28 21 10 14 14 11 8 11 14 18 25 26 22 18 10 18 22 16 27 20 22 8
29 32 35 43 18
<0.05 0.70 1.36 4.10 0.79 0.99 1.74 3.21 1.15 1.19 0.74 0.49 0.88 0.67 2.69 5.56 0.09 0.82 0.29 1.04 1.95 1.33 0.33 0.34 0.57 0.18 0.49 0.33
Hay
01-NC-97-610 50-TN-97-611 49-AR-97-612 69-LA-97-613 63-IA-97-615 63-IA-97-616 63-IA-97-617 04-IL-97-618
60-IL-97-619 60-IL-97-620 67-IN-97-621 67-IN-97-622 37-KS-97-623 36-MN-97-624 37-MO-97-625 68-NE-97-626 89-OH-97-627 34-SD-97-628 05-MS-97-631
79-WI-97-633
0B* <0.05 Pre-emergence; two post-emergence directed; one spot; one desiccation application
Spillner et al. 1999
1988 B* <0.05 <2
<0.05
Forage Hay Seed
Roper 1989n
IL (Fayette)
2.24 38 1 0 5
10 15 21
20 26 24 22 0.1
Hay Forage Forage Forage Seed
22IL-88-458 Ground application
IA (Pioneer 9271) 2.24 38 1 0 5
10 15
24 45 8 9 9
0.05
Forage Hay Forage Forage Forage Seed
36IA-88-459 Ground application
B*
<25 <15
<0.05
Forage Hay Seed
IN (Dekalb CX324) 2.24 38 1 0 5
10 15
78 49 70 58 45
<0.05
Forage Forage Hay Forage Forage Seed
23IN-88-460 Ground application

paraquat 629
Application Year (variety) kg ai/ha kg
ai/hl water, l/ha
no PHI days
Paraquat mg/kg Notes References
MS (DPL 506) 2.24 38 1 0 5
10 15
70 124 49 88 73
0.05
Forage Hay Forage Forage Forage Seed
48MS-88-461 Ground application
MO (Williams) 2.24 38 1 0 5 11 15 20
49 29 51 54 43 0.1
Forage Hay Forage Forage Forage Seed
40MO-88-462 Ground application
MN (Evans) 2.24 38 1 0 5
10 15
30 16 40 29 24 0.1
Forage Hay Forage Forage Forage Seed
33MN-88-463 Ground application
OH (unknown) 2.24 38 1 0 5
10 15 36
135 140 221 125 161
2
Forage Hay Forage Forage Forage Seed
27OH-88-464 Ground application
B* <0.05 <2
<0.05
Forage Hay Seed
IL (Pioneer 9271) 2.24 38 1 0 5
10 15 21
20 26 24 22 0.1
Hay Forage Forage Forage Seed
22IL-88-536 Aerial application
IA (Sieben SS-235) 2.24 38 1 0 5
10 15
0.12 80 10 15 9
0.2
Forage Hay Forage Forage Forage Seed
36IA-88-537 Aerial application
IN (Century) 2.24 38 1 0 5
10 15 25
29 26 23 25 13
<0.05
Forage Forage Hay Forage Forage Seed
24IN-88-538 Aerial application
MS (DPL 506) 2.24 38 1 1 5
10 15 15
38 31 27 47 33 0.2
Forage Hay Forage Forage Forage Seed
48MS-88-539 Aerial application
MO (Williams 82) 2.24 38 1 0 5
10 15 19
19 38 10 10 <5 0.1
Forage Hay Forage Forage Forage Seed
37MO-88-540 Aerial application
MN (BSR 101) 2.24 38 1 0 5
10 15 22
59 2
23 23 22
0.08
Forage Hay Forage Forage Forage Seed
30MN-88-541 Aerial application
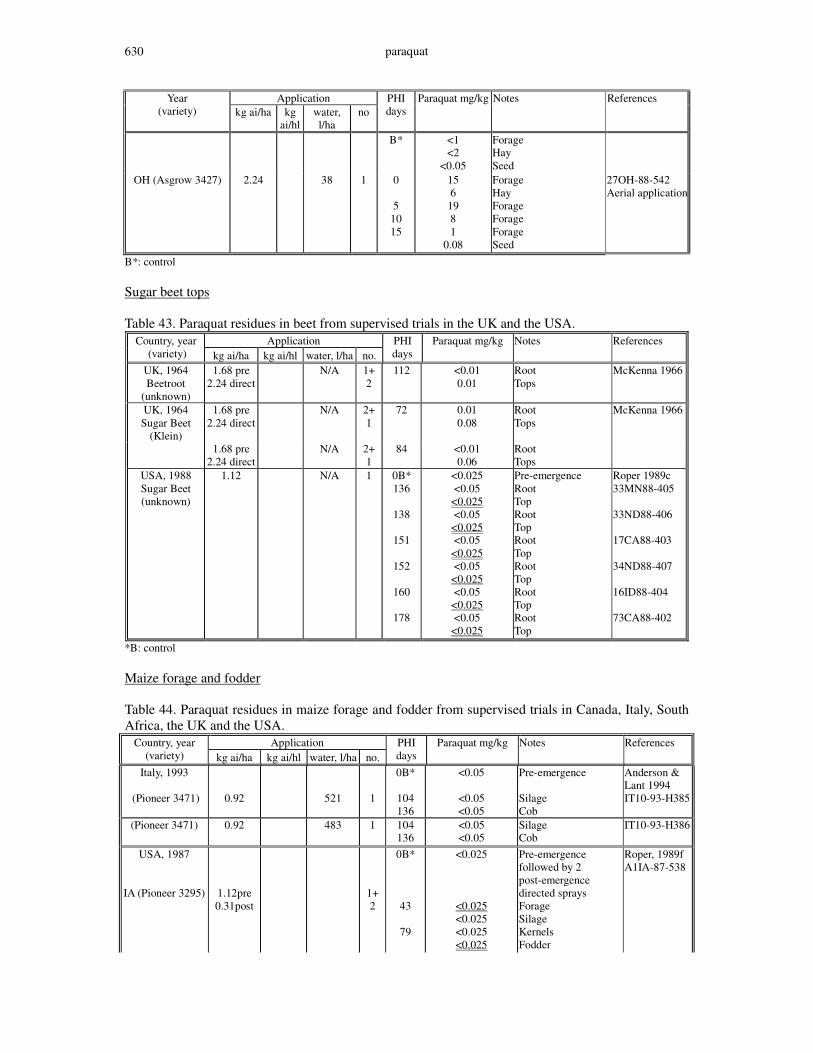
paraquat 630
Application Year (variety) kg ai/ha kg
ai/hl water, l/ha
no PHI days
Paraquat mg/kg Notes References
B*
<1 <2
<0.05
Forage Hay Seed
OH (Asgrow 3427) 2.24 38 1 0 5
10 15
15 6
19 8 1
0.08
Forage Hay Forage Forage Forage Seed
27OH-88-542 Aerial application
B*: control Sugar beet tops Table 43. Paraquat residues in beet from supervised trials in the UK and the USA.
Application Country, year (variety) kg ai/ha kg ai/hl water, l/ha no.
PHI days
Paraquat mg/kg Notes References
UK, 1964 Beetroot
(unknown)
1.68 pre 2.24 direct
N/A 1+ 2
112 <0.01 0.01
Root Tops
McKenna 1966
UK, 1964 Sugar Beet
(Klein)
1.68 pre 2.24 direct
N/A 2+ 1
72 0.01 0.08
Root Tops
McKenna 1966
1.68 pre 2.24 direct
N/A 2+ 1
84 <0.01 0.06
Root Tops
USA, 1988 Sugar Beet (unknown)
1.12 N/A 1 0B* 136
138
151
152
160
178
<0.025 <0.05
<0.025 <0.05
<0.025 <0.05
<0.025 <0.05
<0.025 <0.05
<0.025 <0.05
<0.025
Pre-emergence Root Top Root Top Root Top Root Top Root Top Root Top
Roper 1989c 33MN88-405 33ND88-406 17CA88-403 34ND88-407 16ID88-404 73CA88-402
*B: control Maize forage and fodder Table 44. Paraquat residues in maize forage and fodder from supervised trials in Canada, Italy, South Africa, the UK and the USA.
Application Country, year (variety) kg ai/ha kg ai/hl water, l/ha no.
PHI days
Paraquat mg/kg Notes References
Italy, 1993
(Pioneer 3471)
0.92
521
1
0B*
104 136
<0.05
<0.05 <0.05
Pre-emergence Silage Cob
Anderson & Lant 1994 IT10-93-H385
(Pioneer 3471)
0.92 483 1 104 136
<0.05 <0.05
Silage Cob
IT10-93-H386
USA, 1987
IA (Pioneer 3295)
1.12pre 0.31post
1+ 2
0B*
43
79
<0.025
<0.025 <0.025 <0.025 <0.025
Pre-emergence followed by 2 post-emergence directed sprays Forage Silage Kernels Fodder
Roper, 1989f A1IA-87-538
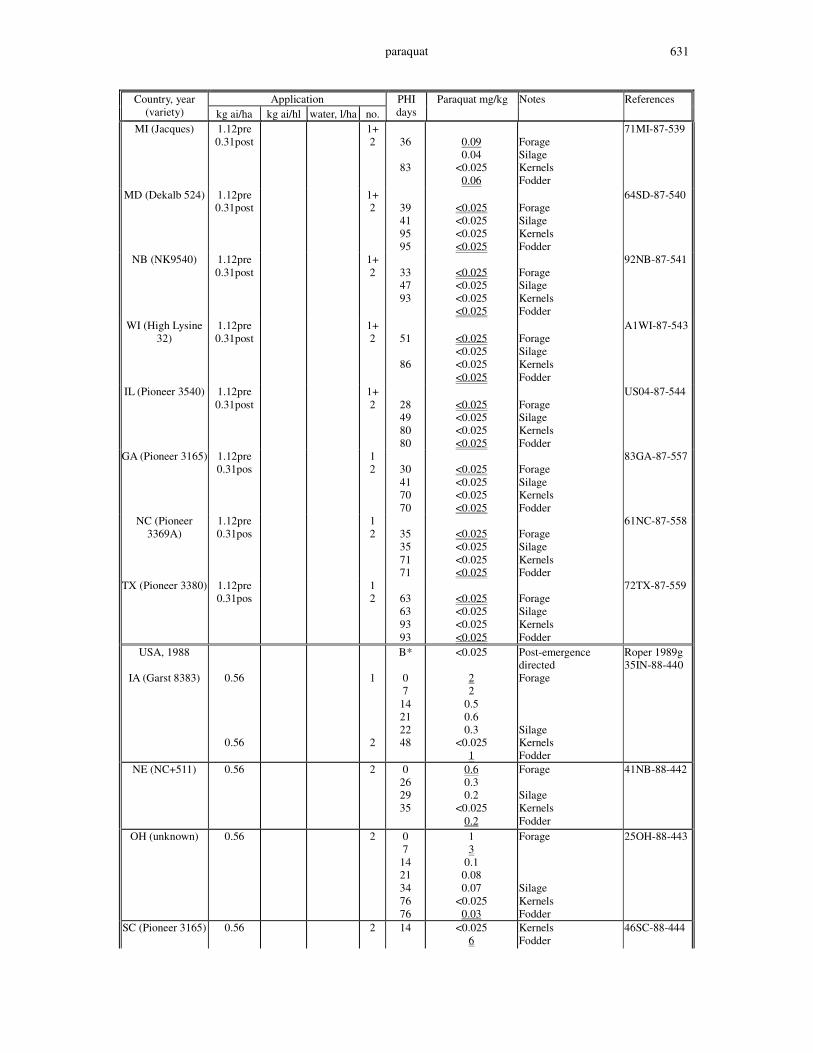
paraquat 631
Application Country, year (variety) kg ai/ha kg ai/hl water, l/ha no.
PHI days
Paraquat mg/kg Notes References
MI (Jacques) 1.12pre 0.31post
1+ 2
36
83
0.09 0.04
<0.025 0.06
Forage Silage Kernels Fodder
71MI-87-539
MD (Dekalb 524) 1.12pre 0.31post
1+ 2
39 41 95 95
<0.025 <0.025 <0.025 <0.025
Forage Silage Kernels Fodder
64SD-87-540
NB (NK9540) 1.12pre 0.31post
1+ 2
33 47 93
<0.025 <0.025 <0.025 <0.025
Forage Silage Kernels Fodder
92NB-87-541
WI (High Lysine 32)
1.12pre 0.31post
1+ 2
51
86
<0.025 <0.025 <0.025 <0.025
Forage Silage Kernels Fodder
A1WI-87-543
IL (Pioneer 3540) 1.12pre 0.31post
1+ 2
28 49 80 80
<0.025 <0.025 <0.025 <0.025
Forage Silage Kernels Fodder
US04-87-544
GA (Pioneer 3165) 1.12pre 0.31pos
1 2
30 41 70 70
<0.025 <0.025 <0.025 <0.025
Forage Silage Kernels Fodder
83GA-87-557
NC (Pioneer 3369A)
1.12pre 0.31pos
1 2
35 35 71 71
<0.025 <0.025 <0.025 <0.025
Forage Silage Kernels Fodder
61NC-87-558
TX (Pioneer 3380) 1.12pre 0.31pos
1 2
63 63 93 93
<0.025 <0.025 <0.025 <0.025
Forage Silage Kernels Fodder
72TX-87-559
USA, 1988
IA (Garst 8383)
0.56
0.56
1
2
B*
0 7
14 21 22 48
<0.025
2 2
0.5 0.6 0.3
<0.025 1
Post-emergence directed Forage Silage Kernels Fodder
Roper 1989g 35IN-88-440
NE (NC+511) 0.56 2 0 26 29 35
0.6 0.3 0.2
<0.025 0.2
Forage Silage Kernels Fodder
41NB-88-442
OH (unknown) 0.56 2 0 7
14 21 34 76 76
1 3
0.1 0.08 0.07
<0.025 0.03
Forage Silage Kernels Fodder
25OH-88-443
SC (Pioneer 3165) 0.56 2 14
<0.025 6
Kernels Fodder
46SC-88-444
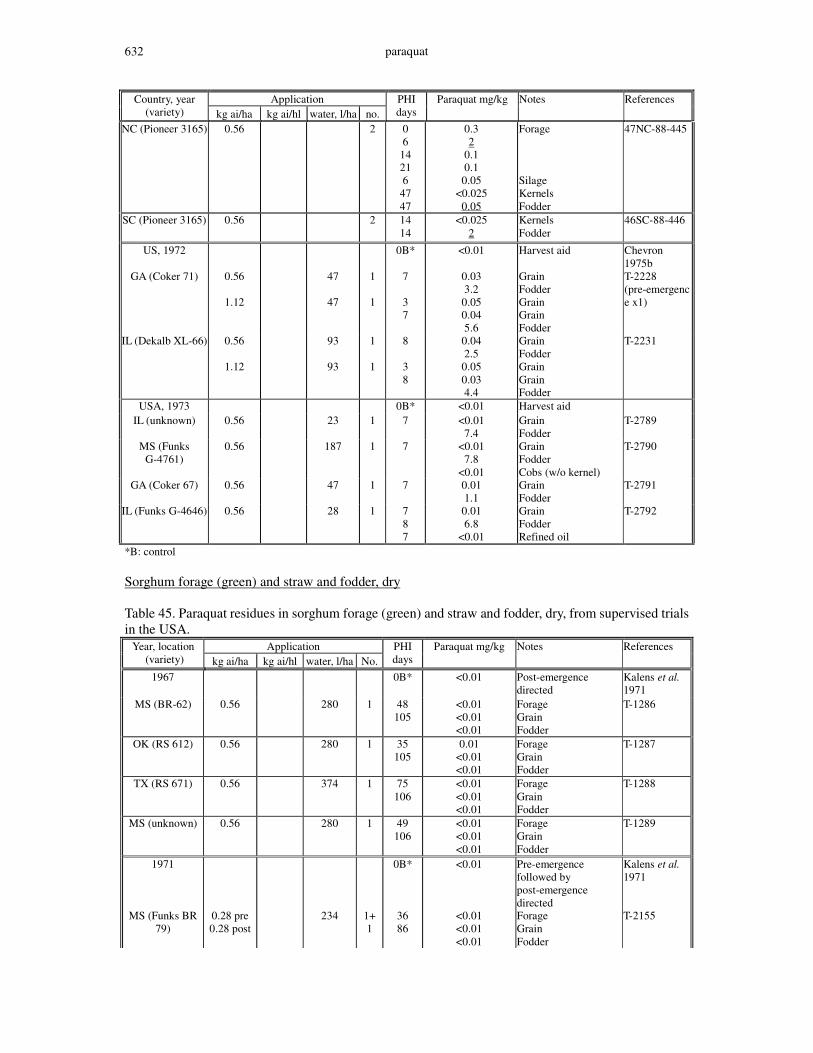
paraquat 632
Application Country, year (variety) kg ai/ha kg ai/hl water, l/ha no.
PHI days
Paraquat mg/kg Notes References
NC (Pioneer 3165) 0.56 2 0 6
14 21 6
47 47
0.3 2
0.1 0.1 0.05
<0.025 0.05
Forage Silage Kernels Fodder
47NC-88-445
SC (Pioneer 3165) 0.56 2 14 14
<0.025 2
Kernels Fodder
46SC-88-446
US, 1972
GA (Coker 71)
0.56
1.12
47
47
1
1
0B*
7
3 7
<0.01
0.03 3.2 0.05 0.04 5.6
Harvest aid Grain Fodder Grain Grain Fodder
Chevron 1975b T-2228 (pre-emergence x1)
IL (Dekalb XL-66) 0.56
1.12
93
93
1
1
8
3 8
0.04 2.5 0.05 0.03 4.4
Grain Fodder Grain Grain Fodder
T-2231
USA, 1973 0B* <0.01 Harvest aid IL (unknown) 0.56 23 1 7 <0.01
7.4 Grain Fodder
T-2789
MS (Funks G-4761)
0.56 187 1 7 <0.01 7.8
<0.01
Grain Fodder Cobs (w/o kernel)
T-2790
GA (Coker 67) 0.56 47 1 7 0.01 1.1
Grain Fodder
T-2791
IL (Funks G-4646) 0.56 28 1 7 8 7
0.01 6.8
<0.01
Grain Fodder Refined oil
T-2792
*B: control Sorghum forage (green) and straw and fodder, dry Table 45. Paraquat residues in sorghum forage (green) and straw and fodder, dry, from supervised trials in the USA.
Application Year, location (variety) kg ai/ha kg ai/hl water, l/ha No.
PHI days
Paraquat mg/kg Notes References
1967
0B*
<0.01
Post-emergence directed
Kalens et al. 1971
MS (BR-62) 0.56 280 1 48 105
<0.01 <0.01 <0.01
Forage Grain Fodder
T-1286
OK (RS 612) 0.56 280 1 35 105
0.01 <0.01 <0.01
Forage Grain Fodder
T-1287
TX (RS 671) 0.56 374 1 75 106
<0.01 <0.01 <0.01
Forage Grain Fodder
T-1288
MS (unknown) 0.56 280 1 49 106
<0.01 <0.01 <0.01
Forage Grain Fodder
T-1289
1971 0B* <0.01 Pre-emergence followed by post-emergence directed
Kalens et al. 1971
MS (Funks BR 79)
0.28 pre 0.28 post
234 1+ 1
36 86
<0.01 <0.01 <0.01
Forage Grain Fodder
T-2155
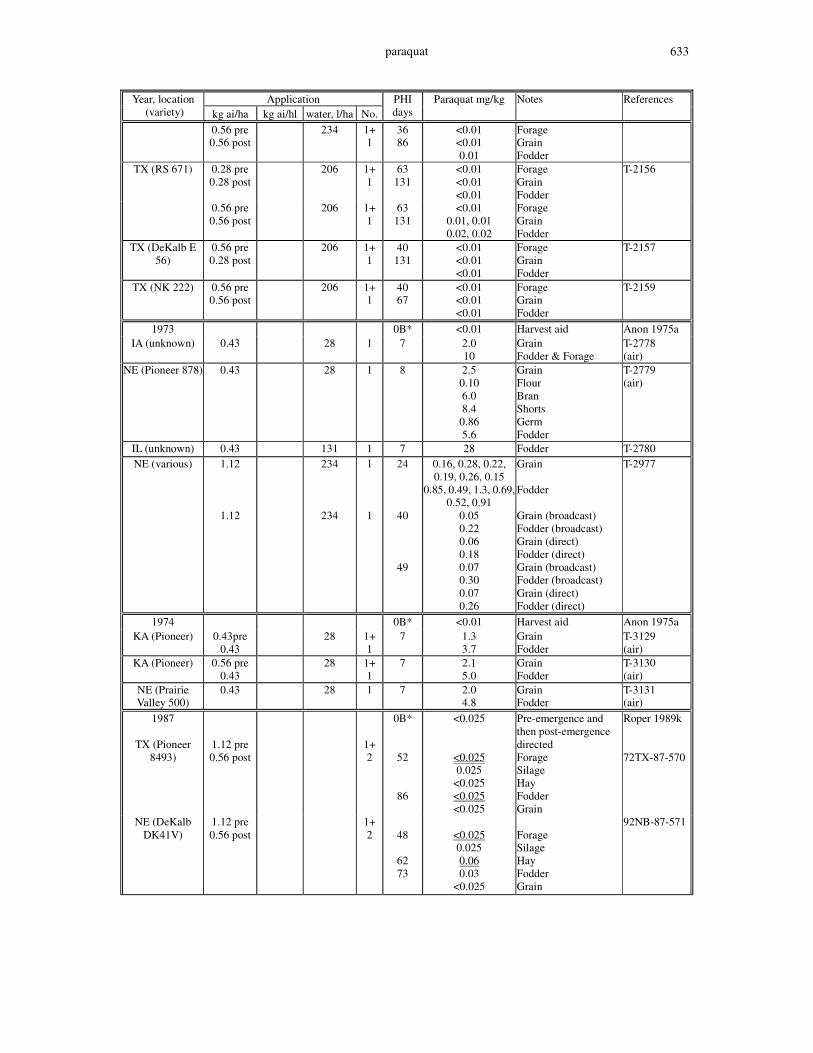
paraquat 633
Application Year, location (variety) kg ai/ha kg ai/hl water, l/ha No.
PHI days
Paraquat mg/kg Notes References
0.56 pre 0.56 post
234 1+ 1
36 86
<0.01 <0.01 0.01
Forage Grain Fodder
TX (RS 671) 0.28 pre 0.28 post
206 1+ 1
63 131
<0.01 <0.01 <0.01
Forage Grain Fodder
T-2156
0.56 pre 0.56 post
206 1+ 1
63 131
<0.01 0.01, 0.01 0.02, 0.02
Forage Grain Fodder
TX (DeKalb E 56)
0.56 pre 0.28 post
206 1+ 1
40 131
<0.01 <0.01 <0.01
Forage Grain Fodder
T-2157
TX (NK 222) 0.56 pre 0.56 post
206 1+ 1
40 67
<0.01 <0.01 <0.01
Forage Grain Fodder
T-2159
1973 0B* <0.01 Harvest aid Anon 1975a IA (unknown) 0.43 28 1 7 2.0
10 Grain Fodder & Forage
T-2778 (air)
NE (Pioneer 878) 0.43 28 1 8 2.5 0.10 6.0 8.4 0.86 5.6
Grain Flour Bran Shorts Germ Fodder
T-2779 (air)
IL (unknown) 0.43 131 1 7 28 Fodder T-2780 NE (various) 1.12
1.12
234
234
1
1
24
40
49
0.16, 0.28, 0.22, 0.19, 0.26, 0.15
0.85, 0.49, 1.3, 0.69, 0.52, 0.91
0.05 0.22 0.06 0.18 0.07 0.30 0.07 0.26
Grain Fodder Grain (broadcast) Fodder (broadcast) Grain (direct) Fodder (direct) Grain (broadcast) Fodder (broadcast) Grain (direct) Fodder (direct)
T-2977
1974 0B* <0.01 Harvest aid Anon 1975a KA (Pioneer) 0.43pre
0.43 28 1+
1 7 1.3
3.7 Grain Fodder
T-3129 (air)
KA (Pioneer) 0.56 pre 0.43
28 1+ 1
7 2.1 5.0
Grain Fodder
T-3130 (air)
NE (Prairie Valley 500)
0.43 28 1 7 2.0 4.8
Grain Fodder
T-3131 (air)
1987
TX (Pioneer 8493)
1.12 pre 0.56 post
1+ 2
0B*
52
86
<0.025
<0.025 0.025
<0.025 <0.025 <0.025
Pre-emergence and then post-emergence directed Forage Silage Hay Fodder Grain
Roper 1989k 72TX-87-570
NE (DeKalb DK41V)
1.12 pre 0.56 post
1+ 2
48
62 73
<0.025 0.025 0.06 0.03
<0.025
Forage Silage Hay Fodder Grain
92NB-87-571
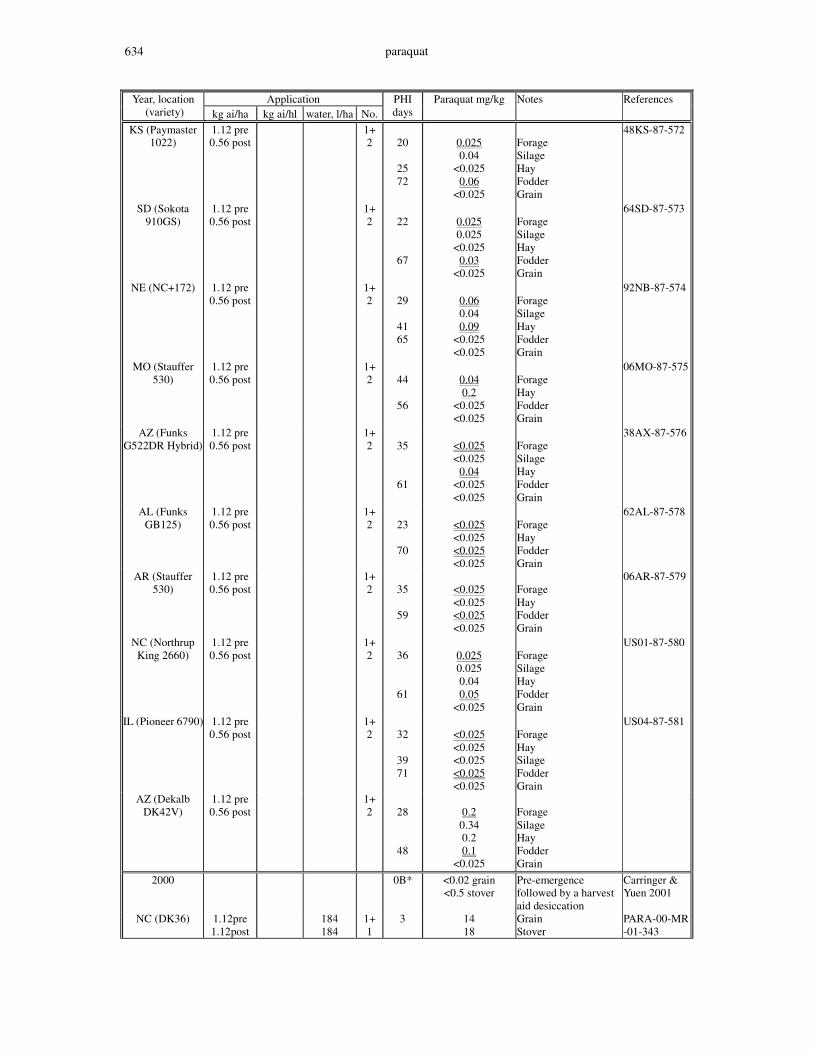
paraquat 634
Application Year, location (variety) kg ai/ha kg ai/hl water, l/ha No.
PHI days
Paraquat mg/kg Notes References
KS (Paymaster 1022)
1.12 pre 0.56 post
1+ 2
20
25 72
0.025 0.04
<0.025 0.06
<0.025
Forage Silage Hay Fodder Grain
48KS-87-572
SD (Sokota 910GS)
1.12 pre 0.56 post
1+ 2
22
67
0.025 0.025
<0.025 0.03
<0.025
Forage Silage Hay Fodder Grain
64SD-87-573
NE (NC+172) 1.12 pre 0.56 post
1+ 2
29
41 65
0.06 0.04 0.09
<0.025 <0.025
Forage Silage Hay Fodder Grain
92NB-87-574
MO (Stauffer 530)
1.12 pre 0.56 post
1+ 2
44
56
0.04 0.2
<0.025 <0.025
Forage Hay Fodder Grain
06MO-87-575
AZ (Funks G522DR Hybrid)
1.12 pre 0.56 post
1+ 2
35
61
<0.025 <0.025
0.04 <0.025 <0.025
Forage Silage Hay Fodder Grain
38AX-87-576
AL (Funks GB125)
1.12 pre 0.56 post
1+ 2
23
70
<0.025 <0.025 <0.025 <0.025
Forage Hay Fodder Grain
62AL-87-578
AR (Stauffer 530)
1.12 pre 0.56 post
1+ 2
35
59
<0.025 <0.025 <0.025 <0.025
Forage Hay Fodder Grain
06AR-87-579
NC (Northrup King 2660)
1.12 pre 0.56 post
1+ 2
36
61
0.025 0.025 0.04 0.05
<0.025
Forage Silage Hay Fodder Grain
US01-87-580
IL (Pioneer 6790) 1.12 pre 0.56 post
1+ 2
32
39 71
<0.025 <0.025 <0.025 <0.025 <0.025
Forage Hay Silage Fodder Grain
US04-87-581
AZ (Dekalb DK42V)
1.12 pre 0.56 post
1+ 2
28
48
0.2 0.34 0.2 0.1
<0.025
Forage Silage Hay Fodder Grain
2000 0B* <0.02 grain <0.5 stover
Pre-emergence followed by a harvest aid desiccation
Carringer & Yuen 2001
NC (DK36) 1.12pre 1.12post
184 184
1+ 1
3 14 18
Grain Stover
PARA-00-MR-01-343
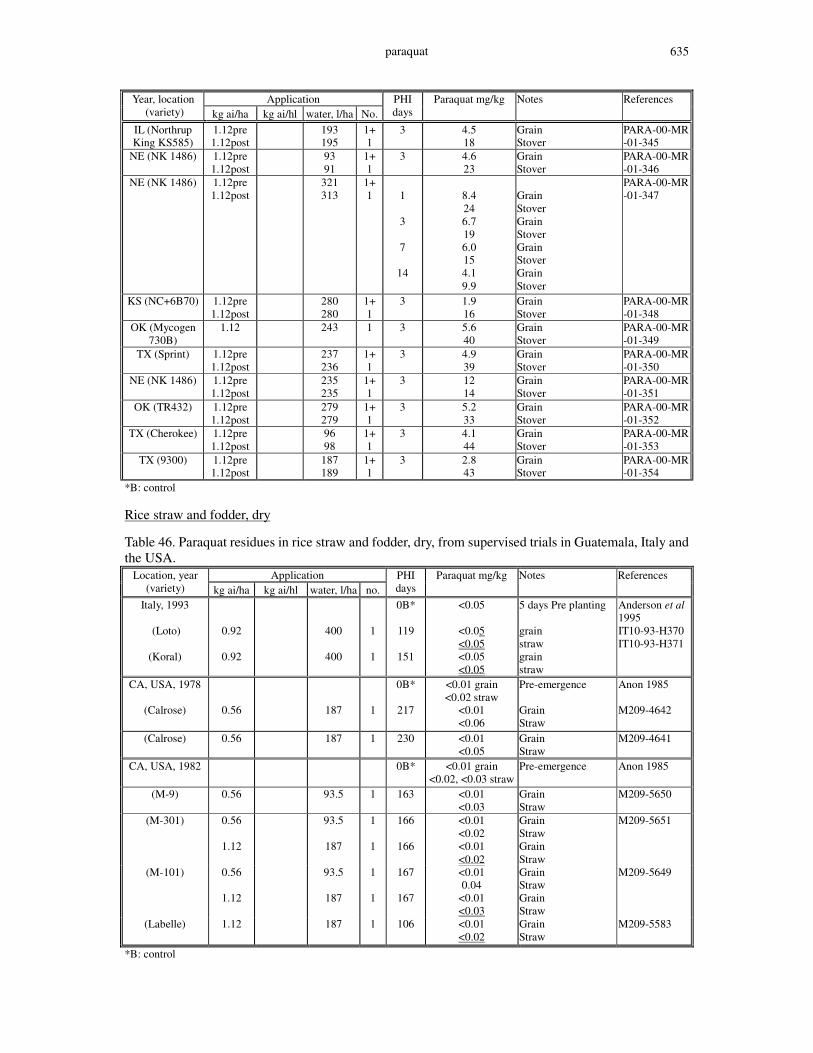
paraquat 635
Application Year, location (variety) kg ai/ha kg ai/hl water, l/ha No.
PHI days
Paraquat mg/kg Notes References
IL (Northrup King KS585)
1.12pre 1.12post
193 195
1+ 1
3 4.5 18
Grain Stover
PARA-00-MR-01-345
NE (NK 1486) 1.12pre 1.12post
93 91
1+ 1
3 4.6 23
Grain Stover
PARA-00-MR-01-346
NE (NK 1486) 1.12pre 1.12post
321 313
1+ 1
1
3
7
14
8.4 24 6.7 19 6.0 15 4.1 9.9
Grain Stover Grain Stover Grain Stover Grain Stover
PARA-00-MR-01-347
KS (NC+6B70) 1.12pre 1.12post
280 280
1+ 1
3 1.9 16
Grain Stover
PARA-00-MR-01-348
OK (Mycogen 730B)
1.12 243 1 3 5.6 40
Grain Stover
PARA-00-MR-01-349
TX (Sprint) 1.12pre 1.12post
237 236
1+ 1
3 4.9 39
Grain Stover
PARA-00-MR-01-350
NE (NK 1486) 1.12pre 1.12post
235 235
1+ 1
3 12 14
Grain Stover
PARA-00-MR-01-351
OK (TR432) 1.12pre 1.12post
279 279
1+ 1
3 5.2 33
Grain Stover
PARA-00-MR-01-352
TX (Cherokee) 1.12pre 1.12post
96 98
1+ 1
3 4.1 44
Grain Stover
PARA-00-MR-01-353
TX (9300) 1.12pre 1.12post
187 189
1+ 1
3 2.8 43
Grain Stover
PARA-00-MR-01-354
*B: control Rice straw and fodder, dry Table 46. Paraquat residues in rice straw and fodder, dry, from supervised trials in Guatemala, Italy and the USA.
Application Location, year (variety) kg ai/ha kg ai/hl water, l/ha no.
PHI days
Paraquat mg/kg Notes References
Italy, 1993
(Loto)
(Koral)
0.92
0.92
400
400
1
1
0B*
119
151
<0.05
<0.05 <0.05 <0.05 <0.05
5 days Pre planting grain straw grain straw
Anderson et al 1995 IT10-93-H370 IT10-93-H371
CA, USA, 1978
(Calrose)
0.56
187
1
0B*
217
<0.01 grain <0.02 straw
<0.01 <0.06
Pre-emergence Grain Straw
Anon 1985 M209-4642
(Calrose) 0.56 187 1 230 <0.01 <0.05
Grain Straw
M209-4641
CA, USA, 1982 0B*
<0.01 grain <0.02, <0.03 straw
Pre-emergence
Anon 1985
(M-9) 0.56 93.5 1 163 <0.01 <0.03
Grain Straw
M209-5650
(M-301) 0.56
1.12
93.5
187
1
1
166
166
<0.01 <0.02 <0.01 <0.02
Grain Straw Grain Straw
M209-5651
(M-101) 0.56
1.12
93.5
187
1
1
167
167
<0.01 0.04
<0.01 <0.03
Grain Straw Grain Straw
M209-5649
(Labelle) 1.12 187 1
106
<0.01 <0.02
Grain Straw
M209-5583
*B: control
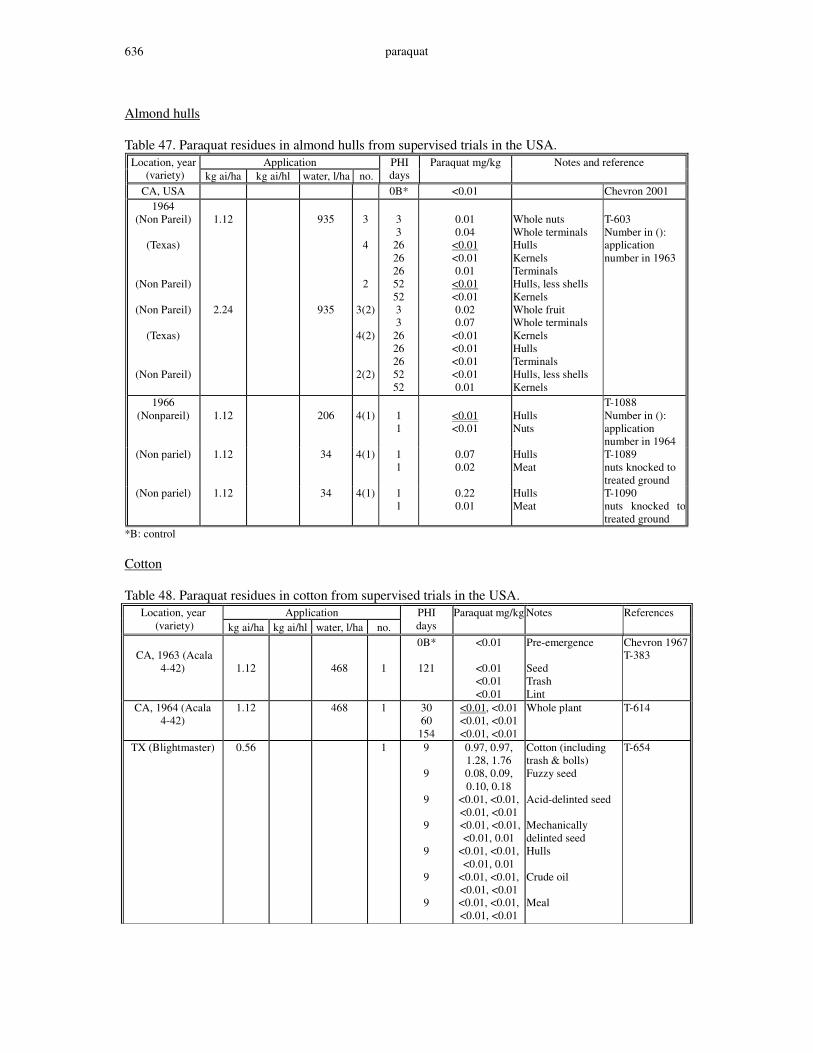
paraquat 636
Almond hulls Table 47. Paraquat residues in almond hulls from supervised trials in the USA.
Application Location, year (variety) kg ai/ha kg ai/hl water, l/ha no.
PHI days
Paraquat mg/kg Notes and reference
CA, USA 0B* <0.01 Chevron 2001 1964
(Non Pareil)
(Texas)
(Non Pareil)
(Non Pareil)
(Texas)
(Non Pareil)
1.12
2.24
935
935
3
4
2
3(2)
4(2)
2(2)
3 3
26 26 26 52 52 3 3
26 26 26 52 52
0.01 0.04
<0.01 <0.01 0.01
<0.01 <0.01 0.02 0.07
<0.01 <0.01 <0.01 <0.01 0.01
Whole nuts Whole terminals Hulls Kernels Terminals Hulls, less shells Kernels Whole fruit Whole terminals Kernels Hulls Terminals Hulls, less shells Kernels
T-603 Number in (): application number in 1963
1966 (Nonpareil)
1.12
206
4(1)
1 1
<0.01 <0.01
Hulls Nuts
T-1088 Number in (): application number in 1964
(Non pariel) 1.12 34 4(1) 1 1
0.07 0.02
Hulls Meat
T-1089 nuts knocked to treated ground
(Non pariel) 1.12 34 4(1) 1 1
0.22 0.01
Hulls Meat
T-1090 nuts knocked to treated ground
*B: control Cotton Table 48. Paraquat residues in cotton from supervised trials in the USA.
Application Location, year (variety) kg ai/ha kg ai/hl water, l/ha no.
PHI days
Paraquat mg/kg Notes References
CA, 1963 (Acala
4-42)
1.12
468
1
0B*
121
<0.01
<0.01 <0.01 <0.01
Pre-emergence Seed Trash Lint
Chevron 1967 T-383
CA, 1964 (Acala 4-42)
1.12 468 1 30 60
154
<0.01, <0.01 <0.01, <0.01 <0.01, <0.01
Whole plant T-614
TX (Blightmaster) 0.56
1
9
9
9
9
9
9
9
0.97, 0.97, 1.28, 1.76 0.08, 0.09, 0.10, 0.18
<0.01, <0.01, <0.01, <0.01
<0.01, <0.01, <0.01, 0.01
<0.01, <0.01, <0.01, 0.01
<0.01, <0.01, <0.01, <0.01 <0.01, <0.01, <0.01, <0.01
Cotton (including trash & bolls) Fuzzy seed Acid-delinted seed Mechanically delinted seed Hulls Crude oil Meal
T-654
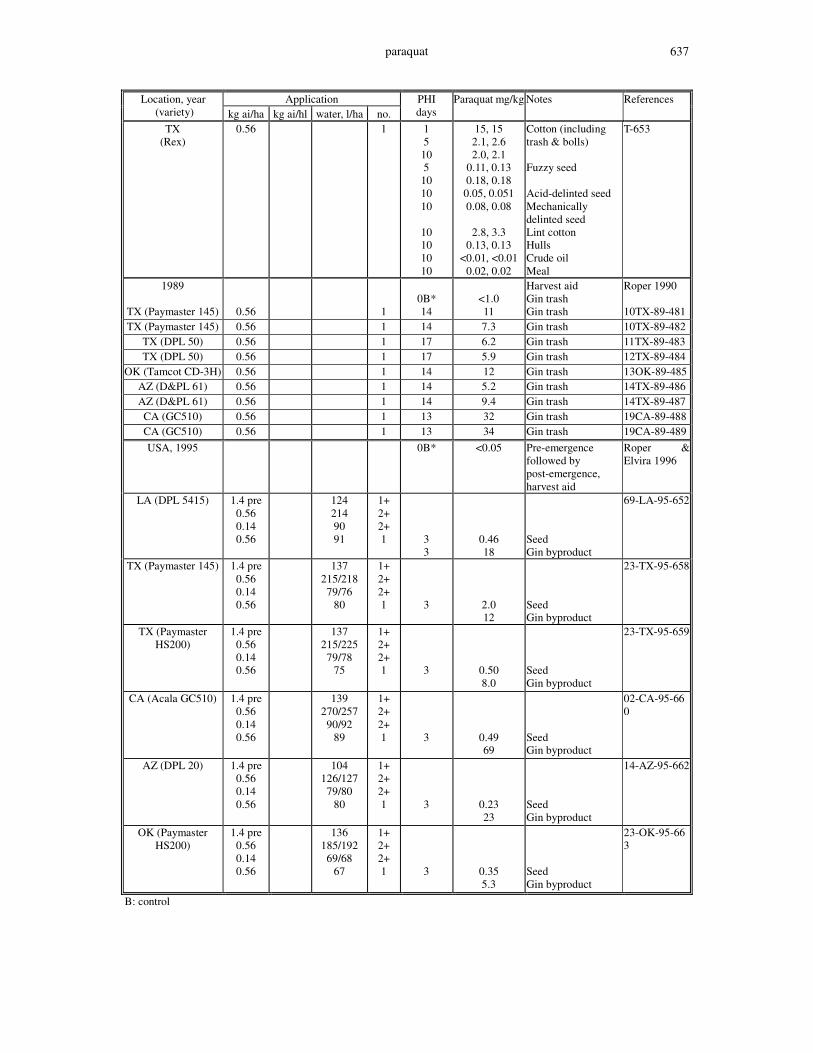
paraquat 637
Application Location, year (variety) kg ai/ha kg ai/hl water, l/ha no.
PHI days
Paraquat mg/kg Notes References
TX (Rex)
0.56
1 1 5 10 5 10 10 10
10 10 10 10
15, 15 2.1, 2.6 2.0, 2.1
0.11, 0.13 0.18, 0.18 0.05, 0.051 0.08, 0.08
2.8, 3.3
0.13, 0.13 <0.01, <0.01
0.02, 0.02
Cotton (including trash & bolls) Fuzzy seed Acid-delinted seed Mechanically delinted seed Lint cotton Hulls Crude oil Meal
T-653
1989 0B*
<1.0
Harvest aid Gin trash
Roper 1990
TX (Paymaster 145) 0.56 1 14 11 Gin trash 10TX-89-481 TX (Paymaster 145) 0.56 1 14 7.3 Gin trash 10TX-89-482
TX (DPL 50) 0.56 1 17 6.2 Gin trash 11TX-89-483 TX (DPL 50) 0.56 1 17 5.9 Gin trash 12TX-89-484
OK (Tamcot CD-3H) 0.56 1 14 12 Gin trash 13OK-89-485 AZ (D&PL 61) 0.56 1 14 5.2 Gin trash 14TX-89-486 AZ (D&PL 61) 0.56 1 14 9.4 Gin trash 14TX-89-487 CA (GC510) 0.56 1 13 32 Gin trash 19CA-89-488 CA (GC510) 0.56 1 13 34 Gin trash 19CA-89-489 USA, 1995 0B* <0.05 Pre-emergence
followed by post-emergence, harvest aid
Roper & Elvira 1996
LA (DPL 5415) 1.4 pre 0.56 0.14 0.56
124 214 90 91
1+ 2+ 2+ 1
3 3
0.46 18
Seed Gin byproduct
69-LA-95-652
TX (Paymaster 145) 1.4 pre 0.56 0.14 0.56
137 215/218 79/76
80
1+ 2+ 2+ 1
3
2.0 12
Seed Gin byproduct
23-TX-95-658
TX (Paymaster HS200)
1.4 pre 0.56 0.14 0.56
137 215/225 79/78
75
1+ 2+ 2+ 1
3
0.50 8.0
Seed Gin byproduct
23-TX-95-659
CA (Acala GC510) 1.4 pre 0.56 0.14 0.56
139 270/257 90/92
89
1+ 2+ 2+ 1
3
0.49 69
Seed Gin byproduct
02-CA-95-660
AZ (DPL 20) 1.4 pre 0.56 0.14 0.56
104 126/127 79/80
80
1+ 2+ 2+ 1
3
0.23 23
Seed Gin byproduct
14-AZ-95-662
OK (Paymaster HS200)
1.4 pre 0.56 0.14 0.56
136 185/192 69/68
67
1+ 2+ 2+ 1
3
0.35 5.3
Seed Gin byproduct
23-OK-95-663
B: control
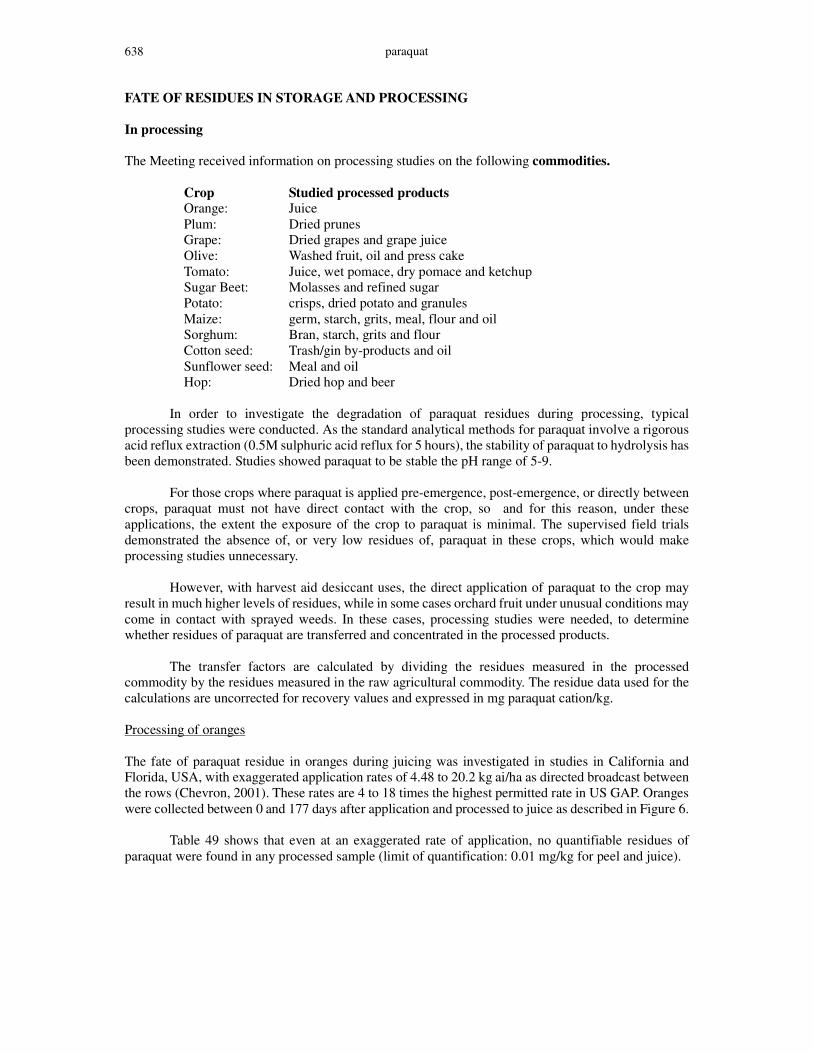
paraquat 638
FATE OF RESIDUES IN STORAGE AND PROCESSING In processing The Meeting received information on processing studies on the following commodities.
Crop Studied processed products Orange: Juice Plum: Dried prunes Grape: Dried grapes and grape juice Olive: Washed fruit, oil and press cake Tomato: Juice, wet pomace, dry pomace and ketchup Sugar Beet: Molasses and refined sugar Potato: crisps, dried potato and granules Maize: germ, starch, grits, meal, flour and oil Sorghum: Bran, starch, grits and flour Cotton seed: Trash/gin by-products and oil Sunflower seed: Meal and oil Hop: Dried hop and beer
In order to investigate the degradation of paraquat residues during processing, typical processing studies were conducted. As the standard analytical methods for paraquat involve a rigorous acid reflux extraction (0.5M sulphuric acid reflux for 5 hours), the stability of paraquat to hydrolysis has been demonstrated. Studies showed paraquat to be stable the pH range of 5-9. For those crops where paraquat is applied pre-emergence, post-emergence, or directly between crops, paraquat must not have direct contact with the crop, so and for this reason, under these applications, the extent the exposure of the crop to paraquat is minimal. The supervised field trials demonstrated the absence of, or very low residues of, paraquat in these crops, which would make processing studies unnecessary. However, with harvest aid desiccant uses, the direct application of paraquat to the crop may result in much higher levels of residues, while in some cases orchard fruit under unusual conditions may come in contact with sprayed weeds. In these cases, processing studies were needed, to determine whether residues of paraquat are transferred and concentrated in the processed products. The transfer factors are calculated by dividing the residues measured in the processed commodity by the residues measured in the raw agricultural commodity. The residue data used for the calculations are uncorrected for recovery values and expressed in mg paraquat cation/kg. Processing of oranges The fate of paraquat residue in oranges during juicing was investigated in studies in California and Florida, USA, with exaggerated application rates of 4.48 to 20.2 kg ai/ha as directed broadcast between the rows (Chevron, 2001). These rates are 4 to 18 times the highest permitted rate in US GAP. Oranges were collected between 0 and 177 days after application and processed to juice as described in Figure 6. Table 49 shows that even at an exaggerated rate of application, no quantifiable residues of paraquat were found in any processed sample (limit of quantification: 0.01 mg/kg for peel and juice).
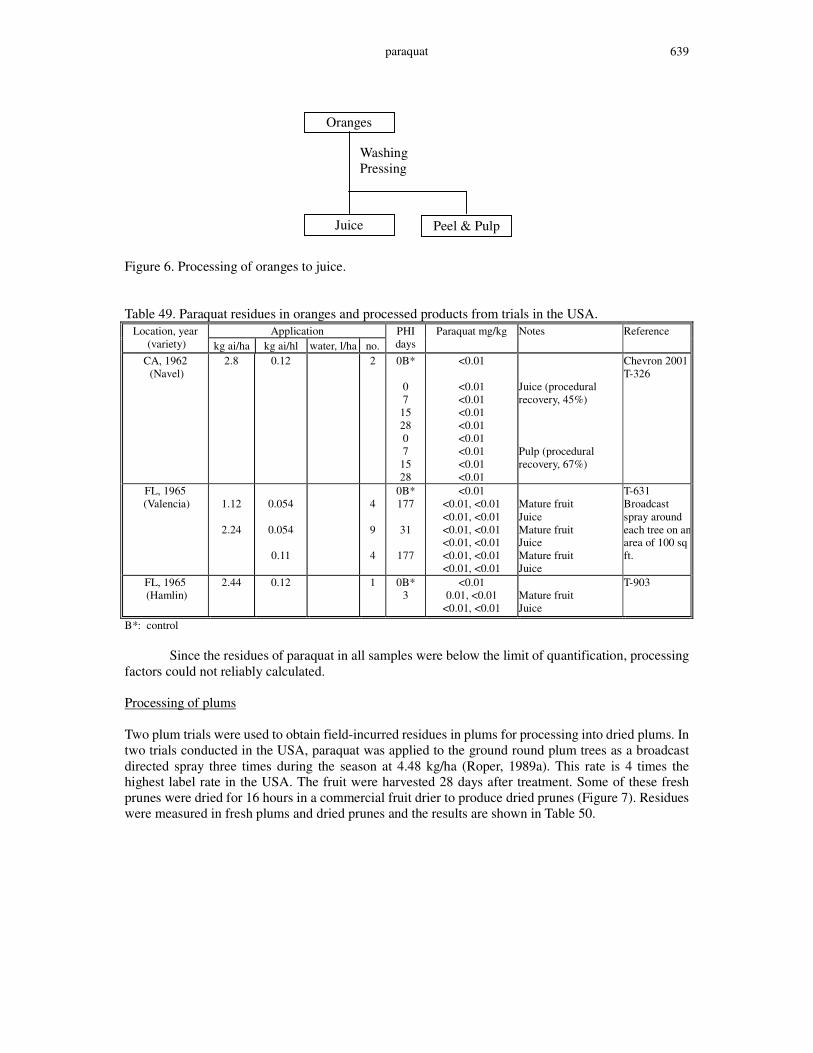
paraquat 639
Figure 6. Processing of oranges to juice.
Table 49. Paraquat residues in oranges and processed products from trials in the USA.
Application Location, year (variety) kg ai/ha kg ai/hl water, l/ha no.
PHI days
Paraquat mg/kg Notes Reference
CA, 1962 (Navel)
2.8 0.12 2 0B*
0 7
15 28 0 7
15 28
<0.01
<0.01 <0.01 <0.01 <0.01 <0.01 <0.01 <0.01 <0.01
Juice (procedural recovery, 45%) Pulp (procedural recovery, 67%)
Chevron 2001 T-326
FL, 1965 (Valencia)
1.12
2.24
0.054
0.054
0.11
4
9
4
0B* 177
31
177
<0.01 <0.01, <0.01 <0.01, <0.01 <0.01, <0.01 <0.01, <0.01 <0.01, <0.01 <0.01, <0.01
Mature fruit Juice Mature fruit Juice Mature fruit Juice
T-631 Broadcast spray around each tree on an area of 100 sq ft.
FL, 1965 (Hamlin)
2.44 0.12 1 0B* 3
<0.01 0.01, <0.01
<0.01, <0.01
Mature fruit Juice
T-903
B*: control Since the residues of paraquat in all samples were below the limit of quantification, processing factors could not reliably calculated. Processing of plums Two plum trials were used to obtain field-incurred residues in plums for processing into dried plums. In two trials conducted in the USA, paraquat was applied to the ground round plum trees as a broadcast directed spray three times during the season at 4.48 kg/ha (Roper, 1989a). This rate is 4 times the highest label rate in the USA. The fruit were harvested 28 days after treatment. Some of these fresh prunes were dried for 16 hours in a commercial fruit drier to produce dried prunes (Figure 7). Residues were measured in fresh plums and dried prunes and the results are shown in Table 50.
Oranges
Juice
Washing Pressing
Peel & Pulp
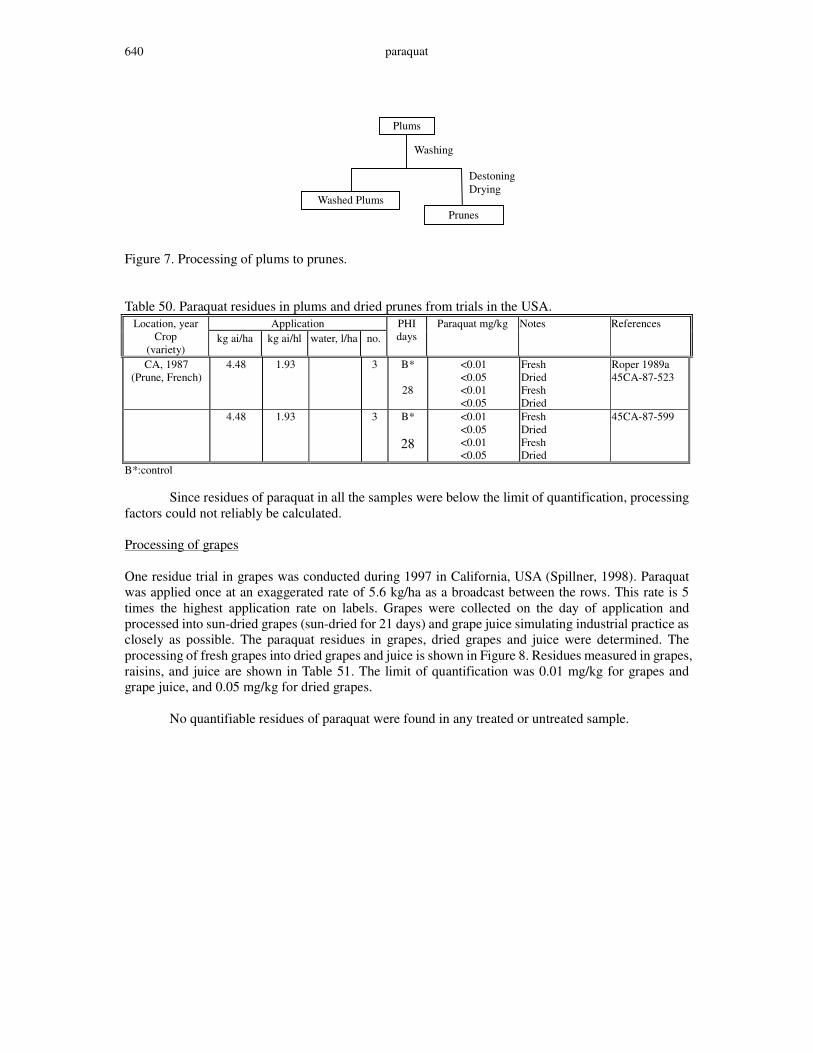
paraquat 640
Figure 7. Processing of plums to prunes. Table 50. Paraquat residues in plums and dried prunes from trials in the USA.
Application Location, year Crop
(variety) kg ai/ha kg ai/hl water, l/ha no.
PHI days
Paraquat mg/kg Notes References
CA, 1987 (Prune, French)
4.48 1.93 3 B*
28
<0.01 <0.05 <0.01 <0.05
Fresh Dried Fresh Dried
Roper 1989a 45CA-87-523
4.48 1.93 3 B*
28
<0.01 <0.05 <0.01 <0.05
Fresh Dried Fresh Dried
45CA-87-599
B*:control Since residues of paraquat in all the samples were below the limit of quantification, processing factors could not reliably be calculated. Processing of grapes One residue trial in grapes was conducted during 1997 in California, USA (Spillner, 1998). Paraquat was applied once at an exaggerated rate of 5.6 kg/ha as a broadcast between the rows. This rate is 5 times the highest application rate on labels. Grapes were collected on the day of application and processed into sun-dried grapes (sun-dried for 21 days) and grape juice simulating industrial practice as closely as possible. The paraquat residues in grapes, dried grapes and juice were determined. The processing of fresh grapes into dried grapes and juice is shown in Figure 8. Residues measured in grapes, raisins, and juice are shown in Table 51. The limit of quantification was 0.01 mg/kg for grapes and grape juice, and 0.05 mg/kg for dried grapes. No quantifiable residues of paraquat were found in any treated or untreated sample.
Plums
Washing
Washed Plums Prunes
Destoning Drying
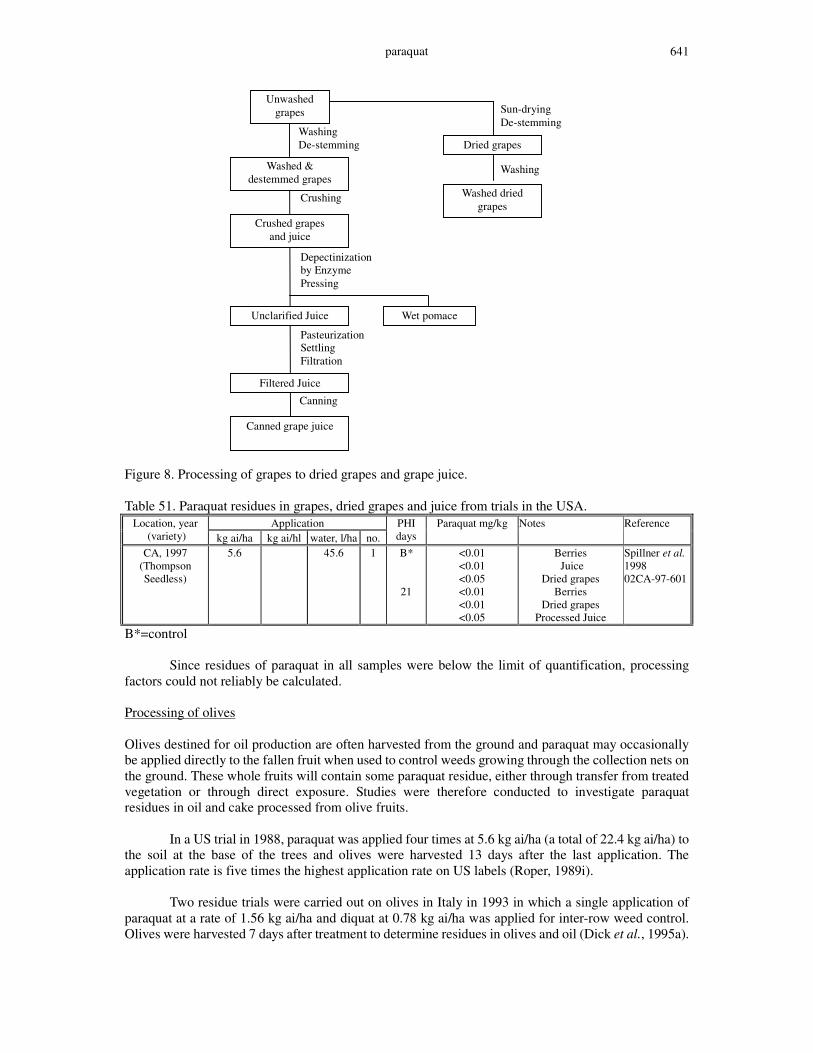
paraquat 641
Figure 8. Processing of grapes to dried grapes and grape juice. Table 51. Paraquat residues in grapes, dried grapes and juice from trials in the USA.
Application Location, year (variety) kg ai/ha kg ai/hl water, l/ha no.
PHI days
Paraquat mg/kg Notes Reference
CA, 1997 (Thompson Seedless)
5.6 45.6 1 B*
21
<0.01 <0.01 <0.05 <0.01 <0.01 <0.05
Berries Juice
Dried grapes Berries
Dried grapes Processed Juice
Spillner et al. 1998 02CA-97-601
B*=control Since residues of paraquat in all samples were below the limit of quantification, processing factors could not reliably be calculated. Processing of olives Olives destined for oil production are often harvested from the ground and paraquat may occasionally be applied directly to the fallen fruit when used to control weeds growing through the collection nets on the ground. These whole fruits will contain some paraquat residue, either through transfer from treated vegetation or through direct exposure. Studies were therefore conducted to investigate paraquat residues in oil and cake processed from olive fruits. In a US trial in 1988, paraquat was applied four times at 5.6 kg ai/ha (a total of 22.4 kg ai/ha) to the soil at the base of the trees and olives were harvested 13 days after the last application. The application rate is five times the highest application rate on US labels (Roper, 1989i). Two residue trials were carried out on olives in Italy in 1993 in which a single application of paraquat at a rate of 1.56 kg ai/ha and diquat at 0.78 kg ai/ha was applied for inter-row weed control. Olives were harvested 7 days after treatment to determine residues in olives and oil (Dick et al., 1995a).
Washing De-stemming
Unwashed grapes
Washed & destemmed grapes
Crushed grapes and juice
Crushing
Depectinization by Enzyme Pressing
Unclarified Juice Wet pomace
Pasteurization Settling Filtration
Filtered Juice
Canning
Canned grape juice
Sun-drying De-stemming
Dried grapes
Washing
Washed dried grapes
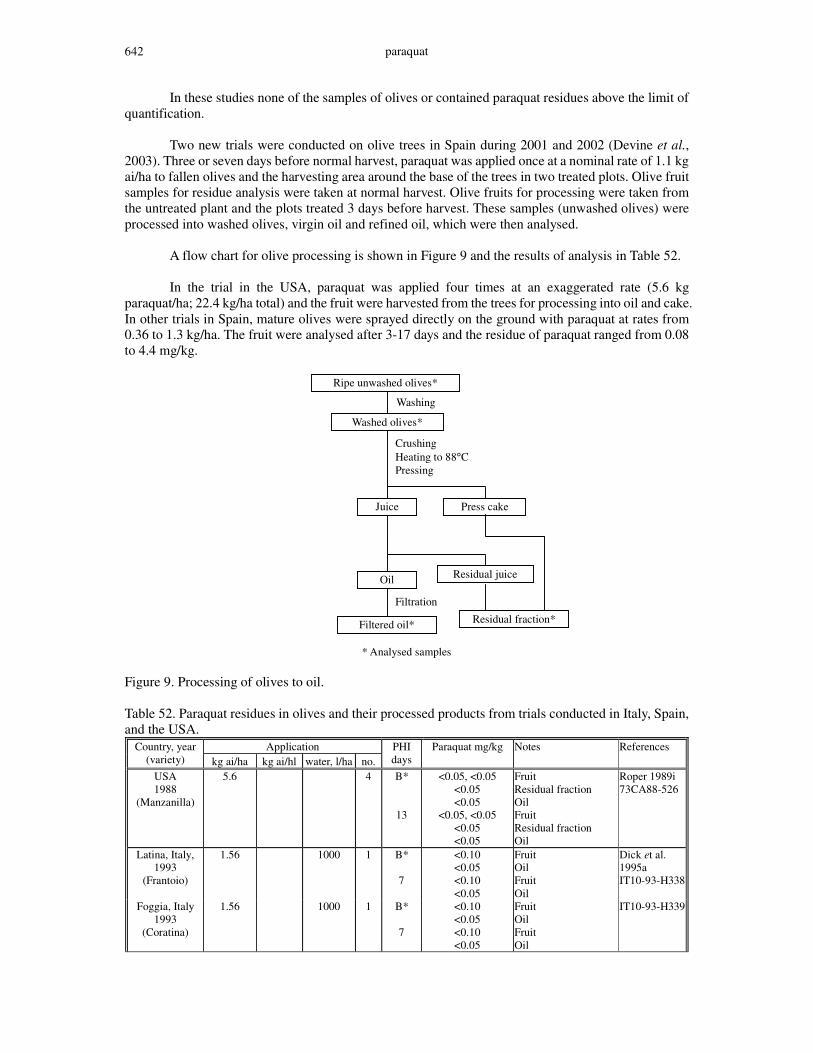
paraquat 642
In these studies none of the samples of olives or contained paraquat residues above the limit of quantification. Two new trials were conducted on olive trees in Spain during 2001 and 2002 (Devine et al., 2003). Three or seven days before normal harvest, paraquat was applied once at a nominal rate of 1.1 kg ai/ha to fallen olives and the harvesting area around the base of the trees in two treated plots. Olive fruit samples for residue analysis were taken at normal harvest. Olive fruits for processing were taken from the untreated plant and the plots treated 3 days before harvest. These samples (unwashed olives) were processed into washed olives, virgin oil and refined oil, which were then analysed. A flow chart for olive processing is shown in Figure 9 and the results of analysis in Table 52. In the trial in the USA, paraquat was applied four times at an exaggerated rate (5.6 kg paraquat/ha; 22.4 kg/ha total) and the fruit were harvested from the trees for processing into oil and cake. In other trials in Spain, mature olives were sprayed directly on the ground with paraquat at rates from 0.36 to 1.3 kg/ha. The fruit were analysed after 3-17 days and the residue of paraquat ranged from 0.08 to 4.4 mg/kg.
* Analysed samples Figure 9. Processing of olives to oil. Table 52. Paraquat residues in olives and their processed products from trials conducted in Italy, Spain, and the USA.
Application Country, year (variety) kg ai/ha kg ai/hl water, l/ha no.
PHI days
Paraquat mg/kg Notes References
USA 1988
(Manzanilla)
5.6 4 B*
13
<0.05, <0.05 <0.05 <0.05
<0.05, <0.05 <0.05 <0.05
Fruit Residual fraction Oil Fruit Residual fraction Oil
Roper 1989i 73CA88-526
Latina, Italy, 1993
(Frantoio)
1.56 1000 1 B*
7
<0.10 <0.05 <0.10 <0.05
Fruit Oil Fruit Oil
Dick et al. 1995a IT10-93-H338
Foggia, Italy 1993
(Coratina)
1.56 1000 1 B*
7
<0.10 <0.05 <0.10 <0.05
Fruit Oil Fruit Oil
IT10-93-H339
Ripe unwashed olives*
Washing
Washed olives*
Crushing Heating to 88°C Pressing
Juice Press cake
Oil Residual juice
Filtration
Filtered oil* Residual fraction*
paraquat 643
Application Country, year (variety) kg ai/ha kg ai/hl water, l/ha no.
PHI days
Paraquat mg/kg Notes References
Andalucia, Spain,
2001/2002 (Hojiblanca)
1.09 347 1 B* 3 3 3 3 3
<0.05 0.45 0.18 0.11
<0.05 <0.05
Mean % of treated olives: 24% Fresh fruit Unwashed fruit Washed fruit Virgin oil Refined oil
Devine et al. 2003 ES051-01-S013
Catalonia, Spain,
2001/2002 (Arbequina)
1.05 192 B* 3 3 3 3 3
<0.05 0.09 0.06
<0.05 <0.05 <0.05
Mean % of treated olives: 10% Fresh fruit Unwashed fruit Washed fruit Virgin oil Refined oil
ES060-01-S113
B*: control
The procedural recoveries in the analysis of virgin oil and refined oil were relatively low at 66 and 62% respectively. Processing factors were calculated from the Spanish trials where residues in the fresh fruit were above the limit of quantification. The results are shown in Table 53. Table 53. Processing factors from olives to oil.
ES051-01-S013 ES051-01-S113 Product Paraquat (mg/kg)
Processing factor
Paraquat (mg/kg)
Processing factor
Fresh Olive 0.38 0.09 Unwashed olives before processing 0.18 0.47 0.06 0.67 Washed olives before processing 0.11 0.29 <0.05 <0.56 Virgin Oil <0.05 <0.13 <0.05 <0.56 Refined oil <0.05 <0.13 <0.05 <0.56
Paraquat is not transferred into the oil. Washing reduces paraquat residues to a certain extent. Processing of tomatoes In a study in the USA in 1988 whole tomatoes were treated with one pre-emergence broadcast application of paraquat at a rate of 1.12 kg ai/ha followed by three directed applications at 2.8 kg ai/ha (about 5 times the highest current application rate). Ripe tomatoes were harvested 30 days after the last application and processed according to normal commercial practice. The limits of quantification were 0.005 mg/kg for whole tomatoes and juice; 0.025 mg/kg for ketchup and wet pomace, and 0.05 mg/kg for dry pomace (Roper, 1989q). A flow diagram outlining the processing is shown in Figure 10 and the results of residue analysis in Table 54. All residues of paraquat in all samples were below the limit of quantification.
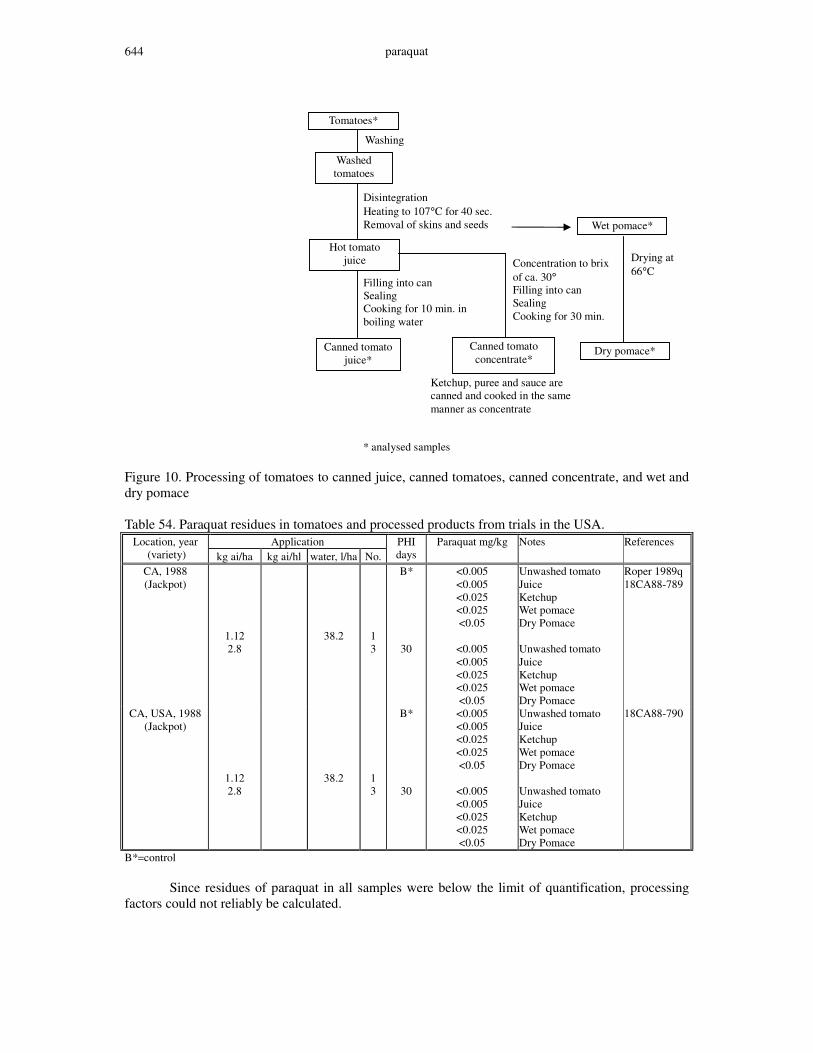
paraquat 644
* analysed samples Figure 10. Processing of tomatoes to canned juice, canned tomatoes, canned concentrate, and wet and dry pomace Table 54. Paraquat residues in tomatoes and processed products from trials in the USA.
Application Location, year (variety) kg ai/ha kg ai/hl water, l/ha No.
PHI days
Paraquat mg/kg Notes References
CA, 1988 (Jackpot)
1.12 2.8
38.2
1 3
B*
30
<0.005 <0.005 <0.025 <0.025 <0.05
<0.005 <0.005 <0.025 <0.025 <0.05
Unwashed tomato Juice Ketchup Wet pomace Dry Pomace Unwashed tomato Juice Ketchup Wet pomace Dry Pomace
Roper 1989q 18CA88-789
CA, USA, 1988 (Jackpot)
1.12 2.8
38.2
1 3
B*
30
<0.005 <0.005 <0.025 <0.025 <0.05
<0.005 <0.005 <0.025 <0.025 <0.05
Unwashed tomato Juice Ketchup Wet pomace Dry Pomace Unwashed tomato Juice Ketchup Wet pomace Dry Pomace
18CA88-790
B*=control Since residues of paraquat in all samples were below the limit of quantification, processing factors could not reliably be calculated.
Wet pomace*
Canned tomato concentrate*
Concentration to brix of ca. 30° Filling into can Sealing Cooking for 30 min.
Canned tomato juice*
Ketchup, puree and sauce are canned and cooked in the same manner as concentrate
Dry pomace*
Tomatoes*
Washing
Washed tomatoes
Hot tomato juice
Filling into can Sealing Cooking for 10 min. in boiling water
Disintegration Heating to 107°C for 40 sec. Removal of skins and seeds
Drying at 66°C
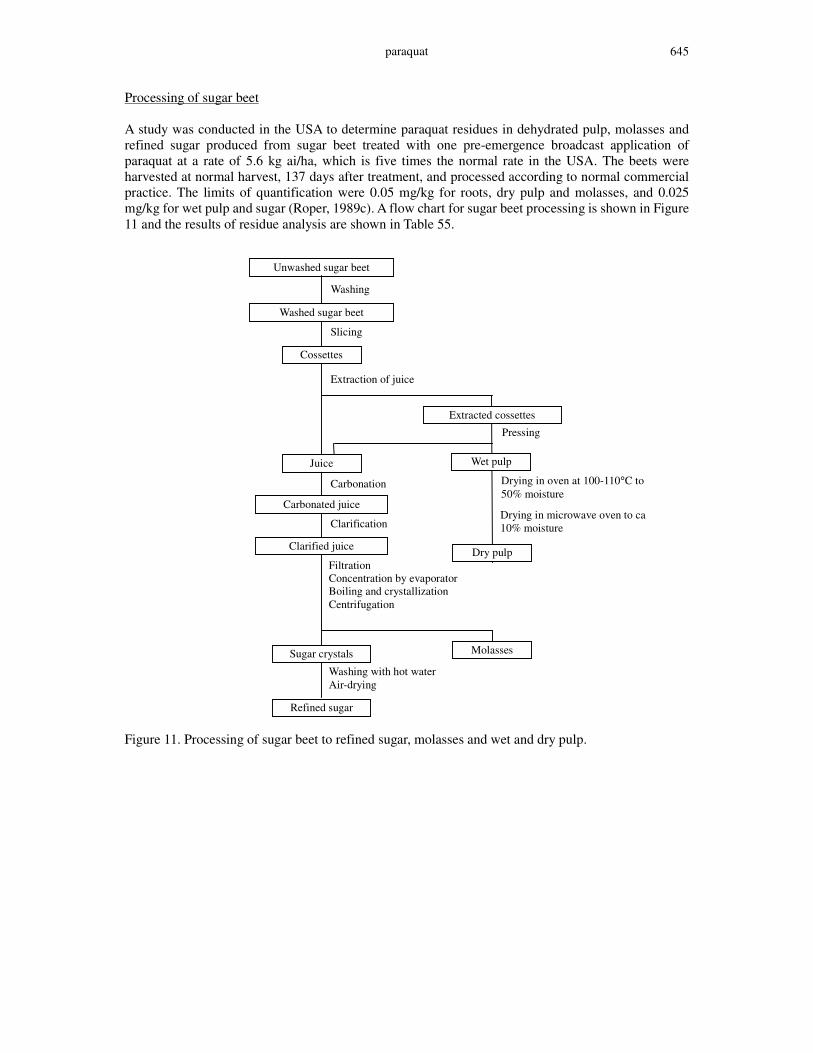
paraquat 645
Processing of sugar beet A study was conducted in the USA to determine paraquat residues in dehydrated pulp, molasses and refined sugar produced from sugar beet treated with one pre-emergence broadcast application of paraquat at a rate of 5.6 kg ai/ha, which is five times the normal rate in the USA. The beets were harvested at normal harvest, 137 days after treatment, and processed according to normal commercial practice. The limits of quantification were 0.05 mg/kg for roots, dry pulp and molasses, and 0.025 mg/kg for wet pulp and sugar (Roper, 1989c). A flow chart for sugar beet processing is shown in Figure 11 and the results of residue analysis are shown in Table 55.
Figure 11. Processing of sugar beet to refined sugar, molasses and wet and dry pulp.
Unwashed sugar beet
Washing
Washed sugar beet
Slicing
Cossettes
Extraction of juice
Extracted cossettes
Pressing
Juice
Drying in oven at 100-110°C to 50% moisture
Wet pulp
Drying in microwave oven to ca 10% moisture
Dry pulp
Carbonation
Carbonated juice
Clarification
Clarified juice
Filtration Concentration by evaporator Boiling and crystallization Centrifugation
Molasses Sugar crystals
Washing with hot water Air-drying
Refined sugar
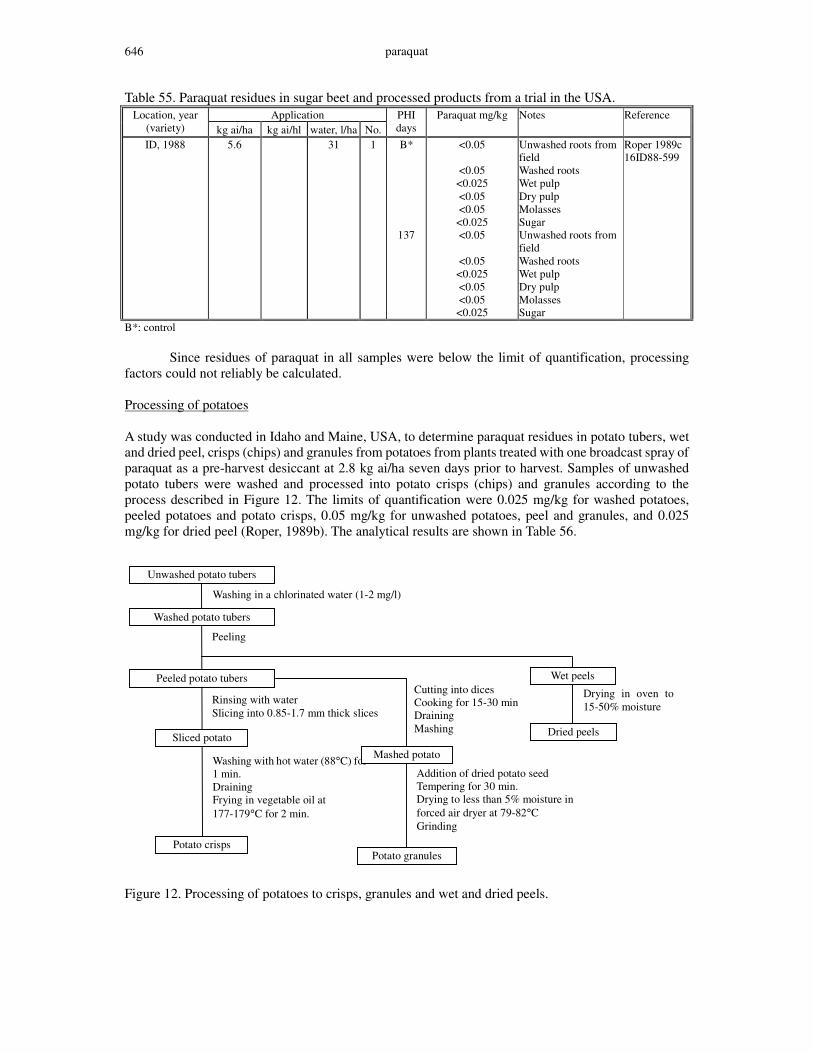
paraquat 646
Table 55. Paraquat residues in sugar beet and processed products from a trial in the USA. Application Location, year
(variety) kg ai/ha kg ai/hl water, l/ha No. PHI days
Paraquat mg/kg Notes Reference
ID, 1988 5.6 31 1
B*
137
<0.05
<0.05 <0.025 <0.05 <0.05 <0.025 <0.05
<0.05 <0.025 <0.05 <0.05 <0.025
Unwashed roots from field Washed roots Wet pulp Dry pulp Molasses Sugar Unwashed roots from field Washed roots Wet pulp Dry pulp Molasses Sugar
Roper 1989c 16ID88-599
B*: control Since residues of paraquat in all samples were below the limit of quantification, processing factors could not reliably be calculated. Processing of potatoes A study was conducted in Idaho and Maine, USA, to determine paraquat residues in potato tubers, wet and dried peel, crisps (chips) and granules from potatoes from plants treated with one broadcast spray of paraquat as a pre-harvest desiccant at 2.8 kg ai/ha seven days prior to harvest. Samples of unwashed potato tubers were washed and processed into potato crisps (chips) and granules according to the process described in Figure 12. The limits of quantification were 0.025 mg/kg for washed potatoes, peeled potatoes and potato crisps, 0.05 mg/kg for unwashed potatoes, peel and granules, and 0.025 mg/kg for dried peel (Roper, 1989b). The analytical results are shown in Table 56.
Figure 12. Processing of potatoes to crisps, granules and wet and dried peels.
Washing in a chlorinated water (1-2 mg/l)
Unwashed potato tubers
Peeling
Washed potato tubers
Peeled potato tubers Wet peels
Rinsing with water Slicing into 0.85-1.7 mm thick slices
Sliced potato
Washing with hot water (88°C) for 1 min. Draining Frying in vegetable oil at 177-179°C for 2 min.
Potato crisps
Dried peels
Drying in oven to 15-50% moisture
Cutting into dices Cooking for 15-30 min Draining Mashing
Mashed potato
Addition of dried potato seed Tempering for 30 min. Drying to less than 5% moisture in forced air dryer at 79-82°C Grinding
Potato granules
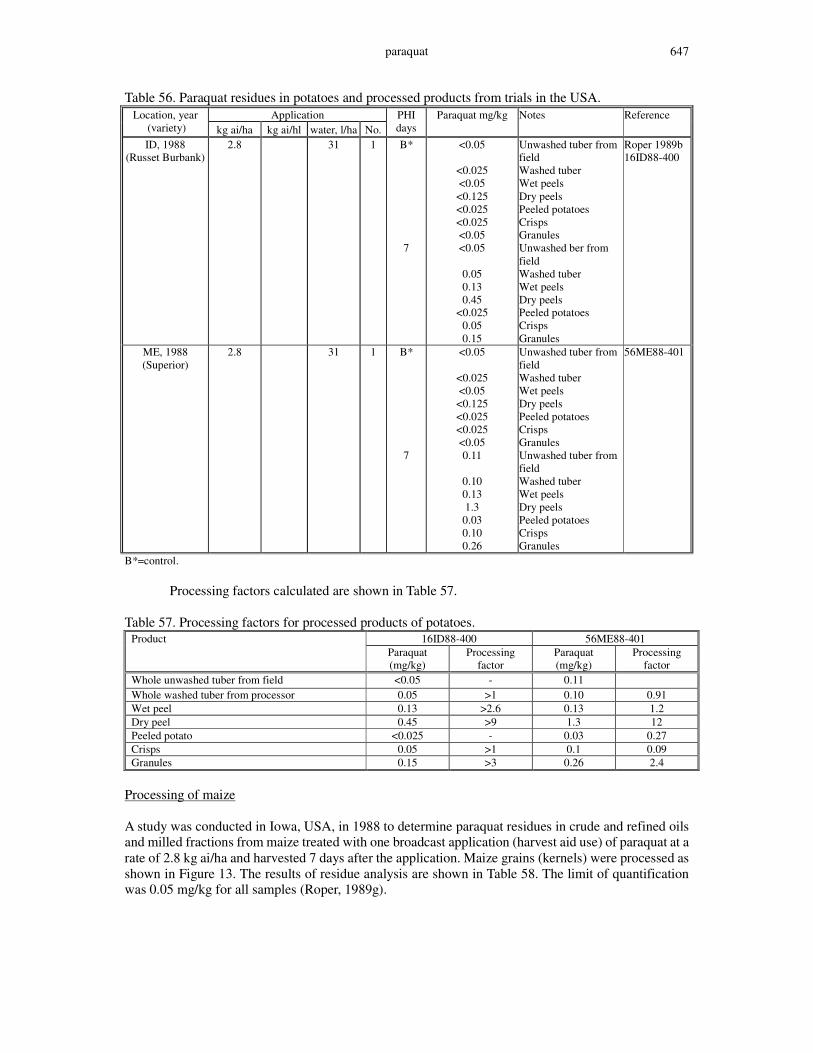
paraquat 647
Table 56. Paraquat residues in potatoes and processed products from trials in the USA. Application Location, year
(variety) kg ai/ha kg ai/hl water, l/ha No. PHI days
Paraquat mg/kg Notes Reference
ID, 1988 (Russet Burbank)
2.8 31 1
B* 7
<0.05
<0.025 <0.05 <0.125 <0.025 <0.025 <0.05 <0.05
0.05 0.13 0.45
<0.025 0.05 0.15
Unwashed tuber from field Washed tuber Wet peels Dry peels Peeled potatoes Crisps Granules Unwashed ber from field Washed tuber Wet peels Dry peels Peeled potatoes Crisps Granules
Roper 1989b 16ID88-400
ME, 1988 (Superior)
2.8 31 1
B* 7
<0.05
<0.025 <0.05 <0.125 <0.025 <0.025 <0.05 0.11
0.10 0.13 1.3 0.03 0.10 0.26
Unwashed tuber from field Washed tuber Wet peels Dry peels Peeled potatoes Crisps Granules Unwashed tuber from field Washed tuber Wet peels Dry peels Peeled potatoes Crisps Granules
56ME88-401
B*=control. Processing factors calculated are shown in Table 57. Table 57. Processing factors for processed products of potatoes.
16ID88-400 56ME88-401 Product Paraquat
(mg/kg) Processing
factor Paraquat (mg/kg)
Processing factor
Whole unwashed tuber from field <0.05 - 0.11 Whole washed tuber from processor 0.05 >1 0.10 0.91 Wet peel 0.13 >2.6 0.13 1.2 Dry peel 0.45 >9 1.3 12 Peeled potato <0.025 - 0.03 0.27 Crisps 0.05 >1 0.1 0.09 Granules 0.15 >3 0.26 2.4
Processing of maize A study was conducted in Iowa, USA, in 1988 to determine paraquat residues in crude and refined oils and milled fractions from maize treated with one broadcast application (harvest aid use) of paraquat at a rate of 2.8 kg ai/ha and harvested 7 days after the application. Maize grains (kernels) were processed as shown in Figure 13. The results of residue analysis are shown in Table 58. The limit of quantification was 0.05 mg/kg for all samples (Roper, 1989g).

paraquat 648
Figure 13. Processing of maize to oil, starch and milling fractions.
Soaking in a 0.1-0.2% SO2 solution at 52°C for 24-48 hr Grinding coarsely in a disc mill
Hulls Germ Endosperm
Grinding Washing with water
Coarse material Coarse
starch
Drying to <10% moisture Cooking at 99-110°C Pressing
Press cake
Crude Oil
Extraction with hexane Evaporation of hexane
Residual press cake
Refining using a refining machine
Refined Oil
Starch
Cleaning by screening and aspiration to remove dust, chaff, cobs and other foreign materials
Addition of water to 22% moisture Cracking with centrifugal or impact mill
Cracked kernels
Drying in oven for 30 min at 60-71oC Cooking at 99-110°C Pressing Screening
Germ Grits Hulls Meal Flour
Cooking at 99-110°C Pressing
Crude Oil
WET MILLING DRY MILLING
Press cake
Extraction with hexane Evaporation of hexane
Residual press cake
Refined Oil Refining using a refining machine
Maize kernels
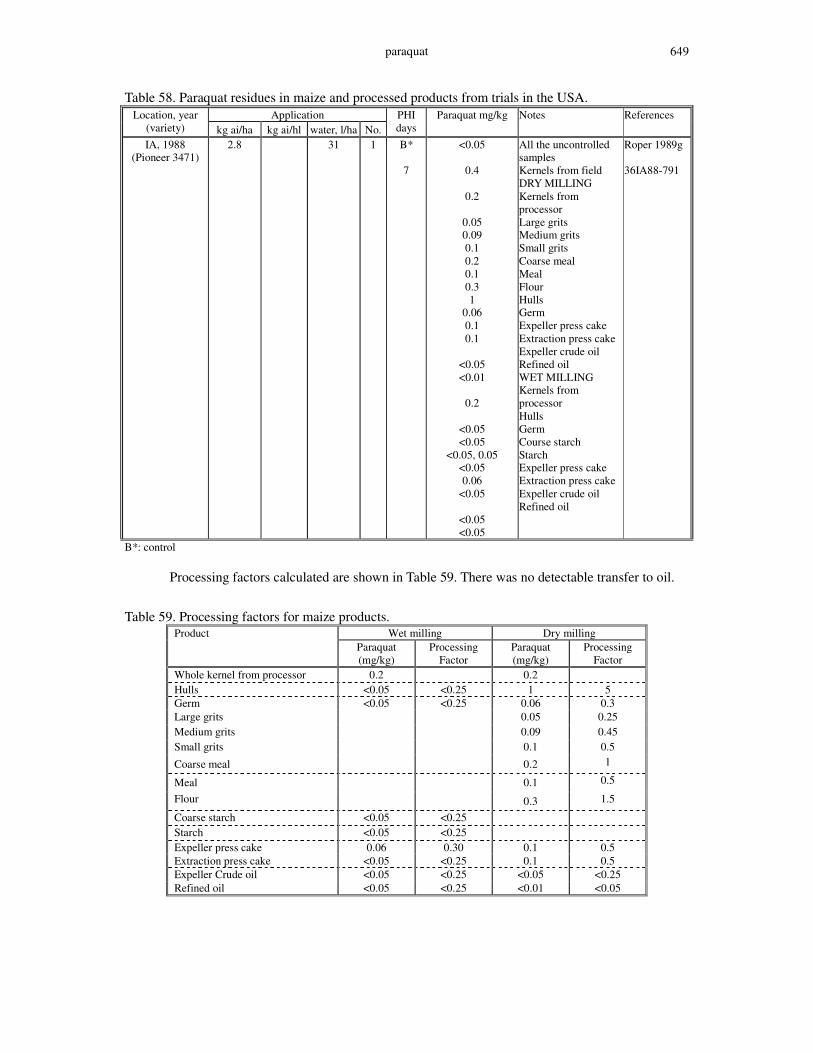
paraquat 649
Table 58. Paraquat residues in maize and processed products from trials in the USA. Application Location, year
(variety) kg ai/ha kg ai/hl water, l/ha No. PHI days
Paraquat mg/kg Notes References
IA, 1988 (Pioneer 3471)
2.8 31 1
B* 7
<0.05
0.4
0.2
0.05 0.09 0.1 0.2 0.1 0.3 1
0.06 0.1 0.1
<0.05 <0.01
0.2
<0.05 <0.05
<0.05, 0.05 <0.05 0.06
<0.05
<0.05 <0.05
All the uncontrolled samples Kernels from field DRY MILLING Kernels from processor Large grits Medium grits Small grits Coarse meal Meal Flour Hulls Germ Expeller press cake Extraction press cake Expeller crude oil Refined oil WET MILLING Kernels from processor Hulls Germ Course starch Starch Expeller press cake Extraction press cake Expeller crude oil Refined oil
Roper 1989g 36IA88-791
B*: control Processing factors calculated are shown in Table 59. There was no detectable transfer to oil. Table 59. Processing factors for maize products.
Wet milling Dry milling Product Paraquat
(mg/kg) Processing
Factor Paraquat (mg/kg)
Processing Factor
Whole kernel from processor 0.2 0.2 Hulls <0.05 <0.25 1 5 Germ <0.05 <0.25 0.06 0.3 Large grits 0.05 0.25 Medium grits 0.09 0.45 Small grits 0.1 0.5 Coarse meal 0.2 1
Meal 0.1 0.5 Flour 0.3 1.5 Coarse starch <0.05 <0.25 Starch <0.05 <0.25 Expeller press cake 0.06 0.30 0.1 0.5 Extraction press cake <0.05 <0.25 0.1 0.5 Expeller Crude oil <0.05 <0.25 <0.05 <0.25 Refined oil <0.05 <0.25 <0.01 <0.05
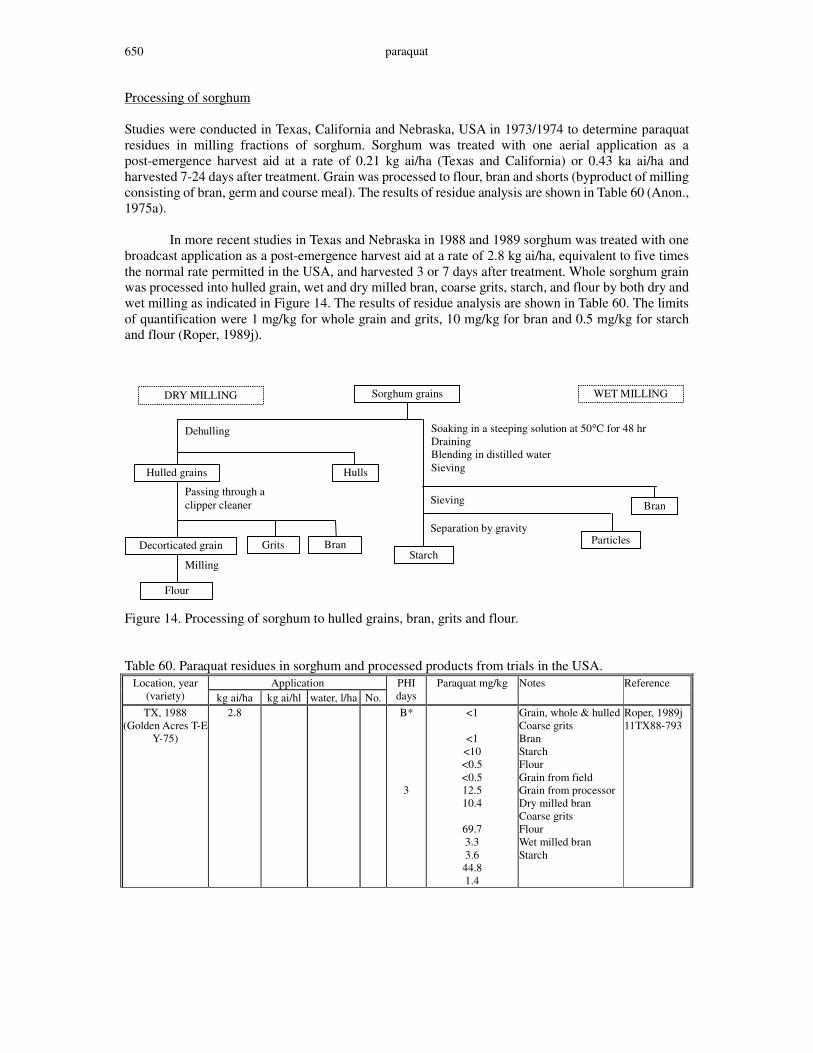
paraquat 650
Processing of sorghum Studies were conducted in Texas, California and Nebraska, USA in 1973/1974 to determine paraquat residues in milling fractions of sorghum. Sorghum was treated with one aerial application as a post-emergence harvest aid at a rate of 0.21 kg ai/ha (Texas and California) or 0.43 ka ai/ha and harvested 7-24 days after treatment. Grain was processed to flour, bran and shorts (byproduct of milling consisting of bran, germ and course meal). The results of residue analysis are shown in Table 60 (Anon., 1975a). In more recent studies in Texas and Nebraska in 1988 and 1989 sorghum was treated with one broadcast application as a post-emergence harvest aid at a rate of 2.8 kg ai/ha, equivalent to five times the normal rate permitted in the USA, and harvested 3 or 7 days after treatment. Whole sorghum grain was processed into hulled grain, wet and dry milled bran, coarse grits, starch, and flour by both dry and wet milling as indicated in Figure 14. The results of residue analysis are shown in Table 60. The limits of quantification were 1 mg/kg for whole grain and grits, 10 mg/kg for bran and 0.5 mg/kg for starch and flour (Roper, 1989j).
Figure 14. Processing of sorghum to hulled grains, bran, grits and flour. Table 60. Paraquat residues in sorghum and processed products from trials in the USA.
Application Location, year (variety) kg ai/ha kg ai/hl water, l/ha No.
PHI days
Paraquat mg/kg Notes Reference
TX, 1988 (Golden Acres T-E
Y-75)
2.8 B* 3
<1
<1 <10 <0.5 <0.5 12.5 10.4
69.7 3.3 3.6 44.8 1.4
Grain, whole & hulled Coarse grits Bran Starch Flour Grain from field Grain from processor Dry milled bran Coarse grits Flour Wet milled bran Starch
Roper, 1989j 11TX88-793
Bran
Dehulling
Hulled grains
Passing through a clipper cleaner
Bran Grits Decorticated grain
WET MILLING DRY MILLING Sorghum grains
Hulls
Milling
Flour
Soaking in a steeping solution at 50°C for 48 hr Draining Blending in distilled water Sieving
Sieving
Particles Separation by gravity
Starch
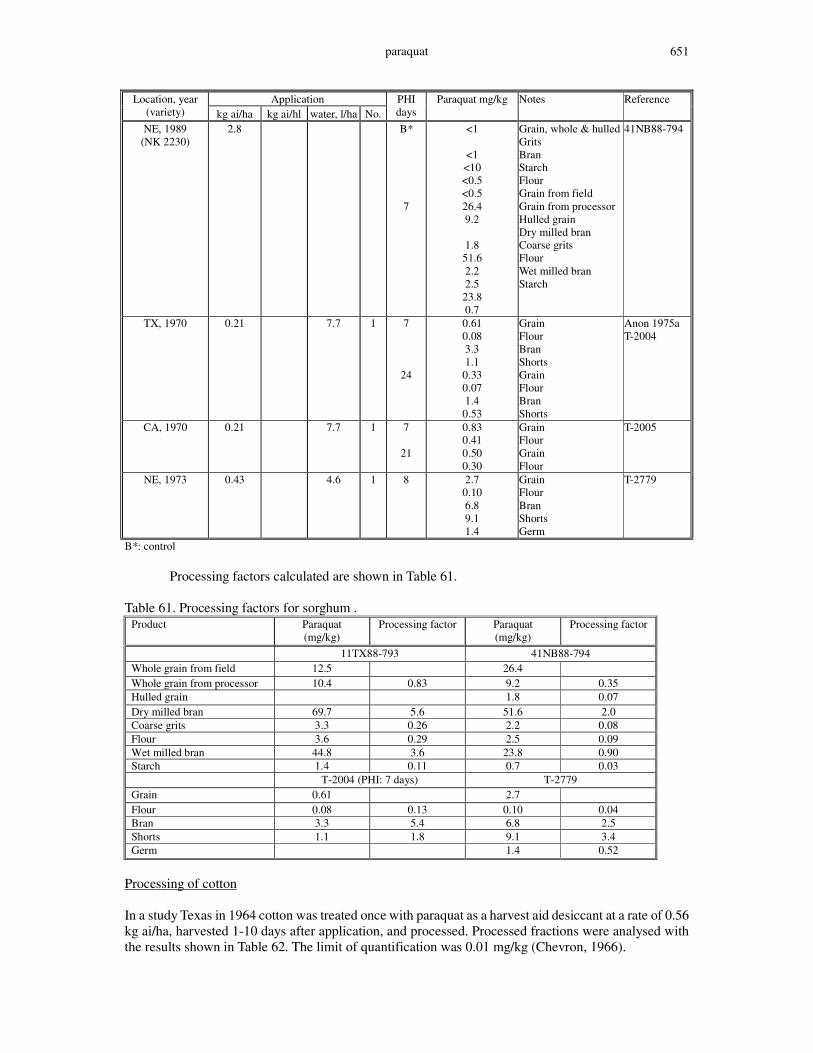
paraquat 651
Application Location, year (variety) kg ai/ha kg ai/hl water, l/ha No.
PHI days
Paraquat mg/kg Notes Reference
NE, 1989 (NK 2230)
2.8 B* 7
<1
<1 <10 <0.5 <0.5 26.4 9.2
1.8 51.6 2.2 2.5 23.8 0.7
Grain, whole & hulled Grits Bran Starch Flour Grain from field Grain from processor Hulled grain Dry milled bran Coarse grits Flour Wet milled bran Starch
41NB88-794
TX, 1970 0.21 7.7 1 7
24
0.61 0.08 3.3 1.1 0.33 0.07 1.4 0.53
Grain Flour Bran Shorts Grain Flour Bran Shorts
Anon 1975a T-2004
CA, 1970 0.21 7.7 1 7
21
0.83 0.41 0.50 0.30
Grain Flour Grain Flour
T-2005
NE, 1973 0.43 4.6 1 8 2.7 0.10 6.8 9.1 1.4
Grain Flour Bran Shorts Germ
T-2779
B*: control Processing factors calculated are shown in Table 61. Table 61. Processing factors for sorghum .
Product
Paraquat (mg/kg)
Processing factor Paraquat (mg/kg)
Processing factor
11TX88-793 41NB88-794 Whole grain from field 12.5 26.4 Whole grain from processor 10.4 0.83 9.2 0.35 Hulled grain 1.8 0.07 Dry milled bran 69.7 5.6 51.6 2.0 Coarse grits 3.3 0.26 2.2 0.08 Flour 3.6 0.29 2.5 0.09 Wet milled bran 44.8 3.6 23.8 0.90 Starch 1.4 0.11 0.7 0.03 T-2004 (PHI: 7 days) T-2779 Grain 0.61 2.7 Flour 0.08 0.13 0.10 0.04 Bran 3.3 5.4 6.8 2.5 Shorts 1.1 1.8 9.1 3.4 Germ 1.4 0.52
Processing of cotton In a study Texas in 1964 cotton was treated once with paraquat as a harvest aid desiccant at a rate of 0.56 kg ai/ha, harvested 1-10 days after application, and processed. Processed fractions were analysed with the results shown in Table 62. The limit of quantification was 0.01 mg/kg (Chevron, 1966).
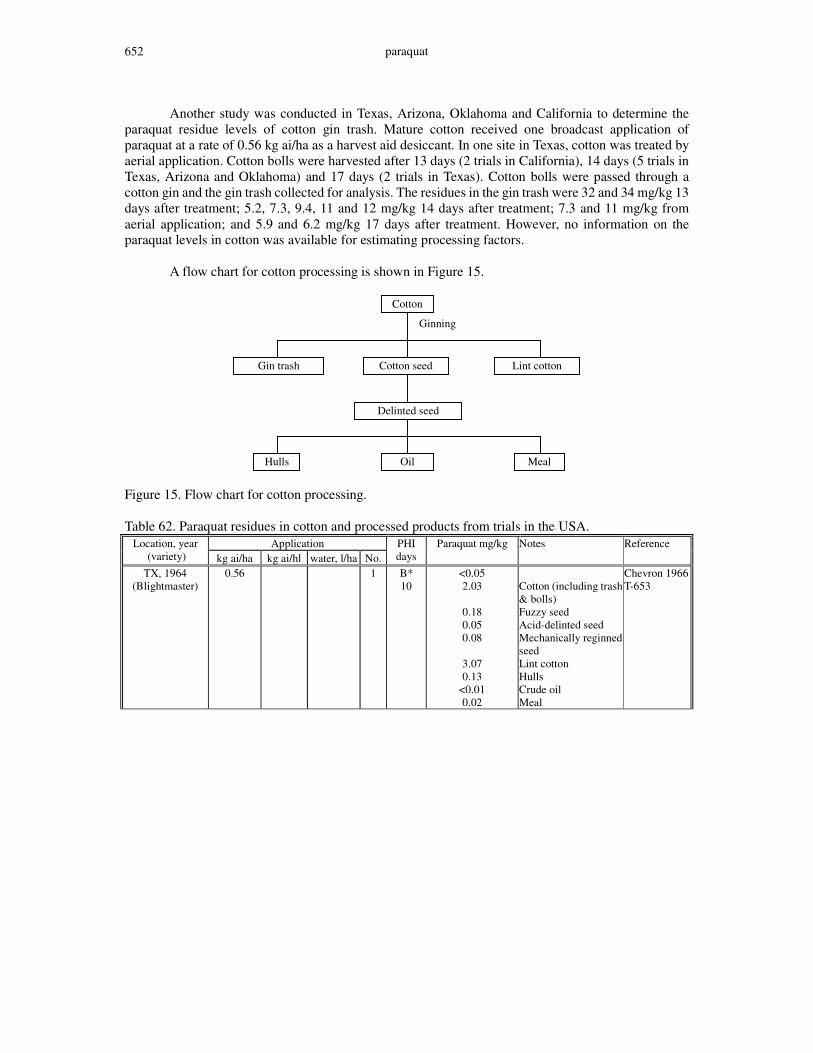
paraquat 652
Another study was conducted in Texas, Arizona, Oklahoma and California to determine the paraquat residue levels of cotton gin trash. Mature cotton received one broadcast application of paraquat at a rate of 0.56 kg ai/ha as a harvest aid desiccant. In one site in Texas, cotton was treated by aerial application. Cotton bolls were harvested after 13 days (2 trials in California), 14 days (5 trials in Texas, Arizona and Oklahoma) and 17 days (2 trials in Texas). Cotton bolls were passed through a cotton gin and the gin trash collected for analysis. The residues in the gin trash were 32 and 34 mg/kg 13 days after treatment; 5.2, 7.3, 9.4, 11 and 12 mg/kg 14 days after treatment; 7.3 and 11 mg/kg from aerial application; and 5.9 and 6.2 mg/kg 17 days after treatment. However, no information on the paraquat levels in cotton was available for estimating processing factors. A flow chart for cotton processing is shown in Figure 15.
Figure 15. Flow chart for cotton processing. Table 62. Paraquat residues in cotton and processed products from trials in the USA.
Application Location, year (variety) kg ai/ha kg ai/hl water, l/ha No.
PHI days
Paraquat mg/kg Notes Reference
TX, 1964 (Blightmaster)
0.56 1 B* 10
<0.05 2.03
0.18 0.05 0.08
3.07 0.13
<0.01 0.02
Cotton (including trash & bolls) Fuzzy seed Acid-delinted seed Mechanically reginned seed Lint cotton Hulls Crude oil Meal
Chevron 1966 T-653
Cotton
Ginning
Cotton seed Gin trash Lint cotton
Delinted seed
Oil Hulls Meal

paraquat 653
Application Location, year (variety) kg ai/ha kg ai/hl water, l/ha No.
PHI days
Paraquat mg/kg Notes Reference
TX, 1964 (Rex)
0.56 1 9 1.37
0.09 <0.01 <0.01
0.01
<0.01 <0.01
1.13
0.14 <0.01 0.01
<0.01 <0.01 <0.01
Cotton (including trash & bolls) Fuzzy seed Acid-delinted seed Mechanically reginned seed Hulls Crude oil Meal BIS(METHYSULFATE) SALT** Cotton (including trash & bolls) Fuzzy seed Acid-delinted seed Mechanically reginned seed Hulls Crude oil Meal
T-654
B*: control ** dichloride salt used
Processing factors calculated are shown in Table 63. Table 63. Processing factors for cotton products.
Product
Paraquat (mg/kg)
Processing factor
Paraquat (mg/kg)
Processing factor
T-653 T-654 Cotton (trash & bolls) 2.03 1.37 Fuzzy seed 0.18 0.09 0.09 0.07 Acid delinted seed 0.05 0.02 <0.01 <0.007 Mechanically delinted seed 0.05 0.02 <0.01 <0.007 Lint cotton 3.07 1.5 Hulls 0.13 0.06 0.01 0.007 Crude oil <0.01 <0.005 <0.01 <0.007 Meal 0.02 0.01 <0.01 <0.007
Sunflower A study was conducted in California, Iowa, Minnesota, Mississippi, North Dakota, South Dakota and Texas, USA, to determine paraquat residues in sunflower oil and meal prepared from sunflower seed. Sunflowers received one application of paraquat as a harvest aid desiccant at rates from 0.28 to 1.12 kg ai/ha (ground application in 5 of 16 tests and aerial application in the others). Mature seeds were harvested 1-3 weeks after treatment and processed to oil, meal and hulls. The results of residue analysis are given in Table 64. The LOQ was 0.01 mg/kg (Chevron, 1975a). Table 64. Paraquat residues in sunflower products from trials in the USA.
Application Location , year (variety) kg ai/ha kg ai/hl water, l/ha No.
PHI days
Paraquat mg/kg Notes Reference
CA, 1971 (Peredovik)
0.28
0.56
61
61
1 B* 7
<0.01 0.11 0.25 0.15
<0.01 0.35 0.62 0.55
<0.01
Mature seed Hulls Meal Oil Mature seed Hulls Meal Oil
Chevron 1975a T-2185 (ground appl.)
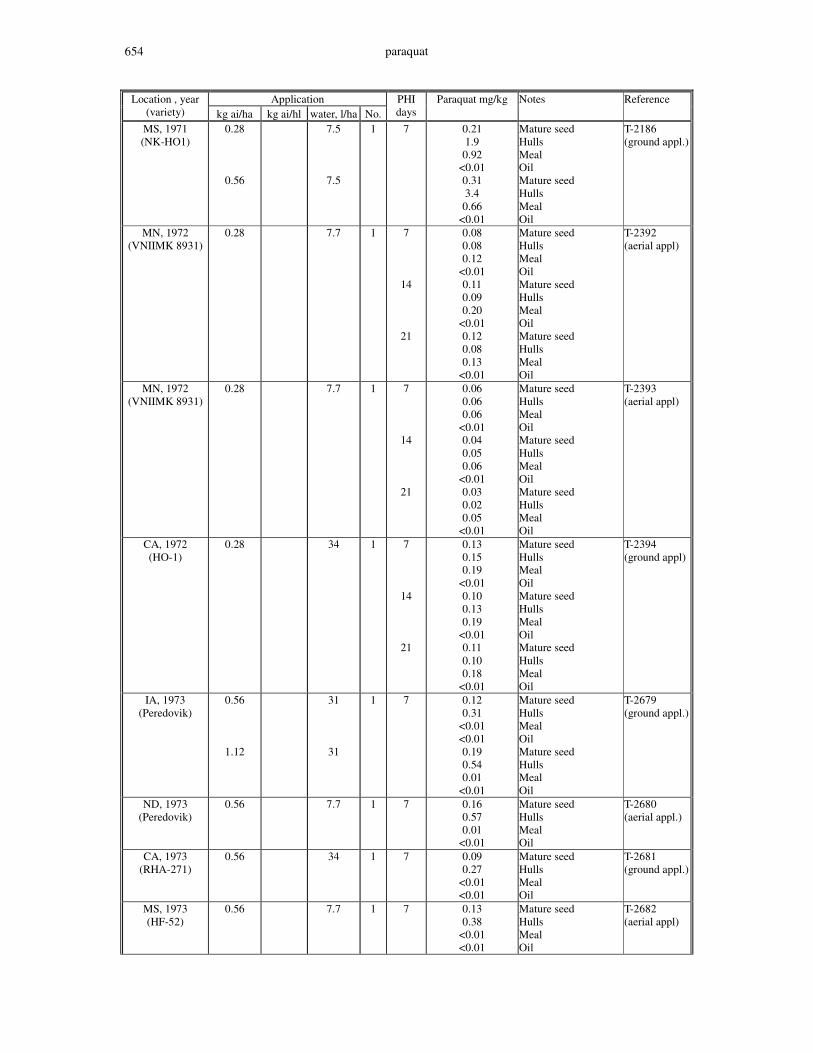
paraquat 654
Application Location , year (variety) kg ai/ha kg ai/hl water, l/ha No.
PHI days
Paraquat mg/kg Notes Reference
MS, 1971 (NK-HO1)
0.28
0.56
7.5
7.5
1 7 0.21 1.9 0.92
<0.01 0.31 3.4 0.66
<0.01
Mature seed Hulls Meal Oil Mature seed Hulls Meal Oil
T-2186 (ground appl.)
MN, 1972 (VNIIMK 8931)
0.28
7.7
1 7
14
21
0.08 0.08 0.12
<0.01 0.11 0.09 0.20
<0.01 0.12 0.08 0.13
<0.01
Mature seed Hulls Meal Oil Mature seed Hulls Meal Oil Mature seed Hulls Meal Oil
T-2392 (aerial appl)
MN, 1972 (VNIIMK 8931)
0.28
7.7
1 7
14
21
0.06 0.06 0.06
<0.01 0.04 0.05 0.06
<0.01 0.03 0.02 0.05
<0.01
Mature seed Hulls Meal Oil Mature seed Hulls Meal Oil Mature seed Hulls Meal Oil
T-2393 (aerial appl)
CA, 1972 (HO-1)
0.28 34 1 7
14
21
0.13 0.15 0.19
<0.01 0.10 0.13 0.19
<0.01 0.11 0.10 0.18
<0.01
Mature seed Hulls Meal Oil Mature seed Hulls Meal Oil Mature seed Hulls Meal Oil
T-2394 (ground appl)
IA, 1973 (Peredovik)
0.56
1.12
31
31
1 7 0.12 0.31
<0.01 <0.01 0.19 0.54 0.01
<0.01
Mature seed Hulls Meal Oil Mature seed Hulls Meal Oil
T-2679 (ground appl.)
ND, 1973 (Peredovik)
0.56 7.7 1 7 0.16 0.57 0.01
<0.01
Mature seed Hulls Meal Oil
T-2680 (aerial appl.)
CA, 1973 (RHA-271)
0.56 34 1 7 0.09 0.27
<0.01 <0.01
Mature seed Hulls Meal Oil
T-2681 (ground appl.)
MS, 1973 (HF-52)
0.56 7.7 1 7 0.13 0.38
<0.01 <0.01
Mature seed Hulls Meal Oil
T-2682 (aerial appl)

paraquat 655
Application Location , year (variety) kg ai/ha kg ai/hl water, l/ha No.
PHI days
Paraquat mg/kg Notes Reference
SD, 1973 (Record)
0.63 3.8 1 14 0.16 0.46 0.02
<0.01
Mature seed Hulls Meal Oil
T2683 (aerial appl)
MN, 1973 (Cargill 101)
0.56 7.7 1 9 0.21 0.62 0.02
<0.01
Mature seed Hulls Meal Oil
T-2684 (aerial appl)
MN, 1974 (Sputnik)
0.56 7.7 1 7 0.14 0.28 0.09
<0.01
Mature seed Hulls Meal Oil
T-3069 (aerial appl)
ND, 1974 (Sputnik)
0.56 7.7 1 7 0.24 0.55 0.13
<0.01
Mature seed Hulls Meal Oil
T-3070 (aerial appl)
TX, 1974 (Sun Hi 372)
0.56 7.7 1 15 0.19 0.40 0.11
<0.01
Mature seed Hulls Meal Oil
T-3126 (aerial appl)
B*: control Processing factors calculated from the results obtained with an application rate of 1.12 kg ai/ha are shown in Table 65.
Table 65. Processing factors from sunflower seed to processed commodities Product
Paraquat (mg/kg)
Processing factor
T-2679 Mature seed 0.19 Hulls 0.54 2.8 Meal 0.01 0.05 Oil <0.01 <0.05
In some trials with lower application rates, higher paraquat residues (0.35, 0.31 and 0.24 mg/kg) were observed in mature seeds. However, the paraquat concentrations in the oil samples, prepared from these mature seeds with higher paraquat residues, were below the limit of detection of 0.01 mg/kg. Hops A study was conducted in the states of Idaho and Washington, USA, to determine paraquat residues in spent hops and a methylene chloride extract from dried hops. Hop vines were treated three times with a directed spray of paraquat at a rate of 2.8 kg ai/ha, five times the normal rate in the USA. Green hop cones were harvested 13 or 14 days after the last treatment. Bulk samples of green hops were dried according to commercial practice. Dried hops were processed into spent hops and methylene chloride extract as shown in Figure 16. The results of residue analysis are shown in Table 66. The limit of quantification was 0.05 mg/kg for green hops, 0.1 mg/kg for dried and spent hops, and 0.0125 mg/kg for methylene chloride extract (Roper, 1989). Another study was conducted in Oregon, USA, to determine paraquat residues in beer. The hop vines received three applications except one trial in which only two applications were made, at 0.56, 1.12 or 2.24 kg ai/ha each time. Green cones were harvested 14 days after the last application. A portion of the cones were dried and used to make beer. No detailed description of beer brewing process was provided. The results of residue analysis are given in Table 67. The LOQ was 0.01 mg/kg for green hops, dried hops and beer (Anon., 1975).
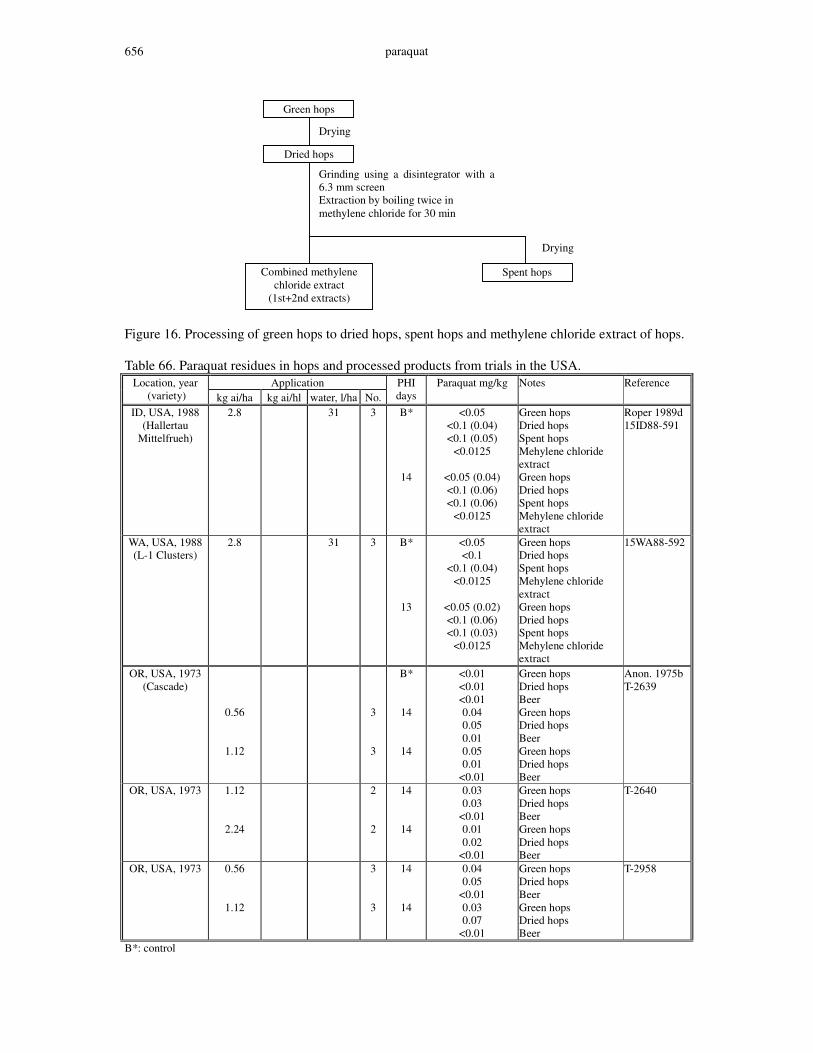
paraquat 656
Figure 16. Processing of green hops to dried hops, spent hops and methylene chloride extract of hops.
Table 66. Paraquat residues in hops and processed products from trials in the USA.
Application Location, year (variety) kg ai/ha kg ai/hl water, l/ha No.
PHI days
Paraquat mg/kg Notes Reference
ID, USA, 1988 (Hallertau
Mittelfrueh)
2.8 31 3 B*
14
<0.05 <0.1 (0.04) <0.1 (0.05)
<0.0125
<0.05 (0.04) <0.1 (0.06) <0.1 (0.06)
<0.0125
Green hops Dried hops Spent hops Mehylene chloride extract Green hops Dried hops Spent hops Mehylene chloride extract
Roper 1989d 15ID88-591
WA, USA, 1988 (L-1 Clusters)
2.8 31 3 B*
13
<0.05 <0.1
<0.1 (0.04) <0.0125
<0.05 (0.02) <0.1 (0.06) <0.1 (0.03)
<0.0125
Green hops Dried hops Spent hops Mehylene chloride extract Green hops Dried hops Spent hops Mehylene chloride extract
15WA88-592
OR, USA, 1973 (Cascade)
0.56
1.12
3
3
B*
14
14
<0.01 <0.01 <0.01 0.04 0.05 0.01 0.05 0.01
<0.01
Green hops Dried hops Beer Green hops Dried hops Beer Green hops Dried hops Beer
Anon. 1975b T-2639
OR, USA, 1973 1.12
2.24
2
2
14
14
0.03 0.03
<0.01 0.01 0.02
<0.01
Green hops Dried hops Beer Green hops Dried hops Beer
T-2640
OR, USA, 1973 0.56
1.12
3
3
14
14
0.04 0.05
<0.01 0.03 0.07
<0.01
Green hops Dried hops Beer Green hops Dried hops Beer
T-2958
B*: control
Green hops
Drying
Dried hops
Grinding using a disintegrator with a 6.3 mm screen Extraction by boiling twice in methylene chloride for 30 min
Combined methylene chloride extract
(1st+2nd extracts)
Spent hops
Drying

paraquat 657
In the study on processing green hops to dried hops, spent hops and methylene chloride extract, residues were all below the limit of quantification, so processing factors could not be reliably calculated. Processing factors were calculated for brewing beer and are shown in Table 67. Drying green hops to dried hops does not cause much increase in the concentration of paraquat which indicates some degradation of paraquat during drying. Table 67. Processing factors from green hops to hops and beer. Product Paraquat
(mg/kg) Processing
factor Paraquat (mg/kg)
Processing factor
Paraquat (mg/kg)
Processing factor
T-2639 (0.56 kg ai/ha) T-2958 (0.56 kg ai/ha) T-2639 (1.12 kg ai/ha) Green cones 0.04 0.04 0.05 Dry cones 0.05 1.3 0.05 1.3 0.01 0.2 Beer 0.01 0.25 <0.01 <0.25 <0.01 <0.2 T-2958 (1.12 kg ai/ha) T-2640 (1.12 kg ai/ha) Mean processing factor Green cones 0.03 0.03 Dry cones 0.07 2.3 0.03 1 1.2 Beer <0.01 <0.33 <0.01 <0.33 <0.28 Maximum application rate in the USA: 0.55 kg ai/ha.
RESIDUES IN ANIMAL COMMODITIES Farm animal feeding studies In animal metabolism studies on a goat and hens, paraquat residue concentrations were measured in tissues, milk and eggs (see Tables 7-9). No additional animal feeding studies were submitted. RESIDUES IN FOOD IN COMMERCE OR AT CONSUMPTION In the residue monitoring data from the Australian National Residue Survey (2001-2002), 18 samples of macademia nuts were analysed for paraquat by an HPLC method. No residues were detected above the limit of reporting of 0.02 mg/kg. NATIONAL MAXIMUM RESIDUE LIMITS National MRLs in Argentina, Brazil, Czech Republic, European Union, Peru and the USA were reported by the manufacturer. The information on MRLs in Japan was obtained from the official web site of the Ministry of Environment. The information on MRLs in Australia and tolerances in the USA was provided by the governments of Australia and the USA respectively. Table 68. National maximum residue limits.
Country Commodity MRL (mg/kg)
Cotton oil 0.05 Cotton seed 0.2
Argentina
Potato 0.2 Cereal grains [except maize; rice]
0.05*
Cotton seed 0.2 Cotton seed oil, edible 0.05 Edible offal (mammalian) 0.5 Eggs 0.01* Fruits (except olives) 0.05* Hops, dry 0.2
Australia
Maize 0.1
Country Commodity MRL (mg/kg)
Meat (mammalian) 0.05* Milks 0.01* Olives 1 Peanut 0.01* Peanut, whole 0.01* Potato 0.2 Poultry, Edible offal of 0.05* Poultry meat 0.05* Pulses 1 Rice 10 Rice, polished 0.5
Sugar cane 0.05*
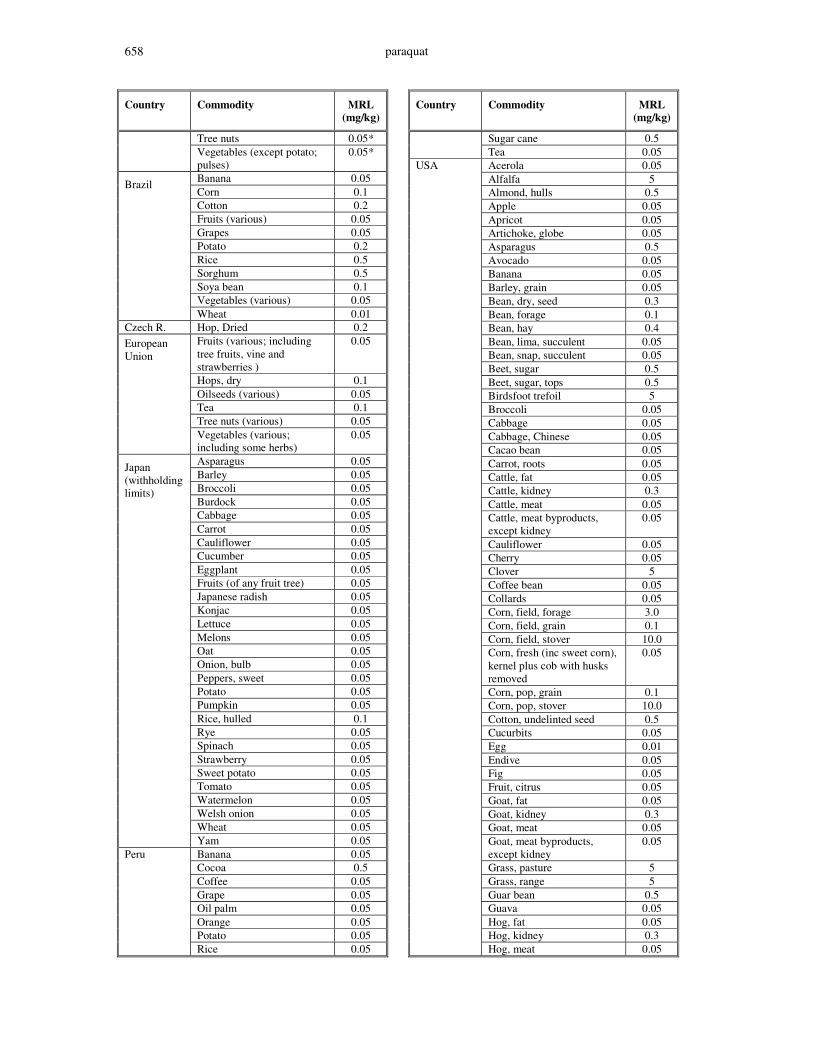
paraquat 658
Country Commodity MRL (mg/kg)
Tree nuts 0.05* Vegetables (except potato; pulses)
0.05*
Banana 0.05 Corn 0.1 Cotton 0.2 Fruits (various) 0.05 Grapes 0.05 Potato 0.2 Rice 0.5 Sorghum 0.5 Soya bean 0.1 Vegetables (various) 0.05
Brazil
Wheat 0.01 Czech R. Hop, Dried 0.2
Fruits (various; including tree fruits, vine and strawberries )
0.05
Hops, dry 0.1 Oilseeds (various) 0.05 Tea 0.1 Tree nuts (various) 0.05
European Union
Vegetables (various; including some herbs)
0.05
Asparagus 0.05 Barley 0.05 Broccoli 0.05 Burdock 0.05 Cabbage 0.05 Carrot 0.05 Cauliflower 0.05 Cucumber 0.05 Eggplant 0.05 Fruits (of any fruit tree) 0.05 Japanese radish 0.05 Konjac 0.05 Lettuce 0.05 Melons 0.05 Oat 0.05 Onion, bulb 0.05 Peppers, sweet 0.05 Potato 0.05 Pumpkin 0.05 Rice, hulled 0.1 Rye 0.05 Spinach 0.05 Strawberry 0.05 Sweet potato 0.05 Tomato 0.05 Watermelon 0.05 Welsh onion 0.05 Wheat 0.05
Japan (withholding limits)
Yam 0.05 Banana 0.05 Cocoa 0.5 Coffee 0.05 Grape 0.05 Oil palm 0.05 Orange 0.05 Potato 0.05
Peru
Rice 0.05
Country Commodity MRL (mg/kg)
Sugar cane 0.5 Tea 0.05 Acerola 0.05 Alfalfa 5 Almond, hulls 0.5 Apple 0.05 Apricot 0.05 Artichoke, globe 0.05 Asparagus 0.5 Avocado 0.05 Banana 0.05 Barley, grain 0.05 Bean, dry, seed 0.3 Bean, forage 0.1 Bean, hay 0.4 Bean, lima, succulent 0.05 Bean, snap, succulent 0.05 Beet, sugar 0.5 Beet, sugar, tops 0.5 Birdsfoot trefoil 5 Broccoli 0.05 Cabbage 0.05 Cabbage, Chinese 0.05 Cacao bean 0.05 Carrot, roots 0.05 Cattle, fat 0.05 Cattle, kidney 0.3 Cattle, meat 0.05 Cattle, meat byproducts, except kidney
0.05
Cauliflower 0.05 Cherry 0.05 Clover 5 Coffee bean 0.05 Collards 0.05 Corn, field, forage 3.0 Corn, field, grain 0.1 Corn, field, stover 10.0 Corn, fresh (inc sweet corn), kernel plus cob with husks removed
0.05
Corn, pop, grain 0.1 Corn, pop, stover 10.0 Cotton, undelinted seed 0.5 Cucurbits 0.05 Egg 0.01 Endive 0.05 Fig 0.05 Fruit, citrus 0.05 Goat, fat 0.05 Goat, kidney 0.3 Goat, meat 0.05 Goat, meat byproducts, except kidney
0.05
Grass, pasture 5 Grass, range 5 Guar bean 0.5 Guava 0.05 Hog, fat 0.05 Hog, kidney 0.3
USA
Hog, meat 0.05
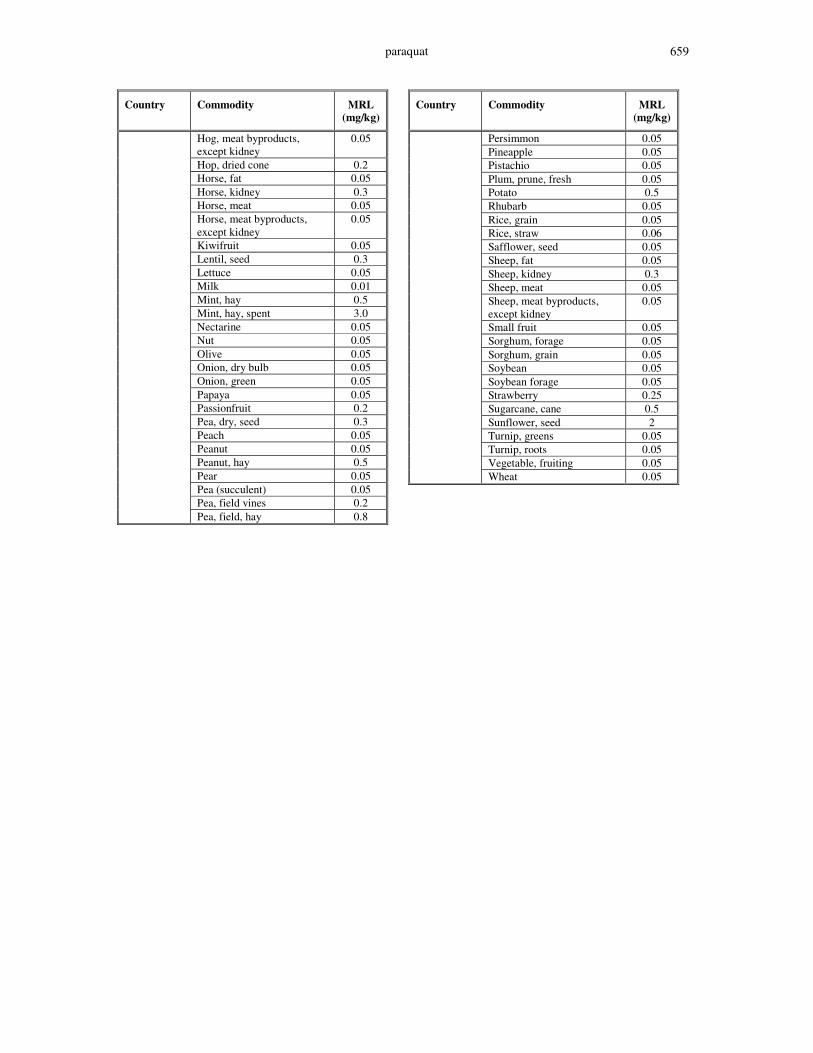
paraquat 659
Country Commodity MRL (mg/kg)
Hog, meat byproducts, except kidney
0.05
Hop, dried cone 0.2 Horse, fat 0.05 Horse, kidney 0.3 Horse, meat 0.05 Horse, meat byproducts, except kidney
0.05
Kiwifruit 0.05 Lentil, seed 0.3 Lettuce 0.05 Milk 0.01 Mint, hay 0.5 Mint, hay, spent 3.0 Nectarine 0.05 Nut 0.05 Olive 0.05 Onion, dry bulb 0.05 Onion, green 0.05 Papaya 0.05 Passionfruit 0.2 Pea, dry, seed 0.3 Peach 0.05 Peanut 0.05 Peanut, hay 0.5 Pear 0.05 Pea (succulent) 0.05 Pea, field vines 0.2
Pea, field, hay 0.8
Country Commodity MRL (mg/kg)
Persimmon 0.05 Pineapple 0.05 Pistachio 0.05 Plum, prune, fresh 0.05 Potato 0.5 Rhubarb 0.05 Rice, grain 0.05 Rice, straw 0.06 Safflower, seed 0.05 Sheep, fat 0.05 Sheep, kidney 0.3 Sheep, meat 0.05 Sheep, meat byproducts, except kidney
0.05
Small fruit 0.05 Sorghum, forage 0.05 Sorghum, grain 0.05 Soybean 0.05 Soybean forage 0.05 Strawberry 0.25 Sugarcane, cane 0.5 Sunflower, seed 2 Turnip, greens 0.05 Turnip, roots 0.05 Vegetable, fruiting 0.05
Wheat 0.05
paraquat 660
APPRAISAL Paraquat, a non-selective contact herbicide, was first evaluated by the JMPR for toxicology and residues in 1970. Subsequently, it was reviewed for toxicology in 1972, 1976, 1982, 1985 and 1986 and for residues in 1972, 1976, 1978 and 1981. The Meeting reviewed paraquat toxicologically within the periodic review programme in 2003 and established an ADI of 0–0.005 mg/kg bw and an ARfD of 0.006 mg/kg bw as paraquat cation. Currently, there are 22 Codex MRLs for plant commodities, their derived products and animal commodities.
The CCPR at its Thirty-second Session identified paraquat as a priority for periodic review by the 2002 JMPR, but residue evaluation was postponed to the present Meeting.
Paraquat is usually available in the form of paraquat dichloride or paraquat bis(methylsulfate). The Meeting received data on metabolism, environmental fate, analytical methods, storage stability, supervised field trials, processing and use patterns.
Metabolism
Animals
The WHO Expert Group of the 2003 JMPR reviewed studies on the the excretion balance of paraquat in rats given a single dose of 1 or 50 mg/kg bw [1,1´-14C-dimethyl]paraquat dichloride or 14 daily doses of 1 mg/kg bw unlabelled paraquat dichloride followed by 1 mg/kg bw of the labelled compound. They also evaluated studies of the biotransformation of paraquat in rats given the same doses of radiolabelled paraquat and other studies of metabolism and toxicity in rats. They concluded that orally administered paraquat is not well absorbed. Excretion was rapid, with 60–70% in faeces and 10–20% in urine; 90% was excreted within 72 h. Paraquat was eliminated largely unchanged: 90–95% of radiolabelled paraquat in urine was identified as the parent compound.
When 23 mg/kg [1,1´-14C-dimethyl]paraquat dichloride were administered through a rumen fistula to one sheep, all the administered radiolabel was excreted within 10 days in urine (4%) and faeces (96%), indicating that residues of orally administered paraquat would not remain or accumulate in sheep tissues. Most of the radiolabel in urine and faeces was attributed to unchanged paraquat and 2–3% to paraquat monopyridone. Less than 1% 4-carboxy-1-methylpyridinium ion, paraquat dipyridone and monoquat were found.
When 0.92 mg/kg [1,1´-14C-dimethyl]paraquat dichloride was administered subcutaneously to a sheep, paraquat was again excreted rapidly. Over 80% of the administered radioactivity was excreted in urine, 69% 1 day after treatment. Unchanged paraquat accounted for most of the radiolabel. The monopyridone was present at 2–3% and monoquat as a trace metabolite. The excretion patterns in the two sheep were virtually identical, regardless of the route of administration.
A pig weighing about 40 kg was fed twice daily with a diet containing [1,1´-14C-dimethyl]paraquat ion at a rate equivalent to 50 mg/kg for 7 days. At sacrifice, 69% of the administered radiolabel had been excreted in faeces and 3.4% in urine; 13% was present in the stomach contents and viscera. All the radiolabel found in tissues, except in liver, was attributed to paraquat. About 70% of the radiolabel in the liver was identified as paraquat, with 7% as monoquat ion and about 0.6% as monopyridone ion. This result indicates that there is no significant metabolism of paraquat in pigs.
In a similar study, a pig was fed a diet containing [2,2´,6,6´-14C]paraquat ion at a rate equivalent to 50 mg/kg for 7 days. At sacrifice, 72.5% of the administered radiolabel had been excreted in faeces and 2.8% in urine. In the liver, about 70% of the radiolabel was identified as paraquat and 4% as monoquat ion.
A Friesian cow weighing 475 kg given a single dose of about 8 mg/kg [1,1´-14C-dimethyl]paraquat dichloride from a balling gun excreted 95.6% of the administered radioactivity in faeces within 9 days; 89% was excreted within the first 3 days. Analysis indicated that 97–99% of the radioactivity in 1–4-day faeces and 100% of that in 5–6-day faeces co-chromatographed
paraquat 661
with paraquat. A total of 0.7% of the administered dose was excreted in urine, 80% of which was excreted within the first 2 days. Paraquat accounted for 90% of the radiolabel in urine on day 1, 70% on day 3 and 62% on day 5. The remaining activity was attributed to paraquat monopyridone and monoquat. Only 0.0032% of the administered radiolabel was recovered from milk within 9 days. The traces of radioactivity in milk (a maximum of 0.005 mg/l as paraquat ion equivalent milk taken in the morning of day 2) were attributed mainly to paraquat and its monopyridone and to a naturally occurring compound which appeared to be lactose. The residue level of any one compound in milk was � 0.002 mg/kg.
When a lactating goat was dosed with [2,2´,6,6´-14C]paraquat dichloride twice daily at each milking for 7 days at a total daily rate equivalent to approximately 100 mg/kg in the diet, 50.3% of the administered radioactivity was excreted in faeces, 2.4% in urine and 33.2% in stomach contents by the time of sacrifice. The total radioactivity, expressed in paraquat ion equivalents, in milk increased during the experimental period, reaching a maximum of 0.0092 mg/kg (equivalent to 0.003% of the daily dose) 4 h before slaughter. Of this radioactivity, 75.7% was attributed to paraquat, and 15.8% did not show a cationic character. There appeared to be no significant metabolism of paraquat in any tissue, except liver and peritoneal fat, where about half the radiolabel was attributed to paraquat, < 5% as monopyridone ion and 5% as monoquat ion.
Warren laying hens given [2,2´,6,6´-14C]paraquat ion in gelatin capsules at a rate equivalent to 30 mg/kg normal diet for 10 days had excreted 99% of the administered radiolabel in faeces at the time of sacrifice; 96.6% of the radiolabel was attributed to unchanged paraquat. The amount of radiolabel in egg albumen did not exceed 0.0014 mg/kg in paraquat ion equivalents throughout the experimental period, while that in the yolk was < 0.001 mg/kg on day 1 and increased gradually to 0.18 mg/kg (in one bird) on day 8. All the radiolabel in yolk was identified as paraquat.
The studies on the fate of orally administered paraquat show that most is excreted unchanged, mainly in faeces and to a much smaller extent in urine. Excretion of paraquat was rapid in all the species studied, hens showing the most efficient excretion. Little paraquat was absorbed from the gastrointestinal tract, and the small amount absorbed was not significantly metabolized. Less than 0.05 mg/kg of paraquat was found in muscle, milk and eggs, even at the high dose rates used in these studies. These findings indicate that no significant bioaccumulation of paraquat is expected to occur in these species.
The metabolism of paraquat in these species was similar. Four metabolites were identified: monoquat, paraquat monopyridone, 4-carboxy-1-methylpyridinium ion and paraquat dipyridone. In all tissues except liver of all the species tested and in goat peritoneal fat, 80–100% of the total radiolabel was attributable to the parent compound, paraquat. In liver and goat peritoneal fat, 50–80% of the radiolabel was associated with paraquat, and absorbed paraquat was metabolized to monoquat and paraquat monopyridone and to a much smaller extent to 4-carboxy-1-methylpyridinium ion. The metabolism of paraquat involves oxygenation of one pyridine ring to form paraquat monopyridone and desmethylation of one pyridine ring to form monoquat. Cleavage of the pyridine–pyridine linkage produces 4-carboxy-1-methylpyridinium ion. The other N-methylpyridine moiety would produce carbon dioxide and methylamine.
Plants
When paraquat is used as a directed spray before sowing, before planting, before emergence and after emergence, it is present in soil as residues, but no direct contact occurs with crops. Sandy loam soil in pots in which lettuce and carrots were sown was sprayed with [U-14C-bipyridyl]paraquat ion immediately after sowing at rates equivalent to 14.3 kg ai/ha for lettuce and 14.7 kg ai/ha for carrots, which are 13 times the highest current application rates for those crops, and maintained in a greenhouse. The radiolabel in mature lettuce and carrots harvested 65 and 96 days after treatment represented 0.0034 and 0.0048 mg/kg in paraquat ion equivalents, respectively. This result confirms the lack of significant translocation of residues of paraquat from treated soil to lettuce leaves or carrot roots.
Paraquat is also used as a crop desiccant and harvest aid, when it is in direct contact with crops. The foliage of potatoes and soya beans growing in pots in a greenhouse was treated with 14C-paraquat at
paraquat 662
rates equivalent to 8.7 or 8.8 kg ai/ha (potato) and 8.2 kg ai/ha (soya beans), 14–16 times the highest current use for desiccation on potato and soya beans. The average TRR, expressed in paraquat ion equivalents, in soya and potato plants harvested 4 days after treatment were 638 mg/kg in soya foliage, 0.747 mg/kg in soya beans and 0.082 mg/kg in potato tuber. In all the samples, 89–94% of the TRR was identified as paraquat. The rest of the radioactive residue consisted of two or three fractions, none of which exceeded 10% of the respective TRR. In soya foliage extracts, small amounts of 4-carboxy-1-methylpyridinium ion (0.3% TRR) and monoquat (0.3 % TRR) were found. The latter is a known photodegradation product of paraquat.
As paraquat is strongly adsorbed by soil (see above), its uptake by plants after pre-emergence or post-emergence directed use is insignificant, even at exaggerated application rates. When paraquat was applied as a desiccant to potato and soya bean at a rate > 10 times the highest recommended application rate, with a 4-day PHI, the main component in potato tuber, soya beans and soya foliage was paraquat. In soya foliage, monoquat and 4-carboxy-1-methylpyridinium ion were also found. Although the latter is a known photodegradation product and was not found in soya beans or potato tuber, biotransformation cannot be excluded because the TRR was too low for reliable identification. As the fate of paraquat in soya foliage appears to involve photodegradation, its fate is considered to be common among plants.
The metabolism of paraquat involves desmethylation of one pyridine ring to form monoquat. 4-Carboxy-1-methylpyridinium ion appears to be produced by photolysis of monoquat, with breakdown of the pyridine–pyridine linkage, but involvement of biotransformation cannot be excluded. Paraquat monopyridone and dipyridone, which are found in animals, were not found in plants even at much higher than normal application rates. The transformation of paraquat in plants is similar to its metabolism in animals. Environmental fate
Soil
Paraquat was applied to slurries of loam, loamy sand, silty clay loam or coarse sand in 0.01 mol/l aqueous calcium chloride at rates higher than normal, to give 0.01 mg/l in the equilibrium solution after a 16-h equilibration. The calculated adsorption coefficients ranged from 480 in the coarse sand to 50 000 in the loam. At normal application rates, the concentration of paraquat in the equilibrium solution could not be determined (< 0.0075 mg/l). No significant desorption was observed.
A field survey of 242 agricultural soils in Denmark, Germany, Greece, Italy, The Netherlands and the United Kingdom showed that paraquat was strongly adsorbed to all the soil types studied. The adsorption coefficients calculated at application rates much higher than normal ranged from 980 to 400 000, and those adjusted for the organic carbon content of soil were 8400–40 000 000. Adsorption coefficients could not be calculated at normal application rates because the concentration in equilibrium solution was below the limit of determination (0.01 mg/l). On the McCall scale, paraquat was classified as ‘immobile’ in all these soils, without leaching.
[2,6-14C]Paraquat was applied to sandy loam soil in pots at a nominal rate of 1.05 kg/ha and incubated in the dark at 20 ± 2 °C under aerobic conditions in order to study the aerobic degradation of paraquat. After 180 days of incubation, paraquat accounted for > 93% of the applied radiocarbon, with no detected degradation products. Less than 0.1% of the applied radioactivity evolved as 14CO2 over the 180-day incubation period. The half-life of paraquat in soil under aerobic conditions could not be estimated, although a long half-life in soil was implied by the results of the study.
In long-term field dissipation studies conducted on cropped plots in Australia, Malaysia, The Netherlands, Thailand, the United Kingdom and the USA, the location had no major effect on the field dissipation rate. Generally, paraquat residue levels had declined to about 50% 10–20 years after the start of the studies. This implies a DT50 of 10–20 years after application of single, large doses of paraquat to soil. The DT90 could not be estimated in these studies, however, as the experimental periods were too short.
Conventional laboratory studies could not provide useful information on the route or rate of degradation of paraquat in soil because of its strong adsorption to soil minerals and organic matter. In

paraquat 663
order to obtain information, microbiological degradation studies were conducted with microorganisms isolated from soil. The most effective soil organism for decomposing paraquat was a yeast species, Lipomyces starkeyi. When incubated with radiolabelled paraquat, the yeast culture or cultures originating from two sandy loam soils decomposed most of the paraquat, released CO2 and formed oxalic acid at 24–25 °C.
An unidentified bacterium isolated from soil metabolized [1,1´-14C]paraquat to monoquat and 4-carboxy-1-methylpyridinium ion. Extracts of Achromobacter D were found to produce CO2, methylamine, succinate and formate as metabolites of 4-carboxy-1-methylpyridinium ion. The results showed that the CO2 originated from a carboxyl group, methylamine from the N-methyl group and the carbon skeletons of formate and succinate from the C-2 and C-3–C-6 atoms of the pyridine ring, respectively. These results indicate that the pyridine ring is split between C-2 and C-3.
The degradation rate of paraquat in soil was determined by cultivating 10 mg/kg [U-14C-dipyridyl]paraquat with Lipomyces and mixed cultures derived from two soils. The degradation of paraquat was rapid, with a DT50 between 0.02 and 1.3 days after a lag phase of about 2 days, accompanied by rapid mineralization to CO2 and the formation of several unidentified minor polar metabolites.
The photolysis of [2,2´,6,6´-14C]-paraquat was studied by applying it to the surface of a highly sandy soil which was exposed to natural sunlight. The proportion of paraquat in samples declined during 85 weeks, at which time paraquat represented 86.6–89.5% of the total radiolabel found in unmixed and mixed soil samples. Thin-layer chromatographic analysis of the 6 mol/l HCl extracts of mixed and unmixed soils contained monoquat ion, paraquat monopyridone ion and an uncharacterized compound, which accounted for 1.4–2.4%, 1.2–1.3% and 1.8–2.4%, respectively, of the total radioactivity after 85 weeks. Photodegradation on the soil surface is not considered to be a major environmental degradation process for paraquat.
Water–sediment systems
Aqueous photolysis of paraquat was examined by maintaining ring-labelled paraquat in sterilized 0.01 mol/l phosphate buffer solution (28 mg/l) at 25 °C under light. After 36 days of irradiation simulating summer sunlight in Florida (USA), most of the recovered radioactivity was attributed to paraquat, with 0.13% as CO2 and no photodegradation products. When solutions of radiolabelled paraquat were exposed to unfiltered ultraviolet light, no paraquat remained after 3 days, with formation of CO2, methylamine and 4-carboxy-1-methylpyridinium ion; the last metabolite further degraded to CO2 and methylamine. These results indicate that, while paraquat appears to be stable to photolysis at pH 7, it readily degrades into CO2 and methylamine when exposed to unfiltered ultraviolet light.
[U-14C-dipyridyl]Paraquat in deionized water was applied to the water surface of two continuously aerated sediment–water systems at a rate equivalent to 1.1 kg ai/ha. Paraquat was strongly adsorbed to the sediment in both systems, even immediately after treatment. After 100 days of incubation, 0.1–0.2% of the applied radioactivity was found in the aqueous phase, 92.9–94.9% in extracts from sediment fractions and 4.2–4.5% in unextracted sediment fractions. Most of the radiolabel recovered from the aqueous phase and sediment extract was attributed to paraquat, while no degradation products were detected. The DT50 or the DT90 could not be estimated as no significant degradation of paraquat was observed during the experimental period.
Residues in succeeding crops
Seeds of wheat, lettuce and carrot were sown into individual pots containing a sandy loam soil 0, 30, 120 and 360 days after treatment of the soil with [2,2´,6,6´-14C]paraquat at an application rate equivalent to 1.05 kg ai/ha, and were maintained in a glasshouse until maturity. Over the course of the study, the TRR in soil represented an average of 99.2% of the applied radioactivity. 14C-Paraquat accounted for 72.7–99.3% of the TRR in soil extracts and no other radioactive compounds were detected in any soil sample. Radioactive residues, expressed in paraquat ion equivalents per kilogram, were below the LOQ in most crop samples sown 0, 30 and 120 days after treatment. The highest
paraquat 664
radioactive residue level, 0.009 mg/kg in paraquat ion equivalents, was found in wheat straw sown 30 days after treatment.
Seeds of lettuce and carrot were sown in pots containing sandy loam soil, and the soil was treated immediately afterwards with [U-14C-dipyridyl]paraquat at exaggerated rates of 14.3 and 14.7 kg/ha respectively, corresponding to approximately 13 times the highest current application rate. The lettuce was harvested 65 days after treatment and the carrots 96 days after treatment. The levels of radioactive residues in lettuce leaf and carrot root at harvest were 0.0034 and 0.0048 mg/kg in paraquat ion equivalents, respectively. There is therefore no significant uptake of paraquat into rotational crops, even when the soil is treated at exaggerated rates.
Methods of analysis
With the long history of registration of paraquat in many countries, many analytical methods have been developed and used for measuring residues in plant and animal commodities. All the methods provided to the Meeting were for analysis of paraquat only. Some analytical methods allow separate determination of paraquat and diquat in a sample.
Samples of plant origin
Six analytical methods for the determination of paraquat in plant commodities and oil and oil cake were submitted.
Three of the methods involve extraction of paraquat by refluxing homogenized or comminuted samples in 0.5 mol/l sulfuric acid for 5 h; filtration, cation-exchange chromatography from which paraquat is eluted with saturated ammonium chloride, conversion of paraquat to its coloured free radical with 0.2% (w/v) sodium dithionite in 0.3 mol/l NaOH and spectrophotometric measurement. The methods differ only in the spectrophotometric measures used: absorption of the free radical in the range 360–430 nm measured against a control solution or absorption in the range of 380–430 nm measured in second derivative mode against a paraquat standard.
In the most recent method, the eluate from cation-exchange chromatography is further cleaned up on a C18 SepPak solid phase extraction cartridge, and the second 5-ml eluate is analysed by reverse-phase ion-pair HPLC with ultraviolet detection at 258 nm.
Two other methods developed for the determination of paraquat in liquid samples, such as oil, also involve second derivative spectrophotometry (360–430 nm), but they do not involve extraction with sulfuric acid. Reverse-phase ion-pair HPLC is also used as the confirmatory method.
All these methods were validated in one or several laboratories for vegetables and fruits, cereal grains and seed, grass and straw, sugar-cane juice, oil seeds, oil and oil cake. The LOQ of these methods ranged from 0.01 to 0.05 mg/kg, except for oil cake, for which the LOQ was 0.5 mg/kg. The mean procedural recoveries were 61–107% at fortification rates reflecting both the LOQ and the actual levels of incurred residues. In general, lower recoveries were made from oil and oil cake. The mean recovery from rape-seed oil cake and olive oil was 67% and that from coffee beans was 61%; those from other commodities were > 70%. The relative standard deviation of recoveries ranged from 2% to 19%.
Samples of animal origin
Three analytical methods for the determination of paraquat in animal products were submitted.
Two methods, including the most recent, for determining paraquat in milk, eggs and animal tissues involve extraction of paraquat by homogenizing samples in 10% trichloroacetic acid, centrifugation, dilution with water, application to a cation-exchange column, sequential washing, elution of paraquat with saturated ammonium chloride, determination by reverse-phase ion-pair HPLC with ultraviolet detection at 258 nm. Fat in milk, skin with subcutaneous fat and fat samples must be removed by hexane extraction before cation exchange.
A method for analysing liquid samples, including milk, does not involve acid extraction or defatting, and milk is mixed directly with cation exchange resin before packing. Otherwise, this method is the same as those described above.

paraquat 665
The LOQs were reported to be 0.005 mg/kg for milk, eggs and bovine, ovine and chicken tissues. The mean procedural recoveries were 75–105%, with a relative standard deviation of 2–13%.
The currently used methods for plant and animal samples were found to be suitable for quantification of paraquat in plant and animal commodities for enforcement purposes. The methods are fully validated and include confirmatory techniques. The earlier methods for quantification of paraquat in plant and animal samples were also found to be suitable in validation; however, a mean recovery < 70% was seen for rape-seed cake, olive oil and coffee beans analysed by one of the methods.
Stability of residues in stored analytical samples
Investigations were reported of the stability of residues in ground samples of prunes, banana, cabbage, potato, carrot, tomato, maize (grain, forage, fodder and silage), wheat grain, coffee beans, birdsfoot trefoil (forage and hay), meat, milk and eggs stored in a deep freezer at a temperature < –15 °C for 1–4 years.
No decrease in residue levels of paraquat, whether fortified or incurred, was observed in any of the crop matrices during the test period, the longest being 46 months. The exception was a slight decrease in birdsfoot trefoil forage that had been treated at a rate equivalent to 0.54 kg ai/ha and contained incurred residues at 57 mg/kg.
No decrease in the levels of residues of paraquat in animal commodity matrices over time was observed under storage for up to 28 months. The test matrices represented a diverse selection of animal tissues, and the studies demonstrate the stability of paraquat under various storage conditions.
Definition of the residue
Paraquat is usually available as the dichloride salt or the bis(methylsulfate) salt but is determined as paraquat ion in analysis. Paraquat is known to adsorb strongly to soil, and most of the small amount incorporated into plant remains as paraquat (90%). Its metabolites were not found when paraquat was applied at normal rates. When it was applied post-emergence, most of the applied compound remained, with minimal amounts of photodegradation products, indicating the involvement of photolysis in the transformation of paraquat. The residue of concern in plants is paraquat ion.
In studies of metabolism in rats, cattle, goats, pigs and hens, the metabolic pathway was similar, producing minor levels of oxidized metabolites. The metabolic pathways in animals and plants are similar. In animals, the residue of concern is also paraquat ion.
The definition of the residue in all countries that provided national MRLs to the Meeting was paraquat ion.
All the identified metabolites have been covered by toxicological evaluations, owing either to their occurrence in rats or in independent studies. The ADI recommended by the JMPR is for paraquat cation.
The Meeting therefore agreed that the definition of residues for plant and animal commodities should be: Paraquat cation (for both compliance with MRLs and estimation of dietary intake).
Results of supervised trials on crops
When used for weed control, paraquat is not sprayed directly onto crops and is strongly adsorbed to soil. Therefore, little paraquat is expected to be found in harvested crops. After pre-emergence application, no residues were expected to be detected in the harvested crops, although some samples contained residues. After use as a harvest aid desiccant, however, paraquat is in direct contact with crops, and the residue levels tend to be much higher than when it is used for weed control.
The Meeting agreed that data from trials of pre-plant and pre-emergence application should be evaluated against any GAP available to the Meeting, regardless of the country or region; while data on
paraquat 666
trials of post-emergence application and harvest aid desiccation should be evaluated against GAP of the country in which the trials were conducted or of a neighbouring country.
As degradation of paraquat on the surface of crops appears to involve photolysis, residue levels are expected to be similar in all crops, justifying estimation of group MRLs for paraquat.
For estimating STMR from the results of two or more sets of trials with different LOQs in which no residues exceeding the LOQs are reported, the lowest LOQ should be used, as stated in the 2002 FAO Manual, unless the residue level can be assumed to be essentially zero. The size of the trial database supporting the lowest LOQ was taken into account in making decisions in these cases.
Since maximum residue levels were estimated for a number of vegetable groups in which the levels were below the LOQ, the Meeting decided to withdraw the previous recommendation for vegetables (except as otherwise listed) of 0.05 * mg/kg.
In Germany, information is required on the possible contamination of fruits that have fallen onto ground treated with pesticides. Therefore, tests were carried out on apples, stone fruits, grapes and olives to simulate the residue situation in fruit used for juice and other processed products. Nevertheless, direct consumption of fruit picked up from the ground is regarded as inappropriate.
Citrus fruit
Numerous supervised residue trials have been carried out over several seasons and in several locations on orange in Italy and in California and Florida, USA, and on lime, lemon and grapefruit in Florida.
Paraquat is registered for the control of weeds around the base of citrus fruit trees at a maximum rate of 1 kg ai/ha as an inter-row spray, with no PHI, in Italy and at a maximum rate of 1.14 kg ai/ha as a directed spray, with no PHI, in the USA.
The residue levels of paraquat in whole mature oranges in trials in Italy and the USA were below the LOQs of 0.01, 0.02 or 0.05 mg/kg, even when paraquat was applied at twice or 30 times the maximum application rate, except in two trials. In one trial with an application rate of 2.44 kg ai/ha, mature fruit from one plot contained paraquat residues at a level of 0.01 mg/kg. In a trial with an application rate of 1.12 kg ai/ha, residue levels of 0.06 and 0.08 mg/kg were found in whole fruit. In this trial, however, the lower fruit-bearing branches were deliberately sprayed, the fruit fell onto sprayed weeds, and they were picked up from the ground within 3 days of spraying for analysis. Even though this represents the worst-case scenario, it does not reflect GAP in any country and is therefore inappropriate for use in estimating a maximum residue level. The residue levels in whole mature oranges in valid trials were, in ranked order: < 0.01 (15), 0.01, < 0.02 (two) and < 0.05 mg/kg (one).
In one trial in the USA, both juice and pulp were analysed for paraquat residues. Although the levels were below the LOQ of 0.01 mg/kg, the procedural recovery was too low for the results to be regarded as reliable.
In trials in the USA on grapefruit, lemon and lime in 1970 and 1972, with application rates reflecting GAP in the USA, the paraquat residue levels were < 0.01 (one) and < 0.05 mg/kg (three).
As the residue situation in oranges and other citrus fruits is similar and GAP is recommended for citrus fruits as a group in Italy and the USA, the Meeting considered it appropriate to establish a group maximum residue level for citrus fruits. The combined residue levels, in ranked order, were: < 0.01 (16), 0.01, < 0.02 (two) and < 0.05 (four) mg/kg. The Meeting estimated a maximum residue level of 0.02 mg/kg, an STMR of 0.01 mg/kg and a highest residue level of 0.02 mg/kg for paraquat in citrus fruits. The value of 0.02 mg/kg covers only the finite residue level found at 0.01 mg/kg.
Pome fruit
paraquat 667
Trials were carried out on apples in Canada, Germany and the United Kingdom and on pears in Canada and Germany.
Paraquat is registered for use to control weeds around the base of pome fruit trees at a maximum rate of 0.66 kg ai/ha with one application and no PHI in the United Kingdom and at a maximum rate of 1.14 kg ai/ha with no PHI in the USA. No information on GAP was available for Canada or Germany, but the results of trials conducted in those countries were reviewed against the GAP of the USA and United Kingdom, respectively.
Trials on apple were conducted at rates of 1.12–4.48 kg ai/ha, and in one trial in the United Kingdom at a highly exaggerated rate of 12.3 kg ai/ha, about 20 times the maximum rate permitted in that country. In the latter trial, paraquat was applied directly to the bark of the trees to simulate worst-case conditions. In some cases, two applications were made, in the same or subsequent years. Apples were harvested 0–780 days after the last application. In trials on pear, paraquat was applied at rates of 1.0–4.48 kg ai/ha once or twice, and pears were harvested 0–77 days after the last application. Paraquat residue levels were below the LOQ of 0.01 mg/kg in all apples and pears taken from trees, even after treatment at rates as high as 20 times the maximum GAP rate.
In the trials in Germany, apples and pears taken from the trees were placed on the ground 6–7 days after application and collected about 7 days later for analysis. Residue levels of paraquat of 0.02–0.19 mg/kg were found in the apples, which could be attributed to the transfer of paraquat from the sprayed weed. The Meeting concluded that these data are not appropriate for use in estimating a maximum residue level.
As the residue situations in apples and pears are similar, and GAP is recommended for pome fruits or orchard fruits as a whole in all the countries that provided information on GAP, the Meeting considered it appropriate to establish a group maximum residue level for pome fruits. As the paraquat residue levels in all the valid trials were below the LOQ, even after application at exaggerated rates, the Meeting estimated a maximum residue level for pome fruits of 0.01* mg/kg, an STMR of 0 mg/kg and a highest residue level of 0 mg/kg.
Stone fruit
Trials were carried out on peaches, plums, apricots and cherries in Canada, Germany, the United Kingdom and the USA.
Paraquat is registered for use to control weeds around the base of stone fruit trees at a maximum rate of 0.66 kg ai/ha, with one application and no PHI for stone fruits in the United Kingdom and at a maximum rate of 1.14 kg ai/ha, with three applications and a 28-day PHI for stone fruits other than peaches in the USA; the PHI for use on peach trees in the USA is 14 days. No information on GAP was available from Canada or Germany, and the results of trials conducted in those countries were reviewed against the GAP of the USA and the United Kingdom, respectively.
The application rates in the supervised trials ranged from 0.22 to 4.48 kg ai/ha, applied to the base of the fruit trees up to three times in a season; the fruit was harvested from the trees 0–103 days after the last application. No residues of paraquat above the LOQ of 0.01 or 0.05 mg/kg were found in fruit harvested directly from the trees in any trial, even after spraying three times at a rate four times the maximum permitted rate. In most of the US trials, paraquat was applied one or two times instead of the maximum of three, but because of the higher application rates, the total amount applied was higher than the maximum allowed by GAP.
In trials on plums in the United Kingdom, paraquat was applied directly to suckers at rates of 0.22–1.34 kg ai/ha. No residues were found above the LOQ of 0.01 mg/kg in fruit harvested 21 or 55 days later.
paraquat 668
In the trials in Germany, fruit were placed on sprayed weeds and collected for analysis about 1 week later. Small amounts of paraquat residues were found (0.02 and 0.04 mg/kg on peach, < 0.01 mg/kg on plum and 0.07 mg/kg on cherry) in the fruit samples, due to transfer from the sprayed weeds. As stone fruit intended for juice production is usually grown in orchards in which herbicides are rarely used, these data were not used for estimating a maximum residue level.
As the residue situations in stone fruits are similar and GAP is recommended for stone fruits or similar GAPs are established for peach and stone fruits excluding peach, the Meeting considered it appropriate to establish a group maximum residue level for stone fruits. As the paraquat residue levels were below the LOQ, even when applied at exaggerated rates and the methods of analysis in most of the trials had a LOQ of 0.01 mg/kg, the Meeting estimated a maximum residue level for stone fruits of 0.01* mg/kg and STMR and highest residue values of 0 mg/kg.
Berries and small fruit
Grape
Trials on residues in grapes have been conducted in Canada, Japan, Switzerland and the USA at rates of 0.3–4.4 kg ai/ha applied one to five times. Grapes were harvested from the vines at maturity 0–196 days after the last application. Four trials were conducted in Germany in which paraquat was applied between the rows of established vines at a rate of 1.0 kg ai/ha and grapes were sampled from the vines 0–14 days after application.
Paraquat is registered for weed control around grape vines at a maximum rate of 0.72 kg ai/ha, with five applications and a 30-day PHI in Japan and a maximum rate of 1.14 kg ai/ha, with the number of applications and the PHI unspecified in the USA. No information on GAP was available from Canada, Germany or Switzerland, but the results of trials in Canada were reviewed against US GAP.
In all trials in Canada, Japan and the USA reviewed against respective GAP, grapes obtained directly from the vine did not contain paraquat residues at levels above the LOQ of 0.01 or 0.02 mg/kg, even when applied at five times the recommended rate or with a shorter PHI.
In the German trials, bunches of grapes were also placed on the sprayed weed a few days after application and collected 7 days later for analysis. Small amounts of paraquat residues (0.04, 0.07, 0.09, 0.10, 0.13 and 0.17 mg/kg) were found in the grapes due to transfer from the sprayed weeds. When the fruits were sampled directly from the vine, the levels of residues were always below the LOQ of 0.01 mg/kg (six trials), which supports the results of the trials conducted in Canada, Japan and the USA.
The residue levels of paraquat in grapes in the trials that met the respective GAP or were conducted at higher rates were: < 0.01 (16), < 0.02 (three) and < 0.05 (two) mg/kg.
Cane fruit
Trials on residues were conducted in Canada on red and blackcurrants, blueberries, loganberries, gooseberries and raspberries at rates of application of paraquat of 0.56–2.24 kg ai/ha. Paraquat was applied once and the fruit was harvested 20–111 days after application.
GAP for cane fruit in the USA is a maximum rate of 1.14 kg ai/ha, with the number of applications and PHI unspecified.
Even at double the application rate, cane fruit did not contain paraquat residues at levels above the LOQ of 0.01 mg/kg. The residue levels in 25 trials following GAP or conducted at higher rates were < 0.01 mg/kg.
Strawberry

paraquat 669
Supervised trials were conducted in France, Germany and the United Kingdom in which paraquat was used to control runners of strawberry plants at rates of 0.42–1.32 kg ai/ha once or twice. Berries were harvested 47–226 days after the last application. Three trials in Germany were conducted in plastic greenhouses.
GAP in the United Kingdom for strawberries is a maximum rate of 0.66 kg ai/ha, with one application and PHI unspecified.
The residue levels of paraquat in strawberries in trials following GAP or conducted at higher application rates were < 0.01 (six) and < 0.05 mg/kg.
As the samples analysed in all the trials except that in which grapes were kept and taken from the ground did not contain paraquat residues at levels above the LOQs and the application rate in the respective GAP is similar, the Meeting decided to propose a group maximum residue level for small fruits and berries. The residue levels in these fruits, in ranked order, were: < 0.01 (47), < 0.02 (three) and < 0.05 mg/kg (three). The Meeting, considering that use of modern analytical methods would enable lower LOQs, agreed to disregard residue levels of < 0.05 mg/kg and < 0.02 mg/kg and estimated a maximum residue level of 0.01* mg/kg and STMR and highest residue values of 0 mg/kg.
Olive
Trials on residues in olives have been carried out in Greece, Italy, Spain and the USA (California).
Paraquat is registered for controlling weeds around the base of olive trees at a maximum rate of 1 kg ai/ha, with the number of applications unspecified and a 40-day PHI in Italy and at a maximum rate of 1.14 kg ai/ha, with four applications and a 13-day PHI in the USA. The results of trials conducted in Greece and Spain were reviewed against GAP in Italy.
In trials in Italy, paraquat was applied at rates of 0.54–1.8 kg ai/ha to the base of trees, and olives were harvested from the ground or trees 7–21 days after application. Although the delay was shorter than the recommended PHI of 40 days, the residue levels in the olives were < 0.05 and < 0.1 (two) mg/kg, indicating that at a PHI of 40 days the levels are likely to be < 0.1 mg/kg. No residues (< 0.05 mg/kg) of paraquat were detected in the oil from these fruits.
In one trial in the USA, paraquat was applied four times at an exaggerated rate (5.6 kg ai/ha; 22.4 kg/ha total) and the fruit was harvested from the trees 13 days later for analysis. The residue levels of paraquat were below the LOQ of 0.05 mg/kg, as were the levels in oil and cake prepared from the olives.
In six trials in Spain, olives were harvested from the ground 0, 1 and 7 days after application of paraquat at 0.60 kg ai/ha, simulating the worse-case scenario of collecting olives intended for oil production. In these trials, the application rate was 60% of the maximum allowed in Italy, but the olive fruit were harvested much earlier than the PHI of 40 days. The residue levels in whole fruit were 0.64–10 mg/kg, indicating that there had been transfer of paraquat from the sprayed weeds to the olives. In all the oil produced from these samples, however, the maximum residue levels of paraquat were 0.06 mg/kg, indicating that paraquat is not extracted into oil, as might be expected from its chemical nature.
In other trials in Spain, mature olives were sprayed directly on the ground with paraquat at rates of 0.36–1.3 kg/ha, and the fruit was analysed 3–17 days after application. The residue levels of paraquat in the olives were 0.08–4.4 mg/kg. Residues of paraquat did not transfer to extracted oil, and washing appeared to reduce the levels on the fruit.
In one trial in Greece, mature olives were sprayed directly with paraquat at a rate of 1.0 kg ai/ha to simulate direct spraying on fallen fruit in collection nets during weed control. No residues were
paraquat 670
found at levels above the LOQ (0.05 mg/kg) in oil extracted from treated fruit harvested 5 days after application.
Olives for oil production are often harvested from the ground and paraquat used for weed control may occasionally be applied directly to the fallen fruit on the ground. The whole fruit will contain some paraquat residue, either through transfer from treated vegetation or through direct spraying. Although the olives may contain relatively high levels of paraquat, no transfer of paraquat to oil occurs. This practice is not in compliance with GAP for olives.
The residue levels in olives taken directly from trees were: < 0.05 and < 0.10 mg/kg (two). In another trial, the level was < 0.05 mg/kg in olives taken from ground that had not been directly sprayed. The residue levels in one US trial conducted at five times the usual rate were below the LOQ of 0.05 mg/kg, indicating that when paraquat is applied in accordance with GAP no residues are expected to occur in olive fruit. The Meeting estimated a maximum residue level of 0.1 mg/kg to replace the previous recommendation for olive at 1 mg/kg. The Meeting also estimated an STMR of 0.05 mg/kg and a highest residue level of 0.1 mg/kg.
Assorted tropical fruits minus inedible peel
Trials on residues were carried out on passion fruit in Hawaii, USA, at an application rate of 1.12–4.48 kg ai/ha, to control weeds. Fruit was harvested 1–28 days after application. GAP in the USA for use on passion fruit is a maximum rate of 1.05 kg ai/ha, with an unspecified number of applications and PHI. The residue level in whole fruit in a trial complying with the maximum GAP was 0.13 mg/kg. After application at a rate higher than the maximum GAP, residue levels of up to 0.19 mg/kg were found in whole fruit. The levels in the edible pulp of all passion fruits analysed in the trials, regardless of PHI, ranged from < 0.01 to 0.02 mg/kg at 1.12 kg ai/ha and from < 0.01 to 0.06 mg/kg at higher rates. Higher levels were found in peel than in the edible portion.
Trials on residues were carried out on kiwifruit in California, USA, at an application rate of 0.56–2.24 kg ai/ha, three times, to control weeds. Fruit was harvested 7–14 days after the last application. The US GAP for kiwifruit is a maximum rate of 1.14 kg ai/ha, with the number of applications unspecified and a 14-day PHI. The residue level in kiwifruit in one trial conducted in accordance with the maximum US GAP was < 0.01 mg/kg. Even at a higher application rate or a shorter PHI, the levels were below the LOQ of 0.01 mg/kg.
Trials on guava were carried out in two locations in Hawaii, USA, with three different application rates of 1.12–4.48 kg ai/ha at each location. Fruit was harvested 1–28 days after application. The US GAP for guava is identical to that for passion fruit. The residue levels of paraquat in all edible pulp and peel analysed were below the LOQ of 0.01 mg/kg at the maximum GAP rate and at rates up to four times the maximum GAP. No residue was found at levels above the LOQ of 0.01 or 0.02 mg/kg in juice, discarded skin or seed obtained from guava treated at 1.12 or 4.48 kg/ha with a 6-day PHI. Although no information was available on residues in whole fruit, levels above the LOQ were not expected in whole fruit in view of the residue situation in pulp, peel and other fractions.
Trials were carried out on banana in Honduras, with three applications of paraquat at 1.4 kg ai/ha or a single application at double this rate, to control weeds in established plantations. Fruit was harvested 0–90 days after the last application. As no information was available on GAP in Honduras, the data were reviewed against GAP of the USA (maximum rate of 1.14 kg ai/ha). The residue levels of paraquat in flesh (0- and 3-day PHI) and whole fruit (� 7-day PHI) were below the LOQ (0.01 mg/kg) in three trials, except in skin from fruit harvested immediately after application.
Except in the trials on passion fruit, the residue levels in tropical fruits in 10 trials conducted according to the respective GAP were all below the LOQ (< 0.01 mg/kg). The Meeting estimated a maximum residue level for paraquat in assorted tropical fruits with inedible peel, excluding passion fruit, of 0.01* mg/kg. The Meeting decided to withdraw the previous recommendation for passion fruit.
paraquat 671
The residue levels in edible portions of these fruit were below the LOQ: < 0.01 (11) mg/kg. The Meeting estimated STMR and highest residue values for paraquat in assorted tropical fruits minus inedible peel, excluding passion fruit, of 0.01mg/kg.
Bulb vegetables
Trials on residues were conducted on onion in Canada, Germany and the United Kingdom in the 1960s. Paraquat is registered in the USA for pre-plant or pre-emergence application to onion in a limited number of states at a maximum rate of 1.14 kg ai/ha, with one application and a 60-day PHI (200 days in California). Uses on bulb vegetables are not included in the label in the United Kingdom.
In one Canadian trial at twice the GAP rate and with a shorter PHI (36 days), the residue levels were below the LOQ of 0.01 mg/kg. In another Canadian trial at an application rate of 1.12 mg/kg, the levels were also < 0.01 mg/kg, but the PHI was 143 days.
Trials were conducted in Germany for post-emergence directed application and for harvest aid uses, but there was no related GAP.
In one trial conducted in the United Kingdom of pre-emergence application on spring onion, the residue level was 0.02 mg/kg, but the application rate was > 30% higher than the maximum rate allowed in the USA. A further trial on spring onion involved directed post-emergence application, for which no information on GAP was available.
The Meeting concluded that there were insufficient data to recommend a maximum residue level for paraquat in onion bulb or bulb vegetables.
Brassica vegetables
Residue trials were carried out on broccoli in Canada; Brussels sprouts in The Netherlands (harvest aid); cabbage in Canada, Japan, Spain and the USA; and cauliflower in Canada. Paraquat was applied once or twice at 0.67–2.2 kg ai/ha for inter-row weed control, and the crop was harvested 5–52 days after the last application.
Paraquat is registered for use in the cultivation of Brassica vegetables during seed-bed preparation as a pre-plant or pre-emergence treatment, or applied as a post-emergence directed or guarded spray for inter-row weed control. GAP in Japan is a maximum rate of 0.36 kg ai/ha, with three applications and a 30-day PHI, for broccoli, cabbage, cauliflower and Chinese cabbage as pre-plant inter-row applications. GAP in the USA is a maximum rate of 1.14 kg ai/ha, with the number of applications and PHI unspecified, for Brassica vegetables as pre-plant, pre-emergence treatment.
In trials conducted on broccoli, cabbage and cauliflower in Canada, the residue levels were below the LOQ of 0.01 mg/kg, even when applied at double the rate. The exception was one trial in Canada in which cabbage harvested 51 days after treatment at twice the rate contained a residue level of 0.06 mg/kg. The residue levels were < 0.01 (two) and 0.06 mg/kg.
In two trials conducted on cabbage in Japan, the residue levels were below the LOQ of 0.03 mg/kg even after application at a higher rate of 0.96 kg ai/ha and a shorter PHI of 5 days. At a highly exaggerated rate of 19.2 kg ai/ha but with only one application and a longer PHI of 52 days, the residue levels were also < 0.03 mg/kg.
No information was available on GAP that would allow evaluation of trials conducted in Spain.
Trials on Chinese cabbage were conducted in the USA in which paraquat was applied once as pre-emergence treatment at 1.05 kg ai/ha, followed by three post-emergence directed applications at 0.56 kg ai/ha. The residue levels were < 0.05 and 0.07 mg/kg. The US label allows only pre-plant and pre-emergence applications.
paraquat 672
Trials on Brussels sprouts in The Netherlands involved a direct harvest aid application to the vegetable. In these trials, the unwashed vegetable contained a residue level of 7.3 mg/kg after 31 days, while washed vegetable had a reduced level of 1.6 after 31 days. Harvest aid desiccation was not, however, included in the labels provided to the Meeting.
The residue levels in these crops in trials that followed GAP and in trials that showed residue levels below the LOQ were, in ranked order: < 0.01 (two), < 0.03 (two) and 0.06 mg/kg. The Meeting concluded that there were insufficient data for estimating a maximum residue level for Brassica vegetables.
Fruiting vegetables
Numerous residue trials were carried out on tomatoes in Canada and the USA, on cucumbers, melons and summer squash in the USA and on peppers in Canada and the USA.
Paraquat is registered in the USA for use on tomatoes for pre-plant or pre-emergence application at a maximum rate of 1.14 kg ai/ha, with an unspecified number of applications and a 30-day PHI; on tomatoes for post-emergence directed spray at a maximum rate of 0.55 kg ai/ha, with an unspecified number of applications and a 30-day PHI; on peppers by directed spray application at a maximum rate of 0.55 kg ai/ha, with three applications and no PHI; and on other fruiting vegetables for pre-plant or pre-emergence application at a maximum rate of 1.14 kg ai/ha, with unspecified number of applications and PHI.
The trials in Canada on tomatoes were for pre-emergence or pre-planting weed control, in which paraquat was used at a low rate of 0.11 kg ai/ha. Trials on tomatoes in the USA involved post-emergence directed application at 0.56–2.24 kg/ha and an exaggerated single high pre-emergence application at a rate of 11.2 kg ai/ha or pre-emergence application of 1.12 kg ai/ha followed by three inter-row directed applications at 2.8 kg ai/ha. Although samples were harvested 21 days after treatment, 30% shorter than the PHI in US GAP of 30 days, the residue levels in tomatoes were below the LOQ of 0.01 mg/kg after application at 0.56 kg ai/ha for post-emergence directed application, except in one trial in which levels up to 0.04 mg/kg were found. After application at exaggerated rates, the residue levels were still below the LOQ of 0.005 or 0.01 mg/kg or at a maximum of 0.02 mg/kg.
The residue levels in trials following GAP or conducted at higher application rates were, in ranked order: < 0.005 (two), < 0.01 (seven) and 0.04 mg/kg.
The trials on sweet peppers were for use of paraquat in inter-row weed control at 0.56–2.2 kg ai/ha. The residue levels in trials at maximum GAP were < 0.01 and 0.01 mg/kg. The levels after exaggerated application rates were either below the LOQ of 0.01 mg/kg, 0.03 mg/kg (once at 1.12 kg ai/ha pre- emergence and four times at 1.12 or 2.24 kg ai/ha post-emergence applications) or 0.02 mg/kg (one trial).
The Meeting considered it appropriate to evaluate residues in tomato and peppers together for estimating the maximum residue level for fruiting vegetables, other than cucurbits. The combined levels were: < 0.005 (two), < 0.01 (eight), 0.01 and 0.04 mg/kg. The Meeting estimated a maximum residue level for fruiting vegetables, other than cucurbits, of 0.05 mg/kg, an STMR of 0.01 mg/kg and a highest residue level of 0.04 mg/kg.
In trials on cucumbers, melons and summer squash in California (USA), paraquat was applied at 1.12 kg ai/ha pre-emergence, followed by three inter-row applications at 0.56 kg ai/ha. While US GAP allows pre-emergence application at a maximum of 1.12 kg ai/ha, the residue levels of paraquat in all 12 trials were below the LOQ of 0.025 mg/kg. The Meeting estimated a maximum residue level for cucurbits of 0.02 mg/kg and STMR and highest residue values of 0 mg/kg.
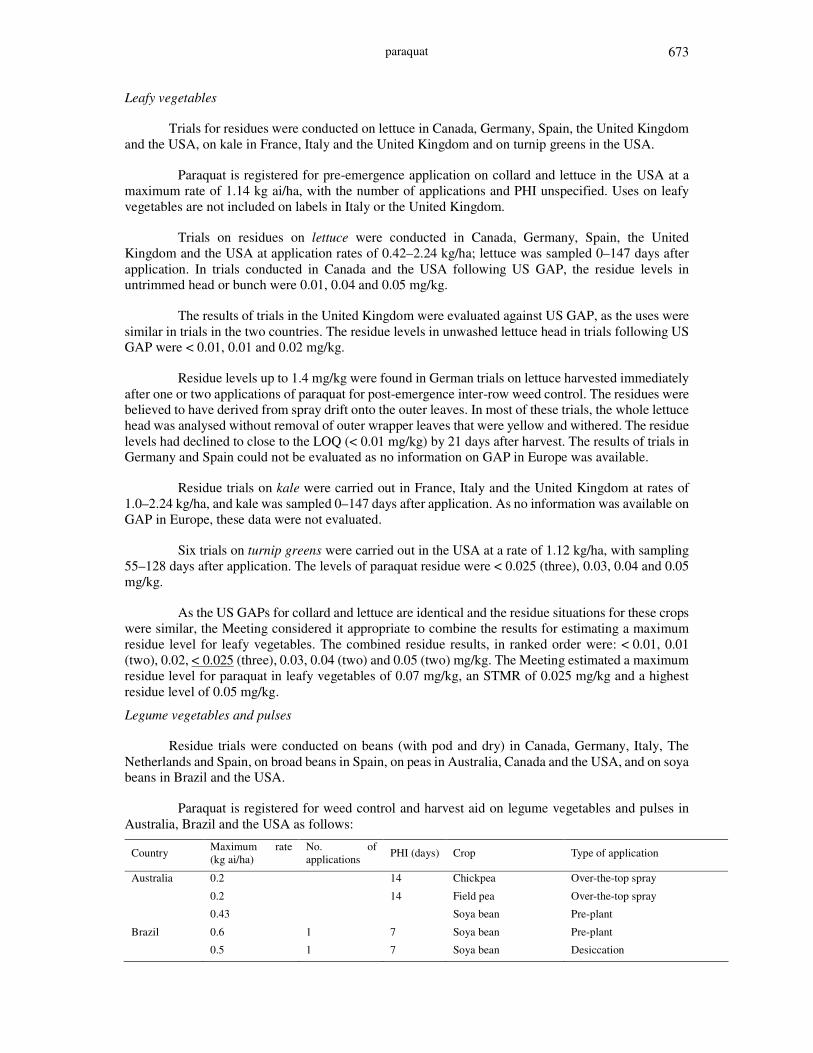
paraquat 673
Leafy vegetables
Trials for residues were conducted on lettuce in Canada, Germany, Spain, the United Kingdom and the USA, on kale in France, Italy and the United Kingdom and on turnip greens in the USA.
Paraquat is registered for pre-emergence application on collard and lettuce in the USA at a maximum rate of 1.14 kg ai/ha, with the number of applications and PHI unspecified. Uses on leafy vegetables are not included on labels in Italy or the United Kingdom.
Trials on residues on lettuce were conducted in Canada, Germany, Spain, the United Kingdom and the USA at application rates of 0.42–2.24 kg/ha; lettuce was sampled 0–147 days after application. In trials conducted in Canada and the USA following US GAP, the residue levels in untrimmed head or bunch were 0.01, 0.04 and 0.05 mg/kg.
The results of trials in the United Kingdom were evaluated against US GAP, as the uses were similar in trials in the two countries. The residue levels in unwashed lettuce head in trials following US GAP were < 0.01, 0.01 and 0.02 mg/kg.
Residue levels up to 1.4 mg/kg were found in German trials on lettuce harvested immediately after one or two applications of paraquat for post-emergence inter-row weed control. The residues were believed to have derived from spray drift onto the outer leaves. In most of these trials, the whole lettuce head was analysed without removal of outer wrapper leaves that were yellow and withered. The residue levels had declined to close to the LOQ (< 0.01 mg/kg) by 21 days after harvest. The results of trials in Germany and Spain could not be evaluated as no information on GAP in Europe was available.
Residue trials on kale were carried out in France, Italy and the United Kingdom at rates of 1.0–2.24 kg/ha, and kale was sampled 0–147 days after application. As no information was available on GAP in Europe, these data were not evaluated.
Six trials on turnip greens were carried out in the USA at a rate of 1.12 kg/ha, with sampling 55–128 days after application. The levels of paraquat residue were < 0.025 (three), 0.03, 0.04 and 0.05 mg/kg.
As the US GAPs for collard and lettuce are identical and the residue situations for these crops were similar, the Meeting considered it appropriate to combine the results for estimating a maximum residue level for leafy vegetables. The combined residue results, in ranked order were: < 0.01, 0.01 (two), 0.02, < 0.025 (three), 0.03, 0.04 (two) and 0.05 (two) mg/kg. The Meeting estimated a maximum residue level for paraquat in leafy vegetables of 0.07 mg/kg, an STMR of 0.025 mg/kg and a highest residue level of 0.05 mg/kg.
Legume vegetables and pulses
Residue trials were conducted on beans (with pod and dry) in Canada, Germany, Italy, The Netherlands and Spain, on broad beans in Spain, on peas in Australia, Canada and the USA, and on soya beans in Brazil and the USA.
Paraquat is registered for weed control and harvest aid on legume vegetables and pulses in Australia, Brazil and the USA as follows:
Country Maximum rate (kg ai/ha)
No. of applications PHI (days) Crop Type of application
Australia 0.2 14 Chickpea Over-the-top spray
0.2 14 Field pea Over-the-top spray
0.43 Soya bean Pre-plant
Brazil 0.6 1 7 Soya bean Pre-plant
0.5 1 7 Soya bean Desiccation
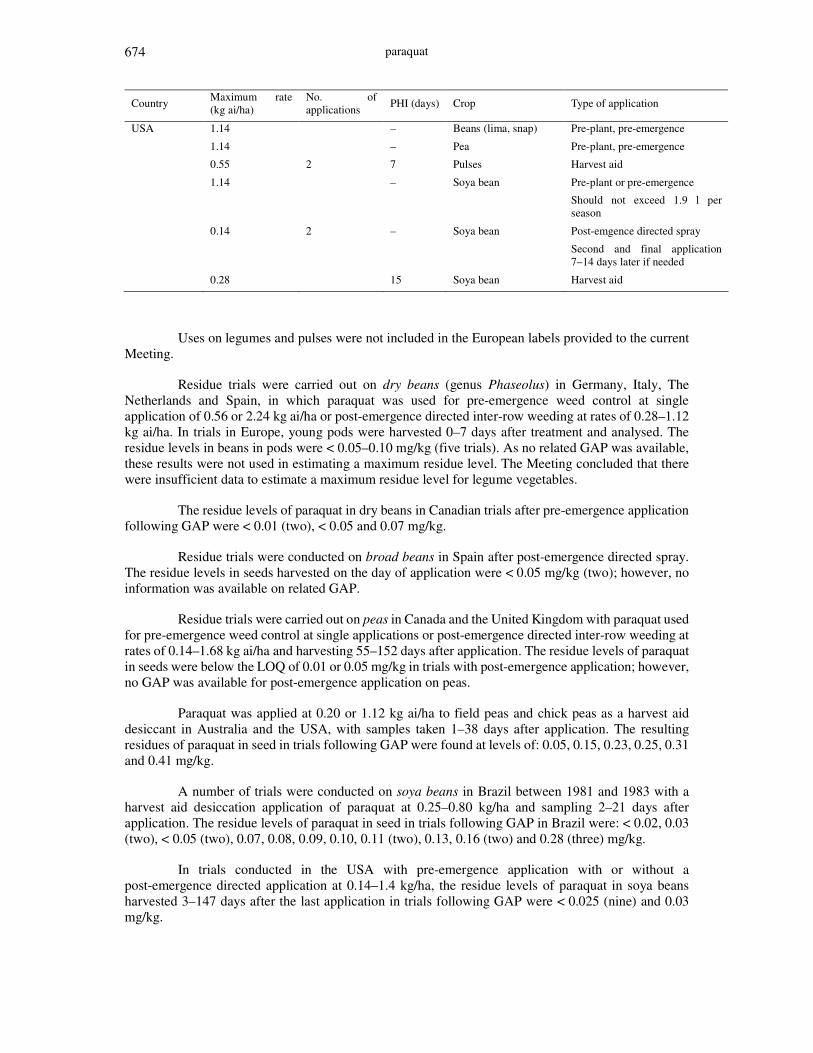
paraquat 674
Country Maximum rate (kg ai/ha)
No. of applications PHI (days) Crop Type of application
USA 1.14 – Beans (lima, snap) Pre-plant, pre-emergence
1.14 – Pea Pre-plant, pre-emergence
0.55 2 7 Pulses Harvest aid
1.14 – Soya bean Pre-plant or pre-emergence
Should not exceed 1.9 l per season
0.14 2 – Soya bean Post-emgence directed spray
Second and final application 7–14 days later if needed
0.28 15 Soya bean Harvest aid
Uses on legumes and pulses were not included in the European labels provided to the current Meeting.
Residue trials were carried out on dry beans (genus Phaseolus) in Germany, Italy, The Netherlands and Spain, in which paraquat was used for pre-emergence weed control at single application of 0.56 or 2.24 kg ai/ha or post-emergence directed inter-row weeding at rates of 0.28–1.12 kg ai/ha. In trials in Europe, young pods were harvested 0–7 days after treatment and analysed. The residue levels in beans in pods were < 0.05–0.10 mg/kg (five trials). As no related GAP was available, these results were not used in estimating a maximum residue level. The Meeting concluded that there were insufficient data to estimate a maximum residue level for legume vegetables.
The residue levels of paraquat in dry beans in Canadian trials after pre-emergence application following GAP were < 0.01 (two), < 0.05 and 0.07 mg/kg.
Residue trials were conducted on broad beans in Spain after post-emergence directed spray. The residue levels in seeds harvested on the day of application were < 0.05 mg/kg (two); however, no information was available on related GAP.
Residue trials were carried out on peas in Canada and the United Kingdom with paraquat used for pre-emergence weed control at single applications or post-emergence directed inter-row weeding at rates of 0.14–1.68 kg ai/ha and harvesting 55–152 days after application. The residue levels of paraquat in seeds were below the LOQ of 0.01 or 0.05 mg/kg in trials with post-emergence application; however, no GAP was available for post-emergence application on peas.
Paraquat was applied at 0.20 or 1.12 kg ai/ha to field peas and chick peas as a harvest aid desiccant in Australia and the USA, with samples taken 1–38 days after application. The resulting residues of paraquat in seed in trials following GAP were found at levels of: 0.05, 0.15, 0.23, 0.25, 0.31 and 0.41 mg/kg.
A number of trials were conducted on soya beans in Brazil between 1981 and 1983 with a harvest aid desiccation application of paraquat at 0.25–0.80 kg/ha and sampling 2–21 days after application. The residue levels of paraquat in seed in trials following GAP in Brazil were: < 0.02, 0.03 (two), < 0.05 (two), 0.07, 0.08, 0.09, 0.10, 0.11 (two), 0.13, 0.16 (two) and 0.28 (three) mg/kg.
In trials conducted in the USA with pre-emergence application with or without a post-emergence directed application at 0.14–1.4 kg/ha, the residue levels of paraquat in soya beans harvested 3–147 days after the last application in trials following GAP were < 0.025 (nine) and 0.03 mg/kg.

paraquat 675
Other trials were conduced in the USA on harvest aid desiccation application at 0.28 or 0.56 kg/ha and sampling 6–36 days after application. The residue levels of paraquat in seeds in trials following GAP were: < 0.01, 0.02 (four), 0.03 (two), 0.04 (two), 0.05, 0.06, 0.07, 0.08 (two), 0.09, 0.12 and 0.13 mg/kg. The hulls of treated soya beans contained higher residues than seeds.
The results of these trials clearly indicate that the levels of residues arising from harvest desiccant uses are higher than those from pre-emergence or post-emergence application.
The Meeting considered it appropriate to combine the results of trials on field peas and chick peas in Australia and on soya beans in Brazil and the USA in which paraquat was used as a harvest aid desiccant to estimate a group maximum residue level for pulses. The combined residue levels in seeds were, in ranked order: < 0.01 (two), < 0.02, 0.02 (four), 0.03 (four), 0.04 (two), < 0.05 (two), 0.05 (two), 0.06, 0.07 (two), 0.08 (three), 0.09 (two), 0.10, 0.11 (two), 0.12, 0.13 (two), 0.15, 0.16 (two), 0.23, 0.25, 0.28 (three), 0.31 and 0.41 mg/kg. The Meeting estimated a maximum residue level of 0.5 mg/kg to replace the previous recommendation for soya bean and an STMR of 0.08 mg/kg and a highest residue level for pulses of 0.41 mg/kg.
Root and tuber vegetables
Paraquat is registered for use at a maximum rate of 0.36 kg ai/ha with three applications and a 30-day PHI in Japan for pre-plant, inter-row application on carrot and in the USA at a maximum rate of 1.14 kg ai/ha for pre-emergence treatment of root and tuber vegetables excluding potatoes.
Two residue trials carried out on beetroot in Canada and the United Kingdom for pre-emergence application in compliance with US GAP resulted in residue levels of < 0.01 and 0.03 mg/kg.
Residue trials were conducted in the United Kingdom on beetroot and sugar-beet in which paraquat was used pre-sowing or pre-emergence at 1.68 kg ai/ha, followed by two directed inter-row applications at 2.24 kg ai/ha after crop emergence. No information was available, however, on GAP for post-emergence application from Europe.
In trials conducted in four states of the USA with pre-emergence application at 1.12 kg ai/ha, the residue levels in sugar-beet roots harvested 136–178 days after application were < 0.05 mg/kg (six) after a single pre-emergence application at 1.12 kg ai/ha. After application at an exaggerated rate of 5.6 kg ai/ha, the residue levels in unwashed root were < 0.05 mg/kg.
Residue trials on carrots with use of paraquat for pre-emergence or inter-row weed control have been carried out in Canada, Japan, Germany and the United Kingdom. The residue levels of paraquat in carrot in the Japanese trials after both pre-emergence and inter-row applications were all below the LOQ of 0.03 mg/kg, despite a shorter PHI or use of a highly exaggerated rate of 19.2 kg ai/ha. The residue levels in carrot in four trials following GAP or conducted at higher rates or shorter PHI were < 0.03 mg/kg. In Canadian trials, the residue levels were below the LOQ of 0.01 mg/kg, even in one trial in which the rate was doubled and the PHI shorter.
As no information was available on GAP in Europe, the data from German trials with post-emergence application were not considered in estimating the maximum residue level.
Residue trials were carried out on parsnips and swedes in the United Kingdom and on turnips in Canada and United Kingdom with use of paraquat for pre-emergence weed control (Canada) or pre-emergence followed by inter-row weed control (United Kingdom). The rates of application were 0.56–2.24 kg ai/ha. Turnip, swede and parsnip roots were harvested 49–122 days after application. The residue levels of paraquat in turnips in two Canadian trials that followed US GAP were < 0.01 mg/kg. No information on GAP was available for post-emergence application in Europe.
paraquat 676
One trial was conducted in France on black salsify, in which paraquat was applied as an inter-row treatment at 0.5 and 0.8 kg ai/ha. There were no residues (< 0.02 mg/kg) in salsify roots harvested 8 and 80 days after treatment; however, no information on GAP was available.
The combined residue levels in beetroot, sugar-beet, carrots and turnips were, in ranked order: < 0.01 (four), < 0.03 (four), 0.03 (two) and < 0.05 (six) mg/kg.
Potato
Trials were carried out on potatoes in Canada, Germany, the United Kingdom and the USA for pre-emergence, post-emergence and harvest aid applications of paraquat.
Paraquat is registered in the United Kingdom for pre-emergence use at a maximum rate of 0.66 kg ai/ha with one application. It is registered in the USA for pre-plant and pre-emergence broadcast application at a maximum rate of 0.55 kg ai/ha and for broadcast application for pre-harvest vine killing and weed dessication at a maximum rate of 0.42 kg ai/ha with a 3-day PHI. The latter application is restricted to fresh market produce, with a restriction of 2.3 l/ha per season; split applications must be applied a minimum of 5 days apart.
Trials were carried out in Germany with post-emergence directed application. The residue levels were below the LOQ of 0.01 mg/kg.
Several residue trials were carried out in Canada and the USA in which paraquat was applied for weed control by pre-emergence or post-crop emergence application at a rate of 0.20–1.12 kg ai/ha. The residue levels in the tubers in trials following US GAP were < 0.01 (eight) and 0.02 mg/kg. At double the application rate, the residue levels were below the LOQ of 0.01 mg/kg.
Trials were also carried out on harvest aid desiccant use in Canada, the United Kingdom and the USA. The US label allows use of paraquat for vine killing and weed desiccation at a maximum of 0.42 kg ai/ha, with a PHI of 3 days, but in these trials rates equivalent to or higher than twice the maximum rate or a much longer PHI were used. Harvest aid use is not included in the United Kingdom label.
The residue levels in trials of pre- and post-emergence application were < 0.01 (eight) and 0.02 mg/kg. The levels in trials with double the application rate in the USA and in trials conducted in Germany were all below the LOQ.
The Meeting decided to combine the results from trials on beetroot, sugar-beet, carrot, turnip and potato. The combined residue levels, in ranked order, were: < 0.01 (12), 0.02, < 0.03 (four), 0.03 (two) and < 0.05 (six) mg/kg. The Meeting estimated a maximum residue level of 0.05 mg/kg, an STMR of 0.02 mg/kg and a highest residue level of 0.05 mg/kg for root and tuber vegetables. The maximum residue level replaces the previous recommendation for potato.
Stem vegetables
Residue trials have been carried out on asparagus, celery and globe artichokes in Canada and the USA with use of paraquat for post-emergence directed inter-row weeding at rates of 1.12–3.25 kg ai/ha in a single application. Three applications of 1.12 or 1.35 kg/ha on artichokes were also tested.
Paraquat is registered in the USA for asparagus at a maximum rate of 1.14 kg ai/ha for pre-plant and pre-emergence broadcast or banded over-row application and at the same maximum rate with a 6-day PHI for asparagus more than 2 years old by broadcast or banded over-row application. The residue levels were < 0.02 (two) and < 0.05 mg/kg.
Although trials were conducted on celery in Canada and on artichoke in the USA, no information on GAP for these crops was available. The Meeting concluded that the data were insufficient for estimating a maximum residue level for asparagus.
paraquat 677
Cereal grains
1.1 Maize
Residue trials were conducted on maize in Canada, Italy, the United Kingdom and the USA with pre- and post-emergence applications and harvest aid uses.
Paraquat is registered for use in the USA at a maximum rate of 1.14 kg ai/ha for pre-plant or pre-emergence broadcast of banded over-row applications and at a maximum rate of 0.55 kg ai/ha for post-emergence directed spray. Residue trials were conducted with use of paraquat for pre-emergence weed control or for post-emergence directed spray in Canada and the USA at rates of 0.28–1.12 kg ai/ha.
In a series of trials in the USA in 1987, one pre-emergence application at 1.12 kg ai/ha and two post-emergence applications at 0.31 kg ai/ha were made. Although the post-emergence application rate was not as high as the maximum rate, the pre-emergence application rate was the maximum allowed for pre-emergence application. The Meeting considered that these trials were conducted in accordance with US GAP. The residue levels in trials in Canada and the USA conducted in accordance with US GAP were: < 0.01 (eight) and < 0.025 mg/kg (16). In trials with higher application rates (up to four times), the residue levels were below the LOQ. The levels in maize cobs were also below the LOQ of 0.01 mg/kg (two trials).
In two residue trials in Italy, paraquat was applied pre-emergence at 0.92 kg ai/ha. The residue levels in cob were < 0.05 mg/kg; however, no analysis of kernels or grain was reported.
Trials were conducted in South Africa and the United Kingdom with post-emergence application; however, owing to the lack of relevant GAP for South Africa and the fact that post-emergence application is not included on the label in the United Kingdom, the results of these trials could not be evaluated by the Meeting.
Several trials were conducted in the USA on use of paraquat as a harvest aid desiccator at rates of 0.56–1.12 kg/ha. This use is not included in US GAP, although it is allowed in Argentina, Brazil and Uruguay.
On the basis of the residue levels in maize grain in trials with paraquat applied pre- or post-emergence in Canada and the USA, < 0.01 (eight) and < 0.025 mg/kg (16), the Meeting estimated a maximum residue level of 0.03 mg/kg to replace the previous recommendation for maize and STMR and highest residue values of 0.025 mg/kg.
Sorghum
A number of residue trials were conducted in the USA, where paraquat is registered for use on sorghum at a maximum rate of 1.14 kg ai/ha, with a PHI of 48 days for grain and 20 days for forage, for pre-plant or pre-emergence broadcast application, and at a maximum rate of 0.55 kg ai/ha in two applications with the same PHIs for post-emergence directed spray. In the latter application, the applications must not exceed 2.5 l per season.
Several residue trials were carried out in the USA in several years and locations, in which paraquat was applied for weed control, either pre-emergence, post-crop emergence directed or as a harvest aid, at rates of 0.21–7.8 kg ai/ha. Samples were taken 20–131 days after pre-emergence or post-emergence directed application. The residue levels in grain in 12 trials conducted in accordance with maximum GAP for pre-emergence or post-emergence applications were all < 0.025 mg/kg. When both pre- and post-emergence applications were made, if the post-application rate was in compliance with GAP, the residue results were taken into consideration in estimating the maximum residue level. In
paraquat 678
one trial with one pre-emergence application at 0.56 kg ai/ha followed by a post-emergence application at 0.56 kg ai/ha, a residue level of 0.01 mg/kg was found.
In harvest aid desiccation applications, paraquat was applied at a rate of 0.21–2.8 kg/ha, and sorghum was sampled 7–49 days after application. Harvest aid desiccant use is not included on the US label.
The Meeting estimated a maximum residue level of 0.03 mg/kg to replace the previous recommendation and STMR and highest residue values of 0.025 mg/kg for sorghum.
Rice
Trials on residues of paraquat on rice were conducted in Guatemala, Italy and the USA. Paraquat is registered for use on rice in the USA by pre-plant or pre-emergence broadcast at a maximum rate of 1.14 kg ai/ha, with no PHI specified.
Two trials were conducted in Italy in 1993, in which paraquat was applied at a rate of 0.92 kg ai/ha to the seed bed 5 days before rice was sown. Rice grain and straw samples taken at harvest did not contain residues of paraquat at levels above the LOQ of 0.05 mg/kg.
Three residue trials were conducted in Guatemala in 1983 in which paraquat was applied as a pre-emergence treatment at rates of 0.30 and 1.0 kg ai/ha to rice. Rice grain and straw samples were taken at harvest. The residues in de-husked rice in one trial conducted in compliance with the maximum rate in US GAP were < 0.05 mg/kg, but residues in rice grain were not analysed.
Residue trials were conducted in the USA in 1978 and 1982 in which paraquat was applied as a pre-emergence treatment at rates of 0.56 and 1.12 kg ai/ha to rice. In trials conducted at the maximum GAP, the residue levels in rice grain were below the LOQ of 0.01 (two) or 0.02 mg/kg. No trials were conducted at rates higher than the maximum allowed in US GAP for rice.
The Meeting concluded that there were insufficient data to estimate a maximum residue level and withdrew the previous recommendation for rice and rice, polished.
Tree nuts
It is common practice to harvest nuts from the ground, and this may result in residues of paraquat in the nuts.
Supervised residue trials were carried out over a number of years in Italy on hazelnuts and in the USA on almonds (California), macadamia nuts (Hawaii), pecans (Alabama and Texas), pistachio nuts (California) and walnuts (California).
Paraquat is registered for use on hazelnuts in Italy at a maximum rate of 1 kg ai/ha with a 40-day PHI and on walnuts at the same maximum rate but with no PHI specified. In the USA, paraquat is registered for use on pistachio nuts at a maximum rate of 1.14 kg ai/ha with a 7-day PHI, with the proviso that no more than two applications should be made after the nuts have split. It is registered for use in the USA on other tree nuts at the same maximum rate with no specification of the number of applications or PHI.
Two trials were conducted in Italy in which hazelnuts were harvested from the ground 1–10 days after treatment around the base of the trees at rates of 0.54–1.8 kg ai/ha. Although the PHI was shorter than 40 days, the residue levels in shelled nuts were below the LOQ of 0.05 mg/kg in one trial. At almost twice the maximum application rate and with a shorter PHI of 10 days, the levels were still below the LOQ.
paraquat 679
In a trial in the USA, paraquat was applied at rates of 0.56–4.5 kg ai/ha one to eight times, to control weeds under mature nut trees. In some cases, applications were made over 2 years. Nuts were harvested, in some cases immature, 1–171 days after the last application. The residue levels in shelled nuts in trials following GAP were: < 0.01 (seven), 0.01, 0.02 and < 0.05 (three) mg/kg.
The combined results of all the trials, in ranked order, were: < 0.01 (seven), 0.01, 0.02 and < 0.05 (four) mg/kg. The Meeting estimated a maximum residue level for paraquat in tree nuts of 0.05 mg/kg, an STMR of 0.01 mg/kg and a highest residue level of 0.05 mg/kg.
Oil seeds
Cotton-seed
Paraquat is registered for use on cotton in the USA at a maximum rate of 1.14 kg ai/ha, with no specification of the number of applications of PHI, for pre-plant or pre-emergence treatment, and at a maximum rate of 0.55 kg ai/ha, with repeated application if necessary and a 3-day PHI as a harvest aid, with the proviso that a total of 1.5 l should not be exceeded in this use.
Residue trials were conducted in the USA over several years and locations, involving pre-emergence applications at 1.12 kg/ha and harvesting 4–176 days after application. The residue levels in fuzzy seed in trials at the maximum GAP were < 0.01 (four) and 0.04 mg/kg.
In numerous trials with pre-emergence application followed by harvest aid desiccation application or a single application as harvest aid desiccant, the residue levels of paraquat in fuzzy seed in trials following maximum GAP were: 0.07, 0.09, 0.15, 0.16 (two), 0.18, 0.21, 0.23, 0.30, 0.34, 0.35, 0.38, 0.44, 0.46, 0.49, 0.50, 0.58 and 2.0 mg/kg. On the basis of residue levels arising from harvest aid uses, the Meeting estimated a maximum residue level for cotton-seed of 2 mg/kg, to replace the previous recommendation, an STMR of 0.34 mg/kg and a highest residue level of 2 mg/kg.
Sunflower seed
In the USA, paraquat is registered for use on sunflower at a maximum rate of 1.14 kg ai/ha with no PHI specified for pre-plant or pre-emergence broadcast or banded over-row application and at a maximum rate of 0.55 kg ai/ha with a 7-day PHI for dessication use.
Trials were conducted with pre-emergence application to sunflowers at 1.12 or 5.6 kg/ha and sampling 41–131 days after application. The residue levels in seeds in four trials conducted in compliance with maximum GAP were < 0.05 mg/kg. When paraquat was applied at five times the maximum recommended rate, the levels were still below the LOQ of 0.05 mg/kg.
In further trials, paraquat was applied as a harvest aid desiccator at 0.28–1.12 kg/ha, and sunflower seeds were harvested 7–21 days after application. The residue levels of paraquat in seeds in trials conducted at maximum GAP were: 0.09, 0.14, 0.15, 0.16 (three), 0.19, 0.22, 0.24, 0.32, 0.35, 0.51, 0.60, 0.74, 0.81 (two) and 0.93 mg/kg. The Meeting used the residue levels arising from harvest aid uses to estimate a maximum residue level for sunflower seed of 2 mg/kg, an STMR of 0.22 mg/kg and a highest residue level of 0.81 mg/kg.
Hops
Residue trials were conducted in Canada and the USA. Paraquat was registered in the USA for use as a directed spray or for suckering and stripping on hops at a maximum rate of 0.55 kg ai/ha in three applications with a 14-day PHI; no more than two applications or applications at no more than 1.5 l/ha were recommended.
In a trial in Canada, a single post-emergence directed application of 1.12 kg ai/ha, which is double the maximum recommended dose, resulted in residue levels of < 0.01 mg/kg in green hops harvested 53 days after application.

paraquat 680
In the USA, trials were conducted in the states of Idaho, Oregon and Washington with three post-emergence directed applications of paraquat at 2.8 kg ai/ha. The residue levels of paraquat in dried hops prepared from hops harvested 14 days after the last of three directed application at the maximum GAP rate were 0.05 mg/kg in two trials. At double this rate, the levels in dried hops prepared from green hops harvested 13 or 14 days after the last treatment were below the LOQ of 0.1 mg/kg (0.01 and 0.07 mg/kg). Two applications at higher rates than that of maximum GAP resulted in 0.02 and 0.03 mg/kg in dried hops.
The residue levels in dried hops were 0.05 mg/kg (two). In view of the low levels of residues in the other trials, the Meeting estimated a maximum residue level of 0.1 mg/kg, to replace the previous recommendation, and STMR and highest residue values of 0.05 mg/kg for hops, dry.
Tea, green, black
Residue trials on tea were conducted in India, where paraquat is registered for use for pre-emergence or post-emergence directed application between rows at a maximum rate of 0.75 kg ai/ha in one application, with no PHI specified.
Six trials were conducted at a total application rate of 0.57–2.0 kg ai/ha over 5–6 months. Green tea leaves were harvested 7 or 21 days after blanket application (after the first or last spot application) and processed into black tea, which was analysed. The residue levels of paraquat in black tea from tea plants treated in accordance with GAP in India or at higher rates were almost always below the LOQ of 0.05 mg/kg. In trials conducted in accordance with GAP, the levels in black tea were: < 0.05 (three), 0.07, 0.09 and 0.12 mg/kg.
In other trials in India, with application rates of 0.05–0.06 kg ai/ha, black tea samples from green tea leaves harvested 5 or 7 days after application contained 0.05 mg/kg (one) or < 0.05 mg/kg. As the application rate was much lower than the maximum, these results were not considered in estimating the maximum residue level. The Meeting estimated a maximum residue level for teas, green, black of 0.2 mg/kg and an STMR of 0.06 mg/kg.
Animal feedstuffs
Soya forage and hay or fodder
Paraquat is registered for use in Australia, Brazil and the USA for weed control andas a harvest aid on soya beans. In the USA, it is registered for use at a maximum rate of 1.14 kg ai/ha for pre-plant or pre-emergence treatment, not to exceed 1.9 l per season, at a maximum rate of 0.14 kg ai/ha as a post-emergence directed spray with a second and final application 7–14 days later; it can also be used at a maximum rate of 0.28 kg ai/ha with a 15-day PHI as a harvest aid.
The residue levels in forage in trials conducted in the USA in accordance with US GAP were: < 0.025 (12), < 0.05 (13), 0.05, 0.06 (four), 0.07, 0.08, 0.15, 0.28 and 1.8 mg/kg, expressed on a dry weight basis.
The Meeting estimated a maximum residue level for soya bean forage (green) of 2 mg/kg, an STMR of 0.05 mg/kg and a highest residue level of 1.8 mg/kg.
The residue levels in hay or fodder in trials conducted in accordance with US GAP were: < 0.025 (five), 0.04, < 0.05 (four), 0.05, 0.1, 0.2 and 0.3 mg/kg, on a dry weight basis. The Meeting estimated a maximum residue level for soya bean fodder of 0.5 mg/kg, an STMR of 0.05 mg/kg and a highest residue level of 0.3 mg/kg.
Sugar-beet tops
Trials were conducted on beet and sugar-beet in the United Kingdom and the USA. The residue levels in sugar-beet tops in six trials conducted in accordance with US GAP were < 0.025 mg/kg, on a fresh weight basis. The Meeting estimated a maximum residue level of 0.2 mg/kg and an STMR of 0.11 mg/kg. On the basis of 23% dry matter and a highest residue level on a fresh weight basis of 0.025
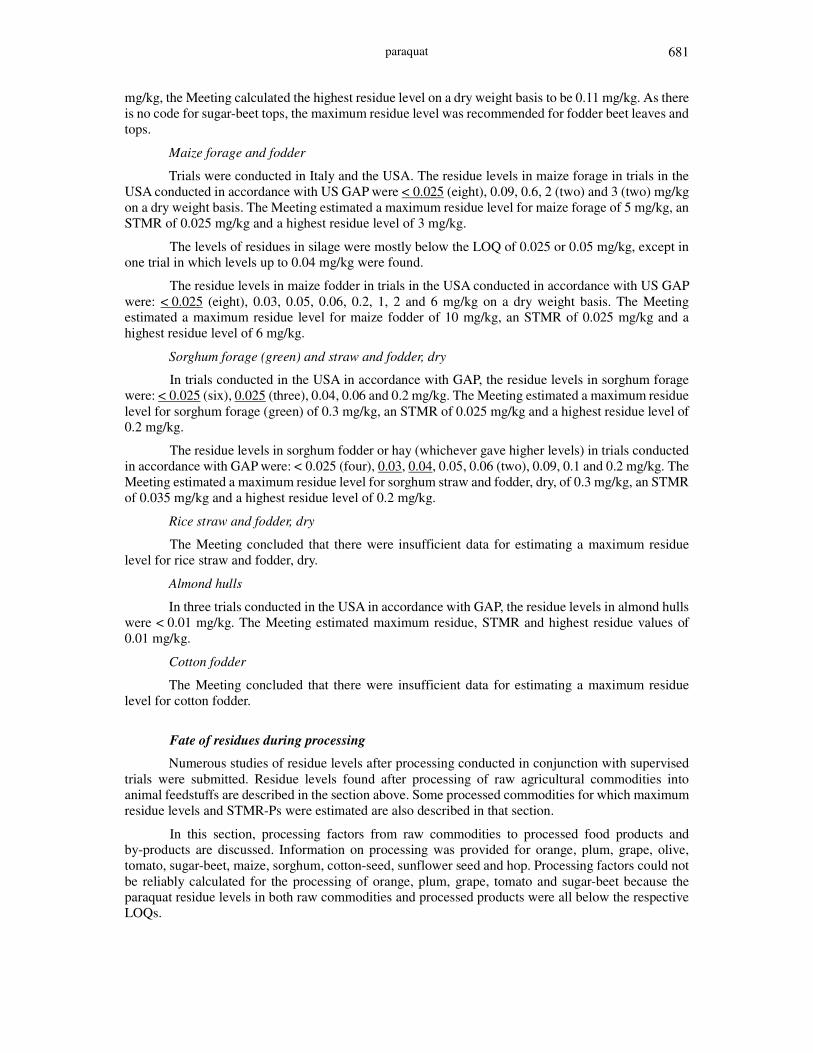
paraquat 681
mg/kg, the Meeting calculated the highest residue level on a dry weight basis to be 0.11 mg/kg. As there is no code for sugar-beet tops, the maximum residue level was recommended for fodder beet leaves and tops.
Maize forage and fodder
Trials were conducted in Italy and the USA. The residue levels in maize forage in trials in the USA conducted in accordance with US GAP were < 0.025 (eight), 0.09, 0.6, 2 (two) and 3 (two) mg/kg on a dry weight basis. The Meeting estimated a maximum residue level for maize forage of 5 mg/kg, an STMR of 0.025 mg/kg and a highest residue level of 3 mg/kg.
The levels of residues in silage were mostly below the LOQ of 0.025 or 0.05 mg/kg, except in one trial in which levels up to 0.04 mg/kg were found.
The residue levels in maize fodder in trials in the USA conducted in accordance with US GAP were: < 0.025 (eight), 0.03, 0.05, 0.06, 0.2, 1, 2 and 6 mg/kg on a dry weight basis. The Meeting estimated a maximum residue level for maize fodder of 10 mg/kg, an STMR of 0.025 mg/kg and a highest residue level of 6 mg/kg.
Sorghum forage (green) and straw and fodder, dry
In trials conducted in the USA in accordance with GAP, the residue levels in sorghum forage were: < 0.025 (six), 0.025 (three), 0.04, 0.06 and 0.2 mg/kg. The Meeting estimated a maximum residue level for sorghum forage (green) of 0.3 mg/kg, an STMR of 0.025 mg/kg and a highest residue level of 0.2 mg/kg.
The residue levels in sorghum fodder or hay (whichever gave higher levels) in trials conducted in accordance with GAP were: < 0.025 (four), 0.03, 0.04, 0.05, 0.06 (two), 0.09, 0.1 and 0.2 mg/kg. The Meeting estimated a maximum residue level for sorghum straw and fodder, dry, of 0.3 mg/kg, an STMR of 0.035 mg/kg and a highest residue level of 0.2 mg/kg.
Rice straw and fodder, dry
The Meeting concluded that there were insufficient data for estimating a maximum residue level for rice straw and fodder, dry.
Almond hulls
In three trials conducted in the USA in accordance with GAP, the residue levels in almond hulls were < 0.01 mg/kg. The Meeting estimated maximum residue, STMR and highest residue values of 0.01 mg/kg.
Cotton fodder
The Meeting concluded that there were insufficient data for estimating a maximum residue level for cotton fodder.
Fate of residues during processing
Numerous studies of residue levels after processing conducted in conjunction with supervised trials were submitted. Residue levels found after processing of raw agricultural commodities into animal feedstuffs are described in the section above. Some processed commodities for which maximum residue levels and STMR-Ps were estimated are also described in that section.
In this section, processing factors from raw commodities to processed food products and by-products are discussed. Information on processing was provided for orange, plum, grape, olive, tomato, sugar-beet, maize, sorghum, cotton-seed, sunflower seed and hop. Processing factors could not be reliably calculated for the processing of orange, plum, grape, tomato and sugar-beet because the paraquat residue levels in both raw commodities and processed products were all below the respective LOQs.

paraquat 682
Processing factors were calculated for olive (oil), potato (crisps and granules), maize (milling fractions and oil), sorghum (milling fractions), cotton-seed (trash, gin products and oil), sunflower seed (oil) and hop (dried hop and beer) and are shown below.
Commodity Processing factor STMR-P (mg/kg)
Olive 0.05
Unwashed olives before processing 0.57
Washed olives before processing < 0.43
Virgin oil < 0.35 0.018
Refined oil < 0.35 0.018
Potato 0.02
Wet peel > 1.9 0.04
Dry peel > 11 0.22
Peeled potato 0.27a 0.01
Crisps > 0.95 0.02
Granules > 2.7 0.05
Maize 0.025
Wet milling
Coarse starch < 0.25a 0.006
Starch < 0.25a 0.006
Crude oil < 0.25a 0.006
Refined oil < 0.25a 0.006
Dry milling
Germ 0.3a 0.0075
Grits 0.25–0.5a 0.0006–0.013
Coarse meal 1a 0.025
Meal 0.5a 0.013
Flour 1.5a 0.038
Crude oil < 0.25a 0.006
Refined oil < 0.05a 0.001
Sorghum 0.025
Hulled grain 0.07a 0.002
Dry milled bran 3.9 0.097
Coarse grits 0.17 0.004
Flour 0.14 0.004
Wet milled bran 2.3 0.058
Starch 0.07 0.002
Shorts 2.6 0.065
Germ 0.52a 0.013
Cotton (from cotton including trash and bolls)
Fuzzy seed 0.08 0.34
Crude oil < 0.006 0.01b
Meal < 0.009 0.04
Sunflower seed 0.3
Hulls 2.8a 0.64
Meal 0.05a 0.01
Oil < 0.05a 0 b
Hop
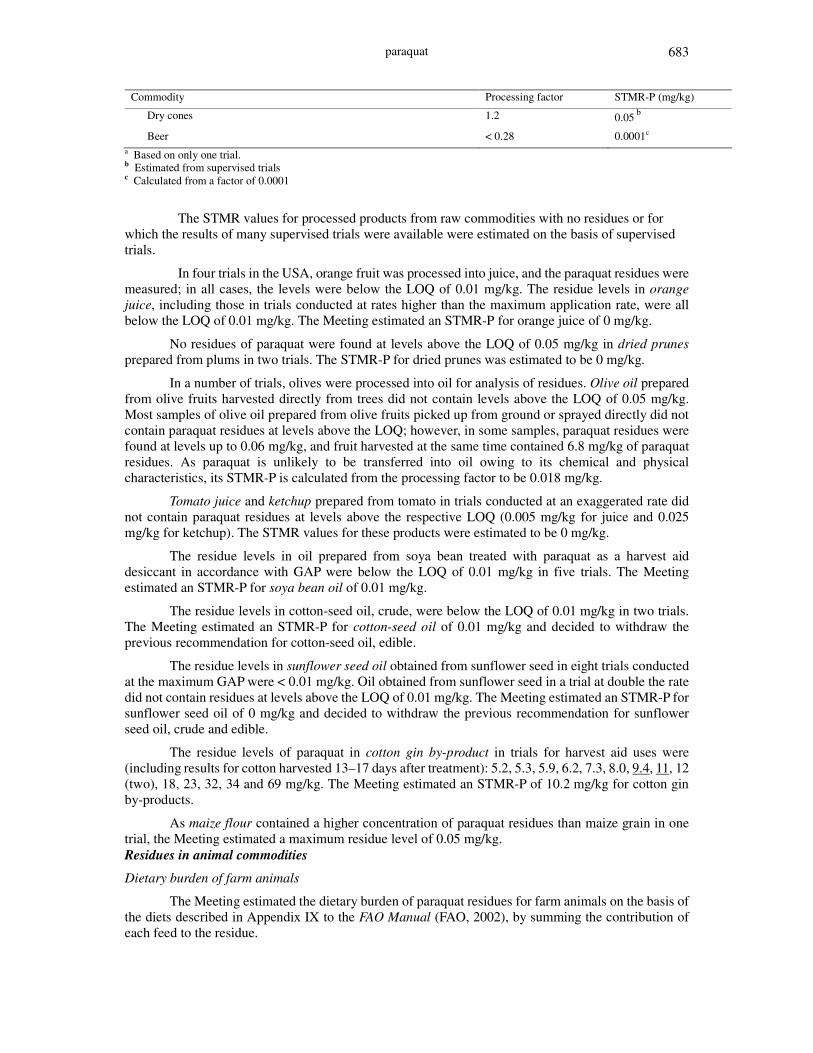
paraquat 683
Commodity Processing factor STMR-P (mg/kg)
Dry cones 1.2 0.05 b
Beer < 0.28 0.0001c a Based on only one trial. b Estimated from supervised trials c Calculated from a factor of 0.0001
The STMR values for processed products from raw commodities with no residues or for which the results of many supervised trials were available were estimated on the basis of supervised trials.
In four trials in the USA, orange fruit was processed into juice, and the paraquat residues were measured; in all cases, the levels were below the LOQ of 0.01 mg/kg. The residue levels in orange juice, including those in trials conducted at rates higher than the maximum application rate, were all below the LOQ of 0.01 mg/kg. The Meeting estimated an STMR-P for orange juice of 0 mg/kg.
No residues of paraquat were found at levels above the LOQ of 0.05 mg/kg in dried prunes prepared from plums in two trials. The STMR-P for dried prunes was estimated to be 0 mg/kg.
In a number of trials, olives were processed into oil for analysis of residues. Olive oil prepared from olive fruits harvested directly from trees did not contain levels above the LOQ of 0.05 mg/kg. Most samples of olive oil prepared from olive fruits picked up from ground or sprayed directly did not contain paraquat residues at levels above the LOQ; however, in some samples, paraquat residues were found at levels up to 0.06 mg/kg, and fruit harvested at the same time contained 6.8 mg/kg of paraquat residues. As paraquat is unlikely to be transferred into oil owing to its chemical and physical characteristics, its STMR-P is calculated from the processing factor to be 0.018 mg/kg.
Tomato juice and ketchup prepared from tomato in trials conducted at an exaggerated rate did not contain paraquat residues at levels above the respective LOQ (0.005 mg/kg for juice and 0.025 mg/kg for ketchup). The STMR values for these products were estimated to be 0 mg/kg.
The residue levels in oil prepared from soya bean treated with paraquat as a harvest aid desiccant in accordance with GAP were below the LOQ of 0.01 mg/kg in five trials. The Meeting estimated an STMR-P for soya bean oil of 0.01 mg/kg.
The residue levels in cotton-seed oil, crude, were below the LOQ of 0.01 mg/kg in two trials. The Meeting estimated an STMR-P for cotton-seed oil of 0.01 mg/kg and decided to withdraw the previous recommendation for cotton-seed oil, edible.
The residue levels in sunflower seed oil obtained from sunflower seed in eight trials conducted at the maximum GAP were < 0.01 mg/kg. Oil obtained from sunflower seed in a trial at double the rate did not contain residues at levels above the LOQ of 0.01 mg/kg. The Meeting estimated an STMR-P for sunflower seed oil of 0 mg/kg and decided to withdraw the previous recommendation for sunflower seed oil, crude and edible.
The residue levels of paraquat in cotton gin by-product in trials for harvest aid uses were (including results for cotton harvested 13–17 days after treatment): 5.2, 5.3, 5.9, 6.2, 7.3, 8.0, 9.4, 11, 12 (two), 18, 23, 32, 34 and 69 mg/kg. The Meeting estimated an STMR-P of 10.2 mg/kg for cotton gin by-products.
As maize flour contained a higher concentration of paraquat residues than maize grain in one trial, the Meeting estimated a maximum residue level of 0.05 mg/kg. Residues in animal commodities
Dietary burden of farm animals
The Meeting estimated the dietary burden of paraquat residues for farm animals on the basis of the diets described in Appendix IX to the FAO Manual (FAO, 2002), by summing the contribution of each feed to the residue.
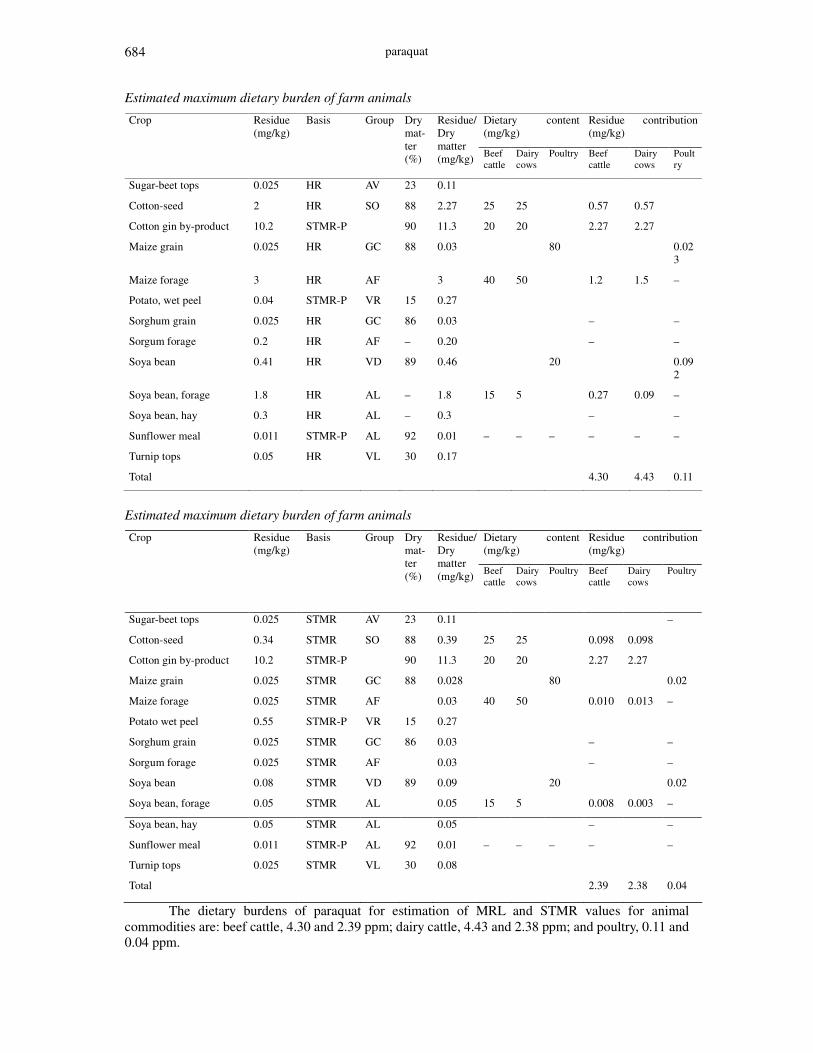
paraquat 684
Estimated maximum dietary burden of farm animals
Dietary content (mg/kg)
Residue contribution (mg/kg)
Crop Residue (mg/kg)
Basis Group Dry mat-ter (%)
Residue/Dry matter (mg/kg) Beef
cattle Dairy cows
Poultry Beef cattle
Dairy cows
Poultry
Sugar-beet tops 0.025 HR AV 23 0.11
Cotton-seed 2 HR SO 88 2.27 25 25 0.57 0.57
Cotton gin by-product 10.2 STMR-P 90 11.3 20 20 2.27 2.27
Maize grain 0.025 HR GC 88 0.03 80 0.023
Maize forage 3 HR AF 3 40 50 1.2 1.5 –
Potato, wet peel 0.04 STMR-P VR 15 0.27
Sorghum grain 0.025 HR GC 86 0.03 – –
Sorgum forage 0.2 HR AF – 0.20 – –
Soya bean 0.41 HR VD 89 0.46 20 0.092
Soya bean, forage 1.8 HR AL – 1.8 15 5 0.27 0.09 –
Soya bean, hay 0.3 HR AL – 0.3 – –
Sunflower meal 0.011 STMR-P AL 92 0.01 – – – – – –
Turnip tops 0.05 HR VL 30 0.17
Total 4.30 4.43 0.11
Estimated maximum dietary burden of farm animals
Dietary content (mg/kg)
Residue contribution (mg/kg)
Crop Residue (mg/kg)
Basis Group Dry mat-ter (%)
Residue/Dry matter (mg/kg) Beef
cattle Dairy cows
Poultry Beef cattle
Dairy cows
Poultry
Sugar-beet tops 0.025 STMR AV 23 0.11 –
Cotton-seed 0.34 STMR SO 88 0.39 25 25 0.098 0.098
Cotton gin by-product 10.2 STMR-P 90 11.3 20 20 2.27 2.27
Maize grain 0.025 STMR GC 88 0.028 80 0.02
Maize forage 0.025 STMR AF 0.03 40 50 0.010 0.013 –
Potato wet peel 0.55 STMR-P VR 15 0.27
Sorghum grain 0.025 STMR GC 86 0.03 – –
Sorgum forage 0.025 STMR AF 0.03 – –
Soya bean 0.08 STMR VD 89 0.09 20 0.02
Soya bean, forage 0.05 STMR AL 0.05 15 5 0.008 0.003 –
Soya bean, hay 0.05 STMR AL 0.05 – –
Sunflower meal 0.011 STMR-P AL 92 0.01 – – – – –
Turnip tops 0.025 STMR VL 30 0.08
Total 2.39 2.38 0.04
The dietary burdens of paraquat for estimation of MRL and STMR values for animal commodities are: beef cattle, 4.30 and 2.39 ppm; dairy cattle, 4.43 and 2.38 ppm; and poultry, 0.11 and 0.04 ppm.
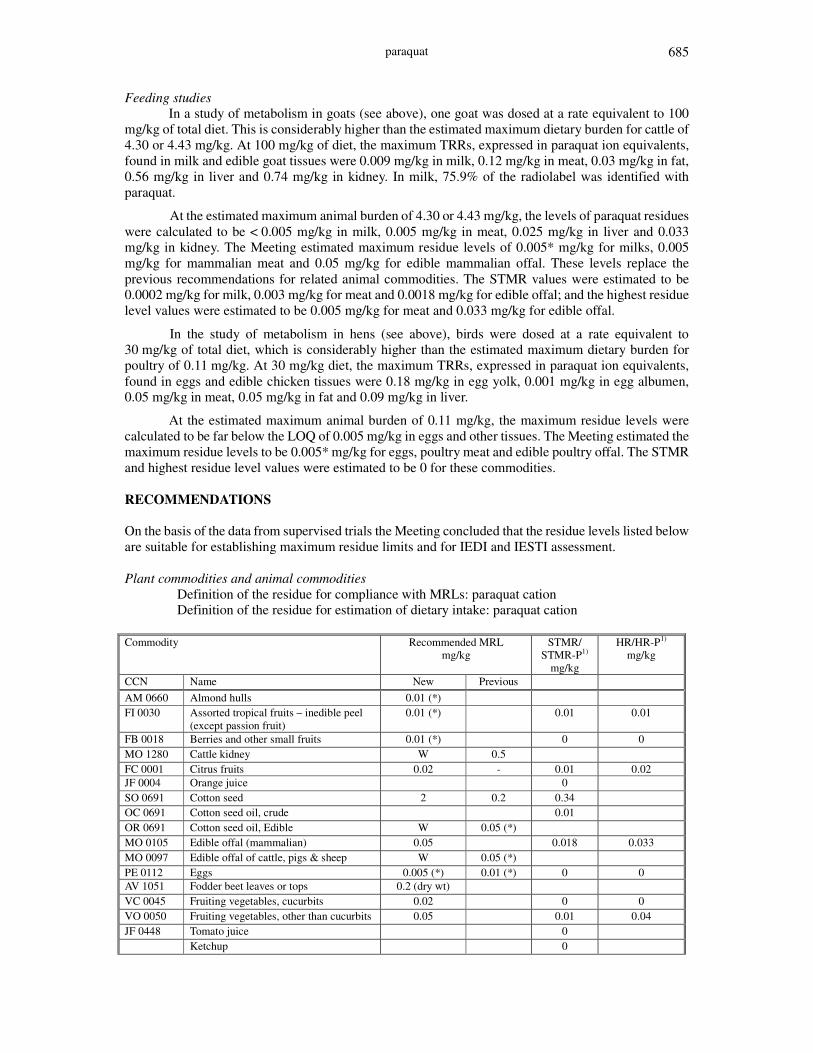
paraquat 685
Feeding studies In a study of metabolism in goats (see above), one goat was dosed at a rate equivalent to 100
mg/kg of total diet. This is considerably higher than the estimated maximum dietary burden for cattle of 4.30 or 4.43 mg/kg. At 100 mg/kg of diet, the maximum TRRs, expressed in paraquat ion equivalents, found in milk and edible goat tissues were 0.009 mg/kg in milk, 0.12 mg/kg in meat, 0.03 mg/kg in fat, 0.56 mg/kg in liver and 0.74 mg/kg in kidney. In milk, 75.9% of the radiolabel was identified with paraquat.
At the estimated maximum animal burden of 4.30 or 4.43 mg/kg, the levels of paraquat residues were calculated to be < 0.005 mg/kg in milk, 0.005 mg/kg in meat, 0.025 mg/kg in liver and 0.033 mg/kg in kidney. The Meeting estimated maximum residue levels of 0.005* mg/kg for milks, 0.005 mg/kg for mammalian meat and 0.05 mg/kg for edible mammalian offal. These levels replace the previous recommendations for related animal commodities. The STMR values were estimated to be 0.0002 mg/kg for milk, 0.003 mg/kg for meat and 0.0018 mg/kg for edible offal; and the highest residue level values were estimated to be 0.005 mg/kg for meat and 0.033 mg/kg for edible offal.
In the study of metabolism in hens (see above), birds were dosed at a rate equivalent to 30 mg/kg of total diet, which is considerably higher than the estimated maximum dietary burden for poultry of 0.11 mg/kg. At 30 mg/kg diet, the maximum TRRs, expressed in paraquat ion equivalents, found in eggs and edible chicken tissues were 0.18 mg/kg in egg yolk, 0.001 mg/kg in egg albumen, 0.05 mg/kg in meat, 0.05 mg/kg in fat and 0.09 mg/kg in liver.
At the estimated maximum animal burden of 0.11 mg/kg, the maximum residue levels were calculated to be far below the LOQ of 0.005 mg/kg in eggs and other tissues. The Meeting estimated the maximum residue levels to be 0.005* mg/kg for eggs, poultry meat and edible poultry offal. The STMR and highest residue level values were estimated to be 0 for these commodities. RECOMMENDATIONS On the basis of the data from supervised trials the Meeting concluded that the residue levels listed below are suitable for establishing maximum residue limits and for IEDI and IESTI assessment. Plant commodities and animal commodities
Definition of the residue for compliance with MRLs: paraquat cation Definition of the residue for estimation of dietary intake: paraquat cation
Commodity Recommended MRL
mg/kg STMR/
STMR-P1) mg/kg
HR/HR-P1) mg/kg
CCN Name New Previous AM 0660 Almond hulls 0.01 (*) FI 0030 Assorted tropical fruits – inedible peel
(except passion fruit) 0.01 (*) 0.01 0.01
FB 0018 Berries and other small fruits 0.01 (*) 0 0 MO 1280 Cattle kidney W 0.5 FC 0001 Citrus fruits 0.02 - 0.01 0.02 JF 0004 Orange juice 0 SO 0691 Cotton seed 2 0.2 0.34 OC 0691 Cotton seed oil, crude 0.01 OR 0691 Cotton seed oil, Edible W 0.05 (*) MO 0105 Edible offal (mammalian) 0.05 0.018 0.033 MO 0097 Edible offal of cattle, pigs & sheep W 0.05 (*) PE 0112 Eggs 0.005 (*) 0.01 (*) 0 0 AV 1051 Fodder beet leaves or tops 0.2 (dry wt) VC 0045 Fruiting vegetables, cucurbits 0.02 0 0 VO 0050 Fruiting vegetables, other than cucurbits 0.05 0.01 0.04 JF 0448 Tomato juice 0 Ketchup 0
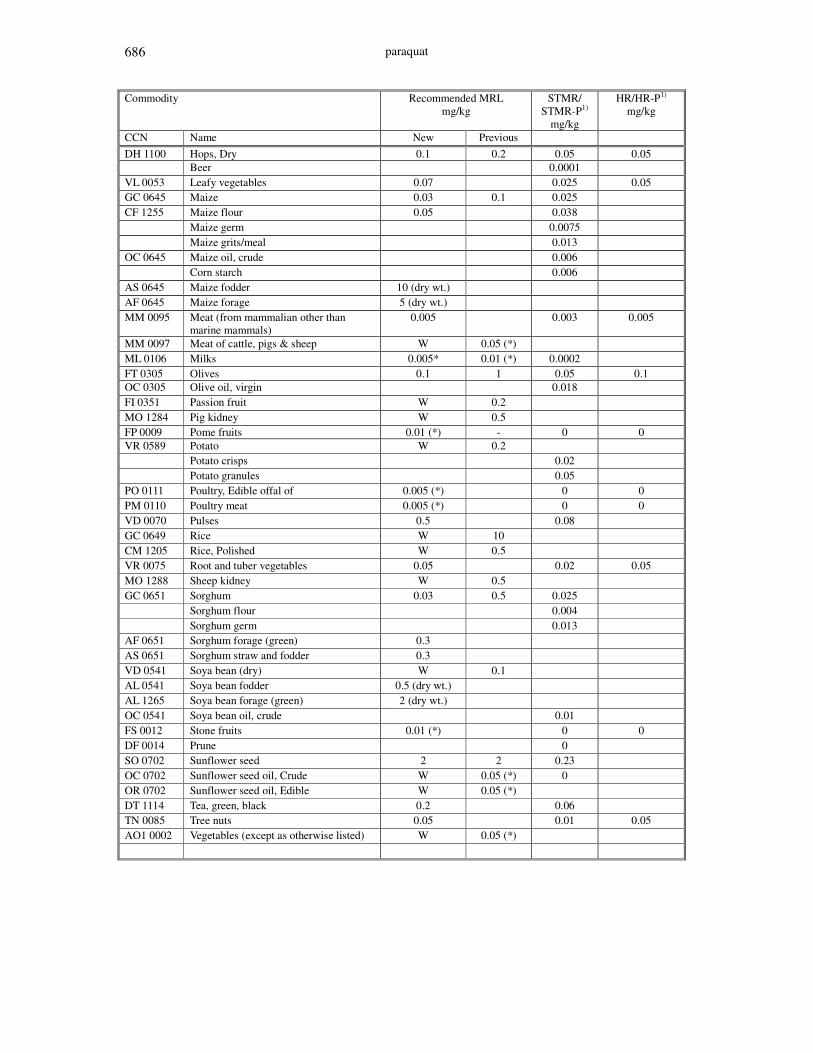
paraquat 686
Commodity Recommended MRL mg/kg
STMR/ STMR-P1)
mg/kg
HR/HR-P1) mg/kg
CCN Name New Previous DH 1100 Hops, Dry 0.1 0.2 0.05 0.05 Beer 0.0001 VL 0053 Leafy vegetables 0.07 0.025 0.05 GC 0645 Maize 0.03 0.1 0.025 CF 1255 Maize flour 0.05 0.038 Maize germ 0.0075 Maize grits/meal 0.013 OC 0645 Maize oil, crude 0.006 Corn starch 0.006 AS 0645 Maize fodder 10 (dry wt.) AF 0645 Maize forage 5 (dry wt.) MM 0095 Meat (from mammalian other than
marine mammals) 0.005 0.003 0.005
MM 0097 Meat of cattle, pigs & sheep W 0.05 (*) ML 0106 Milks 0.005* 0.01 (*) 0.0002 FT 0305 Olives 0.1 1 0.05 0.1 OC 0305 Olive oil, virgin 0.018 FI 0351 Passion fruit W 0.2 MO 1284 Pig kidney W 0.5 FP 0009 Pome fruits 0.01 (*) - 0 0 VR 0589 Potato W 0.2 Potato crisps 0.02 Potato granules 0.05 PO 0111 Poultry, Edible offal of 0.005 (*) 0 0 PM 0110 Poultry meat 0.005 (*) 0 0 VD 0070 Pulses 0.5 0.08 GC 0649 Rice W 10 CM 1205 Rice, Polished W 0.5 VR 0075 Root and tuber vegetables 0.05 0.02 0.05 MO 1288 Sheep kidney W 0.5 GC 0651 Sorghum 0.03 0.5 0.025 Sorghum flour 0.004 Sorghum germ 0.013 AF 0651 Sorghum forage (green) 0.3 AS 0651 Sorghum straw and fodder 0.3 VD 0541 Soya bean (dry) W 0.1 AL 0541 Soya bean fodder 0.5 (dry wt.) AL 1265 Soya bean forage (green) 2 (dry wt.) OC 0541 Soya bean oil, crude 0.01 FS 0012 Stone fruits 0.01 (*) 0 0 DF 0014 Prune 0 SO 0702 Sunflower seed 2 2 0.23 OC 0702 Sunflower seed oil, Crude W 0.05 (*) 0 OR 0702 Sunflower seed oil, Edible W 0.05 (*) DT 1114 Tea, green, black 0.2 0.06 TN 0085 Tree nuts 0.05 0.01 0.05 AO1 0002 Vegetables (except as otherwise listed) W 0.05 (*)

paraquat 687
DIETARY RISK ASSESSMENT
Long-term intake
The IEDIs were calculated for the five GEMS/Food regional diets from the STMR values for fruit, vegetables, maize, sorghum, cotton-seed, sunflower, hops, tea and animal commodities and the STMR-P values for their processed products, as estimated by the current Meeting (Annex 3 of the Report ). The ADI is 0–0.005 mg/kg bw, and the calculated IEDIs were 2–5% of the ADI. The Meeting concluded that the intake of residues of paraquat resulting from uses considered by the current JMPR was unlikely to present a public health concern.
Short-term intake
The IESTIs of paraquat by the general population and by children were calculated for commodities for which STMR or STMR-P values had been estimated by the current Meeting when information on consumption was available (Annex 4 of the Report). The ARfD is 0.006 mg/kg; the calculated IESTIs for children up to 6 years range from 0 to 50% and those for the general population from 0 to 20% of the ARfD. The Meeting concluded that the short-term intake of residues of paraquat from uses considered by the current Meeting was unlikely to present a public health concern.
REFERENCES
AFFA (2002), Report on the Australian National Residue Survey Results 2001-2002, Agriculture, Fisheries and Forestry, Australia, Canberra.
Anderson L (year not specified), RAM 252/01: Standard Operating Procedure
Anderson L (1994a), The Determination of Residues of Paraquat and Diquat in Water, Milk, Oils and other Liquids: A Second Derivative Spectrophotometric Method with Confirmatory Method for Water Residues by High Performance Liquid Chromatography, Unpublished Study Submitted by Zeneca Agrochemicals, Jealott’s Hill Research Centre, Bracknell, Berkshire, UK, Standard Operating Procedure RAM 254/01, Syngenta File no. PP901/0497.
Anderson L (1994b), Validation of a Residue Analytical Method for the Determination of Paraquat in Animal Products, Unpublished Study Submitted by Zeneca Agrochemicals, Jealott’s Hill Research Centre, Bracknell, Berkshire, UK, Report no. RJ1600B, Syngenta File no. PP148/0362.
Anderson L (1995a), Paraquat: Storage Stability of the Residues in Frozen Carrot, Cabbage and Wheat Grain-Final Report, Report No. RJ2011, Syngenta File No. PP148/0364.
Anderson L (1995b), The Determination of Residues of Paraquat and Diquat in Crops: A Second Derivative Spectrophotometric Method. Unpublished Study Submitted by Zeneca Agrochemicals, Jealott’s Hill Research Centre, Bracknell, Berkshire, UK, Standard Operating Procedure RAM 252/02, Syngenta File no. PP148/0350.
Anderson L (1997), The Determination of Paraquat in Animal Products-A High Performance Liquid Chromatographic Method, Unpublished Study Submitted by Zeneca Agrochemicals, Jealott’s Hill Research Centre, Bracknell, Berkshire, UK Standard Operating Procedure RAM 004/07, Syngenta File no. PP148/0357.
Anderson L and Agarwal AS (1966), Paraquat: Residue Levels in Tea from Trials Carried out in India during 1994, Unpublished study submitted by Zeneca Agrochemicals, Jealott’s Hill, UK, Report No. RJ2061B, Syngenta File no. PP 148/0491.
Anderson L and Boseley (1995), Paraquat and Diquat: Validation of an HPLC Analytical Method for the Determination of the Residues in Crops and Soil, Unpublished Study Submitted by Zeneca Agrochemicals, Jealott’s Hill Research Centre, Bracknell, Berkshire, UK, Report no. RJ2013B, Syngenta File no. PP901/0689.
Anderson L and Boseley (1997), The Determination of Paraquat and Diquat in Crops and Soil-A High Performance Liquid Chromatographic Method, Unpublished Study Submitted by Zeneca Agrochemicals, Jealott’s Hill Research Centre, Bracknell, Berkshire, UK Standard Operating Procedure RAM 272/02, Syngenta File no. PP901/0225.
Anderson L and Earl M (1993), Paraquat Residues in Olives From Trials Carried Out in Spain During 1991/1992, Unpublished Study from ICI Agrochemicals, Jealott’s Hill Research Station, Bracknell, Berkshire, UK unpublished report no. RJ1292B, Syngenta File no. PP148/0433.
Anderson L and Lant M (1994), Paraquat and Diquat: Residue Levels in Maize from Trials Carried out in Italy during 1993, Unpublished Study Submitted by Zeneca Agrochemicals, Jealotts Hill Research Centre, Bracknell, United Kingdom Report no. RJ1731B, Syngenta File no. PP148/1760.
Anderson L, Boseley AD and Earl M (1991a), Paraquat: Storage Stability of Residues in Frozen hen Muscle, Report No. RJ0908B, Syngenta File No. PP148/0509.
Anderson L, Boseley AD and Earl M (1991b), Paraquat: Storage Stability of Residues in Frozen Eggs, Report No. RJ0912B, Syngenta File No. PP148/0507.

paraquat 688
Anderson L, Lant MS and Bonfanti F (1995), Paraquat and Diquat: Residue Levels in Rice Grain and Straw from Trials carried out in Italy during 1993, Zeneca Agrochemicals, Jealott’s Hill Research Station, Bracknell, Berkshire, UK unpublished report no. RJ1728B, Syngenta File no. PP148/0463.
Anonymous (1970), A Summary of Paraquat Residues in Food Crops, Unpublished Study Submitted by ICI Plant Protection Division, Jealotts Hill Research Centre, Bracknell, United Kingdom, Report no. RIC 2492, Syngenta File no. PP148/0348.
Anonymous (1975a), Paraquat residue tolerance petition (section D), unpublished study from Chevron Chemical Company, Richmond, California, USA, Syngenta File no. ASF378/0052.
Anonymous (1975b), The Results of Tests on the Amount of Residue Remaining, Including a description of the Analytical Methods Used: Paraquat, unpublished study from Chevron Chemical Company, Richmond, California, USA. Report No 424315, Syngenta File no. PP148/1873.
Anonymous (1985), Residue Chemistry Data - Ortho Paraquat CL/Rice (Pesticide Petition 5F3188), Chevron Chemical Company, unpublished report, Syngenta File no. ASF378/0050.
Australian Pesticides and Veterinary Medicines Authority (2004). Maximum Residue Limits: the MRL standard – maximum residue limits in food and animal feedstuffs.
Baldwin BC, Bray MF and Goeghegan MJ (1966), The Microbial Decomposition of Paraquat, Biochem. Journal, Volume 101(2), p 15, Syngenta File no. PP148/0546.
Baldwin BC (1971), The Isolation of Oxalic Acid from Lipomyces starkeyi Cultures, Unpublished Study Submitted by ICI Plant Protection Division, Jealott’s Hill Research Centre, Bracknell, Berkshire, Report no. M2861, Syngenta File no. PP148/0547.
Benet F and Massenot F (1989), Recherche de Residue de Paraquat Dans de Scorsoneres, Unpublished Study Submitted by ICI SOPRA, SOPRA report no. RH8902.I, Syngenta File no. 148/0393.
Bewick DW, Benner JP, Anema BP and Stevens JEB (1984a), Paraquat: A Survey of Residues and Deactivation Capacities of Soils in the Netherlands, Unpublished Study Submitted by ICI Agrochemicals, Jealott’s Hill Research Centre, Bracknell, Berkshire, Report no. RJ0371B, Syngenta File no. PP148/0648.
Bewick DW, Benner JP, Heckele K and Stevens JEB (1984b), Paraquat: A Survey of Residues and Deactivation Capacities of Soils in the Federal Republic of Germany, Unpublished Study Submitted by ICI Agrochemicals, Jealott’s Hill Research Centre, Bracknell, Berkshire, Report no. RJ0361B, Syngenta File no. PP148/0623.
Bewick DW, Benner JP, Pedersen FK and Stevens JEB (1984c), Paraquat: A Survey of Residues and Deactivation Capacities of Soils in Denmark, Unpublished Study Submitted by ICI Agrochemicals, Jealott’s Hill Research Centre, Bracknell, Berkshire, Report no. RJ0387B, Syngenta File no. PP148/0624.
Bewick DW, Benner JP, Michalopoulos G and Stevens JEB (1985), Paraquat: A Survey of Residues and Deactivation Capacities of Soils in Greece, Unpublished Study Submitted by ICI Agrochemicals, Jealott’s Hill Research Centre, Bracknell, Berkshire, Report no. RJ0415B, Syngenta File no. PP148/0625.
Brown N (1994a), Paraquat: Residues in Chick Peas (Seed and Straw) From a Trial in Australia During 1993, Unpublished Study Submitted by ICI Australia Research Group, Victoria, Australia, Report no. S38990 94-05, Syngenta File no. PP148/0405.
Brown N (1994b), Paraquat: Residues in Field Peas (Seed and Straw) From a Trial in Australia During 1993, Unpublished Study Submitted by ICI Australia Research Group, Victoria, Australia, Report no. S38990 94-06, Syngenta File no. PP148/0406.
Calderbank A and McKenna RH (1964), Bipyridylium Herbicides: Residues of Diquat and Paraquat in Food Crops from 1963 Trials, Unpublished Study Submitted by ICI Plant Protection Division, Jealotts Hill Research Centre, Bracknell, United Kingdom Report no. PP/E/292, Syngenta File no. PP901/0676.
Calderbank A and Yuen SH (1963), Bipyridylium Herbicides: Residues of Diquat and Paraquat in Food Crops, Unpublished Study Submitted by ICI Plant Protection Division, Jealotts Hill Research Centre, Bracknell, United Kingdom Report no. PP/E/231, Syngenta File no. PP901/0288.
Carringer SJ (2000), Paraquat: Final Report-Magnitude of the Residues in Grain Sorghum Raw Agricultural Commodities, Syngenta Crop Protection, Western Research Center, Richmond, California, USA, unpublished report no. RR 00-081B, Syngenta File no. PP148/1192.
Chevron Chemical Company (1966), Summary: Paraquat, unpublished study from Chevron Chemical Company, Richmond, California, USA. Report No 6F0483, Syngenta File no. ASF378/0046.
Chevron Chemical Company (1967), Summary, Paraquat Registration: Preplant and Preemergence Cotton and Potatoes Residue Data, unpublished study from Chevron Chemical Company, Richmond, California, USA. Report No 771.1996, Syngenta File no. ASF378/0038.
Chevron Chemical Company (1970), Summary of Residue Data: Paraquat in Asparagus, Unpublished Study Submitted by Chevron Chemical Company, Richmond, California, USA. Syngenta File no. ASF378/0055.
Chevron Chemical Company (1972a), Summary: Paraquat-Residue Tolerance Petition for Guava. Unpublished study from Chevron Chemical Company, Richmond, California. Report No 424232, Syngenta File no. PP148/1870.
Chevron Chemical Company (1972b), Summary: Paraquat-Residue Tolerance Petition on Passion Fruit. Unpublished study from Chevron Chemical Company, Richmond, California. Report No 424314, Syngenta File no. PP148/1875.
Chevron Chemical Company (1975a), The Results of Tests on the Amount of Residue Remaining, Including a Description of the Analytical Method Used: Paraquat, Chevron Chemical Company, Richmond, California, USA. Report No 424234, Syngenta File no. PP148/1872.
paraquat 689
Chevron Chemical Company (1975b), Summary of Residue Data for Field Corn Treated with Paraquat as a Harvest-Aid. Unpublished Study Submitted by Chevron Chemical Company, Richmond, California, USA, Syngenta File no. ASF378/0053.
Chevron Chemical Company (1975c), Residue Chemistry Data to Support Amendment of Ortho Paraquat CL (EPA Reg. No. 239-2186) Label for Postemergence Directed Spray Application for Control of Weeds in Tomatoes and Peppers, unpublished study from Chevron Chemical Company, Richmond, California (MRID 00062801), Syngenta File no. ASF378/0054.
Chevron Chemical Company (1985), Summary: Section D, Paraquat Residue Tolerance Petition Soybeans, unpublished study from Chevron Chemical Company, Richmond, California, USA, Syngenta File no. ASF378/0038.
Chevron Chemical Company (2001), Paraquat: Residues in Citrus Fruit From Trials Carried Out in the USA, Unpublished study from Chevron Chemical Company, Richmond, California, Report no. RIC2253, Syngenta File no. PP148/0441.
Choban RG (1991), Paraquat: Magnitude of the Residue in or on Chinese Cabbage (Pre- or Post-Directed), Unpublished Data Submitted by IR-4, New Brunswick, New Jersey, USA, Syngenta File no. ASF 378/0056.
Cole JFH et al. (1984), Paraquat: Paraquat: Long-Term, High-Rate Trial, Frensham, UK Crop and Soil Data for the Period 8-12 Years After Treatment., Unpublished Study Submitted by ICI Agrochemicals, Jealott’s Hill Research Centre, Bracknell, Berkshire, UK, Report no. RJ0355B, Syngenta File no. PP148/0599.
Coombe N (1994a), Paraquat: Animal Tissue Validation-Zeneca Agrochemicals SOP RAM/004/03, Unpublished Study Submitted by CEM Analytical Services, North Ascot, Berkshire, UK, Report no. CEMR-299, Syngenta File no. PP148/1236.
Coombe N (1994b), Validation of Zeneca Agrochemicals Standard Operating Procedures for the Analysis of Diquat and Paraquat in Crops, Soil and Water Containing Both Compounds, Unpublished Study Submitted by CEM Analytical Services, North Ascot, Berkshire, UK, Report no. CEMR-322, Syngenta File no. PP901/0671.
Coombe NB (1995a), Storage Stability of Paraquat and Diquat Residues in Frozen Coffee Beans and Bananas, Report No. CEMR-300, Syngenta File No. PP148/0360.
Coombe NB (1995b), Storage Stability of Paraquat and Diquat in Frozen Milk, Report No. CEMR-319, Syngenta File No. PP148/0360.
Coombe NB and Gallardo E (1999), Paraquat: Residue Levels in Cabbage From Trials Carried Out in Spain during 1998, Unpublished Study Submitted by Zeneca Agrochemicals, Jealotts Hill Research Centre, Bracknell, United Kingdom, Report no. CEMR-848, Syngenta File no. PP148/0398.
Day SR and Hemingway RJ (1981), 14C-Paraquat: Degradation on a Sandy Soil Surface in Sunlight, Unpublished Study Submitted by ICI Plant Protection Division, Jealott’s Hill Research Centre, Bracknell, Berkshire, Report no. RJ0168B, Syngenta File no. PP148/0545.
Devine HC (2001a), Method Validation of Paraquat and Diquat in Crops (RAM 272/02), Unpublished Study Submitted by CEM Analytical Services Ltd., Berkshire, UK, Report no. CEMR-1481, Syngenta File no. ASF378/0002.
Devine HC (2001b), Method Validation of Paraquat in Milk and Kidney (RAM 004/07), Unpublished Study Submitted by CEM Analytical Services Ltd., Berkshire, UK, Report no. CEMR-1482, Syngenta File no. ASF378/0001.
Devine HC and Balluff M, (2002a) Paraquat: Residue Levels in Beans With Pods From a Trial Carried Out in Spain During 2001, Unpublished Study Submitted by CEM Analytical Services, North Ascot, UK, Report no. CEMR-1560, Syngenta File no. PP148/1721.
Devine HC and Balluff M (2002b), Paraquat: Residue Levels in Beans With Pods From a Trial Carried Out in Germany During 2001, Unpublished Study Submitted by CEM Analytical Services, North Ascot, UK, Report no. CEMR-1559, Syngenta File no. PP148/1723.
Devine HC and Balluff M (2002c), Paraquat: Residue Levels in Dried Field Beans From a Trial Carried Out in Germany During 2001, Unpublished Study Submitted by CEM Analytical Services, North Ascot, UK, Report no. CEMR-1561, Syngenta File no. PP148/1722.
Devine HC and Balluff M (2002d), Paraquat: Residue Levels in Dried Field Beans From a Trial Carried Out in Spain During 2001, Unpublished Study Submitted by CEM Analytical Services, North Ascot, UK, Report no. CEMR-1562, Syngenta File no. PP148/1724.
Devine HC and Balluff M (2002e), Paraquat: Residue Levels in Strawberry (Protected) From Trials Carried Out in Germany and Northern France During 2001, Unpublished Study Submitted by CEM Analytical Services, North Ascot, UK, Report no. CEMR-1563, Syngenta File no. PP148/1749.
Devine HC and Orellana JW (2003a), Paraquat: Residue Levels in Beans With Pods From a Trial Carried Out in Spain During 2002, Unpublished Study Submitted by CEM Analytical Services, North Ascot, UK, Report no. CEMR-1837, Syngenta File no. PP148/1790.
Devine HC and Orellana JW (2003b), Paraquat: Residue Levels in Fresh Broad Beans From a Trial Carried Out in Spain During 2002, Unpublished Study Submitted by CEM Analytical Services, North Ascot, UK, Report no. CEMR-1829, Syngenta File no. PP148/1791.
Devine HC and Poppezijn W (2003), Paraquat: Residue Levels in Beans With Pods From a Trial Carried Out in the Netherlands During 2002, Unpublished Study Submitted by CEM Analytical Services, North Ascot, UK, Report no. CEMR-1839, Syngenta File no. PP148/1788.
Devine HC, Martinez M and Volle C (2003), Paraquat and Diquat: Residue Levels in Olives and Process Fractions From Trials Carried Out in Spain During 2001, Unpublished Study from CEM Analytical Services, North Ascot, Berkshire, UK, Report no. CEMR-1555, Syngenta File no. ASF378/0012.
Dick JP, Taylor PS and Bonfanti F (1995a), Paraquat and Diquat: Residue Levels in Olive Fruit and Oil from Trials Carried Out in Italy During 1993, Unpublished Study from Zeneca Agrochemicals, Jealott’s Hill Research Station, Bracknell, Berkshire, UK, Report no. RJ1810B, Syngenta File no. PP148/1759.

paraquat 690
Dick JP, Taylor PS and Bonfanti F (1995b), Paraquat: Residue Levels in Oranges From Trials Carried Out in Italy During 1993, Unpublished Study Submitted by Zeneca Agrochemicals, Jealotts Hill Research Centre, Bracknell, United Kingdom, Report no. RJ1808B, Syngenta File no. PP148/1763.
Dyson JS and Chapman P (1995), Paraquat: Long-Term, High-Rate Trial, Frensham, UK 1971-1991, Fatge of Soil Residues, Unpublished Study Submitted by Zeneca Agrochemicals, Jealott’s Hill Research Centre, Bracknell, Berkshire, UK, Report no. TMJ3430B, Syngenta File no. PP148/0645.
Dyson JS, Chapman P and Farmer K (1995a), Paraquat: Long-Term Soil Trial at Greensboro, USA 1979-1991. Fate of Residues in Soil, Unpublished Study Submitted by Zeneca Agrochemicals, Jealott’s Hill Research Centre, Bracknell, Berkshire, UK, Report no. TMJ3329B, Syngenta File no. PP148/0644.
Dyson JS, Ferguson RE and Lane MCG (1994), Paraquat: Adsorption and Desorption Properties in Temperate Soils, ICI Agrochemicals, Jealott’s Hill Research Centre, Bracknell, Berkshire, Report no. TMJ3225B, Syngenta File no. PP148/0557.
Dyson JS, Kirsh O and Stevens JEB (1995b), Paraquat: Long-Term Soil Trials at Greensboro, USA 1979-1991. I Trial Description and Crop Measurements, Unpublished Study Submitted by Zeneca Agrochemicals, Jealott’s Hill Research Centre, Bracknell, Berkshire, UK, Report no. TMJ3328B, Syngenta File no. PP148/0643.
Earl M and Anderson L (1991), Paraquat: Residues in Potatoes from trials Carried Out in Germany During 1990, Unpublished Study From ICI Agrochemicals, Jealott’s Hill Research Station, Bracknell, Berkshire, United Kingdom, Report no. RJ1040B, Syngenta File no. PP148/0386.
Earl M and Anderson L (1992a), Paraquat: Residues in Pome Fruit and Stone Fruit From Trials Carried Out in Germany, Unpublished Study Submitted by ICI Agrochemicals, Jealotts Hill Research Centre, Bracknell, United Kingdom Report no. RJ1053B, Syngenta File no. PP148/0428.
Earl M and Anderson L (1992b), Paraquat: Residues in Grapes From Trials Carried Out in Germany During 1990, Unpublished Study Submitted by ICI Agrochemicals, Jealotts Hill Research Centre, Bracknell, United Kingdom, Report no. RJ1051B, Syngenta File no. PP148/0429.
Earl M and Boseley AD (1988), ICI Agrochemicals Residue Analytical Method No. 4B-The Determination of Residues of Paraquat (PP148) in Animal Products-A High Performance Liquid Chromatographic Method, Unpublished Study Submitted by ICI Plant Protection Division, Jealott’s Hill Research Centre, Bracknell, Berkshire, UK, Report no. ARAM 004B, Syngenta File no. PP148/0359.
Earl M and Boseley AD (1988), The Determination of Residues of Paraquat in Water and Other Liquid Samples—a Spectrophotometric Method (Method 3B), Unpublished Study Submitted by ICI Plant Protection Division, Jealott’s Hill Research Centre, Bracknell, Berkshire, UK, Syngenta File no. PP148/0531.
Earl M and Muir GT (1988), Paraquat/Diquat: Residues in Soybeans From a Trial Carried Out in Brazil During 1986, Unpublished Study From ICI Agrochemicals, Jealott’s Hill Research Centre, Bracknell, Berkshire, Report no. M4827B, Syngenta File no. PP148/0677.
Earl M, Emburey GT, Scholley JC and Anderson L (1992), Paraquat: Storage Stability of the Residue in Frozen Soil, ICI Agrochemicals, Jealott’s Hill Research Centre, Bracknell, Berkshire, Report no. RJ1152B, Syngenta File no. PP148/0639.
Edwards MJ (1974), Paraquat Residue Summary: Residues in Vegetables and Grapes Following Postemergence Treatment with Paraquat for Weed Control, Unpublished Study Submitted by ICI Plant Protection Division, Jealotts Hill Research Centre, Bracknell, United Kingdom, Report no. TMJ1030A, Syngenta File no. PP148/0377.
Florida Dept of Agriculture (1978), Residue Chemistry to Support the Use of Paraquat CL on Lettuce as a Postemergence Directed Spray, Unpublished Study Submitted by the Florida Department of Agriculture and Consumer Services, Report No. 3203-1978, Syngenta File no. ASF378/0043.
Fryer JD, Hance RJ and Ludwig JW (1974), Long-Term Persistence of Paraquat in a Sandy Loam Soil, Weed Research, Volume 15, pp 189-194, Report No. RIC 0651, Syngenta File PP144/0596.
Funderburk HH and Bozarth GA (1967), Review of the Metabolism and Decomposition of Diquat and Paraquat, J. Agric. and Food Chemistry, Volume 15, pp. 563-567, Syngenta File no. ASF378/0033.
Gatti G (1987), Paraquat: Residui Nelle Olive e Nelle Nocciole. Rif71-72. Unpublished report from ICI Solpant, Report no. RIC0284, Syngenta File no. PP148/0439.
Gowman MA, Riley D and Newby SE (1980), Paraquat and Diquat: Long-Term, High-Rate Trial, Frensham, UK 2. Persistence and Movement in Soil, and Greenhouse Bioassays, Unpublished Study Submitted by ICI Agrochemicals, Jealott’s Hill Research Centre, Bracknell, Berkshire, UK, Report no. RJ0014B, Syngenta File no. PP148/0576.
Green M (1994), Paraquat Analysis in Tissue Extracts Using the Enviroguard Paraquat Plate Kit, Unpublished Study Submitted by Central Science Laboratory, Slough, Berkshire, UK, Report WIU/009. Syngenta File no. PP148/0274.
Grout SJ (1994a), Paraquat: Quantification and Characterisation of Radioactive Residues in Root and Leafy Crop after Preplant Soil Treatment, Unpublished Study Submitted by Zeneca Agrochemicals, Jealott’s Hill Research Centre, Bracknell, Berkshire, Report no. RJ1595B, Syngenta File No. PP148/0366.
Grout SJ (1994b), Paraquat: Quantification and Characterisation of Radioactive Residues in Root and Oilseed Crop After Desiccant Treatment of Foliage, Unpublished Study Submitted by Zeneca Agrochemicals, Jealott’s Hill Research Centre, Bracknell, Berkshire, Report no. RJ1683, Syngenta File N° PP148/0367.

paraquat 691
Grout SJ (1996), Addendum Number 1 to Paraquat: Quantification and Characterisation of Radioactive Residues in Root and Oilseed Crop After Desiccant Treatment of Foliage, Unpublished Study Submitted by Zeneca Agrochemicals, Jealott’s Hill Research Centre, Bracknell, Berkshire, Report no. RJ1683-ADD1.
Hance RJ, Byast, TH and Smith PD (1980), Apparent Decomposition of Paraquat in Soil, Soil Biology and Biochemistry, Volume 12, pp. 447-448, Syngenta File no. ASF378/0034.
Hance RJ, Byast TH, Smith PD and Weight TM (1984), Paraquat Persistence-Statistical Analysis of the WRO Long Term Trial, AFRC Weed Research Organisation, Technical Report no. 73, Syngenta File no. PP148/0603.
Hayward CJ and Robbins AJ (1981a), Paraquat Residues on Soyabean From 1981 Brazil Trials, Unpublished Study From ICI Plant Protection Division, Jealott’s Hill Research Centre, Bracknell, Berkshire, Report no. PP148B022, Syngenta File no. PP148/0414.
Hayward CJ and Robbins AJ (1981b), Paraquat Residues on Soyabean From a 1981 Trial in Brazil, Unpublished Study From ICI Plant Protection Division, Jealott’s Hill Research Centre, Bracknell, Berkshire, Report no. PP148B030, Syngenta File no. PP148/0417.
Hemingway R et al. (1972), Paraquat: Metabolism in Sheep, Unpublished Study Submitted by ICI Plant Protection Division, Jealott’s Hill Research Centre, Bracknell, Berkshire, Report no. AR 2359 A, Syngenta File No. PP148/0499.
Hendley P et al. (1976a), Paraquat: Metabolism and Residue Studies in Goats, Unpublished Study Submitted by ICI Plant Protection Division, Jealott’s Hill Research Centre, Bracknell, Berkshire, Report no. AR 2680 A, Syngenta File No. PP148/0495.
Hendley P et al. (1976b), Paraquat: Metabolism and Residues in Hens, Unpublished Study Submitted by ICI Plant Protection Division, Jealott’s Hill Research Centre, Bracknell, Berkshire, Report no. AR 2676 A, Syngenta File No. PP148/0496.
Husband R (2001), Paraquat Dichloride: Physical and Chemical Properties of Pure Material, Unpublished Study From Syngenta Crop Protection, Jealott’s Hill Research Centre, Bracknell, Berkshire, UK, Report no.RJ3167B, Syngenta File No. PP148/1116.
Indian Submission on Supervised Trials on Tea (2004), Data Information Required for CCPR/JMPR Evaluations for Fixation of MRL of Paraquat in Tea, Submitted by the Indian Government
Interregional Research Project No. 4 (1981), Petition Proposing a Tolerance for Paraquat for use in Kiwifruit Production. Unpublished study from IR-4, New Brunswick, New Jersey, USA, Chevron Chemical Co. Report No 424312, Syngenta File no. PP148/1874.
James W (1996) Paraquat and Diquat: Validation of a Method for the Determination of Residues in Crops and Soils, Unpublished Study Submitted by Zeneca Agrochemicals, Jealott’s Hill Research Centre, Bracknell, Berkshire, UK, Report no. ZEN 0396, Syngenta File no. PP901/0244.
Jones SD (2000a), Paraquat/Diquat: Residue Levels in Olives From Trials Carried Out in Spain During 1999, Unpublished Study from CEM Analytical Services, North Ascot, Berkshire, UK, Report no. CEMR-1095, Syngenta File no. PP148/0633.
Jones SD (2000b), Paraquat/Diquat: Residue Levels in Beans With Pods From a Trial Carried Out in Italy During 1999, Unpublished Study Submitted by CEM Analytical Services, North Ascot, UK, Report no. CEMR-1097, Syngenta File no. PP148/0410.
Jones SD (2000c), Paraquat: Residue Levels in Broad Beans From a Trial Carried Out in Spain During 2000, Unpublished Study Submitted by CEM Analytical Services, North Ascot, UK, Report no. CEMR-1096, Syngenta File no. PP148/0030.
Jones SD (2000d), Paraquat: Residue Levels in Outdoor Lettuce Trials Carried Out in Spain During 1999, Unpublished Study Submitted by CEM Analytical Services, North Ascot, United Kingdom, Report no. CEMR-1099, Syngenta File no. PP148/0400.
Jones SD and Cowley P (1999), Paraquat: Residue Levels in Kale From Trials Carried Out in Southern Europe during 1998 and 1999, Unpublished Study Submitted by Zeneca Agrochemicals, Jealotts Hill Research Centre, Bracknell, United Kingdom, Report no. CEMR-849, Syngenta File no. PP148/0380.
Kalens KJ, Kirby BW, Kincade RT et al. (1971), Summary Residue Tests in Grain Sorghum Resulting from Post-Emergence Directed Sprays of Paraquat Alone or a Tank-Mixture of Paraquat and Atrazine, unpublished study from Chevron Chemical Company, Richmond, California, USA, Report No. MRID 00027178, Syngenta File no. ASF378/0051.
Kennedy SH (1984a), Diuron/Paraquat: Residues on Rice from Trials Carried Out During 1983 in Guatemala, ICI Plant Protection Division, Jealott’s Hill Research Station, Bracknell, Berkshire, UK unpublished report no. M3739B, Syngenta File no. PP148/1049.
Kennedy SH (1984b), Paraquat/Diquat: Residues on Vegetables From Trials Carried Out During 1983 in West Germany, Unpublished Study Submitted by ICI Plant Protection Division, Jealotts Hill Research Centre, Bracknell, United Kingdom, Report no. M3720B, Syngenta File no. PP148/0636.
Kennedy SH (1985), Paraquat: Residues in Olive Oil from a Trial Carried Out During 1985 in Greece, Unpublished Study from ICI Plant Protection Division, Jealott’s Hill Research Station, Bracknell, Berkshire, UK, Report no. M3982B, Syngenta File no. PP148/0431.
Kennedy SH (1986), ICI Plant Protection Division Residue Analytical Method No. 1B: The Determination of Residues of Paraquat in Crops- A Spectrophotometric Method, Unpublished Study Submitted by ICI Plant Protection Division, Jealott’s Hill Research Centre, Bracknell, Berkshire, UK, Report no. PPRAM 001B, Syngenta File no. PP148/0349.
Kennedy SH (1987), Paraquat: Residues in Olives from Trials Carried Out During 1987 in Spain, Unpublished Study from ICI Plant Protection Division, Jealott’s Hill Research Station, Bracknell, Berkshire, UK unpublished report no. M4580B, Syngenta File no. PP148/0638.
paraquat 692
Kennedy SH and Robbins SJ (1982), Paraquat Residues on Soyabean From 1981 Brazil Trials, Unpublished Study From ICI Plant Protection Division, Jealott’s Hill Research Centre, Bracknell, Berkshire, Report no. PP148B029, Syngenta File no. PP148/0415.
Kennedy SH, Robbins AJ and Ruskin Y (1983), Paraquat Residues on Soyabean Grains From 1983 Brazilian Trials, Unpublished Study From ICI Plant Protection Division, Jealott’s Hill Research Centre, Bracknell, Berkshire, Report no. PP148B032, Syngenta File no. PP148/0416.
Kuet, S F, Pinheiro, S I, and Laverty, B (2001). Paraquat: rate of intrinsic biodegradability. Syngenta Report RJ 3195B, Syngenta File No. PP148/0004
Lane, M C G L, Taweesak, K, and Dumrongsak, D (2000) Paraquat: Long-term high rate trials Thailand (1989-1999). Zeneca Agrochemicals Report TMJ 4497B, Syngenta File no.PP148/1877.
Lane, M C G and Ngim, J C K (2000) Paraquat: Long-term high rate trials Malaysia (1989-1999). Zeneca Agrochemicals Report TMJ 4171B. Syngenta File No PP148/0615.
Leahey JP et al. (1972), Paraquat: Metabolism in a Cow, Unpublished Study Submitted by ICI Plant Protection Division, Jealott’s Hill Research Centre, Bracknell, Berkshire, Report no. AR 2374 A, Syngenta File No. PP148/0500.
Leahey JP et al. (1976), Paraquat: Metabolism and Residues in Pigs using 14C-Methyl Labelled Paraquat, Unpublished Study Submitted by ICI Plant Protection Division, Jealott’s Hill Research Centre, Bracknell, Berkshire, Report no. AR 2694 A, Syngenta File No. PP148/0498.
Long, K W J, Dempsey, M, Gillings, E, and Shillabeer, N (1996) Paraquat: degradation of 14C-labelled material in natural sediment-water systems. Study Report BL5569/B, Syngenta File No. PP148/0671.
Lurvey, E. (1996), Interregional Research Project No. 4, Paraquat: Magnitude of the Residues on Globe Artichoke, Unpublished Report Submitted by IR-4, New Brunswick, New Jersey, USA, Syngenta File no. ASF378/0057.
Lurvey EL (1997), Paraquat: Magnitude of the Residues Residues in Pea (Dry), Unpublished Report Submitted by IR-4, New Brunswick, New Jersey USA, Study no. IR4 PR#03200, Syngenta File no. ASF378/0058.
Macpherson D (1995), Paraquat: Biotransformation in the rat. Unpublished Study Submitted by Zeneca Agochemicals, Central Toxicology Laboratory, Alderley Park, UK, Report No. CTL/P/4806, Syngenta File no. PP148/0233.
Markus K (1993a), Paraquat: Residues in Field Peas (Whole Plant and Seed) From a Trial in Australia During 1992, Unpublished Study Submitted by ICI Australia Research Group, Victoria, Australia, Report no. S38990 93-04, Syngenta File no. PP148/0403.
Markus K (1993b), Paraquat: Residues in Chick Peas (Whole Plant and Seed) From a Trial in Australia During 1992, Unpublished Study Submitted by ICI Australia Research Group, Victoria, Australia, Report no. S38990 93-06, Syngenta File no. PP148/0404.
Massey JA (1987a), Paraquat/Diquat: Residues in Onions From Trials Carried Out in West Germany During 1984, Unpublished Study Submitted by ICI Plant Protection Division, Jealotts Hill Research Centre, Bracknell, United Kingdom Report no. M4415B, Syngenta File no. PP901/0629.
Massey JA (1987b), Paraquat/Diquat: Residues in Carrots From Trials Carried Out in West Germany During 1984, Unpublished Study Submitted by ICI Plant Protection Division, Jealotts Hill Research Centre, Bracknell, United Kingdom, Report no. M4417B, Syngenta File no. PP148/0630.
Massey JA (1987c), Paraquat/Diquat: Residues in Lettuce From Trials Carried Out in West Germany During 1984, Unpublished Study Submitted by ICI Plant Protection Division, Jealotts Hill Research Centre, Bracknell, United Kingdom Report no. M4416B, Syngenta File no. PP901/0631.
Massey JA (1987d), Paraquat/Diquat: Residues in Olives from Trials Carried Out in Spain During 1986, Unpublished Study from ICI Plant Protection Division, Jealott’s Hill Research Station, Bracknell, Berkshire, UK, Report no. M4531B, Syngenta File no. PP148/0637.
Massey JA (1987e), Paraquat: Residues in Lettuce From Trials Carried Out in New York State, USA During 1986, Unpublished Study Submitted by ICI Plant Protection Division, Jealotts Hill Research Centre, Bracknell, United Kingdom Report no. M4539B, Syngenta File no. PP148/0402.
McCall PJ, Laskowski DA, Swann RL and Dishburger HJ (1980), Measurement of Sorption Coefficients or Organic Chemicals and their use in Environmental Fate Analysis, Proceedings of Symposium, Association of Official Analytical Chemists, 94th Annual Meeting, 1980, Washington, Syngenta File no. PP148/1878.
McKenna RH (1966), Bipyridylium Herbicides: Residues of Paraquat in Food Crops from 1964 and 1965 Trials, Unpublished Study Submitted by ICI Plant Protection Division, Jealotts Hill Research Centre, Bracknell, United Kingdom Report no. A126.597, Syngenta File no. PP148/0396.
Moore M (1989), Paraquat: The Statistical Analysis of the Long-Term WRO Soil Residue Trial. Unpublished Study Submitted by ICI Agrochemicals, Jealott’s Hill Research Centre, Bracknell, Berkshire, UK, Report no. M5010B, Syngenta File no. PP148/0622.
Muller, K and Roy, B (1997) Paraquat and diquat: Long-term trial on a soil with a very low SAC-WB at Meckering, Western Australia, 1971-1995: trial description, crop measurements and fate of soil residues. Zeneca Agrochemicals Report TMJ 3653B, Syngenta File No. PP901/0721
Nagra BS and Kingdom NR (2001), Diquat and Paraquat: Residue Levels in Protected Strawberries From Trials Conducted in the UK During 2000, Unpublished Study Submitted by CEM Analytical Services, North Ascot, UK, Report no. CEMR-1301, Syngenta File no. PP901/0724.
paraquat 693
Parker S, and Leahey JP (1988) Paraquat Aqueous Photolysis at pH7, Unpublished Study Submitted by ICI Plant Protection Division, Jealott’s Hill Research Centre, Bracknell, Berkshire, Report no. RJ0663B, Syngenta File no. PP148/0667.
Reichert N (1996), Determination of Diquat and Paraquat in Potato, Peas Seed, Bean Seed and Soil-Validation of the Methods SOP RAM 252/01 and SOP RAM 253/01 by Zeneca Agrochemicals, Unpublished Study Submitted by Institut Fresenius, Chemische and Biologische Laboratorien, GmbH Im Maisel 14 D-6532 Taunusstein, Report no. IF -94/21111-00, Syngenta File no PP901/0742.
Ricketts, D C (1997) Paraquat: study on degradation in microbial cultures. Zeneca Agrochemicals Report RJ 2459B, Syngenta File No. PP148/0553
Robbins AJ, Lane MCG and Riley D (1988), Paraquat: Adsorption and Desorption Equilibrium in Soils, Unpublished Study Submitted by ICI Agrochemicals, Jealott’s Hill Research Centre, Bracknell, Berkshire, Report no. RJ0662B, Syngenta File no. PP148/0554.
Roberts, T R, Dyson, J S, and Lane, M C G (2002) Deactivation of the biological activity of paraquat in the soil environment: a review of long-term environmental fate. J. Agric. Food Chem. 50: 3623-3631, Syngenta File no. ASF 378/0060.
Roper EM (1989a), Gramoxone Super: Residues of Paraquat in Fresh Market and Dried Prunes, Unpublished Study from ICI Agricultural Products, Western Research Center, Richmond, California, USA, Report no. TMU3657B, Syngenta File no. PP148/0440.
Roper EM (1989b), Magnitude of the Residues in Potatoes and Processing Fractions, Unpublished Study Submitted by ICI Agricultural Products, Western Research Center, Richmond, California, USA, Report no. TMR0022B. Report No 771.1996, Syngenta File no. PP148/0387.
Roper EM (1989c), Magnitude of the Residues in Sugar Beet Processing Fractions, Unpublished Study from ICI Agricultural Products, Western Research Center, Richmond, California, USA, Report no. TMR0036B, Syngenta File no. PP148/0384.
Roper EM (1989d), Paraquat: Magnitude of Residues in Hops and Processing Fractions, ICI Agricultural Products, Western Research Center, Richmond, California, USA, Report no. TMR0038B, Syngenta File no. PP148/0471.
Roper EM (1989e), Paraquat: Magnitude of the Residues in Cucumbers, Melons and Summer Squash, Unpublished Study Submitted by ICI Agricultural Products, Western Research Center, Richmond, California, USA, Report no. TMR0017B, Syngenta File no. PP148/0424.
Roper EM (1989f), Paraquat: Magnitude of the Residues in Field Corn Forage, Silage, Kernels and Fodder, Unpublished Study Submitted by ICI Agricultural Products, Western Research Center, Richmond, California, USA, Report no. TMR0040B, Syngenta File no. PP148/0458.
Roper EM (1989g), Paraquat: Magnitude of the Residues in Field Corn Grain and Processing Fractions, Unpublished Study Submitted by ICI Agricultural Products, Western Research Center, Richmond, California, USA, Report no. TMR0046B, Syngenta File no. PP148/0457
Roper EM (1989h), Paraquat: Magnitude of the Residues in Fresh Market Tomatoes, Unpublished Study Submitted by ICI Agricultural Products, Western Research Center, Richmond, California, USA, Report no. TMR0021B, Syngenta File no. PP148/0425.
Roper EM (1989i), Paraquat: Magnitude of the Residues in Olives and Processing Fractions, Unpublished Study from ICI Agricultural Products, Western Research Center, Richmond, California, USA, Report no. TMR0039B, Syngenta File no. PP148/0432.
Roper EM (1989j), Paraquat: Magnitude of the Residues in Sorghum and Processing Fractions, , ICI Agricultural Products, Western Research Center, Richmond, California, USA, unpublished report no. TMR0037B, Syngenta File no. PP148/0461.
Roper EM (1989k), Paraquat: Magnitude of the Residues in Sorghum, ICI Agricultural Products, Western Research Center, Richmond, California, USA, unpublished report no. TMR0050B, Syngenta File no. PP148/0462.
Roper EM (1989l), Paraquat: Magnitude of the Residues in Soybean Forage and Hay: Project ID 148-88-MR-3, Unpublished Study from ICI Agricultural Products, Western Research Center, Richmond, California, USA, Report no. TMR0045B, Syngenta File no. PP148/0412.
Roper EM (1989m), Paraquat: Magnitude of the Residues in Soybean Forage, Hay and Seed: Project ID 4-148-87-18, Unpublished Study from ICI Agricultural Products, Western Research Center, Richmond, California, USA, Report no. TMR0049B, Syngenta File no. PP148/0407.
Roper EM (1989n), Paraquat: Magnitude of the Residues in Soybean Forage, Hay, and Seed, Harvest Aid Use, Unpublished Study Submitted by ICI Agricultural Products, Western Research Center, Richmond, California, USA, Report no. TMR0041B, Syngenta File no. PP148/0413.
Roper EM (1989o), Paraquat: Magnitude of the Residues in Sunflower Forage and Seeds, ICI Agricultural Products, Western Research Center, Report no. TMR0029B, Syngenta File no. PP148/0479.
Roper EM (1989p), Paraquat: Magnitude of the Residues in Turnip Tops, Unpublished Study from ICI Agricultural Products, Western Research Center, Richmond, California, USA, Report no. TMR0030B, Syngenta File no. PP148/0388.
Roper EM (1989q), Paraquat: Magnitude of the Residues in Whole Tomatoes and Processing Fractions, Unpublished Study Submitted by ICI Agricultural Products, Western Research Center, Richmond, California, USA, Report no. TMR0024B, Syngenta File no. PP148/0426.
Roper EM (1989r), Magnitude of the Residues in Sugar Beet Tops and Roots, Unpublished Study Submitted by ICI Agricultural Products, Western Research Center, Richmond, California, USA, Report no. TMR0031B, Syngenta File no. PP148/0384.
Roper EM (1990), Gramoxone Super®: Magnitude of the Residues of Paraquat in Cotton Gin Trash, ICI Agricultural Products, Western Research Center, Richmond, California, USA, Report no. RR90-056B, Syngenta File no. PP148/0481.
paraquat 694
Roper EM (1991a), Stability of Paraquat Residues in Frozen Tomato Samples: 25 Months Storage, (WRC-90-462), ICI Americas, Inc., Western Research Center, Richmond, California, USA, Report No. TMR0226B, Syngenta File No. PP148/1860.
Roper EM (1991b), Stability of Paraquat Residues in Frozen Potato Samples: 25 Months Storage, (WRC-90-463), ICI Americas, Inc., Western Research Center, Richmond, California, USA, Report No. TMR0227B, Syngenta File No. PP148/1861.
Roper EM (1991c), Stability of Paraquat Residues in Frozen Prune Samples: 25 Months Storage, (WRC-90-464), ICI Americas, Inc., Western Research Center, Richmond, California, USA, Report No. TMR0228B, Syngenta File No. PP148/1862.
Roper EM (1991d), Stability of Paraquat Residues in Frozen Corn Grain Samples: 26 Months Storage, (WRC-90-473), ICI Americas, Inc., Western Research Center, Richmond, California, USA, Report No. TMR0231B, Syngenta File No. PP148/1863.
Roper EM (1991e), Stability of Praquat in Frozen Corn Fodder Samples: 26 Months Storage, (WRC-90-474), ICI Americas, Inc., Western Research Center, Richmond, California, USA, Report No. TMR0232B, Syngenta File No. PP148/1864.
Roper EM (1991f), Stability of Paraquat Residues in Frozen Corn Silage Samples: 26 Months Storage, (WRC-90-475), ICI Americas, Inc., Western Research Center, Richmond, California, USA, Report No. TMR0233B, Syngenta File No. PP148/1865.
Roper EM (1991g), Stability of Paraquat Residues in Frozen Corn Forage Samples: 26 Months Storage, (WRC-90-476), ICI Americas, Inc., Western Research Center, Richmond, California, USA, Report No. TMR0234B, Syngenta File No. PP148/1866.
Roper EM (1991h), Stability of Weathered Residues of Paraquat on Birdsfoot Trefoil Forage and Hay in Frozen Storage, (WRC-90-549), ICI Americas, Inc., Western Research Center, Richmond, California, USA, Report No. TMR0267B, Syngenta File No. PP148/1867.
Roper EM (1993), GRAMOXONE EXTRA: Residues of Paraquat in Soybean Grain Dust Following Harvest Aid Application: Lab Project Number PARA -92-PR-01, Unpublished Study from Zeneca Ag Products, Western Research Center, Richmond, California, USA, Report no. RR93-081B, Syngenta File no. PP148/0411.
Roper EM (1994), Gramoxone® Extra: Residues of Paraquat in Cotton Seed Following Pre-Emergence and Pre-Harvest Dessication Applications, Zeneca Ag Products, Western Research Center, Richmond, California, USA, Report no. RR94-038B, Syngenta File no. PP148/0480.
Roper EM (1995), Paraquat: Magnitude of the Residues of Paraquat on Sunflowers from Trials Conducted in the USA During 1994, Zeneca Ag Products, Western Research Center, Report no. RR95-057B, Syngenta File no. PP148/0478.
Roper EM and Elvira DJ (1996), Gramoxone® Extra: Paraquat Residues on Cotton Seed and Gin Byproducts from Trials Conducted in the United States During 1995, Zeneca Ag Products, Western Research Center, Jealott’s Hill Research Station, Bracknell, Berkshire, UK. Report no. RR96-041B, Syngenta File no. PP148/0492.
Ross JA, Tucker BV, White JC et al. (1978), Residues in Sour Cherries, Plums, Grapes, Pecans, Filberts, Lemons, and Oranges Resulting From the Application of Simazine in Tank Mixture with Paraquat, Unpublished Study Submitted by Ciba-Geigy Corporation, Greensboro, North Carolina, USA, Report no. ABR-78042, Syngenta File no. ASF378/0049.
Slade P (1965), Photochemical Degradation of Paraquat, Unpublished Study Submitted by ICI Agricultural Division, Jealott’s Hill Research Centre, Bracknell, Berkshire, UK, Report no. RIC2610, Syngenta File no. PP148/0669.
Spillner C, Miller M, Collins R and Robbins J (1998), Paraquat: Residue Levels on Processed Commodities of Grapes From a Trial Carried Out in California During 1997, Unpublished Study from Zeneca Ag Products, Western Research Center, Richmond, California, USA, Report no. RR 98-024B, Syngenta File no. ASF378/0048.
Spillner CJ, Miller MM and Robbins JD (1999), Paraquat: Residue Levels in Soybeans from Trials Carried Out in the United States During 1997 and 1998, Unpublished Study from Zeneca Ag Products, Western Research Center, Richmond, California, USA, Report no. RR98-066B, Syngenta File no. PP148/0408.
Spinks C et al. (1976), Paraquat: Metabolism and Residues in Pigs using 14C-Ring Labelled Paraquat, Unpublished Study Submitted by ICI Plant Protection Division, Jealott’s Hill Research Centre, Bracknell, Berkshire, Report no. AR 2692 A, Syngenta File No. PP148/0497.
Stevens JEB and Bewick DW (1991), Paraquat: A Survey of Residues and Deactivation Capacities of Soils in the United Kingdon, Unpublished Study Submitted by ICI Agrochemicals, Jealott’s Hill Research Centre, Bracknell, Berkshire, Report no. RJ0594B, Syngenta File no. PP148/0628.
Stevens JEB, Bewick DW and Palmieri R (1988), Paraquat: A Survey of Residues and Deactivation Capacities of Soils in Italy, Unpublished Study Submitted by ICI Agrochemicals, Jealott’s Hill Research Centre, Bracknell, Berkshire, Report no. RJ0654B, Syngenta File no. PP148/0613.
Swain H (1983a), Paraquat Residue Data on Onions From Trials Carried Out During 1983 in West Germany, Unpublished Study Submitted by ICI Plant Protection Division, Jealotts Hill Research Centre, Bracknell, United Kingdom Report no. PP148B033, Syngenta File no. PP148/0385.
Swaine H (1983b), Paraquat Residue Data on Carrots from Trials Carried Out During 1983 in West Germany, Unpublished Study Submitted by ICI Plant Protection Division, Jealotts Hill Research Centre, Bracknell, United Kingdom, Report no. PP148B035, Syngenta File no. PP148/0381.

paraquat 695
Swaine H (1983c), Paraquat Residue Data on Lettuce From Trials Carried Out During 1983 in West Germany, Unpublished Study Submitted by ICI Plant Protection Division, Jealotts Hill Research Centre, Bracknell, United Kingdom Report no. PP148B034, Syngenta File no. PP148/0401.
Upton BR, Hendley P and Skidmore MW (1985), Paraquat: Hydrolytic Stability in Water at pH 5, 7 and 9, Unpublished Study Submitted by ICI Plant Protection Division, Jealott’s Hill Research Centre, Bracknell, Berkshire, UK, Report no. RJ0436B, Syngenta File no. PP148/0666.
Vickers JA, Hurt AD and Bewick DW (1989), Paraquat: Degradation in Aerobic Soil, Unpublished Study Submitted by ICI Agrochemicals, Jealott’s Hill Research Centre, Bracknell, Berkshire, UK, Report no. RJ0788B, Syngenta File no. PP148/0539.
Vickers JA, Hurt AD and Bewick DW (1990), Paraquat: Rotational Crop Study, Unpublishe Study Submitted by ICI Agrochemicals, Jealott’s Hill Research Centre, Bracknell, Berkshire, Report no. RJ0867B, Syngenta File No. PP148/0494.
Whipp AA and Kalens KJ (1972), Summary of Residue Test Data for the Tank-Mixture of Paraquat CL Spray and Cotoran 80 W (Fluometuron) on Cotton, unpublished study from Chevron Chemical Company, Richmond, California, USA. Report No CCI-1973, Syngenta File no. ASF378/0040.
Wilkinson W (1980), Paraquat and Diquat: Long-Term, High-Rate Trial, Frensham, UK 1. Management of Site, Effects on Crops and Weeds and Residues in Crops, Unpublished Study Submitted by ICI Agrochemicals, Jealott’s Hill Research Centre, Bracknell, Berkshire, UK, Report no. RJ0013B, Syngenta File no. PP148/0662.
Wollerton C (1987), Paraquat Manufacturing Use Product: Physico-Chemical Data File, Unpublished Study From Syngenta Crop Protection, Jealott’s Hill Research Centre, Bracknell, Berkshire, UK, Report no. RJ0533B, Syngenta File No. PP148/0066.
Wright KA and Cain RB (1989), Microbial Metabolism of Pyridinium Compounds: Radioisotope Studies of the Metabolic Fate of 4-carboxy-1-methylpyridinium chloride, Biochem. Journal, Volume 128, pp 561-568, Syngenta File no. ASF378/0035.
Cross Reference Anderson & Agarwal 1996 1 NET
2 NET 3 NET 4 NET 5 ST 6 ST
Anderson & Earl 1993 ES10-91H008 ES10-91H108 ES10-91H208 ES10-91H308 ES10-91H408 ES10-91H508
Anderson & Lant 1994 IT10-93-H385 IT10-93-H386
Anderson et al. 1995 IT10-93-H370 IT10-93-H371
Anon 1975a T-1863 T-1864 T-1865 T-1866 T-1867 T-1868 T-2004 T-2005 T-2778 T-2779 T-2780 T-2977 T-3129 T-3130 T-3131
Anon. 1975b T-2639 T-2640 T-2958 T-2967
Anon 1985 M209-4642 M209-4641 M209-5650 M209-5651 M209-5649 M209-5583
Benet 1989 FR 10/88H Brown 1994a AU10-94-H105 Brown 1994b AU10-93-E204 Carringer & Yuen 2001 PARA-00-MR-01-343
PARA-00-MR-01-344 PARA-00-MR-01-345 PARA-00-MR-01-346 PARA-00-MR-01-347 PARA-00-MR-01-348 PARA-00-MR-01-349 PARA-00-MR-01-350 PARA-00-MR-01-351 PARA-00-MR-01-352 PARA-00-MR-01-353 PARA-00-MR-01-354
paraquat 696
Chevron 1966 T-653 T-654 T-655 T-656 T-657 T-659 T-654 T-653 T-742 T-743 T-745 T-746 T-747 T-749 T-938 T-939 T-786
Chevron 1967 T-383 T-614 T-771 T-1123 T-1124 T-1125
Chevron 1970 T-1403 T-1839 T-1838 T-1837
Chevron 1972b WC-98 WC-127
Chevron 1975a T-2185 T-2186 T-2392 T-2393 T-2394 T-2679 T-2680 T-2681 T-2682 T-2683 T-2684 T-3069 T-3070 T-3071 T-3126 T-3127
Chevron 1975b T-2228 T-2229 T-2230 T-2231 T-2789 T-2790 T-2791 T-2792 T-3106 T-3108
Chevron 1975c T-2866 T-2867 T-2872 T-2875 T-2877 T-3148 T-3333 T-2868 T-2869 T-2873 T-3152 T-3332
Chevron 1985 T-3402A T-3402A T-3996 T-4145 T-4147 T-4191 T-4192 T-4193 T-4194 T-4716 T-4717 T-4729 T-4730 T-4767 T-4811 T-4812 T-4813 T-4818 T-4858 T-4859 T-4860 T-4861 T-4862 T-4949 T-4950 T-5001 T-5002 T-5003 T-5007 T-5011 T-5012 T-5013 T-5014 T-5015 T-5016 T-5017 T-5022 T-5023 T-5218
Chevron 2001 T-321 T-326 T-333 T-345 T-603 T-609 T-630 T-631 T-648 T-758 T-903 T-936 T-1088 T-1089 T-1090 T-1110 T-6617
Coombe & Gallardo 1999 ES10-98-SH015 ES10-98-SH115
Devine & Balluff 2002a S01W031R Devine & Balluff 2002b G01W054R Devine & Balluff 2002c G01W056R Devine & Balluff 2002d S01W033R Devine & Balluff 2002e F01W039R
G01W058R G01W059R
Devine & Orellana 2003a AF/6396/SY/1

paraquat 697
Devine & Orellana 2003b AF/6397/SY/1 Devine & Poppezijn 2003 CEMS-1839/01 Devine et al. 2003 ES051-01-S013
ES060-01-S113 ES050-01-S213 ES052-01-S313
Dick et al. 1995a IT10-93-H338 IT10-93-H339
Dick et al. 1995b IT10-93-H348 IT10-93-H349
Earl & Anderson 1992a RS9022E1 RS9022E2 RS9022E3 RS9022E4 RS9022E5 RS9022E6 RS9023B1 RS9023B2 RS9023B3 RS9023B4 RS9023E1 RS9023E2 RS9023E3 RS9023E4 RS9023G1 RS9023G2 RS9023G4
Earl & Muir 1988 88JH402 Florida Dep. of Agri. 1978 T-4574
T-4575 T-4576 T-4577 T-4578 T-4580 T-4581
Gatti 1987 60/86/1 Jones 2000a ES50-99-S033
ES50-99-S133 Jones 2000b AF/4714/ZE/1 Jones 2000c AF/4715/ZE/1 Jones 2000d AF/4716/ZE/1
AF/4716/ZE/2 Jones & Cowley 1999 AF/4148/CE/1
AF/4148/CE/2 Kalens et al. 1971 T-1286
T-1287 T-1288 T-1289 T-2155 T-2156 T-2157 T-2159
Kennedy 1984b RS8372B1 RS8372B2 RS8372B3 RS8372B4 RS8372E1 RS8372E4 RS8427B5 RS8427E4
Kennedy 1985 INT H 11.85 Kennedy 1987 VG-H.1 Lurvey 1996 92:CA:126
92:CA:125 Lurvey 1997 93-ID04
93-WA32 Markus 1993a AU10-93-H206
Markus 1993b MAP-GRA-92 Massey 1987a RS8423B3
RS8423E3 RS8427B4 RS8427E2
Massey 1987b RS8423B2 RS8423B4 RS8423E5
Massey 1987c RS8423B1 RS8423E1 RS8423E2 RS8427B1 RS8427B3 RS8427E1
Massey 1987d VG-H.2 Massey 1987e 34NY86-014R
34NY86-015R Nagra & Kingdom 2001 TN-00-003
TN-00-004 TN-00-005
Roper 1989a 45CA-87-523 45CA-87-599
Roper 1989b 16ID88-400 56ME88-401
Roper 1989c 16ID88-599 Roper 1989d 15ID88-591
15WA88-592 Roper 1989e 19CA-88-428
19CA-88-429 18CA-88-430 18CA-88-431 19CA-88-432 19CA-88-433 17CA-88-434 17CA-88-435 18CA-88-436 18CA-88-437 18CA-88-438 17CA-88-439
Roper, 1989f A1IA-87-538 71MI-87-539 64SD-87-540 92NB-87-541 A1WI-87-543 US04-87-544 83GA-87-557 61NC-87-558 72TX-87-559
Roper 1989g 35IN-88-440 21IL-88-441 41NB-88-442 25OH-88-443 46SC-88-444 47NC-88-445 46SC-88-446 36IA88-791
Roper 1989h 75FL-87-517E 45CA-87-518
Roper 1989i 73CA-88-526

paraquat 698
Roper 1989j 11TX88-793 41NB88-794
Roper 1989k 72TX-87-570 92NB-87-571 48KS-87-572 64SD-87-573 64SD-87-573E 92NB-87-574 92NB-87-574E 06MO-87-575 38AX-87-576 62AL-87-578 06AR-87-579 US01-87-580 US04-87-581 23IN-88-584 48MS-88-585 38MN-88-787
Roper 1989l
27OH-88-788 Roper 1989m 92NB-87-560
US04-87-561 A1IA-87-562 36LA-87-563 US05-87-564 48MO-87-565 06AR-87-566 62AL-87-567 83GA-87-568 44DE-87-569
Roper 1989n 22IL-88-458 36IA-88-459 23IN-88-460 48MS-88-461 40MO-88-462 33MN-88-463 27OH-88-464 22IL-88-536 36IA-88-537 24IN-88-538 48MS-88-539 37MO-88-540 30MN-88-541 27OH-88-542
Roper 1989o 31SD-88-475 34ND-88-476 34ND-88-528 31SD-88-529 33MN-88-530 10TX-88-531
Roper 1989p 44AL-88-410 45GA-88-411 18CA-88-413 42FL-88-414 43TN-88-415 12TX-88-416
Roper 1989q 18CA88-789 18CA88-790
Roper 1989r 33MN88-405 33ND88-406 17CA88-403 34ND88-407 16ID88-404 73CA88-402
Roper 1990 10TX-89-481 10TX-89-482 11TX-89-483 12TX-89-484 13OK-89-485 14TX-89-486 14TX-89-487 19CA-89-488 19CA-89-489
Roper 1994 13-NM-93-371 13-TX-93-372 25-TX-93-373
Roper 1995 34ND-94-202 34SD-94-203
Roper & Elvira 1996 01-NC-95-651 69-LA-95-652 05-MS-95-653 50-TN-95-654 25-TX-95-655 23-NM-95-656 23-TX-95-658 23-TX-95-659 02-CA-95-660 14-CA-95-661 14-AZ-95-662 23-OK-95-663
Spillner et al. 1998 02-CA-97-601 Spillner et al. 1999 01-NC-97-610
50-TN-97-611 49-AR-97-612 69-LA-97-613 63-IA-97-615 63-IA-97-616 63-IA-97-617 04-IL-97-618 60-IL-97-619 60-IL-97-620 67-IN-97-621 67-IN-97-622 37-KS-97-623 36-MN-97-624 37-MO-97-625 68-NE-97-626 89-OH-97-627 34-SD-97-628 79-WI-97-629 05-MS-97-631 68-NE-97-632 79-WI-97-633
Swaine 1983a RS8378 B4 RS8378 E2 RS8378 E3
Swaine 1983b RS8378B2 RS8378E4 RS8378E5
Swaine 1983c RS8378B1 RS8378B2 RS8378B3
Whipp & Kalens 1972 T-2151 T-2152 T-2153 T-2154