pars: county of contra costa fourth quarter 2018
TRANSCRIPT

PARS: County of Contra Costa
Fourth Quarter 2018
Presented by
Andrew Brown, CFA

This presentation has been prepared for the sole use of the intended
recipient. While the information contained herein has been obtained from
sources believed to be accurate and reliable, any other reproduction or use of
this information may necessitate further disclosures in order to ensure that
the presentation is accurate, balanced, and conforms to all applicable
regulatory requirements.

DISCUSSION HIGHLIGHTS
U.S. Economic and Market Overview
In contrast to 2017’s ultra-low volatility market environment, the pendulum swung in the other direction entering 2018 from a steady freight train of
returns into a roller coaster. Only a few weeks into 2018, escalating concerns over rising inflation expectations disrupted the tranquility investors
enjoyed throughout the prior year. Leading up to the first equity market correction in late January 2018, the S&P 500 Index had not experienced a
drop of more the 1% for a record 112 trading days.
Worries about inflation faded through the second and third quarters as domestic business and consumer optimism soared. The domestic equity
market rallied over the summer on a fragile foundation of sanguine expectations that government policy (both trade and monetary) would not
interfere with the economic mojo set in motion by a massive corporate and personal tax cut.
Early in the fourth quarter major cracks started to appear in this foundation as investor confidence was shaken by recently appointed Federal
Reserve (“Fed”) Chairman Jay Powell when he declared during an interview that interest rates were “a long way from neutral.” The hawkish tone
did not sit well with investors and the equity market slide began.
Fearing the world’s largest central bank no longer had the stock market’s back, the S&P 500 Index would mark an all-time high close of 2930 on
September 20th and, over the course of the quarter, fall to within a hair of an official bear market (a decline of 20% from a peak) before rallying
after Christmas. The ups and downs throughout the year netted a -4.4% annual return for the index including dividends – the benchmark’s first
calendar year loss since 2008. In a traditional flight to safety trade, Treasury bonds rallied and credit spreads widened.
Chairman Powell, perhaps recognizing the gravity of his comments and the potential for financial market volatility to spill over into the real
economy, attempted to backtrack in a speech to the Economic Club of New York, saying that “[interest rates] remain just below the broad range
of estimates of the level that would be neutral for the economy.”
Increasing monetary policy uncertainty was only one punch in the combination that investors endured in the final quarter of the year. The cloud of
a trade war also weighed heavily on sentiment with daily headlines creating large market swings in both directions. Of course, one of the very last
statements market participants wanted to see following what appeared to be a productive G20 summit in early December was a provocative
President Trump tweet “…I am a Tariff Man.” Yet that is exactly what occurred, keeping the equity market on its heels leading up to the Federal
Open Market Committee’s (FOMC) final meeting of the year.
3
PARS: County of Contra Costa

Confronted with an equity market approaching bear market territory, the Fed pressed on with its fourth Fed Funds rate increase of the year and
its ninth since moving off the zero bound in December 2015. Further compounding investor concerns, the Fed continued to forecast the need for
future hikes – a policy path the market clearly felt was missing signs that the global economy was softening. Despite Chairman Powell’s attempts
to qualify that these projections were subject to “data dependence” and “highly uncertain,” it did not stop market anxiety from deepening. In an
unusual move, the President broke with protocol and openly criticized the Fed Chairman by declaring that monetary policy was the “only
problem” with the economy.
Amid swirling policy uncertainty, global financial markets enter 2019 with a growing wall of worry that has the potential to keep volatility elevated
for the foreseeable future. The good news is that policy is controllable and correctable. The big question for the New Year is how quickly a course
correction can be taken before more permanent damage is done.
Market overview/Performance Discussion
Total Plan
The County of Contra Costa OPEB Plan returned -7.40% net of investment fees in the fourth quarter, which lagged the Plan Benchmark return of
-7.04%. What can you say when the best performing equity segment for the quarter came from REITs, which declined only by -6.15%? It was a
difficult quarter to say the least. The majority of the Plan’s equity segments outperformed their benchmark targets, however for the fourth quarter,
this merely translated into losing less than the benchmark. There is little solace or exuberance when the Plan’s small cap stocks decline -19.89%
compared to the Russell 2000 Index return of -20.2%. Alternatives outperformed their Plan target, but still posted a negative return of -1.11%
for the quarter. One positive sign to note, in the month of December when equity markets were significantly down, all three of the alternative
managers posted a positive return. One of the expectations from the alternative segment is that in times of significant turbulence, alternatives
might provide ‘crisis alpha’. Rarely do we highlight one month of returns, as it does not lend itself to drawing any type of a trend, but it was a
welcome sign after the last few quarters. Fixed income was the highest returning segment for the quarter, returning 1.38% relative to the
Bloomberg Barclays US Aggregate Index target of 1.64%. Both the internally managed core fixed income portfolio, and our outside fixed income
money managers (Pimco, and Prudential) maintained and overweight allocation to corporate bonds, which were under pressure during this risk
off period.
4
PARS: County of Contra Costa

Domestic Equity
The market as measured by the S&P 500 delivered the second largest decline since the fourth quarter of 2008 falling -13.5%. Most US economic
data remained solid for the quarter. Domestic Purchasing Managers’ Index (PMI) Data was comfortably above the neutral 50 mark. Initial Jobless
Claims held steady. The change in Average Hourly Earnings was noteworthy, accelerating from 2.8% to 3.2%. There were some areas of
weakness though. Housing continued to soften, retail sales slowed, and credit conditions tightened modestly. Overall, the economic backdrop
was supportive. Rather than focusing on the positive elements of the economy, investors instead focused on the Fed’s continued tightening bias,
the US/China trade conflict, and the government shutdown as chief concerns that might impact future growth and put an end to the bull market.
The market succumbed to these concerns and brushed up against bear market territory with a decline of nearly 20% from September’s peak.
The fundamental data for the market decline was evidenced by the reduced S&P 500 2019 earnings growth expectations. In October of 2018,
analysts expected 2019 S&P 500 earnings to grow about 9.5%. Steady revisions lower over the last three months have reduced expected 2019
earnings growth to the low-6% range as of the end of January. Compared to the reduced earnings estimates, the market overshot to the
downside. As a result, the market decline served up cheaper valuations. The S&P 500 price-to-earnings multiple (P/E) sits at 15.4x, right at its
long-term average. Highlighting the divergence in asset classes, the P/E of small cap value (as measured by the Russell 2000 Value index) is
now 20% below the medium and is near its 10-year low!
From an asset class style perspective, value finally outperformed growth after seven consecutive quarters of growth outperformance. Small cap
stocks (Russell 2000 Index) led the decline falling over -20%. The sectors that outperformed were utilities up 1.4% and consumer staples down
only -5.2%. Energy and information technology declined the most at -17.3% and -23.8% respectively. In short, the market sold risk and bought
safety during the quarter.
Our equity market outlook remains unchanged. In our view, recent market turbulence reflects more of a market event than an economic event; in
other words, a correction without a recession. We have been more conservative than consensus views regarding domestic economic growth,
earnings power, and potential market returns largely because equity markets were underappreciating the trade conflict, tightening monetary
policy, and increased political uncertainty. Positive returns are possible going forward but potential headwinds from higher rates and slower
growth will dampen the upside potential.
5
PARS: County of Contra Costa

• The Plan’s large cap equity segment returned -14.11% in the quarter, which trailed the Russell 1000 Index return of -13.82%.
• The iShares Russell 1000 ETF -13.82% in the quarter.
• The Columbia Contrarian Core Fund returned -14.78% in the quarter, which lagged the benchmark. The Fund ranked in the 77th
percentile of the Morningstar Large Cap Blend Universe.
• The Harbor Capital Appreciation Fund returned -16.39% in the quarter, which lagged the Russell 1000 Growth Index’s return of
-15.89%. The Fund ranked in the 69th percentile of the Morningstar Large Cap Growth Universe.
• The T. Rowe Price Growth Stock Fund returned -14.1% in the quarter, which exceeded the Russell 1000 Growth Index. The Fund
ranked in the 25th percentile of the Morningstar Large Cap Growth Universe.
• The Dodge and Cox Stock Fund returned -13.57% in the quarter which trailed the Russell 1000 Value Index’s return of -11.72%. The
Fund ranked in the 64th percentile of the Morningstar Large Cap Value Universe.
• The Vanguard Growth and Income Fund registered a -14.22% return in the quarter, which lagged the Russell 1000 Index. The Fund
ranked in the 65th percentile of the Morningstar Large Cap Blend Universe.
• The mid cap equity segment returned -15.11% in the quarter, which slightly exceeded the Russell Mid Cap Index return of -15.37%.
• The iShares Russell Mid Cap ETF returned -15.33% in the fourth quarter.
• The small cap equity segment returned -19.89% in the quarter, which slightly exceeded the Russell 2000 Index return of -20.20%.
• The iShares Russell 2000 ETF returned -20.21% in the fourth quarter.
• The T. Rowe Price New Horizons Fund returned -17.01% in the quarter, and outperformed the Russell 2000 Growth Index return of
-21.65%. The Fund ranked in the 47th percentile of Morningstar’s Small Cap Growth Universe.
• The Undiscovered Managers Behavioral Value Fund returned -20.42% in the quarter, and lagged the Russell 2000 Value Index’s
return of -18.67%. The Fund ranked in the 68th percentile of Morningstar’s Small Cap Value Universe.
6
PARS: County of Contra Costa

Real Estate
With the Dow Jones Wilshire REIT Index returning -6.93% for the quarter, REITs had the dubious distinction of being the strongest returning
equity segment within the Plan for the fourth quarter. Only two sub-industries within the index registered positive returns in the quarter:
healthcare (+3.34%) and self-storage (+2.09%). Large declining sub-industries included lodging and leisure (-20%), data centers (-13.31%),
office (-11.97%), and shopping centers (-9.30%). A -6.93% return is far from providing immunity to the Plan in a volatile quarter, but the relative
outperformance likely stems from both the ‘hard asset” nature of REITs and strong cash flow dynamics of the sector. Employment data, gains in
corporate earnings, and GDP growth, all have been supportive to REIT fundamentals.
The Vanguard REIT ETF returned -6.46% which ranked in the 34th percentile.
International/Global Equity
International equity markets were also lower for the quarter. Developed international markets declined slightly less than the Russell 1000, with
the MSCI-EAFE Index returning -12.54%, and emerging markets performed relatively better, declining “only” -7.47%. The end of quantitative
easing in Europe was a factor for the declines. But the dominant theme for international weakness was the China trade conflict. China had
already begun slowing with expected GDP growth for the fourth quarter decelerating to 6.4%, and for 2020, expectations were calling for a
decline to 6% growth. Concerned about the slowdown, China announced a number of fiscal and monetary policy stimulus measures, including
tax cuts and a mandate for banks to lend to small businesses.
As the world’s second largest economy and a major source of global demand, China’s slowdown is by no means isolated to its economy. Ripple
effects are being felt throughout the global economy. During a European Central Bank (ECB) press conference announcing the end of
Quantitative Easing (QE) in Europe, President Mario Draghi warned “…the balance of risks is moving to the downside owing to the persistence of
uncertainties related to geopolitical factors, the threat of protectionism, vulnerabilities in emerging markets and financial market volatility remain
prominent.” (In case you missed it, he basically said “trade war” four separate ways.) The ECB’s plan to gently slow growth by ending QE turned
into a hard brake with the trade war being added to the mix.
Currently, the U.S. is applying tariffs on $253 billion of Chinese- made goods, or roughly half of total imports from China. Trump and Xi at the G20
summit in December yielded a cease-fire allowing additional time for negotiation. The tariffs on an additional $257 billion of Chinese imports the
administration planned to raise were delayed by 60 days. The truce will end March 1 when the final round of tariffs will go into effect if a deal is
not reached. The ongoing trade dispute between the world’s two largest economies has remained the focal point of global financial markets.
Timing of the tariff implementations have coincided almost perfectly with the deterioration in the Purchasing Manger Indices (PMI’s) data over the
past six months with the most recent December reading for China now in contraction territory. Optimism for a deal has increased as the
slowdown has brought both parties to the negotiating table.
7
PARS: County of Contra Costa

In the international developed markets, all major markets were lower with Japan (-16.91%), Germany (-13.78%), and France (-13.56%)
representing the largest declines. The outperformers were Switzerland and Spain, both lower by slightly less than -8%. Emerging markets fared
similarly, with the more trade sensitive markets suffering the most with declines in Mexico (-15.38%), Taiwan (-13.09%), Korea (-12.70%), and
China (-11.64%). A regime change in Brazil brought out-sized gains for the quarter (+10.77%), and Indonesia rebounded with the prospect of
stimulus (+3.94%).
• The Plan’s international/global equity segment returned -12.28% in the quarter. This return outperformed the MSCI EAFE Index
-12.54% and the MSCI ACWI Index return of -12.75%.
• The iShares MSCI EAFE Index ETF returned -12.59% in the quarter.
• The Dodge & Cox International Stock Fund returned -12.39% in the quarter and slightly outperformed the MSCI EAFE Index. The
Fund ranked in the 43rd percentile of the Foreign Large Blend Universe as measured by Morningstar.
• The MFS International Fund returned -11.74% in the quarter and outperformed the MSCI EAFE Index. The Fund ranked in the 19th
percentile for foreign large cap growth managers as measured by Morningstar.
• The iShares MSCI ACWI Index ETF returned -12.73% in the quarter.
• The American Funds New Perspective Fund recorded a -13.15% return in the quarter, which underperformed the MSCI ACWI Index
and ranked in the 50th percentile within the Morningstar World Stock Universe
• The MFS Global Equity R6 Fund returned -13.30%, which underperformed the benchmark and ranked in the 53rd percentile of the
Morningstar World Stock Universe.
• The Hartford Schroders Emerging Market Equity Fund returned -8.85% during the quarter and underperformed the MSCI Emerging
Market benchmark return of -7.47%. The Fund ranked in the 74th percentile of the Morningstar Emerging Market Universe.
• The DFA Large Cap International Fund returned -13.29% in the quarter. We initiated a position in this new manager in the last
week of the quarter.
Fixed Income
As expected, the Federal Reserve raised the funds rate once again in December, to a range of 2¼% to 2½%, the ninth quarter-point increase
since the Fed began tightening three years ago. However, by the time of the FOMC meeting in mid-December, treasury yields had fallen more
than 40 basis points from their peak as slower global growth and persistently low inflation led investors to believe that the Fed was nearing the
end of their tightening campaign. The Fed’s insistence on continuing to raise rates contributed to growing fears that the Fed was about to make a
mistake by tightening too much and causing a recession. The result was a nearly 20% decline in the S&P 500, and a furious Treasury bond rally
that took the ten-year Treasury yield from 3¼% to 2½% during the fourth quarter. Although it was a difficult year for investors as most asset
classes experienced negative returns, the Bloomberg Barclays U.S. Aggregate Index gained 1.6% for the quarter, and a barely positive 0.01%
return for the year.
8
PARS: County of Contra Costa

Fixed Income (Cont.)
U.S. Treasury securities were one of the few asset classes with positive returns this year, gaining 2.6% for the quarter and 0.9% for the year,
despite four hikes in the fed funds rate. Investment-grade corporate bonds, on the other hand, were quite volatile during the year,
underperforming comparable duration Treasuries in three of the four quarters, resulting in the worst relative annual performance since 2011,
when fears of a break-up of the euro zone drove Greek bond yields above 20%. Lower quality bonds outperformed for much of the year, but that
quickly reversed during the fourth quarter as lower quality issues significantly underperformed. High yield bonds, for example, finished the third
quarter +327 basis points ahead of similar duration Treasuries, but finished the year –358 basis points behind, a massive shift of nearly –700
basis points in only three months. High yield bonds, for example, finished the third quarter +327 basis points ahead of similar duration Treasuries,
but finished the year –358 basis points behind, a massive shift of nearly –700 basis points in only three months.
While there was no European debt crisis this year, clearly something caused investors to suddenly avoid risk in the fourth quarter. It seems
unlikely that the concern is due to the current state of the economy, as unemployment is near the lowest in 50 years, consumer and business
confidence is high, while corporate earnings are expected to be nearly 20% higher for the year. The sudden risk aversion is more likely a result
of rising rates combined with much higher debt levels. Investment-grade corporate debt has grown from $2.3 trillion to $6.4 trillion in the last ten
years, while total corporate debt is at an all-time high of 46% of GDP. In addition, U.S. Treasury debt has exploded from $5.8 trillion in 2008 to
$15.8 trillion today, equating to 76% of GDP this year, and an expected 100% of GDP in a little over ten years, as the debt continues to grow.
Projected federal budget deficits of $1 trillion are adding significantly to the demand for funds, while the fed continues to reduce their securities
portfolio at a $600 billion annual pace. A highly levered economy is more sensitive to both slower growth and higher rates since elevated debt
levels result in an ever growing proportion of income going to debt service. Investors are therefore understandably nervous over the Fed’s plans
for tighter monetary policy and/or any signs of slower growth.
This sudden aversion to risk was the primary reason the Plan’s fixed income portfolio underperformed this quarter. The portfolio was overweight
corporate bonds during a quarter in which investment-grade corporates lagged Treasuries by -308 basis points, the worst performance since the
third quarter of 2011. At the end of the third quarter, year-to-date investment-grade corporate bond returns were nearly the same as Treasuries,
but the severe underperformance during the fourth quarter caused corporate bonds to finish the year –315 basis points behind Treasuries.
Usually such sudden and dramatic underperformance is a result of some event or crisis, or the onset of a recession, but there was nothing
particularly alarming to point to this time. The Plan’s duration was shorter than the benchmark, which was a positive for the first three quarters of
the year, however the aversion to risk during the fourth quarter drove Treasury yields about 40 basis points lower, causing a slight
underperformance. Somewhat offsetting the negative impact of a shorter duration was the focus on the intermediate part of the curve where
rates declined even more than for longer maturities.
9
PARS: County of Contra Costa

• The Plan’s fixed income segment returned 1.38% in the quarter, which trailed the Bloomberg Barclays Aggregate Index return of
1.64%.
• The separately managed fixed income portfolio returned 1.38% which lagged the benchmark. The portfolio would have ranked
approximately in the 32nd percentile of the Morningstar Intermediate Term Bond Universe.
• The PIMCO Total Return Bond Fund posted a 1.39% return in the quarter, which placed it in the 32nd percentile of Morningstar’s
Intermediate-Term Bond Universe. The Fund underperformed the Index.
• The Prudential Total Return Bond Fund returned 1.36% in the quarter. This ranked in the 33rd percentile of Morningstar’s Intermediate-
Term Bond Universe and underperformed the benchmark.
Alternative Investments
The Alternatives portion of the Plan returned -1.11% and outperformed the Wilshire Liquid Alternative Index return of -3.72%. According to the
managers of The Eaton Vance Global Macro Fund, the team completed their worst year in 20 years (-0.9% for the quarter, -3.29% calendar
year return). Argentinian investments hurt the Fund twice in the year. A long position in the Argentine Peso was negatively impacted in May
when the IMF began to lend support to the economy (offering austerity measures), this led to locals pulling their local savings – which led to the
currency falling over 30%. In the fourth quarter, political fall-out led to another decline in the currency. In the fourth quarter, long currency
positions in Iceland also saw weakness when the country enacted restrictions on foreign inflows into the currently, but maintained no restrictions
on outflows – which led to the currency being suppressed. On a more positive note, long Japanese Yen positions and long positions in Turkish
credit aided returns in the quarter. The AQR Market Neutral Fund (-1.79%) declined in the quarter, however in the month of December the Fund
returned +3.67%. Normally we do not highlight a one-month return period, but in that December saw the Russell 1000 decline -9.11%, the
theoretical hedge that this Fund offers was welcomed. The manager’s tilt toward high quality stocks (long positions) added to performance. The
negative performance during the quarter was driven largely by sentiment factors and momentum. The Blackrock Strategic Income Fund returned
-0.52%, the manager’s update was not available at the time of this report.
10
PARS: County of Contra Costa

•The alternative investment segment returned -1.11% in the fourth quarter, which exceeded the Wilshire Liquid Alternatives
Index return of -3.72%.
• The AQR Market Neutral Fund returned -1.79%, which ranked in the 64th percentile of Morningstar’s Market Neutral Universe.
The fund exceeded the benchmark.
• The BlackRock Strategic Income Opportunity Fund returned -0.52%, which exceed the benchmark, and ranked in the 30th
percentile of Morningstar’s Non-Traditional Bond Universe.
• The Eaton Vance Global Macro Absolute Return Fund declined -0.90% which ranked in the 37th percentile of Morningstar’s Non-
Traditional Universe
Asset Allocation/Portfolio Transitions
During the quarter we added the DFA Large Cap International Fund as a new manager within international equities. This Fund replaced the
Nationwide Bailard Fund, which was eliminated in the third quarter.
Small cap equities were reduced by -1.0%, and the global equity position was reduced by -0.5%. We added +0.5% to the REIT position, and we
increased large cap domestic by +0.25% and domestic fixed income by +0.25%. Cash also was increased by +0.5%.
11
PARS: County of Contra Costa

Manager Watch List
Name of Fund Date on watch list Date exiting watch list Recommendation Rationale
Columbia Contrarian Core Fund 3Q 2018Retain on Watch List
Annualized return trails the benchmark or
median return trails on a 3-year basis for
more than three consecutive quarters
Dodge & Cox International 3Q 2018Retain on Watch List
Three-year return is now ahead of the
benchmark target, as well, the fund ranks
in the 40th percentile over the previous 3-
year period. The calendar year peer
ranking is in the 81st percentile leads us to
maintain the manager on watch list for the
quarter.
AQR Equity Market Neutral I 3Q 2018Retain on Watch List
Unusual tracking error to the benchmark
12
PARS: County of Contra Costa

13
PARS: County of Contra Costa
9/30/2018 9/30/2018 12/31/2018 12/31/2018 Target
Asset Allocation Market Value % of Total Market Value % of Total Allocation
Large Cap Equities
Columbia Contrarian Core Inst3 8,276,291 3.0% 7,792,539 3.0% --
iShares Russell 1000 ETF 18,494,126 6.7% 17,296,307 6.7% --
Vanguard Growth & Income Adm 8,978,634 3.3% 9,111,140 3.5% --
Dodge & Cox Stock Fund 8,230,822 3.0% 7,812,908 3.0% --
Harbor Capital Appreciation Retirement 2,785,457 1.0% 2,606,511 1.0% --
T. Rowe Price Growth Stock Fund 2,772,223 1.0% 2,604,296 1.0% --
Total Large Cap Equities 49,537,552$ 18.0% 47,223,700$ 18.2% 17.0%
Range Range 13-32%
Mid Cap Equities
iShares Russell Mid-Cap ETF 15,038,541 5.5% 14,579,242 5.6% --
Total Mid Cap Equities 15,038,541$ 5.5% 14,579,242$ 5.6% 6.0%
Range Range 2-10%
Small Cap Equities
iShares Russell 2000 ETF 15,025,221 5.5% 13,267,214 5.1% --
Undiscovered Managers Behavioral Val R6 8,209,000 3.0% 6,457,264 2.5%
T. Rowe Price New Horizons Fund 4,160,613 1.5% 3,913,613 1.5% --
Total Small Cap Equities 27,394,834$ 10.0% 23,638,091$ 9.1% 8.0%
Range Range 4-12%
International Equities
DFA Large Cap International I -- -- 3,888,931 1.5% --
iShares MSCI EAFE ETF 16,376,479 6.0% 11,822,010 4.6% --
Dodge & Cox International Stock Fund 4,114,992 1.5% 3,877,351 1.5% --
MFS® International Growth R6 4,154,962 1.5% 3,880,226 1.5% --
Hartford Schroders Emerging Mkts Eq Y 4,211,127 1.5% 3,844,259 1.5% --
Total International Equities 28,857,561 10.5% 27,312,777$ 10.5% 9.0%
Range Range 4-16%
Global Equities
MSCI iShares ACWI Index ETF 12,365,033 4.5% 10,564,265 4.1%
American Funds New Perspective R6 4,137,563 1.5% 3,900,791 1.5%
MFS Global Equity FD CL R5 #4818 4,122,262 1.5% 3,896,959 1.5%
Total Global Equities 20,624,857$ 7.5% 18,362,015$ 7.1% 7.0%
Range Range 4-12%
Asset Allocation
Period Ending December 31, 2018

14
PARS: County of Contra Costa
9/30/2018 9/30/2018 12/31/2018 12/31/2018 Target
Asset Allocation Market Value % of Total Market Value % of Total Allocation
Real Estate
Vanguard REIT ETF 7,608,931 2.8% 8,544,081 3.3%
7,608,931$ 2.8% 8,544,081$ 3.3% 4.0%
Range Range 0-8%
Fixed Income
Core Fixed Income Holdings 72,882,528 26.5% 68,245,056 26.3% --
PIMCO Total Return Instl Fund 11,804,866 4.3% 11,689,017 4.5% --
Prudential Total Return Bond Q 11,779,177 4.3% 11,634,035 4.5% --
Total Fixed Income 96,466,571$ 35.1% 91,568,107$ 35.3% 38.0%
Range Range 30-50%
Alternatives
BlackRock Strategic Income Opps K 4,152,727 1.5% 6,426,137 2.5% --
Eaton Vance Glbl Macro Abs Ret I 9,657,764 3.5% 6,410,095 2.5% --
AQR Equity Market Neutral I 5,602,874 2.0% 5,166,588 2.0% --
Total Alternatives 19,413,365$ 7.1% 18,002,820$ 6.9% 10.0%
Range Range 5-20%
Cash
Money Market 10,185,042 3.7% 10,374,096 4.0% --
Total Cash 10,185,042$ 3.7% 10,374,096$ 4.0% 1.0%
Range Range 0-5%
TOTAL 275,127,254$ 100.0% 259,604,930$ 100.0% 100.0%
Asset Allocation
Period Ending December 31, 2018

*Ending Market Value differs from total market value on the previous page due to differences in reporting methodology. The above ending market value is reported as of trade
date and includes accruals. The Asset Allocation total market value is reported as of settlement date.
15
PARS: County of Contra Costa
Investment Summary Fourth Quarter 2018 Year to Date 2018
Beginning Value 275,858,092.90 254,664,786.12$
Net Contributions/Withdrawals 4,992,580.98 20,833,234.72
Fees Deducted -48,392.18 -193,402.20
Income Received 5,833,237.10 9,681,815.66
Market Appreciation -26,299,750.76 -24,826,725.70
Net Change in Accrued Income -108,980.30 67,079.14
Ending Market Value* 260,226,787.74$ 260,226,787.74$ *
Investment Summary Fourth Quarter 2017 Year to Date 2017
Beginning Value 242,319,209.06$ 206,343,794.94$
Net Contributions/Withdrawals 5,008,886.29 20,352,188.04
Fees Deducted -47,932.44 -187,946.90
Income Received 4,459,903.12 7,663,145.17
Market Appreciation 2,815,653.67 20,386,797.05
Net Change in Accrued Income 109,066.42 106,807.82
Ending Market Value* 254,664,786.12$ 254,664,786.12$ *
Investment Summary
Period Ending December 31, 2018

Investment Strategy
As of December 31, 2018 Tactical Asset Allocation
Asset Class % Portfolio Weighting Rationale
Target
Current
Portfolio
Over/Under
Weighting
Cash 1.0% 4.0% +3.0% Current cash yields are becoming competitive with shorter term fixed income maturities, as well as recent alternative segment returns have
been disappointing.
Fixed Income 38.0% 35.50% -2.5% We expect the Fed to move cautiously in 2019 as economic data appears to be softening. We have reduced our base case assumption
for 2019 to 1-2 hikes, with the potential for an undershoot if signs of slowing growth accelerate. We believe Fed Funds will peak for the
cycle by the end of 2020. Inflation should modestly accelerate as the impact of fiscal stimulus increases aggregate demand and excess
capacity is depleted. Our year-end 10-year Treasury forecast calls for a range between 2.75% - 3.25% for 2019.
Alternatives 10.0% 7.0% -3.0% We maintain our underweight to alternatives. While we seek the promise of risk-adjusted returns from alternatives, investment returns
over the last several quarters have been disappointing.
Real Estate (REITS) 4.0% 3.25% -0.75% Rising vacancy rates for regional malls and shopping centers, rising interest rate pressures on the sector and declining sales trends for a
variety of sectors create a negative backdrop for REITs. However, we began to close our underweight to REITs last quarter due to our
forecast of the Federal Reserve increasing the Fed Funds rate only 1-2 times in 2019.
Global Equity 7.0% 7.0% - The U.S. economy is on solid footing relative to the rest of the world. Economies outside of the U.S. are slowing due in large part to the
uncertainties caused by global trade issues. Valuations remain attractive overseas, and if a trade deal is executed, global markets would
likely rally. Additionally, global central banks have provided some indication that they may continue ‘easy’ monetary policies – which
would be supportive for global equities.
International (Developed) 9.0% 9.0% - Visibility into developed international earnings has become murkier over the past three months. Europe and Japan are economically more
sensitive to trade than the U.S., thus slowing trade/global demand is likely to impact those markets more significantly relative to the U.S.
Our equal weight allocation is based on positive relative valuations and the belief that a trade deal will be executed in the near future.
International (Emerging) 0.0% 1.5% +1.5% Attractive valuation offset by increasingly cloudy macro backdrop and deteriorating sentiment. China trade concerns have weighed on by
sentiment, and growth within the region.
Total Domestic Equity 31.0% 32.75% +1.75%
Large Cap 17.0% 18.25% +1.25% We have lowered our earnings estimates for the S&P500 for 2019, now forecasting a range of between $168-$172/share. Which equates
to stocks trading at a reasonable 15.5X level. We maintain the modest overweight based on reasonable valuation.
Mid Cap 6.0% 5.5% -0.50% We maintain our slight underweight to mid cap equities, preferring to be overweight small cap and large cap.
Small Cap 8.0% 9.0% +1.0% We maintain an overweight to small cap stocks on the basis of further narrowing in valuation spread relative to domestic large cap. Small
caps have better earnings growth, attractive relative valuations and some insulation from the impact of a stronger dollar.
16PARS: County of Contra Costa

Inception Date: 02/01/2011
* Benchmark from February 1, 2011 to June 30, 2013: 18% Russell 1000 Index, 6% Russell Midcap Index, 8% Russell 2000 Index, 8% MSCI ACWI Index, 10% MSCI EAFE Index, 45% Barclays Aggregate Index, 4% DJ Wilshire REIT Index, 1% Citigroup 3 Month T
Bill Index. From July 1, 2013 to June 30, 2015: 17% Russell 1000 Index, 6% Russell Midcap Index, 8% Russell 2000 Index, 7% MSCI AC World US Index, 9% MSCI EAFE Index, 38% Barclays Aggregate Index, 4% DJ Wilshire REIT Index, 10% HFRI FOF Market
Defensive Index, 1% Citigroup 3 Month T-Bill Index. From July 1, 2015: 17% Russell 1000 Index, 6% Russell Midcap Index, 8% Russell 2000 Index, 7% MSCI AC World Index, 9% MSCI EAFE Index, 38% Barclays Aggregate Index, 4% DJ Wilshire REIT Index, 10%
Wilshire Liquid Alternative Index, 1% Citigroup 3 Month T-Bill Index ** Dynamic Alternatives Index represents the HFRI FOF Market Defensive Index from 07/01/2013 until 06/30/2015, and then the W ilshire Liquid Alternatives Index from 07/01/2015 forwards.
Returns are gross-of-fees unless otherwise noted. Returns for periods over one year are annualized. The information presented has been obtained from sources believed to be accurate and reliable. Past performance is not indicative of future returns. Securities are
not FDIC insured, have no bank guarantee, and may lose value.
17
PARS: County of Contra Costa
3 Months
Year
to Date
(1 Year)
3 Years
5 Years
Inception
to Date
(94 Months)
Cash Equivalents .53 1.72 .92 .56 .36
FTSE 3 Month T-Bill Index .57 1.86 .99 .61 .41
Fixed Income ex Funds 1.38 .14 2.41 2.54 3.14
Total Fixed Income 1.38 .07 2.55 2.59 3.23
BBG Barclays US Aggregate Bd Index 1.64 .01 2.06 2.52 2.81
Total Equities -14.28 -9.19 6.69 4.82 7.50
Large Cap Funds -14.11 -5.43 8.78 7.67 10.14
Russell 1000 Index -13.82 -4.78 9.09 8.21 10.97
Mid Cap Funds -15.11 -8.95 6.96 5.15 8.04
Russell Midcap Index -15.37 -9.06 7.04 6.26 9.59
Small Cap Funds -19.89 -10.13 7.99 5.59 9.81
Russell 2000 Index -20.20 -11.01 7.36 4.41 8.63
International Equities -12.28 -12.29 5.15 1.68 3.80
MSCI AC World Index -12.75 -9.42 6.60 4.26 6.14
MSCI EAFE Index -12.54 -13.79 2.87 .53 3.06
MSCI EM Free Index -7.47 -14.58 9.25 1.65 .59
REIT Funds -6.15 -6.14 1.83 7.40 7.42
Wilshire REIT Index -6.93 -4.84 2.06 7.87 8.05
Alternatives -1.11 -7.43 -1.73 .03
Dynamic Alternatives Index -3.72 -4.24 .96 .75 -.46
Total Managed Portfolio -7.38 -5.50 4.21 3.47 5.06
Total Account Net of Fees -7.40 -5.57 4.12 3.37 4.95
County of Contra Costa -7.04 -4.44 4.54 4.02 5.56
Selected Period Performance
PARS/COUNTY OF CONTRA COSTA PRHCPAccount 6746038001
Period Ending: 12/31/2018

COUNTY OF CONTRA COSTA
18
PARS: County of Contra Costa
3-Month YTD 1-Year 3-Year 5-Year
Fund Name Inception Return Rank Return Rank Return Rank Return Rank Return Rank
Columbia Contrarian Core Inst3 (7/13) -14.78 77 -8.81 82 -8.81 82 6.53 78 7.15 47
T. Rowe Price Growth Stock I -14.10 25 -0.89 37 -0.89 37 10.45 28 10.22 19
Harbor Capital Appreciation Retirement -16.39 69 -0.96 37 -0.96 37 10.24 32 10.33 17
Dodge & Cox Stock (10/14) -13.57 64 -7.07 31 -7.07 31 10.07 7 7.06 16
Vanguard Growth & Income Adm (12/16) -14.22 65 -4.61 31 -4.61 31 8.91 28 8.52 9
iShares Russell 1000 ETF (3/15) -13.84 56 -4.91 37 -4.91 37 8.95 26 8.08 23
Russell 1000 TR USD -13.82 -- -4.78 -- -4.78 -- 9.09 -- 8.21 --
iShares Russell Mid-Cap ETF (3/15) -15.33 36 -9.13 30 -9.13 30 6.89 43 6.10 16
Russell Mid Cap TR USD -15.37 -- -9.06 -- -9.06 -- 7.04 -- 6.26 --
Undiscovered Managers Behavioral Val R6 (9/16) -20.42 68 -15.20 49 -15.20 49 5.21 47 4.99 6
Russell 2000 Value TR USD -18.67 -- -12.86 -- -12.86 -- 7.37 -- 3.61 --
T. Rowe Price New Horizons I -17.01 47 4.17 4 4.17 4 13.98 2 10.43 2
Russell 2000 Growth TR USD -21.65 -- -9.31 -- -9.31 -- 7.24 -- 5.13 --
iShares Russell 2000 ETF (3/15) -20.21 66 -11.02 36 -11.02 36 7.38 27 4.45 27
Dodge & Cox International Stock -12.39 43 -17.98 81 -17.98 81 3.24 40 -0.48 43
MFS International Growth R6 -11.74 19 -8.79 9 -8.79 9 7.52 4 3.46 12
MFS Global Equity R6 (3/15) -13.30 53 -10.76 62 -10.76 62 5.95 46 4.08 45
iShares MSCI EAFE ETF (3/15) -12.59 47 -13.83 37 -13.83 37 2.82 50 0.45 40
iShares MSCI ACWI ETF (3/15) -12.73 44 -9.15 45 -9.15 45 6.93 28 4.54 34
American Funds New Perspective R6 (3/15) -13.15 50 -5.56 18 -5.56 18 7.66 19 6.42 11
DFA Large Cap International I (12/18) -13.29 66 -14.14 44 -14.14 44 3.55 32 0.44 41
MSCI EAFE NR USD -12.54 -- -13.79 -- -13.79 -- 2.87 -- 0.53 --
MSCI ACWI NR USD -12.75 -- -9.42 -- -9.42 -- 6.60 -- 4.26 --
Hartford Schroders Emerging Mkts Eq Y (11/12) -8.85 74 -15.42 45 -15.42 45 9.67 17 1.90 20
MSCI EM Free Index -7.47 -- -14.58 -- -14.58 -- 9.25 -- 1.65 --
Data Source: Morningstar, SEI Investments
Returns less than one year are not annualized. Past performance is not indicative of future returns. The information presented has been obtained from sources believed accurate and
reliable. Securities are not FDIC insured, have no bank guarantee and may lose value.
LARGE CAP EQUITY FUNDS
MID CAP EQUITY FUNDS
SMALL CAP EQUITY FUNDS
INTERNATIONAL EQUITY FUNDS
For Period Ending December 31, 2018

COUNTY OF CONTRA COSTA
PARS: County of Contra Costa
18
3-Month YTD 1-Year 3-Year 5-Year
Fund Name Inception Return Rank Return Rank Return Rank Return Rank Return Rank
Vanguard Real Estate ETF (6/17) -6.46 34 -5.95 58 -5.95 58 2.32 46 7.40 44
Wilshire REIT Index -6.93 -- -4.84 -- -4.84 -- 2.06 -- 7.87 --
Core Fixed Income Portfolio 1.38 32 .14 24 .14 24 2.41 34 2.54 33
PIMCO Total Return Instl 1.39 32 -0.26 39 -0.26 39 2.47 32 2.56 31
PGIM Total Return Bond R6 (5/16) 1.36 33 -0.63 57 -0.63 57 3.59 5 3.59 3
BBgBarc US Agg Bond TR USD 1.64 -- 0.01 -- 0.01 -- 2.06 -- 2.52 --
AQR Equity Market Neutral I (2/16) -1.79 64 -11.73 95 -11.73 95 -0.37 73 -- --
BlackRock Strategic Income Opps K -0.52 30 -0.47 46 -0.47 46 2.69 53 2.32 31
Eaton Vance Glbl Macr Absolute Return I (7/13) -0.90 37 -3.29 81 -3.29 81 1.60 77 2.09 37
Idx: Dynamic Alternatives -3.72 -- -4.24 -- -4.24 -- 0.96 -- 0.75 --
Data Source: Morningstar, SEI Investments
Returns less than one year are not annualized. Past performance is not indicative of future returns. The information presented has been obtained from sources believed accurate and
reliable. Securities are not FDIC insured, have no bank guarantee and may lose value.
ALTERNATIVE FUNDS
REIT EQUITY FUNDS
For Period Ending December 31, 2018
BOND FUNDS

COUNTY OF CONTRA COSTA
20
PARS: County of Contra Costa
.
2018 2017 2016 2015 2014 2013 2012
Fund Name Inception Return Rank Return Rank Return Rank Return Rank Return Rank Return Rank Return Rank
Columbia Contrarian Core Inst3 (7/13) -8.81 82 21.89 28 8.77 73 3.25 7 13.14 27 36.04 15 18.68 --
T. Rowe Price Growth Stock I -0.89 37 33.84 15 1.58 63 10.93 -- 8.83 -- 39.20 -- 18.92 --
Harbor Capital Appreciation Retirement -0.96 37 36.68 5 -1.04 -- 10.99 -- 9.93 -- 37.66 -- 15.69 --
Dodge & Cox Stock (10/14) -7.07 31 18.33 24 21.28 6 -4.49 62 10.40 54 40.55 2 22.01 2
Vanguard Growth & Income Adm (12/16) -4.61 31 20.80 54 12.12 24 2.03 16 14.16 13 32.74 37 17.05 19
iShares Russell 1000 ETF (3/15) -4.91 37 21.53 37 11.91 27 0.82 30 13.08 28 32.93 35 16.27 29
Russell 1000 TR USD -4.78 -- 21.69 -- 12.05 -- 0.92 -- 13.24 -- 33.11 -- 16.42 --
iShares Russell Mid-Cap ETF (3/15) -9.13 30 18.32 27 13.58 61 -2.57 30 13.03 8 34.50 46 17.13 43
Russell Mid Cap TR USD -9.06 -- 18.52 -- 13.80 -- -2.44 -- 13.22 -- 34.76 -- 17.28 --
Undiscovered Managers Behavioral Val R6 (9/16) -15.20 49 13.53 11 20.97 80 3.52 1 5.83 25 37.72 -- 23.55 --
Russell 2000 Value TR USD -12.86 -- 7.84 -- 31.74 -- -7.47 -- 4.22 -- 34.52 -- 18.05 --
T. Rowe Price New Horizons I 4.17 4 31.67 9 7.95 69 4.54 -- 6.10 -- 49.11 -- 16.20 --
Russell 2000 Growth TR USD -9.31 -- 22.17 -- 11.32 -- -1.38 -- 5.60 -- 43.30 -- 14.59 --
iShares Russell 2000 ETF (3/15) -11.02 36 14.66 24 21.36 43 -4.33 44 4.94 44 38.85 35 16.39 34
Dodge & Cox International Stock -17.98 81 23.94 72 8.26 2 -11.35 98 0.08 9 26.31 8 21.03 16
DFA Large Cap International I (12/18) -14.14 44 25.37 48 3.16 23 -2.86 72 -5.24 49 20.69 39 17.75 58
MFS International Growth R6 -8.79 9 32.58 31 2.79 6 0.40 52 -5.01 57 13.94 78 19.77 29
MFS Global Equity R6 (3/15) -9.51 62 24.04 41 7.43 27 -1.34 48 4.08 33 27.93 34 23.14 --
iShares MSCI EAFE ETF (3/15) -13.83 37 24.94 58 0.96 47 -0.90 46 -5.04 46 22.62 18 17.22 66
iShares MSCI ACWI ETF (3/15) -9.15 45 24.35 39 8.22 21 -2.39 62 4.64 28 22.91 63 15.99 51
American Funds New Perspective R6 (3/15) -5.56 18 29.30 16 2.19 77 5.63 6 3.56 40 27.23 38 21.19 14
MSCI EAFE NR USD -13.79 -- 25.03 -- 1.00 -- -0.81 -- -4.90 -- 22.78 -- 17.32 --
MSCI ACWI NR USD -9.42 -- 23.97 -- 7.86 -- -2.36 -- 4.16 -- 22.80 -- 16.13 --
Hartford Schroders Emerging Mkts Eq Y (11/12) -15.42 45 41.10 18 10.53 -- -12.68 -- -4.61 -- -2.28 -- 21.73 --
MSCI EM PR USD -16.64 -- 34.35 -- 8.58 -- -16.96 -- -4.63 -- -4.98 -- 15.15 --
Data Source: Morningstar, SEI Investments
Returns less than one year are not annualized. Past performance is not indicative of future returns. The information presented has been obtained from sources believed accurate and reliable. Securities are not FDIC insured,
have no bank guarantee and may lose value.
For Period Ending December 31, 2018LARGE CAP EQUITY FUNDS
MID CAP EQUITY FUNDS
SMALL CAP EQUITY FUNDS
INTERNATIONAL EQUITY FUNDS

COUNTY OF CONTRA COSTA
21
PARS: County of Contra Costa
.
2018 2017 2016 2015 2014 2013 2012
Fund Name Inception Return Rank Return Rank Return Rank Return Rank Return Rank Return Rank Return Rank
Vanguard Real Estate ETF (6/17) -5.95 58 4.95 57 8.53 17 2.37 65 30.29 33 2.42 27 17.67 30
Wilshire US REIT TR USD -4.84 -- 4.18 -- 7.24 -- 4.23 -- 31.78 -- 1.86 -- 17.59 --
Core Fixed Income Portfolio .14 24 3.49 59 3.63 37 0.78 14 4.74 70 -1.40 41 5.42 69
PIMCO Total Return Instl -0.26 39 5.13 10 2.60 63 0.73 15 4.69 71 -1.92 60 10.36 12
PGIM Total Return Bond R6 (5/16) -0.63 57 6.71 2 4.83 13 0.09 44 7.25 5 -0.91 28 9.96 14
BBgBarc US Agg Bond TR USD 0.01 -- 3.54 -- 2.65 -- 0.55 -- 5.97 -- -2.02 -- 4.21 --
BlackRock Strategic Income Opps K (7/13) -0.47 46 4.97 37 3.65 -- -0.30 -- 3.89 -- 3.28 -- 9.92 --
AQR Equity Market Neutral I (2/16) -11.73 95 5.84 24 5.85 18 17.60 1 -- -- -- -- -- --
Eaton Vance Glbl Macr Absolute Return I (7/13) -3.29 81 4.29 47 4.00 61 2.63 7 3.03 18 -0.24 58 4.11 79
Dynamic Alternatives Index -4.24 -- 5.07 -- 2.29 -- -5.19 -- 6.39 -- 0.54 -- -1.67 --
Data Source: Morningstar, SEI Investments
Returns less than one year are not annualized. Past performance is not indicative of future returns. The information presented has been obtained from sources believed accurate and reliable. Securities are not FDIC insured,
have no bank guarantee and may lose value.
REIT EQUITY FUNDS
ALTERNATIVE FUNDS
For Period Ending December 31, 2018
BOND FUNDS

BlackRock Strategic Income Opps KBSIKX
Key Informa�on
Morningstar Category
Morningstar Ra�ng Overall
Incep�on Date
Expense Ra�o
Fund Size (Mil)
Por�olio Date
Manager Name
US Fund Nontradi�onal Bond
3/28/2016
0.82
33,935.90
6/30/2018
Mul�ple
Correla�on Matrix
Time Period: 4/1/2016 to 12/31/2018
1 2 3
1.00
0.13 1.00
0.51 0.17 1.00
1 BlackRock Strategic Income Opps K
2 BBgBarc US Agg Bond TR USD
3 S&P 500 TR (1989)
1.00 to 0.80 0.80 to 0.60 0.60 to 0.40 0.40 to 0.20 0.20 to 0.00
0.00 to 0.20 0.20 to 0.40 0.40 to 0.60 0.60 to 0.80 0.80 to 1.00
Return Distribu�on - BlackRock Strategic Income Opps K
Time Period: Since Incep�on to 12/31/2018
2.0 1.0 0.0 1.0 2.00.0
4.0
8.0
12.0
16.0
20.0
24.0
BlackRock Strategic Income Opps K US Fund Nontradi�onal Bond
Nu
mb
er
of
Pe
rio
ds
YTD
Peer
group
quar�le
1 year
Peer
group
quar�le
3 years
Peer
group
quar�le
5 years
Peer
group
quar�le
10 years
Peer
group
quar�le
BlackRock Strategic Income Opps K
US Fund Nontradi�onal Bond
0.47 0.47
1.21 1.21 2.55 1.40 3.67
2 2
3 3 3 3 3
Drawdown
Time Period: 1/1/2014 to 12/31/2018
2014 2015 2016 2017 20184.5
3.8
3.0
2.3
1.5
0.8
0.0
BlackRock Strategic Income Opps K US Fund Nontradi�onal Bond
Performance Rela�ve to Peer Group
Peer Group (595%): Open End Funds U.S. Nontradi�onal Bond
8.0
6.0
4.0
2.0
0.0
YTD 1 year 3 years 5 years 10 years
2.0
4.0
6.0
8.0
10.0
BlackRock Strategic Income Opps K US Fund Nontradi�onal Bond
Re
turn
Returns
As of Date: 12/31/2018 Calcula�on Benchmark: US Fund Nontradi�onal Bond
Quarter YTD 1 Year 3 Years 5 Years 10 Years3.0
2.3
1.5
0.8
0.0
0.8
1.5
2.3
3.0
3.8
4.5
0.5 0.5 0.5
1.71.2 1.2
2.6
1.4
3.7
BlackRock Strategic Income Opps K US Fund Nontradi�onal Bond
Re
turn
Risk-Reward
Time Period: 1/1/2016 to 12/31/2018
Std Dev
0.0 2.0 4.0 6.0 8.0
1.0
1.0
3.0
5.0
7.0
BlackRock Strategic Income Opps K US Fund Nontradi�onal Bond
Re
turn
BlackRock Strategic Income Opps K - Risk
Time Period: Since Incep�on to 12/31/2018
Calcula�on Benchmark: US Fund Nontradi�onal Bond
Inv Bmk1 +/ Bmk1
Return
Std Dev
Downside Devia�on
Alpha
Beta
R2
Sharpe Ra�o (arith)
Tracking Error
2.79
1.70
0.00
0.00
1.00
100.00
0.95
0.00
3.15
1.50
0.66
0.80
0.72
65.44
1.31
1.09
0.36
0.19
0.66
0.80
0.28
34.56
0.36
1.09
Monthly Es�mated Fund-Level Net Flow
Time Period: 3/1/2016 to 12/31/2018
2016 2017 2018
1,500M
750M
0M
750M
1,500M
BlackRock Strategic Income Opps K
Es�mat
ed Fund
Level
Month
ly Retu
rn
Source: Morningstar Direct, as of December 31, 2018. Informa�on provided herein was obtained from thirdparty sources deemed reliable. HighMark and its affiliates make no representa�ons or warran�es with respect to the �meliness, accuracy, or completeness of the informa�on
and bear no liability for any loss arising from its use.
22

DFA Large Cap Interna�onal IDFALX
Key Informa�on
Morningstar Category
Morningstar Ra�ng Overall
Incep�on Date
Expense Ra�o
Fund Size (Mil)
Por�olio Date
Manager Name
US Fund Foreign Large Blend
ÙÙÙ
7/17/1991
0.24
4,787.26
11/30/2018
Mul�ple
Asset Alloca�on
%
Cash 1.4
US Equity 1.5
NonUS Equity 97.1
Other 0.0
Total 100.0
HoldingsBased Style Map
Mic
roS
ma
llM
idLa
rge
Gia
nt
DeepVal CoreVal Core CoreGrth HighGrth
DFA Large Cap Interna�onal I 11/30/2018
MSCI World ex USA NR USD 12/31/2018
US Fund Foreign Large Blend 12/31/2018
YTD
Peer
group
quar�le
1 year
Peer
group
quar�le
3 years
Peer
group
quar�le
5 years
Peer
group
quar�le
10 years
Peer
group
quar�le
DFA Large Cap Interna�onal I
MSCI ACWI Ex USA NR USD
US Fund Foreign Large Blend
14.20 14.20
14.59 14.59 2.55
4.48 0.68
0.12 5.84
6.57
14.14 14.14 3.55 0.44 6.162 2 1 2 2
2 2 1 1 1
2 2 2 2 2
Rolling Returns
Time Period: 1/1/2014 to 12/31/2018
Peer Group (595%): Open End Funds U.S. Foreign Large Blend Rolling Window: 3 Years 3 Months shi� Calcula�on Benchmark: MSCI World ex USA NR USD
01 02 03 04 05 06 07 08 09 10 11 12
2018
01 02 03 04 05 06 07 08 09 10 11 12
5.0
0.0
5.0
10.0
DFA Large Cap Interna�onal I MSCI World ex USA NR USD
Re
turn
Performance Rela�ve to Peer Group
Peer Group (595%): Open End Funds U.S. Foreign Large Blend
25.0
20.0
15.0
10.0
5.0
YTD 1 year 3 years 5 years 10 years
0.0
5.0
10.0
DFA Large Cap Interna�onal I MSCI World ex USA NR USD US Fund Foreign Large Blend
Re
turn
Returns
As of Date: 12/31/2018 Calcula�on Benchmark: MSCI ACWI Ex USA NR USD
Quarter YTD 1 Year 3 Years 5 Years 10 Years25.0
20.0
15.0
10.0
5.0
0.0
5.0
10.0
15.0
13
.3
14
.1
14
.1
3.6
0.4
6.2
11
.5
14
.2
14
.2
4.5
0.7
6.6
12
.7
14
.6
14
.6
2.5
0.1
5.8
DFA Large Cap Interna�onal I MSCI ACWI Ex USA NR USD US Fund Foreign Large Blend
Re
turn
RiskReward
Time Period: 1/1/2014 to 12/31/2018
Peer Group (595%): Open End Funds U.S. Foreign Large Blend Calcula�on Benchmark: MSCI ACWI Ex USA NR USD
Std Dev
0.0 3.0 6.0 9.0 12.0 15.0 18.0
4.0
3.0
2.0
1.0
0.0
1.0
2.0
3.0
Re
turn
DFA Large Cap Interna�onal I Risk
Time Period: 1/1/2014 to 12/31/2018
Calcula�on Benchmark: MSCI World ex USA NR USD
Inv Bmk1
Return
Std Dev
Downside Devia�on
Alpha
Beta
R2
Sharpe Ra�o (arith)
Tracking Error
0.34
11.66
0.00
0.00
1.00
100.00
0.03
0.00
0.44
11.48
1.26
0.09
0.97
97.72
0.02
1.76
Monthly Es�mated FundLevel Net Flow
Time Period: 1/1/2014 to 12/31/2018
2014 2016 2018
200M
100M
0M
100M
200M
DFA Large Cap Interna�onal I US Fund Foreign Large Blend
Es�mat
ed Fund
Level N
et Flow
Mo
nthly R
eturn
Source: Morningstar Direct, as of December 31, 2018 Informa�on provided herein was obtained from thirdparty sources deemed reliable. HighMark and its affiliates make no representa�ons or warran�es with respect to the �meliness, accuracy, or completeness of the
informa�on and bear no liability for any loss arising from its use.
23

Dodge & Cox Interna�onal StockDODFX
Key Informa�on
Morningstar Category
Morningstar Ra�ng Overall
Incep�on Date
Expense Ra�o
Fund Size (Mil)
Por�olio Date
Manager Name
US Fund Foreign Large Value
ÙÙÙÙ
5/1/2001
0.63
48,107.51
12/31/2018
Mul�ple
Asset Alloca�on
%
Cash 0.7
US Equity 8.1
NonUS Equity 90.4
Other 0.7
Total 100.0
HoldingsBased Style Map
Mic
roS
ma
llM
idLa
rge
Gia
nt
DeepVal CoreVal Core CoreGrth HighGrth
Dodge & Cox Interna�onal Stock 12/31/2018
MSCI EAFE NR USD 12/31/2018
US Fund Foreign Large Value 12/31/2018
YTD
Peer
group
quar�le
1 year
Peer
group
quar�le
3 years
Peer
group
quar�le
5 years
Peer
group
quar�le
10 years
Peer
group
quar�le
Dodge & Cox Interna�onal Stock
MSCI ACWI Ex USA Value NR USD
US Fund Foreign Large Value
17.98 17.98 3.24 0.48 7.72
13.97 13.97 4.75 0.38 5.95
15.38 15.38 2.20 0.63 5.19
3 3 1 2 1
1 1 1 2 1
1 1 2 2 2
Rolling Returns
Time Period: 1/1/2014 to 12/31/2018
Peer Group (595%): Open End Funds U.S. Foreign Large Value Rolling Window: 3 Years 3 Months shi� Calcula�on Benchmark: MSCI EAFE NR USD
01 02 03 04 05 06 07 08 09 10 11 12
2018
01 02 03 04 05 06 07 08 09 10 11 12
5.0
0.0
5.0
10.0
Dodge & Cox Interna�onal Stock MSCI EAFE NR USD
Re
turn
Performance Rela�ve to Peer Group
Peer Group (595%): Open End Funds U.S. Foreign Large Value
25.0
20.0
15.0
10.0
5.0
YTD 1 year 3 years 5 years 10 years
0.0
5.0
10.0
Dodge & Cox Interna�onal Stock MSCI EAFE NR USD US Fund Foreign Large Value
Re
turn
Returns
As of Date: 12/31/2018 Calcula�on Benchmark: MSCI ACWI Ex USA Value NR USD
Quarter YTD 1 Year 3 Years 5 Years 10 Years30.0
25.0
20.0
15.0
10.0
5.0
0.0
5.0
10.0
15.0
12
.4
18
.0
18
.0
3.2
0.5
7.7
10
.7
14
.0
14
.0
4.7
0.4
6.0
12
.4
15
.4
15
.4
2.2
0.6
5.2
Dodge & Cox Interna�onal Stock MSCI ACWI Ex USA Value NR USD US Fund Foreign Large Value
Re
turn
RiskReward
Time Period: 1/1/2014 to 12/31/2018
Peer Group (595%): Open End Funds U.S. Foreign Large Value Calcula�on Benchmark: MSCI ACWI Ex USA Value NR USD
Std Dev
0.0 3.0 6.0 9.0 12.0 15.0 18.0
6.0
4.0
2.0
0.0
2.0
4.0
Re
turn
Dodge & Cox Interna�onal Stock Risk
Time Period: 1/1/2014 to 12/31/2018
Calcula�on Benchmark: MSCI EAFE NR USD
Inv Bmk1
Return
Std Dev
Downside Devia�on
Alpha
Beta
R2
Sharpe Ra�o (arith)
Tracking Error
0.53
11.78
0.00
0.00
1.00
100.00
0.01
0.00
0.48
13.90
3.66
0.80
1.10
86.82
0.08
5.19
Monthly Es�mated FundLevel Net Flow
Time Period: 1/1/2014 to 12/31/2018
2014 2016 2018
2,000M
1,000M
0M
1,000M
2,000M
Dodge & Cox Interna�onal Stock US Fund Foreign Large Value
Es�mat
ed Fund
Level N
et Flow
Mo
nthly R
eturn
Source: Morningstar Direct, as of December 31, 2018 Informa�on provided herein was obtained from thirdparty sources deemed reliable. HighMark and its affiliates make no representa�ons or warran�es with respect to the �meliness, accuracy, or completeness of the
informa�on and bear no liability for any loss arising from its use.
24

Dodge & Cox StockDODGX
Key Informa�on
Morningstar Category
Morningstar Ra�ng Overall
Incep�on Date
Expense Ra�o
Fund Size (Mil)
Por�olio Date
Manager Name
US Fund Large Value
ÙÙÙÙ
1/4/1965
0.52
63,004.69
12/31/2018
Mul�ple
Asset Alloca�on
%
Cash 3.7
US Equity 83.7
NonUS Equity 12.6
Total 100.0
HoldingsBased Style Map
Mic
roS
ma
llM
idLa
rge
Gia
nt
DeepVal CoreVal Core CoreGrth HighGrth
Dodge & Cox Stock 12/31/2018
S&P 500 TR USD 12/31/2018
US Fund Large Value 12/31/2018
YTD
Peer
group
quar�le
1 year
Peer
group
quar�le
3 years
Peer
group
quar�le
5 years
Peer
group
quar�le
10 years
Peer
group
quar�le
Dodge & Cox Stock
Russell 1000 Value TR USD
US Fund Large Value
8.27 8.27 6.95 5.95 11.18
7.07 7.07 10.07 7.06 13.17
8.60 8.60 6.73 5.13 10.45
2 2 1 1 1
2 2 2 2 2
2 2 2 3 3
Rolling Returns
Time Period: 1/1/2014 to 12/31/2018
Peer Group (595%): Open End Funds U.S. Large Value Rolling Window: 3 Years 3 Months shi� Calcula�on Benchmark: S&P 500 TR USD
01 02 03 04 05 06 07 08 09 10 11 12
2018
01 02 03 04 05 06 07 08 09 10 11 12
7.5
10.0
12.5
15.0
17.5
Dodge & Cox Stock S&P 500 TR USD
Re
turn
Performance Rela�ve to Peer Group
Peer Group (595%): Open End Funds U.S. Large Value
15.0
10.0
5.0
0.0
5.0
YTD 1 year 3 years 5 years 10 years
10.0
15.0
Dodge & Cox Stock S&P 500 TR USD US Fund Large Value
Re
turn
Returns
As of Date: 12/31/2018 Calcula�on Benchmark: Russell 1000 Value TR USD
Quarter YTD 1 Year 3 Years 5 Years 10 Years25.0
20.0
15.0
10.0
5.0
0.0
5.0
10.0
15.0
20.0
13
.6
7.1
7.1
10
.1
7.1
13
.2
11
.7 8.3
8.3
7.0
5.9
11
.2
12
.5 8.6
8.6
6.7
5.1
10
.5
Dodge & Cox Stock Russell 1000 Value TR USD US Fund Large Value
Re
turn
RiskReward
Time Period: 1/1/2014 to 12/31/2018
Peer Group (595%): Open End Funds U.S. Large Value Calcula�on Benchmark: Russell 1000 Value TR USD
Std Dev
0.0 3.0 6.0 9.0 12.0 15.0 18.0
0.0
2.0
4.0
6.0
8.0
10.0
Re
turn
Dodge & Cox Stock Risk
Time Period: 1/1/2014 to 12/31/2018
Calcula�on Benchmark: S&P 500 TR USD
Inv Bmk1
Return
Std Dev
Downside Devia�on
Alpha
Beta
R2
Sharpe Ra�o (arith)
Tracking Error
7.06
12.71
3.26
1.75
1.08
85.93
0.50
4.85
8.49
10.94
0.00
0.00
1.00
100.00
0.71
0.00
Monthly Es�mated FundLevel Net Flow
Time Period: 1/1/2014 to 12/31/2018
2014 2016 2018
1,000M
500M
0M
500M
Dodge & Cox Stock US Fund Large Value
Es�mat
ed Fund
Level N
et Flow
Mo
nthly R
eturn
Source: Morningstar Direct, as of December 31, 2018 Informa�on provided herein was obtained from thirdparty sources deemed reliable. HighMark and its affiliates make no representa�ons or warran�es with respect to the �meliness, accuracy, or completeness of the
informa�on and bear no liability for any loss arising from its use.
25

Eaton Vance Glbl Macr Absolute Return IEIGMX
Key Informa�on
Morningstar Category
Morningstar Ra�ng Overall
Incep�on Date
Expense Ra�o
Fund Size (Mil)
Por�olio Date
Manager Name
US Fund Nontradi�onal Bond
ÙÙ
6/27/2007
0.74
4,214.47
7/31/2018
Mul�ple
Correla�on Matrix
Time Period: 7/1/2007 to 12/31/2018
1 2 3
1.00
0.25 1.00
0.36 0.01 1.00
1 Eaton Vance Glbl Macr Absolute Return I
2 BBgBarc US Agg Bond TR USD
3 S&P 500 TR (1989)
1.00 to 0.80 0.80 to 0.60 0.60 to 0.40 0.40 to 0.20 0.20 to 0.00
0.00 to 0.20 0.20 to 0.40 0.40 to 0.60 0.60 to 0.80 0.80 to 1.00
Return Distribu�on - Eaton Vance Glbl Macr Absolute Retur
Time Period: Since Incep�on to 12/31/2018
6.0 5.0 4.0 3.0 2.0 1.0 0.0 1.0 2.0 3.0 4.0 5.0 6.00.0
10.0
20.0
30.0
40.0
50.0
60.0
70.0
80.0
Eaton Vance Glbl Macr Absolute Return I US Fund Nontradi�onal Bond
Nu
mb
er
of
Pe
rio
ds
YTD
Peer
group
quar�le
1 year
Peer
group
quar�le
3 years
Peer
group
quar�le
5 years
Peer
group
quar�le
10 years
Peer
group
quar�le
Eaton Vance Glbl Macr Absolute Return I
US Fund Nontradi�onal Bond 1.21 1.21
3.29 3.29
2.55
1.60
1.40
2.09
3.67
2.944 4 4 2 4
3 3 3 3 3
Drawdown
Time Period: 1/1/2014 to 12/31/2018
2014 2015 2016 2017 20184.5
3.8
3.0
2.3
1.5
0.8
0.0
Eaton Vance Glbl Macr Absolute Return I US Fund Nontradi�onal Bond
Performance Rela�ve to Peer Group
Peer Group (595%): Open End Funds U.S. Nontradi�onal Bond
8.0
6.0
4.0
2.0
0.0
YTD 1 year 3 years 5 years 10 years
2.0
4.0
6.0
8.0
10.0
Eaton Vance Glbl Macr Absolute Return I US Fund Nontradi�onal Bond
Re
turn
Returns
As of Date: 12/31/2018 Calcula�on Benchmark: US Fund Nontradi�onal Bond
Quarter YTD 1 Year 3 Years 5 Years 10 Years5.0
4.0
3.0
2.0
1.0
0.0
1.0
2.0
3.0
4.0
5.0
0.9
3.3 3.3
1.62.1
2.9
1.71.2 1.2
2.6
1.4
3.7
Eaton Vance Glbl Macr Absolute Return I US Fund Nontradi�onal Bond
Re
turn
Risk-Reward
Time Period: 1/1/2016 to 12/31/2018
Std Dev
0.0 2.0 4.0 6.0 8.0
1.0
1.0
3.0
5.0
7.0
Eaton Vance Glbl Macr Absolute Return I US Fund Nontradi�onal Bond
Re
turn
Eaton Vance Glbl Macr Absolute Return I - Risk
Time Period: Since Incep�on to 12/31/2018
Calcula�on Benchmark: US Fund Nontradi�onal Bond
Inv Bmk1 +/ Bmk1
Return
Std Dev
Downside Devia�on
Alpha
Beta
R2
Sharpe Ra�o (arith)
Tracking Error
1.75
3.70
0.00
0.00
1.00
100.00
0.30
0.00
3.25
2.65
1.62
2.13
0.40
31.81
0.98
3.16
1.50
1.06
1.62
2.13
0.60
68.19
0.68
3.16
Monthly Es�mated Fund-Level Net Flow
Time Period: 1/1/2014 to 12/31/2018
2014 2016 2018
1,500M
1,000M
500M
0M
500M
Eaton Vance Glbl Macr Absolute Return I
Es�mat
ed Fund
Level
Month
ly Retu
rn
Source: Morningstar Direct, as of December 31, 2018. Informa�on provided herein was obtained from thirdparty sources deemed reliable. HighMark and its affiliates make no representa�ons or warran�es with respect to the �meliness, accuracy, or completeness of the informa�on
and bear no liability for any loss arising from its use.
26

Harbor Capital Apprecia�on InstlHACAX
Key Informa�on
Morningstar Category
Morningstar Ra�ng Overall
Incep�on Date
Expense Ra�o
Fund Size (Mil)
Por�olio Date
Manager Name
US Fund Large Growth
ÙÙÙÙ
12/29/1987
0.66
28,266.56
9/30/2018
Mul�ple
Asset Alloca�on
%
Cash 0.1
US Equity 89.5
NonUS Equity 10.3
Total 100.0
HoldingsBased Style Map
Mic
roS
ma
llM
idLa
rge
Gia
nt
DeepVal CoreVal Core CoreGrth HighGrth
Harbor Capital Apprecia�on Instl 9/30/2018
Russell 1000 Growth TR USD 12/31/2018
US Fund Large Growth 12/31/2018
YTD
Peer
group
quar�le
1 year
Peer
group
quar�le
3 years
Peer
group
quar�le
5 years
Peer
group
quar�le
10 years
Peer
group
quar�le
Harbor Capital Apprecia�on Instl
Russell 1000 Growth TR USD
US Fund Large Growth
1.51 1.51 11.15 10.40 15.29
2.18 2.18 8.87 8.03 13.19
1.03 1.03 10.18 10.29 15.272 2 2 1 1
2 2 1 1 1
3 3 3 3 3
Rolling Returns
Time Period: 1/1/2014 to 12/31/2018
Peer Group (595%): Open End Funds U.S. Large Growth Rolling Window: 3 Years 3 Months shi� Calcula�on Benchmark: Russell 1000 Growth TR USD
01 02 03 04 05 06 07 08 09 10 11 12
2018
01 02 03 04 05 06 07 08 09 10 11 12
5.0
10.0
15.0
20.0
25.0
Harbor Capital Apprecia�on Instl Russell 1000 Growth TR USD
Re
turn
Performance Rela�ve to Peer Group
Peer Group (595%): Open End Funds U.S. Large Growth
10.0
5.0
0.0
5.0
10.0
YTD 1 year 3 years 5 years 10 years
15.0
20.0
Harbor Capital Apprecia�on Instl Russell 1000 Growth TR USD US Fund Large Growth
Re
turn
Returns
As of Date: 12/31/2018 Calcula�on Benchmark: Russell 1000 Growth TR USD
Quarter YTD 1 Year 3 Years 5 Years 10 Years30.0
22.5
15.0
7.5
0.0
7.5
15.0
22.5
16
.4
1.0
1.0
10
.2
10
.3 15
.3
15
.9
1.5
1.5
11
.1
10
.4 15
.3
15
.4
2.2
2.2
8.9
8.0
13
.2
Harbor Capital Apprecia�on Instl Russell 1000 Growth TR USD US Fund Large Growth
Re
turn
RiskReward
Time Period: 1/1/2014 to 12/31/2018
Peer Group (595%): Open End Funds U.S. Large Growth Calcula�on Benchmark: Russell 1000 Growth TR USD
Std Dev
0.0 3.0 6.0 9.0 12.0 15.0 18.0
0.0
2.0
4.0
6.0
8.0
10.0
12.0
14.0
Re
turn
Harbor Capital Apprecia�on Instl Risk
Time Period: 1/1/2014 to 12/31/2018
Calcula�on Benchmark: Russell 1000 Growth TR USD
Inv Bmk1
Return
Std Dev
Downside Devia�on
Alpha
Beta
R2
Sharpe Ra�o (arith)
Tracking Error
10.29
13.75
3.61
0.72
1.08
89.02
0.70
4.67
10.40
11.96
0.00
0.00
1.00
100.00
0.81
0.00
Monthly Es�mated FundLevel Net Flow
Time Period: 1/1/2014 to 12/31/2018
2014 2016 2018
1,000M
500M
0M
500M
Harbor Capital Apprecia�on Instl US Fund Large Growth
Es�mat
ed Fund
Level N
et Flow
Mo
nthly R
eturn
Source: Morningstar Direct, as of December 31, 2018 Informa�on provided herein was obtained from thirdparty sources deemed reliable. HighMark and its affiliates make no representa�ons or warran�es with respect to the �meliness, accuracy, or completeness of the
informa�on and bear no liability for any loss arising from its use.
27

Har�ord Schroders Emerging Mkts Eq YHHHYX
Key Informa�on
Morningstar Category
Morningstar Ra�ng Overall
Incep�on Date
Expense Ra�o
Fund Size (Mil)
Por�olio Date
Manager Name
US Fund Diversified Emerging Mkts
10/24/2016
1.11
3,268.41
11/30/2018
Mul�ple
Asset Alloca�on
%
Cash 3.3
NonUS Equity 96.7
Total 100.0
HoldingsBased Style Map
Mic
roS
ma
llM
idLa
rge
Gia
nt
DeepVal CoreVal Core CoreGrth HighGrth
Har�ord Schroders Emerging Mkts Eq Y 11/30/2018
MSCI EM NR USD 12/31/2018
US Fund Diversified Emerging Mkts 12/31/2018
YTD
Peer
group
quar�le
1 year
Peer
group
quar�le
3 years
Peer
group
quar�le
5 years
Peer
group
quar�le
10 years
Peer
group
quar�le
Har�ord Schroders Emerging Mkts Eq Y
MSCI EM NR USD
US Fund Diversified Emerging Mkts
14.58 14.58 9.25 1.65 8.02
15.42 15.42
16.14 16.14 6.88 0.43 7.08
2 2
2 2 1 2 2
2 2 2 3 3
Rolling Returns
Time Period: 1/1/2014 to 12/31/2018
Peer Group (595%): Open End Funds U.S. Diversified Emerging Mkts Rolling Window: 3 Years 3 Months shi� Calcula�on Benchmark: MSCI EM NR USD
01 02 03 04 05 06 07 08 09 10 11 12
2018
01 02 03 04 05 06 07 08 09 10 11 12
5.0
0.0
5.0
10.0
15.0
Har�ord Schroders Emerging Mkts Eq Y MSCI EM NR USD
Re
turn
Performance Rela�ve to Peer Group
Peer Group (595%): Open End Funds U.S. Diversified Emerging Mkts
25.0
20.0
15.0
10.0
5.0
YTD 1 year 3 years 5 years 10 years
0.0
5.0
10.0
15.0
Har�ord Schroders Emerging Mkts Eq Y MSCI EM NR USD US Fund Diversified Emerging Mkts
Re
turn
Returns
As of Date: 12/31/2018 Calcula�on Benchmark: MSCI EM NR USD
Quarter YTD 1 Year 3 Years 5 Years 10 Years25.0
20.0
15.0
10.0
5.0
0.0
5.0
10.0
15.0
8.8
15
.4
15
.4
7.5
14
.6
14
.6
9.2
1.6
8.0
7.5
16
.1
16
.1
6.9
0.4
7.1
Har�ord Schroders Emerging Mkts Eq Y MSCI EM NR USD US Fund Diversified Emerging Mkts
Re
turn
RiskReward
Time Period: 1/1/2014 to 12/31/2018
Peer Group (595%): Open End Funds U.S. Diversified Emerging Mkts Calcula�on Benchmark: MSCI EM NR USD
Std Dev
0.0 3.0 6.0 9.0 12.0 15.0 18.0 21.0
4.0
2.0
0.0
2.0
4.0
Re
turn
Har�ord Schroders Emerging Mkts Eq Y Risk
Time Period: 1/1/2014 to 12/31/2018
Calcula�on Benchmark: MSCI EM NR USD
Inv Bmk1
Return
Std Dev
Downside Devia�on
Alpha
Beta
R2
Sharpe Ra�o (arith)
Tracking Error
1.65
15.19
0.00
0.00
1.00
100.00
0.06
0.00
Monthly Es�mated FundLevel Net Flow
Time Period: 10/1/2016 to 12/31/2018
2017 2018
200M
0M
200M
400M
Har�ord Schroders Emerging Mkts Eq Y US Fund Diversified Emerging Mkts
Es�mat
ed Fund
Level N
et Flow
Mo
nthly R
eturn
Source: Morningstar Direct, as of December 31, 2018 Informa�on provided herein was obtained from thirdparty sources deemed reliable. HighMark and its affiliates make no representa�ons or warran�es with respect to the �meliness, accuracy, or completeness of the
informa�on and bear no liability for any loss arising from its use.
28

MFS Interna�onal Growth IMQGIX
Key Informa�on
Morningstar Category
Morningstar Ra�ng Overall
Incep�on Date
Expense Ra�o
Fund Size (Mil)
Por�olio Date
Manager Name
US Fund Foreign Large Growth
ÙÙÙÙ
1/2/1997
0.90
7,103.75
11/30/2018
Mul�ple
Asset Alloca�on
%
Cash 1.4
US Equity 6.4
NonUS Equity 92.3
Total 100.0
HoldingsBased Style Map
Mic
roS
ma
llM
idLa
rge
Gia
nt
DeepVal CoreVal Core CoreGrth HighGrth
MFS Interna�onal Growth I 11/30/2018
MSCI ACWI Ex USA Growth NR USD 12/31/2018
US Fund Foreign Large Growth 12/31/2018
YTD
Peer
group
quar�le
1 year
Peer
group
quar�le
3 years
Peer
group
quar�le
5 years
Peer
group
quar�le
10 years
Peer
group
quar�le
MFS Interna�onal Growth I
MSCI ACWI Ex USA Growth NR USD
US Fund Foreign Large Growth
8.86 8.86 7.41 3.35 8.62
14.17 14.17 3.15 1.28 7.50
14.43 14.43 4.19 1.69 7.15
1 1 1 1 1
2 2 2 2 3
2 2 2 2 2
Rolling Returns
Time Period: 1/1/2014 to 12/31/2018
Peer Group (595%): Open End Funds U.S. Foreign Large Growth Rolling Window: 3 Years 3 Months shi� Calcula�on Benchmark: MSCI ACWI Ex USA Growth NR USD
01 02 03 04 05 06 07 08 09 10 11 12
2018
01 02 03 04 05 06 07 08 09 10 11 12
5.0
0.0
5.0
10.0
15.0
MFS Interna�onal Growth I MSCI ACWI Ex USA Growth NR USD
Re
turn
Performance Rela�ve to Peer Group
Peer Group (595%): Open End Funds U.S. Foreign Large Growth
25.0
20.0
15.0
10.0
5.0
YTD 1 year 3 years 5 years 10 years
0.0
5.0
10.0
15.0
MFS Interna�onal Growth I MSCI ACWI Ex USA Growth NR USD US Fund Foreign Large Growth
Re
turn
Returns
As of Date: 12/31/2018 Calcula�on Benchmark: MSCI ACWI Ex USA Growth NR USD
Quarter YTD 1 Year 3 Years 5 Years 10 Years25.0
20.0
15.0
10.0
5.0
0.0
5.0
10.0
15.0
11
.7 8.9
8.9
7.4
3.4
8.6
12
.2
14
.4
14
.4
4.2
1.7
7.1
13
.9
14
.2
14
.2
3.2
1.3
7.5
MFS Interna�onal Growth I MSCI ACWI Ex USA Growth NR USD US Fund Foreign Large Growth
Re
turn
RiskReward
Time Period: 1/1/2014 to 12/31/2018
Peer Group (595%): Open End Funds U.S. Foreign Large Growth Calcula�on Benchmark: MSCI ACWI Ex USA Growth NR USD
Std Dev
0.0 3.0 6.0 9.0 12.0 15.0 18.0
2.0
0.0
2.0
4.0
6.0
Re
turn
MFS Interna�onal Growth I Risk
Time Period: 1/1/2014 to 12/31/2018
Calcula�on Benchmark: MSCI ACWI Ex USA Growth NR USD
Inv Bmk1
Return
Std Dev
Downside Devia�on
Alpha
Beta
R2
Sharpe Ra�o (arith)
Tracking Error
3.35
11.49
1.67
1.69
0.94
94.22
0.23
2.84
1.69
11.79
0.00
0.00
1.00
100.00
0.09
0.00
Monthly Es�mated FundLevel Net Flow
Time Period: 1/1/2014 to 12/31/2018
2014 2016 2018
400M
200M
0M
200M
400M
MFS Interna�onal Growth I US Fund Foreign Large Growth
Es�mat
ed Fund
Level N
et Flow
Mo
nthly R
eturn
Source: Morningstar Direct, as of December 31, 2018 Informa�on provided herein was obtained from thirdparty sources deemed reliable. HighMark and its affiliates make no representa�ons or warran�es with respect to the �meliness, accuracy, or completeness of the
informa�on and bear no liability for any loss arising from its use.
29

MFS Global Equity R6MWEMX
Key Informa�on
Morningstar Category
Morningstar Ra�ng Overall
Incep�on Date
Expense Ra�o
Fund Size (Mil)
Por�olio Date
Manager Name
US Fund World Large Stock
ÙÙÙ
6/1/2012
0.83
2,682.67
11/30/2018
Mul�ple
Asset Alloca�on
%
Cash 0.6
US Equity 55.2
NonUS Equity 44.2
Total 100.0
HoldingsBased Style Map
Mic
roS
ma
llM
idLa
rge
Gia
nt
DeepVal CoreVal Core CoreGrth HighGrth
MFS Global Equity R6 11/30/2018
MSCI World NR USD 12/31/2018
US Fund World Large Stock 12/31/2018
YTD
Peer
group
quar�le
1 year
Peer
group
quar�le
3 years
Peer
group
quar�le
5 years
Peer
group
quar�le
10 years
Peer
group
quar�le
MFS Global Equity R6
MSCI ACWI NR USD
US Fund World Large Stock 9.70 9.70 5.85
9.42 9.42
3.65
6.60
9.23
4.26 9.46
9.51 9.51 6.44 4.362 2 2 2
2 2 2 2 2
2 2 2 3 3
Rolling Returns
Time Period: 1/1/2014 to 12/31/2018
Peer Group (595%): Open End Funds U.S. World Large Stock Rolling Window: 3 Years 3 Months shi� Calcula�on Benchmark: MSCI World NR USD
01 02 03 04 05 06 07 08 09 10 11 12
2018
01 02 03 04 05 06 07 08 09 10 11 12
0.0
5.0
10.0
15.0
MFS Global Equity R6 MSCI World NR USD
Re
turn
Performance Rela�ve to Peer Group
Peer Group (595%): Open End Funds U.S. World Large Stock
20.0
15.0
10.0
5.0
0.0
YTD 1 year 3 years 5 years 10 years
5.0
10.0
15.0
MFS Global Equity R6 MSCI World NR USD US Fund World Large Stock
Re
turn
Returns
As of Date: 12/31/2018 Calcula�on Benchmark: MSCI ACWI NR USD
Quarter YTD 1 Year 3 Years 5 Years 10 Years20.0
15.0
10.0
5.0
0.0
5.0
10.0
15.0
12
.1 9.5
9.5
6.4
4.4
12
.8 9.4
9.4
6.6
4.3
9.5
12
.9 9.7
9.7
5.8
3.7
9.2
MFS Global Equity R6 MSCI ACWI NR USD US Fund World Large Stock
Re
turn
RiskReward
Time Period: 1/1/2014 to 12/31/2018
Peer Group (595%): Open End Funds U.S. World Large Stock Calcula�on Benchmark: MSCI ACWI NR USD
Std Dev
0.0 3.0 6.0 9.0 12.0 15.0 18.0
1.0
1.0
3.0
5.0
7.0
9.0
Re
turn
MFS Global Equity R6 Risk
Time Period: 1/1/2014 to 12/31/2018
Calcula�on Benchmark: MSCI World NR USD
Inv Bmk1
Return
Std Dev
Downside Devia�on
Alpha
Beta
R2
Sharpe Ra�o (arith)
Tracking Error
4.56
10.77
0.00
0.00
1.00
100.00
0.36
0.00
4.36
11.07
1.76
0.15
1.00
94.45
0.33
2.61
Monthly Es�mated FundLevel Net Flow
Time Period: 1/1/2014 to 12/31/2018
2014 2016 2018
200M
100M
0M
100M
200M
MFS Global Equity R6 US Fund World Large Stock
Es�mat
ed Fund
Level N
et Flow
Mo
nthly R
eturn
Source: Morningstar Direct, as of December 31, 2018 Informa�on provided herein was obtained from thirdparty sources deemed reliable. HighMark and its affiliates make no representa�ons or warran�es with respect to the �meliness, accuracy, or completeness of the
informa�on and bear no liability for any loss arising from its use.
30

T. Rowe Price New Horizons IPRJIX
Key Informa�on
Morningstar Category
Morningstar Ra�ng Overall
Incep�on Date
Expense Ra�o
Fund Size (Mil)
Por�olio Date
Manager Name
US Fund MidCap Growth
ÙÙÙÙÙ
8/28/2015
0.65
23,325.03
9/30/2018
Henry M. Ellenbogen
Asset Alloca�on
%
Cash 5.5
US Equity 81.6
NonUS Equity 12.7
US Bond 0.1
Other 0.0
Total 100.0
HoldingsBased Style Map
Mic
roS
ma
llM
idLa
rge
Gia
nt
DeepVal CoreVal Core CoreGrth HighGrth
T. Rowe Price New Horizons I 9/30/2018
Russell 2000 Growth TR USD 12/31/2018
US Fund MidCap Growth 12/31/2018
YTD
Peer
group
quar�le
1 year
Peer
group
quar�le
3 years
Peer
group
quar�le
5 years
Peer
group
quar�le
10 years
Peer
group
quar�le
T. Rowe Price New Horizons I
Russell Mid Cap Growth TR USD
US Fund MidCap Growth
4.75 4.75 8.59 7.42 15.12
6.65 6.65 7.11 5.38 12.74
4.17 4.17 13.981 1 1
2 2 2 1 1
3 3 3 3 3
Rolling Returns
Time Period: 1/1/2014 to 12/31/2018
Peer Group (595%): Open End Funds U.S. MidCap Growth Rolling Window: 3 Years 3 Months shi� Calcula�on Benchmark: Russell 2000 Growth TR USD
01 02 03 04 05 06 07 08 09 10 11 12
2018
01 02 03 04 05 06 07 08 09 10 11 12
5.0
10.0
15.0
20.0
25.0
T. Rowe Price New Horizons I Russell 2000 Growth TR USD
Re
turn
Performance Rela�ve to Peer Group
Peer Group (595%): Open End Funds U.S. MidCap Growth
20.0
15.0
10.0
5.0
0.0
YTD 1 year 3 years 5 years 10 years
5.0
10.0
15.0
20.0
T. Rowe Price New Horizons I Russell 2000 Growth TR USD US Fund MidCap Growth
Re
turn
Returns
As of Date: 12/31/2018 Calcula�on Benchmark: Russell Mid Cap Growth TR USD
Quarter YTD 1 Year 3 Years 5 Years 10 Years30.0
22.5
15.0
7.5
0.0
7.5
15.0
22.5
17
.0
4.2
4.2
14
.0
16
.0
4.8
4.8
8.6
7.4
15
.1
17
.6
6.6
6.6
7.1
5.4
12
.7
T. Rowe Price New Horizons I Russell Mid Cap Growth TR USD US Fund MidCap Growth
Re
turn
RiskReward
Time Period: 1/1/2014 to 12/31/2018
Peer Group (595%): Open End Funds U.S. MidCap Growth Calcula�on Benchmark: Russell Mid Cap Growth TR USD
Std Dev
0.0 3.0 6.0 9.0 12.0 15.0 18.0 21.0
0.0
2.0
4.0
6.0
8.0
10.0
12.0
Re
turn
T. Rowe Price New Horizons I Risk
Time Period: 1/1/2014 to 12/31/2018
Calcula�on Benchmark: Russell 2000 Growth TR USD
Inv Bmk1
Return
Std Dev
Downside Devia�on
Alpha
Beta
R2
Sharpe Ra�o (arith)
Tracking Error
5.13
16.30
0.00
0.00
1.00
100.00
0.27
0.00
Monthly Es�mated FundLevel Net Flow
Time Period: 8/1/2015 to 12/31/2018
2015 2016 2017 2018
400M
200M
0M
200M
400M
T. Rowe Price New Horizons I US Fund MidCap Growth
Es�mat
ed Fund
Level N
et Flow
Mo
nthly R
eturn
Source: Morningstar Direct, as of December 31, 2018 Informa�on provided herein was obtained from thirdparty sources deemed reliable. HighMark and its affiliates make no representa�ons or warran�es with respect to the �meliness, accuracy, or completeness of the
informa�on and bear no liability for any loss arising from its use.
31

T. Rowe Price Growth Stock IPRUFX
Key Informa�on
Morningstar Category
Morningstar Ra�ng Overall
Incep�on Date
Expense Ra�o
Fund Size (Mil)
Por�olio Date
Manager Name
US Fund Large Growth
ÙÙÙÙ
8/28/2015
0.52
50,273.64
9/30/2018
Joseph B. Fath
Asset Alloca�on
%
Cash 0.0
US Equity 93.4
NonUS Equity 6.4
Other 0.2
Total 100.0
HoldingsBased Style Map
Mic
roS
ma
llM
idLa
rge
Gia
nt
DeepVal CoreVal Core CoreGrth HighGrth
T. Rowe Price Growth Stock I 9/30/2018
S&P 500 TR USD 12/31/2018
US Fund Large Growth 12/31/2018
YTD
Peer
group
quar�le
1 year
Peer
group
quar�le
3 years
Peer
group
quar�le
5 years
Peer
group
quar�le
10 years
Peer
group
quar�le
T. Rowe Price Growth Stock I
Russell 1000 Growth TR USD
US Fund Large Growth
0.89 0.89
2.18 2.18 8.87
10.45
8.03 13.19
1.51 1.51 11.15 10.40 15.29
2 2 1
2 2 1 1 1
3 3 3 3 3
Rolling Returns
Time Period: 1/1/2014 to 12/31/2018
Peer Group (595%): Open End Funds U.S. Large Growth Rolling Window: 3 Years 3 Months shi� Calcula�on Benchmark: S&P 500 TR USD
01 02 03 04 05 06 07 08 09 10 11 12
2018
01 02 03 04 05 06 07 08 09 10 11 12
5.0
10.0
15.0
20.0
T. Rowe Price Growth Stock I S&P 500 TR USD
Re
turn
Performance Rela�ve to Peer Group
Peer Group (595%): Open End Funds U.S. Large Growth
10.0
5.0
0.0
5.0
10.0
YTD 1 year 3 years 5 years 10 years
15.0
20.0
T. Rowe Price Growth Stock I S&P 500 TR USD US Fund Large Growth
Re
turn
Returns
As of Date: 12/31/2018 Calcula�on Benchmark: Russell 1000 Growth TR USD
Quarter YTD 1 Year 3 Years 5 Years 10 Years25.0
20.0
15.0
10.0
5.0
0.0
5.0
10.0
15.0
20.0
25.0
14.1
0.9 0.9
10.5
15.9
1.5 1.5
11.1 10.4
15.3
15.4
2.2 2.2
8.9 8.0
13.2
T. Rowe Price Growth Stock I Russell 1000 Growth TR USD US Fund Large Growth
Re
turn
RiskReward
Time Period: 1/1/2014 to 12/31/2018
Peer Group (595%): Open End Funds U.S. Large Growth Calcula�on Benchmark: Russell 1000 Growth TR USD
Std Dev
0.0 3.0 6.0 9.0 12.0 15.0 18.0
0.0
2.0
4.0
6.0
8.0
10.0
12.0
14.0
Re
turn
T. Rowe Price Growth Stock I Risk
Time Period: 1/1/2014 to 12/31/2018
Calcula�on Benchmark: S&P 500 TR USD
Inv Bmk1
Return
Std Dev
Downside Devia�on
Alpha
Beta
R2
Sharpe Ra�o (arith)
Tracking Error
8.49
10.94
0.00
0.00
1.00
100.00
0.71
0.00
Monthly Es�mated FundLevel Net Flow
Time Period: 8/1/2015 to 12/31/2018
2016 2017 2018
2,250M
1,500M
750M
0M
750M
T. Rowe Price Growth Stock I US Fund Large Growth
Es�mat
ed Fund
Level N
et Flow
Mo
nthly R
eturn
Source: Morningstar Direct, as of December 31, 2018 Informa�on provided herein was obtained from thirdparty sources deemed reliable. HighMark and its affiliates make no representa�ons or warran�es with respect to the �meliness, accuracy, or completeness of the
informa�on and bear no liability for any loss arising from its use.
32

PGIM Total Return Bond R6PTRQX
Key Informa�on
Morningstar Category
Morningstar Ra�ng Overall
Incep�on Date
Expense Ra�o
Fund Size (Mil)
Por�olio Date
Manager Name
US Fund IntermediateTerm Bond
ÙÙÙÙÙ
12/27/2010
0.41
36,310.24
12/31/2018
Mul�ple
PGIM Total Return Bond R6 FixedInc Sectors (Morningsta
Por�olio Date: 12/31/2018
%
Government 5.8
Government Related 59.6
Municipal Taxable 0.3
Bank Loan 0.4
Corporate Bond 14.7
Agency MortgageBacked 0.7
NonAgency Residen�al MortgageBacked 0.6
Commercial MortgageBacked 5.1
AssetBacked 11.8
Cash & Equivalents 0.5
Other 0.3
Total 100.0
Morningstar Style Box PGIM Total Return Bond R6
Por�olio Date: 12/31/2018
Morningstar Fixed Income Style Box™Hig
hM
ed
Low
Ltd Mod Ext
FixedIncome Stats
Average Eff Dura�on 6.2
Average Eff Maturity
Average Coupon
Average Price
YTD
Peer
group
quar�le
1 year
Peer
group
quar�le
3 years
Peer
group
quar�le
5 years
Peer
group
quar�le
10 years
Peer
group
quar�le
PGIM Total Return Bond R6
BBgBarc US Agg Bond TR USD
US Fund IntermediateTerm Bond
0.63 0.63 3.59 3.59
0.01 0.01 2.06 2.52 3.48
0.52 0.52 2.14 2.24 4.29
3 3 1 1
1 1 3 2 4
2 2 2 3 3
Rolling Returns
Time Period: 1/1/2014 to 12/31/2018
Rolling Window: 3 Years 3 Months shi� Calcula�on Benchmark: BBgBarc US Agg Bond TR USD
01 02 03 04 05 06 07 08 09 10 11 12
2018
01 02 03 04 05 06 07 08 09 10 11 12
1.0
2.0
3.0
4.0
5.0
PGIM Total Return Bond R6 BBgBarc US Agg Bond TR USD US Fund IntermediateTerm Bond
Re
turn
Performance Rela�ve to Peer Group
Peer Group (595%): Open End Funds U.S. IntermediateTerm Bond Calcula�on Benchmark: BBgBarc US Agg Bond TR USD
4.0
2.0
0.0
2.0
4.0
YTD 1 year 3 years 5 years 10 years
6.0
8.0
PGIM Total Return Bond R6 BBgBarc US Agg Bond TR USD US Fund IntermediateTerm Bond
Re
turn
Returns
As of Date: 12/31/2018 Calcula�on Benchmark: BBgBarc US Agg Bond TR USD
Quarter YTD 1 Year 3 Years 5 Years 10 Years1.5
0.8
0.0
0.8
1.5
2.3
3.0
3.8
4.5
5.3
1.4
0.6 0.6
3.6 3.6
1.6
0.0 0.0
2.12.5
3.5
0.9
0.5 0.5
2.1 2.2
4.3
PGIM Total Return Bond R6 BBgBarc US Agg Bond TR USD US Fund IntermediateTerm Bond
Re
turn
RiskReward
Time Period: 1/1/2014 to 12/31/2018
Std Dev
0.0 1.0 2.0 3.0 4.0
0.0
1.0
2.0
3.0
4.0
5.0
Re
turn
PGIM Total Return Bond R6 Risk
Time Period: 1/1/2014 to 12/31/2018
Calcula�on Benchmark: BBgBarc US Agg Bond TR USD
Inv Bmk1
Return
Std Dev
Downside Devia�on
Alpha
Beta
R2
Informa�on Ra�o (geo)
Tracking Error
3.59
3.22
0.58
0.88
1.10
90.32
1.00
1.05
2.52
2.79
0.00
0.00
1.00
100.00
0.00
Monthly Es�mated FundLevel Net Flow
Time Period: 1/1/2014 to 12/31/2018
2014 2016 2018
750M
0M
750M
1,500M
2,250M
PGIM Total Return Bond R6
Source: Morningstar Direct, as of December 31, 2018. Informa�on provided herein was obtained from thirdparty sources deemed reliable. HighMark and its affiliates make no representa�ons or warran�es with respect to the
�meliness, accuracy, or completeness of the informa�on and bear no liability for any loss arising from its use.
33

PIMCO Total Return InstlPTTRX
Key Informa�on
Morningstar Category
Morningstar Ra�ng Overall
Incep�on Date
Expense Ra�o
Fund Size (Mil)
Por�olio Date
Manager Name
US Fund IntermediateTerm Bond
ÙÙÙÙ
5/11/1987
0.55
65,630.90
9/30/2018
Mul�ple
PIMCO Total Return Instl FixedInc Sectors (Morningstar)
Por�olio Date: 9/30/2018
%
Government 5.0
Government Related 27.2
Bank Loan 0.3
Corporate Bond 9.5
Agency MortgageBacked 21.8
NonAgency Residen�al MortgageBacked 1.8
AssetBacked 5.3
Cash & Equivalents 15.0
Swap 1.3
Forward/Future 11.8
Other 1.0
Total 100.0
Morningstar Style Box PIMCO Total Return Instl
Por�olio Date: 9/30/2018
Morningstar Fixed Income Style Box™
Not Available
FixedIncome Stats
Average Eff Dura�on 4.7
Average Eff Maturity 5.7
Average Coupon 4.1
Average Price 105.4
YTD
Peer
group
quar�le
1 year
Peer
group
quar�le
3 years
Peer
group
quar�le
5 years
Peer
group
quar�le
10 years
Peer
group
quar�le
PIMCO Total Return Instl
BBgBarc US Agg Bond TR USD
US Fund IntermediateTerm Bond
0.26 0.26 2.47 2.56 4.71
0.01 0.01 2.06 2.52 3.48
0.52 0.52 2.14 2.24 4.29
2 2 2 2 2
1 1 3 2 4
2 2 2 3 3
Rolling Returns
Time Period: 1/1/2014 to 12/31/2018
Rolling Window: 3 Years 3 Months shi� Calcula�on Benchmark: BBgBarc US Agg Bond TR USD
01 02 03 04 05 06 07 08 09 10 11 12
2018
01 02 03 04 05 06 07 08 09 10 11 12
0.8
1.5
2.3
3.0
3.8
PIMCO Total Return Instl BBgBarc US Agg Bond TR USD US Fund IntermediateTerm Bond
Re
turn
Performance Rela�ve to Peer Group
Peer Group (595%): Open End Funds U.S. IntermediateTerm Bond Calcula�on Benchmark: BBgBarc US Agg Bond TR USD
4.0
2.0
0.0
2.0
4.0
YTD 1 year 3 years 5 years 10 years
6.0
8.0
PIMCO Total Return Instl BBgBarc US Agg Bond TR USD US Fund IntermediateTerm Bond
Re
turn
Returns
As of Date: 12/31/2018 Calcula�on Benchmark: BBgBarc US Agg Bond TR USD
Quarter YTD 1 Year 3 Years 5 Years 10 Years1.5
0.8
0.0
0.8
1.5
2.3
3.0
3.8
4.5
5.3
1.4
0.3 0.3
2.5 2.6
4.7
1.6
0.0 0.0
2.12.5
3.5
0.9
0.5 0.5
2.1 2.2
4.3
PIMCO Total Return Instl BBgBarc US Agg Bond TR USD US Fund IntermediateTerm Bond
Re
turn
RiskReward
Time Period: 1/1/2014 to 12/31/2018
Std Dev
0.0 1.0 2.0 3.0 4.0
0.0
1.0
2.0
3.0
4.0
Re
turn
PIMCO Total Return Instl Risk
Time Period: 1/1/2014 to 12/31/2018
Calcula�on Benchmark: BBgBarc US Agg Bond TR USD
Inv Bmk1
Return
Std Dev
Downside Devia�on
Alpha
Beta
R2
Informa�on Ra�o (geo)
Tracking Error
2.56
2.92
1.06
0.17
0.93
79.06
0.03
1.36
2.52
2.79
0.00
0.00
1.00
100.00
0.00
Monthly Es�mated FundLevel Net Flow
Time Period: 1/1/2014 to 12/31/2018
2014 2016 2018
40,000M
20,000M
0M
20,000M
PIMCO Total Return Instl
Source: Morningstar Direct, as of December 31, 2018. Informa�on provided herein was obtained from thirdparty sources deemed reliable. HighMark and its affiliates make no representa�ons or warran�es with respect to the
�meliness, accuracy, or completeness of the informa�on and bear no liability for any loss arising from its use.
34

AQR Equity Market Neutral R6QMNRX
Key Informa�on
Morningstar Category
Morningstar Ra�ng Overall
Incep�on Date
Expense Ra�o
Fund Size (Mil)
Por�olio Date
Manager Name
US Fund Market Neutral
ÙÙ
10/7/2014
2.11
1,113.13
9/30/2018
Mul�ple
Correla�on Matrix
Time Period: 11/1/2014 to 12/31/2018
1 2 3
1.00
0.24 1.00
0.11 0.18 1.00
1 AQR Equity Market Neutral R6
2 BBgBarc US Agg Bond TR USD
3 S&P 500 TR (1989)
1.00 to 0.80 0.80 to 0.60 0.60 to 0.40 0.40 to 0.20 0.20 to 0.00
0.00 to 0.20 0.20 to 0.40 0.40 to 0.60 0.60 to 0.80 0.80 to 1.00
Return Distribu�on - AQR Equity Market Neutral R6
Time Period: Since Incep�on to 12/31/2018
6.0 5.0 4.0 3.0 2.0 1.0 0.0 1.0 2.0 3.0 4.0 5.0 6.00.0
4.0
8.0
12.0
16.0
20.0
24.0
28.0
AQR Equity Market Neutral R6 US Fund Market Neutral
Nu
mb
er
of
Pe
rio
ds
YTD
Peer
group
quar�le
1 year
Peer
group
quar�le
3 years
Peer
group
quar�le
5 years
Peer
group
quar�le
10 years
Peer
group
quar�le
AQR Equity Market Neutral R6
US Fund Market Neutral
11.65 11.65 0.33
0.74 0.74 1.20 0.79 0.27
4 4 3
3 3 3 3 3
Drawdown
Time Period: 1/1/2014 to 12/31/2018
2014 2015 2016 2017 201820.0
15.0
10.0
5.0
0.0
AQR Equity Market Neutral R6 US Fund Market Neutral
Performance Rela�ve to Peer Group
Peer Group (595%): Open End Funds U.S. Market Neutral
12.5
10.0
7.5
5.0
2.5
YTD 1 year 3 years 5 years 10 years
0.0
2.5
5.0
7.5
10.0
AQR Equity Market Neutral R6 US Fund Market Neutral
Re
turn
Returns
As of Date: 12/31/2018 Calcula�on Benchmark: US Fund Market Neutral
Quarter YTD 1 Year 3 Years 5 Years 10 Years14.0
12.0
10.0
8.0
6.0
4.0
2.0
0.0
2.0
4.0
1.8
11.7 11.7
0.30.5 0.7 0.7
1.2 0.8 0.3
AQR Equity Market Neutral R6 US Fund Market Neutral
Re
turn
Risk-Reward
Time Period: 1/1/2016 to 12/31/2018
Std Dev
0.0 2.0 4.0 6.0 8.0 10.0
4.0
2.0
0.0
2.0
4.0
6.0
8.0
AQR Equity Market Neutral R6 US Fund Market Neutral
Re
turn
AQR Equity Market Neutral R6 - Risk
Time Period: Since Incep�on to 12/31/2018
Calcula�on Benchmark: US Fund Market Neutral
Inv Bmk1 +/ Bmk1
Return
Std Dev
Downside Devia�on
Alpha
Beta
R2
Sharpe Ra�o (arith)
Tracking Error
0.90
1.31
0.00
0.00
1.00
100.00
0.07
0.00
4.89
6.67
3.68
4.00
1.91
14.56
0.61
6.38
3.99
5.36
3.68
4.00
0.91
85.44
0.54
6.38
Monthly Es�mated Fund-Level Net Flow
Time Period: 10/1/2014 to 12/31/2018
2016 2018
200M
0M
200M
400M
AQR Equity Market Neutral R6
Es�mat
ed Fund
Level
Month
ly Retu
rn
Source: Morningstar Direct, as of December 31, 2018. Informa�on provided herein was obtained from thirdparty sources deemed reliable. HighMark and its affiliates make no representa�ons or warran�es with respect to the �meliness, accuracy, or completeness of the informa�on
and bear no liability for any loss arising from its use.
35

American Funds New Perspec�ve R6RNPGX
Key Informa�on
Morningstar Category
Morningstar Ra�ng Overall
Incep�on Date
Expense Ra�o
Fund Size (Mil)
Por�olio Date
Manager Name
US Fund World Large Stock
ÙÙÙÙ
5/1/2009
0.45
78,214.71
12/31/2018
Mul�ple
Asset Alloca�on
%
Cash 3.9
US Equity 51.8
NonUS Equity 42.9
US Bond 1.3
Other 0.0
Total 100.0
HoldingsBased Style Map
Mic
roS
ma
llM
idLa
rge
Gia
nt
DeepVal CoreVal Core CoreGrth HighGrth
American Funds New Perspec�ve R6 12/31/2018
MSCI ACWI NR USD 12/31/2018
US Fund World Large Stock 12/31/2018
YTD
Peer
group
quar�le
1 year
Peer
group
quar�le
3 years
Peer
group
quar�le
5 years
Peer
group
quar�le
10 years
Peer
group
quar�le
American Funds New Perspec�ve R6
MSCI ACWI NR USD
US Fund World Large Stock
5.56 5.56 7.66 6.42
9.42 9.42 6.60 4.26 9.46
9.70 9.70 5.85 3.65 9.23
1 1 1 1
2 2 2 2 2
2 2 2 3 3
Rolling Returns
Time Period: 1/1/2014 to 12/31/2018
Peer Group (595%): Open End Funds U.S. World Large Stock Rolling Window: 3 Years 3 Months shi� Calcula�on Benchmark: MSCI ACWI NR USD
01 02 03 04 05 06 07 08 09 10 11 12
2018
01 02 03 04 05 06 07 08 09 10 11 12
0.0
5.0
10.0
15.0
20.0
American Funds New Perspec�ve R6 MSCI ACWI NR USD
Re
turn
Performance Rela�ve to Peer Group
Peer Group (595%): Open End Funds U.S. World Large Stock
20.0
15.0
10.0
5.0
0.0
YTD 1 year 3 years 5 years 10 years
5.0
10.0
15.0
American Funds New Perspec�ve R6 MSCI ACWI NR USD US Fund World Large Stock
Re
turn
Returns
As of Date: 12/31/2018 Calcula�on Benchmark: MSCI ACWI NR USD
Quarter YTD 1 Year 3 Years 5 Years 10 Years20.0
15.0
10.0
5.0
0.0
5.0
10.0
15.0
13
.1
5.6
5.6
7.7
6.4
12
.8 9.4
9.4
6.6
4.3
9.5
12
.9 9.7
9.7
5.8
3.7
9.2
American Funds New Perspec�ve R6 MSCI ACWI NR USD US Fund World Large Stock
Re
turn
RiskReward
Time Period: 1/1/2014 to 12/31/2018
Peer Group (595%): Open End Funds U.S. World Large Stock Calcula�on Benchmark: MSCI ACWI NR USD
Std Dev
0.0 3.0 6.0 9.0 12.0 15.0 18.0
1.0
1.0
3.0
5.0
7.0
9.0
Re
turn
American Funds New Perspec�ve R6 Risk
Time Period: 1/1/2014 to 12/31/2018
Calcula�on Benchmark: MSCI ACWI NR USD
Inv Bmk1
Return
Std Dev
Downside Devia�on
Alpha
Beta
R2
Sharpe Ra�o (arith)
Tracking Error
4.26
10.87
0.00
0.00
1.00
100.00
0.33
0.00
6.42
11.11
1.96
2.17
0.98
91.85
0.52
3.19
Monthly Es�mated FundLevel Net Flow
Time Period: 1/1/2014 to 12/31/2018
2014 2016 2018
1,000M
500M
0M
500M
American Funds New Perspec�ve R6 US Fund World Large Stock
Es�mat
ed Fund
Level N
et Flow
Mo
nthly R
eturn
Source: Morningstar Direct, as of December 31, 2018 Informa�on provided herein was obtained from thirdparty sources deemed reliable. HighMark and its affiliates make no representa�ons or warran�es with respect to the �meliness, accuracy, or completeness of the
informa�on and bear no liability for any loss arising from its use.
36
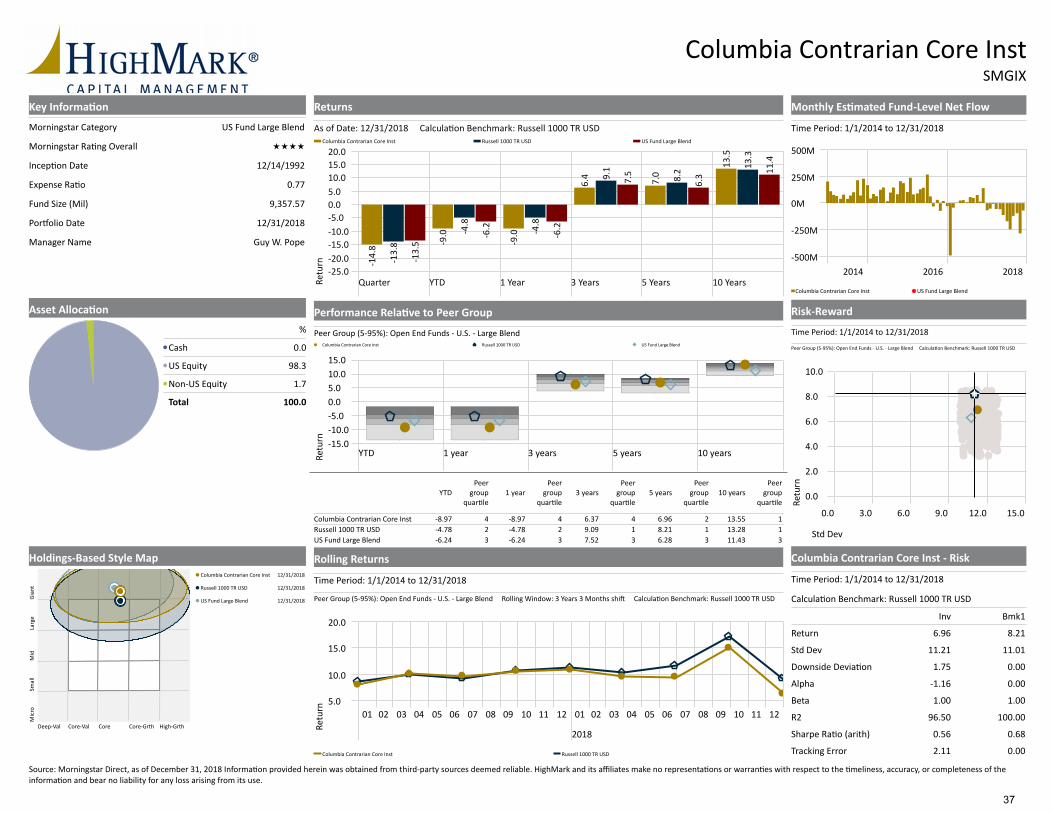
Columbia Contrarian Core InstSMGIX
Key Informa�on
Morningstar Category
Morningstar Ra�ng Overall
Incep�on Date
Expense Ra�o
Fund Size (Mil)
Por�olio Date
Manager Name
US Fund Large Blend
ÙÙÙÙ
12/14/1992
0.77
9,357.57
12/31/2018
Guy W. Pope
Asset Alloca�on
%
Cash 0.0
US Equity 98.3
NonUS Equity 1.7
Total 100.0
HoldingsBased Style Map
Mic
roS
ma
llM
idLa
rge
Gia
nt
DeepVal CoreVal Core CoreGrth HighGrth
Columbia Contrarian Core Inst 12/31/2018
Russell 1000 TR USD 12/31/2018
US Fund Large Blend 12/31/2018
YTD
Peer
group
quar�le
1 year
Peer
group
quar�le
3 years
Peer
group
quar�le
5 years
Peer
group
quar�le
10 years
Peer
group
quar�le
Columbia Contrarian Core Inst
Russell 1000 TR USD
US Fund Large Blend 6.24 6.24 7.52
4.78 4.78
6.28
9.09
11.43
8.21 13.28
8.97 8.97 6.37 6.96 13.554 4 4 2 1
2 2 1 1 1
3 3 3 3 3
Rolling Returns
Time Period: 1/1/2014 to 12/31/2018
Peer Group (595%): Open End Funds U.S. Large Blend Rolling Window: 3 Years 3 Months shi� Calcula�on Benchmark: Russell 1000 TR USD
01 02 03 04 05 06 07 08 09 10 11 12
2018
01 02 03 04 05 06 07 08 09 10 11 12
5.0
10.0
15.0
20.0
Columbia Contrarian Core Inst Russell 1000 TR USD
Re
turn
Performance Rela�ve to Peer Group
Peer Group (595%): Open End Funds U.S. Large Blend
15.0
10.0
5.0
0.0
5.0
YTD 1 year 3 years 5 years 10 years
10.0
15.0
Columbia Contrarian Core Inst Russell 1000 TR USD US Fund Large Blend
Re
turn
Returns
As of Date: 12/31/2018 Calcula�on Benchmark: Russell 1000 TR USD
Quarter YTD 1 Year 3 Years 5 Years 10 Years25.0
20.0
15.0
10.0
5.0
0.0
5.0
10.0
15.0
20.0
14
.8
9.0
9.0
6.4 7.0
13
.5
13
.8
4.8
4.8
9.1
8.2
13
.3
13
.5
6.2
6.2
7.5
6.3
11
.4
Columbia Contrarian Core Inst Russell 1000 TR USD US Fund Large Blend
Re
turn
RiskReward
Time Period: 1/1/2014 to 12/31/2018
Peer Group (595%): Open End Funds U.S. Large Blend Calcula�on Benchmark: Russell 1000 TR USD
Std Dev
0.0 3.0 6.0 9.0 12.0 15.0
0.0
2.0
4.0
6.0
8.0
10.0
Re
turn
Columbia Contrarian Core Inst Risk
Time Period: 1/1/2014 to 12/31/2018
Calcula�on Benchmark: Russell 1000 TR USD
Inv Bmk1
Return
Std Dev
Downside Devia�on
Alpha
Beta
R2
Sharpe Ra�o (arith)
Tracking Error
6.96 8.21
11.21 11.01
1.75 0.00
1.16
1.00
0.00
96.50
1.00
0.56
100.00
2.11
0.68
0.00
Monthly Es�mated FundLevel Net Flow
Time Period: 1/1/2014 to 12/31/2018
2014 2016 2018
500M
250M
0M
250M
500M
Columbia Contrarian Core Inst US Fund Large Blend
Es�mat
ed Fund
Level N
et Flow
Mo
nthly R
eturn
Source: Morningstar Direct, as of December 31, 2018 Informa�on provided herein was obtained from thirdparty sources deemed reliable. HighMark and its affiliates make no representa�ons or warran�es with respect to the �meliness, accuracy, or completeness of the
informa�on and bear no liability for any loss arising from its use.
37

Undiscovered Managers Behavioral Val LUBVLX
Key Informa�on
Morningstar Category
Morningstar Ra�ng Overall
Incep�on Date
Expense Ra�o
Fund Size (Mil)
Por�olio Date
Manager Name
US Fund Small Value
ÙÙÙÙÙ
12/28/1998
0.78
5,115.40
11/30/2018
Mul�ple
Asset Alloca�on
%
Cash 0.3
US Equity 98.8
NonUS Equity 0.4
Other 0.4
Total 100.0
HoldingsBased Style Map
Mic
roS
ma
llM
idLa
rge
Gia
nt
DeepVal CoreVal Core CoreGrth HighGrth
Undiscovered Managers Behavioral Val L 11/30/2018
Russell 2000 Value TR USD 12/31/2018
US Fund Small Value 12/31/2018
YTD
Peer
group
quar�le
1 year
Peer
group
quar�le
3 years
Peer
group
quar�le
5 years
Peer
group
quar�le
10 years
Peer
group
quar�le
Undiscovered Managers Behavioral Val L
Russell 2000 Value TR USD
US Fund Small Value
12.86 12.86 7.37 3.61 10.40
15.27 15.27 5.11 4.89 14.79
15.38 15.38 5.10 2.20 10.66
2 2 2 1 1
1 1 1 1 3
2 2 2 3 3
Rolling Returns
Time Period: 1/1/2014 to 12/31/2018
Peer Group (595%): Open End Funds U.S. Small Value Rolling Window: 3 Years 3 Months shi� Calcula�on Benchmark: Russell 2000 Value TR USD
01 02 03 04 05 06 07 08 09 10 11 12
2018
01 02 03 04 05 06 07 08 09 10 11 12
5.0
10.0
15.0
20.0
Undiscovered Managers Behavioral Val L Russell 2000 Value TR USD
Re
turn
Performance Rela�ve to Peer Group
Peer Group (595%): Open End Funds U.S. Small Value
25.0
20.0
15.0
10.0
5.0
YTD 1 year 3 years 5 years 10 years
0.0
5.0
10.0
15.0
Undiscovered Managers Behavioral Val L Russell 2000 Value TR USD US Fund Small Value
Re
turn
Returns
As of Date: 12/31/2018 Calcula�on Benchmark: Russell 2000 Value TR USD
Quarter YTD 1 Year 3 Years 5 Years 10 Years37.5
30.0
22.5
15.0
7.5
0.0
7.5
15.0
22.5
20
.4 15
.3
15
.3
5.1
4.9
14
.8
18
.7 12
.9
12
.9
7.4
3.6
10
.4
19
.2
15
.4
15
.4
5.1
2.2
10
.7
Undiscovered Managers Behavioral Val L Russell 2000 Value TR USD US Fund Small Value
Re
turn
RiskReward
Time Period: 1/1/2014 to 12/31/2018
Peer Group (595%): Open End Funds U.S. Small Value Calcula�on Benchmark: Russell 2000 Value TR USD
Std Dev
0.0 3.0 6.0 9.0 12.0 15.0 18.0 21.0
4.0
2.0
0.0
2.0
4.0
6.0
8.0
Re
turn
Undiscovered Managers Behavioral Val L Risk
Time Period: 1/1/2014 to 12/31/2018
Calcula�on Benchmark: Russell 2000 Value TR USD
Inv Bmk1
Return
Std Dev
Downside Devia�on
Alpha
Beta
R2
Sharpe Ra�o (arith)
Tracking Error
3.614.89
15.18
0.00
13.76
4.01
0.00
1.00
100.00
0.19
0.00
1.66
0.85
87.22
0.31
5.45
Monthly Es�mated FundLevel Net Flow
Time Period: 1/1/2014 to 12/31/2018
2014 2016 2018
500M
250M
0M
250M
500M
Undiscovered Managers Behavioral Val L US Fund Small Value
Es�mat
ed Fund
Level N
et Flow
Mo
nthly R
eturn
Source: Morningstar Direct, as of December 31, 2018 Informa�on provided herein was obtained from thirdparty sources deemed reliable. HighMark and its affiliates make no representa�ons or warran�es with respect to the �meliness, accuracy, or completeness of the
informa�on and bear no liability for any loss arising from its use.
38
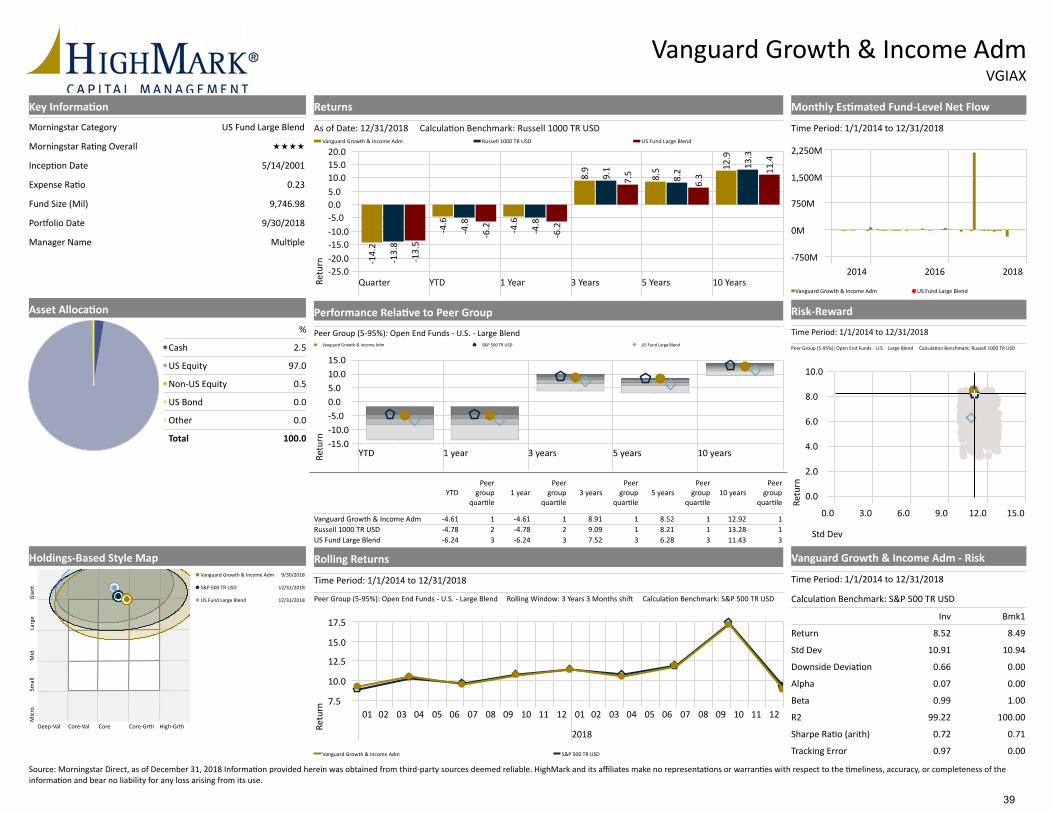
Vanguard Growth & Income AdmVGIAX
Key Informa�on
Morningstar Category
Morningstar Ra�ng Overall
Incep�on Date
Expense Ra�o
Fund Size (Mil)
Por�olio Date
Manager Name
US Fund Large Blend
ÙÙÙÙ
5/14/2001
0.23
9,746.98
9/30/2018
Mul�ple
Asset Alloca�on
%
Cash 2.5
US Equity 97.0
NonUS Equity 0.5
US Bond 0.0
Other 0.0
Total 100.0
HoldingsBased Style Map
Mic
roS
ma
llM
idLa
rge
Gia
nt
DeepVal CoreVal Core CoreGrth HighGrth
Vanguard Growth & Income Adm 9/30/2018
S&P 500 TR USD 12/31/2018
US Fund Large Blend 12/31/2018
YTD
Peer
group
quar�le
1 year
Peer
group
quar�le
3 years
Peer
group
quar�le
5 years
Peer
group
quar�le
10 years
Peer
group
quar�le
Vanguard Growth & Income Adm
Russell 1000 TR USD
US Fund Large Blend
4.78 4.78
4.61 4.61
9.09
8.91
8.21
8.52
13.28
12.92
6.24 6.24 7.52 6.28 11.43
1 1 1 1 1
2 2 1 1 1
3 3 3 3 3
Rolling Returns
Time Period: 1/1/2014 to 12/31/2018
Peer Group (595%): Open End Funds U.S. Large Blend Rolling Window: 3 Years 3 Months shi� Calcula�on Benchmark: S&P 500 TR USD
01 02 03 04 05 06 07 08 09 10 11 12
2018
01 02 03 04 05 06 07 08 09 10 11 12
7.5
10.0
12.5
15.0
17.5
Vanguard Growth & Income Adm S&P 500 TR USD
Re
turn
Performance Rela�ve to Peer Group
Peer Group (595%): Open End Funds U.S. Large Blend
15.0
10.0
5.0
0.0
5.0
YTD 1 year 3 years 5 years 10 years
10.0
15.0
Vanguard Growth & Income Adm S&P 500 TR USD US Fund Large Blend
Re
turn
Returns
As of Date: 12/31/2018 Calcula�on Benchmark: Russell 1000 TR USD
Quarter YTD 1 Year 3 Years 5 Years 10 Years25.0
20.0
15.0
10.0
5.0
0.0
5.0
10.0
15.0
20.0
14
.2
4.6
4.6
8.9
8.5
12
.9
13
.8
4.8
4.8
9.1
8.2
13
.3
13
.5
6.2
6.2
7.5
6.3
11
.4
Vanguard Growth & Income Adm Russell 1000 TR USD US Fund Large Blend
Re
turn
RiskReward
Time Period: 1/1/2014 to 12/31/2018
Peer Group (595%): Open End Funds U.S. Large Blend Calcula�on Benchmark: Russell 1000 TR USD
Std Dev
0.0 3.0 6.0 9.0 12.0 15.0
0.0
2.0
4.0
6.0
8.0
10.0
Re
turn
Vanguard Growth & Income Adm Risk
Time Period: 1/1/2014 to 12/31/2018
Calcula�on Benchmark: S&P 500 TR USD
Inv Bmk1
Return
Std Dev
Downside Devia�on
Alpha
Beta
R2
Sharpe Ra�o (arith)
Tracking Error
8.52
10.91
8.49
0.66
10.94
0.00
0.07
0.99
99.22
0.00
0.72
0.97
1.00
100.00
0.71
0.00
Monthly Es�mated FundLevel Net Flow
Time Period: 1/1/2014 to 12/31/2018
2014 2016 2018
750M
0M
750M
1,500M
2,250M
Vanguard Growth & Income Adm US Fund Large Blend
Es�mat
ed Fund
Level N
et Flow
Mo
nthly R
eturn
Source: Morningstar Direct, as of December 31, 2018 Informa�on provided herein was obtained from thirdparty sources deemed reliable. HighMark and its affiliates make no representa�ons or warran�es with respect to the �meliness, accuracy, or completeness of the
informa�on and bear no liability for any loss arising from its use.
39