part 13 gas well testing
TRANSCRIPT

8/13/2019 Part 13 Gas Well Testing
http://slidepdf.com/reader/full/part-13-gas-well-testing 1/47
Well Test Analysis 1
MOnur September 2013

8/13/2019 Part 13 Gas Well Testing
http://slidepdf.com/reader/full/part-13-gas-well-testing 2/47
Well Test Analysis 2
U on com letion of this section, the student should be able to:
1. Identify the range of validity of each of the following analysisvariables: pressure, pressure-squared, pseudopressure, andadjusted pressure.
2. Estimate pressure drop due to non-Darcy flow.
3. Analyze flow and buildup tests for gas wells using semiloganalysis and any of the following analysis variables: pressure,pressure-squared, pseudopressure, and adjusted pressure.
MOnur September 2013
8/13/2019 Part 13 Gas Well Testing
http://slidepdf.com/reader/full/part-13-gas-well-testing 3/47
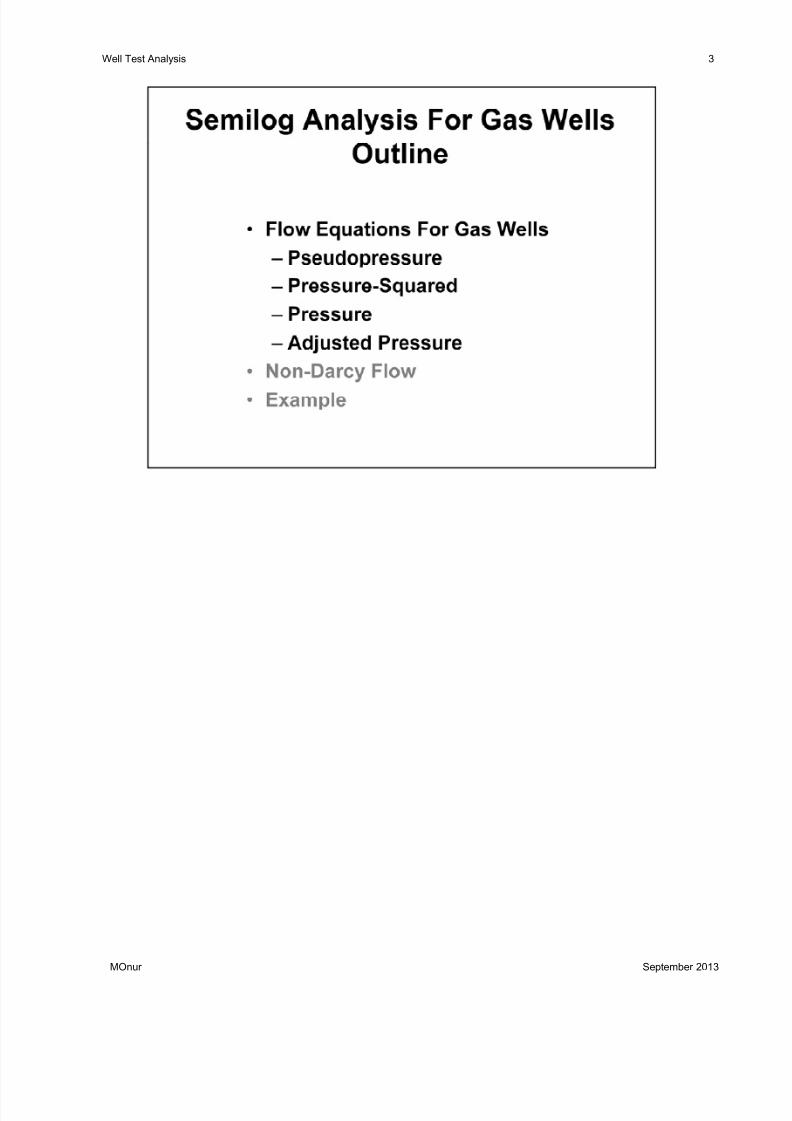
Well Test Analysis 3
MOnur September 2013

8/13/2019 Part 13 Gas Well Testing
http://slidepdf.com/reader/full/part-13-gas-well-testing 4/47
Well Test Analysis 4
The PDE describin flow of a sli htl com ressible li uid ofconstant viscosity in a homogeneous porous medium is thediffusivity equation. This equation is derived from 3 principles -the continuity equation, or conservation of mass, the equation of
state for slightly compressible liquids, and Darcy’s law. OtherPDE’s must be developed to describe gas flow or multi-phase
.
The diffusivity equation is a linear equation, allowing us to usesuperposition in both space and time to develop solutions forcomplex geometries and variable rate histories from simple singlewell solutions.
MOnur September 2013

8/13/2019 Part 13 Gas Well Testing
http://slidepdf.com/reader/full/part-13-gas-well-testing 5/47
Well Test Analysis 5
Nomenclature
p - absolute pressure, psi
V - volume, ft 3
z - real gas deviation factor, dimensionlessn - number of moles
R - ideal gas constant, 10.72 (ft 3)(lb)/(mole)(in 2)(°R)
T - temperature, °R
MOnur September 2013
8/13/2019 Part 13 Gas Well Testing
http://slidepdf.com/reader/full/part-13-gas-well-testing 6/47
Well Test Analysis 6
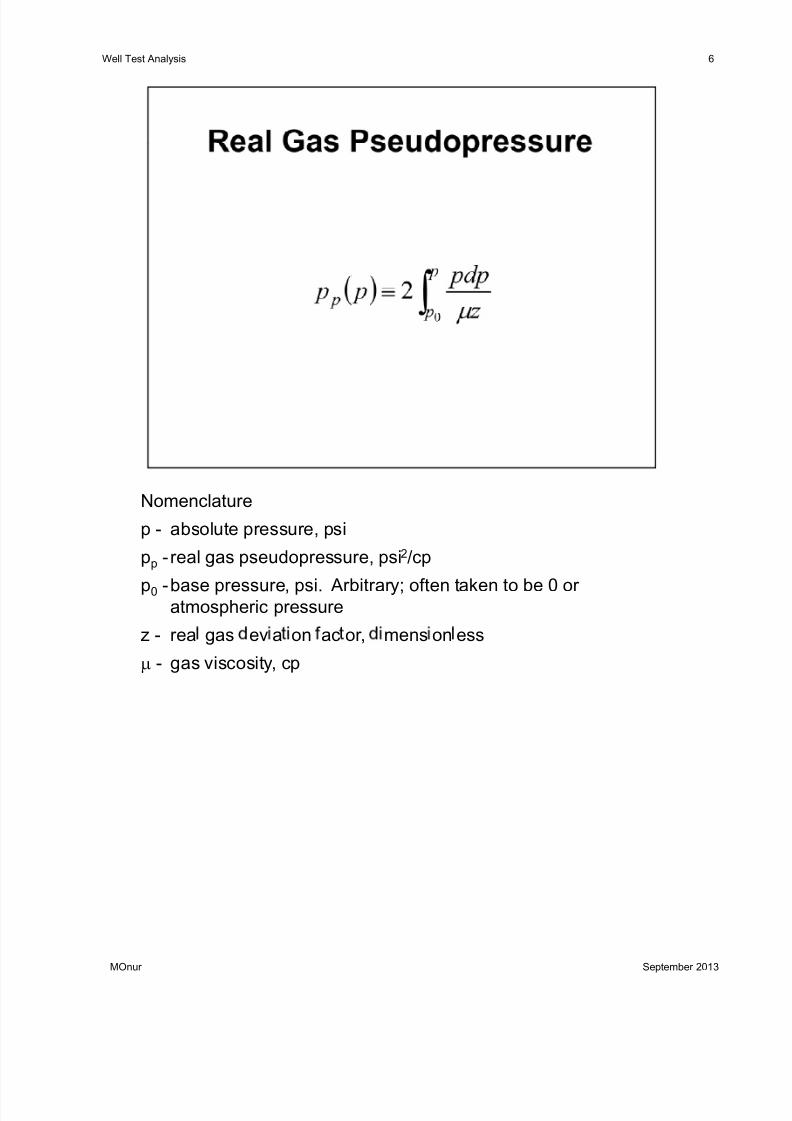
Nomenclature
p - absolute pressure, psi
pp - real gas pseudopressure, psi 2/cp
p0 -base pressure, psi. Arbitrary; often taken to be 0 oratmospheric pressure
z - rea gas ev a on ac or, mens on ess
μ - gas viscosity, cp
MOnur September 2013

8/13/2019 Part 13 Gas Well Testing
http://slidepdf.com/reader/full/part-13-gas-well-testing 7/47
Well Test Analysis 7
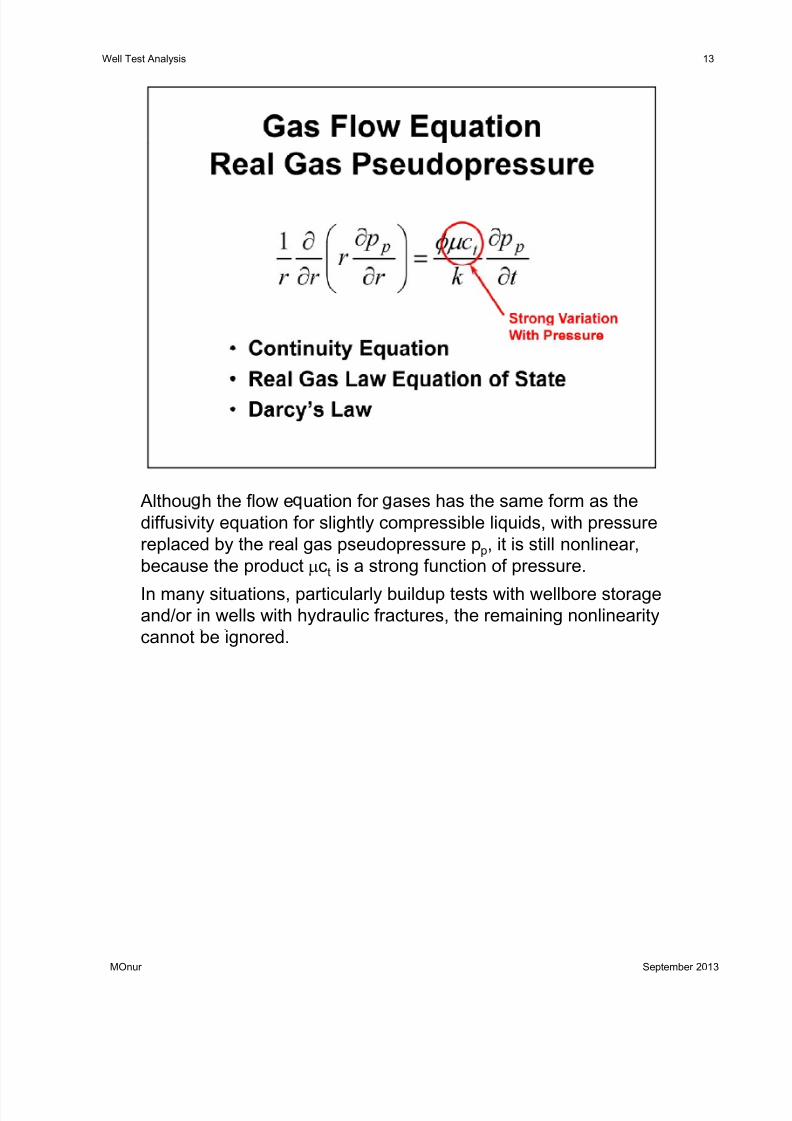
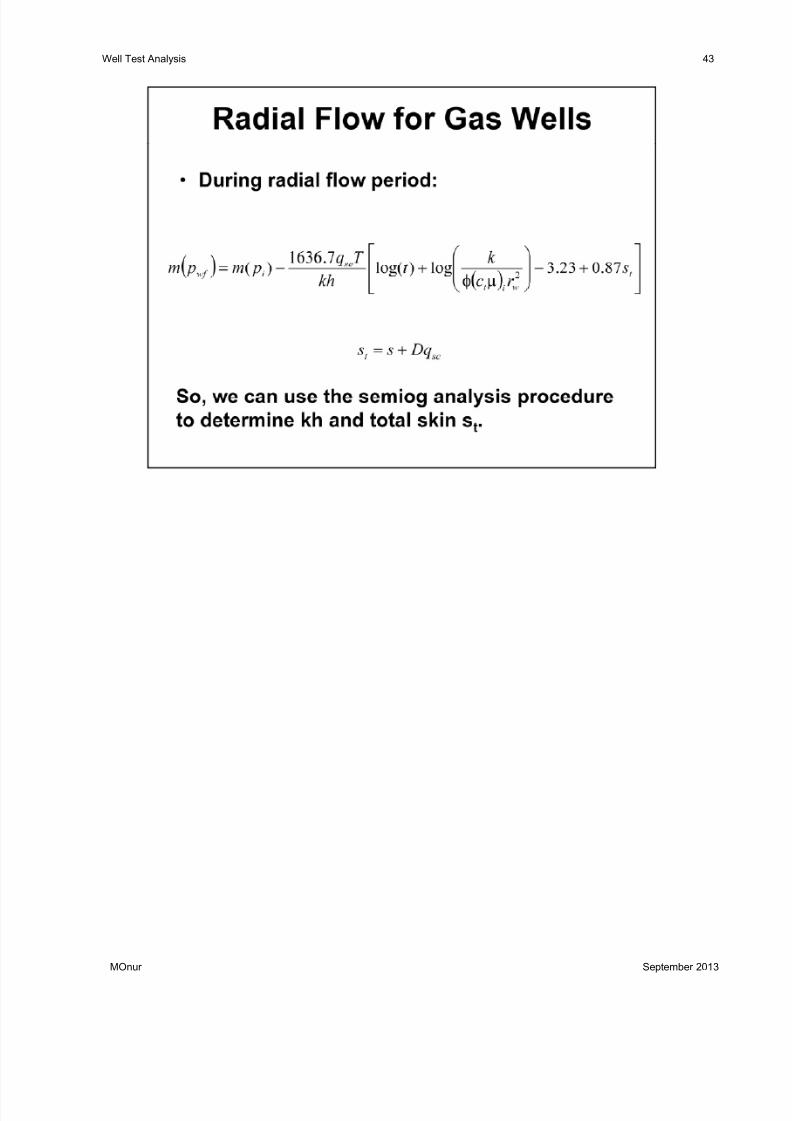
The flow e uation for ases has the same form as the diffusivitequation for slightly compressible liquids, with pressure replacedby the real gas pseudopressure p p.
This PDE is exact , if the 3 assumptions used in its derivation areapplicable.However, unlike the diffusivit e uation for li uids, it is nonlinear ,because the product μc t is a strong function of pressure.
MOnur September 2013

8/13/2019 Part 13 Gas Well Testing
http://slidepdf.com/reader/full/part-13-gas-well-testing 8/47
Well Test Analysis 8
If we assume that the term z is constant, then we can write thegas flow equation in a form similar to that of the diffusivityequation, with pressure replaced by pressure-squared.
This PDE is approximate because of the assumption of constantμz.It is also nonlinear , because the roduct c is a stron function ofpressure.
MOnur September 2013

8/13/2019 Part 13 Gas Well Testing
http://slidepdf.com/reader/full/part-13-gas-well-testing 9/47

8/13/2019 Part 13 Gas Well Testing
http://slidepdf.com/reader/full/part-13-gas-well-testing 10/47
Well Test Analysis 10
If we assume that the term / z is constant, then we can write thegas flow equation in a form similar to that of the diffusivityequation using pressure as the dependent variable.
This PDE is approximate because of the assumption of constantp/μz.It is also nonlinear , because the roduct c is a stron function ofpressure.
MOnur September 2013

8/13/2019 Part 13 Gas Well Testing
http://slidepdf.com/reader/full/part-13-gas-well-testing 11/47
Well Test Analysis 11
This fi ure shows the behavior of the term / z with ressure at200 deg F, for different gas gravities. The term p/ μz is fairlyconstant at high pressures, greater than approximately 3000 psi.
MOnur September 2013
8/13/2019 Part 13 Gas Well Testing
http://slidepdf.com/reader/full/part-13-gas-well-testing 12/47
Well Test Analysis 12
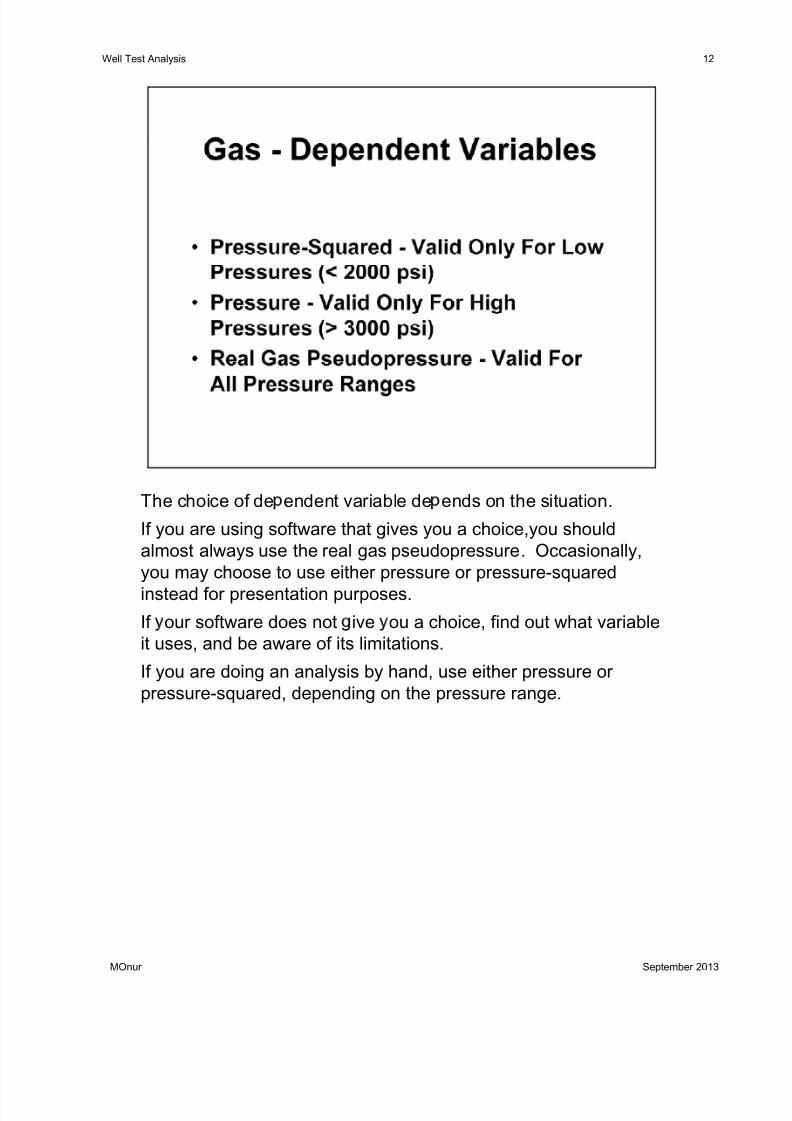
The choice of de endent variable de ends on the situation.
If you are using software that gives you a choice,you shouldalmost always use the real gas pseudopressure. Occasionally,you may choose to use either pressure or pressure-squaredinstead for presentation purposes.If our software does not ive ou a choice, find out what variableit uses, and be aware of its limitations.
If you are doing an analysis by hand, use either pressure orpressure-squared, depending on the pressure range.
MOnur September 2013
8/13/2019 Part 13 Gas Well Testing
http://slidepdf.com/reader/full/part-13-gas-well-testing 13/47

8/13/2019 Part 13 Gas Well Testing
http://slidepdf.com/reader/full/part-13-gas-well-testing 14/47
Well Test Analysis 14
Agarwal proposed the use of the real gas pseudotime function tofurther linearize the gas flow equation. Subsequent studies found thatit is particularly useful for analysis of buildup tests distorted bywellbore storage when using type curves for slightly compressible
liquids.Because the pressure inside the integral is a function of position in the
,evaluated. A useful rule of thumb is that for buildup tests, the pressureshould be evaluated at the wellbore, and for flow tests, it should beevaluated at current average reservoir pressure. For flow tests ininfinite-acting reservoirs, this is equivalent to using time as theindependent variable.
p - absolute pressure, psic t - total compressibility, psi -1
Δt - shutin time, hrs
Δtap - pseudotime, psi-hr/cp
MOnur September 2013
μ - gas viscosity, cp

8/13/2019 Part 13 Gas Well Testing
http://slidepdf.com/reader/full/part-13-gas-well-testing 15/47
Well Test Analysis 15
Pseudopressure and pseudotime provide excellent results when usinganalysis methods for slightly compressible liquids to analyze gas welltests. However, they are inconvenient for two reasons.
1) The units of pseudopressure and pseudotime are such that the
numeric values of these variables will often be in the range of 105
to10 9.
of equations for oil and gas wells for each type of analysis to beperformed.
Adjusted pressure and adjusted time are defined by multiplyingpseudopressure and pseudotime by constants. This gives the newvariables the same units, and similar ranges, as pressure and time,respec ve y.
The equations for analysis of gas well tests in terms of adjustedpressure and adjusted time are quickly obtained from those foranalysis of oil well tests by simple substitutions.
Nomenclature:
MOnur September 2013
reservoir pressure. Other reference pressures (such as currentaverage drainage area pressure) may also be used.

8/13/2019 Part 13 Gas Well Testing
http://slidepdf.com/reader/full/part-13-gas-well-testing 16/47
Well Test Analysis 16
When usin ad usted ressure and ad usted time, the Horner timeratio is calculated using the actual producing time, t p. For a flowtest in an infinite-acting reservoir, this is equivalent to evaluatingthe adjusted time during the flow period using the initial reservoir
pressure instead of the flowing wellbore pressure.
MOnur September 2013

8/13/2019 Part 13 Gas Well Testing
http://slidepdf.com/reader/full/part-13-gas-well-testing 17/47
Well Test Analysis 17
Oil
Flow Test Buildup Test
Semilog graphvariables
pwf vs. t pws vs. ( t p + Δt )/Δt
Bq ooo μ 6.162 Bq ooo μ 6.162
mh= mh=
Skin factor +
−−= 23.3log151.1 2
1
wt o
hr i
r c
k m p p
sμ φ
+
−
−= 23.3log151.1
21
wt o
wf hr
r c
k m
p ps
μ φ
Definition of p MBH,D NA
( )ooo Bq
p pkhμ 6.70
* −
Gas, Usin Ad usted Variables
Flow Test Buildup Test
Semilog graphvariables
pa,wf vs. t pa,ws vs. ( t p+ Δt a)/Δt a
Permeabilitymh
Bqk igig μ 6.162= mh
Bqk igig μ 6.162=
− 1hr aia k p pSkin factor
+
−= .og. 2,,
wtii r cms
μ φ
+
−−
= 23.3log151.1' 2,1,
wtii
wf ahr a
r cms
μ φ
Definition of p MBH,D NA
( )igig
aa
Bq p pkh
μ 6.70
* −
MOnur September 2013

8/13/2019 Part 13 Gas Well Testing
http://slidepdf.com/reader/full/part-13-gas-well-testing 18/47
Well Test Analysis 18
Gas, Using Pressure and Time
Flow Test Buildup Test
Semilog graphvariables
pwf vs. t pws vs. ( t p + Δt )/Δt
Permeabilitymh
k gg.
=mh
k gg.
=
Skin factor +
−−= 23.3log151.1' 2
1
wt
hr i
r c
k m
p ps
μ φ +
−
−= 23.3log151.1' 2
1
wt
wf hr
r c
k m
p ps
μ φ
Definition of p MBH,D NA
( )μ gg Bq
p pkh
6.70* −
Gas, Using Pressure Squared and Time Flow Test Buildup Test
Semilog graphvariables p2wf vs. t p2ws vs. ( t p + Δt )/Δt
Permeabilitymh
zT qk
g μ 1637=
mh
zT qk
g μ 1637=
Skin factor +
−−= 23.3log151.1' 21
wt
hr i
r c
k m
p ps
μ φ +
−
−= 23.3log151.1' 2
1
wt
wf hr
r c
k m
p ps
μ φ
Definition of p MBH,D NA
( )μ zT q
p pkh
g711
22* −
Gas, Using Pseudopressure and Time
Semilog graphvariables
p p vs. t p p vs. ( t p + Δt )/Δt
Permeabilitymh
T qk
g1637=
mh
T qk
g1637=
Skin factor +
−−
= 23.3log151.1' 21,,
wt
hr pi p
r c
k m
p ps
μ φ +
−
−= 23.3log151.1' 2
,1,
wt
wf phr p
r c
k m
p ps
μ φ
Definition of p MBH,D NA
( )T q
p pkh
g
p p
711
* −
MOnur September 2013

8/13/2019 Part 13 Gas Well Testing
http://slidepdf.com/reader/full/part-13-gas-well-testing 19/47
Well Test Analysis 19
MOnur September 2013

8/13/2019 Part 13 Gas Well Testing
http://slidepdf.com/reader/full/part-13-gas-well-testing 20/47
Well Test Analysis 20
MOnur September 2013

8/13/2019 Part 13 Gas Well Testing
http://slidepdf.com/reader/full/part-13-gas-well-testing 21/47
Well Test Analysis 21
The “true” skin due to dama e or stimulation cannot be obtainedfrom a single constant-rate test.
Nomenclature
s - “true” skin due to damage or stimulation, dimensionless
s’ - apparent or effective skin factor that would be measured,
D - non-Darcy flow coefficient (assumed constant), D/Mscf
qg - gas flow rate, Mscf/D
MOnur September 2013

8/13/2019 Part 13 Gas Well Testing
http://slidepdf.com/reader/full/part-13-gas-well-testing 22/47
Well Test Analysis 22
The table below was obtained from a series of different buildutests on a single well, following flow periods at different rates.
qg s'
3500 5.116300 6.73
Linear least-squares fit shows that the true skin s is 3.4, and thenon-Darcy flow coefficient D is 5.1x10 -4 D/Mscf.
8900 7.85
Note: When using this method, care should be taken to ensurethat the permeabilities obtained from the different tests arecomparable. If the permeabilities from the several tests aresignificantly different, the skin factors are likely to be in error.
MOnur September 2013
8/13/2019 Part 13 Gas Well Testing
http://slidepdf.com/reader/full/part-13-gas-well-testing 23/47
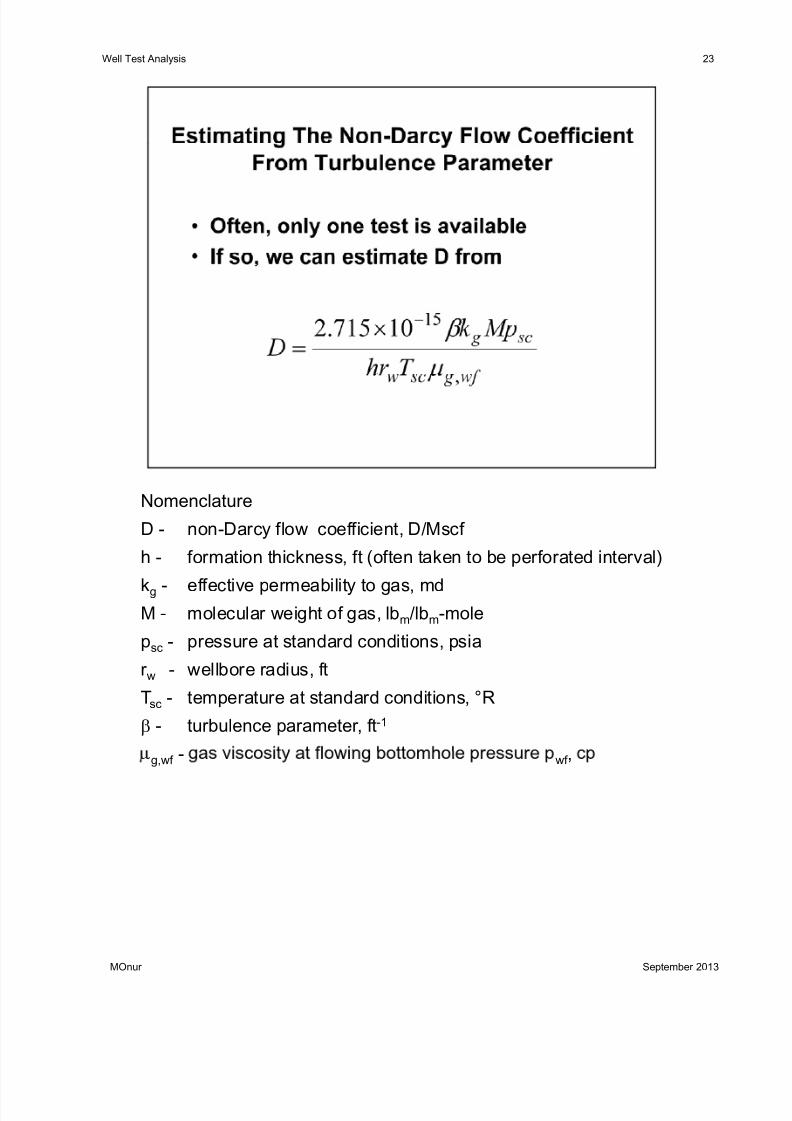
Well Test Analysis 23
Nomenclature
D - non-Darcy flow coefficient, D/Mscf
h - formation thickness, ft (often taken to be perforated interval)
kg - effective permeability to gas, mdM - molecular weight of gas, lb m/lbm-mole
p sc - pressure at standard conditions, psia
r w - wellbore radius, ft
Tsc - temperature at standard conditions, °R
β - turbulence parameter, ft -1
g,wf - wf ,
MOnur September 2013

8/13/2019 Part 13 Gas Well Testing
http://slidepdf.com/reader/full/part-13-gas-well-testing 24/47
Well Test Analysis 24
Nomenclature
D - non-Darcy flow coefficient, D/Mscf
h - formation thickness, ft (often taken to be perforated interval)
kg - effective permeability to gas, mdM - molecular weight of gas, lb m/lbm-mole
p sc - pressure at standard conditions, psia
r w - wellbore radius, ft
Tsc - temperature at standard conditions, °R
β - turbulence parameter, ft -1
g,wf - wf ,
MOnur September 2013

8/13/2019 Part 13 Gas Well Testing
http://slidepdf.com/reader/full/part-13-gas-well-testing 25/47
Well Test Analysis 25
Warnin ! This rovides onl a ver crude estimate of themagnitude of the turbulence parameter. Further, it assumes thatnon-Darcy flow occurs in the formation near the wellbore ratherthan through the perforations. In a gravel-packed well, the most
significant non-Darcy pressure drop may occur in the perforationchannels through the casing.
Nomenclature
kg - effective permeability to gas, md
β - turbulence parameter, ft -1
- ,
MOnur September 2013
8/13/2019 Part 13 Gas Well Testing
http://slidepdf.com/reader/full/part-13-gas-well-testing 26/47
Well Test Analysis 26
MOnur September 2013

8/13/2019 Part 13 Gas Well Testing
http://slidepdf.com/reader/full/part-13-gas-well-testing 27/47
8/13/2019 Part 13 Gas Well Testing
http://slidepdf.com/reader/full/part-13-gas-well-testing 28/47
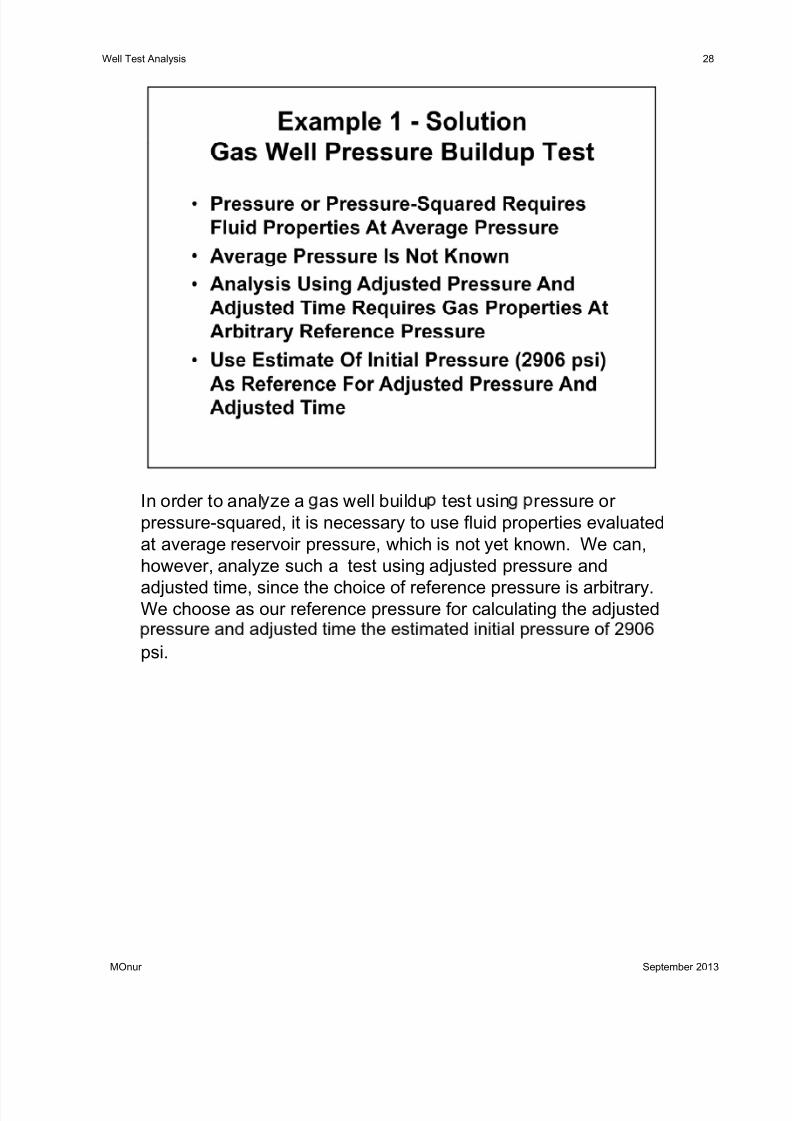
Well Test Analysis 28
In order to anal ze a as well buildu test usin ressure orpressure-squared, it is necessary to use fluid properties evaluatedat average reservoir pressure, which is not yet known. We can,however, analyze such a test using adjusted pressure and
adjusted time, since the choice of reference pressure is arbitrary.We choose as our reference pressure for calculating the adjusted
psi.
MOnur September 2013

8/13/2019 Part 13 Gas Well Testing
http://slidepdf.com/reader/full/part-13-gas-well-testing 29/47
Well Test Analysis 29
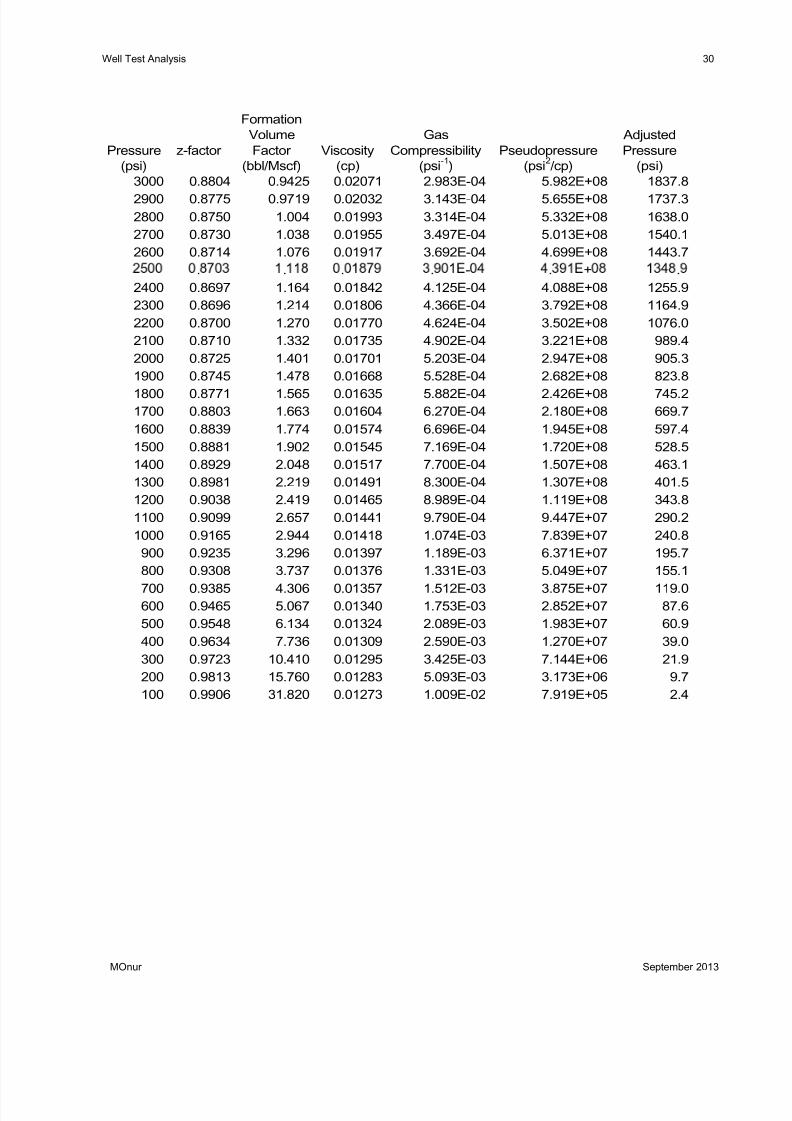
We build a table of fluid ro erties with ressure, usin theproperties at the estimated initial pressure of 2906 psi as thereference pressure for calculating adjusted pressure and adjustedtime.
Note: The values iven in this table and the rest of this ma differfrom your calculated values because of round-off error.
MOnur September 2013
8/13/2019 Part 13 Gas Well Testing
http://slidepdf.com/reader/full/part-13-gas-well-testing 30/47
Well Test Analysis 30
FormationVolume Gas Adjusted
Pressure(psi)
z-factor Factor(bbl/Mscf)
Viscosity(cp)
Compressibility(psi -1)
Pseudopressure(psi 2/cp)
Pressure(psi)
3000 0.8804 0.9425 0.02071 2.983E-04 5.982E+08 1837.8
2900 0.8775 0.9719 0.02032 3.143E-04 5.655E+08 1737.32800 0.8750 1.004 0.01993 3.314E-04 5.332E+08 1638.02700 0.8730 1.038 0.01955 3.497E-04 5.013E+08 1540.12600 0.8714 1.076 0.01917 3.692E-04 4.699E+08 1443.7
. . . . - . + .2400 0.8697 1.164 0.01842 4.125E-04 4.088E+08 1255.92300 0.8696 1.214 0.01806 4.366E-04 3.792E+08 1164.92200 0.8700 1.270 0.01770 4.624E-04 3.502E+08 1076.02100 0.8710 1.332 0.01735 4.902E-04 3.221E+08 989.42000 0.8725 1.401 0.01701 5.203E-04 2.947E+08 905.31900 0.8745 1.478 0.01668 5.528E-04 2.682E+08 823.8
1800 0.8771 1.565 0.01635 5.882E-04 2.426E+08 745.21700 0.8803 1.663 0.01604 6.270E-04 2.180E+08 669.71600 0.8839 1.774 0.01574 6.696E-04 1.945E+08 597.41500 0.8881 1.902 0.01545 7.169E-04 1.720E+08 528.51400 0.8929 2.048 0.01517 7.700E-04 1.507E+08 463.11300 0.8981 2.219 0.01491 8.300E-04 1.307E+08 401.51200 0.9038 2.419 0.01465 8.989E-04 1.119E+08 343.81100 0.9099 2.657 0.01441 9.790E-04 9.447E+07 290.21000 0.9165 2.944 0.01418 1.074E-03 7.839E+07 240.8
900 0.9235 3.296 0.01397 1.189E-03 6.371E+07 195.7800 0.9308 3.737 0.01376 1.331E-03 5.049E+07 155.1
700 0.9385 4.306 0.01357 1.512E-03 3.875E+07 119.0600 0.9465 5.067 0.01340 1.753E-03 2.852E+07 87.6500 0.9548 6.134 0.01324 2.089E-03 1.983E+07 60.9400 0.9634 7.736 0.01309 2.590E-03 1.270E+07 39.0300 0.9723 10.410 0.01295 3.425E-03 7.144E+06 21.9200 0.9813 15.760 0.01283 5.093E-03 3.173E+06 9.7100 0.9906 31.820 0.01273 1.009E-02 7.919E+05 2.4
MOnur September 2013

8/13/2019 Part 13 Gas Well Testing
http://slidepdf.com/reader/full/part-13-gas-well-testing 31/47
Well Test Analysis 31
Test Time
(hr)
AdjustedTime
(hr)
MeasuredPressure
(psi)
PressureSquared
(psi 2)
AdjustedPressure
(psi)
HornerTime Ratio
AdjustedHorner
Time Ratio
0.001 0.00068 1842.4 3394.4 778.3 2000001 29604200.002 0.00136 1878.3 3528.0 806.6 1000001 1468106
0.003 0.00206 1909.2 3645.0 831.3 666668 9714880.004 0.00276 1935.8 3747.3 852.8 500001 7237990.005 0.00347 1959.0 3837.7 871.6 400001 5755740.006 0.00419 1979.3 3917.6 888.3 333334 477021
. . . . .0.008 0.00564 2012.7 4051.0 915.9 250001 3543470.009 0.00638 2026.6 4107.1 927.5 222223 313648
0.01 0.00711 2038.8 4156.7 937.7 200001 2811880.02 0.0146 2108.3 4444.9 996.5 100001 1370620.03 0.0222 2135.2 4559.1 1019.6 66668 900550.04 0.0299 2148.6 4616.5 1031.2 50001 66922
. . . . .0.06 0.0453 2162.4 4676.0 1043.2 33334 441320.07 0.0531 2166.7 4694.6 1046.9 28572 376930.08 0.0608 2170.2 4709.8 1050.0 25001 328880.09 0.0686 2173.2 4722.8 1052.6 22223 29165
0.1 0.0763 2175.8 4734.1 1054.8 20001 261960.2 0.154 2191.7 4803.5 1068.7 10001 12961
. . . . .0.4 0.311 2206.4 4868.2 1081.6 5001 64280.5 0.390 2211.0 4888.5 1085.7 4001 51300.6 0.469 2214.8 4905.3 1089.0 3334 4268
0.7 0.548 2217.9 4919.1 1091.8 2858 36530.8 0.627 2220.6 4931.1 1094.2 2501 31930.9 0.706 2223.0 4941.7 1096.3 2223 2835
1 0.785 2225.2 4951.5 1098.2 2001 25492 1.579 2239.1 5013.6 1110.5 1001 12683 2.376 2247.1 5049.5 1117.6 667.7 842.84 3.175 2252.8 5075.1 1122.7 501.0 630.95 3.975 2257.2 5095.0 1126.6 401.0 504.16 4.777 2260.8 5111.2 1129.8 334.3 419.77 5.580 2263.8 5124.8 1132.5 286.7 359.48 6.383 2266.4 5136.6 1134.8 251.0 314.3
9 7.187 2268.7 5147.0 1136.9 223.2 279.310 7.992 2270.8 5156.5 1138.7 201.0 251.220 16.06 2284.3 5218.0 1150.8 101.0 125.530 24.17 2292.1 5253.7 1157.8 67.67 83.7640 32.29 2297.6 5279.0 1162.8 51.00 62.9450 40.43 2301.9 5298.7 1166.6 41.00 50.47
MOnur September 2013
60 48.57 2305.3 5314.4 1169.7 34.33 42.1870 56.73 2308.2 5327.8 1172.3 29.57 36.2580 64.90 2310.7 5339.3 1174.6 26.00 31.82
8/13/2019 Part 13 Gas Well Testing
http://slidepdf.com/reader/full/part-13-gas-well-testing 32/47
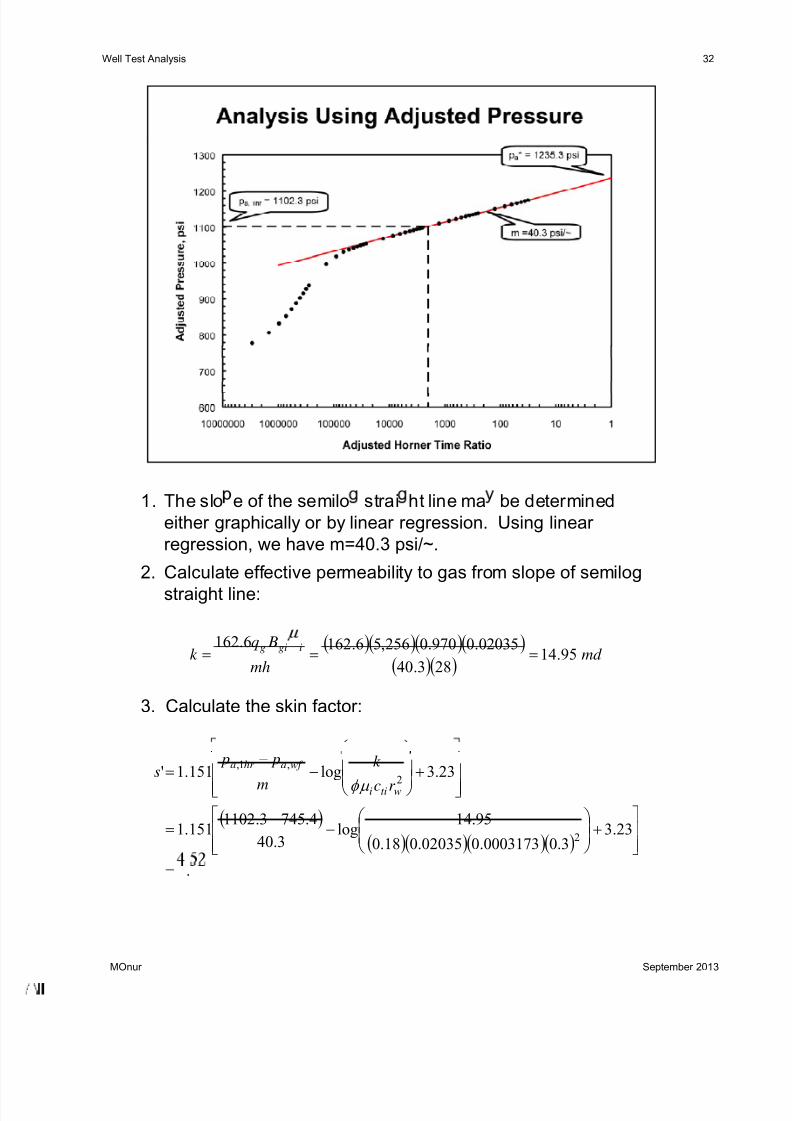
Well Test Analysis 32
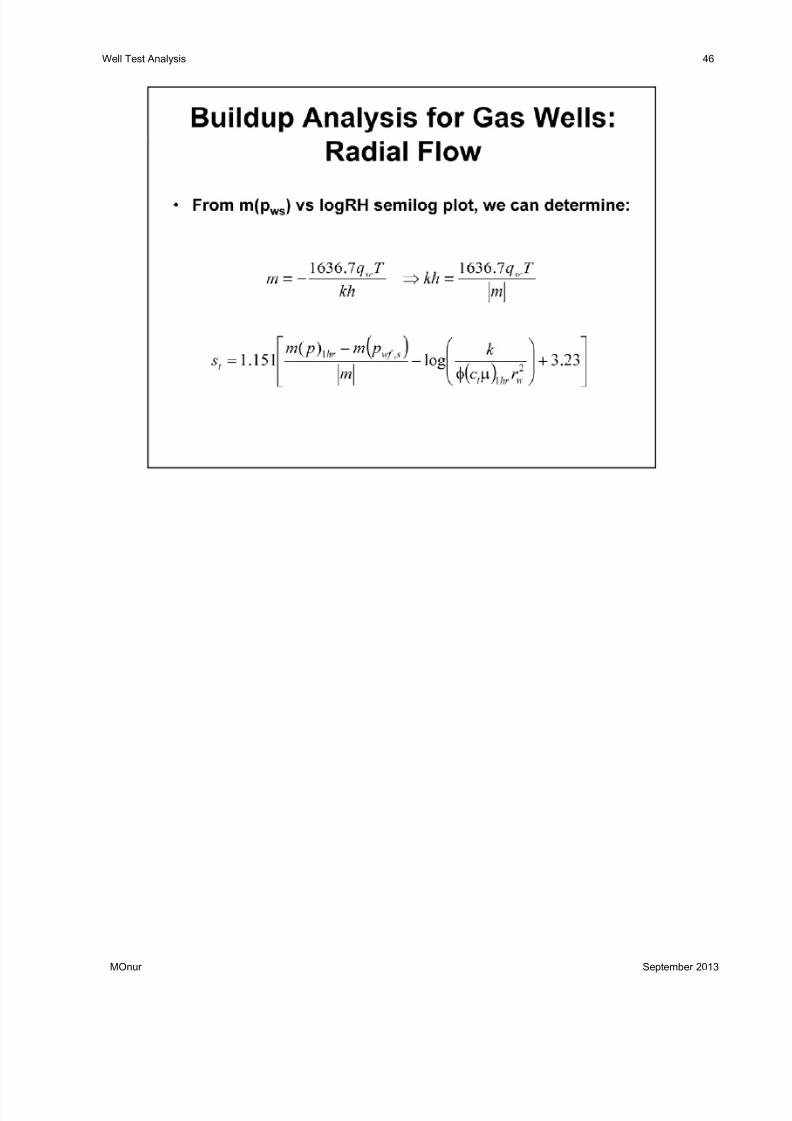
1. The slo e of the semilo strai ht line ma be determinedeither graphically or by linear regression. Using linearregression, we have m=40.3 psi/~.
2. Calculate effective permeability to gas from slope of semilogstraight line:
3. Calculate the skin factor:
( )( )( )( )( )( )
md mh
Bqk igig 95.14
283.4002035.0970.0256,56.1626.162 ===
( )( )( )( )( )
23.33.00003173.002035.018.0
95.14log
3.404.7453.1102
151.1
23.3log151.1'
2
2,1,
=
+
−−=
+
−−
=wtii
wf ahr a
r c
k
m
p ps
μ φ
MOnur September 2013
.

8/13/2019 Part 13 Gas Well Testing
http://slidepdf.com/reader/full/part-13-gas-well-testing 33/47
Well Test Analysis 33
Since the well is in a new reservoir, the Horner lot * ives theaverage reservoir pressure. Because we are using adjustedpressure and adjusted time, we have to convert p a* to p*. This isdone by interpolating between the rows of the pressure-adjusted
pressure table.
The remaining gas properties are also obtained by interpolationwith the gas property table.
MOnur September 2013

8/13/2019 Part 13 Gas Well Testing
http://slidepdf.com/reader/full/part-13-gas-well-testing 34/47
Well Test Analysis 34
1. The slo e of the semilo strai ht line ma be determinedeither graphically or by linear regression. Using linearregression, we have m=45.7 psi/~.
2. Calculate effective permeability to gas from slope of semilogstraight line:
3. Calculate the skin factor:
( )( )( )( )( )( )
md mh
Bqk gg 39.14
287.4501834.0175.1256,56.1626.162 === μ
( )( )( )( )( )
23.33.00004217.001834.018.0
39.14log
7.45800,1225,2
151.1
23.3log151.1'
2
21
=
+
−−=
+
−−
=wt
wf hr
r c
k
m
p ps
μ φ
MOnur September 2013
.
8/13/2019 Part 13 Gas Well Testing
http://slidepdf.com/reader/full/part-13-gas-well-testing 35/47
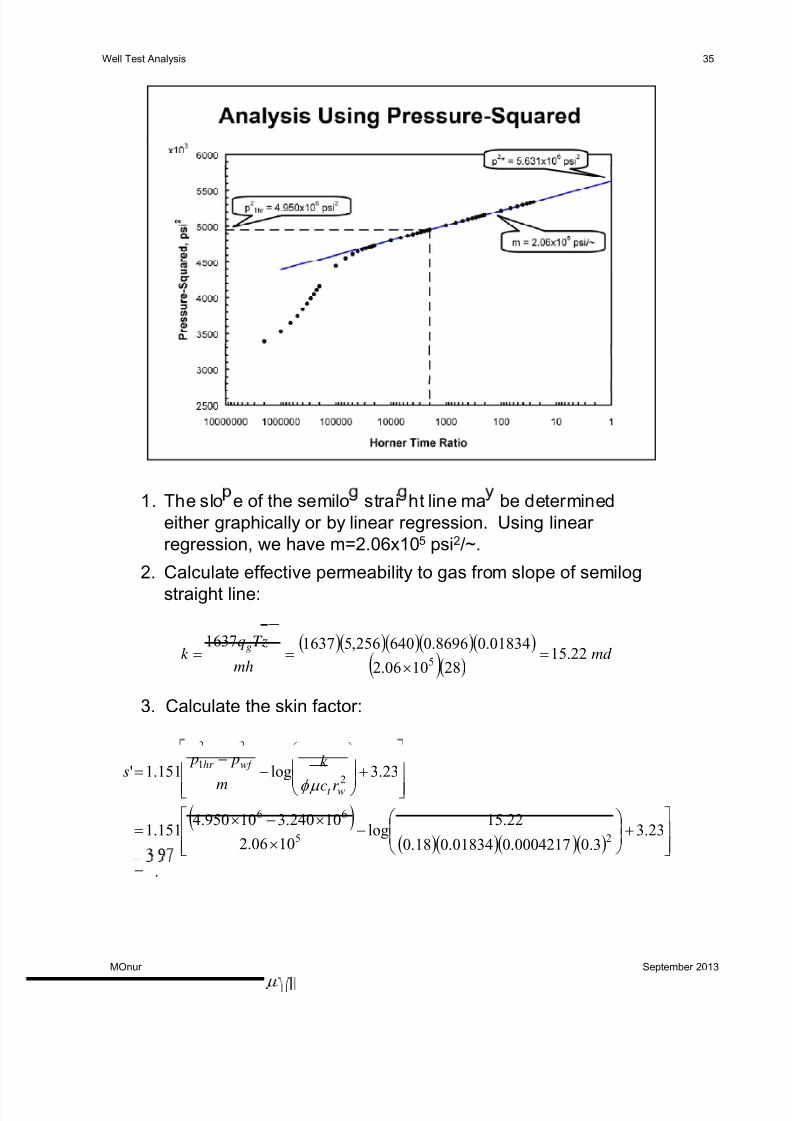
Well Test Analysis 35
1. The slo e of the semilo strai ht line ma be determinedeither graphically or by linear regression. Using linearregression, we have m=2.06x10 5 psi 2/~.
2. Calculate effective permeability to gas from slope of semilogstraight line:
3. Calculate the skin factor:
( )( )( )( )( )( )( )
md mh
zT qk g 22.15
281006.2
01834.08696.0640256,5163716375
=×
==
( )( )( )( )( )
23.33.00004217.001834.018.0
22.15log
1006.2
10240.310950.4151.1
23.3log151.1'
25
66
21
=
+
−
××−×=
+
−−
=wt
wf hr
r c
k
m
p ps
μ φ
MOnur September 2013
.

8/13/2019 Part 13 Gas Well Testing
http://slidepdf.com/reader/full/part-13-gas-well-testing 36/47
Well Test Analysis 36
In this exam le, all three methods ave virtuall the same answer,even though the pressures during the test fell within the pressurerange where neither pressure nor pressure-squared should beused.
In ractice these numbers show the same values for all of theparameters calculated. In reality there is not all that a lot of thedifference between them
MOnur September 2013

8/13/2019 Part 13 Gas Well Testing
http://slidepdf.com/reader/full/part-13-gas-well-testing 37/47
8/13/2019 Part 13 Gas Well Testing
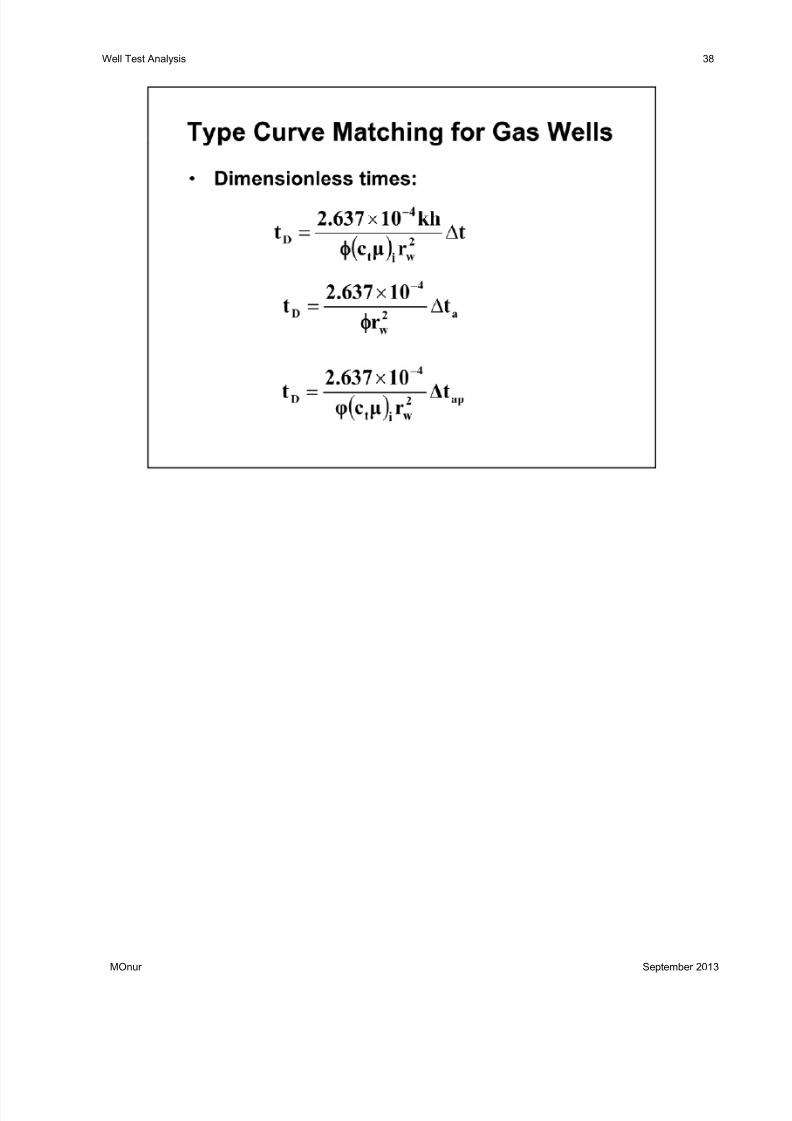
http://slidepdf.com/reader/full/part-13-gas-well-testing 38/47
Well Test Analysis 38
MOnur September 2013

8/13/2019 Part 13 Gas Well Testing
http://slidepdf.com/reader/full/part-13-gas-well-testing 39/47
Well Test Analysis 39
For sim licit , from now on, we use the s mbol m to re resentthe real gas pseudo pressure, which is the exactly the same asthe definition of pp used previously. Here q sc is the surface rate ofgas in MSCF/D. Pwf,s is the flowing bottom hole pressure at the
moment of shut-in.
MOnur September 2013
8/13/2019 Part 13 Gas Well Testing
http://slidepdf.com/reader/full/part-13-gas-well-testing 40/47
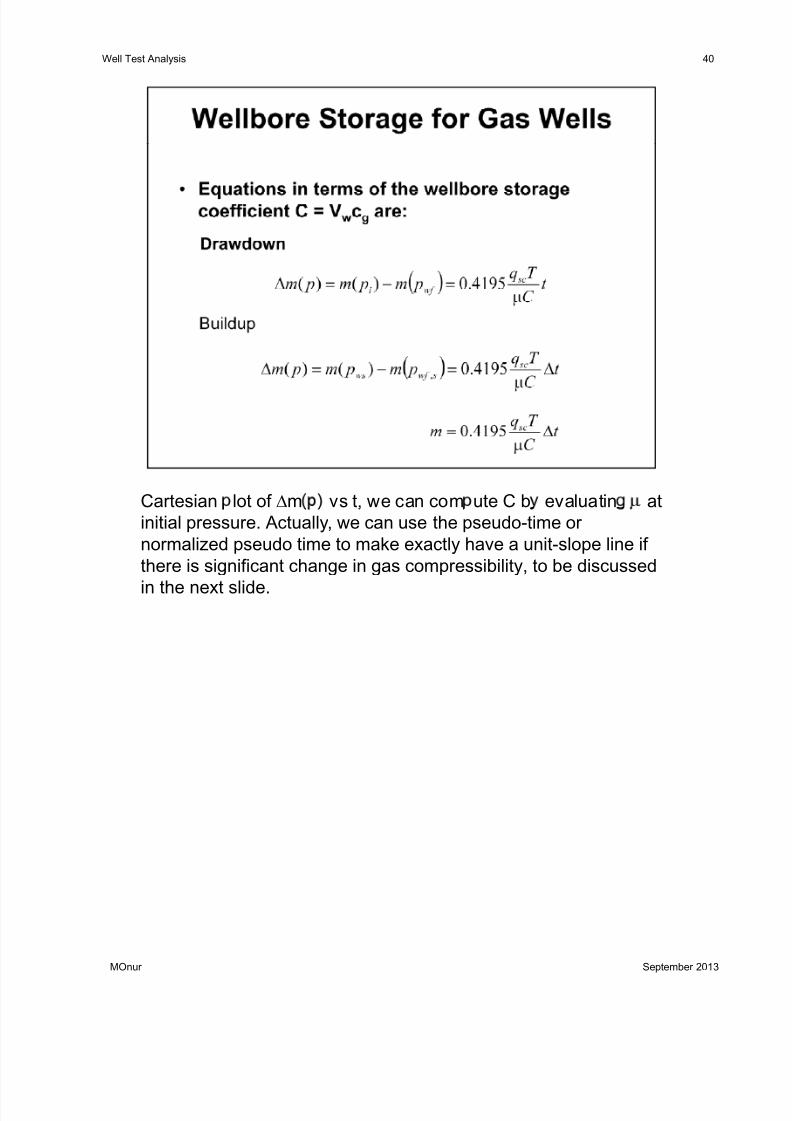
Well Test Analysis 40
Cartesian lot of Δm vs t, we can com ute C b evaluatin atinitial pressure. Actually, we can use the pseudo-time ornormalized pseudo time to make exactly have a unit-slope line ifthere is significant change in gas compressibility, to be discussed
in the next slide.
MOnur September 2013

8/13/2019 Part 13 Gas Well Testing
http://slidepdf.com/reader/full/part-13-gas-well-testing 41/47
Well Test Analysis 41
MOnur September 2013
8/13/2019 Part 13 Gas Well Testing
http://slidepdf.com/reader/full/part-13-gas-well-testing 42/47
Well Test Analysis 42
MOnur September 2013
8/13/2019 Part 13 Gas Well Testing
http://slidepdf.com/reader/full/part-13-gas-well-testing 43/47

8/13/2019 Part 13 Gas Well Testing
http://slidepdf.com/reader/full/part-13-gas-well-testing 44/47

8/13/2019 Part 13 Gas Well Testing
http://slidepdf.com/reader/full/part-13-gas-well-testing 45/47
Well Test Analysis 45
MOnur September 2013
8/13/2019 Part 13 Gas Well Testing
http://slidepdf.com/reader/full/part-13-gas-well-testing 46/47
Well Test Analysis 46
MOnur September 2013

8/13/2019 Part 13 Gas Well Testing
http://slidepdf.com/reader/full/part-13-gas-well-testing 47/47
Well Test Analysis 47