part a. nitrogen dioxide, as measured by monitoring stations additional file 1. histograms of the...
TRANSCRIPT

Part A. Nitrogen dioxide, as measured by monitoring stations
Additional file 1. Histograms of the distributions of air pollution indicators
Nu
mb
er
of
sub
ject
s
Concentration (in parts per billion)

Part B. Nitrogen oxides, as measured by monitoring stations
Nu
mb
er
of
sub
ject
s
Concentration (in parts per billion)
Additional file 1. Histograms of the distributions of air pollution indicators

Part C. Nitrogen monoxide, as measured by monitoring stations
Nu
mb
er
of
sub
ject
s
Concentration (in parts per billion)
Additional file 1. Histograms of the distributions of air pollution indicators

Part D. Carbon monoxide, as measured by monitoring stations
Nu
mb
er
of
sub
ject
s
Concentration (in parts per million)
Additional file 1. Histograms of the distributions of air pollution indicators

Part E. Particulate matter of less than 10 µm in aerodynamic diameter, as measured by monitoring stations
Concentration (in micrograms per cubic meter)
Nu
mb
er
of
sub
ject
s
Additional file 1. Histograms of the distributions of air pollution indicators

Part F. Particulate matter of less than 2.5 µm in aerodynamic diameter, as measured by monitoring stations
Concentration (in micrograms per cubic meter)
Nu
mb
er
of
sub
ject
s
Additional file 1. Histograms of the distributions of air pollution indicators

Part G. Nitrogen dioxide, as predicted by the land use regression model
Nu
mb
er
of
sub
ject
s
Concentration (in parts per billion)
Additional file 1. Histograms of the distributions of air pollution indicators

Part H. Nitrogen oxides, as predicted by the land use regression model
Nu
mb
er
of
sub
ject
s
Concentration (in parts per billion)
Additional file 1. Histograms of the distributions of air pollution indicators

Part I. Nitrogen oxides, as predicted by CALINE4
Concentration (in parts per billion)
Nu
mb
er
of
sub
ject
s
Additional file 1. Histograms of the distributions of air pollution indicators

Part J. Carbon monoxide, as predicted by CALINE4
Nu
mb
er
of
sub
ject
s
Concentration (in micrograms per cubic meter)
Additional file 1. Histograms of the distributions of air pollution indicators

Part K. Particulate matter of less than 2.5 µm in aerodynamic diameter, as predicted by CALINE4
Concentration (in micrograms per cubic meter)
Nu
mb
er
of
sub
ject
s
Additional file 1. Histograms of the distributions of air pollution indicators

Part L. Traffic density within 50 meters around roadways
Nu
mb
er
of
sub
ject
s
Vehicle number per day/meter
Additional file 1. Histograms of the distributions of air pollution indicators

Part M. Traffic density within 75 meters around roadways
Nu
mb
er
of
sub
ject
s
Vehicle number per day/meter
Additional file 1. Histograms of the distributions of air pollution indicators

Part N. Traffic density within 100 meters around roadways
Nu
mb
er
of
sub
ject
s
Vehicle number per day/meter
Additional file 1. Histograms of the distributions of air pollution indicators
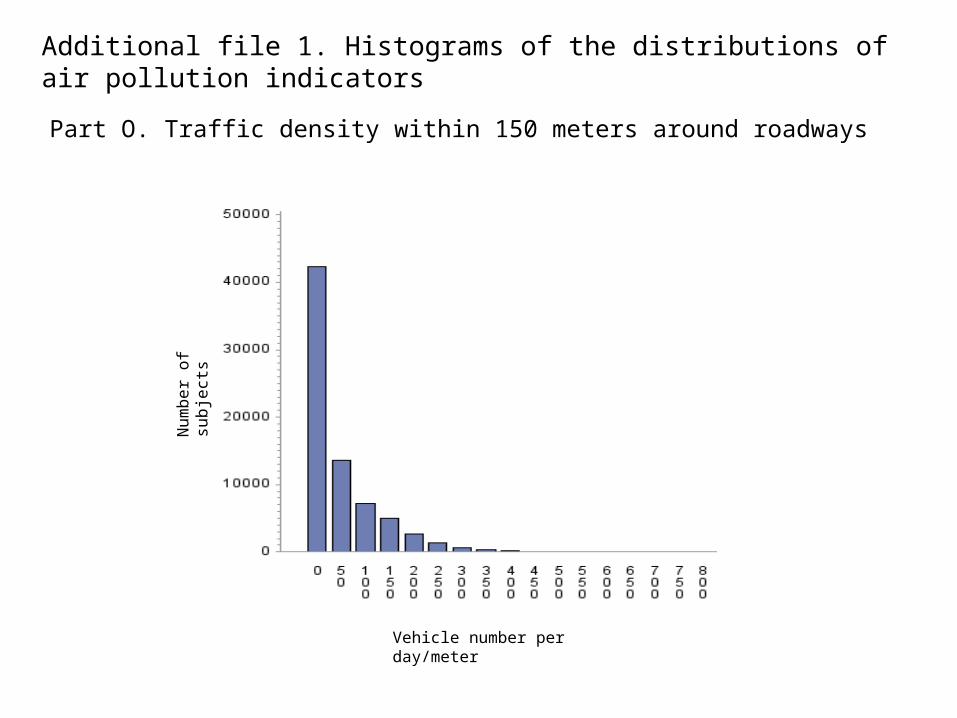
Part O. Traffic density within 150 meters around roadways
Nu
mb
er
of
sub
ject
s
Vehicle number per day/meter
Additional file 1. Histograms of the distributions of air pollution indicators
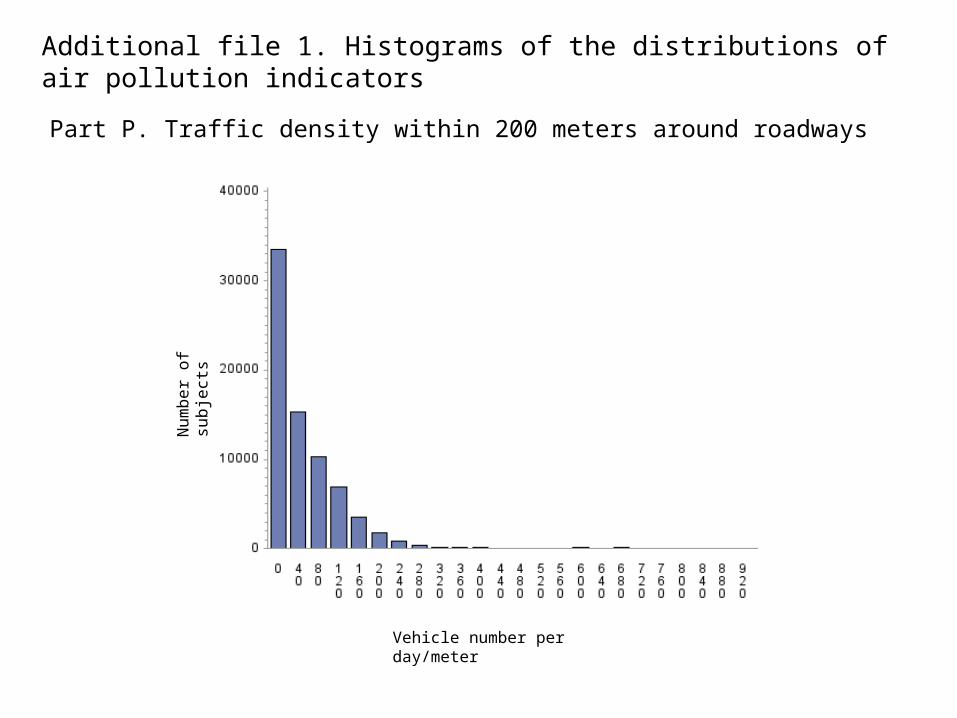
Part P. Traffic density within 200 meters around roadways
Nu
mb
er
of
sub
ject
s
Vehicle number per day/meter
Additional file 1. Histograms of the distributions of air pollution indicators

Part Q. Traffic density within 250 meters around roadways
Nu
mb
er
of
sub
ject
s
Vehicle number per day/meter
Additional file 1. Histograms of the distributions of air pollution indicators

Part R. Traffic density within 300 meters around roadways
Vehicle number per day/meter
Nu
mb
er
of
sub
ject
s
Additional file 1. Histograms of the distributions of air pollution indicators

Part S. Distance to the next freeway
Nu
mb
er
of
sub
ject
s
Distance in meters
Additional file 1. Histograms of the distributions of air pollution indicators

Part T. Distance to the next main road
Nu
mb
er
of
sub
ject
s
Distance in meters
Additional file 1. Histograms of the distributions of air pollution indicators