partial purification and characterization of selected enzymes of bovine nitrogen metabolism
TRANSCRIPT

PARTIAL PURIFICATION AND CHARACTERIZATION OF SELECTED ENZYMES OF
BOVINE NITROGEN METABOLISM:
COMPARISON OF THE NGUNI AND HEREFORD BREEDS
By
LUTENDO MICHAEL MATHOMU
Submitted in accordance with the requirements for the degree of
MASTER OF SCIENCE
In the subject
LIFE SCIENCES
At the
UNIVERSITY OF SOUTH AFRICA
SUPERVISOR: DR M S MYER
CO-SUPERVISOR: PROF C KENYON
NOVEMBER 2012

ii
DECLARATION
I, Lutendo Michael Mathomu hereby declare that the dissertation, “Partial purification and
characterization of selected enzymes of bovine nitrogen metabolism: Comparison of the Nguni and
Hereford breeds”, is my own unaided work. It is being submitted for the Master of Science degree
at the University of South Africa, Pretoria. It has not been submitted before for any degree or
examination in any other university.
________________________
(Signature of candidate)
______day of _____________ 2012
________________________ ________________________
(Signature of supervisor) (Signature of co-supervisor)
______ day of _____________ 2012 ______ day of _____________ 2012

iii
ABSTRACT
Ruminant animals consuming low N-diet have been reported to have increased urea reabsorption
with the Nguni being categorized as N-recycling ruminant. The enzymes associated with N-cycling
are hypothesized to contribute to survival of the Nguni in harsh conditions. Enzymes responsible
for such a function needed to be characterized in order to determine their effect in the functioning
of the Nguni as opposed to Hereford breed. Crude enzymes from both breeds were separated from
most or some contaminants by sephadex G-25, DEAE sephacel, and different affinity column
chromatography. CPS and GDH were successfully purified and characterized by LC-MS/MS and
further analysed by ProteinPilot™, blasted and matched >95% with those of Bos Taurus.
Comparison of characterized enzymes and those which failed to ionise such as ARG, GS and GA
was done using kinetics and graphs annotating specific activities. Partial purification and
characterization was in part achieved.
KEY TERMS
Cattle breeds, Purification, Characterization, Nitrogen metabolism, Arginase, Carbamoyl phosphate
synthetase, Glutamine synthetase, Glutamate dehydrogenase, Glutaminase, Chromatography, Rate
of maximal velocity, Enzyme activity and Kinetics.

iv
ACKNOWLEDGEMENTS
I would like to appreciate my supervisors: Dr. Martin Myer for his valuable support without
compromise and Professor Colin Kenyon for his enthusiastic mentorship and profound knowledge
of science.
My sincere gratitude goes to Mrs Caroline Kunene and Mr Albert Ngwako Mabetha for their
unfading availability and assistance during my laborious laboratory work.
I also wish to thank Dr. Robyn Roth for being there when I needed her advices and for always
listening to my error beeps and offering to help, I whole heartedly appreciate.
Thank you to Dr. Stoyan Stoychev and Mr Sipho Mamputha for always landing a helping hand
during most of my analysis.
The generous financial support of the following organizations is gratefully acknowledged:
University of South Africa and Technology Innovation Agency.
I am thankful to Devon farming, Hereford breeders of South Africa together with Dr. Hans van Zyl
for the provision of samples.
I am grateful to have had you to listen to my troubles Sharon. I always knew you will give a
valuable advice, Dr. Tsepo Tsekoa.
Whenever I thought of giving up you said it would work out. Thank you for listening to my
complaints whenever I got frustrated Rirhandzu.
For your unconditional support and allowing me to pursue my interests, I say you remain the best
mother (…tombo li nyadzwa nga vhafhati, Avhafunani Gladys Mathomu).
I told you I believe in your promises. God, you are good.

v
ABBREVIATIONS & ACRONYMS
AD Anno Domino
AL Argininosuccinic acid Lyase
ARC Agricultural Research Council
ARC-AII Agricultural Research Council Animal Improvement Institute
ARG Arginase
AS Argininosuccinic acid Synthase
ADP Adenosine diphosphate
AMP Adenosine monophosphate
ACN Acetonitrile
AESBF 4-(-2-Aminoethyl)-Benzenesulfonyl Fluoride
ATP Adenosine triphosphate
BC Before Christ
CPS Carbamyl phosphate synthetase
CITR Citrulline
Ca Calcium
Cd Cadmium
Co Cobalt
Cα Alpha-carbon
cAMP Cyclic Adenosine monophosphate
CNBr Cyanogen Bromide
C Carbon
DTT Dithioerythritol
DNA Deoxyribonucleic acid
DEAE Diethylaminoethyl
DMSO Dimethyl sulfoxide
EUN Endogenous urinary nitrogen
EDTA Ethylenediaminetetraacetic acid
EGTA Ethyleneglycoltetraacetic acid
FAO Food and Agricultural Organisation

vi
GS Glutamine synthetase
GOGAT Glutamine oxoglutarate aminotransferase
GA Glutaminase
GABA Gamma-aminobutyric acid
GI Gastrointestinal
GDH Glutamate dehydrogenase
GLUD Glutamate dehydrogenase
GTP Guanosine triphospahate
H Hereford
HCO3-
Bicarbonate
HPLC High performance liquid chromatography
HCl Hydrochloric
HLARG Hereford liver arginase
HLGA Hereford liver glutaminase
HLGS Hereford liver glutamine synthetase
HLCPS Hereford liver carbamoyl phosphate synthetase
HLGDH Hereford liver glutamate dehydrogenase
ID Identification
K2HPO4 Dipotassium phosphate
KH2PO4 Potassium dihydrogen phosphate
Km Michaelis-Menten constant
KDa Kilodalton
KCN Potassium cyanide
KCl Potassium chloride
LC-MS/MS Liquid chromatography - Mass Spectrophotometer/ Mass Spectrophotometer
Li2+
Lithium
M Marker (Protein page ruler)
MFN Metabolic faecal nitrogen
MnCl2 Manganese chloride
MgCl2 Magnesium chloride
MgSO4 Magnesium sulphate

vii
MgCl2.6H2O Magnesium chloride anhydrous
MeOH Methanol
Min Minute
mM
Millimolar
Mg Milligrams
Ml Millilitres
Mn Manganese
Mg Magnesium
N Nitrogen
NAGS N-Acetyl-Glutamate Synthase
NaHCO3 Sodium Hydrogen Carbonate
NLARG Nguni liver arginase
NLGA Nguni liver glutaminase
NLGDH Nguni liver glutamate dehydrogenase
NLGS Nguni liver glutamine synthetase
NPN Non-protein nitrogen
NO Nitrogen oxide
ODC Ornithine decarboxylase
ORNT Ornithine
OTC Ornithine Transcarbamylase
PDG Phosphate-dependent glutaminase
PMSF Phenylmethylsulfonyl-fluoride
SCD Spinocerebellar degeneration
SDS-PAGE Sodium dodecylsulphate polyacrylamide gel electrophoresis
TCA Tricarboxylic acid
UK United Kingdom
UniprotKB Universal protein Knowledgebase
Vmax Maximum velocity
α-KG Alpha Ketoglutarate

viii
LIST OF FIGURES
Figure 1.1. Dispersal of domesticated cattle in Africa
1
Figure 1.2. Frequency of taurine and indicine Y chromosome allele in sub-Saharan
Africa.
2
Figure 1.3. The primary enzymatic steps of the urea cycle
11
Figure 1.4. The mechanism of ammonia detoxification forming urea
14
Figure 1.5. Transport of ammonia to the liver for urea synthesis, using either glutamine
(most tissues) or alanine (muscle) as the carrier.
15
Figure 1.6. End products of the utilization of amino acids are ammonia and urea
excreted by the animal in urine.
16
Figure 2.1: A general overview of L-arginine-connected pathways
21
Figure 2.2. Summarised reaction mechanism in the biosynthesis of Carbamoyl
phosphate and three other unstable intermediates
23
Figure 2.3. An indication of the place of GS in the complex matrix of nitrogen and
carbon metabolism.
27
Figure 2.4. Crystal structure of Arginase complexed with 2Mn2+
ions and the arginine
analogue nor-N-omega-hydroxy-L-arginine
33
Figure 2.5. Structure of Carbamoyl phosphate synthetase.
34
Figure 2.6. Stereo view representation of the large and small subunits of CPS.
35

ix
Figure 2.7. Crystal structures of mammalian glutamine synthetase with 10 identical sub
units
37
Figure 2.8. Structure of bovine GDH.
39
Figure 2.9. The crystal structure of kidney glutaminase showing glutamate in the active
site.
41
Figure 4.1. Indication of the effect of the incubation times on the specific activity of
Nguni and Hereford liver arginase (0.2 – 0.3 mg) at 37oC.
65
Figure 4.2. Effect of the manganese concentration on the specific activity of Nguni
arginase.
66
Figure 4.3. Effect of the manganese concentration on the specific activity of Hereford
arginase.
67
Figure 4.4. Effect of the arginine concentration on the specific activity of Nguni
arginase.
68
Figure 4.5. Effect of the arginine concentration on the specific activity of Nguni
arginase.
69
Figure 4.6. Comparison of the effect of the manganese concentration on the specific
activity of Nguni and Hereford liver arginase presented as average of each increasing
concentration of manganese.
70
Figure 4.7. Comparison of the effect of the arginine concentration on the specific
activity of Nguni and Hereford liver arginase presented as average of each increasing
arginine concentration.
71

x
Figure 4.8. Effect of the selected divalent cations on the specific activity of Hereford
and Nguni arginase.
74
Figure 4.9: SDS-PAGE (10%) analysis of partially purified liver arginase 75
Figure 4.10. The effect of the concentration of Mg-ATP on the specific activity of
Nguni liver carbamoyl phosphate synthetase.
77
Figure 4.11. The effect of the concentration of Mg-ATP on the specific activity of
Hereford liver carbamoyl phosphate synthetase.
78
Figure 4.12. The effect of the concentration of NH4Cl on the specific activity of Nguni
liver carbamoyl phosphate synthetase.
79
Figure 4.13. The effect of the concentration of NH4Cl on the specific activity of
Hereford liver carbamoyl phosphate synthetase.
80
Figure 4.14. Comparison of the effect of the concentration of Mg-ATP on the specific
activity of Nguni (NLCPS) and Hereford (HLCPS) liver carbamoyl phosphate
synthetase presented as average of each increasing Mg-ATP concentration.
81
Figure 4.15. Comparison of the effect of the concentration of NH4Cl on the specific
activity of Nguni (NLCPS) and Hereford (HLCPS) liver carbamoyl phosphate
synthetase presented as average of each increasing NH4Cl concentration.
82
Figure 4.16. SDS-PAGE (10%) analysis of partially purified liver carbamyl phosphate
synthetase
85
Figure 4.17. QSTAR Elite ESI Generated peptide profile for CPS. Peptides of interest:
Precursor MS regions analysed by ProteinPilot™ Software 3.0
86
xi
Figure 4.18. A QSTAR Elite ESI Generated: Carbamoyl-phosphate synthetase I. -
Homo sapiens (Human) is displayed. Peptides of interest: Precursor MS regions
analysed by ProteinPilot™ Software 3.0
85
Figure 4.19. Specific activity of Nguni liver GS versus Mg-ATP concentration. Specific
activity as a function of Mg-ATP concentration.
88
Figure 4.20. Specific activity of Hereford liver GS versus Mg-ATP concentration.
Specific activity as a function of Mg-ATP
89
Figure 4.21. Comparison of the specific activity of Nguni (NLGS) and Hereford
(HLGS) liver glutamine synthetase versus Mg-ATP concentration presented as average
of each increasing Mg-ATP concentration.
90
Figure 4.22. SDS-PAGE (10%) analysis of partially purified liver glutamine synthetase
91
Figure 4.23. Effect of the variation of α-ketoglutarate concentration on the specific
activity of Nguni liver glutamate dehydrogenase at 37oC.
93
Figure 4.24. Effect of the variation of α-ketoglutarate concentration on the specific
activity of Hereford liver glutamate dehydrogenase at 37oC.
94
Figure 4.25. Effect of the variation of ammonium sulphate concentration on the specific
activity of Nguni liver glutamate dehydrogenase at 37oC.
95
Figure 4.26. Effect of the variation of ammonium sulphate concentration on the specific
activity of Hereford liver glutamate dehydrogenase at 37oC.
96
Figure 4.27. Comparison of the effect of the variation of α-ketoglutarate concentration
on the specific activity of Nguni and Hereford liver GDH presented as an average of
each increasing concentration of α-ketoglutarate
97
Figure 4.28. Comparison of the effect of the variation of ammonium sulphate 98

xii
concentration on the specific activity of Nguni and Hereford liver GDH represented as
evarage of each increasing concentration of ammonium sulphate.
Figure 4.29 SDS-PAGE (10%) analysis of partially purified Nguni liver glutamate
dehydrogenase
100
Figure 4.30 SDS-PAGE (10%) analysis of partially purified Hereford liver glutamate
dehydrogenase
101
Figure 4.31. QSTAR Elite ESI Generated peptide profile for GDH. Peptides of interest:
Precursor MS regions analysed by ProteinPilot™ Software 3.0
102
Figure 4.32. QSTAR Elite ESI Generated peptide profile for GDH. Peptides of interest:
Precursor MS regions analysed by ProteinPilot™ Software 3.0
103
Figure 4.33. Effect of glutamine concentration on the specific activity of Nguni liver
glutaminase at 37oC.
106
Figure 4.34. Effect of glutamine concentration on specific activity of Hereford liver
glutaminase at 37oC.
107
Figure 4.35. Comparison of the effect of glutamine concentration on the specific
activity of Nguni (NLGA) and Hereford (HLGA) liver glutaminase at 37oC.
108
Figure 4.36: SDS-PAGE (10%) analysis of partially purified liver glutaminase
111
Figure 4.37. SDS-PAGE (10%) analysis of partially purified liver glutaminase
112
Figure 5.1. Detoxification of ammonia released via transdeamination by its conversion to urea 125
Figure 5.2. The urea cycle showing the two mitochondrial and 3 cytosolic reactions 126

xiii
LIST OF TABLES
Table 4.1. Purification of Nguni liver and Hereford liver Arginase
62
Table 4.2. Comparison of Vmax and Km of Nguni and Hereford liver arginase with
respect to manganese is calculated by graph-pad prism.
63
Table 4.3. Comparison of Vmax and Km of Nguni and Hereford liver arginase with
respect to arginine is calculated by graph-pad prism.
64
Table 4.4. Summary of purification of carbamoyl phosphate synthetase from Nguni
(N) and Hereford livers (H).
74
Table 4.5. Comparison of Vmax and Km of Nguni liver CPS with respect to Mg-ATP
and ammonium is calculated by graph-pad prism.
81
Table 4.6. Comparison Vmax and Km of Hereford liver CPS with respect to Mg-ATP
and ammonium is calculated by graph-pad prism.
82
Table 4.7. Blast information for Nguni liver CPS generated from NCBI database of
proteins.
85
Table 4.8. Blast information for Hereford liver CPS generated from NCBI database of
proteins.
86
Table 4.9. Purification of Nguni liver (N) and Hereford liver (H) GS, indication from
both liver samples. (Units = μmoles ferric hydroximate complex/minute/mg protein).
87
Table 4.10. Comparison of Vmax and Km of Nguni and Hereford liver GS with respect
to Mg-ATP is calculated by graph-pad prism.
87
Table 4.11. Summary of purification of Nguni liver and Hereford liver glutamate
dehydrogenase.
92
Table 4.12. Comparison of Vmax and Km of Nguni and Hereford liver GDH with
respect to substrate α-ketoglutarate is calculated by graph-pad prism.
99

xiv
Table 4.13. Comparison of Vmax and Km of Nguni and Hereford liver arginase with
respect to cofactor manganese is calculated by graph-pad prism.
99
Table 4.14. Blast information for Nguni liver GDH generated from NCBI database of
proteins. Blast Information
103
Table 4.15. Blast information for Hereford liver GDH generated from the NCBI blast database
of proteins. Blast Information.
104
Table 4.16. Purification of Nguni liver and Hereford liver Glutaminase synthetase.
Summarised results.
104
Table 4.17. Comparison of Vmax and Km of Nguni liver glutaminase with respect to
substrate is calculated with the use of Graph-Pad™ prism 5.02.
109
Table 4.18. Comparison of Vmax and Km of Hereford liver glutaminase with respect to
glutamine is calculated with the use of Graph-Pad™ prism 5.02.
109
xv
TABLE OF CONTENTS
Declaration …………………………………………………………………... ii
Abstract ………….………………………………………………………....... iii
Key terms ……………………………………………………………………. iii
Acknowledgement …………………………………………………………… iv
Abbreviations and Acronyms ………………….……………………………. v
List of figures ………………………………………………………………... viii
List of tables …………………………………………………………………. xiii
Table of Contents ……………………………………………………………. xv
CHAPTER 1: BACKGROUND ......................................................................................................... 1
1. Introduction .............................................................................................................................. 1
1.1. Renewed Interest in the Nguni Breed ............................................................................... 6
1.2. Overview of the Nguni cattle project in South Africa ...................................................... 7
1.3. Mammalian nitrogen metabolism ..................................................................................... 8
1.4. Urea cycle ......................................................................................................................... 9
1.5. Problem statement .......................................................................................................... 13
1.6. Expansion of the Problem Statement.............................................................................. 13
1.7. Justification of the Study ................................................................................................ 16
1.8. Aims and Objectives ....................................................................................................... 17
1.8.1. Aims ........................................................................................................................ 17
1.8.2. Objectives ................................................................................................................ 18
CHAPTER 2: UREA CYCLE ENZYMES ...................................................................................... 19
2.1. Enzymology of urea cycle enzymes ............................................................................... 31
CHAPTER 3: MATERIALS AND METHODS .............................................................................. 42
3.1. Purification of bovine liver arginase .............................................................................. 42

xvi
3.1.1. Materials .................................................................................................................. 42
3.1.2. L-Arginine-AH-Sepharose 4B affinity preparation ................................................ 43
3.1.3. Purification of bovine liver arginase procedure ...................................................... 43
3.1.4. Effect of divalent cations......................................................................................... 45
3.1.5. Effect of incubation time ......................................................................................... 45
3.1.6. Arginase Assay: Estimation of enzyme activity ..................................................... 45
3.1.7. Data analysis ........................................................................................................... 46
3.2. Purification of carbamoyl phosphate synthetase ............................................................ 46
3.2.1. Materials .................................................................................................................. 46
3.2.2. Purification of bovine CPS procedure ..................................................................... 47
3.2.3. Specific activity of Carbamoyl phosphate synthetase: Analysis by High
Performance Liquid chromatography (HPLC). ..................................................................... 48
3.2.4. Data analysis ........................................................................................................... 49
3.3. Purification of glutamine synthetase .............................................................................. 49
3.3.1. Materials .................................................................................................................. 49
3.3.2. Purification of bovine GS procedure ....................................................................... 50
3.3.3. Glutamyl Transferase Assay: Estimation of enzyme activity of GS ....................... 51
3.3.4. Specific activity of GS: Analysis by High Performance Liquid chromatography
(HPLC) 51
3.3.5. Data analysis ........................................................................................................... 52
3.4. Purification of glutamate dehydrogenase ....................................................................... 52
3.4.1. Materials .................................................................................................................. 52
3.4.2. Purification of bovine GDH procedure ................................................................... 53
3.4.3. GTP Sepharose Column chromatography: Preparation of GTP Sepharose ............ 54
3.4.4. Glutamate dehydrogenase Assay: Estimation of enzyme activity. ......................... 55
3.5. Purification of glutaminase ............................................................................................. 55
xvii
3.5.1. Materials .................................................................................................................. 55
3.5.2. Purification of bovine glutaminase procedure ........................................................ 56
3.5.3. Glutaminase Assays: Estimation of enzyme activity. ............................................. 57
3.5.4. Data analysis ........................................................................................................... 58
3.6. Protein concentration assay ............................................................................................ 59
3.7. SDS-PAGE ..................................................................................................................... 59
3.8. Bio-analysis of extracted proteins with Liquid Chromatography Mass Spectrometry
(LC-MS/MS) ............................................................................................................................. 59
3.8.1. Introduction to QSTAR®
Elite Liquid Chromatography Mass Spectrometry (LC-
MS/MS) 59
3.9. Database search .............................................................................................................. 60
3.10. Kinetic constants ......................................................................................................... 61
CHAPTER 4: INTEGRATED RESULTS........................................................................................ 62
4.1. Purification of bovine arginase ....................................................................................... 62
4.1.1. Kinetics.................................................................................................................... 63
4.1.2. Enzyme Incubation time.......................................................................................... 64
4.1.3. Effect of substrate concentrations ........................................................................... 64
4.1.4. Effect of divalent cations......................................................................................... 72
4.1.5. Estimation of arginase molecular weight on SDS-PAGE ....................................... 73
4.2. Purification of carbamoyl phosphate synthetase ............................................................ 74
4.2.1. Kinetics.................................................................................................................... 75
4.2.2. Estimation of CPS molecular weight on SDS-PAGE ............................................. 82
4.2.3. Trypsin digest and LC/MS/MS for CPS band Identification .................................. 83
4.3. Purification of glutamine synthetase .............................................................................. 86
4.3.1. Kinetics ....................................................................................................................... 87
4.3.2. Estimation of GS molecular weight on SDS-PAGE ............................................... 90
xviii
4.4. Purification of glutamate dehydrogenase ....................................................................... 92
4.4.1. Kinetics.................................................................................................................... 92
4.4.3. Trypsin digest and LC-MS/MS for GDH band ID ................................................ 102
4.5. Purification of glutaminase ........................................................................................... 104
4.5.1. Kinetics.................................................................................................................. 105
4.5.2. Estimation of glutaminase molecular weight on SDS-PAGE ............................... 110
CHAPTER 5: INTERGRATED DISCUSSION AND CONCLUSION ........................................ 113
5.1. Arginase ........................................................................................................................ 114
5.2. Carbamoyl phosphate synthetase (CPS) ....................................................................... 116
5.3. Glutamine synthetase (GS) ........................................................................................... 118
5.4. Glutamate dehydrogenase (GDH) ................................................................................ 120
5.5. Glutaminase .................................................................................................................. 122
5.6. General Conclusion ....................................................................................................... 123
CHAPTER 6: SUMMARY AND RECOMMENDATIONS ......................................................... 127
6.1. Summary ....................................................................................................................... 127
6.2. Recommendations ........................................................................................................ 128
REFERENCES ............................................................................................................................... 130
APPENDICES ................................................................................................................................ 163

Chapter 1: Background
1
CHAPTER 1: BACKGROUND
1. Introduction
African cattle have been surveyed and the continent is home to 145 cattle breeds with 22% of the
original breeds having become extinct in the last 100 years while 27% of the remainder are at
varying degrees of risk (Rege, 1999). Out of the livestock breeds existing in 1999, 70% were in
developing countries where the risk of loss is at an alarming level (Rege, 1999).
The records of domestication of cattle in Africa show that the Nguni breed was present in the Nile
Valley by 400 BC (Epstein, 1971). Presumably cattle migrated southwards from the northern
regions of Africa in the course of barter and avoiding environmental pressures and war as shown in
Figure 1.1 below.
Figure 1.1. Dispersal of domesticated cattle in Africa (Hanotte et al., 1998)
Cattle were found in the Luangwa Valley in Zambia around 300 BC. By 300 AD communities
which had settled with cattle were living in southern Africa in areas of eastern Botswana, in

Chapter 1: Background
2
Gauteng as far as the Hartebeespoort dam area, the eastern lowveld as well as the coastal region of
Natal (Plug, 1980).
It was during the movement of domesticated cattle from the north of the continent that the animals
were exposed to the harsh extreme climatic conditions and the tropical diseases of Africa.
Presumably, natural selection favoured animals genetically suited to the hostile environment at the
time. Different ecotypes developed as the result of adaptations to the extreme climate of the
continent.
Figure 1.2. Frequency of taurine and indicine Y chromosome allele in sub-Saharan Africa. For each
breed, the proportion of taurine (grey) or indicine allele (black) is indicated. Representation of
South African breeds concentrated in the north of the country (red oval) with numbers 1)
Drakensberger, 2) Afrikaner, 3) Nguni and 4) Pedi (Hanotte et al., 2000).
Chapter 1: Background
3
The Nguni ecotype developed during the time of dispersal (Figure 1.2). It can be separated on the
basis of genetic distancing from other ecotypes which had also developed during the migration
(Hanotte et al., 2000; Bester et al., 2003). Indicine is seen to be more dominant in the central to
Northern parts of the African continent than Taurine which is only dominant in the Southern Africa
amongst other ruminant livestock (Hanotte et al., 2000).
Ruminant livestock have the ability to convert crop residues and fibrous materials of no value to
other herbivores, into protein of high quality. They can also facilitate the use of marginal lands of
little or no value for crop agriculture (Rege & Gibson, 2003). This ability can in part be attributed
to their symbiotic relationship with ruminal microorganisms (Lobley, 1992).
The ability of ruminant livestock to utilise forage materials is not accomplished without cost,
however, as it includes the relatively inefficient use of both ingested energy and protein (Lapierre
et al., 1997). This has been singled out as a focal point for those arguing against the poor usage of
natural resources that occurs with current agricultural practices (Bester et. al., 2003). There is also a
general interest in decreasing nitrogen excretion by livestock to reduce pollution in the air as well
as in the soil and in water (Lapierre et al., 1997). It is thus necessary to improve the metabolic
efficiency of productive animals, with consequent advantages for agricultural economics and better
conservation of ecosystem (Lobley, 1992).
Studies need to increase the efficiency with which ruminants convert feed nitrogen into animal
protein. Part of this improvement must involve strategies to reduce “obligate” catabolism
associated with maintenance of nitrogen equilibrium. Further gains will accrue from a better
understanding of how the hormonal and substrate regulation of protein metabolism and retention
occurs, which will subsequently allow for novel nutritional, endocrinological and genetic
approaches to be adopted in future (Lobley, 1992).
A selective grazer and browser, the Nguni is able to obtain optimal nutritional value from the
available natural vegetation, thus enabling it to survive under conditions that bulk grazers, such as
the European cattle breeds, would find extremely testing (Bester et. al., 2003). Temperamentally,

Chapter 1: Background
4
the Nguni is very docile – another characteristic of an animal in harmony with its total environment
(Ramsay, 1985).
Most studies done to date, mainly under station or improved production conditions in tropical and
sub-tropical countries, have shown that indigenous breeds can be as productive, if not more
productive than European breeds, especially if account is taken of viability and maintenance
requirements, as measured in terms of live-weight (Mpofu, 2002a). In addition, evidence exists in
the literature which indicates that specialised imported breeds cannot compete under conditions in
which indigenous African livestock are predominantly kept; specialised imported breeds cannot
compete (Mpofu, 2002b). The profile of the Nguni, in particular, shows that this breed developed
under a process of natural selection in highly challenging environmental circumstances. Overall,
these animals have a genetic potential to perform better under optimal production environments,
being a medium frame animal with a high tick tolerance and disease resistance (Bester et. al., 2003;
Collins-Lusweti, 2000).
Almost 70% of the world‟s rural poor depend on livestock as an important component of their
livelihoods (Hoffmann, 2010). The African continent where many of the rural poor live, is home to
over 230 million cattle (FAO, 2008) being made up of 145 breeds, most of them indigenous to the
African continent (Rege and Bester, 1998). These breeds have unique genetic attributes, such as
adaptation and tolerance to drought, heat, diseases, as well as having the ability to utilize low-
quality indigenous forages (Lamwaka, 2006; Wurzinger et al., 2007). The Nguni breed falls into
the latter category, being typically kept under pastoralism and the traditional crop-livestock system.
After having entered the growing commercial sector early on the 20th
century, this breed is now
become an excellent source of genetic material well suited to the management style and needs of
the livestock industry. This is especially true for the emergent farmer who requires low
maintenance and relatively high output animals. In addition, the adapted genes of this breed are
used by commercial farmers as a source of “hardy” genes (Bester et. al., 2003).
Under adverse conditions, which are common during the dry season in most rural areas of Southern
Africa, Nguni meat quality is as good as that from other cattle breeds, such as Angus and
Bonsmara. Therefore, besides being a smaller and multipurpose breed, the Nguni can compete

Chapter 1: Background
5
favourably with established breeds in terms of productive performance and meat quality. There is a
need, however, to perform a sensory evaluation of the meat and assess other meat aspects, such as
fatty acid profiles, against Angus and Bonsmara cattle breeds (Muchenje et al., 2008).
Furthermore, the global drive for the development of biotechnology into patentable and marketable
products has sparked interest from international investigators into the genetics of the Nguni breed,
which, even under harsh and arid environmental constraints has high fecundity and also produces
high quality meat (Collins-Lusweti, 2000).
One of the phenomenon that enable the Nguni to survive under adverse conditions is nitrogen
recycling pathway, resulting in animals being substantially less dependent on dietary protein than
other breeds. This attribute is also of importance to the developed world, where nitrogen
contamination of the environment limits intensive animal production. Elevated blood urea levels in
these cattle reflect this phenomenon, particularly when the animals are maintained on poor quality,
low protein grazing food sources (Linington & Osler, 1992; Bester et. al., 2003).
Policies and development efforts to improve livestock production in the communal areas have been
based on the use of fast growing imported breeds (Collins-Lusweti, 2000; Muchenje et al., 2008).
These are perceived to be superior to native breeds, because of their large body size (Bester et al.,
2003). Contrary to this presumption, exotic breeds are failing to cope with the harsh environmental
and socio-economic conditions prevalent in the communal areas in Africa where, among other
constraints, disease is rampant, animal feed is scarce and livestock management is poor (Collins-
Lusweti, 2000; Scholtz, 1988; Schoeman, 1989). As such, farmers raising imported breeds under
these kinds of adverse conditions are more likely to incure high meat production costs.
When compared with other breeds, especially in relation to cow mass and reproductive
performance, the Nguni cattle have proved themselves to be the most fertile beef breed in South
Africa, being ideally suited as a dam line in terminal cross breeding. In addition, its traits of heat,
tick and disease tolerance make it ideal breed for large scale systems (Bester et. al., 2003). This
breed has also shown high reproductive performance and good walking and foraging ability
(Muchenje et al., 2008).

Chapter 1: Background
6
Consumers are increasingly becoming concerned about the quality of meat they eat. There is also
an increasing requirement for information on the origin of the meat and the type of production
system used (Revilla & Vivar-Quintana, 2006). As a way to encourage production systems which
are acceptable and which conform to consumer demands, the use of the adapted indigenous Nguni
cattle breed for beef production in rural South Africa is promoted. In general, there are limited and
inadequate forage management practices in rural areas in Africa, which result in overgrazing and
overstocking with the concomitant sudden loss of weight especially in the dry season, which may
also drastically affect meat quality (Bester et. al., 2003; Muchenje et. al., 2008).
The Nguni breed is known to maintain a high blood urea level when the nitrogen content of the
pasture drops (Chimonyo et al., 2002) and especially during adverse conditions (Linington &
Osler, 1992). It is postulated that this characteristic has been pivotal to the Nguni becoming the
“superior” breed on the African continent. Therefore an understanding of variations which can
occur in the urea cycle, especially focussing on the key enzymes, is crucial for gaining an adequate
understanding of the physiological responses related to Nguni adaptation to arid environments. In
addition, a better understanding of these mechanisms is also essential for the development of
improved strategies to better realise the potential of these breeds. As such, an overall understanding
as to how these enzymes are regulated is therefore crucial in coming to any conclusion as to what
separates the Nguni breed along the lines of the urea cycle, from less “hardy” breeds. It is
generally believed that elevated levels of urea in the Nguni blood sera, probably arises from
increased conversion of glutamine to glutamate in the liver by glutaminase. It is possible that the
Nguni are capable of creating glutamine stores in the muscle in the way sheep do (Marais & Van
der Walt, 1983).
1.1. Renewed Interest in the Nguni Breed
Most studies conducted within the Nguni have concentrated on a limited number of factors, such as
meat quality (Muchenje et al., 2008). Cattle provide diverse functions to farmers and the general
community in Africa and abroad, despite low productivity (Scoones & Graham, 1994). In rural
farming areas, most domesticated animals also provide draught animal power and also serve as

Chapter 1: Background
7
security and risk reduction in rural households, thereby enhancing the sustainability of small land
holder farming systems (Scholtz, 1988). Of the various factors which reduce cattle productivity, the
major ones are low quality of grazing fields during the dry seasons, poor health management and
under-nutrition (Bester et. al., 2003; Mapiye et al., 2007).
European breeds, including the Hereford, Aberdeen Angus as well as Sentimental breeds, have
been distributed throughout Southern Africa. Because of the importation of the less adapted
European breeds, together with their perceived higher income; indigenous breeds were looked upon
as inferior. The perception of indigenous breeds, such as the Nguni, was turned around by scientific
motivations, as well as the committee appointed in 1985 on the desirability of keeping a germ
plasm bank to preserve the hardiness (Hanotte et al., 2000). The Nguni‟s popularity under
commercial breeders has increased exponentially over the last decade. There are also projects in
South Africa which currently aim to increase the number of the indigenous Nguni cattle in the
communal areas. One such project in Eastern Cape aims to up-grade the existing cattle population
in the communal areas by eliminating all non-Nguni bulls within a given community. The Nguni
breed has thus been attracting increasing international interest, mainly due to their resistance to
ticks and tick-borne diseases, high reproductive performance and good walking and foraging ability
(Strydom et al., 2001; Muchenje et al., 2008).
1.2. Overview of the Nguni cattle project in South Africa
The Nguni Cattle Development Project is currently underway in four provinces in South Africa,
having been initiated by Agricultural Research Council (ARC) and the University of Fort Hare,
together with the collaboration of rural development agencies in the country. In a separate project,
farmers in selected communities were given two bulls and 10 in-calf heifers, to allow them to build
up a nucleus herd (Fuller, 2006). In effect, the existing bulls in each community were replaced by
registered Nguni bulls. In a programme consisting of five year cycles, the selected communities
give back to the project two bulls and 10 heifers, which are then passed on to another community
(Raats et al., 2004). One of the conditions of the project is that communities should have fenced
grazing areas, together with a Range Land Management Committee to supervise rotational resting
at specified stocking rates (Mapiye et al., 2007). The model adopted has a long-term goal which is

Chapter 1: Background
8
to develop a market for Nguni beef, Nguni skins and to position the communal farmers for the
global beef market through organic production and product processing (Raats et al., 2004). This
project discourages the use of unknown cows and enforces the removal of the existing exotic bulls
order to replace them with pure registered Nguni bulls. A project development committee made up
of interested stakeholders is in charge of the development of infrastructure, training of farmers and
the redistribution of animals. The implementation of the model in communal areas is conducted in
collaboration with the Department of Agriculture (Raats et al., 2004).
1.3. Mammalian nitrogen metabolism
The ability of mammals to transfer urea from the blood to the gastrointestinal (GI) tract is common
to most species. In ruminants, this phenomenon can also supplement the nitrogen supply to the
ruminal microorganisms, who in turn will also supply the host animal with essential amino acids.
This “protein regeneration cycle” (Houpt, 1959) is of great significance to the survival of ruminants
under unfavourable nutritional conditions. Animals consuming low-nitrogen diets by preventing the
excretion of urea have been reported to have physiological changes such as reduced plasma
filtration by the kidney and an increase in urea re-absorption, thus preventing urea excretion (Leng
et al., 1985; Cirio & Boivin, 1990). There is also an increase in the GI tract clearance rate of urea in
animals which are fed low-nitrogen diets (Marini & Amburgh, 2003), but the specific mechanism
of action in the clearance of urea from GI is yet to be described. Urea transporters in the GI tract of
ruminants might be the mechanism responsible for this increase in the transfer of urea into the GI
tract (Marini & Amburgh, 2003; Ritzhaupt et al., 1998).
The second requirement to avoid high output and loss of nitrogen is that the energy intake by the
animal should be great enough to protect the nitrogenous constituents of the tissues from
catabolism. Under these conditions, the nitrogen output in the urine is reduced to a minimum, and
may be regarded as a measure of the requirement of nitrogen, by the animal, for the maintenance of
life (Mitchell, 1926; McClellan & Hannon, 1932).
Combination of both Endogenous Urinary Nitrogen (EUN) as well as Metabolic Faecal Nitrogen
(MFN) helps to maintain the requirements of an animal for absorbed nitrogen. EUN, being the
nitrogen lost in the urine, resulting from normal turnover of body nitrogen is defined as the

Chapter 1: Background
9
minimum loss of nitrogen through the urine when consuming a nitrogen-free diet (Smuts 1935).
MFN, being the portion of the faeces that is composed of microbial cells, mucus, and other eroded
cells from the gastrointestinal tract, is defined as the nitrogen cost which can be attributed to the
digestive processes (Smuts 1935). Digestibility coefficients for plant nitrogen are high for
ruminants, although variability can occur if soluble digestion inhibitors, such as phenolics, are
present within the plant cells (McLeod, 1974).
In ruminant amino acid nutrition the utilization of protein is influenced by a number of factors.
These include the following, being (a) energy and amino acids, which are absorbed from different
sites in the alimentary tract, such as from the rumen and intestine respectively, (b) the rate of
digestion of specific amino acids from microbial protein (c) amino acid composition effect upon
absorption and (d) selective absorption or digestion of essential amino acids, as compared with
non-essential amino acids (Purser, 1970).
There have been concerns in the past about environmental pollution by nitrogen from domesticated
and commercialised animal enterprises; as such, there has been raised interest in the use of low-
protein diets for pigs, cattle, sheep and other animals (Kornegay & Verstegen, 2001). It has been
estimated that each one percentage unit reduction in dietary protein, accompanied by appropriate
amino acid supplementation, results in around 8% less nitrogen excreted in manure (Kerr & Easter,
1995). However this has not been found to be the case in some experimental settings, which show
no reduction in excreted nitrogen, although the dietary protein requirements were substantially
reduced (Cromwell, 1996).
1.4. Urea cycle
The ruminant stomach is divided into four compartments, namely, the reticulum, rumen, omasum
and abomasum. Feed is passed into the rumen, which may be regarded as a large fermentation
chamber providing a suitable environment for the continuous culture of the microbial population.
The microbial population acts symbiotically by producing the enzymes required for the degradation
of the cellulose material that is ingested by the animal. The ruminant species are therefore of great
value to man because they provide a means of capturing the solar energy stored in the cellulosic
bonds of plants. The function of the omasum is poorly understood. The function of the abomasum
Chapter 1: Background
10
is similar to the stomach of monogastrics, in that it is a glandular compartment where hydrochloric
acid and enzymes partially hydrolyse the protein arising from the feed, as well as the protein arising
from the microbial activity in the rumen. The abomasums secretes lysozyme, which is an enzyme
that efficiently breaks down bacterial cell walls, thereby making the bacterial protein produced in
the rumen available for subsequent proteolysis absorption by the animal.
The majority of soluble protein entering the rumen is degraded to ammonia. Less soluble proteins
which escape rumen proteolysis are passed into the small intestine where they undergo continued
proteolysis, thereby making them available for absorption. The major goal of the ruminant feeding
system, is to maximize the energy conversion and the utilization of the cellulosic biomass, so as to
maximize the conversion of ammonia to microbial biomass (microbial protein) as well as to
minimize the ammonia loss from the rumen by absorption. The ammonia produced and reabsorbed
is detoxified by the liver by synthesizing urea, thereby preventing ammonia toxicity. The rumen
ingesta of the ruminant comprise the feed as well as saliva, with the ruminant animal producing 100
to 150 litres of saliva per day. Depending on the production factors, between 19 and 96 % of the
endogenous urea produced by the liver is recycled to the gut, with 15 to 95% of the transfer
occurring via the saliva (Huntington et al., 2007). Some urea is also transferred across the gut wall.
Urea genesis by the liver is closely linked to the degradability of the dietary nitrogen (dietary N)
and subsequent absorption of ammonia. The ruminant may secret from 50 to 130g of urea per day
in the saliva. The urea, on entering the rumen, is then converted to CO2 and ammonia by the urease
enzymes produced by the rumen microorganisms.
The urea cycle plays an essential role in human and other ureotelic organisms for the efficient
removal of toxic ammonia from body tissues. As such, as already stated, an understanding of the
overall regulation of urea biosynthesis would be greatly improved by elucidation of the individual
regulatory components of the pathway.
The urea cycle (also known as the ornithine cycle) is a cycle of biochemical reactions occurring in
many animals that produces urea ((NH2)2CO) from ammonia (NH3). In mammals, the urea cycle
takes place primarily in the liver, and to a lesser extent in the kidney (Figure 1.3). The urea cycle
consists of five reactions: two mitochondrial and three cytosolic. During these reactions two amino

Chapter 1: Background
11
groups, one from NH4+ and one from aspartate, and a carbon atom from HCO3
- are converted to the
relatively nontoxic excretion product urea at the cost of four "high-energy" phosphate bonds (3
ATP hydrolyzed to 2 ADP and one AMP). Ornithine is the carrier of these carbon and nitrogen
atoms. The presence of arginine in animal protein was shown in 1895 by Hedin (Rogers & Visek,
1985). Arginine has been considered the only intermediate metabolite in the process of nitrogen
detoxification for the years, but other workers have suggested that the urea cycle has other
functions, such as the control of pH homeostasis (Haussinger et al., 1988) which is performed by
other bi-products in the cycle.
Figure 1.3. The primary enzymatic steps of the urea cycle are shown in capital letters, i.e. N-
Acetyl-Glutamate Synthase (NAGS), Carbamyl Phosphate Synthase (CPS-I), Ornithine
Transcarbamylase (OTC), Argininosuccinic acid Synthase (AS), Argininosuccinic acid Lyase
(AL), and Arginase (ARG). Ornithine (ORNT) and Citrulline (CITR) respectively (Tuchman and
Batshaw, 2002).

Chapter 1: Background
12
These bi-products are also involved in the nitric oxide synthase pathway (Moncada et al., 1989).
All this simply suggests that there are many other amino acids involved in ureagenesis and nitrogen
detoxification (Figure 1.3). Scientists continue to explore and evaluate the wide implications of
urea cycle.
Evidence of the modulation of ureagenesis, by arginine, is best understood when considered within
the context of all the urea cycle intermediates: arginine is mostly taken up by the liver, while
ornithine is taken up a lot less (De Bandt et al., 1995), and citrulline uptake is almost insignificant
(Drotman & Freedland, 1972). In the liver of ureotelic animals, arginine activates N-acetyl-
glutamate synthase, thereby catalysing the synthesis of N-acetyl-L-glutamate, which is an allosteric
obligatory activator of carbamyl phosphate synthetase. Another line of evidence suggests that the
modulating effect of arginine is dependent upon the nutritional status of the animal, rather than
depending on an increase in local arginine synthesis through arginno-succinate synthase activations
(Saheki et al., 1977). Arginine has no action on mitochondria from fasted rats, whereas it increases
6.5 to 7.5 fold in mitochondria from rats fed 0% to 60% casein. Feeding rats with a high protein
diet increases CPS and OCT (Wakabayashi et al., 1995), as well as the activity of N-acetyl-
glutamate synthase, together with the modulatory effect of arginine (Morimoto et al., 1990). It is
therefore likely that arginine acts as a key signal for the activation of ureagenesis during high-
protein feeding.
When considering the net balance of ureagenesis:
2NH4+ + 2HCO3
- Urea + CO2 + 3H2O, it is usual to focus on the fact that urea formation allows
for the removal of ammonia. Accordingly, it can be considered that hepatic ureagenesis plays a
considerable role in the maintenance of bicarbonate homeostasis, because bicarbonate is removed
in an equimolar fashion (Haussinger & Gerok, 1988). Under acidotic conditions, the decrease in
glutamine consumption leads to a decreased ureagenesis rate and therefore to a sparing of HCO3-.
Although the role of arginine in the process of adaptation to acidosis is not known, it is interesting
to note that administration of ornithine α-ketoglutarate counteracts acidosis in starved rats (Ziegler
et al., 1992).
Absorbed nitrogen in animals can be used directly for productive processes, or can be converted to
urea in the liver by urea cycle processes; therefore knowledge of urea kinetics is important in
understanding the total nitrogen economy of the animal. Urea recycling is usually considered to be

Chapter 1: Background
13
the process whereby urea in the blood escapes urinary excretion and re-enters the gastrointestinal
tract. Recycled urea in the body of the animal can serve both as a source of protein, as well as a
buffer to the rumen microbial environment against dietary nitrogen deficiency (Houpt 1959).
Once in the rumen, urea is readily hydrolysed by bacterial urease, to produce carbon dioxide and
ammonia. The ammonia may then be reabsorbed and reconverted to urea in the liver, or
synthesized into bacterial protein, or excreted in faeces (Mould & Robbins, 1981).
1.5. Problem statement
Protein in cattle diets is the most expensive major component of cattle feed and insufficient
quantity of protein is the major limiting factor in animal production. In developing world, protein
additives could be better utilized directly by humans, whilst in the developing world excreted
nitrogen leads to massive land pollution problems.
Nguni breed of cattle are less dependent on protein than other breeds in a challenging environment
and maintain elevated levels when the nitrogen content of pasture drops (Linington & Osler, 1992;
Chimonyo et al., 2002). Despite the high blood urea, which is normally considered detrimental to
fertility in cattle, the Nguni is the most fertile breed in South Africa (Scholtz & Theunissen, 2010).
The following question arises: “Is there a difference in the enzyme associated with nitrogen
recycling in the livers of the Nguni breed when compared with a European breed such as the
Hereford?”
1.6. Expansion of the Problem Statement
The rumen and the associated compartment, the reticulum, comprise an anaerobic fermentation of
1011
bacteria and 1010
protozoa. These microorganisms are continually passed into the abomasum
which is acidic, and where digestion of the bacteria is initiated. These microorganisms are therefore
the free food of the ruminant. The ruminant secretes copious quantities of saliva that conveys
sodium hydrogen carbonate (NaHCO3) and urea to the rumen. In this way, the pH of the bacterial
fermentation in the rumen is controlled by neutralising the excess fermentation acids. The ammonia
released by urease activity is either absorbed through the rumen wall, transported to the liver where
it is converted to urea, or the ammonia is utilised by the rumen bacteria to synthesise protein. The

Chapter 1: Background
14
urea may either diffuse back into the rumen via the blood, or is returned to the rumen via saliva.
Approximately 70% of the nitrogen in the saliva is urea. It is believed that elevated blood urea
levels in Nguni cattle play a significant role in allowing this breed to survive in adverse conditions.
Understanding the variation in the urea cycle in various breeds of cattle is therefore crucial to select
for probes that may be used in genetic selection of enzyme polymorphisms that confer resistance to
adverse conditions in the Nguni breed. The mechanism of ammonia detoxification forming urea in
mammals is outlined in Figures 1.4 - 1.5.
Figure 1.4. The mechanism of ammonia detoxification leading to formation of urea in animals
http://themedicalbiochemistrypage.org/nitrogen-metabolism.html#urea

Chapter 1: Background
15
The ammonia released by the reverse reaction of glutamate dehydrogenase is converted to
carbamyl phosphate synthetase I, in the mitochondria. Arginine is converted to urea by arginase,
regenerating ornithine and completing the urea cycle.
Glutamine synthetase in the liver also plays a role in ammonia detoxification. Glutamine is a major
blood amino acid. Glutamine synthesized may also be transported to the liver where the amide-N is
converted to urea. The amide-N of glutamine is released as intra-mitochondrial ammonia by the
enzyme glutaminase. The ammonia may also be converted to citrulline.
The overall regulation of these enzymes is therefore crucial in the understanding of what separates
the Nguni breed urea cycle from other less “hardy” breeds, such as Herefords. The elevated urea
level in the Nguni blood sera possibly arises from increased conversion of glutamine to glutamate
in the liver by glutaminase.
Figure 1.5. Transport of ammonia to the liver for urea synthesis, using either glutamine (most
tissues) or alanine (muscle) as the carrier.
(http://www.campbell.edu/faculty/nemecz/323_lect/Nitrogen_metabolism/images/ammonia-transport.jpg)
The genetic mechanism underlying this unique phenomenon in the Nguni has not been
characterized and can therefore not be fully exploited in the Nguni or other cattle breeds. In order

Chapter 1: Background
16
to be able to include this trait in a selection programme, polymorphisms in the genes involved in
the efficiency of nitrogen metabolism of cattle must still be elucidated.
1.7. Justification of the Study
In livestock production, nutritional shortages relate directly to a decrease in food production
through increased susceptibility of production animals to disease, decreased fertility and milk
production, retarded growth and a subsequent decrease in meat quality.
One of the most important limiting factors in this cycle is the dependency of most production
animals on dietary protein. Ruminants are less dependent on dietary protein than monogastrics, as
bacteria in the rumen can utilize non-protein nitrogen (NPN) sources. The ruminant then in turn
utilizes proteins in the bacteria formed from NPN, as shown in Figure 1.6.
Figure 1.6. End products of the utilization of endogenous NH3 and amino acids in urea cycle are
ammonia and urea excreted in urine.
(http://ahdc.vet.cornell.edu/clinpath/modules/chem/images/urea.gif)

Chapter 1: Background
17
Proteins from fodder and proteins in gut bacteria are degraded to amino acids, which after
absorption from the gut, are metabolised by a variety of tissues. At this point, the fate of nitrogen is
in the hands of intermediary metabolism of particular animal, where subsequent metabolic
efficiency of the animal dictates whether it is wasted or utilized. The end-products of the utilization
of amino acids are ammonia and urea, which are excreted by the animal in the urine are depicted in
Figure 1.6, where in some animals ammonia and urea excreted in dung.
In the developed world, nitrogen in urine and dung (as ammonia) is a major cause for concern, as
this leads to pollution of the environment. In contrast, livestock production in the developing world
is severely limited by insufficient protein to sustain production year round.
As previously stated, the Nguni cattle breed developed as a result of a process of natural selection
in a highly challenging environment. As such, these animals have an excellent ability to maintain
their condition in winter as a result of a lower dependency on protein supplementation during
adverse conditions. The Nguni breed has also shown refusal of NPN licks when feeding on low
quality roughage, despite adverse environmental conditions (Le Roux et al., 1999). This may be
due in part to the maintenance of a high blood urea levels under similar conditions. Overall, Nguni
cattle appear to have an ability to recirculate nitrogen when other breeds merely lose nitrogen
through excretion in urine or dung.
Breeders world-wide are keen to improve the animals they keep. Competition amongst breeders
and breed societies is fierce and the introduction of a test to determine the efficiency of protein
utilization would be of major consequence within the livestock industry world-wide.
1.8. Aims and Objectives
1.8.1. Aims
The aim of this research was to characterize and compare the enzymes associated with nitrogen
recycling in the livers of the Nguni and Hereford breeds. Genetic polymorphisms in the key
enzymes were characterized, based on the variation in the functionality of these enzymes.

Chapter 1: Background
18
1.8.2. Objectives
a. To characterize key enzymes in nitrogen metabolism of Nguni and Hereford breed.
b. To investigate the biochemical and basis for nitrogen recirculation.
In order to do this the following enzymes were studied: arginase, carbamoyl phosphate
synthetase, glutamine synthetase, glutamate dehydrogenase and glutaminase.

Chapter 2: Urea Cycle Enzymes
19
CHAPTER 2: UREA CYCLE ENZYMES
Enzymes of urea cycle include amongst others arginase which is an enzyme of nitrogen metabolism
also called L-arginine amidino hydrolase (EC 3.5.3.1), a binuclear manganese metallo-enzyme that
catalyses the hydrolysis of L-arginine to form L-ornithine and urea (Figure 1.3, Page 11 and
Figure 2.1, Page 21). It is the terminal enzyme of the urea cycle among the six enzymes involved
in the urea cycle (Cederbaum et al., 2004).
Another enzyme of urea cycle is carbamoyl phosphate synthetase (CPS) which catalyses the
reaction of ammonia or glutamine with bicarbonate and two molecules of magnesium ATP to form
carbamoyl phosphate, which is indicated in the reaction 1 below:
2ATP + HCO3-
+ NH4+ 2ADP + H2NCOOPO3
2- + H3PO4………………………………...........
(Marshall et al., 1958; Pierard & Wiame, 1964).
Glutamine synthetase (L-glutamate ammonia ligase: EC 6.3.1.2., GS) forms part of urea cycle and
it catalyses the ATP-dependent incorporation of ammonia into glutamate to form glutamine, which
inturn is an important component of urea synthesis, as indicated in reaction 2 below:
L-Glutamate + NH3 + ATP L-Glutamine + ADP + Pi………………….
Hydroxylamine can replace ammonium in an ATP-dependent synthetase reaction, such as the one
catalysed by glutamine synthetase above (Maurizi et al., 1987; Ronzio et al., 1969).
Glutamate dehydrogenase as an enzyme of urea cycle, also known as ([L-glutamate-NAD (P) +
oxidoreductase (deaminating)], EC 1.4.1.3, GDH) is found in all organisms, where it catalyses the
reversible oxidative deamination of L-glutamate to 2-oxoglutarate and free ammonia (Fang et al.,
2002; Hudson & Daniel, 1993). In the oxidative deamination reaction, GDH feeds the tricarboxylic
acid (TCA) cycle by converting L-glutamate to 2-oxoglutarate, whereas the reductive amination
reaction supplies nitrogen for several biosynthetic pathways (Smith et al., 2001) in the mammalian
system, as indicated in reaction 3 below:
2-oxoglutarate + NH+
4 + NAD(P)H L-glutamate + H2O + NAD(P).................
2
1
3

Chapter 2: Urea Cycle Enzymes
20
The activity of GDH may result in oxidative deamination of glutamate, or in reductive amination of
2-oxoglutarate as the reaction is reversible (Garnier et al., 1997).
Glutaminase catalyzes the first reaction of the primary pathway for ammonia synthesis (Goldstein,
1967) forming glutamate and ammonia. This enzyme also forms part of urea cycle, where it
catalyses the hydrolytic cleavage of glutamine to form glutamate and ammonium ions in
mammalian systems (Watford et al., 2002), as well as bacteria, moulds and yeasts (Imada et al.,
1973). The role of the catalytic activities of glutaminase (Garnier et al., 1997) and GDH in the
synthesis of ammonia are shown in a coupled reaction 4 and 5 below.
L-glutamine + H2O L- glutamate + NH3....................
Glutamic acid + ß-NAD 2-ketoglutarate + ß-NADH + NH3……………….
The Urea cycle has six reactions following each other and works together to rid the body of waste
nitrogen (Figure 2.1). Arginase is the sixth and final enzyme of this cycle, being considered to be
the most recently evolved of all the enzymes in the cycle (Brusilow & Horwich, 2001). When
arginase catalyses the conversion of arginine to urea and ornithine, ornithine is recycled to continue
the cycle, while urea is excreted out of the cell as excess nitrogen (Brusilow & Horwich, 2001).
There have also been reports of urea re-absorption being a useful supply of nitrogen (Cirio &
Boivin, 1990). The first three enzymes in the cycle, namely, N-acetyl-glutamate synthase (NAGS),
carbamoyl phosphate synthase I (CPSI), and ornithine transcarbamylase (OTC), function inside the
mitochondria, whereas the other three, namely argininosuccinic acid synthase (AS),
argininosuccinic acid lyase (AL), and arginase (ARG), act in the cytosol of the cell (Brusilow &
Horwich, 2001). The best characterized arginase of animal origin is from rat and rabbit livers,
where highly purified forms of this enzyme with similar physicochemical properties were
suggested to have an oligomeric native structure (Reyero & Dorner, 1975).
In mammals, arginase has also been purified and characterized from different organs, with each
having different characteristic properties with regard to molecular weight, subunit structure and
their regulation in urea cycle (Carvajal, et al., 1982). In general, this enzyme has been found to
exist in two forms, having a broad tissue distribution, including liver and muscles. Although the
two forms of arginase are encoded by distinct genes with subcellular localization, they nevertheless
GDH
4
?
? 5

Chapter 2: Urea Cycle Enzymes
21
possess similar enzymatic properties. A cytosolic form of arginase (Arginase I) is highly expressed
in the liver or hepatic cells, playing an important role in ureagenesis. Extrahepatic arginase
(Arginase II) is thought to be involved in the biosynthesis of polyamines, ornithine, proline,
glutamate and also in the inflammatory process. Arginase II is a mitochondrial protein that is
mainly concentrated in the kidney (Cederbaum et al., 2004). Some studies have documented the
presence of arginase I and II in blood vessels from numerous animal species (Berkowitz et al.,
2003).
In addition, the type II isoenzymes have also been reported from rat kidneys (Kaysen & Strecker,
1973) and mammary glands (Jenkinson & Grigor, 1994).
Figure 2.1. A general overview of L-arginine-connected pathways. (1) Arginase, (2) ornithine
carbamoyl transferase, (3) argininosuccinate synthetase, (4) argininosuccinase (5) NO synthase, (6)
ornithine decarboxylase, (7) ornithine transaminase, (8) glutamine synthase and (9) glutaminase
(Cynober et al., 1995).
4
Arginosuccinate
3
Arginine
NO
5
Citrulline
2
Ornithine
1
6
α-amines
7
9
Glutamate
Glutamate semi-
aldehyde
8
Glutamine

Chapter 2: Urea Cycle Enzymes
22
Type II arginase isoenzyme has a wide tissue distribution and subsequently plays significant roles
in arginine metabolism, unlike the type I arginase isoenzyme, whose primary function is only the
net production of urea for excretion. The main function of Type II arginase isoenzyme is believed
to be net production of ornithine, a precursor for the biosynthesis of glutamate or polyamines (Li, et
al., 2001), as also found by Cederbaum in 2004.
Previous studies have shown that type I and type II arginases are located extrahepatically, with the
possibility that both enzymes might be involved in the regulation of nitric oxide production in
mammals. Elevated levels of type II arginase activity have been reported to be involved in the
production of ornithine and subsequently of proline and polyamines, all of which are necessary for
wound healing, while expression of the type I isozyme helps in the prevention of excessive
amounts of toxic nitric oxide (Salimuddin et al., 1999; Louis et al., 1998).
Arginine has been reported to be synthesized in only one way for mammalian cells; this mechanism
involves enzymes argininosuccinate synthase (EC 6.3.4.5) and argininosuccinate lyase (EC 4.3.2.1)
which transforms citrulline into arginine via arginosuccinate (Figure 2.1, Page 21). These enzymes
are found predominantly in liver tissues, occurring intracellularly across mitochondrial and
cytosolic barriers. The very high hepatic content of arginase which splits arginine into ornithine and
urea (Figure 1.3, Page 11) prevents the release of any arginine from the liver into the circulation.
The major source of endogenously synthesized arginine is derived from citrulline, which is taken
up by the kidney, with citrulline itself being mainly derived from glutamine and glutamate
metabolism (Tuchman & Batshaw, 2002; Saheki et al., 1977).
Three isoenzymes exist for carbamoyl phosphate synthetase, namely CPS1, CPS2 and CPS3
(Lawson et al., 1996). CPS1 utilizes ammonia rather than glutamine and is activated by
acetylglutamate (Marshall 1976; Anderson 1980). CPS2 is glutamine-dependant enzyme which
catalyzes the first committed step in pyrimidine biosynthesis, and subsequent arginine biosynthesis
in bacteria and fungi (Lawson et al., 1996). CPS3 has also been discovered in fish and in some
invertebrates. It is an acetyl-glutamate-activated enzyme which is related to CPS1 (Hong et al.
1994).

Chapter 2: Urea Cycle Enzymes
23
The interest of many researchers was drawn to a glutamine-dependent form of CPS, after it was
discovered in the mushroom Aguricus bisporus (Levernberg, 1962). Another glutamine dependent
form of CPS was also found in extracts of Escherichia coli (Pierard & Wiame, 1964), mammalian
liver mitochondria (Marshall et al., 1958) and frog liver mitochondria (Marshall et al., 1961).
Carbamoyl phosphate plays an integral part as intermediate in the biosynthesis of pyrimidine
nucleotides, including arginine from glutamine, which also involves bicarbonate, and two
molecules of Mg-ATP, as shown in Figure 2.2.
Figure 2.2. Summarised reaction mechanism in the biosynthesis of carbamoyl phosphate via three
unstable intermediates (Adopted from Lund et al., 2010).
The ability of CPS from E. coli to utilise either ammonia or glutamine, as the amino group donor,
was demonstrated by Kalman et al, (1965). Genetic evidence from the well studied Escherichia
coli has also indicated that the most important mechanism for the synthesis of carbamoyl phosphate
utilizes L-glutamine as a nitrogen donor instead of NH4+
(Pierard et. al., 1965).
In the reaction mechanism for CPS requiring glutamine for enzymatic activity, ATP phosphorylates
bicarbonate to form carboxy phosphate, while glutamine is hydrolysed to glutamate and ammonia.
The ammonia then reacts with the carboxy phosphate intermediate to form carbamate. In the final
HCO3-
Bi-carbonate
ATP
ADP
CO.O.PO32-
Carboxy phosphate
H2O
NH3
L-Glu
L-Glutamine
CO2-.NH2
Carbamate ADP
ATP NH2.CO.O.PO3
2-
Carbamoyl phosphate
Chapter 2: Urea Cycle Enzymes
24
step, a second molecule of ATP phosphorylates carbamate to produce carbamoyl phosphate. There
are three unstable intermediates formed in this process of four separate reactions (ammonia,
carboxy phosphate, and carbamate), before formation of carbamoyl phosphate, as indicated in
Figure 2.2 (Page 23).
Carbamoyl phosphate is of particular importance, because it is a precursor of arginine which, in
turn, is the last in the formation and excretion of urea (Tuchman & Batshaw, 2002). CPS has been
well studied from mammals, plants, yeast and bacteria. These studies revealed that in all cases at
least two distinct enzymes catalyse the synthesis of carbamoyl phosphate (Elliott & Tipton, 1974;
Kalman et al., 1965; Hiller, 1964; Levenberg, 1962).
CPS catalyses a reaction which results from the previous catalysis of three steps in sequence:
bicarbonate phosphorylation, carbamate formation from carboxy-phosphate and ammonia, with
subsequent carbamate phosphorylation (Lusty, 1983; Marshall et al., 1958). A partial bicarbonate-
dependent ATPase reaction reflects a step of bicarbonate phosphorylation, while a partial reaction
of ATP synthesis from ADP and carbamoyl phosphate, reflects the reversal of the step of
carbamate phosphorylation (Figure 2.2, Page 23).
Carbamoyl phosphate synthetase I (CPSI) deficiency, is an autosomal recessive inborn error of the
urea cycle that causes generally lethal hyperammonaemia, protein intolerance, as well as impaired
physical development (Summar et al., 1995; Brusilow & Horwick, 2001). Two clinical patterns of
CPS deficiency are described as neonatal form and delayed onset form (Gelehrter & Snodgrass,
1974; Arashima & Matsuda, 1972; Russell et al., 1962). Enzyme defects are more severe in the
neonatal form and a partial deficiency can occur in the late onset form (Hoshide et al., 1993).
A variety of diseases have been attributed to a deficiency in CPS, including ornithine
transcarbamoylase deficiency (Palmer et al., 1974), as well as congenital hyperammonemia
(Snodgrass & Delong, 1976).
The nature and the properties of the glutamine synthetase (GS) have been purified from different
sources, including bacteria (Adler et al., 1975), blue green alga (Orr et al., 1981), yeast (Mitchell &
Magasanik, 1983), sheep brain (Ronzio et al., 1969), pig brain (Stahl & Jaenicke, 1972), rat liver

Chapter 2: Urea Cycle Enzymes
25
(Deuel et al., 1978), and chick retina (Sarkar et al., 1972), amongst others. In bacterial GS, the
cellular activity of GS is finely regulated by repression/derepression mechanisms, mainly by
adenylylation and deadenylylation of a specific tyrosine residue (Stadtman et al., 1968), although
this process does not happen in mammals (Brown et al, 1971). GS plays a key role in nitrogen
assimilation, because it regulates the synthesis of several other enzymes involved in nitrogen
metabolism, including glutaminase, which requires glutamine synthesised by GS from glutamate
and ammonium (Magasanik et al., 1974; Tyler, 1978). The glutamate-to-glutamine conversion
(reaction 5) by glutamine synthetase (GS) provides the nitrogen donor for the first step in the
biosynthesis of many amino acids, purines, pyrimidines, and amino sugars (Robinson et al., 2001).
(http://themedicalbiochemistrypage.org/nitrogen-metabolism.php)
GS is found at high levels in mammalian brain and liver (Robinson et al., 2001). In mammalian
liver, GS is reported to be expressed exclusively in 1-3 cell layers surrounding the central vein of
the liver lobules (Gebhardt & Mecke, 1983).
Some of the earlier research on the activity of GS in fish focussed mainly on the control of
ammonia disposal and urea formation, such as the study by Anderson (1989), which demonstrated
that high GS activity could be found within the brain, presumably to detoxify ammonia which
might cross the blood-brain barrier (Wilson & Fowlkes 1976).
…………6

Chapter 2: Urea Cycle Enzymes
26
Bacterial, mammalian and chicken GS have remarkable similarities, but none of these are
physically or chemically identical. Moreover, there are many discrepancies concerning the
regulatory effect of different metal ions on GS activity (Ip et al., 1983; Pishak & Phillips, 1980).
The ability of different divalent cations to activate and regulate of GS has been extensively studied.
Among eight cations tested for ovine brain GS (Ca2+
, Co2+
, Fe2+
, Li2+
, Mg2+
, Mn2+
, Ni2+
, Zn2+
) only
Co2+
, Mg2+
and Mn2+
supported GS activity; the order of activity being Mg2+
> Co2+
> Mn2+
in
ovine brain. The maximum activating effect of Mn2+
occurs only within a very narrow range of
concentration, with an excess of cation causing strong inhibition of GS activity (Tholey et al.,
1987). Mn2+
may modulate the Mg2+
dependent GS activity as proposed in a regulatory system
under scrutiny, via the interactions of the two cations, which may be of significance in the
intracellular control of glutamine synthesis (Tholey et al., 1987).
High acidity in the liver diminishes the rate of glutamate and glutamine metabolism via the
phosphate dependent glutaminase (PDG) and GDH pathway, but stimulates glutamine synthesis via
GS by recycling glutamine. This process happens in humans (Nissim, 1999), but it is not known
what exactly occurs in bovine physiology with regard to acidosis in the liver, except that levels of
glutamine are lowered (Phromphetcharat et al., 1981). It has been demonstrated that where
activities of the hepatic urea cycle enzymes CPS, OTC, and AS are increased in developing
Holstein calves, they appeared to contribute to increased urea synthesis as well as recycling
thereof (Tagaki et al., 2008). Increased activities of urea cycle enzymes may also be secondarily
caused by the demand on urea synthesis after weaning, such as by an increased production of
ammonia by ruminal microbes, or gluconeogenesis from amino acids.
Irreversible inactivation of GS in vivo with L-Met-S-sulfoximine leads to convulsions and death of
the animal, thus indicating that the activity of the GS enzyme is essential. Two reasons for this, are
the removal of toxic NH4+ plus the modulation of levels of L-glutamate and γ-aminobutyric acid,
which are neurotransmitters (Norenberg, 1979).
The glutamine synthetase reaction is important in several respects. First it produces glutamine, one
of the 20 major amino acids. Second, in animals, glutamine is the major amino acid found in the
circulatory system (Maurizi et al., 1986). Its role is to carry ammonia to and from various tissues,

Chapter 2: Urea Cycle Enzymes
27
but principally from peripheral tissues to the kidney, where the amide nitrogen is hydrolysed by the
enzyme glutaminase; this process regenerates glutamate and free ammonium ion, which is excreted
in the urine (Juurlink, 1982). The position of GS in the complex matrix of nitrogen and carbon
metabolism is shown in Figure 2.3.
Figure 2.3. An indication of the position of GS in the complex matrix of nitrogen and carbon
metabolism. The role of GS (6) is encompassed in this figure amongst other enzymes such as
glutaminase (7) and glutamate dehydrogenase (5) (Robinson et al., 2001; Rennie, 2011).
GS also aids in the synthesis of glutamate the precursor of the glutamine pool, by combined action
with glutamate synthase (GOGAT; L-glutamine: 2-oxoglutarate aminotransferase, EC 2.6.1.53)
(Janssen et al., 1980). Within the urea cycle, the high affinity of GS for ammonia allows removal of
low concentrations of ammonia (Laemmli, 1970; Juurlink, 1982). Thus GS may presumably play a
modifying role in urea-cycle disorders that can result in hyperammonaemia. A second very
important site for ammonia detoxification by GS is in muscle tissue (Maurizi et al., 1986).

Chapter 2: Urea Cycle Enzymes
28
Glutamine is an important and most abundant amino acid in mammalian blood, making up as much
as 20% of the total amino acid content (Meister, 1984). It is also a significant fuel source utilized
by lymphocytes in rats (Ardawi & Newsholme, 1983) and an important precursor for nucleotide
synthesis (Krebs, 1980). In catabolically stressful disease states, where the immune system is also
placed under high stress, levels of glutamine in the body are lowered, particularly during starvation
scenarios (Cahill 1970), trauma (Souba et al., 1988), acidosis (Phromphetcharat et al., 1981) and
wound healing (Caldwell, 1989). Highly stressful states and suppression of the immune system
during these periods have been linked with lowered availability of glutamine, which has led to the
theory that during severe stress and coinciding with decreased glutamine levels in the circulation,
the immune system is compromised and the mammal becomes more susceptible to infection (Parry-
Billings et al., 1990; Keast & Morton, 1992). In the mammal, glutamine synthetase activity has
been found to be absent from cells and organs of the immune system (Ardawi & Newsholme, 1984)
or nearly so (Szondy & Newsholme 1990). This finding suggests that the immune system is
normally dependent on circulating glutamine. As glutamine can be synthesized de novo, it is
considered a nonessential amino acid that is believed to play a significant role in protein balance
(Lacey & Wilmore, 1990).
There are three types of glutamate dehydrogenase (GDH) that vary according to the coenzyme they
use: NAD(H)-specific, NADP(H)-specific, and GDH, with mixed specificity. NAD(H)-specific
GDH is believed to participate mainly in the catabolism of glutamate, whereas NADP(H)-specific
GDH has mainly an anabolic role (Smith et al., 2001).
GDH is present in the brain at about one-tenth of the activity of GDH in the liver and
immunological studies have already suggested that GDH from the liver as well as from the brain
may have similar properties (Talal & Tomkins, 1964; Smith et al., 2001). The situation concerning
the role of glutamate dehydrogenase, in the brain, is complicated because glutamate is believed to
act as an excitatory neurotransmitter, as well as playing a major role, as a precursor of the
neurotransmitter, γ-aminobutyrate, in the brain (McCarthy, 1980). The role of GDH in the liver is
not as complicated, since the involvement of GDH in serving to balance both nitrogen assimilation
with amino acid catabolism, has been clearly demonstrated (Hudson & Daniel, 1993). Mammals

Chapter 2: Urea Cycle Enzymes
29
have only one form of this inner mitochondrial enzyme that uses either NAD(H) or NADP(H) with
comparable efficacy (Peterson & Smith, 1999).
Mammals express three isoforms of glutaminase, which are encoded by two distinct but structurally
related genes (Labow et al., 2001). Phosphate-dependent glutaminase is mitochondrially situated
(Guha, 1961) and accounts for higher percentage of the glutamine-hydrolysing activity of the liver
than any other enzyme (Horowitz & Knox, 1968) in the mammalian system. This enzyme appears
to be associated with the inner membrane of the mammalian mitochondria according to McGivan et
al., 1980.
Glutaminase has been isolated from most organs of the mammalian body including the rat kidney
(Curthoys & Weiss, 1974), rat liver (Smith & Watford, 1988), brain mitochondria (Kvamme et al.,
2001), as well as hog small intestinal mucosa (Gelfand et al., 1968).
Glutaminase is the major enzyme of glutamine breakdown in most mammalian tissues including
brain and liver (Kvamme et al., 1988; Orloff & Burg, 1971). Glutamine is the most abundant free
α-amino acid found in the body (Medina, 2001). In essence, glutaminase plays an integral part in
the deamidation of glutamine, which has an important role from the point of view relating to meat
production, specifically in the Beef Industry, through hydrolysis of the glutamine amide group
(Dura et al., 2004). Glutamine deamidation produces ammonia and glutamate (Watford et al.,
2002), which respectively becomes an acidity neutraliser and flavour enhancer in meat production
(Dura et al., 2004). Glutamine is also the main respiratory fuel of the small intestine (Windmueller
& Spaeth, 1978). Carbon derived from glutamine is either channelled into the biosynthesis of other
amino acids, or degraded to yield chemical energy, while ammonia derived from glutamine is
either exported to the liver or used for the biosynthesis of pyrimidine nucleotides (McCauley et al.,
1999).
Glutamine deficiency in animal models, which were induced by glutaminase infusion, was found to
be associated with diarrhoea, dysentery and bowel necrosis, particularly in the studies conducted on
rabbits and rhesus monkeys (Hambleton et al., 1980) and also in the study of glutaminase toxicity
in rabbits (Baskerville et al., 1980)

Chapter 2: Urea Cycle Enzymes
30
Mammalian liver possesses a unique isozyme of phosphate-activated glutaminase, which plays an
important role in the balance between nitrogen assimilation and amino acid formation through the
regulation of glutamine catabolism (Smith & Watford, 1990). The existence of two isozymes of
glutaminase was first noted by Krebs in 1935. Through glutamine metabolism, hepatic glutaminase
may be responsible, in part, for the regulation of circulating pH, as Haussinger et al. (1988)
suggested.
Various mammals express two isoforms of glutaminase, that are derived from distinct but
structurally related genes, namely a `hepatic type' which is found only within the liver (Watford,
1993) and a `kidney type', which is widely distributed throughout extra-hepatic sites, but most
active within the kidney and villus enterocytes of small intestines (Sarantos et al., 1993). The two
isoforms of glutaminase function in different areas of mammalian system, at different levels of
activity, including that involved in hepatic ureagenesis and gluconeogenesis (Watford et al., 2002),
renal ammoniagenesis (Curthoys & Gstraunthaler, 2001), the synthesis of excitatory and inhibitory
neurotransmitters (Cooper, 2001), and in the utilization of glutamine as a metabolic fuel (Mithieux,
2001). These isoforms of glutaminase are abundant in rat kidney, brain, intestine, and hepatoma
tissues, but are absent from mammalian liver (Kovacevic & McGivan, 1983). The glutaminase
isoforms contained within intact brain and kidney mitochondria consists of 65- and 68-kDa
peptides, which have been shown to be structurally and immunologically related (Shapiro et al.,
1987; Haser et al., 1985).
Liver glutaminase activity increases in response to diabetes, starvation, and high protein feeding,
but is not affected by changes in acid-base status, as is the case with kidney glutaminase, which is
regulated by changes in acid-base status. The changes in glutaminase activity in liver, during
diabetes, are due to an increased amount of enzyme protein with no change in specific activity
(Smith & Watford, 1988).
Glutamate, being the by-product of the reaction catalysed by glutaminase, is at the centre of the
disposal of the daily protein load. The “glutamate family” of amino acids (glutamate, glutamine,
proline, histidine, arginine and ornithine) comprise ~25% of the dietary amino acid intake, which is
disposed of via conversion to glutamate. As such, the key role of glutaminase, together with the

Chapter 2: Urea Cycle Enzymes
31
glutamate-linked aminotransferases, is in effecting the removal of α-amino nitrogen from almost all
of the amino acids via transdeamination. Glutamate also plays a key role in N-acetyl-glutamate
synthesis, which ensures that the rate of urea synthesis is in accord with rates of amino acid
deamination (Brosnan, 2000).
2.1. Enzymology of urea cycle enzymes
Arginases, whether of eukaryotic or prokaryotic origin, have a common feature in having a
requirement of divalent cations for their activity (Ash, 2004). Mn2+
has since been reported as the
physiologic activator, although other arginases also use different divalent cations, like Co2+
and
Ni2+
(Mora et. al., 1965; Brown, 1966) and in some instances for Fe2+
and Cd2+
are also used
(Anderson, 1945; Edlbacher & Baur, 1958).
Arginases have an alkaline pH optimum with maximal velocities observed in the range of pH 9.0–
9.5 (Roholt & Greenberg, 1956). Rat liver Arginase in a plot of log Vmax versus pH has provided a
pK value of ~7.8–8.0 (Reczkowski, 1991) while pK values of 7.8 and 7.9 have also been reported
in other studies of rat liver (Kuhn et al., 1991) enzymes.
Substrate specificity of the arginases depends on the presence of an intact guanidinium group, the
proper length and hydrophobicity of the side chain, as well as the stereochemistry and nature of
substituents at the Cα position of the molecule (Reczkowski & Ash, 1994). This phenomenon is
demonstrated by D-arginine and guanidinobutyrate failing to work as substrates for the enzyme.
Such exquisite substrate specificity suggests that a well-defined constellation of hydrogen bond
donors must be present at the active site (Ash, 2004).
Arginase has a trimetric structure (i.e. having three identical subunits), with depending on the
organism each subunit having a molecular mass of 20 to 40kD that can bind two Mn2+
ions (Figure
2.4) (Kanyo et al., 1996). Ornithine, lysine, and branched-chain amino acids are all competitive
inhibitors of arginase. However, this enzyme has such a high maximum specific activity, that even
when inhibited, it will never limit flux through the ornithine cycle. Arginase is found primarily in
the liver and, to a lesser extent, in various other organs and tissues. The ornithine thus generated in
the system, is then metabolized to polyamines through ornithine decarboxylase (ODC), then to
Chapter 2: Urea Cycle Enzymes
32
glutamate (mediated by ornithine aminotransferase), and finally to citrulline (mediated by ornithine
carbamoyl transferase) (Cohen, 1962).
CPS is a heterodimeric enzyme composed of two subunits of unequal size (Abdelal & Ingraham,
1975) with the heavy and light subunits being ~40kDa and 118kDa, respectively (Thoden et al.,
1997; Mathews & Anderson, 1972). The heavy subunit alone, catalyses the synthesis of carbamoyl
phosphate from ammonia, ATP and bicarbonate, a reaction which is activated by the presence of
ornithine, while the light subunit confers the ability to utilize glutamine as the amide donor (Trotta
et al., 1974; Abdelal & Ingraham, 1975).
CPS has also been shown to be twice as active when Mg2+
was used as the co-factor, compared to
when Mn2+
and Fe2+
were used as co-factors, each on their own (O‟Neal & Naylor, 1969).

Chapter 2: Urea Cycle Enzymes
33
Figure 2.4. Crystal structure of Arginase complexed with 2Mn2+
ions and the arginine analogue
nor-N-omega-hydroxy-L-arginine (Cox et al., 2001).
Carbamoyl phosphate synthetase (Figures 2.5 - 2.6) as purified from the liver of several
mammalian species, has demonstrated the requirement for N-Acetyl-glutamate, Mg2+
and K+ for
enzymatic activity (Jones, 1965; Marshall et. al., 1961).

Chapter 2: Urea Cycle Enzymes
34
Figure 2.5. Structure of Carbamoyl phosphate synthetase. The small subunit that contains the
active site for the hydrolysis of glutamine, is shown in green whereas the large subunit, that
contains the active site for the synthesis of carboxy phosphate and carbamate, is shown in red. The
other terminal domain of the large subunit that contains the active site for the synthesis of
carbamoyl phosphate is shown in blue (Lund et al., 2010).

Chapter 2: Urea Cycle Enzymes
35
Figure 2.6. Stereo view of a ribbon representation of the large and small subunits of CPS. Shown
here are the locations of the glutamine binding site, the carboxyphosphate and carbamoyl
phosphate active sites together with the allosteric sites (Thoden et al., 1997).
Glutamine was found to be inactive as a substrate to rat CPS, while ammonium was found to be
optimal in the pH range 6.8 - 7.6. Mg2+
and Mn2+
were equally effective as cofactor metal ions in
the forward reaction of rat liver CPS (Lusty, 1978), but excess Mn2+
was found to be inhibitory to
rat liver CPS, as was the case of GS (Tholey et al., 1987).
Extensive biochemical and structural studies have resulted in a picture of the mechanism and
regulation of GS (Eisenberg et al., 2000). Structural analysis of GS has demonstrated that all GS
assemblies are composed of two closed ring structures with active sites formed between protomers,
which associate across an interface, being arranged with dihedral symmetry. GS-I enzymes have
always been dodecameric oligomers with 622 symmetry, whereas the assignment of a consensus

Chapter 2: Urea Cycle Enzymes
36
quaternary structure for the GS-II enzymes, has been controversial. Most recently, crystal structures
of GS from plants (Unno et al., 2006; Seabra et al., 2009), yeast (He et al., 2009), and mammals
(Krajewski et al., 2008) have overturned the octameric assignments from early electron microscopy
studies and revealed a decameric arrangement of subunits with 522 symmetry. To date, however,
only low-resolution structural data exists to describe GS-III enzymes, which are also double-ringed
dodecamers (van Rooyen et al., 2006).
In another study where ß-glutamate and α-glutamate were tested as substrates for GS, activity was
moderately high toward both ß-glutamate and α-glutamate. Specific activities of GS in the test with
ß-glutamate and α-glutamate could be increased when 500mM potassium acetate was added to the
purification buffer (Robinson et al., 2001). As confirmed by high performance liquid
chromatography (HPLC), the product of the reaction with ß-glutamate, ATP and crude enzyme was
ß-glutamine which therefore confirmed the substrate ß-glutamate effectiveness (Lai et al., 1991;
Robinson et al., 2001) in both reactions where either hydroxylamine or ammonium was used. There
is evidence that the activity of GS is dependent on glutamate concentration, this was demonstrated
by a hyperbolic trend followed by GS when glutamate concentrations were varied (Robinsn et al.,
2001).
Mammalian GS is a multimeric enzyme composed of 10 identical subunits (Figure 2.7) with each
subunit varying being between 41 and 58kDa molecular weight, depending on the organism. This
pattern is also apparent in most bacteria, archaea and mammals (Meister, 1980; Tholey et al., 1987;
Lai et al., 1991).

Chapter 2: Urea Cycle Enzymes
37
Figure 2.7. Crystal structures of mammalian glutamine synthetase with 10 identical sub units
showing the 522 symmetry. (Krajewski et al., 2008).

Chapter 2: Urea Cycle Enzymes
38
The necessary binding of metal ions affects the state of aggregation of the enzyme when tested in
vitro (Denman & Wedler, 1984). The many studies with GS have shown that there are two essential
metal ion sites per subunit (Figure 2.7, Page 37) that must be saturated for activation to take place
(Hunt et al., 1975) , particularly where metal ions and active-site ligands greatly stabilize inter-
subunit bonding domains (Maurizi & Ginsburg, 1982). Although GS of bacterial origin greatly
differs from the GS obtained from mammalian tissues, as it relates to oligomeric structure, but
comparisons of catalytic activities have nevertheless indicated marked similarities in active sites
(Gass & Meister, 1970).
The structures of bovine GDH have been studied and determined using X-ray crystallography
(Smith et al., 2001). The enzyme is a homo-hexamer with each subunit having a molecular mass of
~56 kDa. The core structure of the mammalian GDH is a stacked dimer of trimers which form the
N-terminal, “glutamate-binding domain” that is composed mostly of α-strands. On top of these
domains is the NAD binding domains that rotate down upon the substrate and coenzyme to initiate
catalysis. This rotation occurs about a helix at the back of the NAD binding domain called the
“pivot helix”. The determined structure of bovine GDH complexed with NADH, glutamate and
GTP are depicted in Figure 2.8 (Smith et al., 2001). NADH has been shown to bind to a second
site on each subunit, but the effect of coenzyme binding to this site is unclear. This second
coenzyme site binds NAD(H) 10-fold better than NADP(H) (Smith et al., 2001).
The structure of GDH (Figure 2.8) is essentially made up of two trimers of subunits stacked
directly on top of each other, with each subunit being composed of at least three domains (Li et al.,
2012; Smith et al., 2001). The bottom domain makes extensive contacts with a subunit from the
other trimer. Resting on top of the bottom domain is the „NAD binding domain‟ that has the
conserved nucleotide-binding motif. Mammalian GDH has a long protrusion or „antenna‟, rising
above the NAD binding domain that is not found in bacteria, plants, fungi, and the vast majority of
protists. The antenna from each subunit lies immediately behind the adjacent, counter-clockwise
neighbour, within the trimer (Li et al., 2012).

Chapter 2: Urea Cycle Enzymes
39
Figure 2.8. Structure of bovine GDH. On the left is the structure of bovine GDH with each subunit
represented by a ribbon diagram in different colours. On the right side are magnified views of the
regions that exhibit large conformational changes. The arrows highlight the key movement points
(Li et al., 2012).

Chapter 2: Urea Cycle Enzymes
40
Purified mammalian glutaminase isozymes are of different sizes; with kidney-type glutaminase
being composed of four subunits of 65 and 68 kDa in size, whereas the monomer size of the liver
glutaminase is 58 kDa (Watford, 1993). According to Haser et al, (1985), after comparing
glutaminase protein from rat kidney and brain, it was confirmed that the protein is a hetero-tetramer
composed of three 66-kDa and one 68-kDa peptides. Hepatic glutaminase activity is subject to
acute regulation by hormones, such as glucagon, catecholamines and effectors such as ammonia,
bicarbonate and pH (Szweda & Atkinson, 1989).
When studying the many effects pertaining to activity of these enzymes, such as product inhibition,
many factors have been proposed to influence the activity of mammalian glutaminase, including
ammonia (Haussinger & Sies, 1979), HCO-3; glucagon (Joseph & McGivan, 1978), cAMP and
branched-chain amino acids (Baverel & Lund, 1979).
Glutaminase activity is seen to be negligible in some studies of rat liver when ammonia is not
added as the activator (Haussinger & Sies, 1979). In contrast to its activation by ammonia, the
activity of glutaminase is competitively inhibited by glutamate. This effect can most likely be
attributed to glutamine and glutamate interacting with the same active site on glutaminase enzyme,
although specificity of the site is dependant on the concentration of phosphate in the reaction buffer
(Krebs, 1935; Goldstein, 1966; Shapiro et al., 1982).
The monomeric structure of kidney glutaminase is as shown in Figure 2.9 (Karlberg et al, 2012).
Included in the structure is the location of glutamate in the active site.

Chapter 2: Urea Cycle Enzymes
41
Figure 2.9. The crystal structure of kidney glutaminase showing glutamate in the active site
(Karlberg et al., 2012).

Chapter 3: Materials and Methods
42
CHAPTER 3: MATERIALS AND METHODS
To determine the extent by which the specific enzyme activities of the urea cycle enzymes of
Nguni and Hereford breeds differ, livers were obtained from both breeds of animals. The extraction
and purification protocols for arginase, GS, GDH, CPS and glutaminase are outlined below. Four
purifications were carried out for each enzyme arising from four different livers from each breed.
The specific activities were determined using steady-state enzyme assays as outlined below. All
enzymes were assessed for purity using SDS-PAGE. The liver samples from the Nguni breed
considered in this study were kindly provided by Hannes van der Merwe, from Devon farming and
Hans van Zyl from Agricultural Research Council Animal Improvement Institute (ARC-AII), Irene
South Africa. The other liver samples from the Hereford breed utilised in the study were kindly
supplied by the Hereford Breeders Association of South Africa with the assistance of Kobus
Grobler.
3.1. Purification of bovine liver arginase
3.1.1. Materials
All solutions were prepared with nano-pure deionised water. Analytical reagent grade chemicals
were used without further purification, being obtained from the following commercial sources:
Sucrose, potassium chloride, Sodium chloride, L-arginine-HCl, MnCl2.4H2O, β-mercaptoethanol,
Sodium hydrogen carbonate, Tri-chloro-acetic acid, urea and ammonium sulphate from Merck
chemicals (RSA); acrylamide/Bis-acrylamide from Sigma aldrich; Trizma (Sigma, Steinheim
Germany); SDS (Boehringer, Germany); Ninhydrin (USB cooperation, UK); Sephadex G-25,
DEAE Sephacel, CNBr-Sepharose 4B from Pharmacia Biotech (Uppsala, Sweden); Zhicheng
Shaking incubator (Shanghai, China); Molecular weight marker (Fermentas); Glacial acetic acid
and methanol (Saarchem, RSA); Perkin Elmer Cetus DNA thermal cycler heating block;
Coomassie brilliant blue (R-250).

Chapter 3: Materials and Methods
43
3.1.2. L-Arginine-AH-Sepharose 4B affinity preparation
Arginase was purified using an L-arginine based affinity resin. The L-Arginine-AH-Sepharose 4B
affinity resin was prepared according to Patil et al., 1990. L-Arginine-HC1 (0.25g) was dissolved
in 20 ml coupling buffer made of 0.1 M NaHCO3, pH 8 containing 0.5M NaCl. Activated resin was
washed with cold 1mM HCl (1 µl/ 10 ml) for 30 minutes at 4°C (reactive groups hydrolyses at high
pH). Ligand solution was mixed with gel for 2 hours at room temperature, while uncoupled
arginine was removed by washing the gel with coupling buffer. Remaining active groups were
blocked by transferring the medium to 0.1M Tris-HCl buffer pH 8.0 and left to stand for 1 hour at
room temperature. Three cycles were used to thoroughly wash the product at alternating pH. Each
cycle consisted of a wash with 0.1M acetic acid/sodium acetate, pH 4.0 containing 0.5M NaCl,
followed by a wash with 0.1M Tris-HCl buffer pH 8 containing 0.5 M NaCl.
The column was equilibrated with Tris-HC1, 10mM, pH7.8, 1mM MnC12 and stored at 4 °C in a
20% ethanol. The medium was always prevented from freezing.
3.1.3. Purification of bovine liver arginase procedure
Purification of arginase was done according to Dabir et al., 2005 with some modifications by
incorporating an extraction method by Reyero & Dorner, 1975. All procedures were performed at
4oC unless otherwise mentioned. The liver samples, which were initially stored in a 3M Sucrose
solution at -70oC, were subsequently thawed at room temperature and lifted out of the sucrose
solution before being washed with purification buffer. Each 15 g mass of liver sample was weighed
and homogenized with 100 ml of chilled Tris-HCl buffer (100mM, pH 7.5) containing 5mM MnCl2
and 100mM KCl. The homogenate was centrifuged at 17,100 x g for 30 minutes and the
supernatant was collected, while the pellet was discarded.
This supernatant was then subject to heat treatment at 60oC for 30 minutes, with swirling in a
shaking incubator. The supernatant was then immediately cooled in an ice bath, with denatured
proteins being removed by centrifugation at 15,800 x g for 20 minutes.

Chapter 3: Materials and Methods
44
The resulting supernatant was adjusted to 30% (197.5 g/L) saturation with solid (NH4)2SO4 and
stirred at 4 ºC for 30 minutes. The solution was then centrifuged and the pellet discarded. The
supernatant was then brought to 60% (385 g/ L) saturation with solid ammonium sulphate and
treated as before, except that the pellet was retained. The pellet was resuspended in 45 ml of 15mM
Tris-HCl buffer pH 8.0 containing 5mM MnCl2 and brought to solution by gently stirring. The
unresolved proteins were removed by centrifugation at 15,800 x g for 20 minutes and the
supernatant dialyzed overnight against 1L of the same Tris-HCl buffer used for homogenization.
Sephadex G-25 Chromatography
The dialyzed material was applied to a 2.5 x 10 cm Sephadex G-25 column, which was equilibrated
with a 5 bed volume of 15mM Tris-HCl, pH8.0. This material was then eluted with 12 ml of the
same buffer. All samples thus prepared were assayed; with fractions containing activity being
further purified using a DEAE Sephacel column.
DEAE-Sephacel chromatography
Combined samples from the Sephadex G-25 column were applied to a 2.5 x 10 cm column of
DEAE-Sephacel (Sigma) at 4oC equilibrated with the Tris-HCl buffer (15mM, pH 8.0) containing
2mM MnCl2. Elution was carried out with a linear gradient of NaCl from 0 to 0.5M in the same
buffer containing 2mM MnCl2 at a flow rate of 2 ml / min. The active fractions containing arginase
activity were pooled together and stored.
L-Arginine-AH-Sepharose 4B affinity column chromatography
The pooled fractions from above step were dialyzed at 4oC in 1 X 2 L of Tris-HCl buffer (15mM,
pH 8.0) containing 2mM MnCl2 and passed through a cyanogen bromide activated Sepharose 4B
column equilibrated with a 5 bed volume of 100mM Tris-HCl, pH 8. Each protein sample was
loaded onto the column, which was then incubated in ice for 30 minutes. The column was then
washed with a single bed volume of equilibration 100mM Tris-HCl, pH 8 and eluted with fresh
elution buffer containing 3.75 ml buffer, 0.4g KCl, and 0.26g L-Arginine-HCl and 6.25 ml H2O in
2 ml fractions.

Chapter 3: Materials and Methods
45
Thereafter, 2 ml column fractions were collected at a flow rate of 2 ml/ min, before assaying for
arginase activity and protein content. Active fractions were pooled and buffer exchange was
undertaken using a Sephadex G-25 column. A 5 ml enzyme solution was further desalted, to
remove the arginine by dialysis in homogenisation buffer, which was done overnight and stored in
4oC.
3.1.4. Effect of divalent cations
To determine the effect of divalent cations on the activity of the Nguni and Hereford liver arginase,
the enzyme was diluted (1:2) with deionised water and 10 ml was extensively dialyzed with
deionised water (2 x 2 L) over a period of eight hours. The enzyme was further dialyzed with a 1L
of 10mM Tris-HCl buffer (pH 7.5), in the absence of manganese, before being assayed for the
effect of various divalent cation metals listed Mn2+
, Mg2+
, Ca2+
, Co2+
, Ni2+
and Cd2+
.Arginase assay
(Section 3.1.6) was followed with the only change being 2.5mM of cation listed above.
3.1.5. Effect of incubation time
To determine the effect of incubation time on the activity of the Nguni and Hereford liver arginase,
the enzyme was assayed for a maximum of 35 minutes at 5 minute intervals. Samples were assayed
as soon as each incubation time ended. Each assay was conducted as in section 3.1.6 below.
3.1.6. Arginase Assay: Estimation of enzyme activity
Arginase activity was measured according to Roman & Ruy‟s (1969) method as based on
estimation of L-Ornithine, with minor modifications. Briefly, the reaction mixture, which consisted
of 10mM sodium bicarbonate buffer (pH 9.6), 2.5mM MnCl2, 25mM L-arginine and enzyme
solution, in a total volume of 1 ml, was incubated for 30 minutes at 37oC. The reaction was
terminated by adding 10% TCA. Protein was removed from this solution by centrifugation; 1 ml of
the supernatant was mixed with 1 ml of anhydrous glacial acetic acid and ninhydrin reagent. The
mixture was kept in 90oC heating block for 30 minutes. The intense red colour developed was
diluted with 1:1 with glacial acetic acid. The reagent blank was run in a parallel manner and the

Chapter 3: Materials and Methods
46
results were compared with control assay. The optical density was read at 492 nm on
spectrophotometer (Labsystems Multiskan MS, Microtitre plate reader, Japan) against reagent
blank. The activity of arginase was expressed as follows: one unit of an enzyme activity was
defined as that amount of an enzyme which produces one μmole of L-ornithine, per milligram of
protein, per minute at 37oC.
3.1.7. Data analysis
Data (absorbance values) obtained from Labsystems Multiskan MS, Microtitre plate reader was
transposed into an MS-Excel workbook for the calculation of specific activity with a formula
adopted from (Davis & Mora, 1968 and Ndolo et al., 2010), as given below:
Where U/mg Enzyme is µmoles per milligrams of enzyme, ODsample is optical density of sample
at 340nm, ODblank is the optical density of blank, ODstd is the optical density of the urea
standard, RV is the reaction volume, SV is the sample volume, t is time of assay and mg is the
sample protein concentration.
3.2. Purification of carbamoyl phosphate synthetase
3.2.1. Materials
All solutions were prepared with nano-pure deionised water. Analytical reagent grade chemicals
were used without further purification. Reagents were obtained from the following commercial
sources: potassium phosphate, ammonium chloride, Sodium EDTA, MgCl2.6H2O, dithioerythritol
(DTT), dimethyl sulfoxide (DMSO), Sodium hydrogen carbonate, Tri-chloro-acetic acid and
ammonium sulphate from Merck chemicals (RSA); acrylamide/Bis-acrylamide from Sigma aldrich;
AMP, ADP, ATP, KCl, glycerol and HEPES (Sigma, Steinheim Germany); SDS (Boehringer,
Germany); Sephadex G-25, DEAE Sephacel, AMP agarose from Pharmacia Biotech (Uppsala,
(ODstd - ODwater)
(ODsample - Odblank) U/mg Enzyme =
UreaSTD (RV x 1000) x
(SV)(t)(mg)

Chapter 3: Materials and Methods
47
Sweden); Zhicheng Shaking incubator (Shanghai, China); Molecular weight marker (Fermentas);
Glacial acetic acid and methanol (Saarchem, RSA).
3.2.2. Purification of bovine CPS procedure
Purification was done according to Price et al., (1978) with a few modifications. All procedures
were done at 4oC unless otherwise mentioned. Approximately 15 g of defrosted bovine-liver was
suspended in 120ml of 50mM KH2PO4 at pH 7, which contained 1mM sodium EDTA, 20%
glycerol and 10mM MgCl2, together with 1mM dithioerythritol (DTT) and homogenised for 2
minutes at full speed using a commercial blender. Homogenates were centrifuged at 14,500g for 10
minutes with a Sorvall RC-50 centrifuge, after which the supernatant was retained.
The supernatant was first treated with solid (NH4)2SO4 to 80% (525g/L) saturation, then stirred for
20 minutes at 4oC , followed by centrifugation for 20 minutes at 34800g. The resulting pellet was
resuspended in 22.5ml of 2mM KH2PO4, pH 7, containing 0.5mM Sodium EDTA, 4% Glycerol
and 15% DMSO together with 1mM DTT. The solution was sonically disrupted at 50% duty cycle
for one minute and then centrifuged at 39100g for 60mins, after which and the supernatant was
carefully removed.
Sephadex G-25 Desalting
A Sephadex G-25 desalting column (2.5 x 10cm) was equilibrated with 5x column bed volumes of
buffer comprising 2mM KH2PO4, 0.5mM Sodium EDTA, 4% glycerol and 15% DMSO together
with 1mM DTT at pH 7. An amount of supernatant equal to 1 column bed volume was applied to
the column and eluted with 12ml same buffer before being collected into 2ml fractions.
DEAE Sephacel (Anion by Gravity), PD-10
The sample from Sephadex G-25 column were combined and subsequently applied to a 2.5 x 10
cm DEAE-Sephacel (Sigma) column at 4oC, which was equilibrated with 2mM KH2PO4 at pH 7
containing 0.5 mM sodium EDTA, together with 1mM dithiothreitol, 15% dimethyl-sulfoxide and
4% glycerol. This column was left stand for 30 minutes at 4oC, before being washed with 5 bed
volumes of the same buffer and eluted with a gradient from 0 M – 0.5 M KH2PO4, pH 7 in 2 mM

Chapter 3: Materials and Methods
48
KH2PO4, pH 7 containing 0.5 mM sodium EDTA, plus 1 mM dithiothreitol, 15% dimethyl-
sulfoxide and 4% glycerol buffer. A series of 2 ml fractions were subsequently collected. Fractions
containing activity were then pooled and combined for use in the next column. A separate aliquot
was also stored for further analysis.
Adenosine Monophosphate Agarose (AMP) chromatography
The combined sample from Sephadex G-25 chromatography was applied to the AMP agarose
column (2.5 x 5 cm column). The AMP agarose column was equilibrated with 2mM KH2PO4 pH 7,
containing 4% Glycerol, 15% DMSO and 1mM DTT. The column was then washed with five
column volumes of the equilibration buffer. Thereafter, 12ml of 2 mM KH2PO4, pH 7, containing
10 mM MgCl2 and 2.5 mM adenosine diphosphate (ADP) was eluted through the column into 2 ml
fractions. Fractions were then assayed for CPS activity by HPLC; those with the highest CPS
activity were pooled, desalted with Sephadex G-25 and subsequently stored at 4oC until required.
3.2.3. Specific activity of Carbamoyl phosphate synthetase: Analysis by High
Performance Liquid chromatography (HPLC).
Enzyme activity assay was adapted from the method of Price et al., 1978. The reaction mixture
contained in a final volume of 0.6 ml was made up of 20 mM of NaHCO3, 2 mM of ATP, 20 mM
of magnesium chloride, 0.3 M of NH4Cl, 100mM of KCl and 50mM of HEPES at pH 7.6. The
reaction was allowed to proceed for 10 min at 37°C, before being terminated with 3.5 μl of 1 M
trichloroacetic acid. Concentration of ADP was measured using HPLC analysis. As such, all assay
solutions were centrifuged prior to analysis for ADP. The assays for adenosine, AMP, ADP ATP
were carried out using Phenomenex 5μ LUNA C18 column with the mobile phase containing PIC-
A
(Waters Coorporation), 250 ml acetonitrile, 7g KH2PO4 per L of water. The flow rate of the
mobile phase was 1 ml/minute with UV detection.
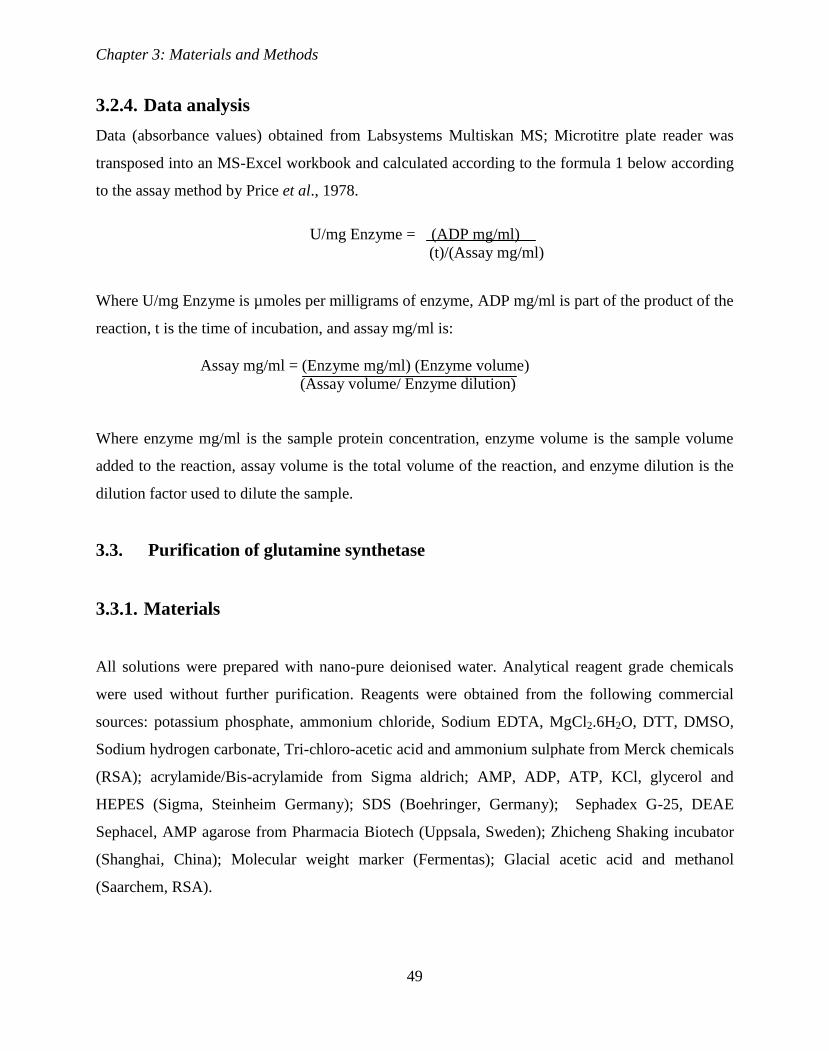
Chapter 3: Materials and Methods
49
3.2.4. Data analysis
Data (absorbance values) obtained from Labsystems Multiskan MS; Microtitre plate reader was
transposed into an MS-Excel workbook and calculated according to the formula 1 below according
to the assay method by Price et al., 1978.
Where U/mg Enzyme is µmoles per milligrams of enzyme, ADP mg/ml is part of the product of the
reaction, t is the time of incubation, and assay mg/ml is:
Where enzyme mg/ml is the sample protein concentration, enzyme volume is the sample volume
added to the reaction, assay volume is the total volume of the reaction, and enzyme dilution is the
dilution factor used to dilute the sample.
3.3. Purification of glutamine synthetase
3.3.1. Materials
All solutions were prepared with nano-pure deionised water. Analytical reagent grade chemicals
were used without further purification. Reagents were obtained from the following commercial
sources: potassium phosphate, ammonium chloride, Sodium EDTA, MgCl2.6H2O, DTT, DMSO,
Sodium hydrogen carbonate, Tri-chloro-acetic acid and ammonium sulphate from Merck chemicals
(RSA); acrylamide/Bis-acrylamide from Sigma aldrich; AMP, ADP, ATP, KCl, glycerol and
HEPES (Sigma, Steinheim Germany); SDS (Boehringer, Germany); Sephadex G-25, DEAE
Sephacel, AMP agarose from Pharmacia Biotech (Uppsala, Sweden); Zhicheng Shaking incubator
(Shanghai, China); Molecular weight marker (Fermentas); Glacial acetic acid and methanol
(Saarchem, RSA).
U/mg Enzyme = (ADP mg/ml)
(t)/(Assay mg/ml)
Assay mg/ml = (Enzyme mg/ml) (Enzyme volume)
(Assay volume/ Enzyme dilution)

Chapter 3: Materials and Methods
50
3.3.2. Purification of bovine GS procedure
Purification of GS was done according to Tholey et al., (1987), with some modifications which
incorporated an extraction method by Smith & Campbell, (1983). All procedures were performed at
4oC, unless otherwise mentioned. Approximately 30 g (wet weight) of fresh bovine liver was
homogenized in 120 ml of 10mM Hepes (pH 6.9) containing 900 mM NaCl, 2 mM MnCl2 plus 5
mM ß-Mercapto-ethanol together with 0.1 mM phenylmethylsulfonyl-fluoride (PMSF) and placed
in a blender processor for 3 minutes at maximum speed. The crude homogenate was then
centrifuged at 15,800 x g for 30 minutes in a Sorvall RC-50C refrigerated super-speed centrifuge
(Du-Point Instruments, USA), after which the debris was discarded, while supernatant was
retained. The resulting supernatant was then sonicated for 5 minutes with a 50% on/off duty cycle
for cooling. The lysate was first centrifuged at 19,800 x g for 20 minutes, after which the pellet was
discarded.
Supernatant was treated with (NH4)2SO4 to 40% saturation. The mixture was stirred for 30 minutes
and then centrifuged at 17300g for 20 minutes. The pellet was discarded and the supernatant was
dialyzed overnight against a 1L of homogenisation buffer containing 10 mM Hepes (pH6.9) plus
900 mM NaCl, 2 mM MnCl2 and 5 mM ß-Mercapto-ethanol together with 0.1 mM PMSF. The
dialysed sample was centrifuged at a high speed of 27000g for 20 minutes after which the
supernatant was decanted and kept for further experiments.
Sephadex G-25 chromatography
The dialysate was loaded on a column (2.5 x 10 cm column) of Sephadex G-25 (Sigma)
equilibrated with the homogenisation buffer. The proteins were eluted with 12 ml of
homogenisation buffer at a constant rate of 0.5ml /min. Thereafter, 2 ml fractions with high enzyme
activity were combined and continued to the next column chromatography and further experiments.
Adenosine Monophosphate Agarose (AMP) chromatography
The combined eluent from Sephadex G-25 column was applied to the AMP Agarose column (2.5 x
5 cm column) equilibrated with 10mM imidazole buffer (pH 7.15) containing 10 mM MnCl2 and

Chapter 3: Materials and Methods
51
150 mM NaCl. The sample was allowed to stand for half an hour at 4oC. The column was then
washed with five column volumes of the equilibration buffer, before elution with 12ml of 10 mM
imidazole (pH 7.15) containing 10 mM MnCl2 450 mM NaCl and 2.5mM adenosine diphosphate
(ADP). Thereafter, 2 ml fractions were collected and subsequently assayed for GS activity using a
γ-glutamyl transferase assay (GT Assay). Fractions with highest GS activity were pooled and
dialysed in homogenisation buffer overnight at 4oC.
3.3.3. Glutamyl Transferase Assay: Estimation of enzyme activity of GS
GS activity was measured according to Tholey et al., (1987) with some adoptions according to the
method of Pamiljans et al., (1962). The reaction was carried out in 50 mM imidazole buffer (pH
7.15) containing 15 mM glutamine, 0.4 mM di-sodium ADP, 30 mM arsenate, 60 mM
hydroxylamine, 0.3 mM MnCl2.4H2O, 60 mM MgCl2.6H2O. This enzyme solution was made up a
total volume of 0.6 ml for a 96 well Microtitre plate. The assay was incubated for 30 minutes at
37oC. The reaction was terminated by addition of 0.09 ml of a solution of 3.32% FeC13.6H20 and
2% trichloroacetic acid. The optical density was read at 540 nm on spectrophotometer (Labsystems
Multiskan MS, Microtitre plate reader, Japan.) against reagent blank. The enzyme activities were
expressed as µmoles of substrate transformed per minute with one unit of enzyme activity defined
as 1.0 µmol of gamma-glutamyl hydroxamate formed (absorbance at 540nm) per min at 37oC.
3.3.4. Specific activity of GS: Analysis by High Performance Liquid
chromatography (HPLC)
The forward reaction of GS was assayed at 37oC by following the quantity of ATP converted into
ADP. The reaction mixture for the HPLC assay was essentially the same as the colorimetric assay
with a few modifications (Wellner & Meister, 1966). The assay mixture contained the following
reagents, in a total volume of 0.6 ml, being 4mM sodium glutamate, 4mM NH4Cl, 1mM MgCl2,
1mM ATP, 50mM Hepes buffer, pH 7.15 and 30µl of 2 - 3 mg/ml enzyme. The assay was
incubated for 30 minutes and terminated with 0.05% 1M TCA. Analysis was performed in
triplicate. One unit of enzyme activity is defined as the amount of enzyme catalysing the hydrolysis
of 1µmol of ADP/min under these conditions. The assays for adenosine, AMP, ADP ATP were

Chapter 3: Materials and Methods
52
carried out using Phenomenex 5μ LUNA C18 column, with the mobile phase containing PIC A
(Waters Coorporation), 250 ml acetonitrile, 7 g KH2PO4 per L water. The flow rate of the mobile
phase was 1 ml/minute with UV detection. Enzyme activities were expressed as µmoles of ADP
formed per minute per mg protein at 37oC.
3.3.5. Data analysis
Data (absorbance values) obtained from Labsystems Multiskan MS; Microtitre plate reader was
transposed into an MS-Excel workbook and calculated according to the formulas below according
to the assay method by Tholey et al., 1987.
Where U/mg Enzyme is µmoles per milligrams of enzyme, ADP mg/ml is part of the product of the
reaction, t is the time of incubation, and assay mg/ml is:
Where enzyme mg/ml is the sample protein concentration, enzyme volume is the sample volume
added to the reaction, assay volume is the total volume of the reaction, and enzyme dilution is the
dilution factor used to dilute the sample.
3.4. Purification of glutamate dehydrogenase
3.4.1. Materials
All solutions were prepared with deionised water. Analytical reagent grade chemicals were used
without further purification and obtained from the following commercial sources: potassium
phosphate (KH2PO4), potassium chloride (KCl), potassium cyanide (KCN),
ethylenediaminetetraacetic acid disodium salt dihydrate (EDTA), sodium bicarbonate (NaHCO3),
U/mg Enzyme = (ADP mg/ml)
(t)/(Assay mg/ml)
Assay mg/ml = (Enzyme mg/ml) (Enzyme volume)
(Assay volume/ Enzyme dilution)
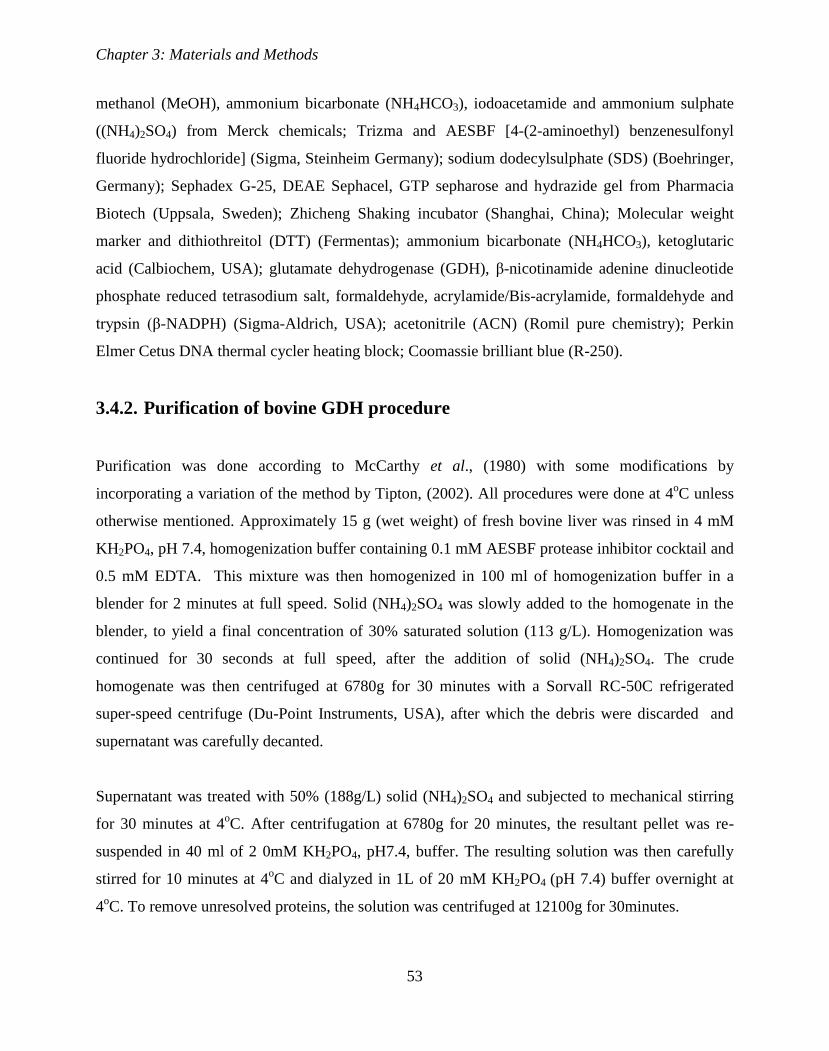
Chapter 3: Materials and Methods
53
methanol (MeOH), ammonium bicarbonate (NH4HCO3), iodoacetamide and ammonium sulphate
((NH4)2SO4) from Merck chemicals; Trizma and AESBF [4-(2-aminoethyl) benzenesulfonyl
fluoride hydrochloride] (Sigma, Steinheim Germany); sodium dodecylsulphate (SDS) (Boehringer,
Germany); Sephadex G-25, DEAE Sephacel, GTP sepharose and hydrazide gel from Pharmacia
Biotech (Uppsala, Sweden); Zhicheng Shaking incubator (Shanghai, China); Molecular weight
marker and dithiothreitol (DTT) (Fermentas); ammonium bicarbonate (NH4HCO3), ketoglutaric
acid (Calbiochem, USA); glutamate dehydrogenase (GDH), β-nicotinamide adenine dinucleotide
phosphate reduced tetrasodium salt, formaldehyde, acrylamide/Bis-acrylamide, formaldehyde and
trypsin (β-NADPH) (Sigma-Aldrich, USA); acetonitrile (ACN) (Romil pure chemistry); Perkin
Elmer Cetus DNA thermal cycler heating block; Coomassie brilliant blue (R-250).
3.4.2. Purification of bovine GDH procedure
Purification was done according to McCarthy et al., (1980) with some modifications by
incorporating a variation of the method by Tipton, (2002). All procedures were done at 4oC unless
otherwise mentioned. Approximately 15 g (wet weight) of fresh bovine liver was rinsed in 4 mM
KH2PO4, pH 7.4, homogenization buffer containing 0.1 mM AESBF protease inhibitor cocktail and
0.5 mM EDTA. This mixture was then homogenized in 100 ml of homogenization buffer in a
blender for 2 minutes at full speed. Solid (NH4)2SO4 was slowly added to the homogenate in the
blender, to yield a final concentration of 30% saturated solution (113 g/L). Homogenization was
continued for 30 seconds at full speed, after the addition of solid (NH4)2SO4. The crude
homogenate was then centrifuged at 6780g for 30 minutes with a Sorvall RC-50C refrigerated
super-speed centrifuge (Du-Point Instruments, USA), after which the debris were discarded and
supernatant was carefully decanted.
Supernatant was treated with 50% (188g/L) solid (NH4)2SO4 and subjected to mechanical stirring
for 30 minutes at 4oC. After centrifugation at 6780g for 20 minutes, the resultant pellet was re-
suspended in 40 ml of 2 0mM KH2PO4, pH7.4, buffer. The resulting solution was then carefully
stirred for 10 minutes at 4oC and dialyzed in 1L of 20 mM KH2PO4 (pH 7.4) buffer overnight at
4oC. To remove unresolved proteins, the solution was centrifuged at 12100g for 30minutes.

Chapter 3: Materials and Methods
54
Sephadex G-25 column chromatography
The 8 ml dialysate was loaded on a column (2.5 x 10 cm column) of Sephadex G-25 (Sigma)
equilibrated with 20 mM KH2PO4 (pH 7.4) buffer. The proteins were eluted with 15 ml of
equilibrating buffer at a constant rate of 0.5 ml/min. Thereafter, 2 ml fractions with high GDH
enzyme activity were combined and continued to the next column chromatography.
DEAE Sephacel, PD-10 column chromatography
Combined samples making up 5 ml of eluted material from Sephadex G-25 column, was applied to
a 2.5 x 10 cm column of DEAE-Sephacel (Sigma) at 4oC, which was equilibrated with 20 mM
KH2PO4 (pH 7.4) buffer. The column was then washed with equilibrating buffer and eluted with a
linear gradient of KH2PO4 (pH 7.4) from 0.02 to 0.15 M at a flow rate of 2 ml/min. The active
fractions containing GDH specific enzyme activity were pooled and dialysed in a litre of 20 mM
KH2PO4 (pH7.4) overnight at 4oC.
3.4.3. GTP Sepharose Column chromatography: Preparation of GTP Sepharose
GTP sepharose was prepared essentially according to Godinot et al., (1974). A 5g amount of
CNBr-activated sepharose was suspended in 100 ml of cold 1mM HCl for 10 minutes, before being
filtered with a glass filter and washed with 900 ml 1mM HCl. The gel solution was then washed
with 0.75 L of deionised water and equilibrated with 0.5 L of 0.1M NaHCO3 buffer (pH 9.0).
Thereafter, 5 ml of gel was suspended together with 1.5g of L-glutamate γ-methylester, in 20ml of
0.1M NaHCO3 buffer. The mixture was then shaken and allowed to stand at room temperature
(25oC), for 2 hours. The gel was then washed with 0.75 L of deionised water. L-glutamate γ-
methylester sepharose was added, drop wise, to hydrazin hydrate and the mixture then incubated at
70oC for about 15 minutes. The resulting gel was then cooled to room temperature and washed with
0.75 L of deionised water. Thereafter, 0.6 ml of formaldehyde was added to the gel, which was
placed on a shaker for an additional 1 hour. The gel was then washed with 0.5 L of cold 0.1M
phosphate buffer containing 5mM EDTA at pH 6.8, followed by 0.5 L of cold 2M KCl and thirdly
washed with 0.75 L of cold water, which was buffered with 0.75 L of cold 0.05M Tris-HCl
containing 1mM EDTA (pH 7.5).

Chapter 3: Materials and Methods
55
Separation of GDH with GTP-sepharose column
Dialysed sample (8ml) was applied to a GTP-sepharose column (2.5 x 10 cm) that was equilibrated
with 100mM Tris-Acetate pH 7.15 buffers containing 1mM KH2PO4 and 0.1mM EDTA. After the
column was washed with a bed volume of equilibration buffer, proteins were eluted with a KCl
gradient from 0mM – 400mM in equilibration buffer. Active fractions were pooled, combined and
dialysed in 20mM KH2PO4 (pH 7.4) overnight and then stored at 4oC for further use.
3.4.4. Glutamate dehydrogenase Assay: Estimation of enzyme activity.
Glutamate dehydrogenase was routinely spectrophotometrically assayed according to the method of
Garnier et al, (1997) using a Labsystems Multiskan MS, Microtitre plate reader, Japan, at 30oC, by
following the decrease in A340 as ß-NADH was oxidized. The assay mixture contained the
following reagents in a total volume of 0.25 ml, being 0.16 mM ß-NADH, 5 mM α-ketoglutarate,
20 mM (NH4)2SO4, 50 mM potassium phosphate buffer, at pH 8.3, plus enzyme. For the assay of
crude enzyme solutions, the mixture also contained 0.4 mM KCN to decrease NADH oxidase
activity. One unit of enzyme activity is defined as the amount of enzyme catalysing the oxidation of
1µmol of NADH/min/mg of protein under the assay conditions.
3.5. Purification of glutaminase
3.5.1. Materials
All solutions were prepared with deionised water. Analytical reagent grade chemicals were used
without further purification and obtained from the following commercial sources: Mannitol,
sucrose, HEPES, potassium phosphate (KH2PO4), sodium chloride (NaCl), glutamic acid,
Ethylenediaminetetraacetic acid disodium salt dihydrate (EDTA), Ethylene glycolaminetetraacetic
acid (EGTA), iodoacetamide and ammonium sulphate ((NH4)2SO4) from Merck chemicals; Trizma
and PMSF [Phenylmethylsulfidefluoride] (Sigma, Steinheim Germany); sodium dodecylesulphate
(SDS) (Boehringer, Germany); Sephadex G-25, DEAE Sephacel, GTP sepharose and nickel
nitrilotriacetic acid gel from Pharmacia Biotech (Uppsala, Sweden); Zhicheng Shaking incubator
(Shanghai, China); Molecular weight marker and dithiothreitol (DTT) (Fermentas); Nicotinamide

Chapter 3: Materials and Methods
56
adenine dinucleotide (NAD), Adenosine diphosphate (ADP) (Roche diagnostics, USA); glutamate
dehydrogenase (GDH), acrylamide/Bis-acrylamide, Nessler‟s reagent, trichloroacetic acid (TCA),
formaldehyde and trypsin (Sigma-Aldrich, USA); acetonitrile, hydrochloric acid (Romil pure
chemistry); Perkin Elmer Cetus DNA thermal cycler heating block; Coomassie brilliant blue (R-
250).
3.5.2. Purification of bovine glutaminase procedure
Purification was done according to the method of Patel & McGivan, (1984) with some
modifications incorporating a variation of the method by Smith & Watford, (1988). All procedures
were done at 4oC unless otherwise mentioned. Approximately 30 g (wet weight) of defrosted
bovine liver was rinsed in homogenization buffer containing 210 mM mannitol, 70 mM sucrose,
10mM HEPES, at pH 8, plus 1.5 mM EGTA and 0.1 mM PMSF, being subsequently homogenised
with the addition of a AESBF cocktail for 3 minutes at full speed, using a commercial blender.
Supernatant was slowly treated with the addition of chilled (NH4)2SO4 to yield a final concentration
of 70% saturated solution (254 g/L). The solution was subjected to mechanical stirring for half an
hour at 4oC, followed by centrifugation at 39100g with a Sorvall RC-50C refrigerated super-speed
centrifuge (Du-Point Instruments, USA). Thereafter, the pellet was resuspended in 25 ml of
homogenization buffer, before being stirred at 4oC and dialysed in 1 L of homogenization buffer
overnight at 4oC.
Sephadex G-25 chromatography
The dialysate (8ml) was loaded onto a column (2.5 x 10 cm column) of a Sephadex G-25 column
(Sigma) equilibrated with 210 mM mannitol pH 8.0, buffer containing 50 mM Tris-HCl, 70 mM
sucrose, together with 1mM-dithiothreitol. The proteins were eluted with 15ml of equilibrating
buffer at a constant rate of 0.5 ml/min. Thereafter, 2 ml fractions with high enzyme activity were
pooled and chromatographically analysed using a DEAE sephacel column, after the enzyme
activity assay was completed.

Chapter 3: Materials and Methods
57
DEAE Sephacel, PD-10
A pooled sample which was collected from a Sephadex G-25 column, was then applied to a 2.5 x
10 cm column of DEAE-Sephacel (Sigma) at 4oC equilibrated with 210 mM mannitol, pH 8.0,
buffer containing 50 mM-Tris-HCl, 70 mM sucrose, together with 1 mM DTT. The column was
then washed with equilibrating buffer and eluted with a linear gradient of 0 - 500mM NaCl in
equilibrating buffer at a flow rate of 2 ml / min. The most active fractions were pooled and dialysed
in 210 mM mannitol pH 8.0, buffer containing 50 mM Tris-HCl, 70mM-sucrose, together with
1mM dithiothreitol overnight at 4oC.
Ultrafiltration
Vivaspin 30000MW 50ml tube was used. 5ml of combined samples from DEAE Sephacel column
chromatography were added to the 50ml Vivaspin 30000MW tube and spun at 5000 x g for 30
minutes in a Epperndorf centrifuge 5810R (Merck) refrigerated bench top centrifuge.
3.5.3. Glutaminase Assays: Estimation of enzyme activity.
3.5.3.1. Confirmation calorimetric glutaminase enzyme activity assay
All reagents were added at room temperature. Glutaminase was routinely assayed by the method
described by Heini et al., (1987) calorimetrically (Labsystems Multiskan MS, Microtitre plate
reader, Japan), except that the volume and the concentrations of some reagents were modified for
quantification of ammonia with Nessler‟s reagent. 500µl of 260mM K2HPO4, 63Mm Tris-HCl -
pH8.6 with 2mM EDTA was added to 500µl distilled water and equilibrated to 37oC. Thereafter,
250µl of enzyme extract was added to other reactions, excluding blank, to which distilled water
was added. The solution was mixed by inversion and incubated at 37oC for 30minutes, after which
the reaction was terminated with 250µl 1.5M TCA. Finally, 10% of assay mixture was aliquot into
250µl distilled water, plus 200µl Nessler‟s reagent, to quantify ammonia produced by the reaction.
The solution was transferred in triplicates into 96-well plate and reading was performed at 540nm
using a micro-titre plate reader.

Chapter 3: Materials and Methods
58
3.5.3.2. Kinetic spectrophotometric glutaminase enzyme activity assay
Glutaminase activity was measured by assaying the production of glutamate from glutamine in a
kinetic assay system (Dura et al., 2002). The method included some modifications according to
McGivan & Bradford (1983). Glutaminase was routinely assayed spectrophotometrically with the
aid of a Labsystems Multiskan MS, Microtitre plate reader, Japan. In order to extend the range of
linearity of the oxidation assay, but excluding changes in volume of the reaction mixture,
concentration of some of the substrates were increased up to ten fold, for some of the reagents. The
initial incubation mixture for the phosphate-dependent glutaminase contained 2.6 mM potassium
phosphate, varied glutamine concentrations, plus 2.6 mM Tris-Cl at pH 8. The corresponding
incubation mixture for the phosphate-independent glutaminase contained 3.2 mM boric acid with
enzyme, while the main reaction mixture contained 462 mM Tris-Cl, 266 mM NAD, 2.6 mM ADP,
1.9mM GDH and 660 mM Glutamic acid, for the control reaction. The first mixture was mixed by
inversion and equilibrated to 37oC, before being transferred into a second mixture and mixed by
inversion prior to incubation for 30 minutes at 37oC. The reaction was then stopped with 20µl HCl
and reaction placed on ice for 5 minutes. Out of the combination of first and second mixtures, a
10µl aliquot became third mixture, upon the addition of 12µl of glutamic acid, as a positive
control. A negative control (blank) was made to include 12µl of H2O, instead of glutamine or
glutamic acid.
After stability of the ensuing reaction was achieved, absorbance versus a blank were prepared by
adding water immediately after the enzyme solution, was analysed at 340 nm by recording the first
absorbance value. Increase in the absorbance values were monitored over a 30minute period, when
the last value was recorded.
3.5.4. Data analysis
Data (absorbance values) obtained from Labsystems Multiskan MS; Microtitre plate reader was
transposed into an MS-Excel workbook and calculated according to Curthoys & Weiss (1974) as in
the formula below.
U/mg Enzyme = (ΔA340T - ΔA340B) (0.22) (0.6)
(6.22) (mg Enzyme/RM) (0.012) (30)

Chapter 3: Materials and Methods
59
Where U/mg Enzyme is µmoles per milligrams of enzyme, ΔA340 is change of absorbance at
340nm, 0.22 is volume of assay in millilitres of step 1, 0.6 is total volume of assay in millilitres of
step 2, 6.22 is millimolar coefficient, RM is reaction mixture volume, 0.012 is volume of step 1
assay used in step 2, 30 is time of assay in minutes as per units definition.
3.6. Protein concentration assay
The protein content of all samples was determined by the Quint-iT™ protein assay in the Quanti™
fluorometer (Invitrogen detection technologies, USA) method (Appendix 2, Page 170).
3.7. SDS-PAGE
The purity of the various fractions obtained during protein purification was assessed by Sodium
Dodecyl-Sulphate Polyacrylamide Gel Electrophoresis (SDS-PAGE). The SDS-PAGE method
used was adapted from Laemmli (1970). A 10% separating gel and 4% stacking gel (Appendix 1,
Page 168) were also prepared.
3.8. Bio-analysis of extracted proteins with Liquid Chromatography Mass
Spectrometry (LC-MS/MS)
3.8.1. Introduction to QSTAR® Elite Liquid Chromatography Mass Spectrometry (LC-
MS/MS)
QSTAR®
Elite LC/MS/MS system is a quadropole time-of-flight (QqTOF) designed for proteomics
and metabolomics research to discover small molecule biomarkers from complex biological
samples. Liquid chromatography mass spectrometry-based approaches for targeted protein
identification and quantification are based on the concept of isotope dilution mass spectrometry
techniques commonly used for the detection of small molecules (Bowers et al., 1993). High-
resolution mass spectrometry provides an approach which can precisely detect wide variety
peptides via high mass accuracy and peptide sequencing. This approach provides high selectivity
and specificity, while technically avoiding most of the problems associated with optimization of

Chapter 3: Materials and Methods
60
multiple assays in a single measurement. This mass spectrometry based technique has a unique
capability to perform candidate-based proteome browsing (Aebersold, 2003; Kuster et al., 2005)
and measure absolute levels of post-translational modifications (Kuster et al., 2005). The in-gel
digestion protocol presented in Appendix 3 (Page 173), was originally introduced in 1996
(Shevchenko et al., 1996), and has become a norm with most workers over the past years. The
protocol can be optimized to balance the time of digestion, plus the speed of the entire protein
identification routine, with the yield of tryptic peptides. The recipe is flexible and can easily be
adapted to meet the specific requirements of any particular proteomics experiment (Havlis et al.,
2003). The method applies with negligible or minor adjustments to gels stained with Coomassie
brilliant blue R250 (Shevchenko et al., 1996). The in-gel digestion procedure is compatible with
downstream MALDI-MS characterization of digests of isolated protein bands or spots.
A variety of mass spectrometric platforms have been used for targeted quantitative proteomics
analysis, including the matrix assisted laser desorption/ionization time-of-flight tandem mass
spectrometer (MALDI TOF) (Pan et al., 2005), and the electrospray ionization (ESI) based QTOF
mass spectrometer (Rivers et al., 2007). The discriminating power as well as maturity of the
technology provided great convenience in adapting the methodology for protein detection.
Protein bands cut out of SDS-PAGE were subjected to tryptic digestion and analysed by LC-
MS/MS according to the methodology indicated in Appendix 3 (Page 173).
3.9. Database search
Protein identification was performed using the ParaghonTM
algorithm thorough search in Protein
Pilot™ software. An identification confidence exceeding 95 % was selected during the search.
Protein Pilot™ software for protein identification supports QSTAR®
Elite reagent workflows. It
incorporates the Paragon™ search algorithm in a single package that increases the speed of
database searches along with advanced data analysis and visualization.
Data generated by QSTAR®
Elite ESI mass spectrophotometer was analysed by Protein pilot™
software and results of peptides obtained were blasted in the http://blast.ncbi.nlm.nih.gov/ website
of proteins database.

Chapter 3: Materials and Methods
61
3.10. Kinetic constants
All enzymes were assayed at a range of substrate concentrations to determine the kinetic constants
using using non-linear regression protocols as defined in the Graph-Pad™ prism 5.02 software
protocols. The calculated enzyme specific activities with their standard deviations were transferred
as values calculated elsewhere into Graph-Pad™ prism 5.02 software for generation of graphs, Vmax
and Km values. When reciprocal plots of velocity against substrate concentration were either linear
or non-linear, the data was fitted to a formula below.
Where v = initial velocity, Vmax = maximal velocity, Km = apparent Michaelis constant,
[S] = substrate (Tveit et al., 1970).
Vmax [S]
Km + [S] v =

Chapter 4: Integrated Results
62
CHAPTER 4: INTEGRATED RESULTS
The data obtained for the purification of arginase, GS, GDH, CPS and glutaminase are outlined
below. Also included is the level of purification obtained for each enzyme at each technique used.
Steady-state enzyme kinetics was used for each enzyme to define the Vmax and Km for each enzyme
substrate used. The GraphPad prism suite of software was used to calculate these kinetic constants
using nonlinear regression analysis.
4.1. Purification of bovine arginase
The purification of arginase from Nguni liver samples and Hereford liver samples was carried out
as described earlier. The results of the enzyme activities obtained at each stage of the purification
are summarized in Table 4.1. The fractional precipitation of arginase with chilled ammonium
sulphate at 4 °C, followed with heat treatment, resulted in good yields of both Nguni and Hereford
arginase. For Nguni liver, the fractional precipitation of arginase with chilled ammonium sulphate
gave a specific activity of 318.29 μmol.min-1
.mg protein, while for Hereford liver; a specific
activity of 510.46 μmol.min-1
.mg of protein was achieved.
Table 4.1. Typical purification of Nguni liver and Hereford liver Arginase (N = Nguni, H =
Hereford) These assays were all run in substrate excess.
Purification
step
Volume
(ml)
Total
protein(mg)
Total activity (U
x103)
Specific activity
(µmol/min/mg)
N H N H N H
Homogenate 110 173 196 218.94 296.34 16.3 22.05
Ammonium
sulphate
50 180 200 318.29 510.46 23.7 37.98
Sephadex G-25 12 205 233 481.05 637.06 35.8 47.4
DEAE
Cellulose
14 196 149 221.8 297.07 17 22.1
Arginine
affinity column
6 185 107 207.49 84.39 15.4 6.28

Chapter 4: Integrated Results
63
4.1.1. Kinetics
The effect of substrate concentration on the arginase activity was determined using arginine and
manganese. Three different GraphPad Prism calculations were applied to the kinetics of Nguni
liver arginase versus manganese and also versus arginine (Table 4.2), and Hereford liver arginase
versus manganese as well as versus arginine (Table 4.3).
Table 4.2. Comparison of Vmax and Km of Nguni liver arginase with respect to manganese (A) and
also with respect to arginine (B) is calculated by GraphPad Prism.
Non-Linear fit NLARG1 NLARG2 NLARG3 NLARG4 Average STDEV
(A) Manganese
Michaelis-
Menten
Best-fit values
Vmax 9.049 5.201 2.999 3.743 5.248 2.333069
Km 19.26 8.698 4.146 6.125 9.55725 5.829743
(B) Arginine
Michaelis-
Menten
Best-fit values
Vmax 19.22 12.82 19.18 13 16.055 3.145676
Km 51.3 21.1 45.45 18.91 34.19 14.35589

Chapter 4: Integrated Results
64
Table 4.3. Comparison of Vmax and Km of Hereford liver arginase with respect to manganese (A)
and arginine (B) is calculated by GraphPad Prism.
Non-Linear fit HLARG1 HLARG2 HLARG3 HLARG4 Average STDEV
(A) Manganese
Michaelis-
Menten
Best-fit
values
Vmax 7.766 6.259 4.903 7.869 6.69925 1.2172
Km 5.659 4.118 2.057 4.27 4.026 1.2856
(B) Arginine
Michaelis-
Menten
Best-fit
values
Vmax 20.12 8.996 9.886 22.67 15.418 6.0527
Km 1.057 1.657 1.832 0.7143 1.315075 0.4504
4.1.2. Enzyme Incubation time
The effect of incubation time on the activities of Nguni liver arginase and Hereford liver arginase
was studied over a 30 minute time period to determine the linearity of the enzyme activity (Figure
4.1). On the basis of this all enzyme assays were run as single point assays for 20 minutes.
4.1.3. Effect of substrate concentrations
The effect of the substrate concentrations on the specific activities of arginase obtained from the
Nguni and Hereford breeds was determined. All enzymes were purified from four different livers,
from each breed, to allow a comparison to be made on the statistical significance of the purification
protocol. This was essential if the enzyme kinetics for each breed was to be compared.
Within each breed, the distribution of the specific enzyme activity data showed very little variation.
However, the overall enzyme activity for the Hereford breed was almost double that of the Nguni
breed (Table 4.1) across the purification process other than the final affinity stage.

Chapter 4: Integrated Results
65
The effect of the concentration of manganese on the activity of arginase is shown in Figure 4.2 -
4.3 for both Nguni and Hereford livers. The steady kinetics for manganese is hyperbolic and yields
a Michaelis-Menten Km of between 6.1 – 19.3mM (Average = 9.557mM) for the Nguni livers and 2
– 5.7mM for the Hereford livers as analysed by GraphPad Prism.
0 10 20 30 400
20
40
60
NLARGHLARG
Incubation time (minutes)
Sp
ecif
ic A
ctiv
ity
(µ
mo
l/m
in/m
g)
Figure 4.1. Indication of the comparison of the effect of the incubation times on the specific
activity of Nguni (NLARG) and Hereford (HLARG) liver arginase (0.2 – 0.3 mg) at 37oC. These
assays were performed in excess substrate.

Chapter 4: Integrated Results
66
0 2 4 60.0
0.5
1.0
1.5
2.0
2.5
NLARG1NLARG2NLARG3NLARG4
Nguni
Mn (mM)
Sp
ecif
ic A
ctiv
ity
(µ
mo
l/m
in/m
g)
Figure 4.2. Effect of the manganese concentration on the specific activity of Nguni arginase in
10mM Sodium bicarbonate, pH 9.6 and 25 mM L-Arginine at 37oC.

Chapter 4: Integrated Results
67
0 2 4 60
1
2
3
4
5
HLARG2HLARG1
HLARG3HLARG4
Hereford
Mn (mM)
Sp
ecif
ic A
ctiv
ity
(µ
mo
l/m
in/m
g)
Figure 4.3. Effect of the manganese concentration on the specific activity of Hereford arginase in
10mM Sodium bicarbonate, pH 9.6 and 25 mM L-Arginine at 37oC.

Chapter 4: Integrated Results
68
0 10 20 30 400
2
4
6
8
10
NLARG1NLARG2NLARG3NLARG4
Nguni
L-Arginine (mM)
Sp
ecif
ic A
ctiv
ity
(µ
mo
l/m
in/m
g)
Figure 4.4. Effect of the arginine concentration on the specific activity of Nguni arginase in10mM
Sodium bicarbonate, pH 9.6 and 2.5 mM MnC12 at 37oC.
The effect of the concentration of arginine on the activity of arginase is shown in Figure 4.5, that
of manganese concentration on the specific activity of Nguni and Hereford liver arginase in Figure
4.6 and the effect of the arginine concentration on the specific activity of Nguni and Hereford liver
arginase in Figure 4.7.

Chapter 4: Integrated Results
69
0 10 20 30 400
2
4
6
8
HLARG1HLARG2HLARG3HLARG4
Hereford
L-Arginine (mM)
Sp
ecif
ic A
ctiv
ity
(µ
mo
l/m
in/m
g)
Figure 4.5. Effect of the arginine concentration on the specific activity of Nguni arginase in 10mM
Sodium bicarbonate, pH 9.6 and 2.5 mM MnCl2 at 37oC.
The steady kinetics for arginine is hyperbolic and yields a Michaelis-Menten Km of between 18.9 –
51.3mM (Average = 34.19mM) for the Nguni livers and 11.8 – 70.2mM (Average = 1.315mM) for
the Hereford livers analysed by GraphPad Prism.
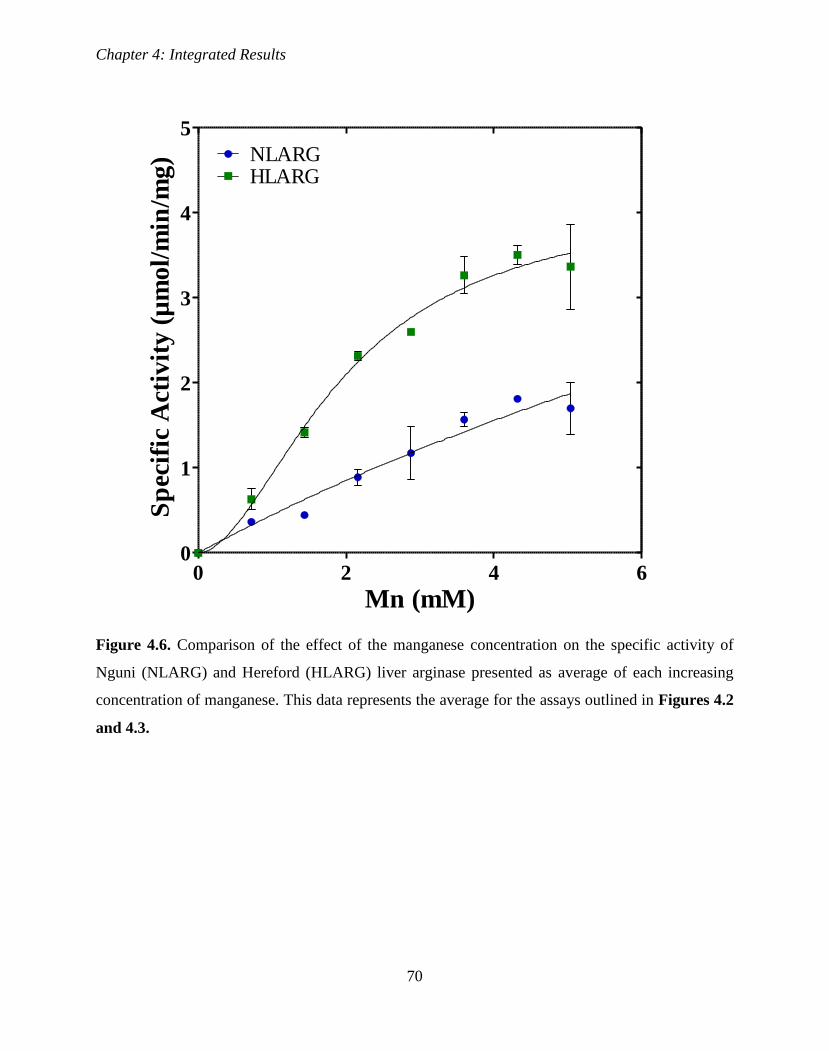
Chapter 4: Integrated Results
70
0 2 4 60
1
2
3
4
5
NLARGHLARG
Mn (mM)
Sp
ecif
ic A
ctiv
ity
(µ
mo
l/m
in/m
g)
Figure 4.6. Comparison of the effect of the manganese concentration on the specific activity of
Nguni (NLARG) and Hereford (HLARG) liver arginase presented as average of each increasing
concentration of manganese. This data represents the average for the assays outlined in Figures 4.2
and 4.3.

Chapter 4: Integrated Results
71
0 10 20 30 400
2
4
6
8
10
NLARGHLARG
L-Arginine (mM)
Sp
ecif
ic A
ctiv
ity
(µ
mo
l/m
in/m
g)
Figure 4.7. Comparison of the effect of the arginine concentration on the specific activity of Nguni
(NLARG) and Hereford (HLARG) liver arginase, presented as evarage of each increasing arginine
concentration. This data represents the average for the assays outlined in Figures 4.4 and 4.5.

Chapter 4: Integrated Results
72
4.1.4. Effect of divalent cations
The results as shown in Figure 4.8 were completely inconclusive after several repetitions.
Figure 4.8. Effect of the selected divalent cations at 2.5mM on the specific activity of Hereford and
Nguni arginase in 10mM Sodium bicarbonate, pH 9.6 at 37oC. These assays were run in excess
substrate.

Chapter 4: Integrated Results
73
4.1.5. Estimation of arginase molecular weight on SDS-PAGE
The molecular weight on SDS-PAGE was marked at 38 kDa for both Nguni and Hereford liver
arginase. There was a 52 kDa visible protein band which was previously reported for buffalo liver
arginase by Dabir et al., 2005 (Figure 4.9). The molecular weight obtained for arginase with both
bovine breeds, is higher than the 35.009 reported for cytoplasmic type 1 bovine arginase, but
similar to 38.616 reported for mitochondrial type 2 bovine arginase. Reports obtained for the
bovine hepatic arginases agree with the reported molecular weights of arginases from buffalo liver
(Dabir et al., 2005). Lane 1 of the Nguni SDS-PAGE indicated approximately 80% purity. All
assays gave very similar responses when compared.
KDa M 1 2 3 4 1 2 3 4
118
66.2 52 52
45 38 38
35
25
18.4
14.4
A B
Figure 4.9. SDS-PAGE (10%) analysis of partially purified liver arginase M: Molecular weight
standard, size in kilo-dalton is shown on the left. A: Partially purified Nguni liver arginase
indicated as 1: NLARG1 2: NLARG2 3: NLARG3 4: NLARG4 and B: Partially purified Hereford
liver arginase indicated as 1: HLARG1 2: HLARG2 3: HLARG3 4: HLARG4.

Chapter 4: Integrated Results
74
4.2. Purification of carbamoyl phosphate synthetase
The results from the purification of carbamoyl phosphate synthetase from both Nguni and Hereford
liver samples are summarized in Table 4.4. Both ammonium sulphate and low molecular weight
proteins were removed from the enzyme fraction solutions via passage through a Sephadex-G25 gel
column, yielding 1485 µmoles/mg/ml and 1646 µmoles/mg/ml of activity for the Nguni and
Hereford livers respectively. Carbamoyl phosphate synthetase was adsorbed on a DEAE-Sephacel
column and eluted with a KH2PO4, (pH7) gradient, ranging in concentration from 2mM – 500mM
KH2PO4 (pH7), yielding 767 µmoles/mg/ml and 957 µmoles/mg/ml of activity for the Nguni and
Hereford livers respectively. The enzyme fractions were then specifically bound on an AMP
Agarose gel column, yielding 490µmoles/mg/ml and 887 µmoles/mg/ml of activity for the Nguni
and Hereford livers respectively.
Table 4.4. Typical purification of carbamoyl phosphate synthetase from Nguni (N) and Hereford
livers (H). The assays were run in excess substrate.
Purification
step
Volume
(ml)
Total
protein(mg)
Total activity
(µmoles/min/mgx103)
Specific activity
(µmoles/min/mg)
N H N H N H
Homogenate 110 2060 895 1490 1904 3.3 2.05
Ammonium
sulphate
50 1920 772 1313 1512 3.7 2.3
Sephadex G-
25
12 1930 705 1485 1646 5.8 4.59
DEAE
Sephacel
14 2490 695 767 957 2.2 2.1
AMP Agarose 6 1860 665 490 887 0.49 0.887
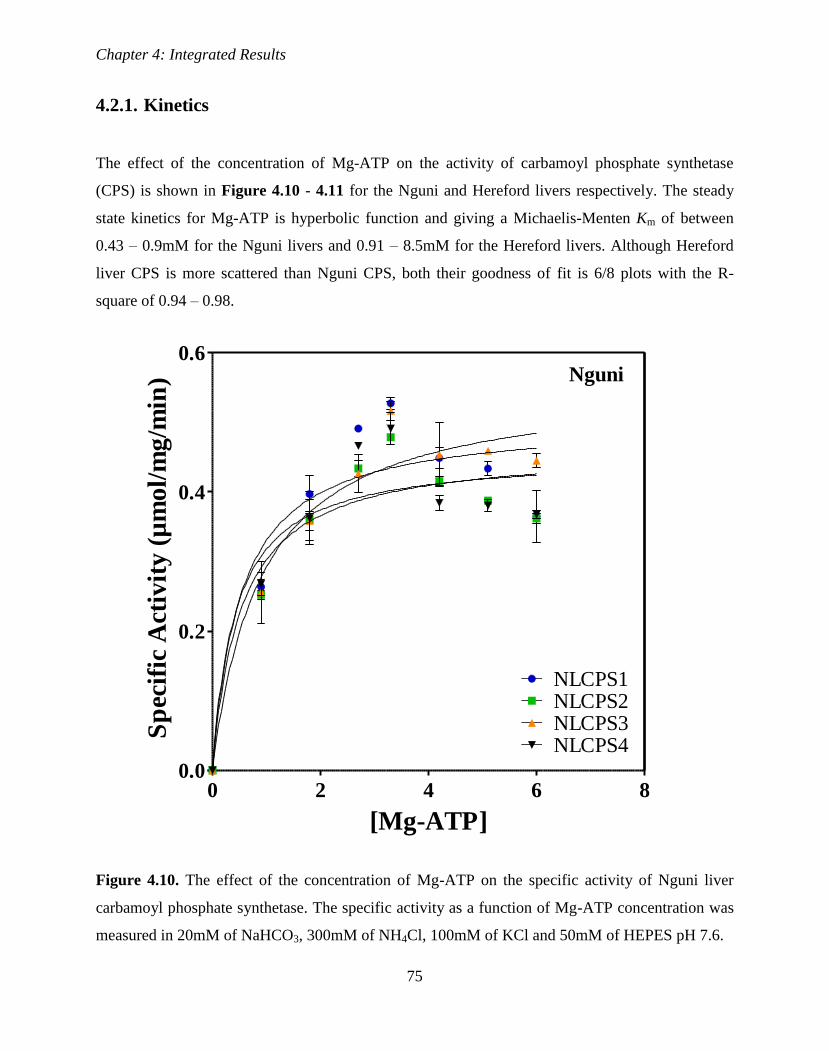
Chapter 4: Integrated Results
75
4.2.1. Kinetics
The effect of the concentration of Mg-ATP on the activity of carbamoyl phosphate synthetase
(CPS) is shown in Figure 4.10 - 4.11 for the Nguni and Hereford livers respectively. The steady
state kinetics for Mg-ATP is hyperbolic function and giving a Michaelis-Menten Km of between
0.43 – 0.9mM for the Nguni livers and 0.91 – 8.5mM for the Hereford livers. Although Hereford
liver CPS is more scattered than Nguni CPS, both their goodness of fit is 6/8 plots with the R-
square of 0.94 – 0.98.
0 2 4 6 80.0
0.2
0.4
0.6
NLCPS1NLCPS2NLCPS3NLCPS4
Nguni
[Mg-ATP]
Sp
ecif
ic A
ctiv
ity
(µ
mo
l/m
g/m
in)
Figure 4.10. The effect of the concentration of Mg-ATP on the specific activity of Nguni liver
carbamoyl phosphate synthetase. The specific activity as a function of Mg-ATP concentration was
measured in 20mM of NaHCO3, 300mM of NH4Cl, 100mM of KCl and 50mM of HEPES pH 7.6.

Chapter 4: Integrated Results
76
0 2 4 6 80.0
0.5
1.0
1.5
HLCPS1HLCPS2HLCPS3HLCPS4
Hereford
[Mg-ATP]
Sp
ecif
ic A
ctiv
ity
(µ
mo
l/m
g/m
in)
Figure 4.11. The effect of the concentration of Mg-ATP on the specific activity of Hereford liver
carbamoyl phosphate synthetase. The specific activity as a function of Mg-ATP concentration was
measured in 20mM of NaHCO3, 300mM of NH4Cl, 100mM of KCl and 50mM of HEPES pH 7.6.
The effect of the concentration of ammonium chloride on the activity of CPS is shown in Figure
4.12 and 4.13 for both Nguni and Hereford livers respectively. The steady kinetics for Mg-ATP is
hyperbolic and yields a Michaelis-Menten Km of between 30.2 – 38.5mM for the Nguni livers and
15.7 – 27.5mM for the Hereford livers. The apparent Michaelis constants reported for mammalian
liver carbamoyl phosphate synthetases are in the range of 10mM (Kerson & Appel, 1968).

Chapter 4: Integrated Results
77
0 20 40 600
2
4
6
NLCPS1NLCPS2NLCPS3NLCPS4
Nguni
[NH4Cl]
Sp
ecif
ic A
ctiv
ity
(µ
mo
l/m
g/m
in)
Figure 4.12. The effect of the concentration of NH4Cl on the specific activity of Nguni liver
carbamoyl phosphate synthetase. Specific activity as a function of ammonium chloride
concentration was measured in 20mM of NaHCO3, 2mM of ATP, 20mM of MgCl2, 100mM of KCl
and 50mM of HEPES pH 7.6 at 37oC.

Chapter 4: Integrated Results
78
0 20 40 600.0
0.5
1.0
1.5
2.0
HLCPS1HLCPS2HLCPS3HLCPS4
Hereford
[NH4Cl]
Sp
ecif
ic A
ctiv
ity
(µ
mo
l/m
g/m
in)
Figure 4.13. The effect of the concentration of NH4Cl on the specific activity of Hereford liver
carbamoyl phosphate synthetase. Specific activity as a function of ammonium chloride
concentration was measured in 20mM of NaHCO3, 2mM of ATP, 20mM of Magnesium Chloride,
100mM of KCl and 50mM of HEPES pH 7.6 at 37oC.
The effect of the concentration of Mg-ATP on the activity of CPS is shown in Figure 4.14 and 4.15
for both Nguni and Hereford livers respectively.

Chapter 4: Integrated Results
79
0 2 4 6 80.0
0.2
0.4
0.6
0.8
NLCPSHLCPS
Nguni
[Mg-ATP]
Sp
ecif
ic A
ctiv
ity
(µ
mo
l/m
g/m
in)
Figure 4.14. Comparison of the effect of the concentration of Mg-ATP on the specific activity of
Nguni (NLCPS) and Hereford (HLCPS) liver carbamoyl phosphate synthetase presented as the
average for each increasing Mg-ATP concentration. These assays were run in excess substrate.
.

Chapter 4: Integrated Results
80
0 20 40 600
2
4
6
NLCPSHLCPS
Nguni
[NH4Cl]
Sp
ecif
ic A
ctiv
ity
(µ
mo
l/m
g/m
in)
Figure 4.15. Comparison of the effect of the concentration of NH4Cl on the specific activity of
Nguni (NLCPS) and Hereford (HLCPS) liver carbamoyl phosphate synthetase presented as average
of each increasing NH4Cl concentration. These assays were also run in excess substrate.

Chapter 4: Integrated Results
81
The effect of Mg-ATP concentration on the activity of Nguni liver and Hereford liver CPS activity
is shown in Tables 4.5 and 4.6 respectively.
Table 4.5. Comparison of Vmax and Km of Nguni liver CPS with respect to Mg-ATP (A) and also
with respect to ammonium (B) is calculated by GraphPad Prism.
Non-Linear fit NLCPS1 NLCPS2 NLCPS3 NLCPS4 Average STDEV
(A) ATP/mg
Michaelis-
Menten
Best-fit
values
Vmax 0.5031 0.4636 0.5575 0.4541 0.494575 0.040712
Km 0.5242 0.5332 0.909 0.4299 0.599075 0.183453
(B) Ammonium
Michaelis-
Menten
Best-fit
values
Vmax 9.394 8.02 8.177 8.566 8.53925 0.532015
Km 36.6 31.94 27.82 36.26 33.155 3.586346

Chapter 4: Integrated Results
82
Table 4.6. Comparison Vmax and Km of Hereford liver CPS with respect to Mg-ATP and
ammonium is calculated by GraphPad Prism.
Non-Linear fit HLCPS1 HLCPS2 HLCPS3 HLCPS4 Average STDEV
ATP/mg
Michaelis-
Menten
Best-fit
values
Vmax 0.7448 1.547 2.333 0.8912 1.379 0.628192
Km 0.9141 4.579 8.58 2.015 4.0221 2.948419
Ammonium
Michaelis-
Menten
Best-fit
values
Vmax 2.676 2.218 2.557 2.186 2.4091 0.21178
Km 22.74 19.21 27.54 15.68 21.2925 4.386441
The effect of Mg-ATP concentration on the activity of Nguni liver and Hereford liver carbamoyl
phosphate synthetase was also determined by a way of linear regression. The apparent Km values of
Mg-ATP were demonstrated while the concentration of ammonium chloride and sodium
bicarbonate were kept constant. At a higher concentration of Mg-ATP; double reciprocal plot
continues linear which agrees to other studies of liver carbamoyl phosphate synthetase in which
double reciprocal also continues linear (Elliot & Tipton, 1973).
4.2.2. Estimation of CPS molecular weight on SDS-PAGE
The molecular weight of CPS obtained for both bovine breeds was found to be 164,740Da, as
shown in Figure 4.16. This value agrees with the size for mitochondrial type bovine carbamoyl
phosphate synthetase reported in UniProtKB protein database (http://www.uniprot.org/uniprot),
as marked by protein molecular weight page ruler (Fermentas).

Chapter 4: Integrated Results
83
KDa
M 1 2 3 4 1 2 3 4
A B
Figure 4.16. SDS-PAGE (10%) analysis of partially purified liver carbamyl phosphate synthetase
M: Molecular weight standard, size in kilo-dalton is shown on the left. A: Partially purified Nguni
liver CPS indicated as 1: NLCPS1 2: NLCPS2 3: NLCPS3 4: NLCPS4 and B: Partially purified
Hereford liver CPS indicated as 1: HLCPS1 2: HLCPS2 3: HLCPS3 4: HLCPS4.
The 150KDa - 170KDa seen in different strength in SDS-PAGE (Figure 4.16 A) were eluted from
DEAE Sephacel of the Nguni liver carbamoyl phosphate synthetase. The Hereford liver carbamoyl
phosphate synthetase which is also seen as different bands (Figure 4.16 B) was also eluted from
the DEAE Sephacel. The presence of CPS in the identified bands was further confirmed using
LC/MS/MS (Section 4.2.4).
4.2.3. Trypsin digest and LC/MS/MS for CPS band Identification
Peptides were identified by QSTAR Elite ESI as gel-based ID marked by protein molecular weight
page ruler in the SDS-PAGE (Figure 4.16, Page 85). The data obtained was analysed by
ProteinPilot™ Software 3.0 (Paragon Algorithm 3.0.0.0, 113442) and reported below. Only
samples detected at a protein threshold of 1.30 (95%) indicating 2.00 Protein score were reported.
150
100
70
50
40
164.7 164.7

Chapter 4: Integrated Results
84
Only proteins with an unused Protein score greater than this value are shown in the Detected
Proteins table. Selected peptides of interest were recorded below as examples.
4.2.3.1. Selected peptides of interest for the identification of Nguni liver CPS
i. AVNTLNEALEFAK
ii. CLGLTEAQTR
iii. GQNQPVLNITNR
iv. IALGIPLPEIK
Figure 4.17. QSTAR Elite ESI Generated peptide profile for CPS. Peptides of interest: Precursor
MS regions analysed by ProteinPilot™ Software 3.0 (Paragon Algorithm 3.0.0.0, 113442)

Chapter 4: Integrated Results
85
In Figure 4.17 (Page 84), a QSTAR Elite ESI Generated peptide profile for Carbamoyl-
phosphate synthase (ammonia) (EC 6.3.4.16) I precursor– rat is displayed
Blast information for Nguni liver CPS is given in Table 4.7
Table 4.7. Blast information for Nguni liver CPS generated from NCBI database of proteins.
Accession Description Maximum
Score
Total
Score
Query
Coverage
Maximum
Identity
NP_001179187.1 Carbamoyl-
phosphate synthase
[ammonia],
mitochondrial
[Bos taurus]
34.7 99.3 80% 100%
http://blast.ncbi.nlm.nih.gov/Blast.cgi?CMD=Web&PAGE_TYPE=BlastHome
4.2.3.2. Selected peptides for the identification of Hereford liver CPS
i. AVNTLNEALEFAK
ii. CLGLTEAQTR
iii. GQNQPVLNITNR
iv. EVEMDAVGK
Figure 4.18. A QSTAR Elite ESI Generated: Carbamoyl-phosphate synthetase I. - Homo
sapiens (Human) is displayed. Peptides of interest: Precursor MS regions analysed by
ProteinPilot™ Software 3.0 (Paragon Algorithm 3.0.0.0, 113442).

Chapter 4: Integrated Results
86
In Figure 4.18 (Page 85), a QSTAR Elite ESI Generated: Carbamoyl-phosphate synthetase I.
- Homo sapiens (Human) is displayed.
Blast information for Hereford liver CPS is given in Table 4.8
Table 4.8. Blast information for Hereford liver CPS generated from NCBI database of
proteins.
Accession Description Maximum
Score
Total
Score
Query
Coverage
Maximum
Identity
NP_001179187.1 Carbamoyl-
phosphate
synthase
[ammonia],
mitochondrial
[Bos taurus]
32.3 63.5 82% 100%
http://blast.ncbi.nlm.nih.gov/Blast.cgi?CMD=Web&PAGE_TYPE=BlastHome
4.3. Purification of glutamine synthetase
The purification of GS from Nguni liver samples and Hereford liver samples was carried out
as described. The results obtained in the purification of GS from Nguni liver samples and
Hereford liver samples are summarized in Table 4.10. The fractional precipitation of GS with
chilled ammonium sulphate at 4 °C, resulted in equivalent yields of both Nguni and Hereford
GS.

Chapter 4: Integrated Results
87
Table 4.9. Typicalpurification of Nguni liver (N) and Hereford liver (H) GS, indication from
both liver samples. (Units = μmoles ferric hydroximate complex/minute/mg protein). These
assays were performed in excess substrate.
4.3.1. Kinetics
The period of incubation used across the kinetic study of GS remained 90 minutes for HPLC
analysis as this was found to be optimal for the linearity of the assay (Price et al., 1978).
Table 4.10. Comparison of Vmax and Km of Nguni and Hereford liver GS with respect to Mg-
ATP is calculated by GraphPad Prism.
Non-linear
fit NLGS1 NLGS2 NLGS3 NLGS4 Average STDEV
Mg-ATP
Michaelis-
Menten
Best-fit values
Vmax 0.08269 0.1082 0.0912 0.07048 0.088143 0.013724
Km 1.953 1.204 1.048 5.635 2.46 1.864736
Non-linear
fit HLGS1 HLGS2 HLGS3 HLGS4 Average STDEV
Mg-ATP
Michaelis-
Menten
Best-fit values
Vmax 3.42 3.57 2.19 2.93 3.0275 0.538348
Km 3.2 1.2 5.7 6.3 4.1 2.038382
Purification step Volume
(ml)
Total
protein(mg)
Specific activity
(µmoles/min/mg)
N H N H
Homogenate 140 246 218 1.31 1.50
Ammonium
sulphate
50 141 106 1.21 1.13
Sephadex G-25 12 245 193 1.28 1.13
AMP Agarose 6 168 131 1.11 1.06

Chapter 4: Integrated Results
88
The effect of the concentration of Mg-ATP on the activity of GS is shown in Figure 4.19 and
4.20 for both Nguni and Hereford livers. The steady kinetics for Mg-ATP is hyperbolic and
yields a Michaelis-Menten Km of between 30.2 – 38.5mM (Average = 2.46mM) for the Nguni
livers and 15.7 – 27.5mM (Average = 4.1mM) for the Hereford livers.
0 2 4 60.00
0.05
0.10
0.15
NLGS1NLGS2NLGS3NLGS4
Nguni
[Mg-ATP]
Sp
ecif
ic A
ctiv
ity
(µ
mo
l/m
in/m
g)
Figure 4.19. Specific activity of Nguni liver GS versus Mg-ATP concentration. Specific
activity as a function of Mg-ATP concentration.

Chapter 4: Integrated Results
89
0 2 4 6-0.1
0.0
0.1
0.2
0.3
HLGS1HLGS2HLGS3HLGS4
Hereford
[Mg-ATP]
Sp
ecif
ic A
ctiv
ity
(µ
mo
l/m
in/m
g)
Figure 4.20. Specific activity of Hereford liver GS versus Mg-ATP concentration. Specific
activity as a function of Mg-ATP concentration.

Chapter 4: Integrated Results
90
0 2 4 60.0
0.1
0.2
0.3
NLGSHLGS
[Mg-ATP]
Sp
ecif
ic A
ctiv
ity
(µ
mo
l/m
in/m
g)
Figure 4.21. Comparison of the specific activity of Nguni (NLGS) and Hereford (HLGS)
liver glutamine synthetase versus Mg-ATP concentration presented as average of each
increasing Mg-ATP concentration.
4.3.2. Estimation of GS molecular weight on SDS-PAGE
The molecular mass of bovine GS is 42031. The molecular weight on SDS-PAGE was was
found to be 59kDa for both Nguni and Hereford liver GS. The molecular weight obtained for
both bovine breeds GS indicated glycosylation of bovine GS. The glycosylation of
mammalian proteins significantly impacts on the quality of SDS-PAGE data.

Chapter 4: Integrated Results
91
KDa M 1 2 3 4
A
KDa M 1 2 3 4
B
Figure 4.22. SDS-PAGE (10%) analysis of partially purified liver glutamine synthetase, M:
Molecular weight standard, size in kDa is shown on the left of both gel A & B. A: Partially
purified Nguni liver GS indicated as 1: NLGS1 2: NLGS2 3: NLGS3 4: NLGS4. B: Partially
purified Hereford liver GS indicated as 1: HLGS1 2: HLGS2 3: HLGS3 4: HLGS4
~58kDa
150
50
100
70
40
~42kDa
~58kDa
150
50
100
70
40

Chapter 4: Integrated Results
92
4.4. Purification of glutamate dehydrogenase
The purification of glutamate dehydrogenase from Nguni liver samples and Hereford liver
samples was carried out as described earlier. The results from the purification of Glutamate
dehydrogenase from Nguni liver samples and Hereford liver samples are summarized in
Table 4.11. For Nguni liver, fractionation with ammonium sulphate resulted in a GDH
specific activity of about 0.58µmol/mg/ml while for Hereford liver it showed a specific
activity of about 0.61µmol/mg/ml. The specific activity of the glutamate dehydrogenase
obtained after affinity column was about 0.07µmol/mg/ml for Nguni and 0.37µmol/mg/ml for
Hereford.
Table 4.11. Typical purification of Nguni liver and Hereford liver glutamate dehydrogenase.
These assays were performed in excess substrate.
Purification
step
Volume
(ml)
Total
protein(mg)
Specific activity
(µmol/min/mg)
N H N H
Homogenate 110 232 245 1.19 0.714
Ammonium
sulphate
50 229 221 0.58 0.61
Sephadex G-25 14 257 233 3.3 1.4
DEAE Sephacel 12 167 194 1.4 0.77
GTP Sepharose 6 50.8 59.0 0.07 0.37
The presence of bovine GDH from both breeds was validated by LC-MS/MS which
identified retinal glutamate dehydrogenase amongst other bands from SDS-PAGE as the band
of interest marked with reference to protein page molecular ruler (Figure 4.29 – Figure
4.30).
4.4.1. Kinetics
The effect of varied concentrations of α-ketoglutarate on the activity of glutamate
dehydrogenase is shown in Figure 4.23 and Figure 4.24 for both Nguni and Hereford livers
respectively. The steady kinetics for α-ketoglutarate is hyperbolic and yields a Michaelis-
Menten Km of between 1.5 – 13.9mM (Average = 5.641mM) (Table 4.11) for the Nguni
livers and a Km of 2.4 – 10.53mM (Average = 6.653mM) for the Hereford livers. Nguni liver

Chapter 4: Integrated Results
93
GDH has a goodness of fit of 6/8 plots with the R-square of 0.9718 – 0.9945. The kinetics
for ammonium chloride was also hyperbolic yielding a Michaelis-Menten Km of between 4.9
– 15.5mM (Average = 23.79mM) for the Nguni livers and a Km of 2.3 – 17.5mM (Average =
6.474mM) for the Hereford livers. Hereford liver GDH has a goodness of fit of 6/8 plots with
the R-square of 0.9508 – 0.9841.
0 1 2 3 4 50.0
0.5
1.0
1.5
2.0
2.5
NLGDH1NLGDH2NLGDH3NLGDH4
Nguni
a-Ketoglutarate [mM]
Sp
ecif
ic A
ctiv
ity
(µ
mo
l/m
in/m
g)
Figure 4.23. Effect of the variation of α-ketoglutarate concentration on the specific activity
of Nguni liver glutamate dehydrogenase at 37oC.

Chapter 4: Integrated Results
94
0 1 2 3 4 50.0
0.5
1.0
1.5
2.0
2.5
HLGDH1HLGDH2HLGDH3HLGDH4
Hereford
a-Ketoglutarate [mM]
Sp
ecif
ic A
ctiv
ity
(µ
mo
l/m
in/m
g)
Figure 4.24. Effect of the variation of α-ketoglutarate concentration on the specific activity
of Hereford liver glutamate dehydrogenase at 37oC.

Chapter 4: Integrated Results
95
0 1 2 3 4 50.0
0.5
1.0
1.5
NLGDH1NLGDH2NLGDH3NLGDH4
Nguni
(NH4)2SO4 [mM]
Sp
ecif
ic A
ctiv
ity
(µ
mo
l/m
in/m
g)
Figure 4.25. Effect of the variation of ammonium sulphate concentration on the specific
activity of Nguni liver glutamate dehydrogenase at 37oC.
The effect of the concentration of ammonium sulphate on the activity of glutamate
dehydrogenase is shown in Figure 4.25 and Figure 4.26 for both Nguni and Hereford livers.

Chapter 4: Integrated Results
96
0 1 2 3 4 50.0
0.5
1.0
1.5
HLGDH1HLGDH2HLGDH3HLGDH4
Hereford
(NH4)2SO4 [mM]
Sp
ecif
ic A
ctiv
ity
(µ
mo
l/m
in/m
g)
Figure 4.26. Effect of the variation of ammonium sulphate concentration on the specific
activity of Hereford liver glutamate dehydrogenase at 37oC.

Chapter 4: Integrated Results
97
0 1 2 3 4 50.0
0.5
1.0
1.5
2.0
2.5
NLGDHHLGDH
a-Ketoglutarate [mM]
Sp
ecif
ic A
ctiv
ity
(µ
mo
l/m
in/m
g)
Figure 4.27. Comparison of the effect of the variation of α-ketoglutarate concentration on the
specific activity of Nguni (NLGDH) and Hereford (HLGDH) liver glutamate dehydrogenase
presented as an average of each increasing concentration of α-ketoglutarate.

Chapter 4: Integrated Results
98
0 1 2 3 4 50.0
0.5
1.0
1.5
NLGDH
HLGDH
(NH4)2SO4 [mM]
Sp
ecif
ic A
ctiv
ity
(µ
mo
l/m
in/m
g)
Figure 4.28. Comparison of the effect of the variation of ammonium sulphate concentration
on the specific activity of Nguni (NLGDH) and Hereford (HLGDH) liver glutamate
dehydrogenase represented as evarage of each increasing concentration of ammonium
sulphate.
The effect of α-ketoglutarate concentration on the activity of Nguni liver and Hereford liver
glutamate dehydrogenase was determined by Linear regression.

Chapter 4: Integrated Results
99
Table 4.12. Comparison of Vmax and Km of Nguni liver GDH with respect to substrate α-
ketoglutarate (A) and also with respect to ammonium (B) is calculated by GraphPad prism.
Non-linear fit NLGDH1 NLGDH2 NLGDH3 NLGDH4 Average STDEV
(A) a-Ketoglutarate
Michaelis-
Menten
Best-fit
values
Vmax 2.7 9.26 3.205 4.325 4.873 2.6004
Km 1.522 13.99 3.061 3.989 5.641 4.9004
(B) Ammonium
Michaelis-
Menten
Best-fit
values
Vmax 5.489 18.35 6.296 2.734 8.217 5.9973
Km 15.52 59.79 14.92 4.938 23.79 21.204
Table 4.13. Comparison of Vmax and Km of Hereford liver GDH with respect to α-
ketoglutarate (A) and also with respect to ammonium (B) is calculated by GraphPad prism.
Non-linear fit HLGDH1 HLGDH2 HLGDH3 HLGDH4 Average STDEV
(A) a-Ketoglutarate
Michaelis
-Menten
Best-fit
values
Vmax 5.232 4.397 6.038 2.52 4.547 1.3060
Km 6.747 6.929 10.53 2.405 6.653 2.8793
(B) Ammonium
Michaelis
-Menten
Best-fit
values
Vmax 5.669 1.783 2.055 2.58 3.022 1.5550
Km 17.26 2.333 2.683 3.621 6.474 6.2449
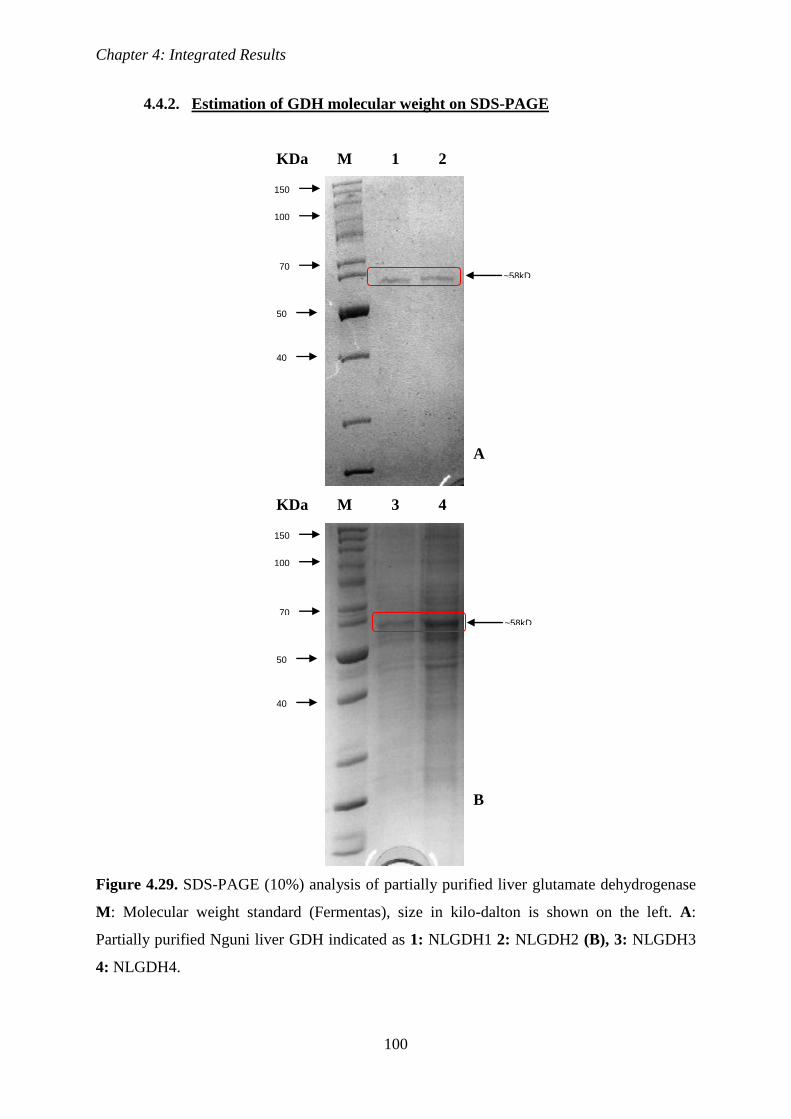
Chapter 4: Integrated Results
100
4.4.2. Estimation of GDH molecular weight on SDS-PAGE
KDa M 1 2
A
KDa M 3 4
B
Figure 4.29. SDS-PAGE (10%) analysis of partially purified liver glutamate dehydrogenase
M: Molecular weight standard (Fermentas), size in kilo-dalton is shown on the left. A:
Partially purified Nguni liver GDH indicated as 1: NLGDH1 2: NLGDH2 (B), 3: NLGDH3
4: NLGDH4.
~58kD
a
150
50
100
70
40
~58kD
a
150
50
100
70
40

Chapter 4: Integrated Results
101
KDa M 1 2
A
KDa M 3 4
B
Figure 4.30. SDS-PAGE (10%) analysis of partially purified liver glutamate dehydrogenase
M: Molecular weight standard, size in kilo-dalton is shown on the left. A: Partially purified
Hereford liver GDH indicated as 1: HLGDH1 2: HLGDH2 3: HLGDH3 4: HLGDH4.
The molecular weight on SDS-PAGE was marked at ~58 kDa for both Nguni and Hereford
liver glutamate dehydrogenase (Figure 4.29 – 4.30) with reference to protein molecular
weight page ruler. The molecular weight obtained for both bovine breeds for glutamate
dehydrogenase is slightly higher than the 56 KDa reported for mitochondrial type bovine
glutamate dehydrogenase reported in http://www.ncbi.nlm.nih.gov website of protein
~58kDa
150
50
100
70
40
~58kDa
150
50
100
70
40

Chapter 4: Integrated Results
102
databases. LC-MS/MS results obtained for the bovine hepatic glutamate dehydrogenase
bands cut out of the SDS-PAGE indicated the presence of bovine mitochodrial glutamate
dehydrogenase (Section 4.4).
4.4.3. Trypsin digest and LC-MS/MS for GDH band ID
Peptides were identified by QSTAR Elite ESI as gel-based ID marked by protein molecular
weight page ruler in the SDS-PAGE (Figure 4.29 - Figure 4.30, Page 100 - 101). The data
obtained was analysed by ProteinPilot™ Software 3.0 (Paragon Algorithm 3.0.0.0, 113442)
and reported in section 5.8.5.1 and 5.8.5.2 below. Only samples detected at a protein
threshold of 1.30 (95%) indicating 2.00 ProtScore. Only proteins with an unused ProtScore
greater than this value are shown in the Proteins Detected table. Peptides were recorded
below together with their precursor MS regions and as examples.
4.4.3.1. Selected peptides for the identification of Nguni liver GDH
i. IIKPCNHVLSLSFPIR
ii. DDGSWEVIEGYR
iii. GFIGPGVDVPAPDMSTGER
iv. IIAEGANGPTTPEADKIFLER
Figure 4.31. QSTAR Elite ESI Generated peptide profile for GDH. Peptides of interest:
Precursor MS regions analysed by ProteinPilot™ Software 3.0.
In Figure 4.31 (Page 102) a QSTAR Elite ESI Generated data of GLUD1 proteins. - Bos
taurus (Bovine) is displayed.

Chapter 4: Integrated Results
103
Table 4.14. Blast information for Nguni liver GDH generated from NCBI database of
proteins. Blast Information
Accession Description Maximum
Score
Total Score Query
Coverage
Maximum
Identity
NP_872593.1 glutamate
dehydrogenase 1,
mitochondrial
precursor [Bos
Taurus]
47.0 172 86% 100%
http://blast.ncbi.nlm.nih.gov/Blast.cgi?CMD=Web&PAGE_TYPE=BlastHome
4.4.3.2. Selected peptides for the identification of Hereford liver GDH
i. MYRYLGEALL
ii. GWARGQPAAA
iii. LSRAGPAALG
iv. PQPGLVPPB
Figure 4.32. QSTAR Elite ESI Generated peptide profile for GDH. Peptides of interest:
Precursor MS regions analysed by ProteinPilot™ Software 3.0.
In Figure 4.32 (Page 103) a QSTAR Elite ESI generated data of GLUD1 proteins. - Bos
Taurus (Bovine) is displayed.

Chapter 4: Integrated Results
104
Table 4.15. Blast information for Hereford liver GDH generated from the NCBI blast database of
proteins. Blast Information.
Accession Description Maximum
Score
Total Score Query
Coverage
Maximum
Identity
NP_872593.1 glutamate
dehydrogenase 1,
mitochondrial
precursor [Bos taurus]
43.9 141 100% 100%
http://blast.ncbi.nlm.nih.gov/Blast.cgi?CMD=Web&PAGE_TYPE=BlastHome
4.5. Purification of glutaminase
The purification of glutaminase from Nguni liver samples and Hereford liver samples was
carried out as described earlier „Purification of Bovine liver glutaminase‟. The results from
the purification of Glutaminase from Nguni liver samples and Hereford liver samples are
summarized in Table 4.16. The fractional precipitation of glutaminase with chilled
Ammonium sulphate (4 °C) at 70% saturation resulted in decreased yield measured in
specific activity of both Nguni and Hereford glutaminase. For Nguni liver, it showed a
specific activity of 1.87 µmol/mg/ml while for Hereford liver glutaminase showed a specific
activity of 0.94 µmol/mg/ml.
Table 4.16. Typical purification of Nguni liver and Hereford liver Glutaminase. These assays
were run in excess substrate.
Purification step Volume (ml) Total
protein(mg)
Specific
activity
(µmol/mg/ml)
Percentage fold
(%)
N H N H N H
Homogenate 140 215 255 3.25 0.94 100 100
Ammonium sulphate 50 107 201 1.87 0.21 58 22
Sephadex G-25 14 116 124 2.27 1.26 7 134
DEAE Sephacel 6 221 227 0.3 0.17 0.9 55
Ultrafiltrate 2 526 505 0.72 0.66 22 70

Chapter 4: Integrated Results
105
Overall protein concentration in milligrams per millilitre after precipitation with chilled
ammonium sulphate decreased substantially for both Nguni and Hereford. The presence of
bovine glutaminase from an SDS-PAGE was not validated by LC-MS/MS, the procedure
identified the band of interest expected to be glutaminase as catalase (Figure 4.28 - 4.29,
Page 98 - 100) and blasting together with aligning failed to identify the band as glutaminase.
4.5.1. Kinetics
The effect of the concentration of glutamine on the activity of glutaminase is shown in
Figure 4.34 and 4.35 for both Nguni and Hereford livers respectively.
The steady kinetics for glutamine for Nguni liver glutaminase yielded a Michaelis-Menten
Km of between 0.4607 – 0.6749mM (Average = 0.5706mM) for the Nguni livers. The kinetics
for the Hereford livers yieldeded a Michaelis-Menten Km of 3.733 – 47.11mM (Average =
22.3133mM). Both Hereford liver glutaminase and Nguni liver glutaminase showed
consistency and are not scattered. A goodness of fit of 6/8 analysed plots were achieved with
an R-square of 0.2695 – 0.4796 for Nguni breed and an R-square of 0.8336 – 0.8669 for
Hereford breed.

Chapter 4: Integrated Results
106
0 1 2 3 40.00
0.02
0.04
0.06
0.08NLGA1NLGA2NLGA3NLGA4
Glutamine [mM]
Sp
ecif
ic A
ctiv
ity
(µ
mo
l/m
g/m
l)
Figure 4.33. Effect of glutamine concentration on the specific activity of Nguni liver
glutaminase at 37oC.

Chapter 4: Integrated Results
107
0 1 2 3 4 50.00
0.01
0.02
0.03
0.04HLGA1HLGA2HLGA3HLGA4
Hereford
Glutamine [mM]
Sp
ecif
ic A
ctiv
ity
(µ
mo
l/m
g/m
l)
Figure 4.34. Effect of glutamine concentration on specific activity of Hereford liver
glutaminase at 37oC.
Samples were assayed for activity in quadruplicate at each glutamine concentration. The
kinetic constants Km and Vmax were determined using Graph-Pad™ prism 5.02 software
(Hearne, UK) for non-linear least-squares fit for all the data points.
The effect of glutamine concentration on the activity of Nguni liver and Hereford liver
glutaminase was determined by linear regression.

Chapter 4: Integrated Results
108
0 1 2 3 40.00
0.02
0.04
0.06
NLGAHLGA
Glutamine [mM]
Sp
ecif
ic A
ctiv
ity
(µ
mo
l/m
g/m
l)
Figure 4.35. Comparison of the effect of glutamine concentration on the specific activity of
Nguni (NLGA) and Hereford (HLGA) liver glutaminase at 37oC. These assays were run in
excess substrate.

Chapter 4: Integrated Results
109
Table 4.17. Comparison of Vmax and Km of Nguni liver glutaminase with respect to substrate
is calculated with the use of Graph-Pad™ prism 5.02.
Non-linear fit NLGA1 NLGA2 NLGA3 NLGA4 Average STDEV
[glutamine]
Michaelis-
Menten
Best-fit values
Vmax 0.05 0.07 0.06 0.07 0.052 0.00306
Km 1.022 1.699 1.804 1.605 1.532 0.08337
Allosteric
sigmoidal
Best-fit values
Vmax 0.02974 0.03602 0.03281 0.03593 0.033625 0.0025
The apparent Km values of glutamine were demonstrated while the concentration of NAD and
GDH were kept constant at 266 mM NAD and 1.9 mM GDH for both breeds
Table 4.18. Comparison of Vmax and Km of Hereford liver glutaminase with respect to
glutamine is calculated with the use of Graph-Pad™ prism 5.02.
Non-linear
fit HLGA1 HLGA2 HLGA3 HLGA4 Average STDEV
[glutamine] Michaelis-Menten
Best-fit values
Vmax 0.022 0.032 0.031 0.021 0.026 0.08861
Km 5.35 3.39 5.75 2.25 4.185 1.65125
Allosteric
sigmoidal
Best-fit values
Vmax 0.02557 0.02645 0.02371 0.0245 0.025058 0.00101

Chapter 4: Integrated Results
110
4.5.2. Estimation of glutaminase molecular weight on SDS-PAGE
The molecular weight on SDS-PAGE was marked at around 60 - 70 kDa for both Nguni and
Hereford liver glutaminase with the use of Fermentas molecular weight ruler and the
glutaminase reported by Perera et al., 1990 and another glutaminase reported by Kvamme et
al., 2001. This report is inconsistent with the bovine glutaminase reported in the
UniprotKB/Swiss-prot protein database. By SDS-PAGE, tissues from rat cortex and brain
stem were also found to have two bands with molecular weights of 65 and 68 kDa
respectively (Laake et al., 1999).

Chapter 4: Integrated Results
111
KDa M 1 2
A
KDa M 3 4
B
Figure 4.36. SDS-PAGE (10%) analysis of partially purified liver glutaminase. M:
Molecular weight standard, size in kilo-dalton is shown on the left. A & B: Partially purified
Nguni liver glutaminase indicated as 1: NLGA1 2: NLGA2 3: NLGA3 4: NLGA4.
~66kD
a
150
50
70
40
~66kD
a
150
50
70
40
~58kD
a
~58kD
a
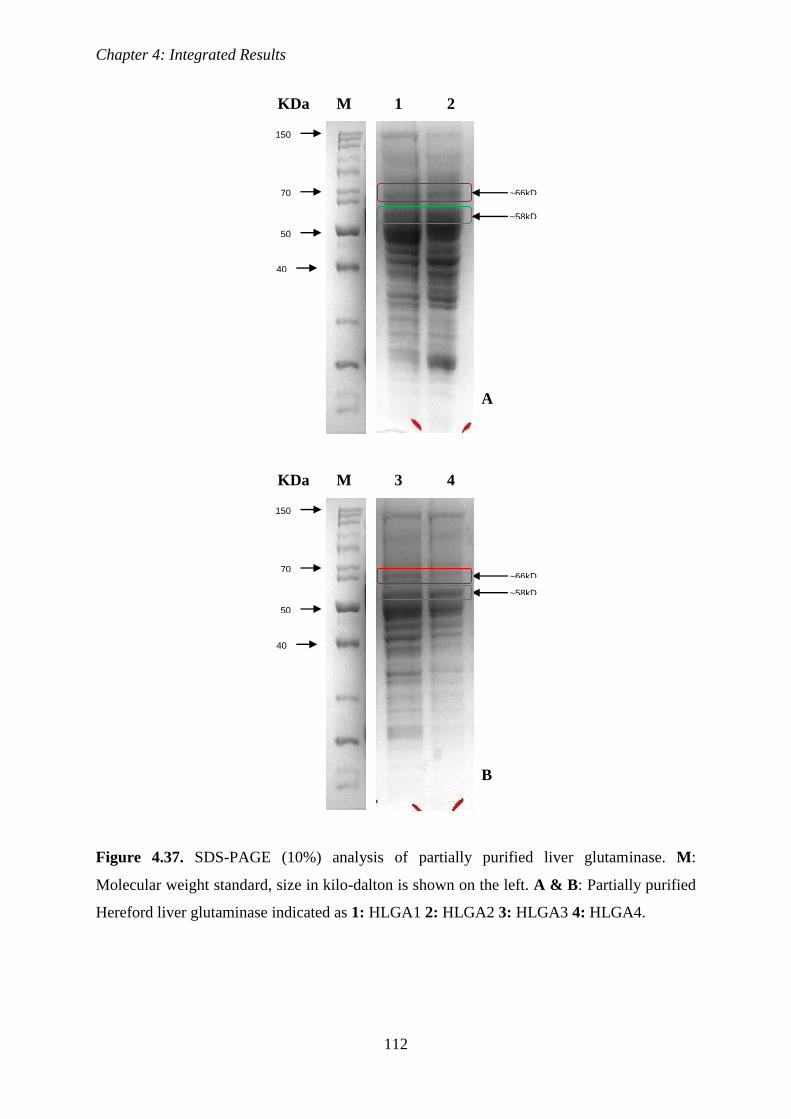
Chapter 4: Integrated Results
112
~66kD
a ~58kD
a
KDa M 1 2
A
KDa M 3 4
B
Figure 4.37. SDS-PAGE (10%) analysis of partially purified liver glutaminase. M:
Molecular weight standard, size in kilo-dalton is shown on the left. A & B: Partially purified
Hereford liver glutaminase indicated as 1: HLGA1 2: HLGA2 3: HLGA3 4: HLGA4.
~66kD
a
150
50
70
40
150
50
70
40
~58kD
a

Chapter 5: Integrated Discussion and Conclusion
113
CHAPTER 5: INTERGRATED DISCUSSION AND CONCLUSION
The enzymes arginase, carbamoyl phosphate synthetase, glutamate dehydrogenase and
glutaminase, were purified from both Nguni and Hereford livers by chromatographic
separations using sephadex G-25, DEAE-sephacel and affinity columns. In some cases only
partial purification was achieved as demonstrated by SDS-PAGE homogeneity. Comparative
protein extractions were obtained. The complexities of the glycosilation of the proteins did
not allow the purity of the extracts to be assessed is in some cases. This did not however
detract from the comparison of the enzyme activities obtained for each breed. Another
compounding factor in the isolation of enzymes from liver tissue which leads to the partial
hydrolysis of enzymes by the high level of proteolytic enzymes found in the cell free extract.
Sephadex G-25 was employed for desalting and separation of small molecules from the
enzyme preparation mixture. Low molecular weight impurities, such as ammonium sulphate,
do permeate the pore volume, with a retention volume equal to the total liquid volume of the
column, because the size of the salt molecules are smaller than the pore size sephadex G-25.
Sephadex G-25 was chosen against a range of other desalting media because of its ability to
hold 25 – 30% relative sample volume and to desalt 98% salt from the sample preparation.
Sephadex G-25 was also found to have an excellent batch-to-batch performance
reproducibility.
DEAE sephacel was chosen as an anionic exchanger column for the enzyme chromatographic
separations, mainly because of several specifications which allowed for the separation of
arginase, carbamoyl phosphate synthetase, glutamate dehydrogenase, glutamine synthetase
and glutaminase from the extracted liver sample mixtures. Some specifications include the
fact that DEAE sephacel is a weak anionic exchanger with a total ionic capacity of 0.13 -
0.17 mmol/ml gel and an available capacity to hold molecules from as low as 14,3 kDa to
669 kDa. In addition, DEAE sephacel was also the column of choice because of long-term
pH stability and a wide working range of pH (from 3 – 9). All enzymes of interest in this
study ranged between 35 kDa and 170 kDa, which was well within the reliable separation
capacity of DEAE sephacel gel.

Chapter 5: Integrated Discussion and Conclusion
114
With the exception of a guanosine triphosphate sepharose gel used to separate glutamate
dehydrogenase, adenosine monophosphate (AMP) agarose was used to separate glutamine
synthetase and carbamoyl phosphate synthetase from the extracted liver enzyme mixtures.
The other affinity chromatographic gels were prepared and activated before use. For arginase,
an arginine affinity column was employed.
5.1. Arginase
Arginase was partially purified from both Nguni and Hereford liver by chromatographic
separations using sephadex G-25, DEAE-sephacel and arginine affinity columns. The native
molecular weight of this enzyme as reflected on SDS-PAGE, showed double bands of around
38 kDa and 52 kDa for both Nguni and Hereford liver arginase. Double bands were apparent
in Figure 4.9, Page 73, and were probably a result of the high level of glycosylation of the
enzyme that occurs in mammalian enzymes. As such, this could only be validated by
deglycosylation procedures and subsequent analysis with LC-MS/MS for band identification,
which was beyond the scope of this study. While arginase was therefore not further
deglycosylated and identified with LC-MS/MS, it was apparent that both breeds indicated
similar double bands in the SDS-PAGE (Figure 4.9, Page 73). Also evident is that the same
order of magnitude of protein was extracted at each stage of the extractions (Table 4.1, Page
62).
Arginase enzymes extracted from both Nguni and Hereford liver samples mixtures were
found to be stable at 60oC following heat treatment of the crude extract, to enhance the
coagulation of thermolabile proteins, which were subsequently removed by centrifugation.
This thermal stability of arginase enzymes has also been reported in studies by other workers,
such as that of rabbit liver (George & Harold, 1973) cotyledon seed and buffalo liver (Dabir
et al., 2005). Ammonium sulphate precipitation (70% saturation) resulted in a further
increase in the specific activity of liver arginase (Table 4.1, Page 62).
As is the case with metal requiring enzymes, arginase needs the presence of manganese to act
as a cofactor, (Angels & Legal, 1984, Helga & Greenberg, 1968). However the amount
required for optimal activity of the enzyme varies. The concentration of MnCl2 used for
optimal activitywas found to be 2 – 2.5 mM (Dabir et al., 2005), the experiment to identify

Chapter 5: Integrated Discussion and Conclusion
115
the divalent metal ion of choice found Mn2+
, Mg2+
, Ca2+
, Co2+
, Ni2+
and Cd2+
could all acted
as cofactors/ activators of bovine arginase (Figure 4.8, Page 72). The enzymatic activity of
arginase assayed from a number of sources has shown to be manganese-dependent (Dabir et
al., 2005).
Mn2+
was found to be the most favourable divalent cation for both the Nguni liver and.
Hereford liver arginase enzymes (Figure 4.8, Page 72).
A direct non-linear relationship was found between the products formed, in relation to the
incubation time over a 20 minute time period in the presence of excess substrate. The
maximum activity of Nguni liver arginase was observed to be at 25 minutes, while activity of
Hereford liver arginase was seen to peak at 20 minutes (Figure 4.1, Page 65) within the total
of 30 minutes allowed for the assay. The common linear period (5 - 20 minutes), of the
activity curve, was used to ensure comparative activities between arginases of the two breeds.
Arginases from both breeds indicated a decrease in activity at 30 minutes. This phenomenon
may suggest the depletion of substrate, product inhibition or enzyme inactivation.
To determine the Km and Vmax values of arginase for arginine from both Nguni and Hereford
liver extracts, arginine was used in the concentration range of 0 to 36mM (Figure 4.4, 4.5 &
4.7, Page 71). The incubation was performed under standard conditions accepted for
determination of Km which is at 37°C and pH 9.5.
The calculated Km for the substrate arginine was significantly different in each breed. For
Nguni arginase, the Km for arginine was 34.19mM and very high as compared to 1.31mM for
Hereford breed. The high Km indicated in-turn the low affinity for the substrate in the case of
the Nguni enzyme. Although the Vmax for the enzymes was essentially the same, namely
16.05 and 15.40, for the nguni and Hereford breeds respectively.
The Km values for Nguni arginase for Mn2+
ranging from 4.146 – 19.260 with one enzyme
being significantly highr than the others. Taking this into account the Km values for Mn2+
for
both breeds were similar (Table 4.2 - 4.3, Page 63 - 64). There were no substantial
differences in Vmax between Nguni & Hereford arginases, in the presence of Mn2+
(Table 4.2
- 4.3, Page 63 - 6).
From the typical extraction profile of the arginase from each breed similar enzyme
concentrations and activities were obtained (Table 4.1, Page 62).

Chapter 5: Integrated Discussion and Conclusion
116
The apparent Michaelis-Menten constants reported for mammalian liver arginases for
arginine are in the range of 6 – 20 mM, which are similar to that reported for yeast arginase
(Hirsch-Kolb et al., 1970). However, in this particular study, the apparent Km for the Nguni
breed exceeded the 20 mM mark for arginine substrate. This is probably significant in
understanging the urea cycling in this breed (see Conclusion). Analysis of literature data
shows that the Km value for arginase varies within rather wide limits for different animals,
ranging from 1.4 mM in rabbit liver, to 200 mM arginine in reptile liver (Cederbaum et al.,
2004; Reyero and Dorner, 1975). The mammalian Km range appears to be from 10 to 20 mM
arginine.
Although arginase is traditionally considered in terms of its biochemical role in the urea
cycle, there is a growing body of evidence that indicates that arginase may play additional
roles in mammalian metabolism (Cox et al., 1999, Mori & Gotoh, 2000). Additional
functions also include biosynthesis of ornithine, which is a precursor of polyamines and
amino acids, such as proline and glutamate (Wu & Morris, 1998). Also, absence of arginase,
or lack of activity of arginase in the bovine system, can be attributed to insufficient regulation
of arginine itself, which can lead to the toxic production of nitrogen oxide. The abundance of
arginase in the liver can therefore be considered an advantage to the animal, since arginases
have also been hypothesized to be involved in cell proliferation, differentiation and wound
healing (Mori & Gotoh, 2000).
5.2. Carbamoyl phosphate synthetase (CPS)
The CPS from Nguni and Hereford breeds was partially purified using Sephadex G-25,
DEAE-sephacel and AMP Agarose affinity columns (Table 4.4, Page 74).
As other workers have shown glycerol could act, either as a cryoprotectant, or by activating
the enzyme (Rubio et. al., 1983) 4% v/v glycerol was added to purification buffer, for
stability of CPS. DMSO (15%) was added as a cryoprotectant. In general, the method of
Pierson & Brien (1980) was used for the purification of CPS and also contained dithiothreitol
as a stabiliser.

Chapter 5: Integrated Discussion and Conclusion
117
Samples assayed for final kinetics were obtained from AMP agarose column with the active
eluants being collected and subsequently combined into one fraction. The AMP agarose did
give as high affinity purification as expected however, the enzyme concentration data as well
as the SDS-PAGE allowed the enzyme activities to be compared (Table 4.4, Figure 4.16).
As decreasing concentrations of protein were eluted from AMP agarose column
chromatography, faint bands were marked with a molecular weight ruler and later identified
with LC-MS/MS quality control methodology.
The effect of magnesium-ATP was determined by measuring the kinetics of both Nguni and
Hereford liver CPS for comparative purposes. The kinetic properties determined for the
partially purified liver CPS indicated different Km values for Mg-ATP between the two
breeds. For Nguni CPS, the Km for MgATP was 0.60 mM and while that for the Hereford was
4.02 mM for Hereford breed. The high Km of Hereford liver samples indicated in-turn the low
affinity for the substrate when compared with the Nguni CPS.which was also seen in the
specific activity of Hereford breed (Table 4.4, Page 74). The Vmax for Mg-ATP for the Nguni
breed CPS was found to be 0.49 while that for the Hereford breed was found to be 1.37. The
affininty for ammonium was low for Nguni breed as indicated by higher Km and Vmax.
The two curves of CPS saturation with Mg-ATP as presented in Figure 4.10 - 4.11, 4.14
(Pages 75 -76, 79) indicated a clear difference in optimum concentrations of Mg-ATP
required for each breed.
The steady state kinetics for Mg-ATP was hyperbolic and yielded a Michaelis-Menton Vmax
between 0.4541 – 0.5575 (Average = 0.4946) for the Nguni CPS and 0.744 – 1.547 (Average
= 1.379) for the Hereford CPS which indicated a higher affinity of Nguni CPS for MgATP
when compared with Hereford breed CPS (Table 4.5 – 4.6, Page 81 - 82). . The maximum
rate of reaction of the Nguni liver CPS was lower than that for the Hereford liver CPS,
The analysis of the data using the GraphPad Prism software gave a Km value for Mg-ATP
which ranged from 0.43 mM – 0.91 mM for the four Nguni livers tested, giving an average
of 0.60 (Table 4.5, Page 81; Figure 4.14, Page 79). A maximal (Vmax) rate for the reaction
was between 0.45 – 0.56 nmol of ADP/mg of protein/min, with an average of 0.50 nmol of
ADP/mg of protein/min (Table 4.7, Page 85). Similarly analysis of this data using GraphPad
Prism software gave a Km value for Mg-ATP which ranged from 0.91 mM – 8.58 mM for the
four Hereford liver extracts, with an average of 4.022 (Table 4.6, Page 82; Figure 4.14,

Chapter 5: Integrated Discussion and Conclusion
118
Page 79). A maximal (Vmax) rate for the reaction was between 0.75 – 1.547 nmol of ADP/mg
of protein/min, with an average of 1.379 nmol ADP/mg of protein/min (Table 4.6, Page 82).
The difference between Vmax of CPS between the two breeds was 0.88 nmol of ADP/mg of
protein/min. As such, with a P<0.0001 between samples of CPS from each breed, no
significant differences were apparent.
Other workers have reported different Km values for CPS some as high as 3 mM for Mg-ATP,
when studying rat liver enzyme (Kerson & Appel, 1968).
The effect of ammonium chloride on the activity of bovine CPS in order to compare the
kinetics of the reaction between Nguni and Hereford liver extracts is shown in Figures 4.12
and 4.13 respectively, (Pages 77 – 78). The steady state kinetics for ammonium chloride was
hyperbolic (Figure 4.12 – 4.13, Page 77 - 78) and yielded a Michaelis-Menton Km of
between 27.82 – 36.6 mM (Average = 33.115) for the Nguni liver CPS, and 15.68 – 27.54
mM (21.292) for the Hereford liver CPS (Table 4.5 and Table 4.6, Page 82). This data thus
suggests that the CPS liver extracts from the two breeds similar affinities for ammonium
chloride.
In other studies of bovine liver, rat liver and frog liver CPS kinetics, the Km values were as
low as 1 - 2 mM for ammonium chloride (Kerson & Appel, 1968). The apparent Michaelis-
Menten constants reported for mammalian liver CPSs are in the range of 10mM (Kerson &
Appel, 1968) but in this case the two breeds investigated in this study the apparent Km
exceeded the 10mM level.
The identification of Nguni and Hereford CPS was achieved with the aid of LC-MS/MS.
Peptides identified by SDS-PAGE by molecular mass (Figure 4.16, Page 83) were then
eluted and hydrolysed for LC-MS/MS analysis (Figure 4.17, Page 84). The enzymes were
found to be CPS in both cases (Tables 4.7 & 4.8, Page 85). For quality control for the
protein blast indicated that the sequence had 99% confidence level for Bos Taurus
(Appendix 4, Page 167).
5.3. Glutamine synthetase (GS)

Chapter 5: Integrated Discussion and Conclusion
119
The method described earlier for the isolation of glutamine synthetase (GS) from bovine
liver, has been used repeatedly by a number of investigators. Yields varied from 75% to 77%,
with the crude enzyme mixture being stable for at least a month when stored between -70oC
and -80oC (Tagaki et al., 2008).
HEPES buffer was effectively used throughout purification of GS, with the inclusion of
higher concentrations of sodium chloride and lower concentrations of magnesium chloride,
all of which proved to be the „key‟ to achieving stability and activity of GS extractions
throughout the study. To this end GS was partially purified from both Nguni and Hereford
livers by a two-step chromatographic separation protocol using Sephadex G-25 and AMP
Agarose affinity columns. A size exclusion Sephadex G-25 column was used to desalt and
concentrate the enzyme extracts. The process of desalting the ammonium sulphate from the
liver sample extract after precipitation greatly diminished GS activity.
The effect of Mg-ATP on the activity of GS was determined by measuring the kinetics of
both Nguni and Hereford liver GS extracts. The curve of GS saturation with Mg-ATP is
presented in Figure 4.19 and 4.20 (Pages 88 - 89), indicating a similarity in optimum
concentrations of Mg-ATP for each breed. Very early on in the reaction, Nguni liver GS
extracts indicated higher activity when compared to Hereford liver GS activity, which only
occurred at increased concentration of Mg-ATP around 2 mM Mg-ATP. This phenomenon
may represent the higher requirement of Mg-ATP for the Hereford GS for Mg-ATP,
compared to the Nguni GS, which was active at a lower concentration of Mg-ATP.
The steady state kinetics for Mg-ATP was hyperbolic and yielded a Michaelis-Menten Km of
between 1.048 – 5.635 mM for the Nguni liver GS extracts and 1.2 – 6.3 mM for the
Hereford GS liver extracts (Table 4.10, Page 87). The average Km of the four Nguni liver GS
extracts was lower than that for the four Hereford livers GS extracts according to Michaelis-
Menten best fit algorithms. The difference between the two Km values was almost 50%, and
may contribute to differences in physiological behaviour seen in one breed compared to the
other.
In other studies of GS activity the Km values for Mg-ATP were 2.0 mM and 2.9 mM for the
HPLC and spectrophotometric assays, respectively (Listrom et al., 1997). These values do
not deviate far from the findings of this study especially, that of the Nguni liver GS, which
had an average Km of 2.46 mM Mg-ATP (Table 4.10, Page 87).

Chapter 5: Integrated Discussion and Conclusion
120
In most of the studies by other workers, GS was considered only in terms of its biochemical
role in the urea cycle (Norenberg, 1979). However, there is now a growing body of evidence
that indicates that GS may play additional roles in mammalian metabolism, especially in the
removal of toxic NH4+from body fluids. In this regard, the abundance of GS in Nguni livers
can be an advantage over the Hereford breed, since GS catalyses the ligation of glutamate and
ammonia to form glutamine, with concomitant hydrolysis of ATP. The activity of bovine
liver GS may eliminate much of cytotoxic ammonia utilising lower levels of Mg-ATP, at the
same time converting neurotoxic glutamate to harmless glutamine (Krajewski et al., 2008).
The native molecular weight of GS enzyme was estimated and marked on SDS-PAGE by a
protein molecular weight Page ruler (Fermentas), indicating double bands of molecular
weight between ~42kDa and ~58kDa for Nguni liver GS, and only ~58kDa for Hereford liver
GS (Figure 4.22A & Figure 4.22B, Page 91). Double bands in Figure 4.22A may indicate
glycosylation of the Nguni liver GS, whereas Hereford liver GS did not show any indication
of being glycosylated.
5.4. Glutamate dehydrogenase (GDH)
The entire purification of glutamate dehydrogenase (GDH) was accomplished in two and a
half days, as compared to the several weeks‟ purification of Fahien et al., 1969. GDH was
purified from both Nguni and Hereford livers by chromatographic separation involving
Sephadex G-25, DEAE-Sephacel and GTP Sepharose gel columns. Purification of Nguni and
Hereford GDH is outlined in (Table 4.11, Page 92).
The kinetic studies of the reductive amination of α-ketoglutarate, which was catalysed by
GDH with NADPH as coenzyme and ammonium ions, were performed at pH 8.3 (Figures
4.23, 4.24 and 4.27, Pages 93 – 94, 97). When concentrations of both ammonium ions and α-
ketoglutarate were varied separately over a wide range, it was possible to determine the effect
of increased concentrations to specific activity of GDH. It was clear that the activity of GDH
was dependant on the concentration of both substrates (Figures 4.23, 4.24 and 4.27, Pages 93
– 94, 97).
The steady kinetics for α-ketoglutarate was hyperbolic and yielded a Michaelis-Menten Km of
between 1.522 – 13.99 mM for the Nguni liver GDH activity and 2.41 – 10.53mM for the

Chapter 5: Integrated Discussion and Conclusion
121
Hereford liver GDH activity (Table 4.12 and 4.13, Page 99). The Km value reported in other
studies for bovine GDH, was as low as 0.5 mM for α-ketoglutarate, and as low as 0.08 mM
for NH4+
(Engel & Dalziel, 1970). The Vmax in the presence of α-ketoglutarate for the Nguni
liver GDH was found almost identical for the two breeds as determined by Michaelis-Menten
non-linear fits. The Vmax being between 2.7 – 9.2 nmol of NAD+/mg/min for the Nguni
enzyme and 2.54 – 6.03 nmol of NAD+/mg/min (Figure 4.25 and 4.26, Pages 95 – 96; Table
4.12 and 4.13, Page 99).
The affinity for ammonium was low for Nguni breed as indicated by higher Km and Vmax.
The steady kinetics for (NH4)2SO4 was hyperbolic and yielded a Michaelis-Menten Km of
between 4.94 – 15.52 mM for the Nguni liver GDH activity and 2.33 – 17.26 mM for the
Hereford liver GDH activity, while a Vmax of between 2.73 – 18.35 mM for the Nguni liver
GDH activity and 2.01 – 5.67 mM for the Hereford liver GDH activity was obtained (Table
4.12 and 4.13, Page 99).
Both the Km values of Nguni liver GDH and Hereford liver GDH, with respect to α-
ketoglutarate, were found similar with the reported Km for human and rabbit liver GDH (6.3
mM) (Engel & Dalziel, 1970).
The native molecular weight of liver extract GDH estimated on SDS-PAGE showed a single
band in the region of ~58 kDa for both breeds (Figure 4.29 - 4.30, Pages 100 - 101) as
marked by a protein molecular weight ruler (Fermentas).
The characterization Nguni liver GDH was achieved with the aid of LC-MS/MS
chromatography. Peptides were identified (Figure 4.31 – 4.32, Page 102 - 103) by QSTAR
Elite ESI as gel-based ID as marked by a protein molecular weight page ruler in the SDS-
PAGE (Figure 4.29 – 4.30, Page 100 - 101. The NCBI protein blast (Appendix 5, Page 169)
indicated that the sequence had 99% confidence level for Bos taurus GDH.
This provided further confirmation for the existence of bovine GDH in liver sample extracts
from both breeds of animal (Table 4.14 – 4.15, Page 103 - 104).

Chapter 5: Integrated Discussion and Conclusion
122
5.5. Glutaminase
Glutaminase was purified in potassium phosphate buffer. Glutaminase was partially purified
from Nguni and Hereford livers via chromatographic separations, including Sephadex G-25
column chromatography, DEAE-Sephacel column chromatography and also using
ultrafiltration. A Sephadex G-25 column was used to desalt and concentrate the enzyme in
preparation for anionic binding with the DEAE sephacel chromatographic column.
Glutaminase has a strong anionic binding for DEAE sephacel according to Patel & McGivan
(1984). From the purification data, partial purified Nguni and Hereford liver glutaminase was
concentrated by ultrafiltration (Table 4.16, Page 104).
Varying degrees of success for the purification of hepatic glutaminase, has been reported by a
number of workers since the early to middle 1980‟s, with the study by Smith & Watford
(1988) being the protocol of choice used here.
The calculated Km for glutamine showed a significant difference. For Nguni glutaminase, the
Km for glutamine was 1.022 – 1.804 mM compared to 3.39 – 5.34 mM for Hereford breed.
The high Km of Hereford liver samples had indicated the low affinity for glutamine.
If Km is lower for a substrate, it maybe concluded that the affinity for such substrate for
optimal activity is high. The Km value of Nguni liver glutaminase, with respect to glutamine,
was also found to be lower than that for Hereford liver glutamine (Table 4.17 – 4.18, Page
109). The Vmax obtained for the Nguni enzyme was 0.05 – 0.07 while that for the Hereford
enzyme was 0. 022 – 0.032. The functioning of the glutaminase for the Nguni enzyme was
therefore significantly higher both when assessed by the higher affinity of the enzyme as well
as the higher Vmax. This is important as this would mean that the Nguni enzyme would
produce more NH3 which could then be used for the synthesis of carbamoyl phosphate and
subsequently urea.
The partially purified glutaminase estimated on SDS-PAGE (Figure 4.36 - 4.37, Page 111 -
112) showed a multiple bands of molecular weight between 35 kDa - 150 kDa for both Nguni
and Hereford liver glutaminase. The LC-MS/MS was unable to identify the protein of
interest. This may be due to high levels of glycosylation of the enzyme concerned.

Chapter 5: Integrated Discussion and Conclusion
123
The Km values of the Nguni liver glutaminase, with respect to the substrate glutamine, were
also similar when compared with that isolated from mammalian brain cells (0.8 mM
glutamine) (Nimmo & Tipton, 1981), E. coli (0.45 mM glutamine) (Hartman, 1968). Rat
kidney glutaminase (3 – 4 mM glutamine) (Kenny et al., 2003), was slightly higher than that
found in this study.
Within the range of 0 to 4.2 mM glutamine (Willemoes & Sigurskjold, 2002) concentrations
and the standard conditions accepted for determination of Km (37°C and pH 7.4), it was
possible to determine Km and Vmax values of glutaminase from Nguni and Hereford livers.
The Km values of the Nguni liver glutaminase, with respect to the substrate glutamine, were
considerably lower than the reported Km of the mammalian liver glutaminase, as reported at 6
mM glutamine (McGivan et al., 1980) and 28 mM glutamine, which was the highest
concentration reported (Huang & Knox, 1976). However the values of Hereford liver
glutaminase can be closely associated with the Km values of McGivan et al., (1980) and also
that of Huang & Knox, (1976). The Km of Nguni liver glutaminase reported in this study is
closely related to that of Lactoccocus lactis , considering the similar assaying conditions with
a coupled assay system, where NAD is reduced to NADH (1.10 mM glutamine) (Willemoes
& Sigurskjold, 2002).
Although the difference in Vmax between the two breeds for glutamine was 0.109 mmol of
NADH/mg of protein/min (Table 4.17 – 4.18, Page 109), it is imperative to note that the
behaviour of glutaminase from the two breeds could also have been similar. This is
confirmed by the non-significance of the differences in the slopes of the combined data from
both breeds.
In general, both breeds had acceptable Km values with respect to glutamine concentrations.
Results from this study are not directly comparable with data from other workers, who
reported that the behaviour of the enzyme obeys different kinetics depending on assay
conditions. In particular, soluble glutaminase from pig brain was found to follow sigmoid
kinetics according to Svenneby (1971), but not according to Kvamme & Torgner (1974).
5.6. General Conclusion
The mechanism of ammonia detoxification to form urea in mammals is outlined in Figure
5.1 and the urea cycle (Figure 5.2). The ammonia (NH4+) released by the reverse reaction of

Chapter 5: Integrated Discussion and Conclusion
124
glutamate dehydrogenase (GDH) is converted to carbamoyl phosphate by carbamoyl
phosphate synthase I (CPS), in the mitrochondria. Another mitrochondrial enzyme, ornithine
transcarbamoylase (OTC), then converts the carbamyl phosphate to citrulline in the presence
of L-ornithine. The citrulline synthesized in the mitrochondria is converted to arginine in the
cytosol by argininosuccinate (ASA) synthase and argininosuccinate (ASA) lyase. Arginine is
then converted to urea by arginase, regenerating ornithine and completing the urea cycle.
Glutamine synthetase (GS) in the liver also plays a role in ammonia detoxification.
Glutamine is a major blood amino acid, and may also be transported to the liver where the
amide-N is converted to urea. The amide-N of glutamine is released as ammonia,
intramitrochondrially, by the enzyme glutaminase. This ammonia may also be converted to
citrulline.
The overall regulation of these enzymes is therefore crucial in the understanding of what
separates the Nguni breed urea cycle from other less "hardy" breeds. The elevated urea levels
in the Nguni blood sera, possibly arises from increased conversion of glutamine to glutamate
in the liver by glutaminase. It is possibly that the Nguni are capable of creating glutamine
stores in the muscle as occurs in sheep.

Chapter 5: Integrated Discussion and Conclusion
125
Glutamate a-Ketoglutarate
NAD NADH
GDH
NH4+ + HCO3
-
Carbamylphosphate
Citrulline
Ornithine
Citrulline
Aspartate
Argininosuccinate
Arginine
Ornithine Ornithine
UREA
AMP ATP
ASA synthase
ASA lyase
Arginase
2 ATP
2 AMPCPS-
OTC
Glutamate
Transamination
Glutamine
GSGlutaminase
CytosolMytochondria
Figure 5.1. Detoxification of ammonia released via transdeamination by its conversion to urea

Chapter 5: Integrated Discussion and Conclusion
126
Figure 5.2. The urea cycle showing the two mitochondrial and 3 cytosolic reactions
The Nguni arginase has a lower affinity for the substrate than the Hereford enzyme (Figure
5.1). This would lead to an accumulation of arginine under equivalent conditions in the Nguni
liver, however, the Nguni CPS has a higher affinity for ATP than the Hereford enzyme and
would therefore utilise the arginine more efficiently than the Hereford enzyme creating the
necessary “pull” on the transfer of the arginine into the mitochondria of the liver. As the
arginine transport is dependent on the export of the L-citruline increase levels of citruline
would also drive the formation of arginosuccinate thereby increasing the drive for the
formation of urea. The higher affinity of the Nguni glutaminase as well as the higher Vmax
would also mean that the Nguni enzyme would produce more NH3 which could then be used
for the synthesis of carbomoyl phosphate and subsequently urea.

Chapter 6: Summary and Recommendation
127
CHAPTER 6: SUMMARY AND RECOMMENDATIONS
6.1. Summary
Protein regeneration cycle is of great significance to the survival of ruminants under
unfavourable environmental and nutritional conditions. The Nguni breed of cattle is able to
obtain optimal nutritional value from the natural vegetation available, thus enabling it to
survive under conditions that most grazers such as the European cattle breeds would find
extremely testing. This observation alone proves that the Nguni breed is an animal in
harmony with its environment despite the condition. Since animals consuming low N-diet
have been reported to have increased urea reabsorption, the Nguni can then be categorised
into the class of N-recycling ruminants.
The activity of enzymes of bovine nitrogen metabolism is hypothesized to contribute to either
the deterioration or survival of the cattle in harsh environmental conditions. Since enzymes
responsible for certain functions in bovine metabolism are known, it is important to identify
those specific enzymes by purification and characterization in bovine liver and kidney to be
able to determine the effect of such enzymes.
Partial purification and characterization of five selected enzymes of bovine nitrogen
metabolism was attempted. Crude enzymes from both Nguni and Hereford livers were
separated from most or some contaminants by sephadex G-25, DEAE sephacel, and different
affinity column chromatography depending on the size, binding, ionic and affinity strength.
Carbamoyl phosphate synthetase and GDH were successfully purified and characterized by
LC-MS/MS and the results were blasted and matched >95% with those of Bos Taurus in
NCBI protein database (Appendix 5, Page 169). Comparison of those fully characterized
enzymes was done using kinetics calculated and presented clearly in graphs. Although
partially purified and compared utilizing GraphPad™ Prism software by the use of kinetics
and graphs, enzymes such as arginase, glutamine synthetase and glutaminase failed to ionise
by LC-MS/MS during characterization.
Partial purification and characterization of selected enzymes of bovine nitrogen metabolism
was in part achieved.
Chapter 6: Summary and Recommendation
128
6.2. Recommendations
For the purification of arginase, CPS, GS, GDH and glutaminase from bovine liver, more
sophisticated equipments and conditioned work environment was required since animal
tissues and cells are delicate.
The requirement of Nguni and Hereford liver arginase for higher ammonium chloride
concentration can only be explained by a further study since such trend was not completely
clear in this study. The phenomenon whereby the requirement of substrate is higher in
Hereford than in Nguni is seen in all enzymes purified in this study in varied percentages for
each individual enzyme. It is a trend which requires further investigation in a separate study.
If the Km of a substrate for an enzyme is too high, the enzyme is less likely to be active in
lower substrate concentrations.
Although partial purification was achieved for the Nguni liver and the Hereford liver by
bench-top chromatographic separations, complete purification is important to fully
characterize enzymes. There is still a need to fully and cleanly purify these enzymes to avoid
the failure of ionization of some of these enzymes by LC-MS/MS. There is also a need to
deglycosylate enzymes such as GS for the full characterization thereof. LC-MS/MS picked
human CPS for Hereford and also picked rat CPS for Nguni liver samples, analysis by
ProteinPilot™ and protein peptides blasting (Appendix 4, Page 167) indicated that the
sequence had 99% confidence Bos Taurus which was confirmatory of the presence of bovine
CPS in samples of both breeds. It is then recommended that characterization be done in fully
purified CPS to avoid confusion with contaminating bands.
GS was not characterized due to failure of ionization in LC-MS/MS. It is with this reason that
it is recommended that characterizing GS be given a sole focus in order to be able to
deglycosylate the enzyme which could not be done in this study due to scope and time
constraints. The only kinetics studied for the part of GS was that of the effect of Mg-ATP
concentration on the activity of GS. It is recommended that the effect of glutamate and NH4
be studied in order to fully characterize and compare the complete behaviour of GS from
Nguni liver with that of the Hereford liver.
Chapter 6: Summary and Recommendation
129
Similarly to CPS, LC-MS/MS picked human GDH for Hereford and rat GDH for Nguni
samples. Protein peptides blast indicated that the sequence had 99% confidence Bos Taurus
which was confirmatory to prove the presence of bovine GDH in samples for both breeds in
addition to the calculated specific activity.
Estimates of the distribution of both Nguni and Hereford liver glutaminase were made
completely based on the calculated specific activity and kinetics although these were far from
satisfactory. LC-MS/MS identified the band of interest as catalase instead of glutaminase
while the calculated activity and the marking with Fermentas protein Page ruler identified the
two bands as glutaminase and GDH as a contaminant. A thorough study into the purification
and identification of hepatic glutaminase by carefully set-up chromatographic separations and
LC-MS/MS is recommended.

References
130
REFERENCES
Abdelal, T.H., and Ingraham, J.L. (1975). Carbamoyl-phosphate synthetase from Salmonella
typhimurium. Journal of Biological Chemistry, 250, 4410 - 4417
Adler, S. P., Purich, D., and Stadtman, E. R. (1975). Cascade control of Escherichia coli GS.
Journal of biological chemistry, 250, 6264-6272
Aebersold, R. (2003). Constellations in a cellular universe. Nature, 422(6928), 115–116
Alabadi D., Agüero M.S., Pérez-Amador M.A., Carbonell J. (1996). Arginase, arginine
decarboxylase, ornithine decarboxylase and polyamines in tomato ovaries, Plant Physiology.
112, 1237–1244
Amaya, K.R., Kocherginskaya, S.A., Mackie, R.I., and Cann, I.K.O. (2005). Biochemical and
Mutational Analysis of GS Type III from the Rumen Anaerobe Ruminococcus albus 8.
Journal of Bacteriology, 187(21), 7481–7491
Anderson, A. B. (1945). The activation of Jack-Bean arginase by cobalt, manganese, and
iron. Biochemical Journal, 39, 139–142
Anderson, P. M. (1977). Binding of allosteric effectors to carbamoyl-phosphate synthetase
from Escherichia coli. Biochemistry, 16, 587–593
Anderson, P. M. (1980). Glutamine- and N-acetylglutamate-dependent carbamoyl phosphate
synthetase in elasmobranchs. Science, 208, 291-293
Anderson, P.M. (1989). Glutamine-dependent carbomyl-phosphate synthetase and other
enzyme activities related to the pyrimidine pathway in spleen of Squalus acanthias (spiny
dogfish). Biochemical Journal, 261: 523-529
Arashima, S., and Matsuda, L. (1972). A case of carbamoyl phosphate synthetase deficiency.
Tohoku Journal of Experimental Medicine, 107, 143-147
References
131
Ardawi, M.S.M., and Newsholme, E.A. (1983). Glutamine metabolism in lymphocytes of the
rat. Biochemical Journal, 212, 835-842
Ardawi, M.S.M. and Newsholme, E.A. (1984). Glutamine metabolism in lymphoid tissues.
In: Glutamine Metabolism in Mammalian Tissues. Haussinger, D., and Sies, H. (pp. 235-246)
Ed. Springer-Verlag, Berlin.
Ash, D.E. (2004). Structure and function of arginase. Journal of Nutrition, 134(10), 2760-
2764
Baskerville, A., Hambleton, P., Benbough, J.E. (1980). Pathological features of glutaminase
toxicity. British Journal of Experimental Pathology, 61, 132-138
Batshaw, M., Brusilow, S., and Walser, M. (1975). Treatment of carbamoyl phosphate
deficiency with keto analogues of essential amino acids. New England Journal of Medicine,
292, 1085-1090
Baverel, G. and Lund, P. (1979). A role for bicarbonate in the regulation of mammalian
glutamine metabolism. Biochemical Journal, 184, 599-606
Bester, J., Matjuda, L.E., Rust, J.M., & Fourie, H.J. (2003). The Nguni: A case study.
Community based management of animal genetic resources, Food and Agriculture
Organisaztion of the United Nations (FAO). Proceedings of the workshop held in Mbabane
Zwaziland 7-11 May 2001.
Bernar, J., Hanson, R. A., Kern, R., Phoenix, B., Shaw, K.N.F. and Cederbaum, S. D. (1986).
Journal of Pediatrics, 108, 432-435
Berkowitz, D.E, White, R., Li, D., Minhas, K.M., Cernetich, A., Kim, S., Burke, S., Shoukas,
A.A., Nyhan, D., Champion, H.C., Hare, J. (2003). Arginase reciprocally regulates nitric
oxide synthase activity and contributes to endothelial dysfunction in aging blood vessels.
Circulation Research, 108, 2000 –2006
References
132
Boutin J.P. (1982). Purification, properties, and subunit structure of the arginase from iris
bulbs. European Journal of Biochemistry, 127, 237–243
Bowers, G.N. Jr, Fassett, J.D., White, E. (1993). Isotope dilution mass spectrometry and the
National Reference System. Analytical Chemistry, 65(12), 475 – 479
Butin, J.P. (1982). Purification, properties and subunit structure of arginase from Iris bulbus.
European Journal of Biochemistry, 127, 237-243
Brosnan, J.T. (2000). Glutamate, at the interface between amino acid and carbohydrate
metabolism. Journal of Nutrition, 130(4), 988-990
Brown, G. W., Jr. (1966). Studies in comparative biochemistry and evolution. I. Avian liver
arginase. Archives of Biochemistry and Biophysics, 114, 184–194
Brown, M.S., Segal, A., and Stadtman, E.R. (1971). Modulation of glutamine synthetase
adenyltlation and deadenylylation is mediated by metabolic transformation of P II –
regulatory protein. Proceedings of the National Academy of Science, 68(12), 2949 -2953
Brusilow, S.W., and Horwich, A.L. (2001). Urea cycle enzymes, in: C.R. Scriver, A.L.
Beaudet, D. Valle, W.S. Sly, B. Vogelstein, B. Childs, K.W. Kinzler (Eds.), The Metabolic
and Molecular Bases of Inherited Disease, eighth ed., McGraw-Hill, New York, 2001, pp.
1909–1963
Buscur, L., Cabellow, J., Veliz, M., and Gonzalez, A. (1966). Molecular forms of human
liver arginase. Biochemica et Biophysica Acta, 128,149-154
Cahill, G.F. Jr. (1970). Starvation in man. New England Journal of Medicine, 282, 668-675
Caldwell, M.D. (1989). Local glutamine metabolism in wounds and inflammation.
Metabolism, 38, 34-39
Carvajal, N., Ascoria, M., Rodriguez, J.P., Fernandez, M., Martinez, J. (1982). Evidence of
cooperative effects in human liver arginase. Biochimica et Biophysica Acta, 701, 146-148

References
133
Cederbaum, S.D., Yu, H., Grody, W.W., Kern, R.M., Yoo, P., Iyer, R.K. (2004). Arginase I
and II: do their functions overlap? Medical Genetics & Metabolism, 81 (suppl 1), 38-44
Chimonyo, M., Hamudikuwana, H., Kusina, N.T., Ncube, I. (2002). Changes in stress-related
plasma metabolite concentrations in working Mashona cows on dietary supplementation.
Livestock Production Science, 73, 165-173
Chiu, J. F., and Boeker, E. A. (1979). Cow brain glutaminase: partial purification and
mechanism of action. Archives of Biochemistry and Biophysics, 196(2), 493-500
Cirio, A., and R. Boivin. (1990). Extraction renale du para-aminohippurate et de l‟inuline
chez le mouton carence en proteines. Annales de Recherches Veterinaires, 21, 167–170
Cohen, P. P. (1962). Carbamyl group synthesis In: Boyer, P.D., Lardy, H. and Myrback, K.,
(ed.) The Enzymes, 2nd
edn (pp. 477 - 494), Academic Press, New York.
Collins-Lusweti, E. (2000). Performance of Nguni, Afrikaner and Bonsmara cattle under
drought conditions in North West province of Southern Africa. South African Journal of
Animal Science, 30 (1), 33-38
Cooper, A.J. (2001). Role of glutamine in cerebral nitrogen metabolism and ammonia
neurotoxicity. Mental Retardation and Developmental Disabilities Research Reviews, 280–
286
Cox, J. D., Kim, N. N., Traish, A. M. and Christianson, D. W. (1999). Arginase-boronic acid
complex highlights a physiological role in erectile function. Nature Structural Biology, 6,
1043 – 1047
Cox, J.D., Cama, E., Colleluori, D.M., Pethe, S., Boucher, J.L., Mansuy, D., Ash, D.E., and
Christianson, D.W. (2001). Mechanistic and metabolic inferences from the binding of
substrate analogues and products to arginase. Biochemistry, 40(9), 2689 - 2701

References
134
Cox, J. D., Kim, N. N., Traish, A. M., and Christianson, D. W. (1999) Nature Structural
Biology, 6, 1043–1047
Crombez, E.A., and Cederbaum, S.D. (2005). Hyperargininemia due toliver arginase
deficiency. Molecular Genetics and Metabolism, 84, 243–251
Cromwell, G. L. (1996). Synthetic amino acid may improve performance, reduce nitrogen
excretion. Feedstuffs, 68(49), 12–31
Curthoys, N.P., and Weiss, R.F. (1974). Regulation of Renal Ammoniagenesis Subcellular
Localization of Rat Kidney Glutaminase Isoenzymes. Journal of Biological Chemistry,
249(10), 3261-3266
Curthoys, N.P. and Kuhlenschmidt, T., Godfrey, S.S. (1976). Regulation of renal
ammoniagenesis, purification and characterization of phosphate-dependent glutaminase from
rat kidney. Archives of Biochemistry and Biophysics, 174, 82 – 89
Curthoys, N.P., and Gstraunthaler, G. (2001). Mechanism of increased renal gene expression
during metabolic acidosis. American Journal of Physiology & Renal Physiology, 281, 381–
390
Cynober, L., Le Boucher, J., and Vasson, M. (1995). Arginine metabolism in mammals:
Review. Nutritional Biochemistry, 6, 402 - 413
Dabir, S., Dabir, P., and Somvanshi, B. (2005). Purification, properties and alternate substrate
specificities of arginase from two different sources: Vigna catjang cotyledon and buffalo
liver. International Journal of Biological Sciences, 1 (3), 114 - 122
Davis, R.H. and Mora, J. (1968). Utilization of Exogenous and Endogenous Ornithine by
Neurospora crassa. Journal of Bacteriology, 96, 383 - 388
De Bandt, J.P., Cynober, L., Lim, S.K., Coudray-Lucas, C., Poupon, R., and Giboudeau, J.
(1995). Metabolism of omithine, a-ketoglutarate and arginine in the isolated perfused rat
liver. Journal of Nutrition, 73, 227 - 239

References
135
de la Rosa, V., Campos-Sandoval, J.A., Martin-Rufia, M., Cardona, C., Mates, J.M., Segura,
J.A., Alonso, F.J. and Marquez, J. (2009). A novel glutaminase isoform in mammalian
tissues. Neurochemistry International, 55, 76 – 84
Denman, R. B., and Wedler, F. C. (1984). Association-dissociation of mammalian brain
glutamine synthetase: effects of metal ions and other ligands. Archives of Biochemistry and
Biophysics, 232, 427 - 440
Deuel, T. F., Louie, M., and Lerner, A. (1978). GS from rat liver. Purification, properties and
preparation of specific antisera. Journal of biological chemistry, 253, 6111 - 6118
Drotman, R.B. and Freedland, R.A. (1972). Citrulline metabolism in the perfused rat liver.
Annual Journal of Physiology, 222, 973 - 975
Dura, M.A., Flores, M., Toldra, F. (2004). Effects of curing agents and the stability of a
glutaminase from Debaryomyces spp. Food Chemistry, 86, 385 – 389
Dura, M.A., Flores, M., Toldra, F. (2002). Purification and characterisation of a glutaminase
from Debaryomyces spp. International Journal of Food Microbiology, 76, 117 – 126
Durante, W., Johnson, F.K., Johnson, R.A. (2007). Arginase: a critical regulator of nitric
oxide synthesis and vascular function. Clinical & Experimental Pharmacology & Physiology,
34, 906 - 911
Edlbacher, S. and Baur, H. (1958). The nature of yeast and liver arginase. Hoppe-Seyler‟s Z.
Physiology & Chemistry, 254, 275 – 284
Eisenberg, D., Gill, H.S., Pfluegl, G.M., and Rotstein, S.H. (2000). Structure-function
relationships of glutamine synthetases. Biochimica et Biophysica Acta, 1477, 122–145.
Epstein, H. (1971). The origin of domestic animals in Africa. Vol. 1, Africana Publishing
Corporation, New York.

References
136
Esch, F., Lin, K.I., Hills, A., Zaman, K., Baraban, J.M., Chatterjee, S., Rubin, L., Ash, D.E.,
and Ratan, R.R. (1998). Arginase is a Multipotent Inhibitor of Neuronal Apoptosis. Journal
of Neuroscience, 18(11), 4083 – 4095
Elliot, K. R. F., and K. F. Tipton. (1973). Purification and characterization of carbamoyl
phosphate synthetase from beef liver. FEBS Letters, 37, 79 - 81
Elliott, K. R. F., and Tipton, K. F. (1974). Kinetic Studies of Bovine Liver Carbamoyl
Phosphate Synthetase. Biochemical Journal, 141, 807 - 816
Engel, P.C., and Dalziel, K. (1970). Kinetic Studies of Glutamate Dehydrogenase:
The Reductive Amination of 2-Oxoglutarate. Biochemistry Journal, 118, 409 - 419
Fang, J., Hsu, B.Y.L., MacMulien, C.M., Poncz, M., Smith, T.J., and Stanley, C.A. (2002).
Expression,purification and characterization of human glutamate dehydrogenase (GDH)
allosteric regulatory mutations. Biochemical Journal, 363, 81 - 87
Figueroa, J.L., Lewis, A.J., Miller, P.S., Fischer, R.L., Gómez, R.S., and Diedrichsen, R.M.
(2002). Nitrogen metabolism and growth performance of gilts fed standard corn-soybean
meal diets or low-crude protein, amino acid-supplemented diets. Journal of Animal Science,
80, 2911 - 2919
Fuller, A. (2006). The sacred hide of Nguni; the rise of an ancient breed of cattle is giving
South Africa new opportunity. Miracles that are changing the Nation. Industrial Development
Corporation (IDC). Newsletter. pp. 3 - 4
Gass, J. D., and Meister, A. (1970). A computer analysis of the active site of glutamine
synthetase. Biochemistry, 9, 1380 - 1390
Garnier, A., Berredjem, A., and Botton, B. (1997). Purification and Characterization of the
NAD-Dependent Glutamate Dehydrogenase in the Ectomycorrhizal Fungus Laccaria bicolour
(Maire) Orton. Fungal Genetics and Biology, 22, 168 - 176

References
137
Gebhardt, R. and Mecke, D. (1983). Heterogenous distribution of glutamine synthetase
among rat liver paranchymal cells in situ and in primary culture. EMBO Journal, 2(4), 567 -
570
Gelehrter, T. D., and Snodgrass, P.J. (1974). Lethal neonatal deficiency of carbamoyl
phosphate synthetase. New England Journal of Medicine, 290, 430 - 433
Gelfand, M.D., Spiro, H.M., and Herskovic, T. (1968). Small intestine glutaminase
deficiency in celiac disease. American Journal of Digestive Diseases, 13(7), 638 - 642
George, A.K., and Harold, J.S. (1973). Isolation and characterization of arginase from rabbit
liver. Biochemical Journal, 133, 779 - 788
Godinot, C., Julliard, J. H. and Gautheron, D. C. (1974). A rapid and efficient new method of
purification of glutamate dehydrogenase by affirnity chromatography on GTP-Sepharose.
Analytical Biochemistry, 61, 264-270
Goldstein, L. (1966). Relationship of glutamate to ammonia production in the rat kidney.
American Journal of Physiology, 210, 661 - 666
Goldstein, L. (1967). Pathways of glutamine deamination and their control in the rat kidney.
American Journal of Physiology, 213, 983 - 989
Guha, S.R. (1961). Intracellular localization of glutaminase I in rat liver. Enzymologia,
23, 94 - 100
Hambleton, P., Benbough, J.E., Baskerville, A., Harris-Smith, P.W. (1980). Clinical
biochemical aspects of glutaminase toxicity in rabbits and Rhesus monkeys. British Journal
of Experimental Pathology, 61, 208 - 216
Hankard, R. G., Haymond, M.W., and Darmaun, D. (1996). Effect of glutamine on leucine
metabolism in humans. American Journal of Physiology, 271(34), 748 – 754

References
138
Hanotte, O., Okomo, M., Bradley, D., Verjee, Y., Ochieng, A., Teale, A., and Rege, J.E.O.
(1998). Geographical distribution and frequency of taurine Bos taurus and zebu B.indicus Y
chromosome haplotypes amongst sub-Saharan African cattle breeds. Proceedings of the 4th
Global Conference on Conservation of Domestic Animals and Genetic Resources., Nepal, 17-
21 Aug.
Hanotte, O., Tawah, C.L., Bradley, D.G., Okomo, M., Verjee, Y., Ochieng, J., and Rege,
J.E.O. (2000). Geographic distribution and frequency of a taurine Bos Taurus and an indicine
Bos indicus Y specific allele amongst sub-Saharan African cattle breeds. Molecular Ecology,
9, 387 – 396
Haser, W.G., Shapiro, R.A., Curthoys, N.P. (1985). Comparison of the phosphate-dependent
glutaminase obtained from rat brain and kidney. Biochemical Journal, 229, 399 - 408
Hartman, S.C. (1968). Glutaminase of Escherichia coli: III. Studies of the reaction
mechasism. Journal of Biological Chemistry, 243(5), 870 – 878
Haussinger, D. and Sies, H. (1979). Hepatic glutamine metabolism under the influence of the
portal ammonia concentration in the perfused rat liver. European Journal of Biochemistry,
101, 179 - 184
Havlis, J., Thomas, H., Sebela, M. and Shevchenko, A. (2003). Fast-response proteomics by
accelerated in-gel digestion of proteins. Analitical Chemistry, 75, 1300 –1306
Haussinger, D., Meijer, A.J., Gerok, W., and Sies, H. (1988). Hepatic nitrogen metabolism
and acid-base homeostasis. In pH Homeosrasis (D. Hlussinger, ed.), Academic Press,
London, p. 337 - 378
Haussinger, D., and Gerok, W. (1988). Urea synthesis and pH regulation. Atlas Science:
Biochemistry & molecular biology, 1, 65 - 70
He, Y.X., Gui, L., Liu, Y.Z., Du, Y., Zhou, Y., Li, P., and Zhou, C.Z. (2009). Crystal
structures of Saccharomyces cerevisiae glutamine synthetase Gln1 suggests a nano-tube-like
supra-molecular assembly. Proteins, 76, 249 – 254

References
139
Heini, H.G., Gebhardt, R., Brecht, A., and Mecke, D. (1987). Purification and
characterization of rat liver glutaminase. European Journal of Biochemistry, 162, 541 - 546
Hiller, R. G. (1964). Studies on the incorporation 14
CO2 into glutamic acid in Chlorella
pyrenoidosa. Phytochemistry. 3(5), 569 - 575
Hirsch-Kolb, H., Heine, J.P., Kolb, H.J., and Greenberg, D.M. (1970). Comparative physical
and chemical studies of mammalian arginase. Computational Biochemistry and Physiology,
37, 345 - 359
Hoffmann, I. (2010). Livestock biodiversity. Rev. Sci. Tech. Off. Int. Epiz., 29(1), 73 – 86
Hong, J., W. L., Salo, C. J., Lusty, and Anderson, P.M. (1994). Carbamyl phosphate
synthetase III, an evolutionary intermediate in the transition between glutamine-dependent
and ammonia-dependent carbamyl phosphate synthetases. Journal of Molecular Biology, 243,
131 - 140
Horowitz, M.L., and Knox, W.E. (1968). A phosphate activated glutaminase in rat liver
different from that in kidney and other tissues. Enzymologia Biologia et Clinica, 9(4), 241 -
255
Hoshide, R., Matsuura, T., Haraguchi, Y., Endo, F., Yoshinaga, M., and Matsuda, I. (1993).
Carbamoyl Phosphate Synthetase I Deficiency: One Base Substitution in an Exon of the CPS
I Gene Causes a 9-Basepair Deletion due to Aberrant Splicing. Journal of Clinical
Investigation, 91, 1884 - 1887
Houpt, T. R. (1959). Utilization of blood urea in ruminants. Annual Journal of Physiology,
197,115 - 120
Huang, Y.Z., and Knox, W.E. (1976). A comparative study of glutaminase isozymes in rat
tissues. Enzymes. 21 (5), 408 – 426

References
140
Hudson, R.C., and Daniel, R.M. (1993). L-glutamate dehydrogenases: distribution, properties
and mechanism. Comparative biochemistry and physiology B, 106(4), 767 - 792
Hunt, J. B., Smyrniotis, P. Z., Ginsburg, A., and Stadtman, E. R. (1975). Metal ion
requirement by glutamine synthetase of Escherichia coli in catalysis of gamma-glutamyl
transfer. Archives of Biochemistry and Biophysics, 166, 102 - 124
Huntington, G.B., Burns, J.C., and Archibeque, S.L. (2007). Urea metabolism in beef steers
grazing Bermudagrass, Caucasian blurstem, or gamagrass pastures varying in plant
morphology, protein content, and protein composition. Journal of Animal Science, 85(8),
1997 - 2004
Holcenberg, J.S., Ericsson, L. and Roberts, J. (1978). Amino acid sequence of the
diazooxonorleucine binding site of Acinetobacter and Pseudiomonas 7A glutaminase-
asparaginase enzymes. Biochemistry, 17, 411 - 417
Ikemoto, M., Tabata, M., Miyake, T., Kono, T., Mori, M., Totani, M., and Murachi, T.
(1990). Expression of human liver arginase in Escherichia coli: Purification and properties of
the product. Biochemical Journal, 270, 697 - 703
Imada, A., Igarasi, S., Nakahama, K., Isono, M. (1973). Asparaginase and glutaminase
activities of micro-organisms. Journal of General Microbiology, 76, 85 – 99
Ip, S. M., Rowell, P., and Stewart, W. D. P. (1983). The role of specific cations in regulation
of cyanobacterial GS. Biochemical and Biophysical Research Communication, 114, 206 - 213
Iyer, R., Jenkinson, C.P., Vockley, J.G., Kern, R.M., Grody, W.W., And Cederbaum, S.
(1998). The human arginases and arginase deficiency. Journal of Inherited Metabolic
Disease, 21 (1), 86 - 100
Janssen, D.B., Camp, H.J.M., Pieter J. M. Leenen, P.J.M. and van der Drift, C. (1980). The
Enzymes of the Ammonia Assimilation in Pseudomonas aeruginosa. Archives of
Microbiology. 124, 197 - 203

References
141
Jenkinson, C. P. and Grigor, M. R. (1994). Rat mammary arginase: Isolation and
characterization. Biochemical Medicine Metabolic Biology, 51, 156 – 165
Jenkinson, C.P., Grody, W.W., Cedarbaum, S.D. (1996). Comparative properties of arginase.
Computational Biochemistry Physiology, 114B, 107 – 132
Jepson, M. M., Bates, P.C., Broadbent, P., Pell, J.M., and Millward, D.J. (1988). Relationship
between glutamine concentration and protein synthesis in rat skeletal muscle. Ammerican
Journal of Physiology, 255, 66 – 172
Joerink, M., Savelkoul, H.F., and Wiegertjes, G.F. (2006). Evolutionary Conservation of
Alternative Activation of Macrophages: Structural and Functional Characterization of
Arginase 1 and 2 in Carp (Cyprinus carpio L.). Molecular Immunology, 43, 1116 – 1128
Johnson, F.K., Johnson, R.A., Peyton, K.J., Durante, W. (2005). Arginase inhibition restores
arteriolar endothelial function in Dahl rats with salt-induced hypertension. American Journal
of Physiology Regulatory, Integrative and Comparative Physiology, 288, 1057 – 1062
Jones, M. E. (1965). Amino acid metabolism. Annual Reviews of Biochemistry, 34, 381
Joseph, S. K. and McGivan, J. D. (1978). The effects of ammonium chloride and bicarbonate
on the activity of glutaminase in isolated liver mitochondria. Biochemical Journal, 176, 837 -
8844
Juurlink, B. H. J. (1982). GS and glutamyltransferase activities in the mouse astrocyte in
vitro. Neurochemical Research, 7, 905 - 910
Kalman, S. M., Duffield, P. H., and Brzozowski, T. (1965). Carbamyl phosphokinase and an
activity which catalyses amino group transfer from glutamine to ornithine in citrulline
synthesis. Biochemical and Biophysical Research Communication, 18, 530
Karlberg, T., Thangavelu, K., Pan, C.Q., Balaji, G., Uttamuchandani, M., Suresh, V.,
Sivharama, J. (2012). Structural basis for the allosteric inhibitory mechanism of human

References
142
kidney-type glutaminase (KGA) and its regulation by Raf-Mek-Erk signaling in cancer cell
metabolism. Proceeding of the National Academy of Science, 109, 7705 - 7710.
Kanyo, Z.F., Scolnick, L.R., Ash, D.E., and Christianson, D.W. (1996). Structure of a unique
binuclear manganese cluster in arginase. Nature, 383, 554 - 557
Kaysen, G. A. and Strecker, H. J. (1973). Purification and properties of arginase of rat
kidney. Biochemical Journal, 133, 779 – 788
Keast, D., and Morton, A.R. (1992). Long-term exercise and immnne function. In: Exercise
and Disease. pp. 89-120. CRC Press, Baton Rouge.
Kenny, J., Bao, Y., Hamm, B., Taylor, L., Toth, A., Wagers, B., and Curthoys, N.P. (2003).
Bacterial expression, purification, and characterization of rat kidney-type mitochondrial
glutaminase. Protein Expression and Purification, 31, 140 – 148
Kerson, L.A., and Appel, S.H. (1968). Kinetic studies on rat liver CPS. The Journal of
Biological Chemistry, 243(16), 4279 - 4285
Kerr, B. J., and R. A. Easter. (1995). Effect of feeding reduced protein, amino acid-
supplemented diets on nitrogen and energy balance in grower pigs. Journal of Animal
Science, 73, 3000 - 3008
King J.E., Gifford D.J. (1997). Amino acid utilization in seeds of loblolly pine during
germination and early seedling growth. I. Arginine and arginase activity. Plant Physiology.
113, 1125 – 1135
Kleczkowski, K. (1965). L-Glutamine as donor of carbamoyl group nitrogen for the enzymic
synthesis of citrulline in green pea seedlings. Acta biochemistry, 12, 243
Kornegay, E. T., and Verstegen, M.W.A. (2001). Swine nutrition and environmental
pollution and odor control. In: A. J. Lewis and L. L. Southern (ed.) Swine Nutrition. 2nd ed.
p 609. CRC Press, Boca Raton, FL

References
143
Kovacevic, Z., and McGivan, J. D. (1983). Mitochondrial metabolism of glutamine and
glutamate and its physiological significance. Physiological Reviews, 63, 547 - 605
Kuhn, N. J., Talbot, J. and Ward, S. (1991). pH-Sensitive control of arginase by Mn(II) ions
at submicromolar concentrations. Archives of Biochemistry & Biophysics, 286, 217 – 221
Kuster, B., Schirle, M., Mallick, P., and Aebersold, R. (2005). Scoring proteomes with
proteotypic peptide probes. Nature Reviews. Molecular Cellular Biology, 6(7), 577 – 583
Krajewski, W.W., Collins, R., Holmberg-Schiavone, L., Jones, T.A., Karlberg, T., and
Mowbray, S.L. (2008). Crystal structures of mammalian glutamine synthetases illustrate
substrate-induced conformational changes and provide opportunities for drug and herbicide
design. Journal Molecular Biology. 375, 217 – 228
Krebs, H. A. (1935). Metabolism of amino-acids: The synthesis of glutamine from glutamic
acid ammonia, and the enzymic hydrolysis of glutamine in animal tissue. Biochemical
Journal, 29, 1951-1969
Krebs, H.A. (1980). Glutamine metabolism in the animal body. In: Mora, J., and Palacios, R.
(ed.), Glutamine metabolism, enzymology and regulation. pp. 319 - 329. New York:
Academic Press.
Kvamme, E., Tveit, B., and Svenneby, G. (1970). Glutaminase from pig renal cortex. I.
Purification and general properties. Journal of Biological Chemistry, 245(8), 1871 - 1877
Kvamme, E. and Torgner, I.A. (1974). Phosphate dependent effects of palmityl-CoA and pig
brain and pig kidney glutaminase. FEBS Letters, 47, 244 - 247
Kvamme, E., Svenneby, G., and Torgner, I. A. (1988). In: Kvamme, E., ed. Glutamine and
Glutamate in Mammals. (pp. 53 - 67). CRC Press, Inc., Boca Raton, FL
Kvamme, E., Torgner, I.A., and Roberg, B. (2001). Kinetics and localization of brain
phosphate activated glutaminase. Journal of Neuroscience Reserach, 66 (5), 951 – 958
References
144
Laake, J.H., Takumi, Y., Eidet, J., Torgner I.A., Roberg, B., Kvamme, E., and Ottersen, O.P.
(1999). Postembedding immunogold labelling reveals subcellualar localization and pathway
specific enrichment of phosphate activated glutaminase in rat cerebellum. Neuroscience, 88
(4), 1137 - 1151
Labow, B.I., Souba, W.W. and Abcouwer, S.F. (2001). Mechanisms governing the
expression of the enzymes of glutamine metabolism – glutaminase and glutamine synthetase.
Journal of Nutrition, 131, 2467 – 2474
Lacey, J. M., and Wilmore, D.W. (1990). Is glutamine a conditionally essential amino acid?
Nutrition Reviews, 48, 297 – 309
Laemmli, U.K. (1970). Cleavage of structural proteins during the assembly of the head of the
bacteriophage T4. Nature; 227, 680 - 685
Lai, M.C., Sowers, K.R., Robertson, D.E., Roberts, M.F., and Gunsalus, R.P. (1991).
Distribution of compatible solutes in the halophilic methanogenic archaebacteria. Journal of
Bacteriology, 173, 5352 – 5358
Lawson, F.S., Charlebois, R.L., and Dilloni, J.R. (1996). Phylogenetic analysis of
carbamoylphosphate synthetase genes: complex evolutionary history includes an internal
duplication within a gene which can root the tree of life. Molecular biology and Evolution,
13(7), 970 - 977
Leng, L., M. Szanyiova, and K. Boda. (1985). The renal response of sheep to a low dietary
nitrogen intake. Physiology, 34, 147 – 154
Le Roux, G.J.G., Swart, J.S., Oosthuhysen, C., Tretheway, C., Pittaway, C., and Daines, T.
(1999). Factors affecting cattle performance on Coast-cross 2 at different stocking and
fertilizer rates. South African Journal of Animal Science, 29(2), 112 - 122
Levenberg, B. (1962). Role of L-glutamine as donor of carbamoyl nitrogen for the enzymatic
synthesis of citruline in Agaricus bisporus. Journal of Biological Chemistry, 237, 2590

References
145
Levine, R. L., Oliver, C. N., Fulks, R. M. and Stadtman, E. R. (1981). Turnover of bacterial
glutamine synthetase: oxidative inactivation precedes proteolysis. Proceedings of the
National Academy of Science, U.S.A. 78, 2120 - 2124
Li, H., Meininger, C. J., Hawker, J. R., Jr., Haynes, T. E., Kepka-Lenhart, D., Mistry, S. J.
(2001). Regulatory role of arginase I and II in nitric oxide, polyamine, and proline syntheses
in endothelial cells. American Journal of Physiology, Endocrinology and Metabolism, 280(1),
75 - 82
Linington, M.J. and Osler, H., (1992). Blood glucose and urea levels in Bonsmara, Brahman
and Nguni cows grazing in the far northern Transvaal. Proceedings of the lst Annual
Congress SASAP, April 1992. Zithabiseni, Kwandebele.
Listrom, C.D, Morizono, H., Rajagopal, B.S., Mccann, M.T., Tuchman, M. and Allewell,
N.M. (1997). Expression, purification, and characterization of recombinant human GS.
Biochemical Journal, 328, 159 - 163
Lobley, G.E. (1992). Control of the metabolic fate of amino acids in ruminants: a review.
Journal of Animal Sciences, 70, 3264 - 3275
Louis, C. A., Reichner, J. S., Henry, W. L., Mastrofrancesco, B., Gotoh, T., Mori, M. and
Albina, J. E. (1998). Distinct arginase isoforms expressed in primary and transformed
macrophages: Regulation by oxygen tension. American Journal of Physiology, 274, 775 - 782
Lund, L., Fan, Y., Shao, Q., Gao, Q.Y., and Raushel, F.M. (2010). Carbamate Transport in
Carbamoyl Phosphate Synthetase: A Theoretical and Experimental Investigation. Journal of
the American Chemical Society, 132, 3870 – 3878
Lusty, C. J. (1983). The molecular structure and function of carbamoyl phosphate synthetase
I. Transactions of the New York Academy of Science, 41, 103 – 115
Lusty, C. J. (1978). Carbamoylphosphate Synthetase I of Rat-Liver Mitochondria
Purification, Properties, and Polypeptide Molecular Weight. European Journal of
Biochemistry, 85, 373 - 383

References
146
MacLennan, P., Brown, R., and Rennie, M.A. (1989). A positive relationship between protein
synthetic rate and intracellular glutamine concentration in perfused rat skeletal muscle. FEBS
Letters, 215, 187 – 191
Marais, A.L., and Van der Walt, J.G. (1983). Homeorhetic hormones, metabolites and
accelerated growth. Suid Afrikaanse Tydskrif Veek, 13(1), 76 - 78
Mapiye, C., Chimonyo, M., Muchenje, V., Dzama, K., Marufu, M.C., Raats, J.G. (2007).
Potential for value-addition of Nguni cattle products in the communal areas of South Africa:
a review. African Journal of Agricultural Research, 2(10), 488 - 495
Marini, J. C., and Amburgh, M. E. (2003). Nitrogen metabolism and recycling in Holstein
heifers. Journal of Animal Science, 81, 545 - 552
Matsubara S., Suzuki S. (1984). Arginase activity in the cotyledons of soybean seedlings,
Plant physiology 62, 309 – 314
Mandelstam, J., and Yudkin, J. (1952). Studies in biochemical adaptation. The effect of
variation in dietery protein upon the hepatic arginase of the rat. Biochemical Journal, 51, 681
- 690
Marescau, B., De Deyn, P.P., Qureshi, I.A., De Broe, M.E., Antonozzi, I., Cederbaum, S.D.,
Cerone, R. (1992). The pathobiochemistry of uremia and hyperargininemia further
demonstrates a metabolic relationship between urea and guanidinosuccinic acid. Metabolism,
41, 1021 - 1024
Marshall, M., Metzenberg, R. L. and Cohen, P. P. (1958). Carbamoyl phosphate synthetase:
Studies on the mechanism of action. Journal of Biological Chemistry, 233, 102
Marshall, M., Metzenberg, R. L. and Cohen, P. P. (1961). The synthesis of carbamoyl
phosphate synthetase in thyroxin treated tadpoles. Journal of Biological Chemistry, 236, 2229

References
147
Matthews, S. L., Anderson, P. M. (1972). Evidence for the presence of two nonidentical
subunits in carbamoyl phosphate synthetase of Escherichia coli. Biochemistry, 11, 1176–
1183
Marshall, M. (1976) in The Urea Cycle (Grisolia, S., Baguena, R. and Mayor, F., eds) pp. 133
-141, John Wiley and Sons, New York.
Marshall, M. (1976). Carbamoyl-phosphate synthetase from frog liver. (pp. 133 -142) In:
Grisolia, S., Baguena, R., and Mayor, E., (eds). The urea cycle. John Wiley and Sons, New
York.
Magasanik, B., Prival, M. J., Brenchley, J. E., Tyler, B. M., DeLeo, A. B., Streicher, S. L.,
Bender, R. A., Paris, C. G. (1974). GS as a regulator of enzyme synthesis. Current topics in
cellular regulation, 8, 119 - 138
Maurizi, M. R., and Ginsburg, A. (1982b). Active site ligand stabilization of quaternary
structures of glutamine synthetase from Escherichia coli. Journal of biological chemistry,
257(7), 246 - 251
Maurizi, M. R., Pinkofsky, H. B., McFarland, P. J., and Ginsburg, A. (1987). Mg2+
is bound
to GS extracted from bovine or ovine brain in the presence of L-methionine-S-sulfoximine
phosphate. Archives of Biochemistry and Biophysics, 246, 494 - 500
Magasanik, B., Prival, M. J., Brenchley, J. E., Tyler, B. M., DeLeo, A. B., Streicher, S. L.,
Bender, R. A., Paris, C. G. (1975). GS as a regulator of enzyme synthesis. Current Topics in
Developmental Biology, 8, 119 - 138
McCarthy, A.D., Walker, J.M., and Tipton, K.F. (1980). Purification of Glutamate
Dehydrogenase from Ox brain and liver: Evidence that commercially available preparations
of the enzyme from Ox liver have suffered proteolytic cleavage. Biochemical Journal, 191,
605-611
McCauley, R., Kong, S., Heel, K., Hall, J.C. (1999). Review: The role of glutaminase in the
small intestine. International Journal of Biochemistry and Cell Biology, 31(3-4), 405 - 413

References
148
McClellan, W. S., and Hannon, B.E. (1932). Clinical calorimetry. XLVIII. Nitrogen
equilibrium with a low-protein diet. Journal of Biological Chemestry, 95, 327
McGivan, J.D., Lacey, J.H., and Joseph, S.K. (1980). Localization and some properties of
phosphate-dependent glutaminase in disrupted liver mitochondria. Biochemical Journal, 192,
537 - 542
McGivan, J.D., and Bradford, N.M. (1983). Characteristics of the activation of glutaminase
by ammonia in sonicated rat liver mitochondria. Biochemica et Biophysica Acta, 759(3), 296-
302
McLeod, M. N. (1974). Plant tannins: Their role in forage quality. Nutrition Abstracts and
Reviews, 44, 803 - 815
Medina, M.A. (2001). Glutamine and cancer. Journal of Nutrition, 131, 2539 – 2541
Meister, A. (1980). Catalytic mechanism of GS: overview of glutamine metabolism. In:
Mora, J., and Palacios, R. (ed.), Glutamine metabolism, enzymology and regulation. (pp. 1 –
40). New York: Academic Press.
Meister, A. (1984). Enzymology of glutamine. In: Haussinger, D. and Sies, H., (ed.).
Glutamine Metabolism in Mammalian Tissues (pp. 3 – 15). Springer-Verlag, Berlin
Michael R. Maurizi, M.R., Pinkofsky, H.B., and Ginsburg, A. (1987). ADP, Chloride Ion,
and Metal Ion Binding to Bovine Brain GS. Biochemistry, 26, 5023 - 5031
Miflin, B.J., and Habash, D.Z. (2002). The role of GS and glutamate dehydrogenase in
nitrogen assimilation and possibilities for improvement in the nitrogen utilization of crops.
Journal of Experimental Botany, 53(370), 979 – 987
Mitchell, H. (1926). Determination of the protein requirements of animals and of the protein
values of farm feeds and rations. Bulletin of the National Research Council, 55

References
149
Mitchell, A. P., and Magasanik, B. (1983). Purification and properties of GS from
Saccharomyces cerevisiae. Journal of biological chemistry, 258, 119 - 124
Mithieux, G. (2001). New data and concepts on glutamine and glucose metabolism in the gut.
Current Opinion in Clinical Nutrition and Metabolic Care, 4, 267 – 271
Mpofu, N. (2002a). Comparison of indigenous and foreign cattle for beef production at
Matopos Research Station in Zimbabwe. ZaBelo Livestock Consultancy Report, , Bulawayo,
Zimbabwe
Mpofu, N. (2002b). The multiplication of Africa‟s indigenous cattle breeds internationally:
The story of the Tuli and Boran breeds. ZaBelo Livestock Consultancy Report, Bulawayo,
Zimbabwe
Moncada, S., Palmer, R.M.J., and Higgs, E.A. (1989). Biosynthesis of nitric oxide from L-
arginine. A pathway for the regulation of cell function and communication. Biochemical
Pharmacology. 38, 1709 - 1715
Morimoto, B.H., Brady, J.F., and Atkinson, D.E. (1990). Effect of level dietary protein on
arginine-stimulated citrulline synthesis. Correlation with mitochondrial N-acetylglutamate
concentrations. Biochemical Journal, 272, 671 - 675
Mould, E.D., and Robbins, C.T. (1981). Nitrogen metabolism in Elk. The Journal of Wildlife
Management, 45(2), 323 - 334
Morris, S.M. (1998). Arginine synthesis, metabolism, and transport: regulators of nitric oxide
synthesis. In: Cellular and molecular biology of nitric oxide (Laskin, J.D., Laskin, D.L., eds).
Monticello, NY: Dekker.
Mora, J., Tarrab, R., Martuscelli, J. and Soberon, G. (1965). Characteristics of arginase from
ureotelic and non-ureotelic animals. Biochemical Journal, 96, 588 – 594
Morris, S.M. Jr. (2007). Arginine metabolism: boundaries of our knowledge. Journal of
Nutrition, 137, 1602 – 1609

References
150
Mori, M., and Gotoh, T. (2000). Regulation of arginine metabolic enzymes. Biochemical
Biophysical Research Communication, 275, 715 – 719
Morris, S.M., Bhamidipati, D., and Kepka-Lenhart, D. (1997). Human Type Arginase:
Sequence Analysis and Tissue Specific Expression. Gene, 193, 157 – 161
Muchenje, Dzama, K., Chimonyo, M., Raats, J.G. Strydom, P.E. (2008). Meat quality of
Nguni, Bonsmara and Aberdeen Angus steers raised on natural pasture in the Eastern Cape,
South Africa. Meat Science, 79, 20 – 28
Ndolo, R.A., Forrest, M.L. and Krise, J.P.. (2010). The Role of Lysosomes in Limiting Drug
Toxicity in Mice. The Journal of Pharmacology and Experimental Therapeutics 333, 120 –
128
Nimmo, G.A., and Tipton, K.F. (1981). Kinetic Comparisons between Soluble and
Membrane-Bound Glutaminase Preparations from Pig Brain. European Journal of
Biochemistry, 117, 57 - 64
Nissim, I. (1999). Newer aspects of Glutamine/Glutamate metabolism: the role of acute pH
changes. American Journal of Physiology and Renal Physiology, 277, 493 - 497
Norenberg, M. D. (1979). The distribution of glutamine synthetase in the rat central nervous
system. Journal of Histochemistry and Cytochemestry, 27, 756 - 762
Orloff, J., And Burg, M. (1971). Kidney. Annual reviews of physiology, 33, 83 - 130
Orr, J., Keefer, L. M., Keim, P., Nguyen, T. D., Wellems, T., Heinrikson, R. L., and
Haselkorn, R. (1981). Purification, physical characterization and NHz-terminal sequence of
GS from the cyanobacterium Anabaena 7120. Journal of biological chemistry. 256,13091 -
13098
References
151
O'Neal, T.D., and Naylor, A.W. (1969). Partial Purification and Properties of Carbamoyl
Phosphate Synthetase of Alaska Pea (Pisum sativum L. cultivar Alaska): Purification and
General Properties. Biochemical Journal, 113, 271 – 279
Palmer, T., Oberholzer, V. G., Burgess, E. A,, Butler, L. J., and Levin, B. (1974).
Hyperammonaemia in 20 families. Biochemical and genetical survey, including
investigations in 3 new families. Archives of Disease in Childhood, 4(9), 443 - 449
Pamiljans, V., Krishnaswamy, P. R., Dumville, G., and Meister, A. (1962). Studies on the
mechanism of glutamine synthesis: Isolation and properties of the enzyme from sheep brain.
Biochemistry, 1, 153 - 158
Pan, S., Zhang, H., Rush, J., Eng, J., Zhang, N., Patterson, D., Comb, M.J., Aebersold, R.
(2005). High throughput proteome screening for biomarker detection. Molecular and Cellular
Proteomics, 4(2), 182 – 190
Patel, M., and McGivan, J.D. (1984). Partial purification and properties of rat liver
glutaminase. Biochemical Journal, 220(2), 583 - 590
Patil, N.B., Somvanshi, B.S., and Kothari, R.M. (1990). A simple and rapid high recovery
protocol for the purification of arginase. Biotechnology techniques, 4(2), 133 - 136
Parry-Billings, M., Budgett, R. and Koutedakis, Y. (1990). Plasma amino acid concentrations
in the overtraining syndrome; possible effects on the immune system. Medicine and Science
in Sports and Exercise, 24, 1353 - 1358
Perera, S.Y., Chen, T.C., and Curthoys, N.P. (1990). Biosynthesis and processing of renal
mitochondrial glutaminase in cultured proximal tubular epithelial cells and in isolated
mitochondria. Journal of biological chemistry, 265 (29), 17764 - 1777
Peterson, P.E., and Smith, T.J. (1999). The structure of glutamate dehydrogenase provides
insights into the mechanism of allostery. Structure, 7(7), 769 - 782
References
152
Phromphetcharat, V., Jackson, A., Dass, P.D. and Welbourue, T.C. (1981). Ammonia
partitioning between glutamine and urea: interorgan participation in metabolic acidosis.
Kidney International, 20, 590 - 605
Pierard, A., and Wiame, J. M. (1964). Regulation and mutation affecting a glutamine
dependent formation of carbamoyl phosphate in Escherichia coli. Biochemical and
Biophysical Research Communication, 16, 76
Pierard, A., Glansdorff, N., Mergeay, M., and Wiame, J.M. (1965). Control of the
biosynthesis of carbamoyl phosphate in Escherichia coli. Journal of Molecular Biology,
14(1), 23 - 36
Pierson, D. L., and J. M. Brien. (1980). Human carbamoylphosphate synthetase I.
Stabilization, purification, and partial characterization ofthe enzyme from human liver.
Journal of Biological Chemistry, 255, 7891 - 7895
Pishak, M. R., and Phillips, A. T. (1980). Glucocorticoid stimulation of GS production in
cultured rat glioma cells. Journal of Neurochemistry, 34, 866 - 872
Plug, I. (1980). Sulamano and Bulila 1, faunal remains from two early Iron Age sites in
Zambia, Unpublished report, Transvaal Museum, Pretoria.
Price, C. W., Holwell, J.H., and Abdelal, A.T.H. (1978). Purification and Properties of the
Arginine-specific Carbamoylphosphate Synthase from Saccharomyces cerevisiae. Journal of
General Microbiology, 106, 145 - 151
Purser, D.B. (1970). Nitrogen Metabolism in the Rumen: Microorganisms as a Source of
Protein for the Ruminant Animal. Journal of Animal Science, 30, 988 - 1001
Raats, J.G., Magadlela, A.M., Fraser, G.C.G., and Hugo, A. (2004). Re-introducing Nguni
nucleus herds in 100 communal villages of the Eastern Cape Province. A proposed co-
operative project between the University of Fort Hare, Agricultural and Development
Research Institute (ARDRI) and the East Cape Department of Agriculture and the Kellogg
Foundation, Unpublished report
References
153
Raijman, L., and Jones, M.E. (1976). Purification, composition, and some properties of rat
liver carbamoyl phosphate synthetase (ammonia). Archives of Biochemistry and Biophysics.
175, 270 - 278
Ramsay, K.A. (1985). The Nguni and its future in southern Africa, Lecture: Annual Nguni
Production Sale, Bartlow Combine, KwaZulu-Natal, 12 Sept., 1985.
Reczkowski, R. R. (1991). Characterization of the kinetic and catalytic mechanism of rat
liver arginase. Ph.D. Thesis, Temple University.
Reczkowski, R. S. and Ash, D. E. (1994) Rat liver arginase: kinetic mechanism, alternate
substrates, and inhibitors. Archives of Biochemistry and Biophysics, 312, 31 – 37
Rege, J.E.O. and Bester, J. (1998). Livestock resources and sustainable development in
Africa. In Proceedings of the 6th World Congress on Genetics Applied Livestock Production,
26, 19 – 26. Armidale, Australia.
Rege, J.E.O., (1999b). The state of African cattle genetic resources I. Classification
framework and identification of threatened and extinct breeds. Animal Genetics Resources.
25, 1 - 25
Rege, J.E.O., and Gibson, J.P. (2003). Animal genetic resources and economic development:
issues in relation to economic valuation. Ecological Economics, 45, 319 - 330
Rennie, M.J. (2011). Influence of exercise on protein and amino acid metabolism.
Comprensive physiology, (online), 995 - 1035
Revilla, I., and Vivar-Quitana, A.M. (2006). Effect of breed and ageing time on meat quality
and sensory attributes of veal calves of the “Ternera de Aliste” quality label. Meat science,
73, 189 - 195

References
154
Reyero, C., and Dorner, F. (1975) Purification of Arginases from Human-Leukemic
Lymphocytes and Granulocytes: Study of Their Physicochemical and Kinetic Properties.
European Journal of Biochemistry, 56, 137 - 147
Ritzhaupt, A., Wood, I. S., Jackson, A. A., Moran, B. J., and Shirazi-Beechey, S.P. (1998).
Isolation of a RT-PCR fragment from human colon and sheep rumen RNA with nucleotide
sequence similarity to human and rat urea transporter isoforms. Biochemical Society
Transaction, 26, 122
Rivers, J., Simpson, D.M., Robertson, D.H., Gaskell, S.J., Beynon, R.J. (2007). Absolute
multiplexed quantitative analysis of protein expression during muscle development using
QconCAT. Molecular and Cellular Proteomics, 6(8), 1416 – 1427
Rogers, Q.R. and Visek, W.J. (1985). Metabolic role of urea cycle intermediates: nutritional
and clinical aspects. Journal of Nutrition, 115, 505 - 541
Roholt, O. A. and Greenberg, D. M. (1956). Liver Arginase. IV. Effect of pH on kinetics of
manganese-activated enzyme. Archives of Biochemistry and Biophysics, 62, 454 – 470
Roman, W., and Ruys, J. (1969). Simple method for the estimation of l-ornithine. Journal
Clinical Enzyme, 2, 121 - 128
Ronzio, R. A., Rowe, W. B., Wilk, S., and Meister, A. (1969). Preparation and studies on the
characterization of sheep brain GS. Biochemistry, 8, 2670 - 2674
Robinson, P., Kelly, Neelon, K., Schreier, H.J., and Roberts, M.F. (2001). Glutamate as a
Substrate for GS. Applied and Environmental Microbiology, 67(10), 4458 – 4453
Robinson, M.M., Mcbryant, S.J., Tsukamoto, T., Rojas, C., Ferraris, D.V., Hamilton, S.K.,
Hansen, J.C., and Curthoys, N.P. (2007). Novel mechanism of inhibition of rat kidney-type
glutaminase by bis-2-(5-phenylacetamido-1,2,4-thiadiazol-2-yl)ethyl sulfide (BPTES).
Biochemical Journal, 406, 407 – 414

References
155
Rubio, V., Liorente, P., and Britton, H.G. (1998). Mechanism of csrbamoyl phosphate
synthtase from Escheria coli binding of the ATP molecules used in the reaction and
sequestration by the enzyme of the ATP molecule that yields carbamoyl phosphate. European
Journal of Biochemistry, 255, 262 – 270
Russell, A., B. Levin, V. G. Oberholzer, and L. Sinclair. (1962). Hyperammonaemia, a new
instance of an inborn enzymatic defect of the biosynthesis of urea. Lancet, 2(7258), 699 - 700
Saheki, T., Katsunuma, T., and Sase, M. (1977). Regulation of urea in rat liver. Journal of
Biochemistry, 82, 551-558
Saheki, T., Katsunuma, T., and Sase, M. (1977). Regulation of urea synthesis in rat liver.
Changes of ornithine and acetylglutamate concentrations in the livers of rats subjected to
dietary transitions. Journal of Biochemistry, 82(2), 551 - 558
Salimuddin, Nagasaki, A., Gotoh, T., Isobe, H. and Moti, M. (1999). Regulation of the genes
for arginase isoforms and related enzymes in mouse macrophages by lipopolysaccharide.
American Journal of Physiology, 277, 110 – 117
Sarantos, P., Ockert, K., and Souba, W.W. (1993). Endotoxin stimulates lymphocyte
glutaminase expression. Archives of Surgery, 128(8), 920 - 924
Sarkar, P. K., Fischman, D. A., Goldwasser, E., and Moscona, A. A. (1972). Isolation and
characterization of GS from chick neural retina. Journal of biological chemistry, 247, 7743 -
7749.
Schoeman, S.J. (1989). Review: Recent research into the production potential of indigenous
cattle with specific reference to Sanga. South African Journal of Animal Science, 19, 55 - 61
Scholtz, M.M. (1988). Selection possibilities of hardy beef breeds in Africa: The Nguni
example. Proceedings of the 3rd World Congress on sheep and beef cattle breeds, Paris,
France 2, 303 - 304
References
156
Scholtz, M.M., and Theunissen, A. (2010). The use of indigenous cattle in terminal cross-
breeding to improve beef cattle production in Sub-Saharan Africa. Animal Genetic
Resources, 46, 33 – 39
Scoones, I., and Graham, O. (1994). New directions for pastoral development in Africa.
Development in Practice, 4(3), 188 - 198
Seabra, A.R., Carvalho, H., and Pereira, P.J.B. (2009). Crystallization and prelimary
crystallographic characterization of glutamine synthetase from Medicago truncatula. Acta
Crystallographica Section F, Structural Biology and Crystallization Communication, 65,
1309 – 1312
Shapiro, R.A., Morehouse, R.F., and Curthoys, N.P. (1982). Inhibition by glutamate of
phosphate-dependent glutaminase of rat kidney. Biochemical Journal, 207, 561 - 566
Shapiro, R. A., Haser, W. G., and Curthoys, N. P. (1987). Immunoblot analysis of
glutaminase peptides in intact and solubilized mitochondrion isolated from various rat tissues.
Biochemical Journal, 242, 743 - 747
Svenneby, G. (1971). Activation of pig brain glutaminase. Journal of Neurochemistry, 18,
2201 - 2208
Shevchenko, A., Wilm, M., Vorm, O. and Mann, M. (1996). Mass spectrometric sequencing
of proteins from silver-stained polyacrylamide gels. Analytical Chemestry, 68, 850 – 858
Shevchenko, A., Tomas, H., Havlis, J., Olsen, J.V. and Mann, M. (2007). In-gel digestion for
mass spectrometric characterization of proteins and proteomes. Nature Protocols, 1(6), 2856
- 2860
Smith, D.D., and Campbell, J.W. (1983). Subcellular Location of Chicken Brain GS and
Comparison with Chicken Liver Mitochondrial GS. Journal of Biological Chemistry,
258(20), 12265 - 12268

References
157
Smith, E.M., and Watford, M. (1988). Rat hepatic glutaminase: purification and
immunochemical characterization. Archives of Biochemistry and Biophysics, 260, 740 - 751
Smith, E.M., and Watford, M. (1990). Sequence Similarity to kidney-type Glutaminase:
Molecular cloning of a cDNA for rat hepatic glutaminase. Journal of Biological Chemistry,
265(18), 10631 - 10636
Smith, T.J., Peterson, P.E., Schmidt, T., Fang, J., and Stanley, C.A. (2001). Structures of
bovine glutamate dehydrogenase complexes elucidate the mechanism of purine regulation.
Journal of Molecular Biology, 307, 707 - 720
Smuts, D. B. (1935). The relation between the basal metabolism and the endogenous nitrogen
metabolism, with particular reference to the estimation of the maintenance requirement of
protein. Journal of Nutrition, 9, 403 - 433
Snodgrass, P. J., and Delong, G. R. (1976). Urea-cycle enzyme deficiencies and an increased
nitrogen load producing hyperammonemia in Reye‟s syndrome. New England Journal of
Medicine, 294, 855 - 860
Souba, W.W., Strebel, F.R., Bull, J.M., Copeland, E.M., Teagtmeyer, H., Cleary, K. (1988).
Interorgan glutamine metabolism in the tumor-bearing rat. Journal of Surgical Research,
44(6), 720 – 726
Stadtman, E. R., Shapiro, B. M., Kingdon, H. S., Woolfolk, C. A., Hubbard, J. S. (1968).
Cellular regulation of GS activity in Escherichia coli. Advances in Enzyme Regulation, 6, 257
- 289
Stahl, J., and Jaenicke, L. (1972). Investigations of the structure of GS from pig brain.
European Journal of Biochemistry, 29, 401 - 407
Stehle, P., Zander, J., Mertes, N., Albers, S., Puchstein, S., Lawin, P., and Furst, P. (1989).
Effect of parenteral glutamine peptide supplements on muscle glutamine loss and nitrogen
balance after major surgery. Lancet, 1(8632), 231 – 233

References
158
Strydom, P.E., Naude, R.T., Smith, M.F., Scholtz, M.M., van Wyk, J.B. (2001).
Characterisation of indigenous African cattle breeds in relation to meat quality traits. Meat
Science, 55, 79 - 88
Summar, M. L., Dasouki, M. J., Schofield, P. J., Krishnamani, M. R. S., Vnencak-Jones, C.,
and Tuchman, M. (1995). Physical and linkage mapping of human carbamoyl phosphate
synthetase I and reassignment from 2p to 2q35. Cytogenetics and Cell Genetics, 71, 266 –
267
Szondy, Z. and Newsholme, E.A. (1990). The effect of various concentrations of
nucleobases, nucleotides or glutamine on the incorporation of [3H] thymidines into DNA in
rat mesenteric-lymph-node lymphocytes stimulated by phytohaemagglutinin. Biochemical
Journal, 270, 437 - 440
Szweda, L. I., and Atkinson, D. E. (1989). Response of rat liver glutaminase to pH,
Mediation by phosphate and ammonium ions. Journal of Biological Chemistry, 264, 15357 -
15360
Tagaki, M., Yonezawa, T., Haga, S., Shingu, H., Kobayashi, Y., Takahashi, T., Ohtani, Y.,
Obara, Y., and Katoh, K. (2008). Changes of activity and mRNA expression of urea cycle
enzymes in the liver of developing Holstein calves. Journal of Animal Science, 86, 1526 -
1532
Talal, N., and Tomkins, G.M. (1964). Allosteric properties of glutamate dehydrogenases from
different sources. Science, 146(3649), 1309 - 1311
Thoden, J.B., Holden, H.M., Wesenberg, G., Raushel, F.M., Rayment, I. (1997). Structure of
carbamoyl phosphate synthetase: a journey of 96A from substrate to product. Biochemistry,
36(21), 6305 - 6316
Tholey, G., Bloch, S., Ledig, M., Mandel, P., and Wedler, F. (1987). Chick Brain GS and
Mn2+
- Mg2+
. Interactions. Neurochemical Research, 12(11), 1041 - 1047

References
159
Tipton, K.F. (2002). Principles of enzyme assay and kinetic studies. In: Eisenthal, R. and
Danson, M.J. (eds). Enzyme Assays: A Practical Approach. (pp. 1 – 47). Oxford University
Press, Oxford, U.K.
Trotta, P. P., Pinkus, L. M., Haschemeyre, R.H., and Meister, A. (1974). Reversible
dissociation of the monomer of glutamine-dependent carbamoyl phosphate synthetase into
catalytically active heavy and light subunits. Journal of Biological Chemistry, 249, 492 - 499
Tuchman, M., and Batshaw, M.L. (2002). Management of inherited disorders of Ureagenesis.
Current Opinions in Endocrinology, Diabetes and Obesity, 12(2), 99 - 109
Tveit, B., Svenneby, G., and Kvamme, E. (1970). Kinetic Properties of Glutaminase from Pig
Renal Cortex. European Journal Biochemistry, 14, 337 - 344
Tyler, B. M., DeLeo, A. B., Magasanik, B. (1974). Activation of transcription of hut DNA by
GS. Proceedings of the national academy of sciences, 71, 225 - 229
Tyler, B. (1978). Regulation of the assimilation of nitrogen compounds. Annual Review of
Biochemistry, 47, 1127 - 1162
Unno, H., Uchida, T., Sugawara, H., Kurisu, G., Sugiyama, T., Yamaya, T., Sakakibara, H.,
Hase, T., and Kusunoki, M. (2006). Atomic structure of plant glutamine synthetase: a key
enzyme for plant productivity. Journal of Biological Chemistry, 281, 29287 – 29296
Van Rooyen, J.M., Abratt, V.R., and Sewell, B.T. (2006). Three dimensional structure of a
type III glutamine synthetase by single-particle reconstruction. Journal of Molecular Biology,
361(4), 796 - 810
Wakabayashi, K., Kakita, A., Sakamoto, M., Su, M., Iwananga, K, Ikuta, F. (1995).
Variability of brain lesions in rats administered methylmecury at various postnatal
development phases. Brain Research, 705(1-2), 267 - 272
Waldo, D. R. (1968). Nitrogen metabolism in the ruminant. Journal of Dairy Science, 51, 265
- 275

References
160
Watford, M. (1993). Hepatic glutaminase expression: relationship to kidney-type glutaminase
and to the urea cycle. FASEB Journal, 7, 1468 – 1474
Watford, M., Erbeldinz, E.J., Shapiro, A.C,. Zakow, A.M., and Smith, E.M. (1985).
Contributions to nephrology, 47, 140 - 144
Watford, M., Chellaraj, V., Ismat, A., Brown, P. and Raman, P. (2002). Hepatic glutamine
metabolism. Nutrition, 18, 301 – 303
Wedler, F. C., and Toms, R. (1986). Interaction of Mn2+
with mammalian glutamine
synthetase. Federation Proceedings of the Federation of American Society for Experimental
Biology, 45, 1650
Wellner, V. P. and Meister, A. (1966). Activity of glutamine synthetase toward the optical
isomers ofalpha-aminoadipic acid. Biochemistry, 5, 872 - 879
Wernerman, J., Hammarqvist, F., and Vinnars, E. (1990). α-Ketoglutarate and postoperative
muscle catabolism. Lancet, 335, 701 – 703
Willemoes, M., and Sigurskjold, B.W. (2002). Steady-state kinetics of the glutaminase
reaction of CTP synthase from Lactococcus lactis: The role of the allosteric activator GTP in
coupling between glutamine hydrolysis and CTP synthesis. European Journal of
Biochemistry. 269, 4772 – 4779
Wilson, R.P. and Fowlkes, P.L. (1976). Activity of GS in channel catfish tissues determined
by an improved tissue assay method. Comparative Biochemistry and Physiology, 54B, 365 -
368
Windmueller, H.G., Spaeth, A.E. (1978). Identification of ketone bodies and glutamine as the
major respiratory fuels in vivo for postabsorptive rat small intestine. Journal of Biology
Chemistry, 253, 69 - 76

References
161
Wright, L.C., Brady, C.J., Hinde, R.W. (1981). Purification and properties of the arginase
from Jerusalem artichoke tubers. Phytochemistry, 20, 2641 – 2645
Wu, G., and Morris, S. M., Jr. (1998). Arginine metabolism: nitric oxide and beyond.
Biochemical Journal, 336, 1 – 17
Wright, P.A., Campbell, A., Morgan, R.L., Rosenberger, A.G., and Murray, B.W. (2004).
Dogmas and Controversies in the Handling of Nitrogenous Wastes: Expression of Arginase
Type I and II Genes in Rainbow Trout: Influence of Fasting on Liver Enzyme Activity and
mRNA Levels in Juveniles. Journal of Experimental Biology, 207, 2033 – 2042
Wurzinger, M., Ndumu, D., Baumung, R., Drucker, A., Okeyo, A.M., Semambo, D.K.,
Byamungu, N. and Sölkner, J. (2007). Comparison of production systems and selection
criteria of Ankole cattle by breeders in Burundi, Rwanda, Tanzania and Uganda. Tropical
Animal Health Production, 38, 571 – 581
Wykes, L. J., Fiorotto, M., Burrin, D.G., Rosario, M.D., Frazer, M.E., Pond, W.G., and
Jahoor, F. (1996). Chronic low protein intake reduces tissue protein synthesis in a pig model
of protein malnutrition. Journal of Nutrition, 126, 1481 – 1488
Ziegler, F., Coudray-Lucas, C., Jardel, A., Lasnier, E., Le Boucher, J., Ekindjian, O.G., and
Cynober, L. (1992). Omithine alpha-ketoglutarate and glutamine supplementation during
refeeding of food-deprived rats. Journal of parrenteral and enteral nutrition, 16, 505 - 510
Zonia, L.E., Stebbins, N.E., Polacco, J.C. (1995). Essential role of urease in germination of
N-limited Arabidopsis thaliana seeds. Plant Physiology, 107, 1097 – 1103
Internet/ Digital sources
Nitrogen Metabolism and The Urea cycle – The Medical Biochemistry page [Retrieved April
17, 2010, from http://themedicalbiochemistrypage.org/nitrogen-metabolism.html#urea]

References
162
Cornell University College of Veterinary Medicine – Animal Health Diagnostic Center, NYS
Veterinary Diagnostic Laboratory [Retrieved April 17, 2010, from
http://ahdc.vet.cornell.edu/clinpath/modules/chem/images/urea.gif]
Universal Protein Resource, Protein Knowledgebase (UniProtKB). Basel, Switzerland.
[Retrieved December 12, 2011, from http://www.uniprot.org/uniprot]
Nitrogen Metabolism - The medical biochemistry page. [Retrieved June 03, 2010, form
http://themedicalbiochemistrypage.org/nitrogen-metabolism.php]
FAO. (2008). FAOSTAT data 2008. Food and Agriculture Organisation of the United
Nations, Rome, Italy [Retrieved December 04, 2011, from http://faostat.fao.org/faostat]
GE Healthcare life sciences – Technical support [Retrieved December 01, 2011 from,
http://www.gelifesciences.co.jp/tech_support/manual/pdf/71710100ac.pdf]
Lamwaka, S. (2006). Ugandan pastoralists hit by market reforms. PANOS features. London,
PANOS [Retrieved April 17, 2010 from,
http://www.panos.org.uk/newsfeatures/featuredetails.asp ]
Lapierre, H., Pellerin, D., and Bernier, F. (1997). Balancing Dietary Protein to Maximize
Protein recovery in Milk. [Retrieved April 17, 2010, from
http://www.wcds.afns.ualberta.ca/proceedings/1997/ch07-97.htm]
Campbell University Education, Nitrogen metabolism. [Retrieved April 17, 2010, from,
http://www.campbell.edu/faculty/nemecz/323_lect/Nitrogen_metabolism/images/ammonia-
transport.jpg]

Appendices
163
APPENDICES
Appendix 1: SDS-PAGE preparations, (Page 59)
Separating gel
This procedure was done in the fume-hood. The following tabulated reagents were added in
the tabulated sequence to make up a total volume of 15 ml 10% separating gel.
Reagents Volume (ml)
40% bis-acrylamide 3.75
1.5 M Tris-HCl, pH 8.8 3.75
Deionised water 7.418
10% SDS 0.15
10% ammonium sulphate 0.075
0.25% Tetramethylenediamine (TEMED) 0.0075
Stacking gel
This procedure was done in the fume-hood. The following tabulated reagents were added in
the tabulated sequence to make up a total volume of 5 ml 4% stacking gel.
Reagents Volume (ml)
40% bis-acrylamide 0.5
0.5 M Tris-HCl, pH 8.8 1.25
Deionised water 3.22
10% SDS 0.05
10% ammonium sulphate 0.025
0.25% Tetramethylenediamine (TEMED) 0.005
SDS-PAGE running buffer
The following reagents were weighed 3.74 mM SDS
25 mM Tris-HCl, pH 8.3
192.5 mM Glycine
Make up to final volume (1 L) with dH2O

Appendices
164
Preparation of SDS-PAGE stain
10% acetic acid, 50% methanol and 40% deionised water and 1% Sigma Brilliant Blue R'.
This procedure was done in the fume-hood. 1g of Sigma Brilliant Blue R' was dissolved in
500 ml of methanol followed by addition of 100 ml glacial acetic acid and then 400 ml of
deionised water. The total volume of stain was 1000 ml.
Preparation of SDS-PAGE de-stain
10% acetic acid, 10% methanol and 80% deionised water.
This procedure was done in the fume-hood. 100 ml of methanol was added followed by 100
ml of glacial acetic acid which was then followed by addition of deionised water to make up
a total volume of 1000 ml.
SDS-PAGE separation of bands
The purified enzyme was treated with 1% SDS and β-mercaptoethanol for 10 minutes at 90oC
and loaded in wells. Molecular weight standards used were bovine serum albumin (66,000),
Egg albumin (45,000), Glyceraldehydes triphosphate dehydrogenase (35,000), Carbonic
anhydrase (29,000) and β-lactoglobuline (18,400) (Fermentas). The gel was stained in 0.25%
w/v Coomassie brilliant blue (R-250) prepared in 50% v/v methanol and 10% v/v acetic acid.
The gels were destained by passive diffusion using a solution of 50% v/v methanol and 1%
acetic acid.
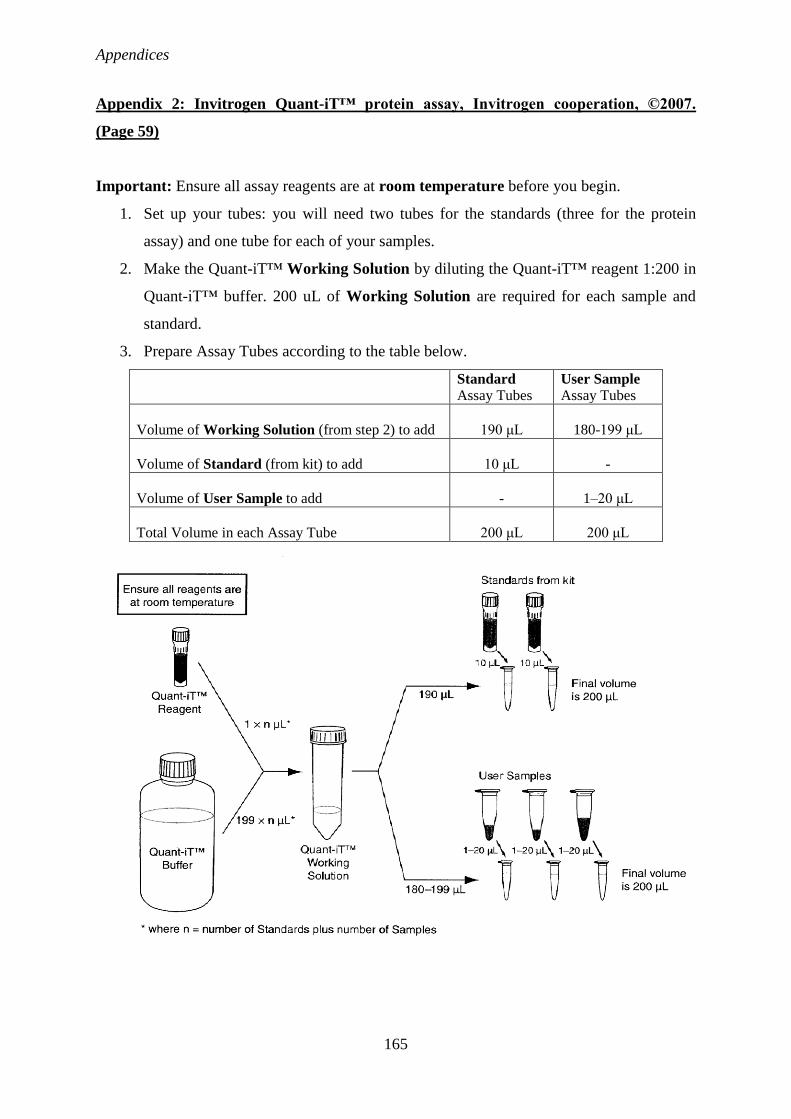
Appendices
165
Appendix 2: Invitrogen Quant-iT™ protein assay, Invitrogen cooperation, ©2007.
(Page 59)
Important: Ensure all assay reagents are at room temperature before you begin.
1. Set up your tubes: you will need two tubes for the standards (three for the protein
assay) and one tube for each of your samples.
2. Make the Quant-iT™ Working Solution by diluting the Quant-iT™ reagent 1:200 in
Quant-iT™ buffer. 200 uL of Working Solution are required for each sample and
standard.
3. Prepare Assay Tubes according to the table below.
Standard
Assay Tubes User Sample
Assay Tubes
Volume of Working Solution (from step 2) to add
190 μL
180-199 μL
Volume of Standard (from kit) to add
10 μL
-
Volume of User Sample to add
-
1–20 μL
Total Volume in each Assay Tube
200 μL
200 μL

Appendices
166
4. Vortex all tubes for 2–3 seconds.
5. Incubate the tubes for 2 minutes at room temperature (15 minutes for the Quant-iT™
protein assay).
6. Read tubes in Quant-iT™ fluorometer.
7. Multiply by the dilution factor (see Manual) to determine concentration of your
original sample. Alternatively, choose Calculate sample concentration to have the
Quant-iT™ fluorometer perform this multiplication for you.
Use only thin-wall, clear 0.5 mL PCR tubes. Acceptable tubes include Qubit™ assay
tubes. (500, Invitrogen) or Axygen PCR-05-C tubes (VWR).

Appendices
167
Appendix 3: Bio-analysis of extracted proteins with Liquid Chromatography Mass
Spectrometry (LC-MS/MS) (Page 59).
a. Tryptic digestion within cut-out bands from SDS-PAGE gels
Protein bands of interest were in-gel trypsin digested as per the protocol described in
(Shevchenko et al., 2007). In short, gel bands were destained using 50mM NH4HCO3/50%
MeOH followed by in-gel protein reduction (50mM DTT in 25 mM NH4HCO3) and
alkylation (55 mM iodoacetamide in 25 mM NH4HCO3). Proteins were digested over night at
37 °C using 5 – 50 µl, 10 ng/µl tryspin depending on the gel piece size. Peptides were
extracted using 50% acetonitrile (ACN)/5% formic acid (FA) and vacuum dried.
b. Liquid Chromatography Mass Spectrophotometer
Trypsin digested samples extracted from gel-plugs were re-suspended in 40 µl of 2%
ACN/0.2% FA and centrifuged at 20200g, 4 °C for 15 minutes. Samples were analysed on a
Dionex Ulitomate 3000 RSLC system coupled to a QSTAR®
Elite mass spectrometer.
Samples were de-salted on an Acclaim PepMap C18 trap (75 μm x 2 cm) for 8 min at 5
μl/min using 2 % ACN/0.2 % FA. Peptides were separated on Acclain PepMap C18 RSLC
column (75 μm x 15 cm, 2um particle size) connected to the trap column via 10-port
switching valve. Peptide elution was achieved using a flow-rate of 500 µl/min with a
gradient: 4-60 % B in 30 min (A: 0.1 % FA; B: 80% ACN/0.1 % FA). Nano-spray was
achieved using a MicroIonSpray head assembled with a New Objective, PicoTip emitter. An
electrospray voltage of 2.0 - 2.8 kV was applied to the emitter. The QSTAR®
Elite mass
spectrometer was operated in Information Dependant Acquisition (IDA) using an Exit Factor
of 2.0 and Maximum Accumulation Time of 2.0 sec. MS scans were acquired from m/z 400
to m/z 1500 and the three most intense ions were automatically fragmented in Q2 collision
cells using nitrogen as the collision gas. Collision energies were chosen automatically as
function of m/z and charge.

Appendices
168
Appendix 4: Carbamoyl-phosphate synthase (NCBI Blast: Generated report), (Page
59).
LOCUS NP_001179187 1500 aa linear MAM 24-OCT-
2011
DEFINITION carbamoyl-phosphate synthase[ammonia],mitochondrial
[Bos taurus].
ACCESSION NP_001179187 XP_587645
VERSION NP_001179187.1 GI:300795597
DBSOURCE REFSEQ: accession NM_001192258.1
KEYWORDS
SOURCE Bos taurus (cattle)
ORGANISM Bos taurus
Eukaryota; Metazoa; Chordata; Craniata; Vertebrata;
Euteleostomi;Mammalia; Eutheria; Laurasiatheria;
Cetartiodactyla; Ruminantia;Pecora; Bovidae; Bovinae;
Bos.
REFERENCE 1 (residues 1 to 1500)
AUTHORS Zimin,A.V.,
Delcher,A.L.,Florea,L.,Kelley,D.R.,Schatz,M.C.,
Puiu,D., Hanrahan,F., Pertea,G., Van Tassell,C.P.,
Sonstegard,T.S.,Marcais,G., Roberts,M.,
Subramanian,P., Yorke,J.A. and Salzberg,S.L.
TITLE A whole-genome assembly of the domestic cow, Bos
Taurus
JOURNAL Genome Biol. 10 (4), R42 (2009)
PUBMED 19393038
COMMENT PROVISIONAL REFSEQ: This record has not yet been
subject to final
NCBI review. The reference sequence was derived from
AAFC03081787.1, AAFC03081786.1, AAFC03081788.1,
AAFC03081789.1,AAFC03128505.1, AAFC03081790.1 and
AAFC03106155.1.On Jul 17, 2010 this sequence version
replaced gi:76659916.
Sequence Note: The RefSeq transcript and protein were
derived from genomic sequence to make the sequence
consistent with the reference genome assembly. The
genomic coordinates used for the transcript record
were based on alignments.

Appendices
169
1 mtriltackv vktlktsfgl tnvtahhqwk farpgirlls vkaqtahivl edgtkmkgys
61 fghpssvage vvfntglagy pealtdpayk gqiltmanpi vgnggapdta aldelglsky
121 lesdgikvag llvlnysddy hhwlatkslg qwlreekvpa iygvdtrmlt kiirdkgtml
181 gkiefegqsv dfvdpnkqnl iaeistkdvk vygkgnpmkv vavdcgikns virllvkrga
241 evhvvpwnhd ftkmeydgll iaggpgnpal aqpliqnvkk ilesdrkepl fgistgnlit
301 glaagaqvyk msmanrgqnq pvlnitnrqa fitaqnhgya ldstlpagwk plfvnvndqt
361 negimheskp ffgvqfhpev gpgptdteyl fdsfvslikk ekgttitsvl pkpglvasrv
421 evskvlilgs gglsigqage fdysgsqavk amkeenvktv lmnpniasvq tnevglkqad
481 tvyflpitpq fvtevikaer pdglilgmgg qtalncgvel frrgvlkeyg vkvlgtsves
541 imatedrqlf sdklneinek iapsfavesi edalkaadni gypvmirsay algglgsglc
601 pnretlmdls tkafamtnqi lveksvtgwk eieyevvrda ndncvtvcnm envdamgvht
661 gdsvvvapaq tlsnaefqll rrvsinvvrh lgivgecniq falhptsmey ciievnarls
721 rssalaskat gyplafiaak ialgiplpei knvvsgktsa cfepsldymv tkiprwdldr
781 fhgtssrigs smksvgevma igrtfeesfq kalrmchpsi dgftsrlpmn kewpsdidlr
841 reladpssir iyaiakaled nmsldeimkl tsidkwflyk mrdilnmekt lkglnsesit
901 eetlkkakei gfsdkqiskc lglteaqtre lrlkknihpw vkqidtlaae ypsvtnylyv
961 tyngqehdin fddhgmmvlg cgpyhigssv efdwcavssi rtlrqlgkkt vvvncnpetv
1021 stdfdecdkl yfeelsleri ldiyhqeacg gciisvggqi pnnlavplyk ngvkimgtsp
1081 lqidraedrs ifsavldelk vaqapwkavn tlnealefak svgfpcllrp syvlsgsamn
1141 vvfsedemkk fleeatrvsq ehpvvltkfi egarevemda vgkdgrvish aisehvedag
1201 vhsgdatlml ptqtisqgai ekvkdatrki akafaisgpf nvqflvkgnd vlviecnlra
1261 srsfpfvskt lgidfidvat kvmigehide kplptlehpi ipadyvaika pmfswprlrd
1321 adpilrcema stgevacfge gihtaflkam lstgfklpqk giligiqqsf rpqflgvaeq
1381 lhnegfklfa teatsdwlna nnvpatpvaw psqegqnpsl spirklirdg sidlvinlpn
1441 nntkfvhdny virrtavdsg ialltnfqvt klfaeavkka rnvdskslfh yrqyragkel

Appendices
170
Appendix 5: Glutamate dehydrogenase (NCBI Blast: Generated report), (Page 59).
LOCUS NP_872593 558 aa linear MAM 20-NOV-
2011
DEFINITION glutamate dehydrogenase 1, mitochondrial precursor [Bos
taurus].
ACCESSION NP_872593
VERSION NP_872593.1 GI:32880221
DBSOURCE REFSEQ: accession NM_182652.1
KEYWORDS .
SOURCE Bos taurus (cattle)
ORGANISM Bos taurus
Eukaryota; Metazoa; Chordata; Craniata; Vertebrata;
Euteleostomi;
Mammalia; Eutheria; Laurasiatheria; Cetartiodactyla;
Ruminantia;
Pecora; Bovidae; Bovinae; Bos.
REFERENCE 1 (residues 1 to 558)
AUTHORS Cai,L., Xie,Y., Li,L., Li,H., Yang,X. and Liu,S.
TITLE Electrochemical and spectral study on the effects of
Al(III) and
nano-Al13 species on glutamate dehydrogenase activity
JOURNAL Colloids Surf B Biointerfaces 81 (1), 123-129 (2010)
PUBMED 20675102
REMARK GeneRIF: Data show that glutamate dehydrogenase activity
in an
enzymatic catalyzed reaction by tracing the increasing
of oxidation
current of NADH.
REFERENCE 2 (residues 1 to 558)
AUTHORS Wacker,S.A., Bradley,M.J., Marion,J. and Bell,E.
TITLE Ligand-induced changes in the conformational stability
and
flexibility of glutamate dehydrogenase and their role in
catalysis
and regulation
JOURNAL Protein Sci. 19 (10), 1820-1829 (2010)
PUBMED 20665690
REMARK GeneRIF: Data show that heat inactivation of the native
GDH enzyme
occurred with a rate constant of inactivation of 0.252
min-1.

Appendices
171
1 myrylgeall lsragpaalg sasadsaall gwargqpaaa pqpglvppar
rhyseaaadr
61 eddpnffkmv egffdrgasi vedklvedlk treteeqkrn rvrsilriik
pcnhvlslsf
121 pirrddgswe viegyraqhs qhrtpckggi rystdvsvde vkalaslmty
kcavvdvpfg
181 gakagvkinp knytdnelek itrrftmela kkgfigpgvd vpapdmstge
remswiadty
241 astighydin ahacvtgkpi sqggihgris atgrgvfhgi enfineasym
silgmtpgfg
301 dktfvvqgfg nvglhsmryl hrfgakciav gesdgsiwnp dgidpkeled
fklqhgtilg
361 fpkakiyegs ilevdcdili paasekqlpk snaprvkaki iaegangptt
peadkifler
421 nimvipdlyl naggvtvsyf ewlnnlnhvs ygrltfkyer dsnyhllmsv
qeslerkfgk
481 hggtipivpt aefqdrisga sekdivhsgl aytmersarq imrtamkynl
gldlrtaayv
541 naiekvfrvy neagvtft