participatory systems mapping: a practical guide
TRANSCRIPT
Contact: [email protected] and [email protected] 1
Participatory Systems Mapping: a practical guide Participatory Systems Mapping is a participatory modelling methodology in which a group of stakeholders collaboratively develop a simple causal map of an issue during the course of a workshop. Stakeholders produce a map made up of factors, which can represent anything as along as they are expressed as a variable (i.e. can in some sense go up and down) and connections which represent causal relationships. The map is intended to represent what stakeholders believe to be the causal structure of their system. The map can be built using a white-board or simple pen and paper materials on a large table. The process of building a map can be hugely valuable to participants, the digitized version of the map can be a useful resource, and additional analysis can be conducted on the map created. Why use Participatory Systems Mapping? These types of models provide thinking tools which can be used for discussion and exploration of complex issues, as well as sense checking the implications of suggested causal links. Such “hands on” complexity science can increase stakeholder motivation and understanding of the scope of whole systems approaches.
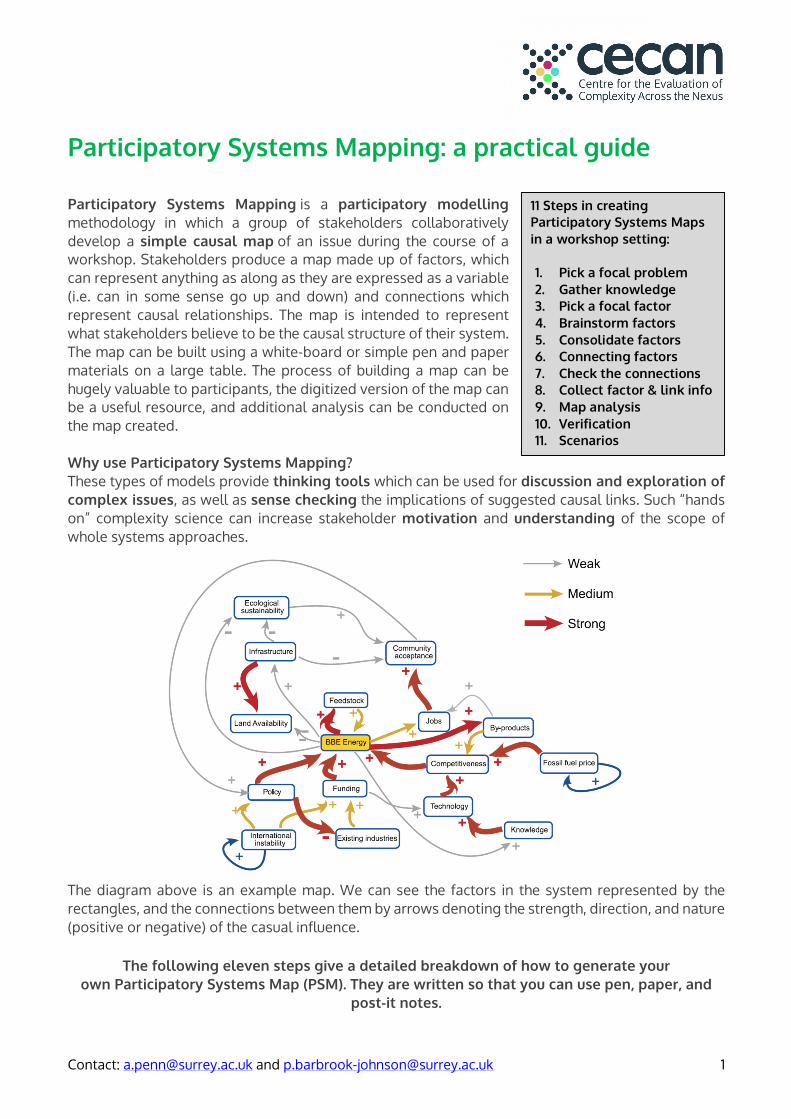
The diagram above is an example map. We can see the factors in the system represented by the rectangles, and the connections between them by arrows denoting the strength, direction, and nature (positive or negative) of the casual influence.
The following eleven steps give a detailed breakdown of how to generate your own Participatory Systems Map (PSM). They are written so that you can use pen, paper, and
post-it notes.
11 Steps in creating Participatory Systems Maps in a workshop setting: 1. Pick a focal problem 2. Gather knowledge 3. Pick a focal factor 4. Brainstorm factors 5. Consolidate factors 6. Connecting factors 7. Check the connections 8. Collect factor & link info 9. Map analysis 10. Verification 11. Scenarios

Contact: [email protected] and [email protected] 2
Decide on a focal problem In order to make a PSM you must first decide on the problem area which you wish to explore. PSM is most useful in situations in which many sorts of factors are interacting to influence what happens, but your problem can be anything. It is best to be relatively specific with your problem area by narrowing to, for example, a particular time and location with which you are familiar. For example, in our Humber case study PSM (above) the focal problem area was the current development of bio-based economy in the Humber region. A more specific problem is easier to think about, than more diffuse or general ones. Plan for gathering knowledge Once you have defined your problem area, you need to bring together the relevant people or sources of information to map it fully. We strongly recommend working with a group of stakeholders, but if you are working alone, bring together any data, records or other information sources before you start. If you will be running a workshop think of key groups or individuals with different perspectives or expertise on the issue. Think broadly and include those who are impacted on or participate directly with the system rather than simply experts on the generalities. In this way you can map the reality of what is happening on the ground and may discover unexpected connections. Decide on a focal factor(s) As a hook to help you begin, you should think of a focal factor, or factors, within your problem. This should be a variable (something that can increase or decrease) within your system which is both important to you and central to the problem area. For example, in the Humber PSM the focal factor was the amount of production of bio-based energy. You may find you need to start with several focal factors when there are a few core issues/objectives, which may be important to different stakeholders, in your system. Brainstorm factors Thinking as widely as possible, all participants should individually brainstorm all the factors that they think impact the focal factor (directly or indirectly) and conversely any factors that the focal factor impacts. These can be from any domain, technical, social, economic, political, ecological etc. They can be quantifiable, e.g. prices, or qualitative such as social attitudes. All factors should be able to increase or decrease. It is helpful to write all individual factors on separate post-it notes. To keep things manageable at first, it is often a good idea to only brainstorm those factors which are strongly impacted by, or impact on, the focal factor. Consolidate factors Using a whiteboard or table top ask all participants to place their factors together and start to group them if they duplicate the same idea. Are grouped factors really the same or are there important differences? Discuss and clarify what you mean by each factor to come to a common understanding. Once grouping is final, write each consolidated factor on its own single post-it. It is best to start with fewer factors to focus thinking, so if you have more than 20, pick out the 20 most important to start with, retaining the others for later. Connecting factors Next, start drawing your map, drawing the connections which show how the factors influence each other. Start by putting your focal factor on the map. Then, together as a group discuss and add the consolidated factors that directly influence it either positively (if they increase the focal factor increases) or negatively (if they increase the focal factor decreases). Draw these connections in,
Contact: [email protected] and [email protected] 3
including ‘+’ and ‘-‘ signs, adding factors as you go. If a connection is complex or you are unsure of its nature, capture this too. Then, think about what the focal factor influences.
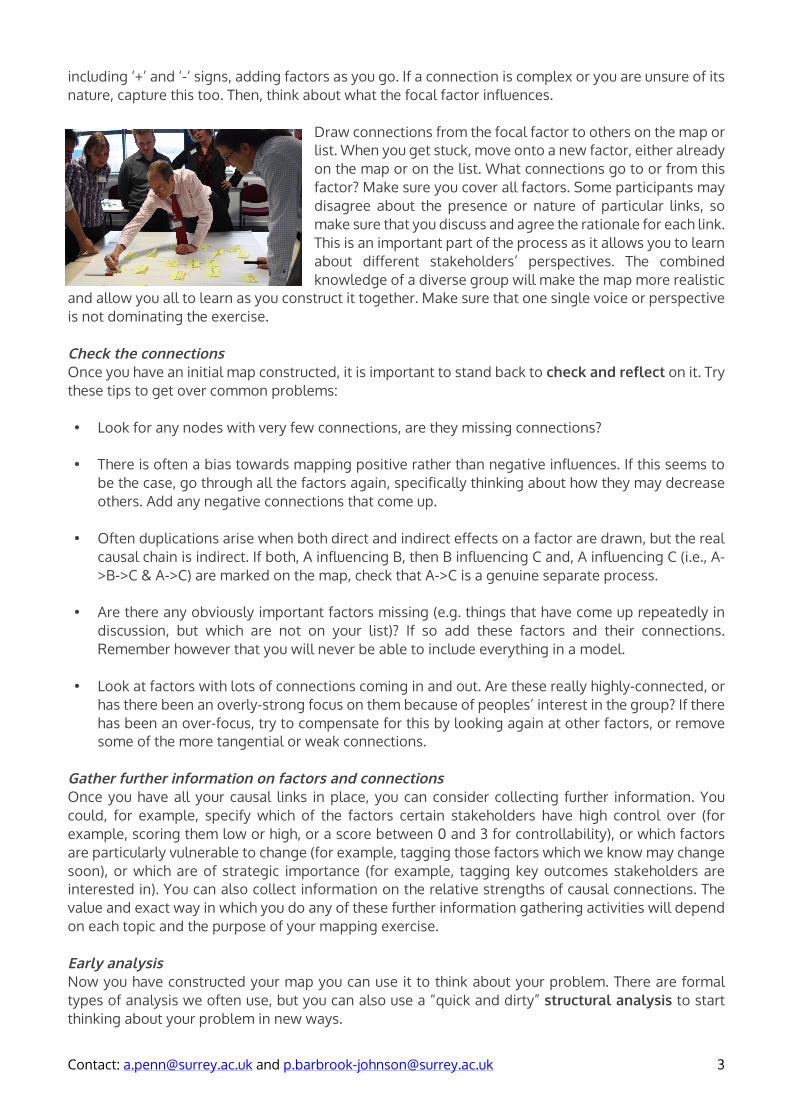
Draw connections from the focal factor to others on the map or list. When you get stuck, move onto a new factor, either already on the map or on the list. What connections go to or from this factor? Make sure you cover all factors. Some participants may disagree about the presence or nature of particular links, so make sure that you discuss and agree the rationale for each link. This is an important part of the process as it allows you to learn about different stakeholders’ perspectives. The combined knowledge of a diverse group will make the map more realistic
and allow you all to learn as you construct it together. Make sure that one single voice or perspective is not dominating the exercise. Check the connections Once you have an initial map constructed, it is important to stand back to check and reflect on it. Try these tips to get over common problems: • Look for any nodes with very few connections, are they missing connections?
• There is often a bias towards mapping positive rather than negative influences. If this seems to
be the case, go through all the factors again, specifically thinking about how they may decrease others. Add any negative connections that come up.
• Often duplications arise when both direct and indirect effects on a factor are drawn, but the real causal chain is indirect. If both, A influencing B, then B influencing C and, A influencing C (i.e., A->B->C & A->C) are marked on the map, check that A->C is a genuine separate process.
• Are there any obviously important factors missing (e.g. things that have come up repeatedly in discussion, but which are not on your list)? If so add these factors and their connections. Remember however that you will never be able to include everything in a model.
• Look at factors with lots of connections coming in and out. Are these really highly-connected, or has there been an overly-strong focus on them because of peoples’ interest in the group? If there has been an over-focus, try to compensate for this by looking again at other factors, or remove some of the more tangential or weak connections.
Gather further information on factors and connections Once you have all your causal links in place, you can consider collecting further information. You could, for example, specify which of the factors certain stakeholders have high control over (for example, scoring them low or high, or a score between 0 and 3 for controllability), or which factors are particularly vulnerable to change (for example, tagging those factors which we know may change soon), or which are of strategic importance (for example, tagging key outcomes stakeholders are interested in). You can also collect information on the relative strengths of causal connections. The value and exact way in which you do any of these further information gathering activities will depend on each topic and the purpose of your mapping exercise. Early analysis Now you have constructed your map you can use it to think about your problem. There are formal types of analysis we often use, but you can also use a “quick and dirty” structural analysis to start thinking about your problem in new ways.
Contact: [email protected] and [email protected] 4
• Look at factors which are of high importance (e.g. key outcomes), focus on the factors one or two steps ‘up’ from them (i.e. which are one or two incoming causal connections away); is there anything unexpected or useful to learn from these? Conversely, look at the factors one or two steps ‘down’ from controllable factors; what might these tell us?
• Consider the factors which represent any interventions or policies in your system, and the factors downstream from them; are there any interactions, such as trade-offs or synergies between them? Are there any unexpected indirect effects of interventions?
• Look for factors which have many incoming or outgoing connections (so called high in-degree or out-degree nodes). The former are highly influenced, the latter are highly influential in your system. Do you see anything that you don’t expect? What practical implications might this have?
• Look particularly at factors up or downstream from these highly connected factors. Factors which are influenced directly or indirectly by a highly influenced factor may vary for many different reasons. Are there possible unexpected indirect effects on these which might be important? Factors which are upstream of a highly influential factor may provide unexpected sources of change or control over large sections of the problem domain. Do you see indirect sources of influence or impacts which you might not have realised were there?
• Look at factors which have outgoing links only. These are drivers, factors which influence your problem, but are not influenced by it. Do these cause problems? Do you just adapt or react to them?
• Conversely, look at factors which have incoming links only. These are sinks and according to your map influence nothing else in the system, no matter how much they are changed. Is this true? What might possible consequences be? Might there be threshold values at which they might start to influence the rest of the system?
• Are there any factors with a high number of outgoing connections, but which have low
controllability (i.e. a potential vulnerability)? Or any factors with many outgoing factors, that are controllable (i.e. a potential lever)? Are there any interesting interactions between controllable, important or vulnerable factors?
Verification By starting to examine the map you have produced in detail, you may find that certain causal influences don’t make sense to you. This is an opportunity to “sense check” the map, but also to re-evaluate your own ideas about the system. It is also useful to verify any map you have constructed by showing it to other stakeholders or individuals with knowledge of the problem domain and asking them what they think is missing or incorrect. Disagreement on structure can suggest areas that need further investigation or modelling in order to clarify causal connections. However, remember that this map is subjective; there will always be different opinions about what the causal connections are. Scenarios The map that you have drawn shows the present structure of your problem, but you can use it to think about possible change. Think about different scenarios, such as possible changes on the horizon for your problem or ways in which you might want to do things differently. How would the map be structured differently in these cases? Would new factors have to be added? What difference does this make to your thinking if you analyse these new maps? Drawing maps for different scenarios is a way to preserve and examine disagreements between different perspectives.