partnerships drive performance - amazon s3
TRANSCRIPT

NWSA ANNUAL REPORT 2019
Click to navigate to section
2019 ANNUAL REPORT
PARTNERSHIPSDRIVE PERFORMANCE

THE NORTHWEST SEAPORT ALLIANCENWSA ANNUAL REPORT 2019
Click to navigate to section
The Northwest Seaport Alliance is a marine cargo operating partnership of the Port of Seattle and Port of Tacoma. We are the fourth-largest container gateway in North America. Under a port development authority, the NWSA manages the container, breakbulk, auto and some bulk terminals in Seattle and Tacoma.

3
CONTENTS
2019 ANNUAL REPORT
THE NORTHWEST SEAPORT ALLIANCE P.O. Box 2985 Tacoma, WA 98401-2985800-657-9808
Seattle HarborPier 69, 2711 Alaskan Way Seattle, WA 98121
Tacoma HarborOne Sitcum Plaza Tacoma, WA 98421
On the cover:Demolition of Terminal 5’s north berth began in August 2019. Modernizing the 185-acre terminal will allow The Northwest Seaport Alliance to handle some of the largest container vessels calling at West Coast ports today.
Click to navigate to section
www.nwseaportalliance.com
LEADERSHIP
CEO LETTER
TRADE STATISTICS
FINANCIAL REPORT
INDEPENDENT AUDITOR’S REPORT
54
68
35

THE NORTHWEST SEAPORT ALLIANCENWSA ANNUAL REPORT 2019
4TABLE OF CONTENTS CEO LETTER LEADERSHIP TRADE STATISTICS FINANCIAL REPORT AUDITOR’S REPORTClick to navigate to section
Partnerships drive performance at The Northwest Seaport Alliance. In its fifth year, the NWSA continued to align the vision of port leadership, business stakeholders and the wider community to make our region a premier destination for marine cargo.
During 2019 the alliance generated healthy annual cash returns to the Ports of Seattle and Tacoma, even as container volumes remained steady and international shippers faced substantial headwinds during the U.S.-China trade dispute.
Continuous outreach by our Operations Service Center — along with our annual Peak Planning Meeting that brought together participants from every link in the supply chain — elevated the level of coordination necessary to keep our gateway competitive. Likewise, truck congestion eased thanks to innovative thinking and close collaboration on the part of terminal operators and their longshore partners. Going forward, we will provide even greater visibility into container movements using the RFID technology installed across both harbors to implement the 2019 Clean Trucks Program.
That initiative represented just one aspect of the NWSA’s commitment to meaningful emissions reductions across Puget Sound as our team prepares its update to the Northwest Ports Clean Air Strategy. Other examples include state and federal funding for shore power and a pilot program for electric yard
trucks. Similar collaboration with federal, state and local government was also evident in the contributions by the Ports of Tacoma and Seattle to projects that will improve traffic flow with the new Lander Street overpass and better connections between the ports and I-5 via state Route 167 and state Route 509.
Looking ahead, I’m encouraged by the ongoing growth of warehouse operations and transloading from our facilities. This complements our long-term planning that brought the final four super-post-Panamax cranes to Tacoma’s Husky Terminal in 2019 as we broke ground on an equally ambitious redevelopment project at Seattle’s Terminal 5.
Moving into 2020, we will continue to extend the NWSA’s reach deeper into the supply chain, working closely with railroads, importers, exporters, strategic inland terminals and all our partners to position our gateway as a vital center of North American commerce.
John Wolfe, CEO The Northwest Seaport Alliance
CEO LETTER
BUILDING CONNECTIONS
Seattle Harbor Tacoma Harbor

THE NORTHWEST SEAPORT ALLIANCENWSA ANNUAL REPORT 2019
5TABLE OF CONTENTS CEO LETTER LEADERSHIP TRADE STATISTICS FINANCIAL REPORT AUDITOR’S REPORTClick to navigate to section
PORT OF SEATTLE COMMISSION
PORT OF TACOMA COMMISSION
STEPHANIE BOWMAN (2019 PRESIDENT)
DICK MARZANO
FRED FELLEMAN
DON JOHNSON
RYAN CALKINS
DON MEYER
COURTNEY GREGOIRE
CLARE PETRICH (2019 PRESIDENT)
PETER STEINBRUECK
JOHN McCARTHY
In August 2015, the Ports of Seattle and Tacoma joined forces and formed The Northwest Seaport Alliance. The first of its kind in North America, the partnership unifies the two ports’ marine cargo terminal investments, operations, planning and marketing activities to strengthen the Puget Sound gateway and attract more business opportunities to the region. The alliance is governed by the elected commissions of the two ports as equal members.
LEADERSHIP
THE NORTHWEST SEAPORT ALLIANCENWSA ANNUAL REPORT 2019
6TABLE OF CONTENTS CEO LETTER LEADERSHIP TRADE STATISTICS FINANCIAL REPORT AUDITOR’S REPORTClick to navigate to section
$579.6 MILLION
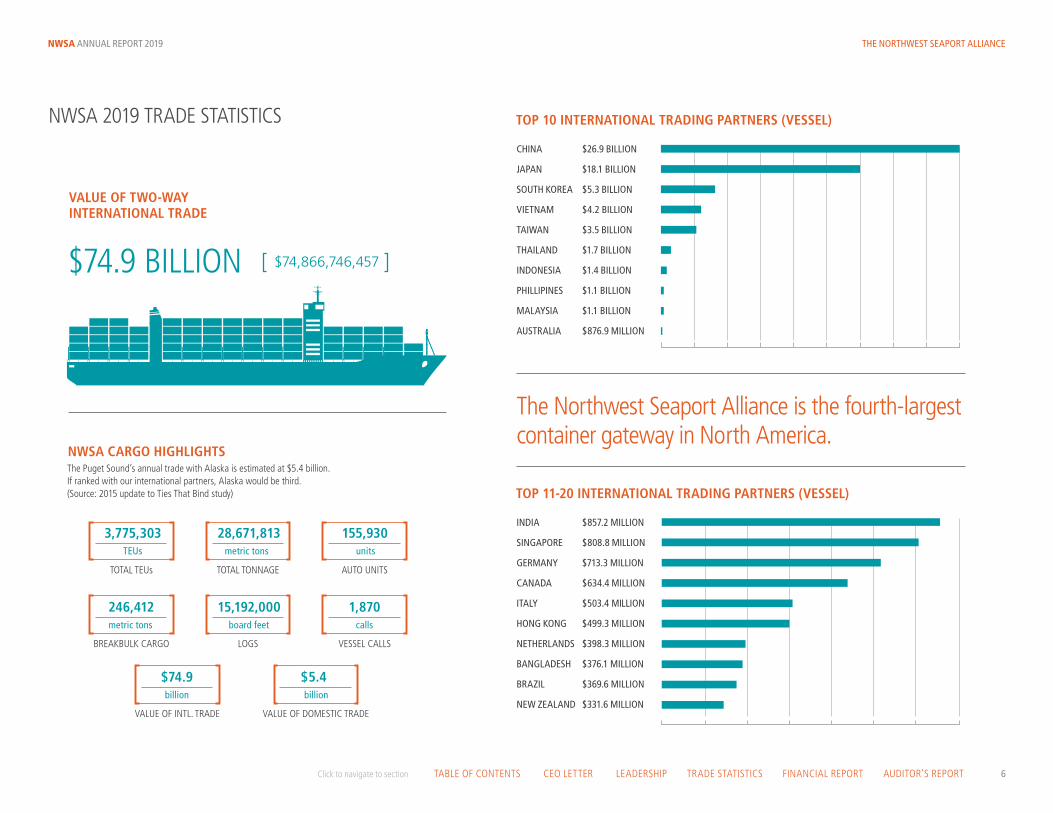
The Northwest Seaport Alliance is the fourth-largest container gateway in North America.
VALUE OF TWO-WAY INTERNATIONAL TRADE
VALUE OF INTERNATIONAL IMPORTS (VESSEL)
VALUE OF INTERNATIONAL EXPORTS (VESSEL)
TOP 10 EXPORT COMMODITIES (VESSEL)TOP 10 IMPORT COMMODITIES (VESSEL)
$11.1 BILLION $8.6 BILLION $7.8 BILLION $4.1 BILLION
$1.9 BILLION
$1.9 BILLION
$1.3 BILLION
$2.0 BILLION
TOP 10 INTERNATIONAL TRADING PARTNERS (VESSEL)
NWSA CARGO HIGHLIGHTS
3,775,303TEUs
28,671,813metric tons
155,930units
246,412metric tons
15,192,000board feet
$74.9billion
$5.4billion
1,870calls
$74.9 BILLION
$59.4 BILLION
$74,866,746,457
$59,422,723,364
$15.4 BILLION$15,444,023,093
$2.7 BILLION$3.6 BILLION
$2.5 BILLION $1.4 BILLION $674.8 MILLION
$610.0 MILLION $583.1 MILLION$624.7 MILLION
$1.1 BILLION
$590.2 MILLION
CHINA $26.9 BILLION
JAPAN $18.1 BILLION
SOUTH KOREA $5.3 BILLION
VIETNAM $4.2 BILLION
TAIWAN $3.5 BILLION
THAILAND $1.7 BILLION
INDONESIA $1.4 BILLION
PHILLIPINES $1.1 BILLION
MALAYSIA $1.1 BILLION
AUSTRALIA $876.9 MILLION
TOP 11-20 INTERNATIONAL TRADING PARTNERS (VESSEL)
INDIA $857.2 MILLION
SINGAPORE $808.8 MILLION
GERMANY $713.3 MILLION
CANADA $634.4 MILLION
ITALY $503.4 MILLION
HONG KONG $499.3 MILLION
NETHERLANDS $398.3 MILLION
BANGLADESH $376.1 MILLION
BRAZIL $369.6 MILLION
NEW ZEALAND $331.6 MILLION
$468.8 MILLION
The Puget Sound’s annual trade with Alaska is estimated at $5.4 billion.If ranked with our international partners, Alaska would be third.(Source: 2015 update to Ties That Bind study)
NWSA 2019 TRADE STATISTICS

THE NORTHWEST SEAPORT ALLIANCENWSA ANNUAL REPORT 2019
7TABLE OF CONTENTS CEO LETTER LEADERSHIP TRADE STATISTICS FINANCIAL REPORT AUDITOR’S REPORTClick to navigate to section
$579.6 MILLION
The Northwest Seaport Alliance is the fourth-largest container gateway in North America.
VALUE OF TWO-WAY INTERNATIONAL TRADE
VALUE OF INTERNATIONAL IMPORTS (VESSEL)
VALUE OF INTERNATIONAL EXPORTS (VESSEL)
TOP 10 EXPORT COMMODITIES (VESSEL)TOP 10 IMPORT COMMODITIES (VESSEL)
$11.1 BILLION $8.6 BILLION $7.8 BILLION $4.1 BILLION
$1.9 BILLION
$1.9 BILLION
$1.3 BILLION
$2.0 BILLION
TOP 10 INTERNATIONAL TRADING PARTNERS (VESSEL)
NWSA CARGO HIGHLIGHTS
3,775,303TEUs
28,671,813metric tons
155,930units
246,412metric tons
15,192,000board feet
$74.9billion
$5.4billion
1,870calls
$74.9 BILLION
$59.4 BILLION
$74,866,746,457
$59,422,723,364
$15.4 BILLION$15,444,023,093
$2.7 BILLION$3.6 BILLION
$2.5 BILLION $1.4 BILLION $674.8 MILLION
$610.0 MILLION $583.1 MILLION$624.7 MILLION
$1.1 BILLION
$590.2 MILLION
CHINA $26.9 BILLION
JAPAN $18.1 BILLION
SOUTH KOREA $5.3 BILLION
VIETNAM $4.2 BILLION
TAIWAN $3.5 BILLION
THAILAND $1.7 BILLION
INDONESIA $1.4 BILLION
PHILLIPINES $1.1 BILLION
MALAYSIA $1.1 BILLION
AUSTRALIA $876.9 MILLION
TOP 11-20 INTERNATIONAL TRADING PARTNERS (VESSEL)
INDIA $857.2 MILLION
SINGAPORE $808.8 MILLION
GERMANY $713.3 MILLION
CANADA $634.4 MILLION
ITALY $503.4 MILLION
HONG KONG $499.3 MILLION
NETHERLANDS $398.3 MILLION
BANGLADESH $376.1 MILLION
BRAZIL $369.6 MILLION
NEW ZEALAND $331.6 MILLION
$468.8 MILLION
The Puget Sound’s annual trade with Alaska is estimated at $5.4 billion.If ranked with our international partners, Alaska would be third.(Source: 2015 update to Ties That Bind study)
NWSA 2019 TRADE STATISTICS

THE NORTHWEST SEAPORT ALLIANCENWSA ANNUAL REPORT 2019
8TABLE OF CONTENTS CEO LETTER LEADERSHIP TRADE STATISTICS FINANCIAL REPORT AUDITOR’S REPORTClick to navigate to section
FINANCIAL REPORT

THE NORTHWEST SEAPORT ALLIANCENWSA ANNUAL REPORT 2019
9TABLE OF CONTENTS CEO LETTER LEADERSHIP TRADE STATISTICS FINANCIAL REPORT AUDITOR’S REPORTClick to navigate to section
INTRODUCTIONThe Northwest Seaport Alliance (NWSA) Management Discussion and Analysis (MD&A) of financial activities and performance introduces the 2019 and 2018 financial statements of the NWSA, a Port Development Authority. NWSA management prepared this MD&A and readers should consider it in conjunction with the financial statements and the notes thereto. The notes are essential to a full understanding of the data contained in the financial statements. This report also presents information about the formation of the NWSA and certain required supplementary financial information.
OVERVIEW OF THE FINANCIAL STATEMENTSThe financial section of this annual report consists of three parts: MD&A, the basic financial statements and the notes to the financial statements. The financial statements include: the statements of net position, the statements of revenues, expenses and changes in net position, and the statements of cash flows.
The statements of net position present information on the NWSA’s assets and deferred outflows and liabilities and deferred inflows, with the difference between the assets and deferred outflows, and liabilities and deferred inflows reported as net position. Over time, increases or decreases in net position may serve as an indicator of whether the financial position of the NWSA is improving or deteriorating. The statements of revenues, expenses and changes in net position shows how the NWSA’s net position changed during the year. These changes are reported in the period in which the underlying event occurs, regardless of the timing of related cash flows.
Formation of The Northwest Seaport AllianceThe ports of Seattle and Tacoma (the home ports) joined forces in August 2015, forming the NWSA to unify management of marine cargo facilities and business to strengthen the Puget Sound gateway and attract more marine cargo and jobs to the region.
The NWSA is a special purpose governmental entity established as a Port Development Authority (PDA), similar to Public Development Authorities formed by cities and counties. The PDA is governed by the home ports as equal members (each a “Managing Member” and collectively, “Managing Members”) with each home port acting through its elected commissioners. As approved, the charter for the NWSA (“Charter”) may be amended only by mutual agreement of the Managing Members. Each home port will remain a separate legal entity, independently governed by its own elected commissioners. Each home port has granted to the NWSA a license for the NWSA’s exclusive use, operation and management of certain facilities, but ownership of the licensed facilities remains with the home ports, not with the NWSA.
Membership InterestsThe home ports made an initial contribution of certain cargo terminals and related marine cargo business activities to the NWSA through license agreements (“Licensed Properties”). Under these agreements, the NWSA is charged with managing the properties as an agent on behalf of the Managing Members. The initial contribution of each home port to the NWSA was 50 percent (based on the value of the contributed facilities using cash flow forecasts for each parcel that went to the NWSA) with a revaluation review that was completed during 2019 by the Managing Members. The revaluation review is to determine if material changes in cash flows from the Licensed Properties have occurred since the initial valuation. A change in the valuation of the cash flow forecasts of these facilities could result in a change in Membership Interests. The Managing Members shall approve any change in Membership Interest by vote, to include provision for addressing any change to distributions and allocations as a result of the change in Membership Interest. Changes in Membership Interest do not affect a Managing Member’s voting rights under the Charter, as votes are not weighted by or otherwise determined by Membership Interest.
On April 2, 2019, the Managing Members and the Port of Seattle commission authorized the completion of the one-time Membership Interest Affirmation of the 50 percent share for each home port in satisfaction of the NWSA Charter. In lieu of completing the required reevaluation of Membership Interest, the Port of Seattle agreed to pay up to $32 million additional contribution to the NWSA. This additional contribution was in recognition that certain forecasted revenue streams not secured by long-term contractual agreements in the initial valuation may not be achieved without the redevelopment of Terminal 5. This additional contribution by the Port of Seattle will be made to the NWSA in three installments. The first two installments of $11 million each will be made on or around March 31, 2020 and 2021, respectively. The final installment will be made in 2024 and may be adjusted if the actual redevelopment costs are less than the Terminal 5 redevelopment program authorization. The Managing Members also authorized the distribution of these affirmation payments to the home ports equally after the NWSA receives the funds from the Port of Seattle, hence there is no impact on NWSA’s net position and the NWSA will record the transactions in the periods they occur.
Financial FrameworkThe NWSA intends to support the credit profiles of both home ports, and its financial framework will preserve both ports’ commitment to financial strength and fiscal stewardship. The NWSA distributes cash to each home port based on cash flow from operations, calculated pursuant to generally accepted accounting principles (GAAP). Distributions are to be made no less than quarterly based on each Managing Member’s Membership Interest. Cash flow from operations will be distributed to home ports and not retained by the NWSA for funding capital investments.
The NWSA is responsible for capital investments, including renewal and replacement projects and new development. Both home ports work cooperatively with the NWSA to develop an annual capital investment plan for approval by each Managing Member. Capital funding will be provided by joint contributions from the home ports. Each Managing Member must approve its capital contributions.
MANAGEMENT’S DISCUSSION AND ANALYSIS Year Ended December 31, 2019 and 2018

THE NORTHWEST SEAPORT ALLIANCENWSA ANNUAL REPORT 2019
10TABLE OF CONTENTS CEO LETTER LEADERSHIP TRADE STATISTICS FINANCIAL REPORT AUDITOR’S REPORTClick to navigate to section
The Charter recognizes that each home port’s respective share of revenues received by the NWSA with respect to the Licensed Properties has been or may be pledged in connection with the home port’s bond obligations. Under the Charter, the Managing Members instruct the Chief Executive Officer (CEO) to manage the PDA in a prudent and reasonable manner in support of the home ports’ respective bond covenants. The home ports shall keep the CEO and the NWSA management informed of their respective bond obligations and shall each notify the other home port of any proposed change to such home port’s governing bond resolutions as soon as practical before adoption. The Charter does not modify or alter the obligations of each home port with respect to its own bond obligations. The NWSA does not assume any obligations to the home ports’ bondholders.
With respect to bonds of each home port that were outstanding at the time of the formation of the NWSA, the Managing Members shall establish and maintain a requirement for the NWSA to calculate and establish a minimum level of net income from the NWSA equal to the amount required for the home ports to meet their bond rate covenants in effect at the time of formation of the NWSA (“Bond Income Calculation,” initially calculated to be $90 million). The Managing Members shall require the Bond Income Calculation to be reviewed annually as part of the NWSA budget process and the Managing Members may adjust the Bond Income Calculation so long as it does not cause any home port to fail to comply with its rate covenant in effect at the time of formation of the NWSA. The NWSA may not take any action that reasonably would reduce NWSA income below the minimum level established by the Bond Income Calculation unless each Managing Member separately votes to approve that action. Such a vote by each Managing Member must occur even if the action is within the CEO’s delegated authority. The Bond Income Calculation is subject to adjustment, including reductions resulting from payment or refunding of bonds outstanding at the time of the formation of the NWSA.
FundingSubsequent to the initial funding, future needs are evaluated during the annual budget process or if the working capital reserve should decline below a target minimum established by the Managing Members. Managing Members each must vote affirmatively to approve additional working capital contributions. The NWSA has generated enough cash from operations to cover its working capital requirements through 2019 and the 2020 NWSA budget does not anticipate additional funding needs.
Funding for capital construction projects since formation of the NWSA through December 31, 2019 totaled $297.2 million. The majority of this capital funded container terminal improvements at Terminals 5 and 46 in the North Harbor and Terminal 4 in the South Harbor. Additional information on capital construction spending can be found in the capital assets section below.
Financial Position SummaryThe statements of net position present the financial position of the NWSA. The statements include all of the NWSA’s assets and deferred outflows, and liabilities and deferred inflows. Net position serves as an indicator of the NWSA’s financial position. The NWSA’s current assets consist primarily of cash and cash equivalents, investments and accounts receivable.
Statements of Net Position (dollars in thousands):2019 2018 2017
Current assets $ 100,046 $ 91,948 $ 100,803
Capital assets, net 313,948 234,235 152,228
Long-term investments 13,725 13,369 12,535
Other assets 101 2,600 3,025
Total assets $ 427,820 $ 342,152 $ 268,591
Deferred outflows of resources $ 1,488 $ 1,652 $ 481
Current liabilities $ 54,111 $ 36,837 $ 41,553
Noncurrent liabilities 20,426 21,710 19,642
Total liabilities $ 74,537 $ 58,547 $ 61,195
Deferred inflows of resources $ 1,395 $ 1,258 $ 349
Net investment in capital assets $ 313,948 $ 234,235 $ 152,228
Restricted 13,725 13,369 12,535
Unrestricted 25,703 36,395 42,765
Total net position $ 353,376 $ 283,999 $ 207,528
The NWSA’s total net position was $353.4 million at December 31, 2019. Of this amount, $314.0 million was the investment in capital assets, $13.7 million was restricted, and $25.7 million was unrestricted and available to finance operating activities. The NWSA’s total net position was $284.0 million at December 31, 2018. Of this amount, $234.2 million was the investment in capital assets, $13.4 million was restricted, and $36.4 million was unrestricted and available to finance operating activities. The NWSA’s investment in capital assets represents capital assets for the NWSA’s terminal and real estate facilities.
THE NORTHWEST SEAPORT ALLIANCENWSA ANNUAL REPORT 2019
11TABLE OF CONTENTS CEO LETTER LEADERSHIP TRADE STATISTICS FINANCIAL REPORT AUDITOR’S REPORTClick to navigate to section
MANAGEMENT’S DISCUSSION AND ANALYSIS (continued) Year Ended December 31, 2019
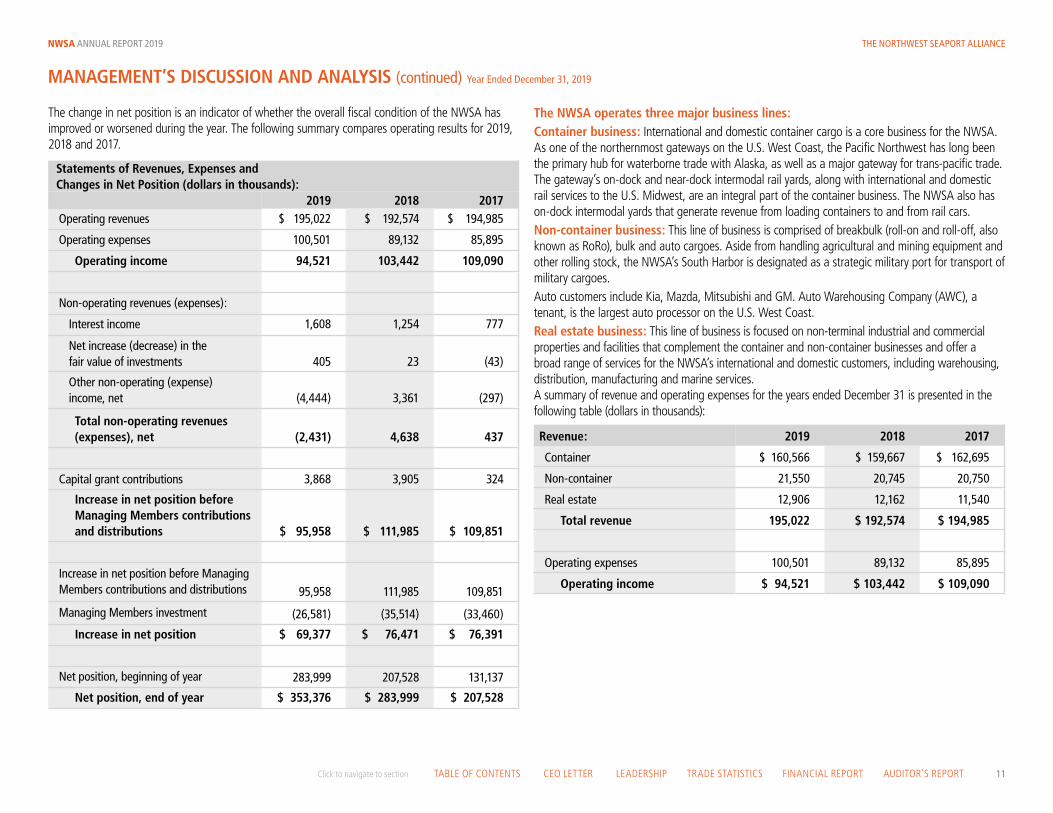
The NWSA operates three major business lines:Container business: International and domestic container cargo is a core business for the NWSA. As one of the northernmost gateways on the U.S. West Coast, the Pacific Northwest has long been the primary hub for waterborne trade with Alaska, as well as a major gateway for trans-pacific trade. The gateway’s on-dock and near-dock intermodal rail yards, along with international and domestic rail services to the U.S. Midwest, are an integral part of the container business. The NWSA also has on-dock intermodal yards that generate revenue from loading containers to and from rail cars. Non-container business: This line of business is comprised of breakbulk (roll-on and roll-off, also known as RoRo), bulk and auto cargoes. Aside from handling agricultural and mining equipment and other rolling stock, the NWSA’s South Harbor is designated as a strategic military port for transport of military cargoes. Auto customers include Kia, Mazda, Mitsubishi and GM. Auto Warehousing Company (AWC), a tenant, is the largest auto processor on the U.S. West Coast.Real estate business: This line of business is focused on non-terminal industrial and commercial properties and facilities that complement the container and non-container businesses and offer a broad range of services for the NWSA’s international and domestic customers, including warehousing, distribution, manufacturing and marine services.A summary of revenue and operating expenses for the years ended December 31 is presented in the following table (dollars in thousands):
Revenue: 2019 2018 2017
Container $ 160,566 $ 159,667 $ 162,695
Non-container 21,550 20,745 20,750
Real estate 12,906 12,162 11,540
Total revenue 195,022 $ 192,574 $ 194,985
Operating expenses 100,501 89,132 85,895
Operating income $ 94,521 $ 103,442 $ 109,090
The change in net position is an indicator of whether the overall fiscal condition of the NWSA has improved or worsened during the year. The following summary compares operating results for 2019, 2018 and 2017.
Statements of Revenues, Expenses and Changes in Net Position (dollars in thousands):
2019 2018 2017Operating revenues $ 195,022 $ 192,574 $ 194,985
Operating expenses 100,501 89,132 85,895
Operating income 94,521 103,442 109,090
Non-operating revenues (expenses):
Interest income 1,608 1,254 777
Net increase (decrease) in the fair value of investments 405 23 (43)
Other non-operating (expense) income, net (4,444) 3,361 (297)
Total non-operating revenues (expenses), net (2,431) 4,638 437
Capital grant contributions 3,868 3,905 324
Increase in net position before Managing Members contributions and distributions $ 95,958 $ 111,985 $ 109,851
Increase in net position before Managing Members contributions and distributions 95,958 111,985 109,851
Managing Members investment (26,581) (35,514) (33,460)
Increase in net position $ 69,377 $ 76,471 $ 76,391
Net position, beginning of year 283,999 207,528 131,137
Net position, end of year $ 353,376 $ 283,999 $ 207,528

THE NORTHWEST SEAPORT ALLIANCENWSA ANNUAL REPORT 2019
12TABLE OF CONTENTS CEO LETTER LEADERSHIP TRADE STATISTICS FINANCIAL REPORT AUDITOR’S REPORTClick to navigate to section
2018 Revenues, Expenses and Changes in Net Position versus the Prior Year Container business revenue decreased $3.0 million as container revenues were down $4.0 million primarily due to the APM Terminal lease termination payment in the prior year of $5.7 million. The new shipping alliances that were formed in 2017 continued to shift cargo from the South Harbor to the North Harbor and Canada, increasing Terminal 18 revenue by $2.6 million and decreasing revenues at East Sitcum and Husky Terminals by $1.0 million. The shifting of cargo also decreased intermodal revenue by $0.7 million at the north intermodal yard in the South Harbor.
Breakbulk revenues were up $0.5 million as the mix of higher weight cargo increased revenue based on tonnage. Auto revenues were down $0.4 million due to a 4% decrease in auto units as Kia shifted production from Asia to Mexico.
Real estate revenue was up $0.6 million over the prior year due to short-term rents at Terminal 5 of $0.2 million, and multiple other locations had increased rent revenue due to escalations.
Operating expense of $89.1 million increased $3.2 million over the prior year. Depreciation expense increased by $4.1 million as a result of new asset additions and operating expenses were up by $1.1 million for Terminal 46 apron and crane rail design. These increases were offset by lower variable intermodal operating costs (longshore labor, equipment expense) of $1.3 million at the North Intermodal Yard due to container cargo shifting to the North Harbor and Canada and a decrease of $1.0 million from the 2017 extended gate program that was initiated to improve truck turn times and mitigate traffic congestion.
Non-operating income in 2018 was $4.2 million more than the prior year primarily due to the contributed stormwater improvement asset of $3.1 million at Terminal 18. Interest income and an adjustment in fair value of investments of $0.7 million was up $0.3 million versus 2017 due to the rising interest rate environment.
Capital grant contributions from the TIGER grant were $3.9 million in 2018 and $0.3 million in 2017.
2019 Revenues, Expenses and Changes in Net Position versus the Prior Year Container business revenue was relatively flat versus the prior year, increasing $0.9 million as volumes were strong early in 2019 while importers moved orders forward to stay ahead of tariffs, but tapered off later in the year, ending slightly down (0.6 percent) compared to the prior year. Lease expirations and terminations along with effects of the new carrier alliances that shifted cargo between terminals resulted in offsetting revenue variances over the prior year at several terminals. Annual lease escalations netted $2.7 million, the completion of Husky terminal with eight new super-post-Panamax cranes increased rental revenue by $2.4 million, the redevelopment of Terminal 5 which relocated customers in the North Harbor increased revenue by $1.0 million, and intermodal revenues were up $0.9 million due to increased volumes. These positive variances were offset by lease terminations at the East Sitcum Terminal and Terminal 46 totaling $6.0 million.
Non-container business revenues increased $0.8 million over the prior year, driven by auto volumes that were up 12%, which generated $0.6 million in additional revenues. Total breakbulk tonnage was slightly down, however due to a higher concentration of bulk cargoes, which produce more revenues than RoRo cargoes, generated $0.2 million more revenue than the prior year.
Real estate revenue was up $0.7 million compared with the prior year, including $0.4 million at Terminal 25 and $0.1 million at Terminal 104 due to several new leases (Kiewit Infrastructure West, United Parcel Service and Pacific Coast Container) and annual escalations on existing agreements.
Operating expense before depreciation of $89.2 million increased $6.4 million over the prior year. Depreciation expense increased by $5.0 million as a result of new asset additions, primarily for new cranes and improvements at Terminal 4. Operations expenses were up by $3.7 million, primarily for the costs of removing old cranes that were no longer in service in the North Harbor, customer incentive programs, and additional volumes. Maintenance expense was up $2.7 million, driven by increased crane maintenance costs on the four new super-post-Panamax cranes at Husky Terminal, pavement repairs at several locations, and environmental cap repairs.
Non-operating expense for 2019 was $7.8 million more than the prior year, primarily due to current year costs of $3.7 million for sound mitigation barriers related to the Terminal 5 modernization project and prior year contributed stormwater improvement asset of $3.1 million at Terminal 18.
Interest income and an adjustment in fair value of investments of $2.0 million was up $0.7 million versus 2018 due to the rising interest rate environment.
Capital grant contributions from the TIGER grant were $3.9 million in 2019 and $3.9 million in 2018.
On July 10, 2019, elected officials, customers and labor partners helped celebrate the groundbreaking of the Terminal 5 modernization program in Seattle by signing a concrete pile.

THE NORTHWEST SEAPORT ALLIANCENWSA ANNUAL REPORT 2019
13TABLE OF CONTENTS CEO LETTER LEADERSHIP TRADE STATISTICS FINANCIAL REPORT AUDITOR’S REPORTClick to navigate to section
Net PositionThe net position reflects the investments received from the home ports, and the NWSA’s earnings and distributions to Managing Members. The net position is presented as follows (dollars in thousands):
20182019
Activity 2019
Working capital contributions $ 51,000 $ --- $ 51,000
Capital construction contributions 208,586 88,609 297,195
Non-cash capital work-in-process contributions 16,793 --- 16,793
Total contributions 276,379 88,609 364,988
Increase in net position before Managing Member distributions 345,004 95,958 440,962
Distributions to Managing Members (337,384) (115,190) (452,574)
Net position, end of year $ 283,999 $ 69,377 $ 353,376
Capital Assets
The home ports fund the NWSA’s capital investment plan through capital construction contributions, which are reviewed at least annually as part of the budget process or may occur during the year when major projects are authorized by the Managing Members. The investments in capital assets, also referred to as post-formation assets, may include buildings, improvements, machinery and equipment, and construction in process. The Charter does not contain a provision for NWSA to purchase land.
Capital spending for the years ended December 31 is summarized by major project/category in the table below (dollars in thousands):
2019 2018 2017
Pier 4 redevelopment and container cranes $ 39,953 $ 51,211 $ 61,167
Terminal 5 modernization 22,616 529 1,050
Terminal 46 dock rehabilitation 10,479 8,028 ---
North and South Harbor terminal stormwater improvements
6,992 15,041 ---
Facility and building improvements 6,264 726 5,224
Rail improvements 1,016 --- ---
Other 1,289 6,126 1,679
$ 88,609 $ 81,661 $ 69,120
The NWSA’s capital assets, net of depreciation, for its business activities as of December 31, 2019, 2018 and 2017, amounted to $313.9 million, $234.2 million and $152.2 million, respectively. This investment in capital assets includes building and land improvements, machinery and equipment, and construction in process. See Note 3 for additional information.
Subsequent Event On March 11, 2020, the World Health Organization characterized COVID-19 as a global pandemic. A significant portion of the cargo that moves through our gateway is to and from Asia, specifically China. As the recent outbreak of COVID-19 continues to spread throughout the supply chain, we believe it has the potential to have a negative impact on our operating results and financial condition. The extent of the impact of COVID-19 on our operational and financial performance will depend on certain developments, including the duration and spread of the outbreak, impact on supply chains and supply chain employees which at this time are uncertain and cannot be predicted. Given these uncertainties, we cannot reasonably estimate the related impact to our business, operating results and financial condition.
REQUEST FOR INFORMATION
The Northwest Seaport Alliance designed this financial report to provide our citizens, customers, investors and creditors with an overview of the NWSA’s finances. If you have questions or need additional information please visit our website at http://www.nwseaportalliance.com or contact: Chief Financial Officer, P.O. Box 2985, Tacoma, Washington, 98401-2985, Telephone 800-657-9808.
The NWSA hosted the fourth annual Peak Planning Meeting in Seattle in May 2019. The meeting brings together more than 150 representatives from all segments of the supply chain to discuss best practices and build on what we’ve learned in years past.

THE NORTHWEST SEAPORT ALLIANCENWSA ANNUAL REPORT 2019
14TABLE OF CONTENTS CEO LETTER LEADERSHIP TRADE STATISTICS FINANCIAL REPORT AUDITOR’S REPORTClick to navigate to section
FINANCIAL STATEMENTS

THE NORTHWEST SEAPORT ALLIANCENWSA ANNUAL REPORT 2019
15TABLE OF CONTENTS CEO LETTER LEADERSHIP TRADE STATISTICS FINANCIAL REPORT AUDITOR’S REPORTClick to navigate to section
STATEMENTS OF NET POSITION Years Ended December 31, 2019 and 2018 (Dollars in Thousands)
ASSETS
CURRENT ASSETS 2019 2018
Cash and cash equivalents $ 1,083 $ 10,261
Investments, at fair value 62,521 53,807
Trade accounts receivable, net of allowance for doubtful accounts 18,844 14,448
Grants receivable 1,786 3,777
Related-party receivable — Managing Members 14,781 6.919
Prepayments and other current assets 1,031 2,736
Total current assets 100,046 91,948
NON-CURRENT ASSETS
Long-term investments:
Restricted investments, at fair value 13,725 13,369
Long-term investments 13,725 13,369
CAPITAL ASSETSBuildings 15,525 11,637
Improvements 166,699 125,810
Machinery and equipment 101,968 55,604
Construction in process 50,016 50,203
Total cost 334,208 243,254
Less accumulated depreciation 20,260 9,019
Net capital assets 313,948 234,235
OTHER ASSETS
Other assets 101 2,600
Total non-current assets 327,774 250,204
Total assets $427,820 $ 342,152
DEFERRED OUTFLOWS OF RESOURCES
Pension deferred outflows $ 1,488 $ 1,652
LIABILITIES AND NET POSITION
CURRENT LIABILITIES 2019 2018
Accounts payable and accrued liabilities $ 26,627 $ 26,597
Related-party payable — Managing Members 25,956 8,833
Payroll and taxes payable 1,528 1,407
Total current liabilities 54,111 36,837
NON-CURRENT LIABILITIESSecurity deposits 14,676 14,415
Net pension liability 2,316 3,059
Other noncurrent liabilities 3,434 4,236
Total noncurrent liabilities 20,426 21,710
Total liabilities $ 74,537 $ 58,547
DEFERRED INFLOWS OF RESOURCES
Pension deferred inflows $ 1,395 $ 1,258
NET POSITION
Investment in capital assets $ 313,948 $ 234,235
Restricted 13,725 13,369
Unrestricted 25,703 36,395
Total net position $ 353,376 $ 283,999
See notes to financial statements.
In March 2019 ILWU Local 23 workers docked the Zhen Hua 31, carrying four new super-post-Panamax cranes to Husky Terminal in Tacoma.

THE NORTHWEST SEAPORT ALLIANCENWSA ANNUAL REPORT 2019
16TABLE OF CONTENTS CEO LETTER LEADERSHIP TRADE STATISTICS FINANCIAL REPORT AUDITOR’S REPORTClick to navigate to section
STATEMENTS OF REVENUES, EXPENSES AND CHANGES IN NET POSITION December 31, 2019 and 2018 (Dollars in Thousands)
OPERATING REVENUES 2019 2018Property rentals $ 195,022 $ 192,574
Total operating revenues 195,022 192,574
OPERATING EXPENSES
Operations 45,024 41,298
Maintenance 18,460 15,786Administration 19,684 19,283Security 4,774 4,306Environmental 1,287 2,154
Total before depreciation 89,229 82,827Depreciation 11,272 6,305
Total operating expenses 100,501 89,132Operating income 94,521 103,442
NON-OPERATING REVENUES (EXPENSES)Interest income 1,608 1,254Net increase in the fair value of investments 405 23Other non-operating (expenses) revenues, net (4,444) 3,361
Total non-operating (expenses) revenues, net (2,431) 4,638Increase in net position, before capital contributions 92,090 108,080
Capital grant contributions 3,868 3,905Increase in net position before Managing Members contributions and distributions
95,958 111,985Capital construction contributions 88,609 83,326Distributions to Managing Members (115,190) (118,840)
Total Managing Member investment (26,581) (35,514)Net position, beginning of year 283,999 207,528
Net position, end of year $ 353,376 $ 283,999
See notes to financial statements.
As of Jan. 1, 2019, the NWSA Clean Truck Program requires all trucks serving our international container terminals to have a 2007 or newer engine or certified equivalent emission control system. The new emission standards reduce diesel particulate matter emissions by up to 90% per truck.

THE NORTHWEST SEAPORT ALLIANCENWSA ANNUAL REPORT 2019
17TABLE OF CONTENTS CEO LETTER LEADERSHIP TRADE STATISTICS FINANCIAL REPORT AUDITOR’S REPORTClick to navigate to section
STATEMENT OF CASH FLOWS Years Ended December 31, 2019 and 2018 (Dollars in Thousands)
RECONCILIATION OF OPERATING INCOME TO NET CASH PROVIDED BY OPERATING ACTIVITIES 2019 2018
Operating income $ 94,521 $ 103,442
Adjustments to reconcile operating income to net cash provided by operating activities:
Non-operating (expense) income (214) 731
Depreciation 11,272 6,305
Changes in assets and liabilities:
(Increase) decrease in trade accounts receivable (4,290) 7,527
Decrease in prepayments, other current and long-term assets 1,282 126
(Decrease) increase in accounts payable, accrued liabilities and other liabilities
(7,316) 3,594
Increase (decrease) in related-party payable — Managing Members
20,544 (3,814)
(Decrease) increase in security deposits (250) 812
Increase in payroll and taxes payable 80 242
(Decrease) increase in pension-related accounts (443) 674
Total adjustments and changes 20,665 16,197
Net cash provided by operating activities $ 115,186 $ 119,639
NON-CASH INVESTING AND FINANCING ACTIVITIES
Capital asset additions and other purchases financed with accounts payable
$ 3,181 $ 9,053
Contributions receivable from Managing Members for capital construction $ 14,781 $ 6,919
Distributions payable to Managing Members $ (18,270) $ (7,580)
Increase in fair value of investments $ 405 $ 23
See notes to financial statements.
CASH FLOWS FROM OPERATING ACTIVITIES 2019 2018
Cash received from customers $ 187,535 $ 200,183
Cash paid to suppliers, longshore labor and employees (35,001) (43,088)
Cash paid to home ports for support services (37,342) (38,252)
Cash (paid back) held for customer deposits (6) 796
Net cash provided by operating activities 115,186 119,639
CASH FLOWS FROM NON-CAPITAL FINANCING ACTIVITIES
Cash distributions to Managing Members (104,500) (121,400)
Net cash used by non-capital financing activities (104,500) (121,400)
CASH FLOWS FROM CAPITAL AND RELATED FINANCING ACTIVITIES
Cash received from Managing Members for capital construction 80,748 85,435
Acquisition and construction of capital assets (99,271) (87,590)
Cash received from federal grants 5,719 155
Net cash used in capital and related financing activities (12,804) (2,000)
CASH FLOWS FROM INVESTING ACTIVITIES
Purchases of investments (173,462) (96,841)
Proceeds from sales and maturities of investment securities 164,750 102,500
Interest received on investments 1,652 1,229
Net cash (used in) provided by investing activities (7,060) 6,888Net (decrease) increase in cash and cash equivalents (9,178) 3,127
CASH AND CASH EQUIVALENTS
Beginning of year 10,261 7,134
End of year $ 1,083 $ 10,261

THE NORTHWEST SEAPORT ALLIANCENWSA ANNUAL REPORT 2019
18TABLE OF CONTENTS CEO LETTER LEADERSHIP TRADE STATISTICS FINANCIAL REPORT AUDITOR’S REPORTClick to navigate to section
NOTE 1. SUMMARY OF SIGNIFICANT ACCOUNTING POLICIES
Reporting entityThe ports of Seattle and Tacoma (the home ports) formed The Northwest Seaport Alliance (NWSA), a special purpose governmental entity established as a Port Development Authority (PDA), with an effective date of August 4, 2015 (the Effective Date). The PDA was formed pursuant to a provision in Title 53 Revised Code of Washington (RCW) that grants ports that meet certain criteria the authority to create a separate PDA, similar to public development authorities created by Washington cities and counties. Each Port Commission is a Managing Member of the NWSA. Each port will remain a separate legal entity, independently governed by its own elected commissioners. As formed, the NWSA is to continue for an indefinite term until dissolution. As approved, the Charter for the NWSA may be amended only by mutual agreement of both ports as the NWSA’s Managing Members. On January 1, 2016, the NWSA became a separate legal entity.
The State Legislature granted qualifying ports the authority to create a PDA for the management of maritime activities and to allow ports to act cooperatively and use financial resources strategically, while remaining separate entities and complying with federal regulations. Pursuant to the PDA statute, if a PDA is created jointly by more than one port district, the PDA must be managed by each port district as a member, in accordance with the terms of the statute and the Charter. Any port district that creates a PDA must oversee the affairs, operations, and funds of the PDA to correct any deficiency, and ensure the purposes of each program undertaken are reasonably accomplished. The statute permits a PDA, in managing maritime activities of a port district or districts, to own and sell real and personal property; to enter into contracts; to sue and be sued; to loan and borrow funds; to issue bonds, notes, and other evidences of indebtedness; to transfer funds, real or personal property, property interests, or services; and to perform community services related to maritime activities managed by the PDA. As previously discussed, the statute allows, but the Charter prohibits, the NWSA to issue bonds, borrow funds, or enter into other debt instruments. By statute, PDAs do not have the power of eminent domain or the power to levy taxes or special assessments. In transferring real property to a PDA, the port district or districts creating the PDA must impose appropriate deed restrictions necessary to ensure the continued use of the property for the public purpose for which the property is transferred.
The NWSA is governed by its Managing Members, with each Managing Member acting pursuant to the Charter through its elected commissioners. The Managing Members appointed a Chief Executive Officer who is responsible for hiring staff and entering into service agreements with the Managing Members as needed. Staff is comprised of certain Port of Tacoma and former Port of Seattle employees. In addition, both Managing Members provide services through support service agreements with a portion of staff time allocated to and reimbursed by the NWSA.
Effective January 1, 2016, the revenues and expenses associated with Licensed Properties were accounted for and reported by the NWSA. The initial funding of working capital and capital
construction and subsequent earnings and distributions are presented on the statements of net position. Additional information about the formation of the NWSA is presented in the MD&A.
The home ports agreed to share investments, earnings and distributions on a 50/50 basis. The home ports’ initial contribution of Licensed Properties to the NWSA was 50% (based on the value of the contributed facilities using cash flow forecasts for each parcel that went to the NWSA). The initial cash investments totaling $78 million, of which $51 million funded working capital and $27 million funded capital construction projects, were shared equally. The home ports contributed an additional $16.8 million of noncash work-in-process capital projects that started in the home port and will be completed by the NWSA for an opening investment of $94.8 million.
The NWSA distributes cash to each home port based on cash flow from operations, calculated pursuant to generally accepted accounting principles (GAAP). Distributions are to be made no less than quarterly based on each Managing Member’s percentage of total shares; however, distributions have generally been made in the following month after the amount due was determined.
Nature of business The PDA is used to account for the general operations of the NWSA as more fully described below.
The NWSA is authorized by Washington law to provide and charge rentals, tariffs and other fees for docks, wharves and similar harbor facilities, including associated storage and traffic handling facilities, for waterborne commerce. The NWSA may also provide freight and passenger terminals and transfer and storage facilities for other modes of transportation, including air, rail and motor vehicles.
Measurement focus, basis of accounting and presentation
The financial statements of the NWSA have been prepared in conformity with accounting principles generally accepted in the United States of America, as applied to government units. The Governmental Accounting Standards Board (GASB) is the accepted standard-setting body for establishing governmental accounting and financial reporting principles. The NWSA is accounted for on a flow of economic resources measurement focus and the full-accrual basis of accounting where revenues are recognized when earned and expenses are recognized when incurred, regardless of the timing of the related cash flows.
The accounting records of the NWSA are maintained in accordance with methods prescribed by the State Auditor under the authority of Chapter 43.09, RCW. The NWSA also follows the Uniform System of Accounts for Port Districts in the State of Washington.
Use of estimates
The preparation of financial statements in conformity with accounting principles generally accepted in the United States of America requires management to make estimates and assumptions that affect the amounts reported in the financial statements and accompanying notes to the financial statements. Significant estimates also affect the reported amounts of revenues and expenses during the reporting period. Significant estimates made by the NWSA include depreciation and environmental liabilities. Actual results could differ from those estimates.
NOTES TO FINANCIAL STATEMENTS Years Ended December 31, 2019 and 2018

THE NORTHWEST SEAPORT ALLIANCENWSA ANNUAL REPORT 2019
19TABLE OF CONTENTS CEO LETTER LEADERSHIP TRADE STATISTICS FINANCIAL REPORT AUDITOR’S REPORTClick to navigate to section
Significant risks and uncertaintiesTThe NWSA is subject to certain business risks that could have a material impact on future operations and financial performance. These risks include economic conditions, collective bargaining disputes, federal, state and local government regulations, and changes in law.
The formation of the NWSA is intended to reduce pricing competition between the home ports by creating a unified gateway, to allow for coordination regarding customer relationships, to improve capacity utilization between the home ports, and to rationalize strategic capital investments. The formation of the NWSA may or may not successfully address these risks, and may create new risks, including the risks associated with a new joint venture funded by the Managing Members with equal Membership Interests, and reliance on the financial strength of the home ports to fund future capital expenditures and shortfall in working capital.
The Charter requires that the NWSA maintain the Bond Income Calculation and not to take any action that would reasonably reduce its income below this minimum net operating income level unless each Managing Member votes separately to approve that action. This minimum net operating level was established based on the amount required at formation of the NWSA for the Managing Members to meet their then current bond rate covenants, and may not always reflect the amount required to meet bond rate covenants on a go-forward basis.
If net operating income before depreciation of the NWSA is not sufficient for either home port to be in compliance with a rate covenant (as described in each Managing Member’s governing bond resolutions in effect as of the Effective Date), then: (i) upon that Managing Member’s request, the NWSA shall hire an independent third-party consultant to perform analysis and make recommendations for actions needed to achieve bond covenant compliance; (ii) if the consultant recommends an action that the NWSA is unwilling, unable or refuses to undertake, either Managing Member can require dissolution of the NWSA following the dispute resolution process even if within the “Initial Period” (as defined in the Charter, “the expiration of 20 years following the NWSA’s formation”); and (iii) the NWSA shall have at least four months to respond, act and or dissolve following its receipt of the consultant’s recommended action, unless a shorter time is required by the applicable bond covenants.
The NWSA selected as its Chief Executive Officer, the Chief Executive Officer of the Port of Tacoma, who served in those dual roles until the Port of Tacoma hired an Executive Director in June 2019.
Cash and cash equivalentsCash and cash equivalents represents cash and demand deposits. The NWSA maintains its cash in bank deposit accounts, which are covered by the Public Deposit Protection Commission (PDPC) of the State of Washington.
Trade accounts receivable Trade accounts receivable are carried at original invoice amount less an estimate made for doubtful accounts based on a review of all outstanding amounts. Management determines the allowance for doubtful accounts by identifying delinquent accounts and by using historical experience applied to an aging of accounts. Trade accounts receivable are written off when deemed uncollectible. Recoveries of receivables previously written off are recorded when received. The allowance for doubtful accounts at December 31, 2019 and 2018, was $4.4 million and $3.5 million, respectively.
Investments Investments are stated at fair value which is the price that would be received in an orderly transaction between market participants at the measurement date. The NWSA also has investments in the state Local Government Investment Pool (LGIP). The LGIP is similar to a money market fund recognized by the Securities and Exchange Commission. The investments are limited to high-quality obligations with limited maximum and average maturities. These investments are valued at amortized cost. Interest income on investments is recognized as earned. Interest income and changes in the fair value of investments are recognized on the statements of revenues, expenses and changes in net position. The NWSA’s general policy is to not hold more than 20% of its holdings in any one investment. See Note 2 for further information.
Capital assets and depreciation Capital assets are recorded at cost. Donated assets are recorded at acquisition value on the date donated.
The NWSA’s policy is to capitalize all asset additions greater than $20,000 and with an estimated life of more than three years. Depreciation is computed on the straight-line method. The following lives are used:
Years
Buildings and improvements 10-75
Machinery and equipment 3-20
Preliminary costs incurred for proposed projects are deferred pending construction of the facility. As projects are constructed, the project costs are transferred to the appropriate capital asset account; charges that relate to abandoned projects are expensed when the project is abandoned
Net position Net position consists of investment in capital assets, restricted and unrestricted net position. Investment in capital assets consists of capital assets, net of accumulated depreciation which was $313.9 million and $234.2 million at December 31, 2019 and 2018, respectively. Net position is reported as restricted when there are limitations imposed on their use either through the enabling legislation adopted by the NWSA or through external restrictions imposed by creditors, grantors, laws or regulations of other governments. The restricted net position at December 31, 2019 and
NOTE 1. SUMMARY OF SIGNIFICANT ACCOUNTING POLICIES (CONTINUED)

THE NORTHWEST SEAPORT ALLIANCENWSA ANNUAL REPORT 2019
20TABLE OF CONTENTS CEO LETTER LEADERSHIP TRADE STATISTICS FINANCIAL REPORT AUDITOR’S REPORTClick to navigate to section
2018 of $13.7 million and $13.4 million, respectively, were restricted grant and customer restricted investments. The unrestricted component of net position is the net amount of the assets and deferred outflows of resources less liabilities and deferred inflows of resources that are not included in the determination of investment in capital assets or the restricted components of net position. Unrestricted net position was $25.7 million and $36.4 million at December 31, 2019 and 2018, respectively.
Retentions payable The NWSA enters into construction contracts that may include retention provisions such that a certain percentage of the contract amount is held for payment until completion of the contract and acceptance by the NWSA. The NWSA’s policy is to pay the retention due only after completion and acceptance have occurred. Retentions payable totaled $111,000 and $219,000 at December 31, 2019 and 2018, respectively. Retentions payable are included in accounts payable and accrued liabilities on the accompanying statements of net position.
Federal and state grants The NWSA may receive federal and state grants as reimbursement for construction of facilities and other capital projects. These grants are included in capital grant contributions on the accompanying statements of revenues, expenses and changes in net position.
Employee benefits The NWSA accrues unpaid vacation and sick leave benefit amounts as earned and payable upon termination. These benefits are accrued at current rates of compensation. Accrued vacation and sick leave are included in payroll and taxes payable and amounted to $429,000 and $204,000, respectively, at December 31, 2019, and $405,000 and $198,000, respectively, at December 31, 2018. Vacation and sick leave paid in 2019 was $344,000 and $173,000, respectively, and $363,000 and $222,000, respectively, in 2018. The estimated total amount of vacation and sick leave expected to be paid in 2020 is $355,000 and $178,000, respectively.
The NWSA provides health care benefits for eligible employees through the HRA VEBA Trust which a nonprofit, multiple employer voluntary employees’ beneficiary association (VEBA) authorized under Internal Revenue Code 501(c)(9). The HRA VEBA Trust offers a funded health reimbursement arrangement (HRA) plan available to certain governmental employers in the Northwest (Washington, Oregon, and Idaho). The Trust is managed by a Board of Trustees elected by the plan participants, participating employers, or the Board itself, depending on the Trustee position. The NWSA has two plans, one of which was closed to new employees hired after July 1, 2015 (VEBA5), the second plan is open to all eligible employees. The NWSA contributed $120,000 and $81,000 to eligible employee VEBA accounts in 2019 and 2018, respectively.
The NWSA offers its employees a deferred compensation plan created in accordance with Internal Revenue Code Section 457. The plan, available to all NWSA employees, permits them to defer a portion of their salary until future years. In accordance with GASB authoritative guidance, accounting and
reporting for Internal Revenue Code Section 457 deferred compensation plans, employee assets are not reflected in the NWSA’s financial statements. This plan is fully funded and held in an external trust.
The NWSA established a profit sharing plan for nonrepresented employees in accordance with Internal Revenue Code Section 401. The plan provides for an annual contribution to each eligible employee’s 401 account based on the NWSA meeting financial targets. The minimum contribution of $100 or a maximum contribution of 4% of total salaries of eligible employees may be made annually. In addition to the employer contribution, eligible employees may defer a portion of their salary until future years. The NWSA has not utilized this performance plan and, hence, did not contribute to the plan in 2019 or 2018. This plan is fully funded and held in an external trust.
Pensions The NWSA’s full-time and qualifying part-time employees participate in the cost-sharing, multiple-employer public employee defined benefit retirement plans administered by the Washington State Department of Retirement Systems (DRS). The net pension liability, deferred outflows of resources and deferred inflows of resources related to pensions, pension expense, information about the fiduciary net position of the Washington State Department of Retirement Systems Plan (PERS) and additions to/deductions from PERS’s fiduciary net position have been determined on the same basis as they are reported to PERS. For this purpose, benefit payments (including refunds of employee contributions) are recognized when due and payable in accordance with the benefit terms. Investments are reported at fair value (see Note 6).
Environmental remediation costs The NWSA environmental remediation policy requires accrual of pollution remediation obligation amounts when: (a) one of the following specific obligating events is met and (b) the amount can be reasonably estimated. Obligating events include: imminent endangerment to the public; permit violation; NWSA named as party responsible for sharing costs; NWSA named in a lawsuit to compel participation in pollution remediation; or commenced or legally obligated to commence pollution remediation. Potential cost recoveries such as insurance proceeds, if any, are evaluated separately from the NWSA’s pollution remediation obligation. Costs incurred for pollution remediation obligations are typically recorded as non-operating environmental expenses unless the expenditures relate to the NWSA’s principal ongoing operations, in which case they are recorded as operating expenses. Costs incurred for pollution remediation obligations can be capitalized if they meet specific criteria. Capitalization criteria include: preparation of property in anticipation of a sale; preparation of property for use if the property was acquired with known or suspected pollution that was expected to be remediated; performance of pollution remediation that restores a pollution-caused decline in service utility that was recognized as an asset impairment; or acquisition of property, plant and equipment that have a future alternative use not associated with pollution remediation efforts.
The NWSA licenses property from the home ports for its operations. Remediation costs associated with contamination on Licensed Properties that occurred before the formation of the NWSA shall remain the responsibility of the home port in which the Licensed Property is located. Remediation
NOTE 1. SUMMARY OF SIGNIFICANT ACCOUNTING POLICIES (CONTINUED)

THE NORTHWEST SEAPORT ALLIANCENWSA ANNUAL REPORT 2019
21TABLE OF CONTENTS CEO LETTER LEADERSHIP TRADE STATISTICS FINANCIAL REPORT AUDITOR’S REPORTClick to navigate to section
costs associated with redevelopment on Licensed Properties shall be the responsibility of the NWSA. At December 31, 2019 and 2018, the NWSA determined that there was no environmental remediation liability to be recognized.
Security depositsUnder the terms of certain Licensed Property lease agreements, the NWSA’s customers or tenants are required to provide security in the event of delinquencies in rent payment, default, or other events defined in these agreements. The security amounts are determined by lease terms. The NWSA held $14.7 million and $14.4 million in security deposits at December 31, 2019 and 2018, respectively.
Operating and non-operating revenues and expenses Property rental revenues are charges for use of the NWSA’s facilities and are reported as operating revenue. Grants and similar items are recognized as revenue as soon as all eligibility requirements imposed by the provider have been met. Other revenues generated from non-operating sources are classified as non-operating.
Operating expenses are costs primarily related to the property rental activities. Interest expense and other expenses incurred not related to the normal operations of the NWSA’s terminal and property rental activities are classified as non-operating.
Reclassifications Certain reclassifications have been made to prior year amounts to conform to the current presentation. These reclassifications have no effect on previously reported changes in net position.
Recent accounting pronouncement In May 2017, GASB issued Statement No. 87, Leases. The objective of this statement is to better meet the information needs of financial statement users by improving accounting and financial reporting for leases by governments. The requirements of this statement are effective for reporting periods beginning after December 15, 2019. The NWSA is currently evaluating the effect of the adoption of this standard on its financial statements and related disclosures and the adoption is expected to have a significant impact on the statements of net position.
Recent accounting pronouncement, adopted In January 2017, the GASB issued Statement No. 84, Fiduciary Activities. The objective of this statement is to improve guidance regarding the identification of fiduciary activities for accounting and financial reporting purposes and how those activities should be reported and this statement establishes criteria for identifying fiduciary activities of all state and local governments. The requirements of this statement are effective for reporting periods beginning after December 15, 2018. The NWSA adopted this standard which did not have a material effect on its financial statements and related disclosures.
NOTE 1. SUMMARY OF SIGNIFICANT ACCOUNTING POLICIES (CONCLUDED)
Top: Washington Gov. Jay Inslee joined lawmakers, stakeholders and industry leaders October 2019 to celebrate the kickoff of the $2 billion Puget Sound Gateway Program, which includes the completion of state Route 167 in Pierce County and state Route 509 in King County. These projects complete the critical freight links between our marine terminals to industrial lands and support regional economic growth.
Bottom: The Agriculture Transportation Coalition hosted its 31st Annual Meeting in Tacoma. Nearly 500 attendees, representing companies that import and export food, farm and fiber products, gathered in June 2019 to discuss critical issues related to exporting their products to international markets.

THE NORTHWEST SEAPORT ALLIANCENWSA ANNUAL REPORT 2019
22TABLE OF CONTENTS CEO LETTER LEADERSHIP TRADE STATISTICS FINANCIAL REPORT AUDITOR’S REPORTClick to navigate to section
NOTE 2. DEPOSITS AND INVESTMENTS
Discretionary deposits The NWSA’s cash of $1.1 million and $10.3 million at December 31, 2019 and 2018, respectively, were deposited in qualified depositories as required by state statute. Deposits in excess of federal depository insurance coverage are covered by the PDPC of the State of Washington. The PDPC is a statutory authority under Chapter 39.58 RCW. Currently, all public depositories with the state fully collateralize uninsured public deposits at 50%.
Investments State of Washington statutes authorize the NWSA to invest in direct obligations of the U.S. Government, certificates of deposit, bankers’ acceptances, repurchase agreements, commercial paper, supranationals and certain municipal bonds. These investments must be placed with or through qualified public depositories of the State of Washington.
Risks Interest rate risk: Interest rate risk is the risk that changes in interest rates will adversely affect the fair value of an investment. The NWSA’s investment guideline is to maximize investment return while preserving liquidity. To the extent possible, the NWSA will attempt to match its investments with anticipated cash flow requirements using the specific-identification method. The NWSA does not have a formal interest rate risk policy.
Concentration risk: Concentration risk is defined as holdings greater than 5% as noted in the table below. The NWSA does not have a formal concentration risk policy.
Credit risk: Credit risk is the risk that an issuer of an investment will not fulfill its obligation to the holder of the investment. This is measured by the assignment of a rating by a nationally recognized statistical rating organization. The LGIP is an external investment pool, as defined by the GASB. The NWSA does not have a formal credit risk policy.
Custodial credit risk: Custodial credit risk is the risk that, in the event of the failure of the counterparty, the NWSA will not be able to recover the value of its investments or collateral securities that are in the possession of the outside party. To minimize this risk, the NWSA’s policy requires that all security transactions are settled “delivery versus payment.” This means that payment is made simultaneously with the receipt of the security. These securities are delivered to the NWSA’s safekeeping bank. With the exception of the Washington State LGIP, the NWSA’s investment securities are registered, or held by the NWSA or its agent in the NWSA’s name. The
certificates of deposit are covered by the PDPC. The PDPC is a statutory authority under Chapter 39.58 RCW. The PDPC approves which banks and thrifts can hold state and local government deposits and monitors collateral pledged to secure uninsured public deposits. This secures public treasurers’ deposits when they exceed the amount insured by the FDIC by requiring banks and thrifts to pledge securities as collateral.
The LGIP manages a portfolio of securities that meet the maturity, quality, diversification and liquidity requirements set forth by the GASB for external investment pools that elect to measure, for financial reporting purposes, investments at amortized cost. The funds are limited to high quality obligations with regulated maximum and average maturities to minimize both market and credit risk. LGIP participants may contribute and withdraw funds on a daily basis. Participants must inform the Office of the State Treasurer of any contribution or withdrawal over $1 million no later than 9 a.m. on the same day the transaction is made. Contributions or withdrawals for $1 million or less can be requested at any time prior to 10 a.m. on the day of the transaction. However, participants may complete transactions greater than $1 million when notification is made between 9 a.m. and 10 a.m., at the sole discretion of the Office of the State Treasurer. All participants are required to file with the State Treasurer documentation containing the names and titles of the officials authorized to contribute or withdraw funds.
Investments and restricted investments for long-term-lease deposit and clean truck program funding on the statements of net position are as follows (dollars in thousands):
2019 2018
Investments $ 62,521 $ 53,807
Restricted investments at fair value 13,725 13,369
Total deposits and investments $ 76,246 $ 67,176
The tables below identify the types of investments, concentration of investments in any one issuer, and
THE NORTHWEST SEAPORT ALLIANCENWSA ANNUAL REPORT 2019
23TABLE OF CONTENTS CEO LETTER LEADERSHIP TRADE STATISTICS FINANCIAL REPORT AUDITOR’S REPORTClick to navigate to section
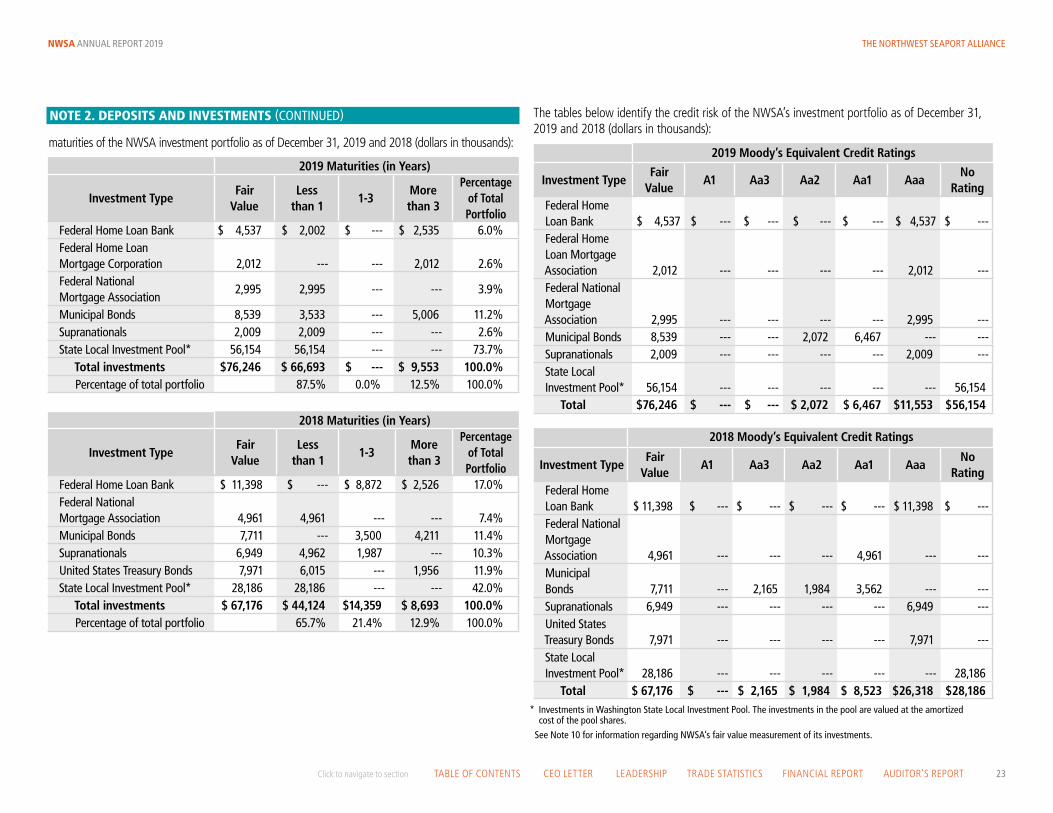
The tables below identify the credit risk of the NWSA’s investment portfolio as of December 31, 2019 and 2018 (dollars in thousands):
2019 Moody’s Equivalent Credit Ratings
Investment TypeFair
ValueA1 Aa3 Aa2 Aa1 Aaa
No Rating
Federal Home Loan Bank $ 4,537 $ --- $ --- $ --- $ --- $ 4,537 $ ---Federal Home Loan Mortgage Association 2,012 --- --- --- --- 2,012 ---Federal National Mortgage Association 2,995 --- --- --- --- 2,995 ---Municipal Bonds 8,539 --- --- 2,072 6,467 --- ---Supranationals 2,009 --- --- --- --- 2,009 ---State Local Investment Pool* 56,154 --- --- --- --- --- 56,154
Total $76,246 $ --- $ --- $ 2,072 $ 6,467 $11,553 $56,154
2018 Moody’s Equivalent Credit Ratings
Investment TypeFair
ValueA1 Aa3 Aa2 Aa1 Aaa
No Rating
Federal Home Loan Bank $ 11,398 $ --- $ --- $ --- $ --- $ 11,398 $ ---Federal National Mortgage Association 4,961 --- --- --- 4,961 --- ---Municipal Bonds 7,711 --- 2,165 1,984 3,562 --- ---Supranationals 6,949 --- --- --- --- 6,949 ---United States Treasury Bonds 7,971 --- --- --- --- 7,971 ---State Local Investment Pool* 28,186 --- --- --- --- --- 28,186
Total $ 67,176 $ --- $ 2,165 $ 1,984 $ 8,523 $26,318 $28,186* Investments in Washington State Local Investment Pool. The investments in the pool are valued at the amortized cost of the pool shares.See Note 10 for information regarding NWSA’s fair value measurement of its investments.
maturities of the NWSA investment portfolio as of December 31, 2019 and 2018 (dollars in thousands):
2019 Maturities (in Years)
Investment TypeFair
ValueLess
than 11-3
More than 3
Percentage of Total Portfolio
Federal Home Loan Bank $ 4,537 $ 2,002 $ --- $ 2,535 6.0%Federal Home Loan Mortgage Corporation 2,012 --- --- 2,012 2.6%Federal National Mortgage Association
2,995 2,995 --- --- 3.9%
Municipal Bonds 8,539 3,533 --- 5,006 11.2%Supranationals 2,009 2,009 --- --- 2.6%State Local Investment Pool* 56,154 56,154 --- --- 73.7%
Total investments $76,246 $ 66,693 $ --- $ 9,553 100.0%Percentage of total portfolio 87.5% 0.0% 12.5% 100.0%
2018 Maturities (in Years)
Investment TypeFair
ValueLess
than 11-3
More than 3
Percentage of Total Portfolio
Federal Home Loan Bank $ 11,398 $ --- $ 8,872 $ 2,526 17.0%Federal National Mortgage Association 4,961 4,961 --- --- 7.4%Municipal Bonds 7,711 --- 3,500 4,211 11.4%Supranationals 6,949 4,962 1,987 --- 10.3%United States Treasury Bonds 7,971 6,015 --- 1,956 11.9%State Local Investment Pool* 28,186 28,186 --- --- 42.0%
Total investments $ 67,176 $ 44,124 $14,359 $ 8,693 100.0%Percentage of total portfolio 65.7% 21.4% 12.9% 100.0%
NOTE 2. DEPOSITS AND INVESTMENTS (CONTINUED)
THE NORTHWEST SEAPORT ALLIANCENWSA ANNUAL REPORT 2019
24TABLE OF CONTENTS CEO LETTER LEADERSHIP TRADE STATISTICS FINANCIAL REPORT AUDITOR’S REPORTClick to navigate to section
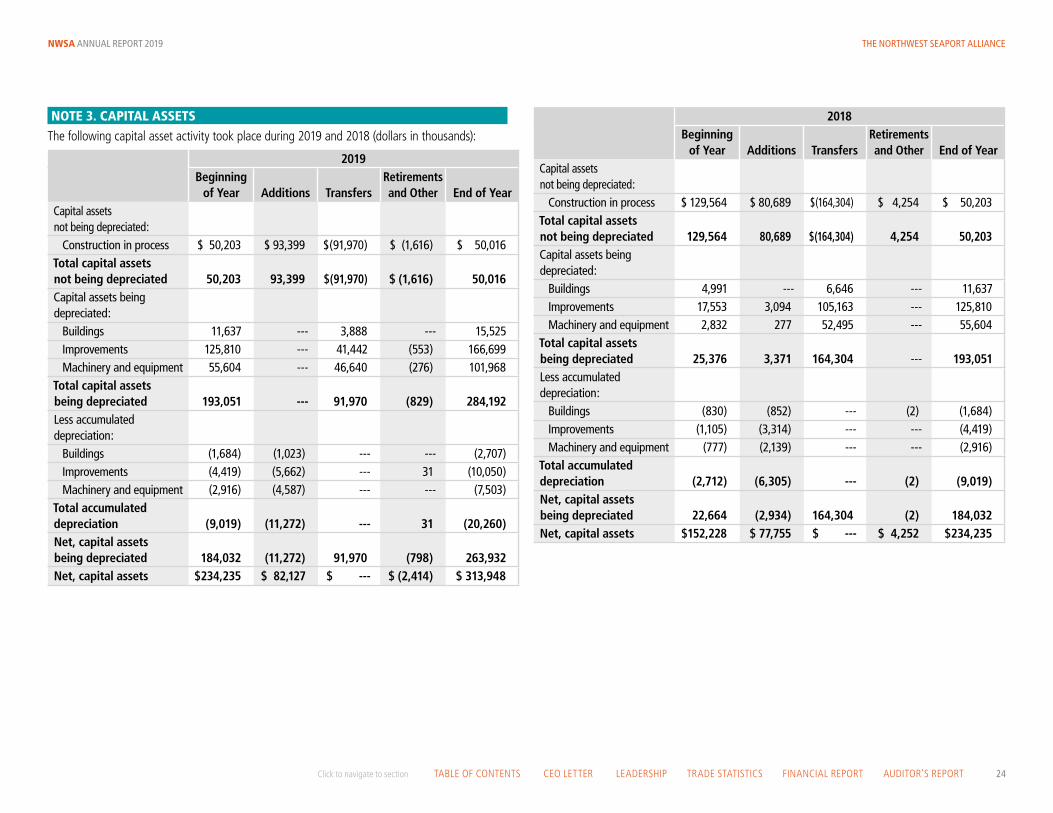
NOTE 3. CAPITAL ASSETS
The following capital asset activity took place during 2019 and 2018 (dollars in thousands):
2019Beginning
of Year Additions TransfersRetirements and Other
End of Year
Capital assets not being depreciated:
Construction in process $ 50,203 $ 93,399 $(91,970) $ (1,616) $ 50,016Total capital assets not being depreciated 50,203 93,399 $(91,970) $ (1,616) 50,016Capital assets being depreciated: Buildings 11,637 --- 3,888 --- 15,525 Improvements 125,810 --- 41,442 (553) 166,699 Machinery and equipment 55,604 --- 46,640 (276) 101,968Total capital assets being depreciated 193,051 --- 91,970 (829) 284,192Less accumulated depreciation: Buildings (1,684) (1,023) --- --- (2,707) Improvements (4,419) (5,662) --- 31 (10,050) Machinery and equipment (2,916) (4,587) --- --- (7,503) Total accumulated depreciation (9,019) (11,272) --- 31 (20,260) Net, capital assets being depreciated 184,032 (11,272) 91,970 (798) 263,932Net, capital assets $234,235 $ 82,127 $ --- $ (2,414) $ 313,948
2018Beginning
of Year Additions TransfersRetirements and Other
End of Year
Capital assets not being depreciated:
Construction in process $ 129,564 $ 80,689 $(164,304) $ 4,254 $ 50,203Total capital assets not being depreciated 129,564 80,689 $(164,304) 4,254 50,203Capital assets being depreciated: Buildings 4,991 --- 6,646 --- 11,637 Improvements 17,553 3,094 105,163 --- 125,810 Machinery and equipment 2,832 277 52,495 --- 55,604Total capital assets being depreciated 25,376 3,371
164,304 --- 193,051
Less accumulated depreciation: Buildings (830) (852) --- (2) (1,684) Improvements (1,105) (3,314) --- --- (4,419) Machinery and equipment (777) (2,139) --- --- (2,916) Total accumulated depreciation (2,712) (6,305) --- (2) (9,019) Net, capital assets being depreciated 22,664 (2,934)
164,304 (2) 184,032
Net, capital assets $152,228 $ 77,755 $ --- $ 4,252 $234,235

THE NORTHWEST SEAPORT ALLIANCENWSA ANNUAL REPORT 2019
25TABLE OF CONTENTS CEO LETTER LEADERSHIP TRADE STATISTICS FINANCIAL REPORT AUDITOR’S REPORTClick to navigate to section
NOTE 4. RISK MANAGEMENT
The NWSA is exposed to various risks of loss related to torts; damage to, theft of, and destruction of assets or cargo; natural disasters; and employee injuries. To limit its exposure, the NWSA purchases a variety of insurance policies. For marine general liability, the NWSA purchases $150 million in coverage, subject to a $500,000 deductible. All risk property insurance is purchased by the home ports to include assets owned by the NWSA situated on home port land and the NWSA is listed as a named insured where its interest applies. For details concerning property insurance, please consult the notes to the year-end financial reports for the respective home ports.
The NWSA is self-insured for its regular medical coverage. The liability for unpaid medical claims is included in payroll and taxes payable on the accompanying statements of net position and is expected to be paid in 2020. Excess loss coverage has been purchased through an outside provider to limit individual loss to $110,000. Self-insured claim activity for December 31, 2019, 2018, and 2017 were as follows (dollars in thousands):
2019 2018 2017Claims liability, beginning of year $ 357 $ 121 $ 105Claims reserve 1,176 1,308 748Payments on claims (1,150) (1,072) (732)
Claims liability, end of year $ 383 $ 357 $ 121
The NWSA is self-insured for workers compensation losses. These losses are subject to a $1.25 million self-insured retention as a Named Insured under the Port of Tacoma’s excess workers’ compensation policy. The estimated liability for workers’ compensation is included in payroll and taxes payable on the accompanying financial statements of net position. At December 31, 2019, the estimated self-insurance liability for workers’ compensation was $46,000 and this amount is expected to be paid in 2020. At December 31, 2018, the estimated self-insurance liability for workers’ compensation was $21,000. The liability for unpaid claims represents the estimated future indemnity, medical, rehabilitation, and legal costs for all open claims.
Workers’ compensation claim activity for December 31, 2019, 2018, and 2017 were as follows (dollars in thousands):
2019 2018 2017Claims liability, beginning of year $ 21 $ 22 $ ---Claims incurred during the year 71 71 28Changes in estimate for prior year claims 16 (8) ---Payments on claims (62) (64) (6)
Claims liability, end of year $ 46 $ 21 $ 22
NOTE 5. LEASE COMMITMENTS
The NWSA leases land, office space and other equipment under operating leases that expire through 2023. Future minimum lease payments under noncancelable operating leases are as follows (dollars in thousands):
Years ending December 31:2020 $ 1,1302021 5152022 5152023 515
Total minimum payments required $ 2,675
Total rent expense under noncancelable operating leases for the year ended December 31, 2019, was $1,322,000.
The NWSA, as a lessor (via licensing agreements with the home ports), leases land and facilities under terms of one to 50 years. In addition, some properties are rented on a month-to-month basis. Future minimum rents receivable under noncancelable operating leases and subleases are as follows (dollars in thousands):
Years ending December 31:2020 $ 101,7382021 97,5052022 95,8902023 96,9162024 97,578Thereafter 1,446,079
Total minimum future rents $ 1,935,706
Licensed assets of the home ports and NWSA assets held for rental and leasing purposes for the year ended December 31, 2019, are as follows (dollars in thousands):
Land $ 659,201 Buildings, improvements and equipment, net 783,673
Total, net of accumulated depreciation $ 1,442,874

THE NORTHWEST SEAPORT ALLIANCENWSA ANNUAL REPORT 2019
26TABLE OF CONTENTS CEO LETTER LEADERSHIP TRADE STATISTICS FINANCIAL REPORT AUDITOR’S REPORTClick to navigate to section
NOTE 6. PENSION PLANS
The NWSA’s full-time and qualifying part-time employees participate in the cost-sharing, multiple-employer public employee defined benefit retirement plans (PERS) administered by the Washington State Department of Retirement Systems. Historical trend and other information regarding each plan are presented in the Washington State Department of Retirement Systems comprehensive annual financial report. A copy of this report may be obtained at: Historical trends and other information regarding each plan are presented in the Washington State Department of Retirement Systems comprehensive annual financial report. A copy of this report may be obtained at:
Department of Retirement Systems Communications Unit P. O. Box 48380 Olympia, WA 98504-8380 www.drs.wa.gov
Plan description and benefits
PERS was established in 1947, and its retirement benefit provisions are contained in Chapters 41.34 and 41.40 RCW. PERS is a cost-sharing, multiple-employer retirement system composed of three separate pension plans for membership purposes. PERS Plan 1 and PERS Plan 2 are defined benefit plans, and PERS Plan 3 is a defined benefit plan with a defined contribution component.
PERS members include elected officials; state employees; employees of the Supreme, Appeals and Superior Courts; employees of the Legislature; employees of district and municipal courts; employees of local governments; and higher education employees not participating in higher education retirement programs (HERPs).
PERS is composed of and reported as three separate plans for accounting purposes: Plan 1, Plan 2/3 and Plan 3. Plan 1 accounts for the defined benefits of Plan 1 members. Plan 2/3 accounts for the defined benefits of Plan 2 members and the defined benefit portion of benefits for Plan 3 members. Plan 3 accounts for the defined contribution portion of benefits for Plan 3 members.
Although members can only be a member of either Plan 2 or Plan 3, the defined benefits of Plan 2 and Plan 3 are accounted for in the same pension trust fund. All assets of Plan 2/3 may legally be used to pay the defined benefits of any of the Plan 2 or Plan 3 members or beneficiaries, as the terms of the plans define. Therefore, Plan 2/3 is considered a single plan for accounting purposes.
As of June 30, 2019, 309 employers and 840 nonemployer contributing entities were participating in PERS Plan 1. The plan is closed to new entrants. PERS 1 members were vested after the completion of five years of eligible service. PERS Plan 1 provides retirement, disability and death benefits. Retirement benefits are calculated using 2% of the member’s Average Final Compensation (AFC) times the member’s years of service. AFC is the average of the member’s 24 consecutive highest-paid service
credit months. Members are eligible for retirement from active status at any age with at least 30 years of service, at age 55 with at least 25 years of service, or at age 60 with at least five years of service.
PERS Plan 1 retirement benefits are actuarially reduced to reflect the choice of a survivor benefit. Members retiring from inactive status before the age of 65 may also receive actuarially reduced benefits. Other benefits include duty and nonduty disability payments, an optional Cost-of-Living Adjustment (COLA), and a one-time, duty-related death benefit, if found eligible by the Washington State Department of Labor & Industries.
The PERS Plan 1 member contribution rate is established by statute at 6%. The employer contribution rate is developed by the Office of the State Actuary (OSA) and includes an administrative expense component that is currently set at 0.18%.
PERS Plan 2 members are vested after completing five years of eligible service. Plan 3 members are vested in the defined benefit portion of their plan after 10 years of service or after five years of service if 12 months of that service are earned after age 44. PERS Plan 2/3 provides retirement, disability and death benefits. Retirement benefits for Plan 2 are calculated using 2% of the member’s AFC times the member’s years of service. Retirement defined benefits for Plan 3 are calculated using 1% of AFC times the member’s years of service. AFC is the monthly average of the member’s 60 consecutive highest-paid service credit months. PERS Plan 2/3 has no cap on years of service credit.
Members are eligible for retirement with a full benefit at 65 with at least five years of service credit. Retirement before age 65 is considered an early retirement. PERS Plan 2/3 members who have at least 20 years of service credit and are 55 years of age or older are eligible for early retirement with a reduced benefit. The benefit is reduced by a factor that varies according to age for each year before age 65. PERS Plan 2/3 retirement benefits are actuarially reduced to reflect the choice of a survivor benefit. Other PERS Plan 2/3 benefits include duty and nonduty disability payments; a COLA based on the Consumer Price Index, capped at 3% annually; and a one-time, duty-related death benefit, if found eligible by the Washington State Department of Labor & Industries.
The PERS Plan 2/3 employer and employee contribution rates are developed by the OSA to fully fund Plan 2 and the defined benefit portion of Plan 3. The Plan 2/3 employer rates include a component to address the PERS Plan 1 unfunded actuarial accrued liability and an administrative expense that is currently set at 0.18%.
PERS Plan 3 members are immediately vested in the defined contribution portion of their plan. PERS Plan 3 defined contribution benefits are totally dependent on employee contributions and investment earnings on those contributions. PERS Plan 3 members choose their contribution rate when joining membership and can change rates only when changing employers. As established by Chapter 41.34 RCW, Plan 3 defined contribution rates are set at a minimum of 5% and a maximum of 15%; members have six rate options to choose from. Employers do not contribute to the defined contribution benefits.

THE NORTHWEST SEAPORT ALLIANCENWSA ANNUAL REPORT 2019
27TABLE OF CONTENTS CEO LETTER LEADERSHIP TRADE STATISTICS FINANCIAL REPORT AUDITOR’S REPORTClick to navigate to section
Pension liabilities, pension expense, and deferred inflows and outflows of resources and related to pensionsAt December 31, 2019 and 2018, the NWSA reported a liability of $2.3 million and $3.1 million, respectively, for its proportionate share of the net pension liability. The net pension liability was measured as of June 30, 2019 and 2018, the total pension liability used to calculate the net pension liability was determined by an actuarial valuation as of that date. The NWSA’s proportion of the net pension liability was based on a projection of the NWSA’s long-term share of contributions to the pension plan relative to the projected contributions of all participating agencies, actuarially determined. At June 30, 2019, the NWSA’s proportionate share of net pension liability and the change in proportionate share from June 30, 2018, is presented in the following table (dollars in thousands):
PERS 1 PERS 2/3 TotalNWSA’s proportionate share of the net pension liability:
2019 $ 1,746 $ 570 $ 2,3162018 2,052 1,007 3,059
PERS 1 PERS 2/3NWSA’s proportionate share of the net pension liability:
2019 0.0454% 0.0586%2018 0.0459% 0.0590%Change in proportionate share -0.0005% -0.0004%
PERS 1 PERS 2/3 TotalNWSA’s net pension expense/(benefit):
2019 $ (259) $ (184) $ (443)2018 982 (308) 674
* The employer rates include the employer administrative expense fee of 0.18% for 2019 and 2018
** Plan 3 defined benefit portion only
*** Rate selected by PERS 3 members, 5% minimum to 15% maximum
Contributions The required contribution rates, expressed as a percentage of covered payrolls, as of December 31, 2019 and 2018, were:
2019 PERS Plan 1 PERS Plan 2 PERS Plan 3Employer* 12.83% 12.83% 12.83%**Employee 6.00% 7.41% ***
2018 PERS Plan 1 PERS Plan 2 PERS Plan 3Employer* 12.83% 12.83% 12.83%**Employee 6.00% 7.41% ***
The NWSA made contributions of $314,000 to PERS 1 and $502,000 to PERS 2/3 during 2019 and $326,000 to PERS 1 and $495,000 to PERS 2/3 during 2018. And the employees made the required contributions for 2019 and 2018. The NWSA’s required contributions for the years ended December 31 are as follows (dollars in thousands):
Year PERS Plan 1 PERS Plan 2/3 Total2019 $ 326 $ 491 $ 8172018 309 472 781
NOTE 6. PENSION PLANS (CONTINUED)
In 2019, the NWSA and the Port of Tacoma reported a record year with more than 190,000 autos handled through the two auto processing facilities at the gateway.

THE NORTHWEST SEAPORT ALLIANCENWSA ANNUAL REPORT 2019
28TABLE OF CONTENTS CEO LETTER LEADERSHIP TRADE STATISTICS FINANCIAL REPORT AUDITOR’S REPORTClick to navigate to section
2019 PERS 1 PERS 2/3 TotalSources of deferred outflow of resources:Net difference between projected and actual earnings on pension plan investments (2) $ --- $ --- $ ---Changes in assumptions (1) --- 15 15Differences between expected and actual experience (1) --- 163 163Changes in proportion and differences between NWSA contributions and proportionate share of contributions (1) --- 898 898NWSA contributions subsequent to measurement date 152 260 412
Total $ 152 $ 1,336 $ 1,488
2019 PERS 1 PERS 2/3 TotalSources of deferred inflow of resources:Net difference between projected and actual earnings on pension plan investments (2) $ (117) $ (829) $ (946)Changes in assumptions (1) --- (239) (239)Differences between expected and actual experience (1) --- (122) (122)Changes in proportion and differences between NWSA contributions and proportionate share of contributions (1) (88) (88)
Total $ (117) $ (1,278) $ (1,395)
(1) The recognition period for each plan is equal to the average of the expected remaining service lives of all employees provided with pensions through the pension plan, which was determined at the beginning of the measurement date.
(2) The recognition period is a closed, 5-year period for all plans.
NOTE 6. PENSION PLANS (CONTINUED)
For the year ended December 31, 2019 and 2018, deferred outflows of resources and deferred inflows of resources related to pensions were from the following sources (dollars in thousands):

THE NORTHWEST SEAPORT ALLIANCENWSA ANNUAL REPORT 2019
29TABLE OF CONTENTS CEO LETTER LEADERSHIP TRADE STATISTICS FINANCIAL REPORT AUDITOR’S REPORTClick to navigate to section
2018 PERS 1 PERS 2/3 TotalSources of deferred outflow of resources:Net difference between projected and actual earnings on pension plan investments (2) $ --- $ --- $ ---Changes in assumptions (1) --- 12 12Differences between expected and actual experience (1) --- 123 123Changes in proportion and differences between NWSA contributions and proportionate share of contributions (1) --- 1,111 1,111NWSA contributions subsequent to measurement date 165 241 406
Total $165 $ 1,487 $ 1,652
2018 PERS 1 PERS 2/3 TotalSources of deferred inflow of resources:Net difference between projected and actual earnings on pension plan investments (2) $ (82) $ (618) $ (700)Changes in assumptions (1) --- (287) (287)Differences between expected and actual experience (1) --- (176) (176)Changes in proportion and differences between NWSA contributions and proportionate share of contributions (1) --- (95) (95)
Total $ (82) $ (1,176) $ (1,258)
(1) The recognition period for each plan is equal to the average of the expected remaining service lives of all employees provided with pensions through the pension plan, which was determined at the beginning of the measurement date.
(2) The recognition period is a closed, 5-year period for all plans.
NOTE 6. PENSION PLANS (CONTINUED)
The winners of the North Star Awards were announced in April 2019 at the NWSA Annual Breakfast. Left: TOTE Maritime Alaska received the 2019 Environmental Stewardship Award. Right: Prologis received the 2019 Cargo Anchor Award.

THE NORTHWEST SEAPORT ALLIANCENWSA ANNUAL REPORT 2019
30TABLE OF CONTENTS CEO LETTER LEADERSHIP TRADE STATISTICS FINANCIAL REPORT AUDITOR’S REPORTClick to navigate to section
As of December 31, 2019, deferred outflows of resources related to pensions resulting from NWSA’s contributions subsequent to the measurement date were $412,000 and will be recognized as a reduction of the net pension liability in the year ended December 31, 2020. Other amounts reported as deferred outflows of resources and deferred inflows of resources related to pensions will be recognized in pension expense as follows (dollars in thousands):
Years ending December 31: PERS 1 PERS 2/3 Total2020 $ (26) $ (61) $ (87)2021 (61) (232) (293)2022 (22) 5 (17)2023 (8) 92 842024 --- (10) (10)Thereafter --- 4 4
Total $ (117) $ (202) $ (319)
Actuarial assumptionsThe 2019 pension liability (TPL) for each of the plans was determined by an actuarial valuation as of June 30, 2018, with the results rolled forward to June 30, 2019. Besides the discount rate, the actuarial assumptions used in the June 30, 2018, valuation were based on the results of the 2007-2012 Experience Study Report and the 2017 Economic Experience Study. Additional assumptions for subsequent events and law changes are current as of the 2018 actuarial valuation report.
The TPL was calculated as of the valuation date and rolled forward to the measurement date of June 30, 2019. Plan liabilities were rolled forward from June 30, 2018, to June 30, 2019, reflecting each plan’s normal cost (using the entry age cost method), assumed interest and actual benefit payments. Additional assumptions for subsequent events and law changes are current as of the 2018 actuarial valuation report and are as follow:
Inflation
2.75% total economic inflation; 3.50% salary inflation (2018: 2.75% for total economic inflation; 3.50% for salary inflation).
Salary increasesIn addition to the base 3.50% salary inflation assumption, salaries are also expected to grow by promotions and longevity (2018: salaries were expected to grow 3.50%).
Investment rate of return7.40% (2018: 7.40%).
Mortality ratesRates were based on the RP-2000 reports, “Combined Healthy Table” and “Combined Disabled Table”, which the Society of Actuaries publishes. The OSA applied offsets to the base table and recognized future improvements in mortality by projecting the mortality rates using 100% Scale BB. Mortality rates are applied on a generational basis, meaning members are assumed to receive additional mortality improvements in each future year throughout their lifetimes.
Long-term expected rate of return The OSA selected a 7.40% long-term expected rate of return on pension plan investments using a building-block method (2018: 7.40% long-term expected rate of return). In selecting this assumption, OSA reviewed the historical experience data, considered the historical conditions that produced past annual investment returns, and considered Capital Market Assumptions (CMA) and simulated expected investment returns the Workplace Safety & Insurance Board (WSIB) provided.
The CMAs contain three pieces of information for each class of assets WSIB currently invests in:
• Expected annual return • Standard deviation of the annual return • Correlations between the annual returns of each asset class with every other asset class
The WSIB uses the CMAs and their target asset allocation to simulate future investment returns over various time horizons.
Estimated rates of return by asset classBest estimates of arithmetic real rates of return for each major asset class included in the pension plan’s target asset allocation as of December 31, 2019 are summarized below.
Asset Class Target Allocation% Long-Term Expected Real Rate of Return Arithmetic
Fixed income 20% 2.20%Tangible assets 7% 5.10%Real estate 18% 5.80%Global equity 32% 6.30%Private equity 23% 9.30%
Total 100%
The inflation component used to create the table is 2.20 percent and represents WSIB’s most recent long-term estimate of broad economic inflation.
NOTE 6. PENSION PLANS (CONTINUED)

THE NORTHWEST SEAPORT ALLIANCENWSA ANNUAL REPORT 2019
31TABLE OF CONTENTS CEO LETTER LEADERSHIP TRADE STATISTICS FINANCIAL REPORT AUDITOR’S REPORTClick to navigate to section
Discount rateThe discount rate used to measure the total pension liability was 7.40% for all plans (2018: 7.40%). To determine that rate, an asset sufficiency test was completed to test whether each pension plan’s fiduciary net position was sufficient to make all projected future benefit payments for current plan members. Consistent with current law, the asset sufficiency test included an assumed 7.50% long-term discount rate to determine funding liabilities for calculating future contribution rate requirements. Consistent with the long-term expected rate of return, a 7.40% future investment rate of return on invested assets was assumed for the test.
Contributions from plan members and employers are assumed to continue being made at contractually required rates (including PERS Plans 2 and 3, whose rates include a component for the PERS Plan 1 liability). Based on those assumptions, the pension plan’s fiduciary net position was projected to be available to make all projected future benefit payments of current plan members. Therefore, the long-term expected rate of return of 7.40% was used to determine the total liability (2018: 7.40%).
Sensitivity net pension liability to changesin the discount rate The table below presents the net pension liability of employers, calculated using the discount rate of 7.40% as well as what employers’ net pension liability would be if it were calculated using a discount rate 1 percentage point lower (6.40%) or 1 percentage point higher (8.40%) than the current rate (dollars in thousands):
December 31, 2019: Pension Trust 1% Decrease Discount Rate 1% IncreaseDiscount rate 6.40% 7.40% 8.40%Proportionate share of net pension liability PERS 1 $ 2,187 $ 1,746 $ 1,364Proportionate share of net pension liability/(asset) PERS 2/3 4,368 570 (2,547)
December 31, 2018: Pension Trust 1% Decrease Discount Rate 1% IncreaseDiscount rate 6.40% 7.40% 8.40%Proportionate share of net pension liability PERS 1 $ 2,521 $ 2,052 $ 1,645Proportionate share of net pension liability/(asset) PERS 2/3 4,606 1,007 (1,944)
Detailed information about the pension plan’s fiduciary net position is available in the separately issued DRS financial reports. Additional actuarial and pension plan information is included in the DRS 2019 Comprehensive Annual Financial Report, including descriptions of actuarial data, assumptions, methods, and plan provisions relied on for the preparation of GASB 67 and GASB 68. Additional details regarding this information is included in OSA’s 2018 Actuarial Valuation Report on the OSA website.
Change in assumptions and methods Actuarial results that OSA provided within this publication reflect the following changes in assumptions and methods:
• OSA updated modeling to reflect providing benefit payments to the date of initial retirement eligibility for terminated vested members who delay application for retirement benefits.
• OSA updated Cost-of-Living Adjustment (COLA) programming to reflect legislation signed during the 2018 Legislative Session (C151 L18). This law provides PERS Plan 1 annuitants who are not receiving a basic minimum, alternate minimum, or temporary disability benefit with a one-time permanent 1.5% increase to their monthly retirement benefit, not to exceed a maximum of $62.50 per month.
DRS accounting and reporting changes DRS reported increases to the beginning Net Position Restricted for Pensions in PERS Plan 2/3 defined benefit (DB) plans. These increases were recorded as reductions to the beginning Net Position Restricted for Pensions in the defined contribution (DC) component of the PERS 2/3 plan. The restatement of the beginning Net Position Restricted for Pensions in the Plan 2/3 plans, DB and DC, is the result of GASB 67 implementation for the Plan 3 Total Allocation Portfolio (TAP) annuities previously recorded within the financial statements as Plan 3 DC. The Plan 3 TAP annuity balances were immaterial to the Plan 2/3 DB balances prior to the fiscal year ending June 30, 2019 and therefore provisions of GASB 67 for TAP annuities were not implemented in prior fiscal years. The restatement of beginning net position had no effect on the NWSA’s pension liability of net position for pensions or the total change in fiduciary net position.
NOTE 6. PENSION PLANS (CONCLUDED)
A group of NWSA Managing Members spent two days in central Washington in August 2019 to meet with lawmakers and customers, who depend on our gateway to deliver goods around the world.

THE NORTHWEST SEAPORT ALLIANCENWSA ANNUAL REPORT 2019
32TABLE OF CONTENTS CEO LETTER LEADERSHIP TRADE STATISTICS FINANCIAL REPORT AUDITOR’S REPORTClick to navigate to section
NOTE 7. COMMITMENTS AND CONTINGENCIES
CommitmentsThe NWSA has entered into separate contractual agreements for terminal maintenance, infrastructure improvements, environmental projects, and professional services. At December 31, 2019, the remaining commitments are as follows (dollars in thousands).
Description Remaining Commitments (Thousands)Terminal projects $ 1,164Environmental 1,570Consulting and other 1,520
Total minimum payments required $ 4.254
In addition to contracts entered into by the NWSA, both the Port of Tacoma and the Port of Seattle, acting as agents for the NWSA (per support services agreements), issue contracts on behalf of the NWSA. The remaining commitments on these contracts totaled $189,205,100 at December 31, 2019, of which $98,500 related to contracts issued by the Port of Tacoma and $189,106,600 related to contracts issued by the Port of Seattle. The Port of Seattle’s commitments on the NWSA’s behalf are primarily related to terminal construction projects at Terminals 5 and 46. Both Ports will be reimbursed by the NWSA in accordance with their support service agreements (see Note 9, Related-Party Transactions, for additional information).
ContingenciesThe NWSA is named as a defendant in various other lawsuits incidental to carrying out its function. The NWSA believes its ultimate liability, if any, will not be material to the financial statements.
NOTE 8. MAJOR CUSTOMERS
Operating revenues for the year ended December 31, 2019, of $195.0 million included $142.5 million, or 73%, of operating revenue from ten customers. The top three customers accounted for 59% of operating revenues out of the top ten customers, and 43% of total operating revenues. Receivables from the ten significant customers totaled $7.7 million, or 33%, of total trade receivables at December 31, 2019.
Operating revenues for the year ended December 31, 2018, of $192.6 million included $139.0 million, or 72%, of operating revenue from ten customers. The top three customers accounted for 55% of operating revenues out of the top ten customers, and 40% of total operating revenues. Receivables from the ten significant customers totaled $6.7 million, or 46%, of total trade receivables at December 31, 2018.
NOTE 9. RELATED-PARTY TRANSACTIONS
As more fully described in the MD&A, Note 1, Summary of Significant Accounting Policies, and Note 7, Commitments and Contingencies, the NWSA entered into licensing agreements with each home port for the exclusive use, operation and management of certain facilities or Licensed Properties. These licensing agreements generated 100% of NWSA revenues in 2019 and 2018.
Support services agreementsThe NWSA entered into support services agreements with the home ports to receive support services during NWSA’s start-up and transition period as the NWSA works to set up its back-office infrastructure and staff positions. The support services received by the NWSA include finance, human resources, information technology, public affairs, risk management, capital construction and environmental project management and contracting, equipment and facilities maintenance, security, and office infrastructure. Support services charged to the NWSA from the home ports totaled $41.2 million and $38.2 million in 2019 and 2018, respectively. The expenses are included in operating expenses on the accompanying statements of revenues, expenses and changes in net position.
The NWSA entered into support services agreements with the Port of Tacoma to provide the Port of Tacoma executive management, commercial, environmental and planning support services. Support services provided to the Port of Tacoma by NWSA amounted to $1.4 million in 2019 and 2018. The amount of operating expenses on the accompanying statements of revenues, expenses and changes in net position are net of the charges to the Port of Tacoma. The NWSA did not enter into agreements to provide support services to the Port of Seattle.
Related-party receivable and payable The NWSA generally repays the home ports for support services and operating costs incurred as agents for the NWSA, in the following month, after the amount due is determined. At December 31, 2019 and 2018, $7.7 million and $1.2 million, respectively, were payable to the home ports and are presented on the statements of net position as related-party payable - Managing Members.
The NWSA distributes cash flow from operations, calculated pursuant to GAAP to the home ports. Distributions have generally been made in the following month, after the amount due is determined. At December 31, 2019 and 2018, $18.3 million and $7.6 million, respectively, were payable to the home ports and are presented on the statements of net position as related-party payable - Managing Members.
The home ports generally fund capital contribution requirements in the following month, after the amount due is determined. During 2019 and 2018, home ports contributed $88.6 million and $83.3 million, respectively, of funding for capital construction projects in accordance with the capital investment plan approved by the Managing Members. At December 31, 2019 and 2018, $14.8 million and $6.9 million, respectively, were receivable from the home ports and are presented on the statements of net position as related-party receivable - Managing Members.
The Managing Members also serve as commissioners for their respective home ports. In 2019, the Port of Tacoma hired an Executive Director to replace the NWSA CEO who also served as Port of Tacoma CEO during the transition period.

THE NORTHWEST SEAPORT ALLIANCENWSA ANNUAL REPORT 2019
33TABLE OF CONTENTS CEO LETTER LEADERSHIP TRADE STATISTICS FINANCIAL REPORT AUDITOR’S REPORTClick to navigate to section
NOTE 10. FAIR VALUE MEASUREMENTS
The NWSA’s assets that are measured and reported on a fair value basis are classified and disclosed in one of the following three categories:
Level 1: Quoted market prices in active markets for identical assets or liabilities.
Level 2: Observable market-based inputs or unobservable inputs that are corroborated by market data.
Level 3: Unobservable inputs that are not corroborated by market data.
In determining the appropriate levels, the NWSA performs a detailed analysis of the assets and liabilities that are subject to the guidance. The NWSA’s fair value measurements are evaluated by an independent third-party vendor. The third-party vendor uses a variety of methods when pricing these securities that incorporate relevant observable market data to arrive at an estimate of what a buyer in the marketplace would pay for a security under current market conditions. Level 1 inputs are quoted prices in active markets for identical assets assessed at the measurement date. An active market for the asset is a principal market in which transactions for the asset are open to many and occur with sufficient frequency and volume. Level 2 inputs include quoted prices for similar assets in active markets, quoted prices for identical or similar assets in markets where there isn’t sufficient activity, and/or where price quotations vary substantially either over time or among market makers (some brokered markets, for example), or in which little information is released publicly. The NWSA does not have any Level 3 assets or liabilities at December 31, 2019 and 2018.
The tables below present the balances of assets measured at fair value by level within the hierarchy at December 31, 2019 and 2018 (dollars in thousands):
Fair Value of Investments as of December 31, 2019Level 1 Level 2 Total
Investments:Federal Home Loan Bank $ --- $ 4,537 $ 4,537Federal Home Loan Mortgage Corporation --- 2,012 2,012Federal National Mortgage Association --- 2,995 2,995Municipal Bonds 3,182 5,357 8,539Supranational Bonds --- 2,009 2,009
Total investments $ 3,182 $ 16,910 $ 20,092
Fair Value of Investments as of December 31, 2018Level 1 Level 2 Total
Investments:Federal Home Loan Bank $ --- $ 11,398 $ 11,398Federal National Mortgage Association --- 4,961 4,961Municipal Bonds 2,165 5,546 7,711Supranational Bonds --- 6,949 6,949United States Treasury Bonds 7,971 --- 7,971
Total investments $ 10,136 $ 28,854 $ 38,990
NOTE 11. SUBSEQUENT EVENTS
On March 11, 2020, the World Health Organization characterized COVID-19 as a global pandemic. A significant portion of the cargo that moves through our gateway is to and from Asia, specifically China. As the recent outbreak of COVID-19 continues to spread throughout the supply chain, we believe it has the potential to have a negative impact on our operating results and financial condition. The extent of the impact of COVID-19 on our operational and financial performance will depend on certain developments, including the duration and spread of the outbreak, impact on supply chains and supply chain employees which at this time are uncertain and cannot be predicted. Given these uncertainties, we cannot reasonably estimate the related impact to our business, operating results and financial condition.
At their December 2019 meeting, the NWSA Managing Members recognized the three retiring members for their service: Port of Seattle Commissioner Courtney Gregoire (left) and Port of Tacoma Commissioners Don Johnson and Clare Petrich.

THE NORTHWEST SEAPORT ALLIANCENWSA ANNUAL REPORT 2019
34TABLE OF CONTENTS CEO LETTER LEADERSHIP TRADE STATISTICS FINANCIAL REPORT AUDITOR’S REPORTClick to navigate to section
REQUIRED SUPPLEMENTARY INFORMATION Years Ended December 31, 2019, 2018 and 2017 (Dollars in Thousands)
SCHEDULE OF THE NORTHWEST SEAPORT ALLIANCE’S SHARE OF NET PENSION ASSET/LIABILITY (NPA/NPL)PERS PLAN 1 2019 2018 2017NWSA’s proportion of NPL 0.0454% 0.0459% 0.0230%
NWSA’s proportionate share of NPL $ 1,746 $ 2,052 $ 1,093
NWSA’s covered-employee payroll $ --- $ --- $ ---
NWSA’s proportionate share of the net pension liability as a percentage of its covered-employee payroll NA NA NA
Plan fiduciary net pension position as a percentage of the total pension liability 67.1% 63.2% 61.2%
Contractually required contribution $ 326 $ 309 $ 286
Contributions in relation to the contractually required contribution (314) (326) (286)
Contribution excess $ 12 $ (17) $ ---
NWSA’s covered-employee payroll $ --- $ --- $ ---
Contributions as a percentage of covered-employee payroll 0.0% 0.0% 0.0%
PERS PLAN 2/3NWSA’s proportion of NPL 0.0586% 0.0590% 0.0296%
NWSA’s proportionate share of NPL $ 570 $ 1,007 $ 1,030
NWSA’s covered-employee payroll $ 6,371 $ 6,151 $5,844
NWSA’s proportionate share of the net pension liability as a percentage of its covered-employee payroll 8.9% 16.4% 17.6%
Plan fiduciary net pension position as a percentage of the total pension liability 97.8% 95.8% 91.0%
Contractually required contribution $ 491 $ 472 $ 411
Contributions in relation to the contractually required contribution (502) (495) (411)
Contribution excess $ (11) $ (23) $ ---
NWSA’s covered-employee payroll $ 6,362 $ 6,440 $5,844
Contributions as a percentage of covered-employee payroll 7.9% 7.7% 7.0%
(1) Information presented prospectively beginning with December 31, 2017, prior year reported with Port of Tacoma.See Note 6 of the financial statements for additional information on the plan.

THE NORTHWEST SEAPORT ALLIANCENWSA ANNUAL REPORT 2019
35TABLE OF CONTENTS CEO LETTER LEADERSHIP TRADE STATISTICS FINANCIAL REPORT AUDITOR’S REPORTClick to navigate to section
Report on the Financial Statements We have audited the accompanying financial statements of The Northwest Seaport Alliance (the NWSA) as of and for the years ended December 31, 2019 and 2018, and the related notes to the financial statements, which, collectively, comprise the NWSA’s basic financial statements as listed in the table of contents.
Management’s Responsibility for the Financial Statements Management is responsible for the preparation and fair presentation of these financial statements in accordance with accounting principles generally accepted in the United States of America; this includes the design, implementation and maintenance of internal control relevant to the preparation and fair presentation of the financial statements that are free from material misstatement, whether due to fraud or error.
Auditor’s Responsibility Our responsibility is to express opinions on these financial statements based on our audits. We conducted our audits in accordance with auditing standards generally accepted in the United States of America and the standards applicable to financial audits contained in Government Auditing Standards issued by the Comptroller General of the United States. Those standards require that we plan and perform the audit to obtain reasonable assurance about whether the financial statements are free of material misstatement.
An audit involves performing procedures to obtain audit evidence about the amounts and disclosures in the financial statements. The procedures selected depend on the auditor’s judgment, including the assessment of the risks of material misstatement of the financial statements, whether due to fraud or error. In making those risk assessments, the auditor considers internal control relevant to NWSA’s preparation and fair presentation of the financial statements in order to design audit procedures that are appropriate in the circumstances but not for the purpose of expressing an opinion on the effectiveness of NWSA’s internal control. Accordingly, we express no such opinion. An audit also includes evaluating the appropriateness of accounting policies used and the reasonableness of significant accounting estimates made by management, as well as evaluating the overall presentation of the financial statements.
We believe the audit evidence we have obtained is sufficient and appropriate to provide a basis for our audit opinion.
Opinion In our opinion, the financial statements referred to above present fairly, in all material respects, the financial position of the NWSA as of December 31, 2019 and 2018, and the respective changes in financial position and cash flows thereof for the years then ended, in accordance with accounting principles generally accepted in the United States of America.
Other Matters Required Supplementary Information: Accounting principles generally accepted in the United States of America require that the management’s discussion and analysis and the schedule of NWSA’s share of net pension asset/liability as listed in the table of contents be presented to supplement the basic financial statements. Such information, although not a part of the basic financial statements, is required by the Governmental Accounting Standards Board, who considers it to be an essential part of financial reporting for placing the basic financial statements in an appropriate operational, economic or historical context. We have applied certain limited procedures to the required supplementary information in accordance with auditing standards generally accepted in the United States of America, which consisted of inquiries of management about the methods of preparing the information and comparing the information for consistency with management’s responses to our inquiries, the basic financial statements, and other knowledge we obtained during our audits of the basic financial statements. We do not express an opinion or provide any assurance on the information because the limited procedures do not provide us with sufficient evidence to express an opinion or provide any assurance.
Other Reporting Required by Government Auditing Standards In accordance with Government Auditing Standards, we have also issued our report dated March 30, 2020, on our consideration of the NWSA’s internal control over financial reporting and on our tests of its compliance with certain provisions of laws, regulations, contracts, and grant agreements and other matters. The purpose of that report is to solely describe the scope of our testing of internal control over financial reporting and compliance and the results of that testing, and not to provide an opinion on the effectiveness of the NWSA’s internal control over financial reporting or on compliance. That report is an integral part of an audit performed in accordance with Government Auditing Standards in considering NWSA’s internal control over financial reporting and compliance.
Tacoma, Washington March 30, 2020
The Managing Members
The Northwest Seaport Alliance
Tacoma, Washington
INDEPENDENT AUDITOR’S REPORT
RSM US LLP is the U.S. member firm of RSM International, a global network of independent audit, tax and consulting firms. Visit rsmus.com/aboutus for more information regarding RSM US LLP and RSM International.

Click to navigate to section ©2020 THE NORTHWEST SEAPORT ALLIANCE
www.nwseaportalliance.com