passenger terminal demand capacity and facility...
TRANSCRIPT

C h a p t e r 3
Passenger Terminal
Demand Capacity
and Facility Requirements
Missoula International Airport Master Plan Update
Prepared for
Missoula County Airport Authority
NOVEMBER 2008

I
Contents
Section Page
3 Passenger Terminal Demand Capacity and Facility Requirements ..................................... 3-1 3.1 Design Level Activity .............................................................................................................. 3-1
3.1.1 Existing Activity.......................................................................................................... 3-2 3.1.2 Projected Design Hour Activity............................................................................... 3-6
3.2 Gate Demands........................................................................................................................... 3-8 3.2.1 Average Annual Passengers per Gate Approach .............................................. 3-11 3.2.2 Departures per Gate Approach ............................................................................. 3-12 3.2.3 Required Gates.......................................................................................................... 3-13
3.3 Passenger Terminal Facilities Planning Criteria .............................................................. 3-14 3.3.1 Aircraft Gates and Departure Lounges................................................................ 3-20 3.3.2 Airline Space.............................................................................................................. 3-22 3.3.3 Concessions................................................................................................................ 3-26 3.3.4 Public Spaces ............................................................................................................. 3-27 3.3.5 Other Areas................................................................................................................ 3-30
3.4 Summary & Conclusions ...................................................................................................... 3-32 Tables
3-1 Forecast Peak Hour Passengers..............................................................................................3-6 3-2 Projected Gate Demand – Average Annual Passengers per Gate Approach.................3-11 3-3 Projected Gate Demand – Peak Month Passengers per Gate Approach ........................3-12 3-4 Projected Gate Demand – Annual Departures per Gate Approach ................................3-13 3-5 Projected Gate Demand – Summary....................................................................................3-13 3-6 Terminal Facilities Planning Criteria ...................................................................................3-15 3-7 Narrow Body Equivalent Gate Statistic and FAA Airplane Design Group...................3-19 3-8 Equivalent Aircraft and FAA Airplane Design Groups....................................................3-20 3-9 Average Aircraft Seating Capacities and Hold Room Sizes.............................................3-21 Exhibits
3-1 Characteristics from an Average August 2007 day with 24 Flights ..................................3-3 3-2 Average August Day Loads....................................................................................................3-4 3-3 Average August Day Flight Activity .....................................................................................3-5 3-4 Total Aircraft Parking Position Demand Including RON Aircraft....................................3-9 3-5 Active Aircraft Parking Position Demand ..........................................................................3-10

3-1
CHAPTER 3
Passenger Terminal Demand Capacity and Facility Requirements
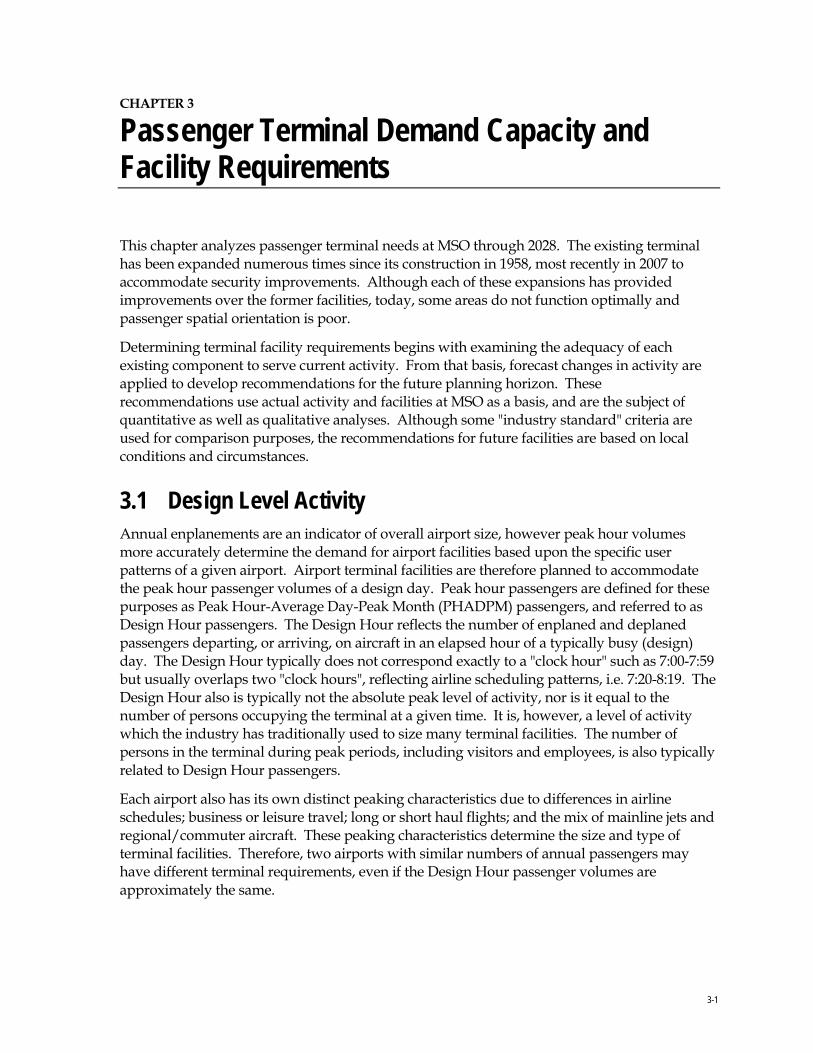
This chapter analyzes passenger terminal needs at MSO through 2028. The existing terminal has been expanded numerous times since its construction in 1958, most recently in 2007 to accommodate security improvements. Although each of these expansions has provided improvements over the former facilities, today, some areas do not function optimally and passenger spatial orientation is poor.
Determining terminal facility requirements begins with examining the adequacy of each existing component to serve current activity. From that basis, forecast changes in activity are applied to develop recommendations for the future planning horizon. These recommendations use actual activity and facilities at MSO as a basis, and are the subject of quantitative as well as qualitative analyses. Although some "industry standard" criteria are used for comparison purposes, the recommendations for future facilities are based on local conditions and circumstances.
3.1 Design Level Activity Annual enplanements are an indicator of overall airport size, however peak hour volumes more accurately determine the demand for airport facilities based upon the specific user patterns of a given airport. Airport terminal facilities are therefore planned to accommodate the peak hour passenger volumes of a design day. Peak hour passengers are defined for these purposes as Peak Hour-Average Day-Peak Month (PHADPM) passengers, and referred to as Design Hour passengers. The Design Hour reflects the number of enplaned and deplaned passengers departing, or arriving, on aircraft in an elapsed hour of a typically busy (design) day. The Design Hour typically does not correspond exactly to a "clock hour" such as 7:00-7:59 but usually overlaps two "clock hours", reflecting airline scheduling patterns, i.e. 7:20-8:19. The Design Hour also is typically not the absolute peak level of activity, nor is it equal to the number of persons occupying the terminal at a given time. It is, however, a level of activity which the industry has traditionally used to size many terminal facilities. The number of persons in the terminal during peak periods, including visitors and employees, is also typically related to Design Hour passengers.
Each airport also has its own distinct peaking characteristics due to differences in airline schedules; business or leisure travel; long or short haul flights; and the mix of mainline jets and regional/commuter aircraft. These peaking characteristics determine the size and type of terminal facilities. Therefore, two airports with similar numbers of annual passengers may have different terminal requirements, even if the Design Hour passenger volumes are approximately the same.

CHAPTER 3 - PASSENGER TERMINAL DEMAND CAPACITY AND FACILITY REQUIREMENTS
3-2
3.1.1 Existing Activity Most major airlines operate "hub and spoke" route systems such as American's hubs in Chicago and Dallas/Ft. Worth; Delta's in Atlanta, Cincinnati, and Salt Lake City; United's in Chicago and Denver; Northwest's in Minneapolis and Detroit, etc. At these hubs there are a number of banks of flights when most passengers change planes to reach their final destination. These banks of connecting flights form a series of peaks during the day - typically seven to 10.
In contrast, the other cities served by the airlines are referred to as "spokes". Airline schedules at the spoke cities are generally tied to the connecting banks at the hub. Most airlines have similar scheduling patterns and these tend to overlap with each other at the spoke airports resulting in, for example, a large number of departures between 7 and 7:30 a.m. Even low-cost carriers who rely less on a traditional hub and spoke network, still schedule many flights during these same windows.
Service at MSO is currently provided by a combination of narrowbody, regional jets (RJs), and turboprop aircraft operated by Allegiant, Horizon, Northwest (NW) and Skywest (Delta Connection and United Express). During the summers of 2007 and 2008, NW operated 124 seat A319s, but beginning in the winter of 2007/08, smaller 76 seat E175 RJs were substituted. NW had high load factors with the larger aircraft, and as shown in the Forecast, mainline equipment is expected to be used in the future during peak months. United also substituted narrow body jet equipment for some RJ flights in the summer of 2008. Big Sky (using 19 passenger aircraft) ceased operations in March 2008. It is possible that another airline with similar aircraft could re-start service on these routes.
The daily pattern of flight activity and passenger peaking at MSO is somewhat typical of spoke airport activity. Morning departures are almost all of the destinations served from MSO. In the evening, there are corresponding arrivals which serve to position equipment for the next day's departure peak. These peaks are not as concentrated as a mid-day peak between 12:30 and 13:30, which is the peak hour for both arrivals and departures.
Exhibits 3-1 through 3-3 illustrate the passenger pattern on an average August 2007 day with 24 flights. The exhibits show peak hour passengers; passengers per half hour (a measure of concentration within the peak hour); flights per half hour; and average gate utilization (flights per gate). Allegiant has since added a flight to Phoenix which operates two days/week, arriving and departing in the evening. This flight does not influence the peak hours.
One measure of terminal activity is the degree of concentration of daily activity during the peak hour. Passenger counts were obtained from the airlines for flights during a two week period (August 6-19, 2007) and averaged for the analysis. Enplaning data was available for all flights, but deplaning data was limited. Where deplaning data was not available, deplaning and enplaning passengers were assumed to be equal. This is at the high end of the range for a spoke airport, but is understandable due to the limited number of flights and the timing of the Allegiant and NW mainline flights. The average day had approximately 25 percent of the daily activity in the peak hours. During the peak hours, the enplaning load factor was 95 percent and the deplaning load factor was 92 percent; both extremely high averages for a sustained two week period.

Exhibit 3-1Missoula International Airport2007 Design Day Passengers Average August Day Loads
Peak Hour Passengers: 327 begins at 1210 Daily Passengers: 1,298Peak Hour =Peak Hour = 25.2%25.2% of daily passengersof daily passengers
Peak Hour Passengers: 319 begins at 1130 Daily Passengers: 1,271Peak Hour =Peak Hour = 25.1%25.1% of daily passengersof daily passengers
Peak Hour Passengers: 571 begins at 1210 Daily Passengers: 2,569Peak Hour =Peak Hour = 22.2%22.2% of daily passengersof daily passengers
0
100
200
300
400
0 1 2 3 4 5 6 7 8 9 10 11 12 13 14 15 16 17 18 19 20 21 22 23 24
Peak Hour Enplaned Passengers
0
100
200
300
400
0 1 2 3 4 5 6 7 8 9 10 11 12 13 14 15 16 17 18 19 20 21 22 23 24
Peak Hour Deplaned Passengers
0
200
400
600
0 1 2 3 4 5 6 7 8 9 10 11 12 13 14 15 16 17 18 19 20 21 22 23 24
Peak Hour Total Passengers
Hirsh Associates 03/31/2008 07DDPAX.WK4


Exhibit 3-2Missoula International Airport2007 Design Day Passengers Average August Day Loads
Daily Departures: 24 Avg Passengers/Departure =54.1
Daily Arrivals: 24 Avg Passengers/Arrival = 53.0
0
50
100
150
200
250
Passengers per half hour0 1 2 3 4 5 6 7 8 9 10 11 12 13 14 15 16 17 18 19 20 21 22 23 24
Enplaned Passengers
0
50
100
150
200
Passengers per half hour0 1 2 3 4 5 6 7 8 9 10 11 12 13 14 15 16 17 18 19 20 21 22 23 24
Deplaned Passengers
0
100
200
300
400
Passengers per half hour0 1 2 3 4 5 6 7 8 9 10 11 12 13 14 15 16 17 18 19 20 21 22 23 24
Total Passengers
Hirsh Associates 03/31/2008 07DDPAX.WK4


Exhibit 3-3Missoula International Airport2007 Design Day Passengers Average August Day Loads
Daily Departures: 24 Peak Clock Hour Departures: 35 gates = 4.8 per gate Peak Rolling Hour Departures: 4
Daily Arrivals: 24 Peak Clock Hour Arrivals: 35 gates = 4.8 per gate Peak Rolling Hour Arrivals: 4
Daily Operations: 48 Peak Clock Hour Ops: 5 Peak Rolling Hour Ops: 7
0
1
1
2
2
3
Flights per half hour0 1 2 3 4 5 6 7 8 9 10 11 12 13 14 15 16 17 18 19 20 21 22 23 24
Departing Flights
0
1
1
2
2
3
Flights per half hour0 1 2 3 4 5 6 7 8 9 10 11 12 13 14 15 16 17 18 19 20 21 22 23 24
Arriving Flights
0
1
2
3
4
5
Operations per half hour0 1 2 3 4 5 6 7 8 9 10 11 12 13 14 15 16 17 18 19 20 21 22 23 24
Operations
Hirsh Associates 03/31/2008 07DDPAX.WK4

CHAPTER 3 - PASSENGER TERMINAL DEMAND CAPACITY AND FACILITY REQUIREMENTS
3-6
3.1.2 Projected Design Hour Activity Many terminal facilities are based on Design Hour passengers. Table 3-1 presents calculations developing Design Hour Passengers for each of the forecast activity levels. The Forecast Chapter outlined a range of possible forecast scenarios in addition to the FAA's Terminal Area Forecast (TAF). There is a significant spread in these forecasts with long range (2028) enplanements estimated to be between 432,000 and 530,000. For terminal planning four activity levels have been used. These are the Base (Regression Model) Forecasts for 2013, 2018 and 2028; and the High Model forecast scenario for 2028.
TABLE 3-1 Forecast Peak Hour Passengers
Forecast Activity Level
2007 2013 2018 2028 High
Scenario
Annual Enplanements 283,478 333,100 376,600 473,500 529,800
Peak Month Enplanements Percent of Annual Enplanements 11.5% 11.4% 11.4% 11.4% 11.4%
Peak Month Enplanements 1 32,534 38,000 42,900 54,000 60,400
Average Day/Peak Month Enplaned Passengers 2 1,298 1,410 1,530 1,740 1,950
Peak Hour Passengers Percentage of daily activity in the peak hour 2 Enplaned 25.2% 23.5% 23.5% 23.5% 23.5%
Deplaned 25.0% 23.0% 23.0% 23.0% 23.0%
Total 22.1% 20.5% 20.5% 20.5% 20.5%
Peak Hour Passengers Enplaned 330 330 360 410 460 Deplaned 320 320 350 400 450 Total 570 580 630 710 800 Prepared By: Hirsh Associates Notes: 1- Peak month for 2007 was July due to runway closures in late August. 2- Based on flight specific data for August 6-19, 2007.
The projections in Table 3-1 will provide a range of activity which should produce meaningful differences in terminal facilities requirements. The timing for implementing these phases will be determined as the actual growth of the Airport occurs.
Peak Month Passengers The Airport has typical seasonal variations with the summer months as the busiest. August and July have consistently been the peak months accounting for an average of 11.4 percent of annual passengers from 2003 through 2007 (Forecast Chapter Table 1-15). In 2007, July was the busiest month (11.5 percent). This was due to the closure of the main runway for nine days in August and September, limiting service to Big Sky during that time period. The airport still
CHAPTER 3 - PASSENGER TERMINAL DEMAND CAPACITY AND FACILITY REQUIREMENTS
3-7
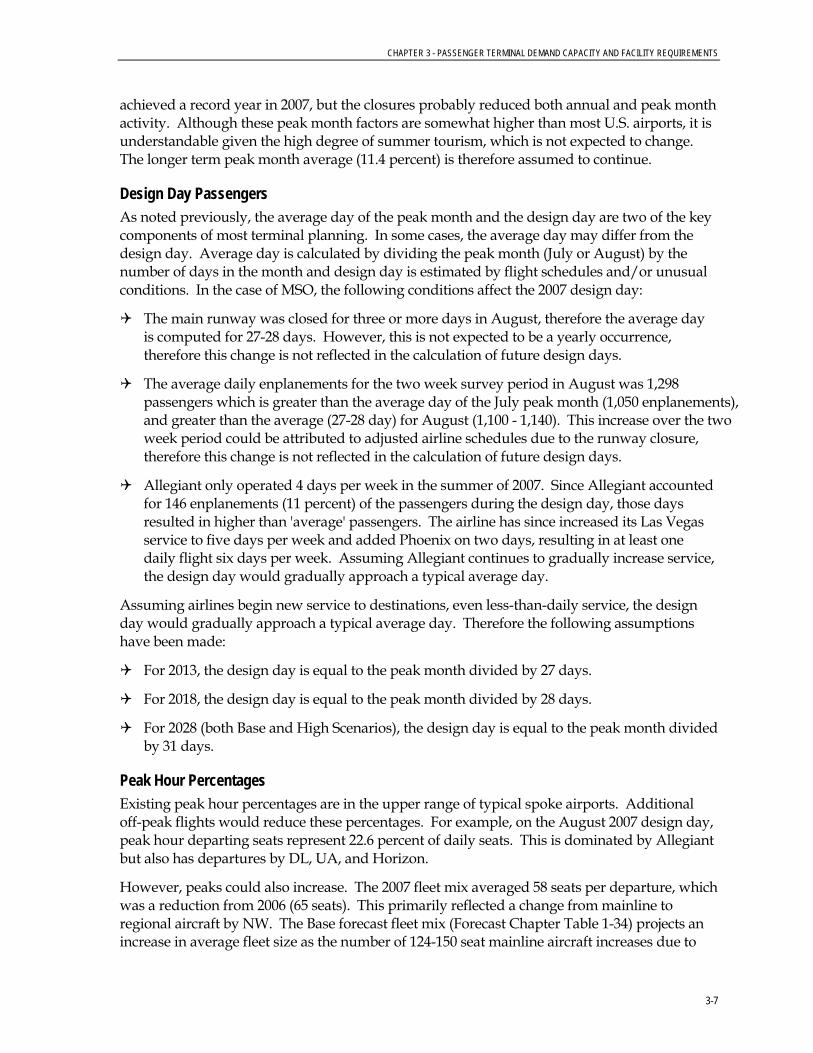
achieved a record year in 2007, but the closures probably reduced both annual and peak month activity. Although these peak month factors are somewhat higher than most U.S. airports, it is understandable given the high degree of summer tourism, which is not expected to change. The longer term peak month average (11.4 percent) is therefore assumed to continue.
Design Day Passengers As noted previously, the average day of the peak month and the design day are two of the key components of most terminal planning. In some cases, the average day may differ from the design day. Average day is calculated by dividing the peak month (July or August) by the number of days in the month and design day is estimated by flight schedules and/or unusual conditions. In the case of MSO, the following conditions affect the 2007 design day:
The main runway was closed for three or more days in August, therefore the average day is computed for 27-28 days. However, this is not expected to be a yearly occurrence, therefore this change is not reflected in the calculation of future design days.
The average daily enplanements for the two week survey period in August was 1,298 passengers which is greater than the average day of the July peak month (1,050 enplanements), and greater than the average (27-28 day) for August (1,100 - 1,140). This increase over the two week period could be attributed to adjusted airline schedules due to the runway closure, therefore this change is not reflected in the calculation of future design days.
Allegiant only operated 4 days per week in the summer of 2007. Since Allegiant accounted for 146 enplanements (11 percent) of the passengers during the design day, those days resulted in higher than 'average' passengers. The airline has since increased its Las Vegas service to five days per week and added Phoenix on two days, resulting in at least one daily flight six days per week. Assuming Allegiant continues to gradually increase service, the design day would gradually approach a typical average day.
Assuming airlines begin new service to destinations, even less-than-daily service, the design day would gradually approach a typical average day. Therefore the following assumptions have been made:
For 2013, the design day is equal to the peak month divided by 27 days.
For 2018, the design day is equal to the peak month divided by 28 days.
For 2028 (both Base and High Scenarios), the design day is equal to the peak month divided by 31 days.
Peak Hour Percentages Existing peak hour percentages are in the upper range of typical spoke airports. Additional off-peak flights would reduce these percentages. For example, on the August 2007 design day, peak hour departing seats represent 22.6 percent of daily seats. This is dominated by Allegiant but also has departures by DL, UA, and Horizon.
However, peaks could also increase. The 2007 fleet mix averaged 58 seats per departure, which was a reduction from 2006 (65 seats). This primarily reflected a change from mainline to regional aircraft by NW. The Base forecast fleet mix (Forecast Chapter Table 1-34) projects an increase in average fleet size as the number of 124-150 seat mainline aircraft increases due to

CHAPTER 3 - PASSENGER TERMINAL DEMAND CAPACITY AND FACILITY REQUIREMENTS
3-8
new service. If mainline service is substituted for RJs at critical times of the day, the peak hours could increase significantly.
Based on these factors, and the very high load factors achieved during the mid-day peak in 2007, it has been assumed that peak hour percentages will reduce in the near term. The factors would then stay constant in the mid- to longer term. This results in peak hours holding steady for the near term before increasing in later years.
3.2 Gate Demands The number of gates needed to support forecast activity is an important component of determining the overall size and configuration of the terminal complex. A gate is defined as an aircraft parking position near the terminal which is used daily for loading and unloading passengers. The five existing gates at Missoula International Airport are a combination of three second level gates with loading bridges that can serve both regional and mainline jets, and two ground loading positions. MSO does not have designated aprons solely identified for remain overnight (RON) aircraft parking positions, but apron areas exist where RON aircraft can be parked.
There are a number of methodologies which can be used to project future gate demands. These include ratios of average annual passengers per gate, daily flights per gate, and projecting design day schedules. Two methodologies have been used to estimate future gate demands for MSO; average annual passengers per gate, and departures per gate. .
Gate utilization is in the typical range for a spoke airport with an average of 4.8 flights or turns per gate1 for the summer design day as shown in Exhibit 3-3. On an annual average basis, there were 4.0 turns per gate for 2007 based on a reported 14,110 annual air carrier operations.
Exhibit 3-4 illustrates the number of aircraft parking positions (including RONs) required to support the summer design day. A 20 minute buffer time between a scheduled departure and the next arrival is assumed. This shows that the maximum number of aircraft on the ground was five during the overnight period. Of these, three are Group II aircraft (wingspans up to 79 feet) which are the Skywest RJs. Two are larger Group III aircraft (up to 118 feet) which are the NW mainline aircraft and the Horizon Q400 turboprop. The exhibit also includes the time when the peak number of each aircraft size is on the ground, and average gate occupancy times for each size of aircraft.
Exhibit 3-5 illustrates the same schedule, but only includes active gates. The assumptions in this analysis are that a RON aircraft requires a gate from 30 minutes before departure time to 30 minutes after arrival, indicating the number of gates which would likely require holdrooms under a minimum development scenario. The exhibit shows that the peak demand is for four active gates at 12:20 p.m. Two of these gates are Group III (Allegiant MD-80 and a Horizon Q400), with the other two as Group II (Skywest RJs).The active gate analysis assumes that gates are common or preferential use. At the present time, MSO leases gates and holdrooms on an exclusive use basis, therefore requiring five gates.
1 A "turn" is a paired arrival and departure.

Mis
sou
la In
tern
atio
nal
Air
po
rtE
xhib
it 3
-420
07 D
esig
n D
ayM
inim
um B
uffe
r T
ime:
20m
inut
es
RO
N P
arki
ng
Po
siti
on
s In
clu
ded
I/II
III
III
a
IV
V
VI
C
ombi
ned
Max
imum
Num
ber
of G
ates
:3
20
00
05
begi
ns a
t:0
00
Avg
. Sch
edul
ed T
ime
on G
ate:
102
134
NA
NA
NA
NA
112
min
utes
0246
01
23
45
67
89
10
11
12
13
14
15
16
17
18
19
20
21
22
23
24
I/
II
III
II
Ia
IV
V
VI
No
min
al G
ate
Dem
and
Hirs
h A
ssoc
iate
s 0
3/31
/200
8M
SO
07G
AT
.WK
4


Mis
sou
la In
tern
atio
nal
Air
po
rtE
xhib
it 3
-520
07 D
esig
n D
ayM
inim
um B
uffe
r T
ime:
20m
inut
es
Act
ive
Gat
es S
ho
wn
RO
N fl
ight
s on
gat
e:30
min
utes
bef
ore
depa
rtur
e tim
e30
min
utes
afte
r ar
rival
tim
e
I/II
III
III
a
IV
V
VI
C
ombi
ned
Max
imum
Num
ber
of G
ates
:3
20
00
04
begi
ns a
t:10
1012
1012
20
Avg
. Sch
edul
ed T
ime
on G
ate:
2639
NA
NA
NA
NA
29m
inut
es
012345
01
23
45
67
89
10
11
12
13
14
15
16
17
18
19
20
21
22
23
24
I/
II
III
II
Ia
IV
V
VI
No
min
al G
ate
Dem
and
Hirs
h A
ssoc
iate
s 0
3/31
/200
8M
SO
07G
AT
.WK
4

SECTION 3 PASSENGER TERMINAL DEMAND CAPACITY AND FACILITY REQUIREMENTS
3-11
3.2.1 Average Annual Passengers per Gate Approach The first approach (Table 3-2) uses the current ratio of average annual passengers per gate, adjusted for forecast changes in fleet mix and annual load factors. This methodology assumes that the pattern of gate utilization will remain relatively stable. The increase in passengers per gate would be due to increases in enplanements per departure (due to fleet seating capacity and/or passenger load factors), as opposed to increasing numbers of departures per gate.
TABLE 3-2 Projected Gate Demand – Average Annual Passengers per Gate Approach Base Forecast and High 2028 Scenario
Year Enplaned
Passengers Departures Enpl. Pax./ Departure
Enpl. Pax./ Gate Gates
2006 275,125 6,986 19.7 55,000 5
2007 283,478 7,055 40.2 56,700 5
2013 333,100 8,036 42 58,500 6
2018 376,600 8,917 42 59,500 7
2028 473,500 10,855 44 61,500 8
High Scenario 529,800 12,285 43 60,800 9
Prepared By: Hirsh Associates
The basis for the existing factor is the number of gates in use.
The ratio of enplanements/gate for each forecast year is calculated by multiplying the current (2007) factor by the percentage increase in enplanements/departure. For example, the factor would increase from 56,700 enplanements/gate (2007 data) to 58,500 for 2013, and 61,500 enplanements/gate by the end of the forecast period without any further increase in the number of daily departures per gate. The factor is different for the Base and High 2028 forecasts because the forecast projects slightly different average numbers of enplanements per departure for each scenario.
Future gate requirements were estimated by dividing annual forecast passengers by the estimated passengers per gate factor for that forecast period. For example, in 2013, 333,100 enplanements divided by 58,500 enplanements/gate results in a requirement for six gates. This approach results in a projected need for eight gates by the end of the planning period, and nine gates for the High scenario.
Because the two peak summer months constitute almost 23 percent of annual enplanements, the same approach was applied to the peak month activity forecasts (Table 3-3). This resulted in a lower need for gates in three of the four forecast scenarios.

CHAPTER 3 - PASSENGER TERMINAL DEMAND CAPACITY AND FACILITY REQUIREMENTS
3-12
TABLE 3-3 Projected Gate Demand – Peak Month Passengers per Gate Approach Base Forecast and High 2028 Scenario
Year Enplaned
Passengers Departures
Daily Departures /
Gate
Monthly Departures /
Gate Gates 2006 30,728 706 43.5 6,100 5
2007 32,534 696 46.7 6,500 5
2013 38,000 758 50 7,000 6
2018 42,900 841 51 7,100 6
2028 54,000 1,024 53 7,300 8
High Scenario 60,400 N/A 53 7,300 9
Prepared By: Hirsh Associates
3.2.2 Departures per Gate Approach The previous average annual gate methodology has as an underlying basis that the pattern of service at MSO is stable. Given the volatility of the airline industry, it is likely that gate utilization will change to some extent for some airlines.
However, if MSO attracts service by airlines not currently serving the Airport, it is likely that these carriers would initially follow scheduling patterns like the existing carriers. This could result in a demand for more gates during the morning departure peak and/or mid-day (and requiring more RONs).
As would be expected, the entry of an additional airline would require a sixth RON position and potentially a fourth early morning active departure gate. Since the 2007 peak demand for gates was at mid-day, an airline scheduled prior to this would initially result in better daily utilization of the same four peak active gates required in 2007.
For this approach it has been assumed that annual gate utilization would increase to 4.5 departures/gate by 2013, stay constant through 2018 and then increase to 4.8 departures/gate for 2028 in both scenarios.
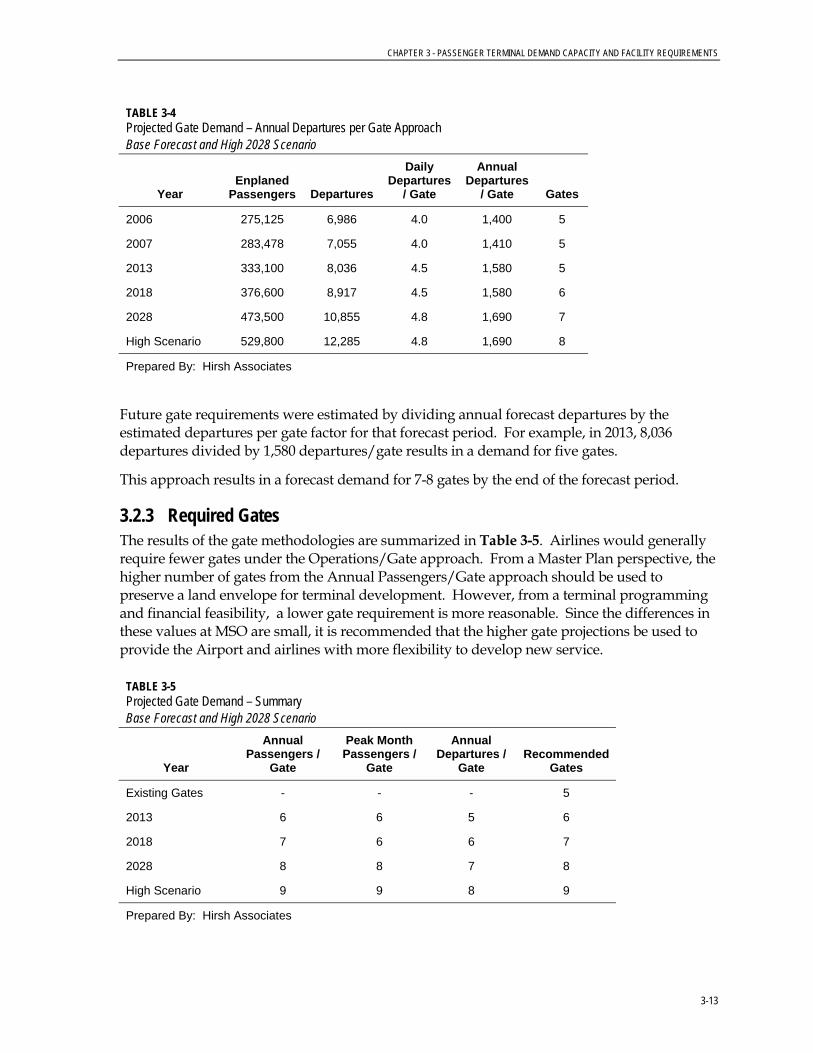
For the Departures per Gate approach (Table 3-4), the ratio of annual departures/gate for each forecast year is calculated by multiplying the current (2007) factor by the percentage change in assumed daily departures/gate. For example, the factor would increase from 1,410 departures/gate (2007) to 1,580 by 2013.
CHAPTER 3 - PASSENGER TERMINAL DEMAND CAPACITY AND FACILITY REQUIREMENTS
3-13
TABLE 3-4 Projected Gate Demand – Annual Departures per Gate Approach Base Forecast and High 2028 Scenario
Year Enplaned
Passengers Departures
Daily Departures
/ Gate
Annual Departures
/ Gate Gates
2006 275,125 6,986 4.0 1,400 5
2007 283,478 7,055 4.0 1,410 5
2013 333,100 8,036 4.5 1,580 5
2018 376,600 8,917 4.5 1,580 6
2028 473,500 10,855 4.8 1,690 7
High Scenario 529,800 12,285 4.8 1,690 8
Prepared By: Hirsh Associates
Future gate requirements were estimated by dividing annual forecast departures by the estimated departures per gate factor for that forecast period. For example, in 2013, 8,036 departures divided by 1,580 departures/gate results in a demand for five gates.
This approach results in a forecast demand for 7-8 gates by the end of the forecast period.
3.2.3 Required Gates The results of the gate methodologies are summarized in Table 3-5. Airlines would generally require fewer gates under the Operations/Gate approach. From a Master Plan perspective, the higher number of gates from the Annual Passengers/Gate approach should be used to preserve a land envelope for terminal development. However, from a terminal programming and financial feasibility, a lower gate requirement is more reasonable. Since the differences in these values at MSO are small, it is recommended that the higher gate projections be used to provide the Airport and airlines with more flexibility to develop new service.
TABLE 3-5 Projected Gate Demand – Summary Base Forecast and High 2028 Scenario
Year
Annual Passengers /
Gate
Peak Month Passengers /
Gate
Annual Departures /
Gate Recommended
Gates
Existing Gates - - - 5
2013 6 6 5 6
2018 7 6 6 7
2028 8 8 7 8
High Scenario 9 9 8 9
Prepared By: Hirsh Associates

CHAPTER 3 - PASSENGER TERMINAL DEMAND CAPACITY AND FACILITY REQUIREMENTS
3-14
3.3 Passenger Terminal Facilities Planning Criteria Terminal facility requirements for an airport (the terminal program) are a function of the specific and unique characteristics of that airport. These include the design levels of passenger and aircraft activity; the number and type of airlines serving the airport; the operating requirements of the airlines; and local factors such as the proportions of leisure vs. business travelers, locally originating passengers, etc.
Unlike airfield facilities, the capacity of each element of a terminal facility can vary depending on the level of crowding and/or processing time which is considered acceptable. A passenger traveling on business may be less tolerant of congestion or delay than a passenger traveling for pleasure. In many cases the degree of acceptability itself may also vary depending on the configuration of the terminal space and the level of amenity provided. Thus, the 'capacity' of a terminal can vary significantly.
The approach taken in developing terminal facilities requirements for MSO has been to review the plans and areas of the terminals, make limited observations of passenger activity, and discuss with airport and airline staff how well the present facilities are functioning. These observations - coupled with calculations of area per passenger, per gate, or other determinants of demand - were compared to generally accepted industry planning standards. From these comparisons, a planning factor for each terminal component was determined and used to project facility requirements.
The program areas developed were based on the utilization of existing facilities, and on projected trends as discussed in the previous chapters.
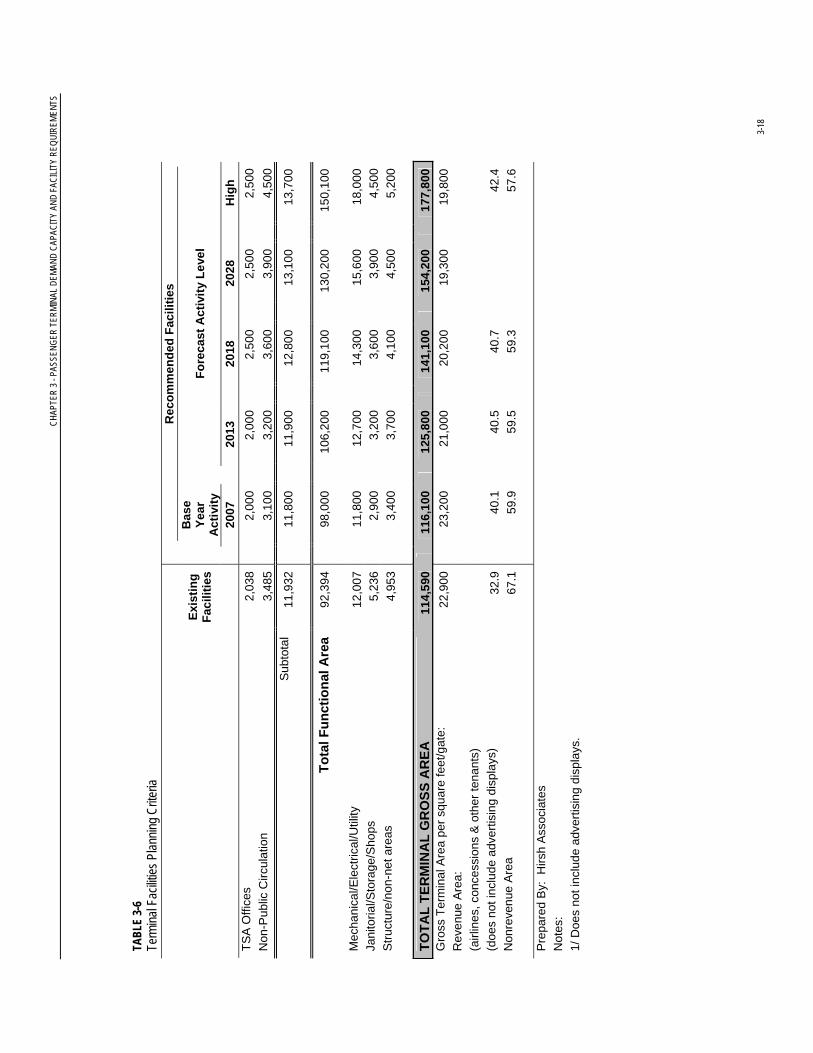
Table 3-6 presents the terminal program data in six columns:
1) Existing Facilities: These areas are measured from existing architectural plans of the terminal, and the current functions.
2) Base Year 2007 Activity: These areas represent the facilities which would be needed to support levels of passenger activity for the base planning year. These values may differ from existing conditions and either point out deficiencies in existing facilities or identify facilities with excess theoretical capacity. These differences are discussed for each item.
3-6) Recommended Facilities in 2013, 2018 and 2028 (Base & High): These are the areas recommended to support each level of annual enplanements and the associated Peak Hour passengers. The timing of the needed improvements must ultimately be based on the actual passenger growth rates.

SEC
TIO
N 3
PAS
SEN
GER
TER
MIN
AL D
EMAN
D C
APAC
ITY
AND
FAC
ILIT
Y R
EQU
IREM
ENTS
3-
15
TABL
E 3-
6
Term
inal
Fac
ilitie
s Pl
anni
ng C
riter
ia
R
ecom
men
ded
Faci
litie
s
Bas
e Ye
ar
Act
ivity
Fore
cast
Act
ivity
Lev
el
Exis
ting
Faci
litie
s
20
07
20
13
20
18
20
28
H
igh
Ann
ual E
npla
nem
ents
283,
478
33
3,10
0
376,
600
47
3,50
0
529,
800
Pe
ak H
our P
asse
nger
s
Pea
k H
our E
npla
ned
Pas
seng
ers
33
0
330
36
0
410
46
0
Pea
k H
our D
epla
ned
Pas
seng
ers
32
0
320
35
0
400
45
0
Pea
k H
our T
otal
Pas
seng
ers
57
0
580
63
0
710
80
0
W
ell-w
ishe
rs p
er e
npla
ning
pas
seng
er
0.
2
0.2
0.
2
0.2
0.
2
Mee
ter/g
reet
ers
per d
epla
ning
pas
seng
er
0.
5
0.5
0.
5
0.5
0.
5
GA
TES
A
ircra
ft G
ates
:
Reg
iona
l (G
roup
II)
1
R
egio
nal (
Gro
up II
I) 1
2
3
3
4
4
Nar
row
body
(Gro
up II
I) 3
3
3
4
4
5
Tot
al G
ates
5
5
6
7
8
9
T
otal
NB
EG
4.
7 5.
0
6.0
7.
0
8.0
9.
0
T
otal
EQ
A
3.9
4.0
4.
5
5.5
6.
0
7.0
Ad
ditio
nal R
ON
Par
king
0
0
1
2
2
2
Dep
artu
re L
oung
es (s
quar
e fe
et):
R
egio
nal (
Gro
up II
)
0
0
0
0
0
Reg
iona
l (G
roup
III)
2,
300
3,
500
3,
500
4,
600
4,
600
N
arro
wbo
dy (G
roup
III)
6,00
0
6,00
0
8,00
0
8,00
0
10,0
00
Tot
al D
epar
ture
Lou
nge
Are
a 8,
617
8,
300
9,50
0
1
1,50
0
12,
600
1
4,60
0 A
IRLI
NE
SPA
CE
Tick
etin
g/C
heck
-in P
ositi
ons:
Tota
l Equ
ival
ent P
ositi
ons
25
2
3
23
25
2
9
32

CH
APTE
R 3
- PA
SSEN
GER
TER
MIN
AL D
EMAN
D C
APAC
ITY
AND
FAC
ILIT
Y R
EQU
IREM
ENTS
3-
16
TABL
E 3-
6
Term
inal
Fac
ilitie
s Pl
anni
ng C
riter
ia
R
ecom
men
ded
Faci
litie
s
Bas
e Ye
ar
Act
ivity
Fore
cast
Act
ivity
Lev
el
Exis
ting
Faci
litie
s
20
07
20
13
20
18
20
28
H
igh
P
erce
ntag
e U
sing
Sta
ffed
Pos
ition
s
64
60
50
40
40
Con
vent
iona
l Sta
ffed
Pos
ition
s 14
15
1
4
1
3
12
1
3
Per
cent
age
Usi
ng K
iosk
s
36
40
50
60
60
Sel
f Ser
vice
Kio
sks
11
8
9
13
1
7
19
Li
near
Pos
ition
s 23
23
2
3
2
5
29
3
2 Ti
cket
Cou
nter
– le
ngth
(lin
ear f
eet)
119
130
130
140
16
0
180
Tick
et C
ount
er –
are
a (s
quar
e fe
et)
1,37
6
1,3
00
1,30
0
1,40
0
1,
600
1,80
0 A
TO O
ffice
s (s
quar
e fe
et)
945
3
,300
3,
300
3,
500
4,00
0
4,
500
Airl
ine
Ope
ratio
ns (
squa
re fe
et)
2,18
9
2,0
00
2,30
0
2,80
0
3,
000
3,50
0 B
agga
ge M
ake-
up:
E
stim
ated
Mak
e-up
cap
acity
(car
ts)
12
16
18
22
2
4
28
B
agga
ge M
ake-
up a
rea
(squ
are
feet
) 4,
428
8
,000
9,
000
11,
000
1
2,00
0
14,
000
C
heck
ed B
agga
ge E
DS
– u
nits
2
4
4
4
5
5
C
heck
ed B
agga
ge E
DS
– a
rea
(squ
are
feet
) 57
0
2,0
00
2,00
0
2,00
0
2,
500
2,50
0 B
agga
ge C
laim
:
Cla
im F
ront
age
requ
ired
(line
ar fe
et)
-
2
10
21
0
23
0
260
29
0
Cla
im U
nits
2
2
2
2
2
3
C
laim
Fro
ntag
e P
rogr
amm
ed (l
inea
r fee
t) 21
0
2
60
26
0
26
0
260
39
0
Cla
im A
rea
(squ
are
feet
) 4,
755
7
,800
7,
800
7,
800
7,80
0
11,
700
O
vers
ized
Bag
gage
(sq
uare
feet
) 14
5
4
00
40
0
40
0
400
60
0 B
agga
ge S
ervi
ce O
ffice
s (s
quar
e fe
et)
0
5
00
50
0
50
0
600
70
0 B
agga
ge C
laim
Off-
load
Are
a (s
quar
e fe
et)
2,13
5
3,0
00
3,00
0
3,00
0
3,
000
4,50
0 B
agga
ge T
rain
Circ
ulat
ion
(squ
are
feet
) 0
1,1
00
1,20
0
1,40
0
1,
500
1,90
0 S
ubto
tal
16,5
43
29,
400
3
0,80
0
3
3,80
0
36,
400
4
5,70
0 C
ON
CES
SIO
NS
Se
cure
Con
cess
ions
(squ
are
feet
):
Foo
d/B
ever
age
472
1
,600
1,
800
2,
100
2,60
0
2,
900

CH
APTE
R 3
- PA
SSEN
GER
TER
MIN
AL D
EMAN
D C
APAC
ITY
AND
FAC
ILIT
Y R
EQU
IREM
ENTS
3-
17
TABL
E 3-
6
Term
inal
Fac
ilitie
s Pl
anni
ng C
riter
ia
R
ecom
men
ded
Faci
litie
s
Bas
e Ye
ar
Act
ivity
Fore
cast
Act
ivity
Lev
el
Exis
ting
Faci
litie
s
20
07
20
13
20
18
20
28
H
igh
N
ews/
Gift
/Ret
ail
619
9
00
1,00
0
1,10
0
1,
400
1,60
0 S
ubto
tal:
Sec
ure
Con
cess
ions
1,
091
2
,500
2,
800
3,
200
4,00
0
4,
500
Non
-Sec
ure
Con
cess
ions
(squ
are
feet
):
Foo
d/B
ever
age
4,54
7
1,6
00
1,80
0
2,10
0
2,
600
2,90
0
New
s/G
ift/R
etai
l 1,
025
9
00
1,00
0
1,10
0
1,
400
1,60
0 S
ubto
tal:
Non
-Sec
ure
Con
cess
ions
5,
572
2,50
0
2,80
0
3,20
0
4,00
0
4,50
0 O
ther
Ser
vice
s (s
quar
e fe
et)
719
700
700
700
70
0
700
Con
cess
ion
Sup
port
Are
a (s
quar
e fe
et)
2,21
6
1,5
00
1,70
0
1,90
0
2,
400
2,70
0 R
enta
l Car
Cou
nter
-leng
th (l
inea
r fee
t) 75
80
12
0
12
0
120
12
0 R
enta
l Car
Lea
se A
rea
(squ
are
feet
) 1,
464
1
,600
2,
400
2,
400
2,40
0
2,
400
Gro
und
Tran
spor
tatio
n S
ervi
ces
(squ
are
feet
) 0
0
20
0
20
0
200
20
0 S
ubto
tal
11,0
62
8,80
0
10,6
00
11
,600
13,7
00
15
,000
PU
BLI
C S
PAC
E (s
quar
e fe
et)
Tick
et L
obby
5,
280
6
,500
6,
500
7,
000
8,00
0
9,
000
Pub
lic S
eatin
g/W
aitin
g A
rea
3,34
2
2,9
00
2,90
0
3,20
0
3,
600
4,10
0 R
AC Q
ueue
Are
a 76
2
1,2
00
1,80
0
1,80
0
1,
800
1,80
0 R
estro
oms
– Te
rmin
al L
ocat
ions
1,
315
1
,700
1,
700
1,
900
2,10
0
2,
400
Res
troom
s –
Sec
ure
Loca
tions
53
8
1,8
00
1,80
0
1,80
0
1,
800
1,80
0 Se
cure
Circ
ulat
ion
7,48
9
8,3
00
9,90
0
1
1,60
0
13,
200
1
4,90
0 Se
curit
y Sc
reen
ing
Lane
s 2
2
2
3
3
3
C
heck
poin
t/sea
rch/
queu
e ar
ea
3,22
2
2,5
00
2,50
0
3,80
0
3,
800
3,80
0 O
ther
Pub
lic C
ircul
atio
n 22
,292
14,
800
1
6,30
0
1
8,30
0
20,
100
2
3,30
0 S
ubto
tal
44,2
40
39,7
00
43
,400
49,4
00
54
,400
61,1
00
OTH
ER A
REA
S (s
quar
e fe
et)
In
form
atio
n C
ount
er
83
100
100
100
10
0
100
Airp
ort A
dmin
istra
tion/
Ope
ratio
ns
6,32
6
6,6
00
6,60
0
6,60
0
6,
600
6,60
0
CH
APTE
R 3
- PA
SSEN
GER
TER
MIN
AL D
EMAN
D C
APAC
ITY
AND
FAC
ILIT
Y R
EQU
IREM
ENTS
3-
18
TABL
E 3-
6
Term
inal
Fac
ilitie
s Pl
anni
ng C
riter
ia
R
ecom
men
ded
Faci
litie
s
Bas
e Ye
ar
Act
ivity
Fore
cast
Act
ivity
Lev
el
Exis
ting
Faci
litie
s
20
07
20
13
20
18
20
28
H
igh
TSA
Offi
ces
2,03
8
2,0
00
2,00
0
2,50
0
2,
500
2,50
0 N
on-P
ublic
Circ
ulat
ion
3,48
5
3
,100
3,
200
3,
600
3,90
0
4,
500
Sub
tota
l 11
,932
11
,800
11,9
00
12
,800
13,1
00
13
,700
Tota
l Fun
ctio
nal A
rea
92,3
94
98,0
00
10
6,20
0
119,
100
13
0,20
0
150,
100
M
echa
nica
l/Ele
ctric
al/U
tility
12
,007
1
1,80
0
12,
700
14,
300
1
5,60
0
18,
000
Jani
toria
l/Sto
rage
/Sho
ps
5,23
6
2,9
00
3,20
0
3,60
0
3,
900
4,50
0 S
truct
ure/
non-
net a
reas
4,
953
3
,400
3,
700
4,
100
4,50
0
5,
200
TOTA
L TE
RM
INA
L G
RO
SS A
REA
11
4,59
0
116,
100
12
5,80
0
141,
100
15
4,20
0
177,
800
Gro
ss T
erm
inal
Are
a pe
r squ
are
feet
/gat
e:
22,9
00
23,2
00
21
,000
20,2
00
19
,300
19,8
00
Rev
enue
Are
a:
(airl
ines
, con
cess
ions
& o
ther
tena
nts)
(d
oes
not i
nclu
de a
dver
tisin
g di
spla
ys)
32.9
40
.1
40
.5
40
.7
42
.4
Non
reve
nue
Area
67
.1
59.9
59.5
59.3
57.6
P
repa
red
By:
Hirs
h A
ssoc
iate
s
Not
es:
1/
Doe
s no
t inc
lude
adv
ertis
ing
disp
lays
.
SECTION 3 PASSENGER TERMINAL DEMAND CAPACITY AND FACILITY REQUIREMENTS
3-19
It should be noted that the terminal space program represents a starting point for terminal planning. It is generally considered a minimum program which is needed to support the peak hour levels of passenger activity. As such, it does not refer to any specific terminal concept or gate configuration. When a final terminal concept is chosen, the gross terminal area may differ from the square foot total presented in the tables. For example, the amount of secure and non-secure circulation may vary from the program due to the terminal configuration and location of the security checkpoint, whereas the amount of airline space is relatively independent of the concept selected.
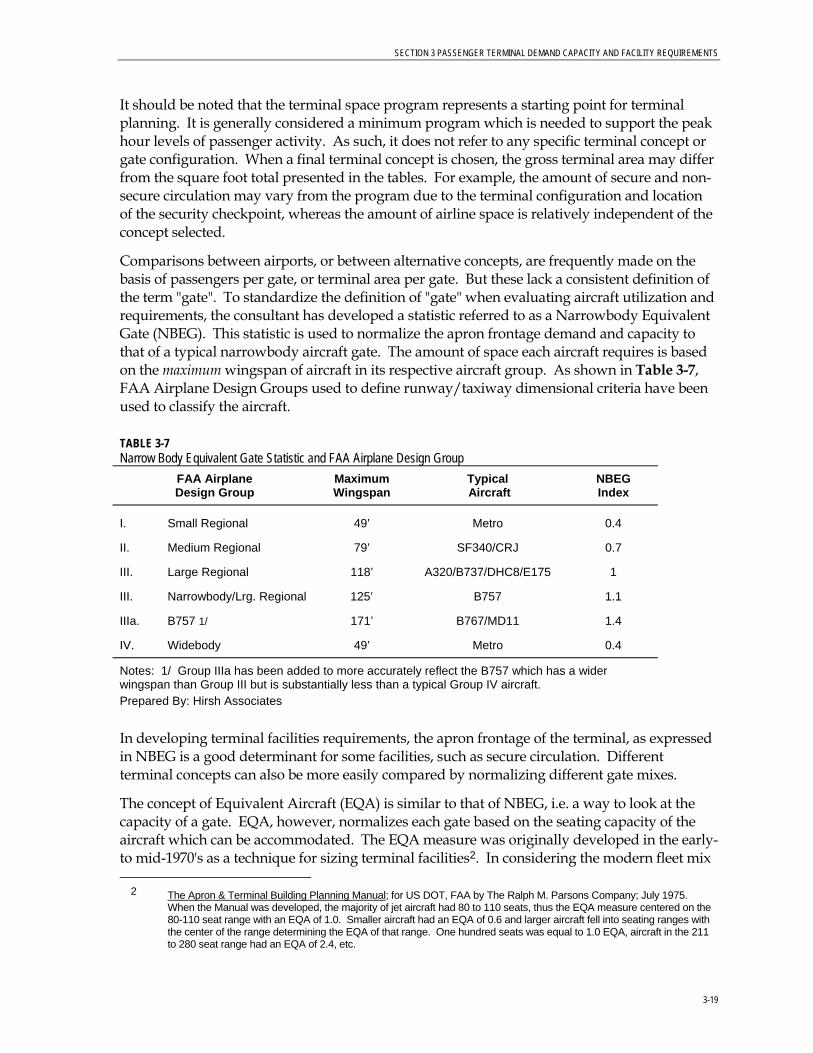
Comparisons between airports, or between alternative concepts, are frequently made on the basis of passengers per gate, or terminal area per gate. But these lack a consistent definition of the term "gate". To standardize the definition of "gate" when evaluating aircraft utilization and requirements, the consultant has developed a statistic referred to as a Narrowbody Equivalent Gate (NBEG). This statistic is used to normalize the apron frontage demand and capacity to that of a typical narrowbody aircraft gate. The amount of space each aircraft requires is based on the maximum wingspan of aircraft in its respective aircraft group. As shown in Table 3-7, FAA Airplane Design Groups used to define runway/taxiway dimensional criteria have been used to classify the aircraft.
TABLE 3-7 Narrow Body Equivalent Gate Statistic and FAA Airplane Design Group
FAA Airplane Design Group
Maximum Wingspan
Typical Aircraft
NBEG Index
I. Small Regional 49’ Metro 0.4
II. Medium Regional 79’ SF340/CRJ 0.7
III. Large Regional 118’ A320/B737/DHC8/E175 1
III. Narrowbody/Lrg. Regional 125’ B757 1.1
IIIa. B757 1/ 171’ B767/MD11 1.4
IV. Widebody 49’ Metro 0.4
Notes: 1/ Group IIIa has been added to more accurately reflect the B757 which has a wider wingspan than Group III but is substantially less than a typical Group IV aircraft. Prepared By: Hirsh Associates
In developing terminal facilities requirements, the apron frontage of the terminal, as expressed in NBEG is a good determinant for some facilities, such as secure circulation. Different terminal concepts can also be more easily compared by normalizing different gate mixes.
The concept of Equivalent Aircraft (EQA) is similar to that of NBEG, i.e. a way to look at the capacity of a gate. EQA, however, normalizes each gate based on the seating capacity of the aircraft which can be accommodated. The EQA measure was originally developed in the early- to mid-1970's as a technique for sizing terminal facilities2. In considering the modern fleet mix 2 The Apron & Terminal Building Planning Manual; for US DOT, FAA by The Ralph M. Parsons Company; July 1975.
When the Manual was developed, the majority of jet aircraft had 80 to 110 seats, thus the EQA measure centered on the 80-110 seat range with an EQA of 1.0. Smaller aircraft had an EQA of 0.6 and larger aircraft fell into seating ranges with the center of the range determining the EQA of that range. One hundred seats was equal to 1.0 EQA, aircraft in the 211 to 280 seat range had an EQA of 2.4, etc.

CHAPTER 3 - PASSENGER TERMINAL DEMAND CAPACITY AND FACILITY REQUIREMENTS
3-20
of regional and jet aircraft, and in order to have some relationship with the physical parameters associated with the NBEG, the basis of EQA has been revised from the 1970 definition. The modern Equivalent Aircraft is also a Group III narrowbody jet. Most aircraft in this class typically have 140-150 seats. This establishes a basis of 1.0 EQA = 145 seats. As with the concept of NBEG, smaller aircraft may use a gate. However, as shown in Table-8, the EQA capacity is based on the largest aircraft and seating configuration typically in use.
TABLE 3-8 Equivalent Aircraft and FAA Airplane Design Groups
FAA Airplane Design Group
Typical Seats
Typical Aircraft
EQA Index
I. Small Regional 25 Metro 0.2
II. Medium Regional 50 SF340/CRJ 0.4
III. Large Regional 75 DHC8/E175 0.5
III. Narrowbody/Lrg. Regional 145 A320/B737/MD80 1
IIIa. B757 185 B757 1.3
IV. Widebody 280 B767/MD11 1.9
Prepared By: Hirsh Associates
While most terminal facility requirements are a function of peak hour passenger volumes, some airline facilities are more closely related to the capacity of the aircraft. For example, while the total number of baggage carts required for a flight are a function of peak hour passengers (and their bags), the number of carts staged at any one time are generally based on the size of the aircraft. Thus, the EQA capacity of the terminal represents a better indicator of demand for these facilities.
In the following program analysis, peak hour passengers, NBEG and EQA have been used as appropriate to estimate the demand for terminal facilities.
3.3.1 Aircraft Gates and Departure Lounges The previous discussion of the methodology used to project the demands for aircraft gate positions were for nominal gates. The total number of gates must be converted to a gate mix to develop a terminal program.
Gate Mix Three existing gates have passenger loading bridges and can accommodate Group III narrowbody aircraft, as well as smaller RJs. The other two ground loaded parking positions are flexible and, under current scheduling, are used for Group II and III regional aircraft. During 2007, Allegiant's MD-80 was gated on one of the ground loaded gates although officially sized for a smaller Group II aircraft.
The projected gate mix recommends that the number of Group III mainline narrowbody gates remain constant in the near term to provide continued opportunities for mainline service in the peak season. The forecast fleet mix growth of mainline and larger regional jets also indicates that gates for mainline aircraft should be increased over time to maintain this flexibility. With

CHAPTER 3 - PASSENGER TERMINAL DEMAND CAPACITY AND FACILITY REQUIREMENTS
3-21
the exception of one or two Group III regional gates (for large turboprop aircraft) it is recommended that all gates have loading bridges.
Remain Overnight (RON) Aircraft Parking In addition to active gates, parking needs to be provided for additional RON aircraft. During the summer 2007 period there were five aircraft on the ground overnight, as compared to the four active gates. This is a typical pattern at spoke airports.
In the longer term, it is expected that the number of RON positions will likely grow slightly, although this is highly dependent on individual airline scheduling practices and fleet allocation.
Departure Lounges Departure Lounges, or Holdrooms, are based on the mix of gates and the average seating capacity of each class of aircraft. The holdroom area consists of the passenger seating/lounge area; the airline's ticket lift podium; and circulation.
The amount of seating/lounge area is generally based on providing lounge area for 80 percent of the aircraft capacity. Of these passengers, the percentage of passengers seated varies from 50 percent to 80 percent, with the remaining 20 percent to 50 percent standing. At MSO it is recommended that an 80 percent seated / 20 percent standing ratio be used to maintain a higher level of service which the Airport wants to maintain. Lower seating ratios are more appropriate when alternative secure-side waiting areas are available such as larger sit-down restaurants which may not be provided. The difference in holdroom area for the aircraft mix at MSO is also relatively minor.
All holdrooms are assumed to be grouped to allow better flexibility of use, as is the current condition. Grouping makes it is possible to reduce the amount of passenger seating by approximately 10 percent. When there are simultaneous departures from adjacent gates, as at MSO, such a reduction is typically not recommended.
A 180 square foot (6 feet wide) deplaning corridor has been added to the lounge area which assumes an average 30-foot deep holdroom. The corridor effectively acts as an extension of the loading bridge or apron door. Each ticket lift podium position is allocated 5 feet for width, although many airlines use 3-4 feet wide positions. The depth of the podium and back wall is typically 8 feet and a 10-15-foot deep queuing area is provided. Table 3-9 describes the average aircraft seating capacities and holdroom sizes for aircraft types operating at MSO.
TABLE 3-9 Average Aircraft Seating Capacities and Hold Room Sizes
Seats Area (SF)
Group I Regional 50 850
Group III Regional 80 1,150
Narrowbody 145 2,000
Prepared By: Hirsh Associates

CHAPTER 3 - PASSENGER TERMINAL DEMAND CAPACITY AND FACILITY REQUIREMENTS
3-22
The existing upper level holdrooms total approximately 7,100 square feet, which indicates some excess capacity for the current fleet mix. The lower level holdroom is approximately 1,500 square feet, which also has excess capacity for current levels of activity. The program indicates a shortfall in holdroom area beginning in 2013. Some of this deficit may be mitigated if mainline equipment is only used for a limited number of flights.
3.3.2 Airline Space Airline space includes both exclusive leased areas (for example offices and operations), and joint use space (such as baggage claims).
Airline Ticket Counter (ATO Counter) ATO positions are typically based on the number of peak hour enplaning passengers; the number of peak departing flights; the number of airlines; the time distribution of passengers arriving at the terminal; and the percentage of passengers checking in at the ticket counter vs. curbside check-in or using a self-service kiosk. Some of this information has been estimated for MSO. A planning factor was developed which reflects these characteristics, current ATO counter utilization (not necessarily leased positions), and understood excesses and shortfalls.
The existing airlines are using a combination of 12 conventional staffed ATO counters and 11 electronic self-service kiosks3. Nine of the kiosks are installed immediately in front of, or adjacent to the ATO counter. Two will be located along the front window wall of the ticket lobby for passengers without checked bags. There are two additional check-in positions which are not actively used. There is approximately 119 linear feet (LF) of ATO counter.
In order to estimate future ATO requirements, conventional staffed positions and kiosks were combined as Equivalent Check-in Positions (ECP). Each airlines' ECP is the number of conventional positions in use, plus the number of kiosks. Thus, the current ECP demand is 12 conventional positions plus 11 kiosks, or 23 ECP. The current ratio of Peak Hour Enplaned Passengers per ECP was held constant for the forecast years. This will accommodate both growth in passengers and provide an opportunity for new airlines.
From discussions with the airlines, and the number of kiosks in use, it is estimated that 64 percent of the passengers use conventional check-in counters, and that 36 percent use kiosks. Utilization varies significantly between the existing airlines, ranging from 0 percent for Allegiant to 85 percent for NW. Based on industry trends, the percentage of kiosk use is expected to increase in the future. Using these assumptions, conventional staffed positions are expected to remain relatively constant over time, with the growth in check-in capacity due to additional kiosks.
The current shortfall of conventional check-in counters is consistent with discussions concerning lack of facilities for Allegiant. Similarly, the existing oversupply of kiosks is reflected in that the peak hour is driven by Allegiant which does not use kiosks.
The number of forecast ECPs was converted to conventional linear positions to establish the length of the ATO counter. Locations for kiosks are a combination of airline preference and the
3 The existing count of kiosks includes two units for UA and one additional unit for DL which were to be installed late in
2007.

CHAPTER 3 - PASSENGER TERMINAL DEMAND CAPACITY AND FACILITY REQUIREMENTS
3-23
physical constraints of the ticket lobby. Of the 11 kiosks, nine are presently located in line with the ATO counter, with only two away from the counter. It has been assumed that the current ratio of linear positions to ECP (approximately 1:1) will continue.
Most domestic carriers can use a 6-foot double counter plus a shared 30 inch bag well for an average of 4.25 feet per agent. There are also breaks in the ATO counter to allow personnel access to individual ATO office areas, and end counters typically without bag wells. This increases the average ATO counter length for planning to approximately 5.5 linear feet per position, as compared to an existing ratio of 5.2 linear feet per position. The width of an in-line kiosk can be less than that of a staffed counter, but is highly dependent on individual airlines' equipment. For planning, all in-line positions are assumed to require the same width.
The ATO counter has a typical 10-foot deep area from the back wall to the front of the counter. This is assumed to continue.
Airline Offices Airline Offices include the ATO offices and other airline administrative spaces. At most airports the ATO offices are located immediately behind, or adjacent to the ATO counter to provide support functions for the ticket agents. Typically these are 25-30 feet deep along the length of the counter. Other offices may include functions such as the airline station manager. The amount of these offices and location (ATO, operations area, office location on a terminal upper level, etc.) is dependent on individual airline requirements and preferences, and space availability.
In the existing terminal all offices and operations spaces are located directly behind the ATO counter. These offices vary in configuration, and all of the space is leased. The existing space utilization (ATO, administrative and operations) was determined during meetings with the airline station managers. For the program, a 25-foot deep office area has been assumed behind the ATO counter.
Airline Operations Operations include all of the apron level support spaces for aircraft servicing, and aircraft crew related support spaces. The demand for operations areas is a function of the size and types of aircraft being operated and individual airline operating policies. Because many airlines do not identify their specific space requirements at this stage of planning and future airlines cannot be identified, a program area for operations is typically based on the number/size of gates and airlines at an airport.
As noted above, at MSO operations spaces are integrated with ATO and other offices behind the ticket counter. In addition, operations related functions (such as staff lockers and storage) occur in baggage make-up areas since sufficient space is not available elsewhere. For planning, it is recommended that appropriate operations spaces be provided separate from ATO offices and baggage make-up. A relatively low planning factor has been used which recognizes that aircraft maintenance is not regularly done at MSO. The combination of ATO offices and operations spaces (approximately 3,130 square feet) is considered to be less than demand (5,300 square feet).
With the exception of the baggage make-up areas, ground service equipment (GSE) is stored on the apron. This is a problem for many of the carriers and should be addressed in future
CHAPTER 3 - PASSENGER TERMINAL DEMAND CAPACITY AND FACILITY REQUIREMENTS
3-24
terminal development. The Program, however, does not specifically identify an area for enclosed GSE storage.
Baggage Make-up Baggage make-up includes the make-up units, the cart loading areas and baggage tug/cart (baggage train) maneuvering lanes. Each airline presently has a separate make-up area with simple run-out belts. As noted above, the airlines use part of their make-up areas for operations or storage.
Due to the configuration of the bag rooms and conveyors, most of the bag carts must be pushed into position by hand, but depending on how each airline stages its carts, some can be pulled out directly by bag tugs. In most cases, the amount of make-up conveyor presentation length is considered inadequate and some carts must be staged away from the conveyor.
Although checked baggage ratios are a consideration, these generally affect the total number of baggage carts in use rather than the size of the make-up area. The number of carts staged at any one time, however, are generally based on the size of the aircraft. Using EQA provides a consistent basis for baggage system planning, since larger aircraft typically require more bag cart staging area than smaller aircraft. The number of staged carts is also a function of individual airline policies for pre-sorting baggage at the spoke airport for more efficient transfer at their hub.
The program area should be able to continue to accommodate individual belts for each airline with adequate tug/cart maneuvering; shared recirculating make-up units; or a combination of the two arrangements if desired in the future. All of the bag make-up functions should be in enclosed, conditioned spaces with adequate ventilation for personnel.
Checked Baggage Screening As a result of the Aviation and Transportation Security Act, all checked baggage is subject to screening for explosives. As with most smaller airports, baggage screening is done in the ticket lobby after passengers check-in and have bag tags attached. The two screening areas were reasonably convenient, except for Allegiant, but do block passenger circulation.
The TSA is currently using two, Reveal CT-80 explosive detection systems (EDS) in combination with explosive trace detection (ETD) units for alarmed bags which cannot be cleared by the EDS operators, and oversized bags which cannot fit in the CT-80 unit. The ETD units also provide additional inspection capacity during peak conditions. The Reveal CT-80s are low capacity units (approximately 100 bags per hour) and are much smaller than other EDS units. It also is possible to install the CT-80s in an in-line configuration in the baggage make-up area. For the long term, the industry consensus is that for all but the smallest airports, some type of in-line equipment will be necessary. In-line systems have been assumed for future MSO planning, however this will require a terminal expansion to accommodate the equipment.
During the summer, data from some airlines, and estimates by others indicate an average of 1.2 checked bags/passenger for the peak periods. The ratio is reported to be higher during holidays, but the summer ratio has been used for planning as this is the peak season. This requires four, common use CT-80s for current peaks which is consistent with reports of

CHAPTER 3 - PASSENGER TERMINAL DEMAND CAPACITY AND FACILITY REQUIREMENTS
3-25
capacity problems during the summer of 2007. The current units can generally meet airline departure times due to the early check-in times required by the airlines.
For MSO, an in-line concept would be for each airline to have an individual EDS unit. Each airline would need to have a large EDS to accommodate high peaking demands, as opposed to multiple airlines sharing a larger capacity EDS unit. Redundancy issues would need to be addressed with multiple EDS units. A more detailed study of individual baggage flow rates would need to be conducted for individual airline installations. It should be noted that EDS technology is changing, and that the capacity of existing equipment (such as the CT-80) may be increased by upgrades rather than replacement. Thus, it is recommended that sufficient flexibility be maintained in expansion alternatives to accommodate different EDS configurations.
The Program area has assumed individual in-line EDS units similar in size and capacity to the CT-80, including in-feed and outflow conveyors and adjacent ETD inspection tables for alarmed bags. This should provide sufficient program area to accommodate different EDS configurations and operating scenarios.
Baggage Claim Baggage claim requirements are based primarily on peak hour deplaned passengers, the concentration of these arriving passengers within a 20 minute time period, and - to a lesser extent - checked bag per passenger ratios. Observations at most U.S. airports indicate that the majority of domestic passengers arrive at the baggage claim area before their bags are unloaded onto the claim units. At an airport such as MSO, virtually 100 percent of the passengers are waiting prior to first bag delivery. The result is that the claim unit should be sized for the estimated number of passengers waiting for baggage, because most bags are claimed on the first revolution of the claim unit.
An analysis of the schedules indicates that the concentration of arriving seats within a peak 20 minute period was 60 percent of the hourly arrivals during the summer 2007. This is a typical-to-high percentage, but understandable given the scheduling patterns at MSO. The percentage of passengers who have checked baggage is estimated at 80 percent based on the average of 1.2 checked bags per passenger reported by the airlines.
The two existing claim units have approximately 90 and 120 linear feet of claim frontage. The larger claim is reasonably sized for most narrowbody aircraft (but could be undersized for Allegiant), and can accommodate multiple smaller regional flights. The smaller claim is properly sized for a regional aircraft of the 70-80 seat range. Based on the seasonal peaks, both claim units should be able to accommodate larger mainline narrowbody aircraft and have at least 130 linear feet of claim frontage.
The baggage claim area is recommended to be 30 square feet per foot of frontage to provide adequate queuing and circulation space. The separation between adjacent claim units is recommended to be 30 feet as compared to 28 feet at present.
There is a single bag claim shelf for oversized items such as skis and golf bags. This shelf is generally adequate. However, due to the configuration of the bag claim off-load area, a second over-size shelf should be provided.

CHAPTER 3 - PASSENGER TERMINAL DEMAND CAPACITY AND FACILITY REQUIREMENTS
3-26
Baggage Service Offices Baggage service offices are typically required only by airlines with sufficient activity to warrant staffing. Other airlines may use baggage lock-up areas to store late or unclaimed baggage. There are no baggage service offices or lock-up areas at present. Discussions with the airlines indicate that only one airline is presently interested in staffing an office, but storage space might be used by other carriers as well.
Baggage Claim Off-load These areas include: the portion of a flat plate, direct feed claim unit upon which the bags are placed (or the feed conveyor for a remote-fed claim unit); the adjacent baggage train lane and work area; and a by-pass lane for baggage trains.
The bag claim off-load area is narrow so that a bag cart train cannot bypass carts which are being unloaded. This limits the flexibility of use of the claim units, and can cause delays in delivering bags.
Baggage Train Circulation A small percentage of baggage handling space for baggage train circulation around and between the bag make-up areas is included for planning. The final configuration of the terminal may require more or less space.
3.3.3 Concessions Terminal Concessions include all of the commercial, revenue-producing functions which serve the traveling public. At the present time, approximately 84 percent of the food/beverage and retail merchandise concessions are located in the non-secure area of the terminal. This was less of a problem prior to 9/11 when security screening was faster. Passengers could stay in the non-secure area longer, or easily return to the non-secure area if a flight was delayed.
With slower, more intensive screening and the prohibition of visitors past security, most passengers are reluctant to stay in the non-secure area as long. Unless a flight delay is of a known, long duration, passengers are also reluctant to leave the holdroom to use the concessions in the non-secure area. At MSO, with the new checkpoint location, the existing non-secure concessions are also not within sight of the security queue.
For most airports it is recommended that only 10-20 percent of concessions be on the non-secure side of the terminal. At MSO, the concessions (especially the restaurant) draw a significant number of non-passengers which are necessary to maintain the businesses. Thus, it is recommended that up to 50 percent of the concessions remain non-secure.
Food and Beverage Services Food and beverage concessions presently include a table service restaurant and bar in the non-secure area. The existing area for seating and the kitchen is considered adequate by the restaurant operator. There has been a significant reduction in take-out business due to TSA regulations. The new checkpoint location has also reduced the number of passengers which would walk by the restaurant. In terms of typical demand levels, there is more than adequate space through the forecast period.

CHAPTER 3 - PASSENGER TERMINAL DEMAND CAPACITY AND FACILITY REQUIREMENTS
3-27
There is a small coffee/snack bar on the upper level of the secure portion of the concourse. This location has been recently expanded and has good visibility from the holdrooms.
News/Gift/Specialty This category includes news, gift, retail, and specialty shops. There is one large news/gift shop adjacent to the main seating area (non-secure) and a smaller secure location along the corridor to the upper level holdrooms. The new secure location is larger than the previous location, but is still not ideally located. The previously occupied balcony location has been counted as available space but is currently vacant.
Other Services This category is limited to the travel agency and real estate offices located around the main lobby/seating area. This is not anticipated to change over the planning period.
Concession Support Concession support consists of storage areas, preparation kitchens, employee lockers and administrative offices. The identified support areas include the kitchen and storage areas adjacent to the restaurant, storage/offices for the retail store, and identified storage areas in the basement.
Support areas are currently equal to approximately 33 percent of the public portions of the concessions. The larger concessionaires report that they have adequate support space. For Programming, a more typical 30 percent of the customer-serving areas has been used.
Rental Car Counters There are four rental car companies operating on-airport: Avis, Budget, Hertz and National/Alamo. Each company has a counter and office area in the terminal, and an assigned number of ready/return parking spaces in a lot adjacent to the terminal. Four other companies (Dollar, Enterprise, Rent-a-Wreck and Thrifty) have facilities off-airport and pick up passengers by van.
Office and counter space for the existing four rental car companies is considered adequate. Some off-airport companies have expressed interest in leasing terminal counters and parking at the airport, therefore counter and parking space should be expanded to accommodate a total of six companies within the planning period.
Ground Transportation Services There are no spaces in the terminal used by other ground transportation services (taxis or buses). For planning, it is recommended that space be provided for other transportation services in the future.
3.3.4 Public Spaces Public spaces include most of the non-revenue producing areas of the terminal including queuing areas, seating and waiting areas, restrooms, and circulation. Some of the public space elements are directly related to peak hour passenger volumes, whereas others are functions of other facility requirements.

CHAPTER 3 - PASSENGER TERMINAL DEMAND CAPACITY AND FACILITY REQUIREMENTS
3-28
Ticket Lobby The ticket lobby includes ticket counter (ATO) queuing area and cross circulation. The ticket lobby varies in depth from 25 feet opposite the former Big Sky counter; to 35 feet opposite Skywest; and approximately 40 feet at Northwest. At the Horizon counter, the depth varies from 22 feet to the end of the EDS screening area to much deeper depending on where the corridor to the new Security Screening Check Point (SSCP) is considered to be. The EDS areas have caused crowding in the queues and limits cross-circulation, especially in the narrower areas when Big Sky handled Allegiant.
The minimum dimension from the face of the ticket counter to any obstruction to cross circulation should be 35 feet for smaller airports with traffic similar to MSO. The area in the Program includes lobby space beyond the ends of the ATO counter. However, the difference between the existing area (which excludes the space taken by the EDS) and the Base Year requirements is effectively greater than shown in the Table since the ATO counter is not continuous.
Public Seating Public seating areas include general waiting areas near the ticket lobby, baggage claim areas and concessions. These are typically in non-secure areas of the terminal.
Existing seating and waiting areas are located in a large central lobby between the curb and ticket lobby, across from the holdroom exit and Big Sky ATO counter, in scattered areas along corridors, and in an area along the front wall opposite the baggage claim.
Airports typically provide seating for a portion of the peak hour enplaned passengers and their visitors, plus the greeters for the deplaning passengers. Due to security restrictions, the number of well-wishers at most airports have declined dramatically, and due to the high percentage of tourists, these ratios are estimated to be low at MSO.
Typically, most passengers go through security as soon as possible after check-in. This reduces the demand for general seating for departing passengers. For terminal programming, it has been assumed that non-secure seating would be provided for 10 percent of peak hour enplaned passengers and their visitors, plus all of the meeter/greeters of deplaning peak hour passengers.
Rental Car Queue The rental car queue provides an area for passengers distinct from circulation corridors or the baggage claim area. A 10-foot deep zone in front of the rental car counters has been assumed for the existing queue which leaves approximately 13 feet for circulation between the back of the queue and the first set of columns defining the active baggage claim area. This is due to the awkward configuration of the baggage claim addition to the original terminal. Discussions with the rental car companies and airlines indicate that there are congestion problems with the rental car queue and the bag claim at peak times. It is recommended that a 15-foot deep rental car queue area be provided in addition to adequate cross circulation behind the queue.
Restrooms Restrooms should have at least as many toilets for women as toilets and/or urinals for men. Most of the existing restrooms have equal numbers of fixtures for men and women. In some
CHAPTER 3 - PASSENGER TERMINAL DEMAND CAPACITY AND FACILITY REQUIREMENTS
3-29
jurisdictions, new building codes are mandating 25 percent to 50 percent more fixtures for women than for men. These ratios are appropriate for airports when the passenger gender mix approaches 50 percent female.
The program area has been divided between the main terminal locations (ticketing, bag claim and concession areas) and the secure holdroom area. The terminal factor is based on peak hour total passengers and their estimated visitors. The holdroom factor is based on providing a restroom appropriate to the size of the aircraft gates. The minimum number of toilets and/or urinals is recommended to be six per sex for the secure location.
Restrooms are currently located at two locations in the non-secure portion of the terminal, and at the upper holdroom area. There are no restrooms for the lower level holdroom. The restrooms in the terminal appear to be reasonably sized, but there should be a restroom for both holdroom levels.
In addition to handicapped access toilets, sinks and urinals, it is recommended in transportation facilities such as airports that companion care restrooms be provided. These unisex restrooms allow an elderly or disabled person, and small children to be accompanied into a restroom by another person who assists them. Although not very large, retrofitting these companion care facilities can be difficult. The program areas include an allowance for such restrooms in both secure and non-secure areas. The Airport does not currently have any companion care restrooms.
Secure Circulation Secure circulation typically consists of the main corridor of the concourses and adjacent egress stairs from upper level holdrooms. At MSO, an approximately 10-foot wide circulation zone exists along the upper holdroom with a narrower corridor connecting to the stairs from the security checkpoint. Enplaning passenger circulation up from the SSCP is via a stair and elevator, with no provision for a future escalator. Exiting circulation and access to the ground level holdroom is via stairs and an elevator.
Terminal planning practice would recommend a 15-foot wide corridor for single-loaded concourses handling aircraft of the size expected at MSO. Ancillary uses would be located outside of these corridors. The program area is based on an area per equivalent concourse length determined by gates expressed as NBEG. The actual amount of secure circulation required will depend on the terminal configuration.
Security Screening Checkpoint (SSCP) With the changes in security inspection procedures, processing rates have been greatly reduced at most airports. The TSA has also mandated new security screening checkpoint (SSCP) configurations. In 2007 MSO greatly expanded its former single lane checkpoint into a dual lane configuration. Although this has improved the level of passenger service and processing rate, limited TSA staffing has restricted the hours when both lanes can be staffed.
Actual screening rates have not been measured at MSO, but it is reported by the TSA that they are achieving approximately 100-105 passengers/hour/lane4. It is understood that when fully 4 180-210 passengers/lane/hour is a typical processing rate measured at most larger domestic airports. Airports with high
percentages of leisure travelers tend to have lower processing rates.

CHAPTER 3 - PASSENGER TERMINAL DEMAND CAPACITY AND FACILITY REQUIREMENTS
3-30
staffed, the existing two SSCP lanes can accommodate current levels of activity. An effective processing rate of 120 passengers/hour/lane has been used for calculating demand due to the spread out nature of the passenger arrivals curve. That is, a peak hour's passenger load is actually processed over a period of time exceeding an hour. Under these assumptions, the two existing lanes would be adequate though 2013. If the departures peak becomes more concentrated and a higher processing rate cannot be achieved, a third lane would be necessary in the near term, with a fourth lane by 2018, and a fifth lane for the 2028 High scenario.
General Public Circulation Other public circulation includes all of the corridors, vertical circulation elements, and other architectural spaces which tie the public functional elements of the terminal together. General circulation also includes areas near the concourse security exit where meeter/greeters wait for arriving passengers. There is not a well defined greeter area in the existing terminal.
The program area is based on a percentage of these functional areas: baggage claim, baggage service offices, holdrooms, concessions (excluding concession support area), and other public areas. The existing terminal has a very large amount of general circulation, amounting to 50 percent of the public functional spaces. This is due to multiple expansions which spread out the main terminal functions. For planning, 30 percent has been used to reflect more typical relationships of smaller terminals. The percentage is a first approximation and will also vary with the terminal configuration. The split between secure and non-secure (public) circulation is also a function of the terminal concept.
3.3.5 Other Areas Information Counter Most medium sized and large airports have information counters, usually staffed by volunteers. In a tourist area this can be especially useful. There is an information counter at the front door, with other information primarily provided via advertising displays. The program has continued to include space for an information counter in the future. However, it is recommended that it be located closer to the baggage claim area where it would be more obvious to arriving passengers.
Airport Administration/Operations Offices Airport administrative offices are located on the second floor of the terminal with a separate security office near the baggage claim area. This category of space also includes a multi-use meeting room, and offices in the basement used by the Airport.
Administration space is understood to be adequate for current levels of staffing, but may need to be increased in the future. A medium sized common conference room (300 square feet) has been added for Airport and airline use.
Transportation Security Administration (TSA) Offices In addition to the passenger and baggage screening equipment and adjacent search areas, the TSA occupies space for general offices, training, agent break room, and storage. This is presently split between the second floor (break room) and ground floor offices. It is understood to be adequate for current levels of activity and can accommodate some growth.

CHAPTER 3 - PASSENGER TERMINAL DEMAND CAPACITY AND FACILITY REQUIREMENTS
3-31
However, the second floor break room does not have elevator access and thus cannot accommodate some TSA personnel. TSA space has been assumed to increase after 2016 when additional SSCP lanes and EDS equipment is required.
Non-Public Circulation Non-public circulation provides access to airline operations, airport administration areas, concession support, and other areas typically not used by the traveling public. The existing terminal has non-public circulation at the high end of the range for most terminals due to the multiple expansions and access points to the basement and second floor.
The program area is based on 10 percent of non-public functional areas (compared to 16 percent at present), and includes employee restrooms on the second floor and in the basement.
Mechanical/Electrical/Utility The utilities area is equal to approximately 13 percent of the total functional areas of the existing terminal. This area does not count equipment mounted on the roof or located outside the terminal, and is at the high end of the range typical of most terminals (typically 8-12 percent). For the program a 12 percent ratio has been used.
Janitorial/Storage/Shops Janitorial, storage and shop space include the building maintenance functions which are required to be within the terminal building. In addition to typical janitorial functions, space must be made available to store any specialized maintenance equipment for the terminal, such as lifts for high ceiling areas. Additional maintenance support may also be provided by facilities outside the terminal complex.
These functions are currently equal to approximately 5.7 percent of the functional areas of the terminal, which is greater than typical. Some of this may be due to available storage areas in the basements of the multiple expansions. A more typical planning ratio of 3 percent has been used to take some of these uses into consideration.
Some terminals have loading docks for deliveries and trash removal. The existing terminal does not have a loading dock. All deliveries to concessionaires are through the 'front door’; however restaurant trash is removed via dumpsters on the apron. Due to the current flight scheduling, there are sufficient times when curb activity is low and this method is acceptable. It is not anticipated that a separate loading dock will be required in the future.
Structure/Non-net areas Non-net areas are added to the recommended facility requirements to provide a better estimate of the total gross building footprint. Although the program areas are in terms of gross space, allowances must be made for exterior walls. It is also to be expected that buildings will have areas that are unusable, or occupied by special structures.
Non-net areas currently represent approximately 4.5 percent of other gross areas. This is a high ratio, but reasonable due to multiple expansions of the existing terminal. For future planning, a 3 percent ratio has been used which assumes portions of the existing terminal will be abandoned.
CHAPTER 3 - PASSENGER TERMINAL DEMAND CAPACITY AND FACILITY REQUIREMENTS
3-32
3.4 Summary & Conclusions In general, the existing terminal has deficiencies to varying degrees in a number of functional areas. There is excess capacity in a limited number of areas.
The more significant deficiencies are:
Baggage make-up and airline operations. The current size and configuration of the make-up spaces does not allow most baggage carts to be positioned and maneuvered easily. Although it is recognized that leasing of baggage make-up and other office/operations space is an airline decision, the existing areas are generally inadequate. Baggage make-up space will also be affected by the installation of in-line baggage screening if this is the long term solution.
Checked baggage screening and ticket lobby. The location of the EDS equipment constrains the ticket lobby and limits cross-circulation. The current number of EDS units is also fewer than needed to handle peak period baggage.
Baggage Claim. The existing baggage claims are undersized if two mainline aircraft arrive during the peak. The smaller bag claim is also undersized if two regional aircraft are being served simultaneously.
The baggage off-load area is also too narrow to allow bag trains to pass. This reduces the flexibility to use both claim units fully.
Concessions. The balance between secure and non-secure concessions results in a lack of secure side capacity while the total amount of concessions is more than adequate.
In summary, the terminal has capacity to accommodate growth in many areas. The above constraints would primarily affect the ability of the airport to attract new service.