passive investors are passive monitors - duke …...governance implications of passive investing by...
TRANSCRIPT

Passive Investors are Passive Monitors
Davidson HeathUniversity of Utah
Daniele MacciocchiUniversity of Utah
Roni MichaelyUniversity of Geneva
Matthew C. RinggenbergUniversity of Utah
First Draft: March 15, 2018This Draft: November 18, 2018∗
ABSTRACT
Passively managed index funds now own more than 25% of U.S. mutual fundand ETF assets. Using a new regression discontinuity design, we study the gov-ernance implications of passive investing by directly examining the voice andexit mechanisms. We find that index funds are more likely to vote with a firm’smanagement. Moreover, while they do regularly exit positions and omit holdingsin their target benchmark, they do not use the exit mechanism to enforce goodgovernance. Our results show that passive investing shifts power from investorsto firm managers.
Keywords: governance, index investing, monitoring, passive investing, voting, exit
JEL Classification Numbers: G12, G14
∗Davidson Heath, David Eccles School of Business, University of Utah, [email protected]. Daniele Macciocchi, David Eccles School of Business, University of Utah,[email protected]. Roni Michaely, Geneva Finance Research Institute, University ofGeneva, [email protected]. Matthew C. Ringgenberg, David Eccles School of Business, University ofUtah, [email protected]. We thank Russell for providing index data. We also thankbrownbag and seminar participants at the University of Gothenburg, Lund University, University of Miami,Pennsylvania State University, Stockholm Business School, University of Toronto, University of Utah, andYork University, and we thank Lucian Bebchuk, Alex Edmans, Fabrizio Ferri, Peter Iliev, Phil Mackintosh,Will Mullins, Nathan Seegert, Steve Stubben, Wei Wei, and Alex Young for comments and suggestions.Finally, we thank Peter Iliev for sharing code and data with us. All errors are our own. c©2018.
Passive Investors are Passive Monitors
- PRELIMINARY -Please do not cite or distribute
First Draft: March 15, 2018This Draft: November 18, 2018
ABSTRACT
Passively managed index funds now own more than 25% of U.S. mutual fundand ETF assets. Using a new regression discontinuity design, we study thegovernance implications of passive investing by directly examining the voice andexit mechanisms. We find that index funds are more likely to vote with a firm’smanagement. Moreover, while they do regularly exit positions and omit holdingsin their target benchmark, they do not use the exit mechanism to enforce goodgovernance. Our results show that passive investing shifts power from investorsto firm managers.
Keywords: governance, index investing, monitoring, passive investing, voting, exit
JEL Classification Numbers: G12, G14
I. Introduction
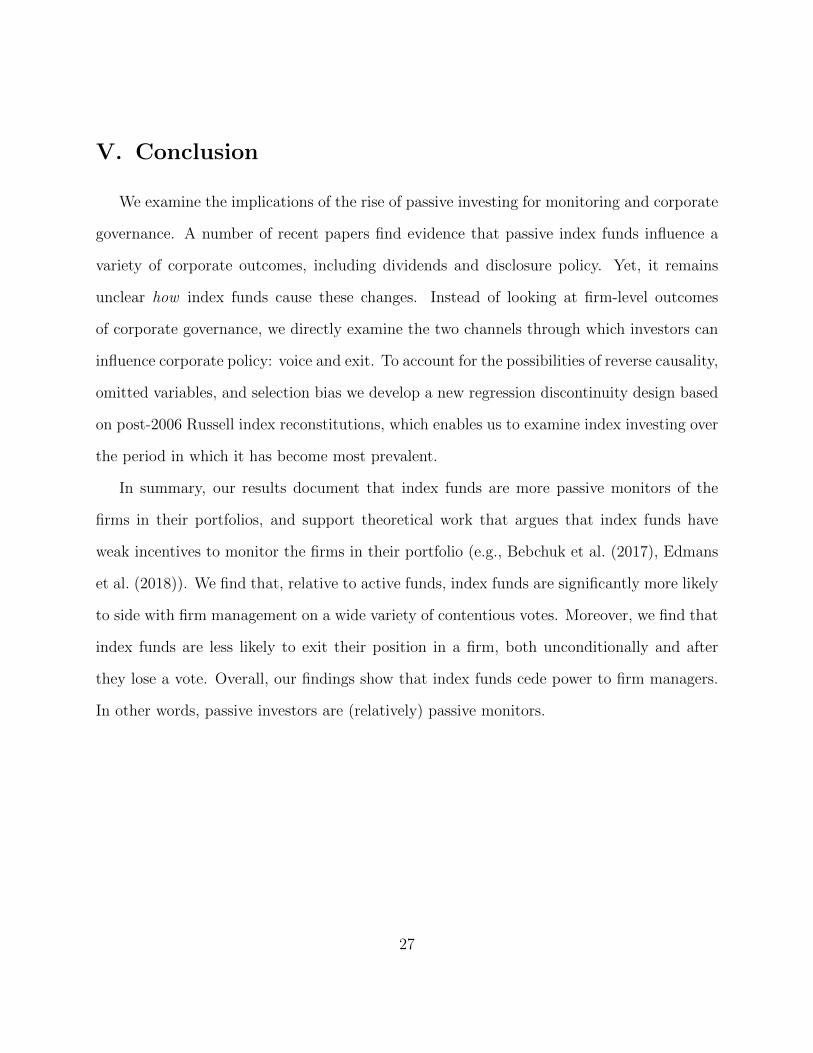
In recent years public corporations have experienced a large increase in ownership by pas-
sively managed index funds (see Figure 1) and index funds are now the largest blockholders
of many U.S. corporations (Azar, Tecu, and Schmalz (2018)). These facts raise important
questions about monitoring and corporate governance. Notably, to what extent do index
funds monitor their portfolio firms? On one hand, principal-agent theories argue that in-
vestors with large positions have stronger incentives to monitor (e.g., Berle and Means (1932),
Jensen and Meckling (1976), Admati, Pfleiderer, and Zechner (1994), Maug (1998)). On the
other hand, the economics of index investing suggests that index funds might have weak
incentives to monitor since they have many firms in their portfolio and limited resources due
to their fee structure (Bebchuk, Cohen, and Hirst (2017)).1
Surprisingly, a number of recent studies argue that index funds are “closet activists” who
improve a variety of corporate policies, from dividends and disclosure to competitive strat-
egy.2 Yet, it remains unclear how these effects occur. By contrast, Schmidt and Fahlenbrach
(2017) find that index fund ownership leads to worse mergers and acquisitions and negative
announcement returns following the appointment of directors, suggesting that index fund
ownership leads to worse corporate governance. We contribute to the debate by examining
the two main governance mechanisms predicted by theory: voice and exit.3 In other words,
rather than looking at various outcomes of corporate governance, we take a step back and
1In our data, the average index fund holds 357 stocks each year while the average active fund holds 114stocks. We discuss this point further in Section II and IV.
2Boone and White (2015), Appel, Gormley, and Keim (2016), Crane, Michenaud, and Weston (2016),Azar et al. (2018).
3In theory fund managers can affect corporate governance through two main channels: (i) voting theirshares (the voice mechanism) or (ii) selling their shares (the exit mechanism). See Hirschman (1970); Shleiferand Vishny (1986); Maug (1998); Admati and Pfleiderer (2009); Bebchuk et al. (2017); Edmans (2009). Othermethods such as activist investing or corporate engagement (i.e. meeting with a firm’s managers) implicitlyrely on the threat of voting or exit.
1
directly examine the monitoring behavior of index funds.
Conceptually, index funds might have stronger incentives to monitor their portfolio firms
and express their dissent to firm management through voice, since the need to reduce tracking
error make it more costly to use exit as a governance mechanism. On the other hand, given
their low-cost structure, index funds have limited pro-rata resources to invest in monitoring.
Moreover, indexing creates a free-rider problem since improvements to corporate governance
are shared with all the funds that follow the same index, but the costs are borne only by
the the index fund that exercises active monitoring Bebchuk et al. (2017). We find that
index funds are significantly more likely to vote with firm management. And while index
funds do exit their positions (voluntarily exiting 14% of their portfolio stocks each year on
average), they do not use exit in conjunction with voice. Specifically, unlike active funds,
index funds are not more likely to exit a position after losing a vote. Thus, consistent with
the theoretical predictions in Bebchuk et al. (2017) and Edmans, Levit, and Reilly (2018),
we find that passive investors are passive monitors.4
To cleanly compare fund monitoring behavior we develop a new regression discontinuity
design that allows us to address potential biases arising from reverse causality, omitted
variables, and selection. In contrast to most existing papers (e.g., Boone and White (2015),
Appel et al. (2016), Crane et al. (2016), Schmidt and Fahlenbrach (2017)), our approach
enables us to examine the post-2006 period. This has several advantages. First, the amount
of capital allocated to passive index funds has grown dramatically since 2006, so our approach
allows us to examine the impact of index investing when it is most prevalent. Second,
our approach avoids potential selection issues in studies that use pre-2007 Russell Index
4A priori it may be unclear if voting with management should be considered “passive”. However, froma principal-agent perspective, this behavior transfers power from investors (the principals) to the firm’smanagers (the agents). Thus, we label this behavior passive from a governance perspective.
2
reconstitutions (see Wei and Young (2017) for a discussion).5 Third, our sample period
means that our results can be viewed as out-of-sample relative to previous studies. Finally,
we also note that we are the first to examine the relation between exogenous shocks to fund
ownership and fund voting using a database of all corporate votes.
We first examine voting behavior. Using a sample of all mutual fund votes on all agenda
items at shareholder meetings of U.S. firms between 2004 and 2017, we find that index fund
managers are more likely to cede authority to firm management. On consensus votes (when
proxy advisors and management agree), passive and active fund managers vote identically
and almost always in the consensus direction. However, on contentious votes (when proxy
advisors and management disagree), index funds vote with management 53% of the time
compared to 47% for active funds.6
Next, we examine fund exit. In theory, funds can sell their shares if they disagree with
the strategy of a firm. Unconditionally, index funds are 13 percentage points less likely to
exit a position than active funds. Moreover, when we condition on a voting outcome that
went against the fund’s wishes (in other words, the fund voted in one direction, but the
majority of investors voted in the other direction), we find that index funds do not “vote
with their feet.” Active funds are significantly more likely to exit the position following a
lost vote; Index funds are not. That is, the outcome of “voice” drives exit decisions for active
funds only.7
The main difficulty in interpreting these broad comparisons is that fund holdings are
endogenous. First, firm characteristics such as size and liquidity jointly affect ownership
5We document this with extensive balance and robustness checks.6Consistent with these findings, in the prospectus for Vanguard Index Funds dated April 25, 2018
Vanguard states, “We will give substantial weight to the recommendations of the company’s board, absentguidelines or other specific facts that would support a vote against management.”
7The model in Edmans et al. (2018) suggests that voting and exit must be examined together, becauseshareholders may substitute between mechanisms.
3

and governance. Second, different firm policies attract different types of investors.8 Thus,
there is the potential for endogeneity due to both omitted variables and reverse causality.
More subtly there is also the potential for selection bias: If a fund chooses not to hold a
firm, we do not observe how that fund would have voted. Thus, if index funds tend to hold
well-run firms whose management is often right or active funds tend to hold poorly-run firms
whose management is often wrong, the differences in voting and exit might reflect differences
between firms and not funds.
To generate exogenous variation in fund holdings we develop a new research design using
Russell index reconstitutions from 2007 onward. In June of each year, Russell Investments
reconstitutes their popular Russell 1000 (large-cap) and Russell 2000 (small-cap) indexes.
In 2007 Russell implemented a new assignment regime (“banding”), which broke the yearly
discontinuity in index membership around the rank-1000 index threshold.9 We proceed from
the insight that banding replaced the yearly discontinuity in index membership with two
yearly discontinuities in index switching.
We use the yearly discontinuities from 2007 to 2015 to construct two sets of yearly
cohorts. We show that our stacked-cohort design does not suffer from sample selection,
which is a potential concern in studies of the pre-2007 regime (see Wei and Young (2017)).
When a stock switches into the Russell 2000, index fund ownership increases by 1.28% of
market capitalization on average; when a stock switches out of the Russell 2000, index fund
ownership falls by 1.21% of market capitalization. In both cases an opposite change in
ownership by active funds accompanies the change in index fund ownership.
8Grinstein and Michaely (2005) find that higher firm payouts attract institutional holdings, while Brav,Jiang, Partnoy, and Thomas (2008) and Aghion, Van Reenen, and Zingales (2013) find that active investorstarget firms with weak governance.
9We discuss the Russell Index construction procedure in detail in Section III. We use the term “banding”because as of 2007 Russell added an upper and lower band around the index threshold and stocks that arewithin the band do not switch indices.
4
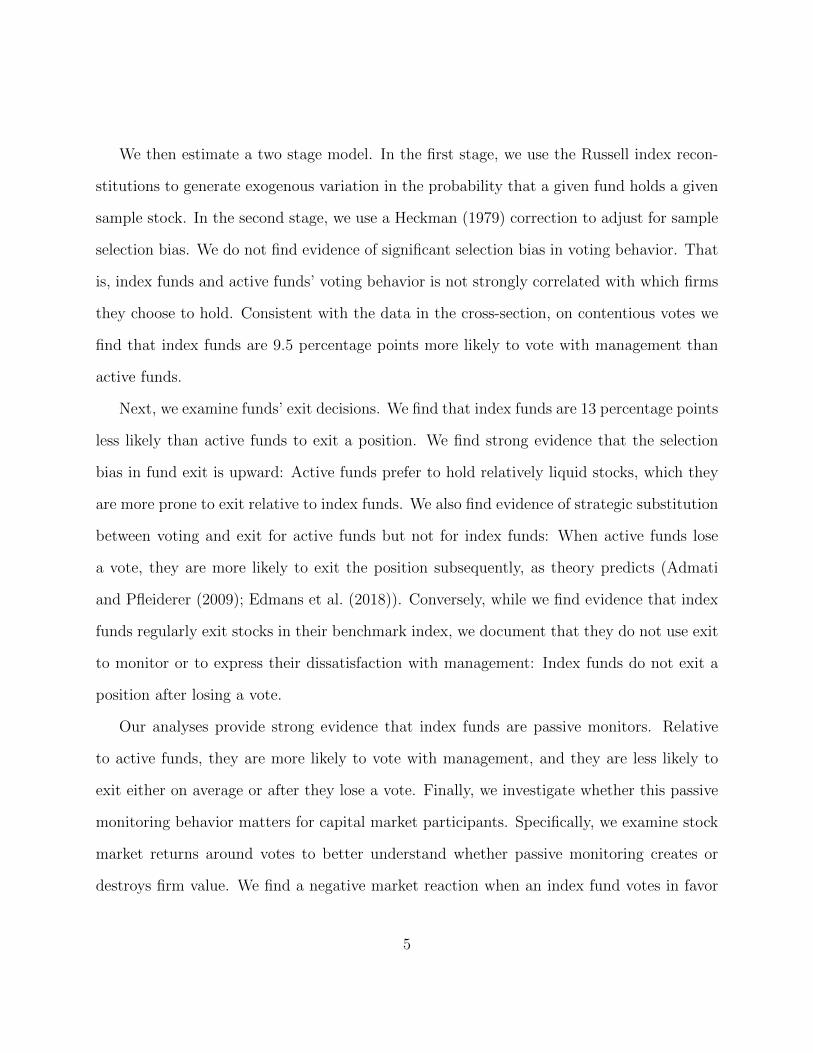
We then estimate a two stage model. In the first stage, we use the Russell index recon-
stitutions to generate exogenous variation in the probability that a given fund holds a given
sample stock. In the second stage, we use a Heckman (1979) correction to adjust for sample
selection bias. We do not find evidence of significant selection bias in voting behavior. That
is, index funds and active funds’ voting behavior is not strongly correlated with which firms
they choose to hold. Consistent with the data in the cross-section, on contentious votes we
find that index funds are 9.5 percentage points more likely to vote with management than
active funds.
Next, we examine funds’ exit decisions. We find that index funds are 13 percentage points
less likely than active funds to exit a position. We find strong evidence that the selection
bias in fund exit is upward: Active funds prefer to hold relatively liquid stocks, which they
are more prone to exit relative to index funds. We also find evidence of strategic substitution
between voting and exit for active funds but not for index funds: When active funds lose
a vote, they are more likely to exit the position subsequently, as theory predicts (Admati
and Pfleiderer (2009); Edmans et al. (2018)). Conversely, while we find evidence that index
funds regularly exit stocks in their benchmark index, we document that they do not use exit
to monitor or to express their dissatisfaction with management: Index funds do not exit a
position after losing a vote.
Our analyses provide strong evidence that index funds are passive monitors. Relative
to active funds, they are more likely to vote with management, and they are less likely to
exit either on average or after they lose a vote. Finally, we investigate whether this passive
monitoring behavior matters for capital market participants. Specifically, we examine stock
market returns around votes to better understand whether passive monitoring creates or
destroys firm value. We find a negative market reaction when an index fund votes in favor
5
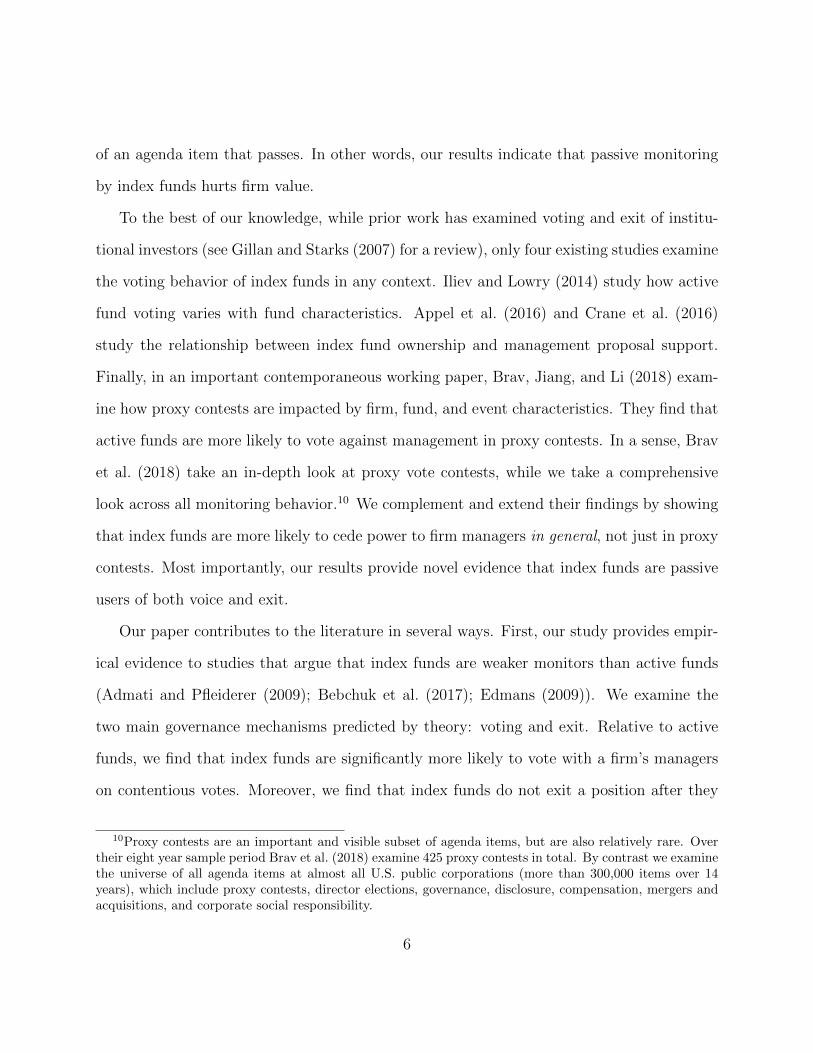
of an agenda item that passes. In other words, our results indicate that passive monitoring
by index funds hurts firm value.
To the best of our knowledge, while prior work has examined voting and exit of institu-
tional investors (see Gillan and Starks (2007) for a review), only four existing studies examine
the voting behavior of index funds in any context. Iliev and Lowry (2014) study how active
fund voting varies with fund characteristics. Appel et al. (2016) and Crane et al. (2016)
study the relationship between index fund ownership and management proposal support.
Finally, in an important contemporaneous working paper, Brav, Jiang, and Li (2018) exam-
ine how proxy contests are impacted by firm, fund, and event characteristics. They find that
active funds are more likely to vote against management in proxy contests. In a sense, Brav
et al. (2018) take an in-depth look at proxy vote contests, while we take a comprehensive
look across all monitoring behavior.10 We complement and extend their findings by showing
that index funds are more likely to cede power to firm managers in general, not just in proxy
contests. Most importantly, our results provide novel evidence that index funds are passive
users of both voice and exit.
Our paper contributes to the literature in several ways. First, our study provides empir-
ical evidence to studies that argue that index funds are weaker monitors than active funds
(Admati and Pfleiderer (2009); Bebchuk et al. (2017); Edmans (2009)). We examine the
two main governance mechanisms predicted by theory: voting and exit. Relative to active
funds, we find that index funds are significantly more likely to vote with a firm’s managers
on contentious votes. Moreover, we find that index funds do not exit a position after they
10Proxy contests are an important and visible subset of agenda items, but are also relatively rare. Overtheir eight year sample period Brav et al. (2018) examine 425 proxy contests in total. By contrast we examinethe universe of all agenda items at almost all U.S. public corporations (more than 300,000 items over 14years), which include proxy contests, director elections, governance, disclosure, compensation, mergers andacquisitions, and corporate social responsibility.
6

lose a corporate vote. Second, we develop a new Russell methodology which allows us to
present the first causal evidence on the impact of passive investing using post-2006 data.
Third, our paper adds to the broad literature examining the impact of institutional investors
on corporate behavior.11 While a number of papers have shown that corporate outcomes
appear to be affected by index fund ownership,12 it is unclear how index funds actually cause
these effects. Our study shows that index funds do not influence firm-level outcomes through
the two main monitoring channels: voice and exit. Overall, we provide strong evidence that
passive investors are (relatively) passive monitors.
The remainder of the paper proceeds as follows: Section II describes the data used in
this study and presents key summary statistics regarding the monitoring behavior of funds.
Section III provides a detailed overview of our identification strategy. Section IV presents
our main results. Section V concludes.
II. Data and Summary Statistics
To examine the governance implications of passive index investing, we combine data from
the Center for Research in Security Prices (CRSP), Compustat, Institutional Shareholder
Services (ISS), and the Frank Russell Company (Russell), as discussed in detail below.
A. Data
We use Russell Index membership lists provided directly from Russell and we match this
data to firm and stock-level characteristics from CRSP and Compustat.13 To measure fund
11See Edmans (2014) for a recent review of this literature.12Boone and White (2015), Appel et al. (2016), Crane et al. (2016), Azar et al. (2018).13We do not impose filters on this data, because our identification strategy requires all firms that were in
the Russell 1000 or Russell 2000 in cohort year t and year t− 1.
7
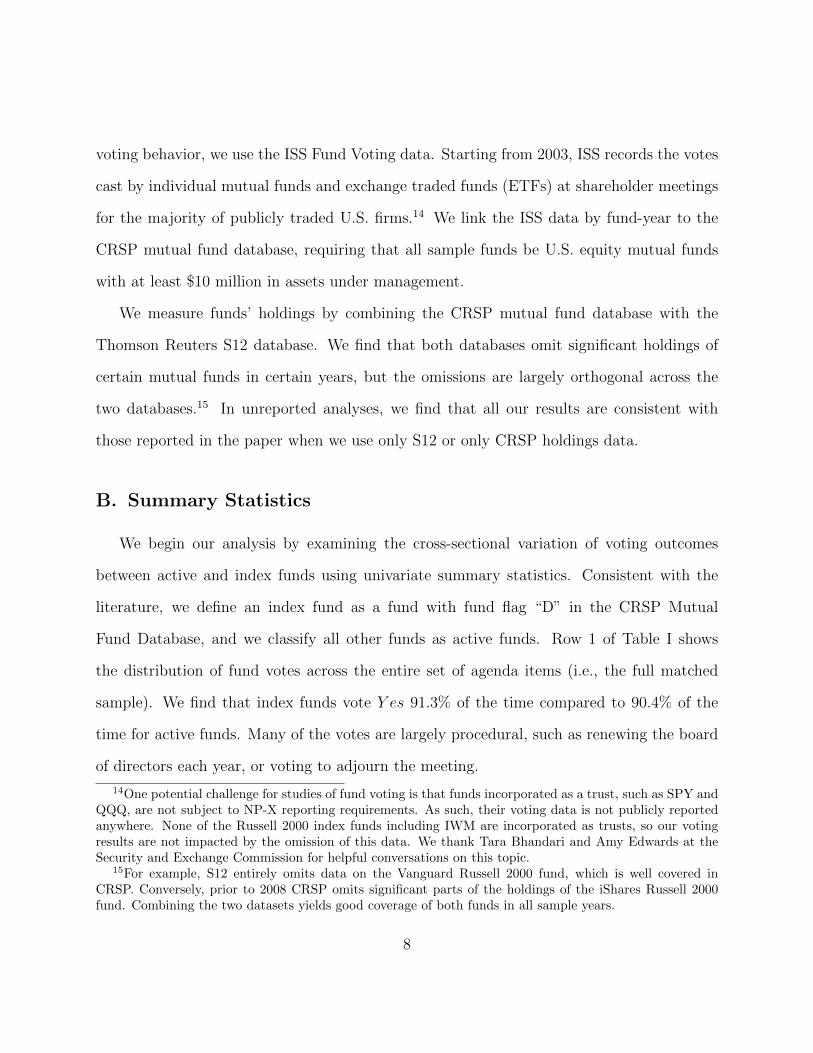
voting behavior, we use the ISS Fund Voting data. Starting from 2003, ISS records the votes
cast by individual mutual funds and exchange traded funds (ETFs) at shareholder meetings
for the majority of publicly traded U.S. firms.14 We link the ISS data by fund-year to the
CRSP mutual fund database, requiring that all sample funds be U.S. equity mutual funds
with at least $10 million in assets under management.
We measure funds’ holdings by combining the CRSP mutual fund database with the
Thomson Reuters S12 database. We find that both databases omit significant holdings of
certain mutual funds in certain years, but the omissions are largely orthogonal across the
two databases.15 In unreported analyses, we find that all our results are consistent with
those reported in the paper when we use only S12 or only CRSP holdings data.
B. Summary Statistics
We begin our analysis by examining the cross-sectional variation of voting outcomes
between active and index funds using univariate summary statistics. Consistent with the
literature, we define an index fund as a fund with fund flag “D” in the CRSP Mutual
Fund Database, and we classify all other funds as active funds. Row 1 of Table I shows
the distribution of fund votes across the entire set of agenda items (i.e., the full matched
sample). We find that index funds vote Y es 91.3% of the time compared to 90.4% of the
time for active funds. Many of the votes are largely procedural, such as renewing the board
of directors each year, or voting to adjourn the meeting.
14One potential challenge for studies of fund voting is that funds incorporated as a trust, such as SPY andQQQ, are not subject to NP-X reporting requirements. As such, their voting data is not publicly reportedanywhere. None of the Russell 2000 index funds including IWM are incorporated as trusts, so our votingresults are not impacted by the omission of this data. We thank Tara Bhandari and Amy Edwards at theSecurity and Exchange Commission for helpful conversations on this topic.
15For example, S12 entirely omits data on the Vanguard Russell 2000 fund, which is well covered inCRSP. Conversely, prior to 2008 CRSP omits significant parts of the holdings of the iShares Russell 2000fund. Combining the two datasets yields good coverage of both funds in all sample years.
8

Accordingly, in the next four rows of Table I we analyze the distribution of fund votes
broken into two categories: “consensus votes”, i.e. items for which management and ISS
made the same recommendation (rows 2-3), and “contentious votes”, i.e. items for which
management and ISS made opposing recommendations (rows 4-5). For items that manage-
ment and ISS both approve, index funds vote Y es 96.8% of the time while active funds vote
Y es 97.1% of the time. Similarly, for votes that management and ISS both oppose, index
funds vote Y es 4.5% of the time while active funds vote Y es 5.3% of the time. The rates
at which active and index funds abstain or fail to record a vote are also similar. Thus, on
consensus votes, index funds and active funds vote identically.
On contentious items the results are very different. For items which management approves
but ISS opposes, index funds vote Y es 51.6% of the time compared to 44.6% for active funds.
Similarly, for items which management opposes but ISS approves, index funds vote Y es 43.2%
of the time compared to 48.1% for active funds. Thus, in both cases index funds are more
likely to side with management. Interestingly, index funds are also less likely than active
funds to abstain on contentious items: For items approved by management but opposed by
ISS, index funds abstain 26.7% of the time compared to 29.5% for active funds. Maug and
Rydqvist (2001) notes that if voting is costless, then nobody should ever abstain or fail to
vote. Hence, the significant number of abstentions in our analysis implies that voting is
costly. As some firms require a majority of votes cast Y es to approve a measure, abstentions
can have the same effect as voting against a proposal. Thus, finding that active funds are
more likely than index funds to abstain on contentious items again suggests that index funds
are more likely to side with management. Across all contentious votes in the sample, index
funds voted with management 52.7% of the time while active funds voted with management
47.4% of the time.
9
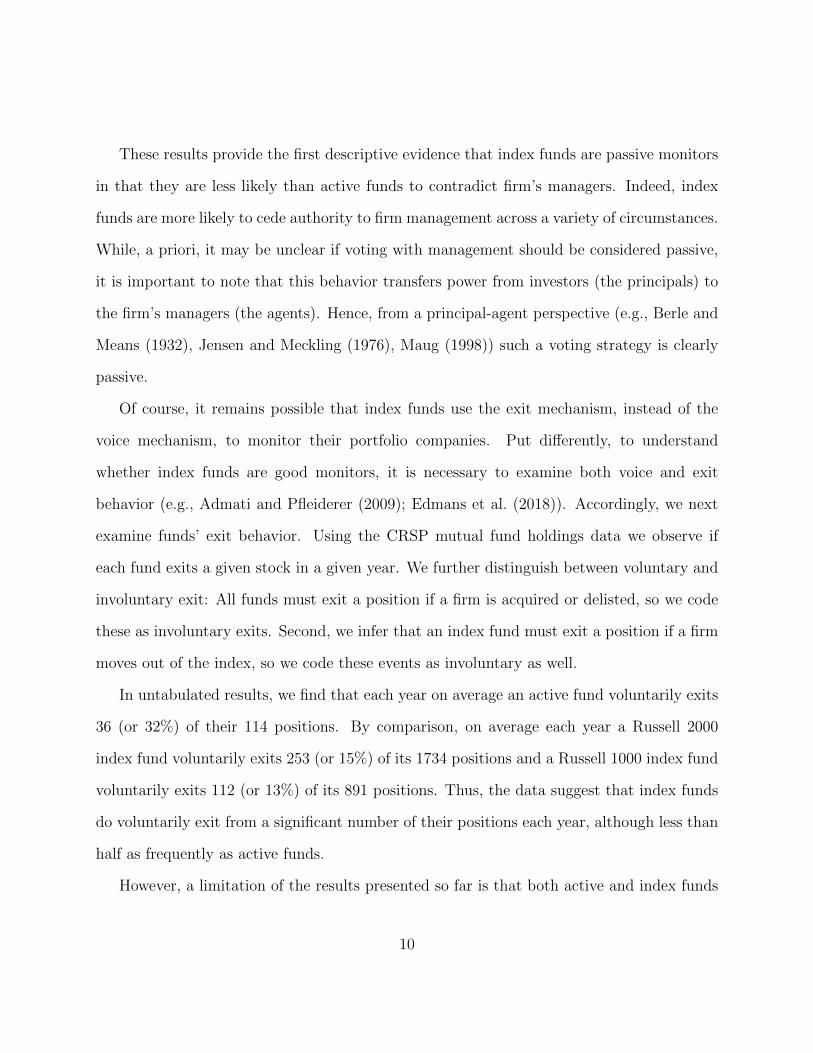
These results provide the first descriptive evidence that index funds are passive monitors
in that they are less likely than active funds to contradict firm’s managers. Indeed, index
funds are more likely to cede authority to firm management across a variety of circumstances.
While, a priori, it may be unclear if voting with management should be considered passive,
it is important to note that this behavior transfers power from investors (the principals) to
the firm’s managers (the agents). Hence, from a principal-agent perspective (e.g., Berle and
Means (1932), Jensen and Meckling (1976), Maug (1998)) such a voting strategy is clearly
passive.
Of course, it remains possible that index funds use the exit mechanism, instead of the
voice mechanism, to monitor their portfolio companies. Put differently, to understand
whether index funds are good monitors, it is necessary to examine both voice and exit
behavior (e.g., Admati and Pfleiderer (2009); Edmans et al. (2018)). Accordingly, we next
examine funds’ exit behavior. Using the CRSP mutual fund holdings data we observe if
each fund exits a given stock in a given year. We further distinguish between voluntary and
involuntary exit: All funds must exit a position if a firm is acquired or delisted, so we code
these as involuntary exits. Second, we infer that an index fund must exit a position if a firm
moves out of the index, so we code these events as involuntary as well.
In untabulated results, we find that each year on average an active fund voluntarily exits
36 (or 32%) of their 114 positions. By comparison, on average each year a Russell 2000
index fund voluntarily exits 253 (or 15%) of its 1734 positions and a Russell 1000 index fund
voluntarily exits 112 (or 13%) of its 891 positions. Thus, the data suggest that index funds
do voluntarily exit from a significant number of their positions each year, although less than
half as frequently as active funds.
However, a limitation of the results presented so far is that both active and index funds
10
choose which stocks they hold. Hence, there is the potential for both an endogeneity bias
– if fund holdings are correlated with firm governance – and a selection bias – if a fund
chooses not to hold a firm then we do not observe how the fund would have voted. To
address endogeneity and selection bias, in the next section we develop a new research design
that uses post-2006 Russell index reconstitutions. We show that this empirical approach
produces exogenous variation in fund holdings, and we use this variation to examine fund
voting and exit behavior.
III. Research Design
A. Background on Russell Indexes
In June of each year Russell Investments reconstitutes their popular Russell 1000 (large-
capitalization) and Russell 2000 (small-capitalization) indexes. To determine index assign-
ment, Russell ranks all qualifying U.S. common stocks by their market capitalization as of
the last business day in May. Before June 2007, index assignment followed a simple threshold
rule: stocks ranked from 1-1000 were assigned to the Russell 1000, while stocks ranked from
1001-3000 were assigned to the Russell 2000.
Starting in June 2007, Russell implemented a new assignment regime (“banding”). After
sorting stocks by their market capitalization, Russell computes an upper and lower band
around the Russell 1000 cutoff; the band is calculated as +/- 2.5% of the total market
capitalization of the Russell 3000. Stocks within the bands do not switch indexes. That is,
if a stock that ranks above the threshold but below the upper band was in the Russell 2000
last year, it will stay in the Russell 2000 the next year and similarly, if a stock that ranked
below the rank-1000 threshold but above the lower band was in the Russell 1000 last year,
11

it will stay in the Russell 1000 the next year.
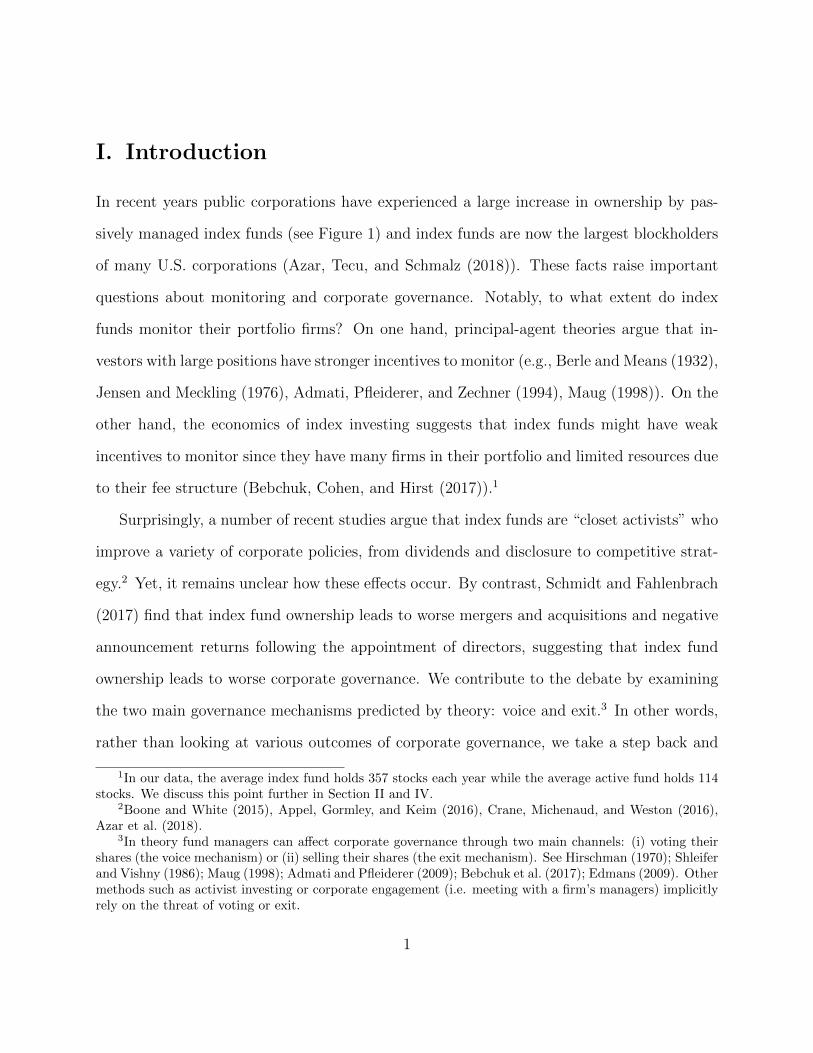
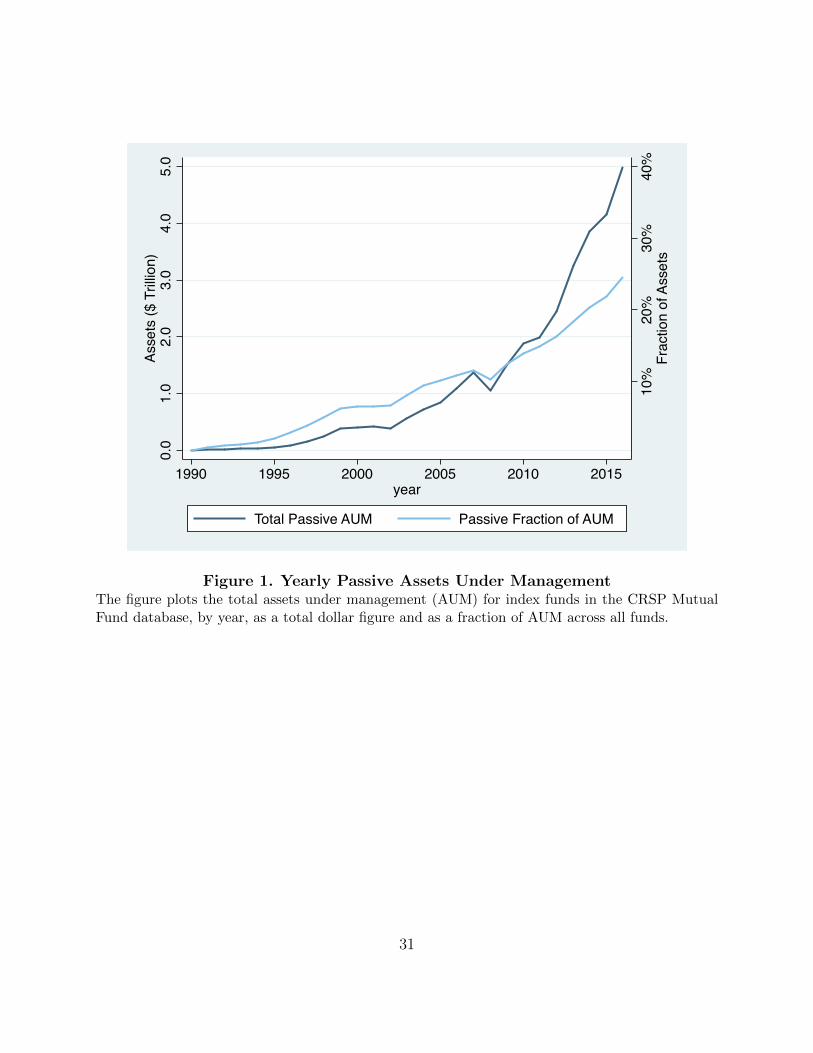
Figure 2 Panel A plots index assignments for 2006, the last year before banding. The
solid vertical line denotes the main index threshold, between the stocks ranked 1000 and
1001 according to their May market capitalization.16 In 2006 we see that there was a sharp
discontinuity in index assignment at the threshold, which lends itself to a single regression
discontinuity design (RDD).
Figure 2 Panel B plots index assignments in 2007, the first year of the banding regime,
which eliminated the discontinuity near the threshold. Hence, an RDD around the threshold
is no longer feasible. However, we see that there are two new discontinuities at the upper
and lower bands (dashed vertical lines). These discontinuities correspond to whether nearby
stocks switched indexes or stayed in their previous index (i.e., from the Russell 2000 into
the Russell 1000 for stocks near the upper band, and from the Russell 1000 into the Russell
2000 for stocks near the lower band). For example, consider a stock that was a member
of the Russell 2000 as of May 2007 and was nearby the upper band when the indexes were
reconstituted. This stock’s new index assignment dependeds on whether it ranked just above
the upper band, in which case it would switch into the Russell 1000, or just below the upper
band, in which case it would stay in the Russell 2000. In sum, the stock’s index assignment
in June 2007 depends on four parameters:
1. The stock’s overall ranking in the Russell 3000, which is sensitive to small fluctuations
in the market capitalization of both the focal stock and all the neighboring stocks in
16Each year Russell reports their rankings based on their own proprietary calculations of market adjustedcapitalization. However, Russell does not disclose its initial rankings based on May unadjusted market cap-italization, hence we do not observe the unadjusted rankings. We thus compute proxy market capitalizationand rankings at the end of May each year using CRSP and Compustat data following Chang, Hong, andLiskovich (2015). Our results are robust and very similar when we use alternative methods of imputing theRussell rankings based on their adjusted market capitalization. Our predicted Russell membership recov-ers the actual Russell Index membership for 99.7% of the sample firm-years. Details are in the InternetAppendix.
12
the ranking;
2. The market capitalization of the rank-1000 stock, which determines the index thresh-
old;
3. The total market capitalization of the Russell 3000 as calculated by Russell, which
determines the width of the bands (+/- 2.5%);
4. The cumulative market capitalization as calculated by Russell of all the stocks ranked
above the focal stock, which determines where the stock sits relative to the bands.
All four parameters are difficult to predict ex ante – indeed, Russell does not make their
unadjusted market capitalization numbers or rankings available ex post. Furthermore, all
four parameters are difficult or impossible to manipulate. This line of reasoning suggests
that within a sufficiently small window of each band in each year, whether a stock ranks
above or below the band – and therefore switches or stays – is as good as randomly assigned.
We proceed from the insight that the banding regime replaced the discontinuity in index
assignment with two separate discontinuities in index switching. For each June index re-
constitution from 2007 to 2015, we select a cohort which consists of two sets of treated and
control stocks. Specifically, we select all stocks that were potential switchers in windows of
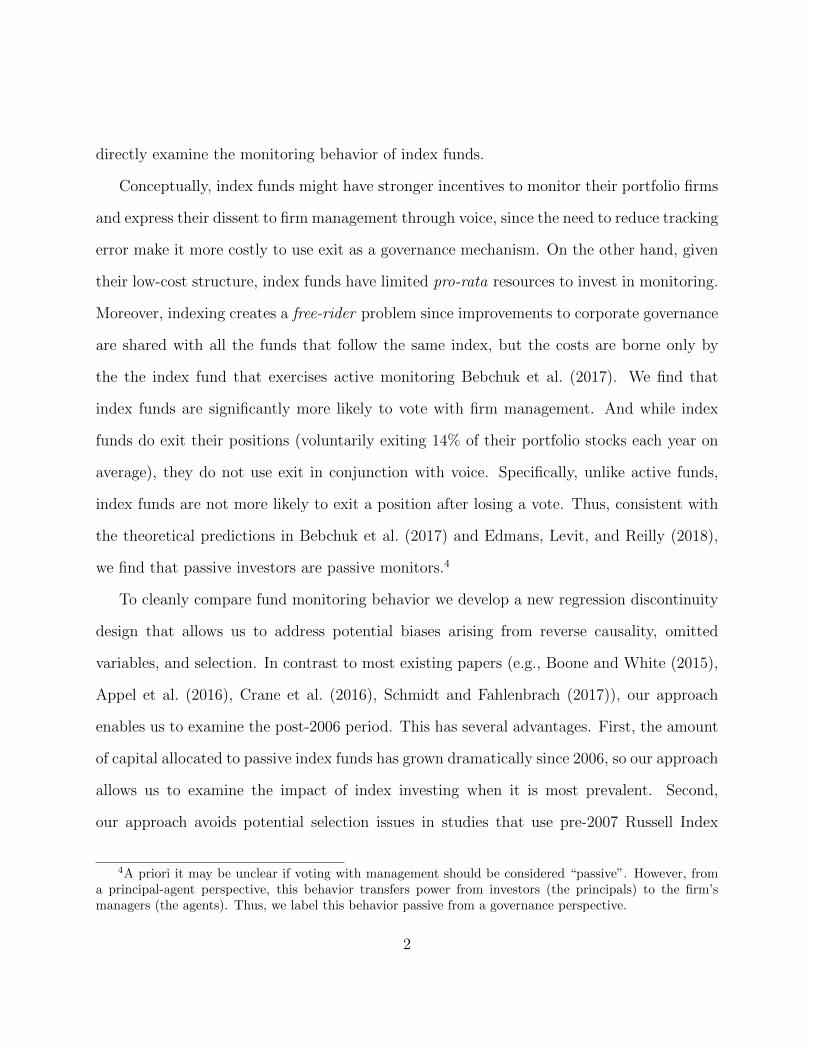
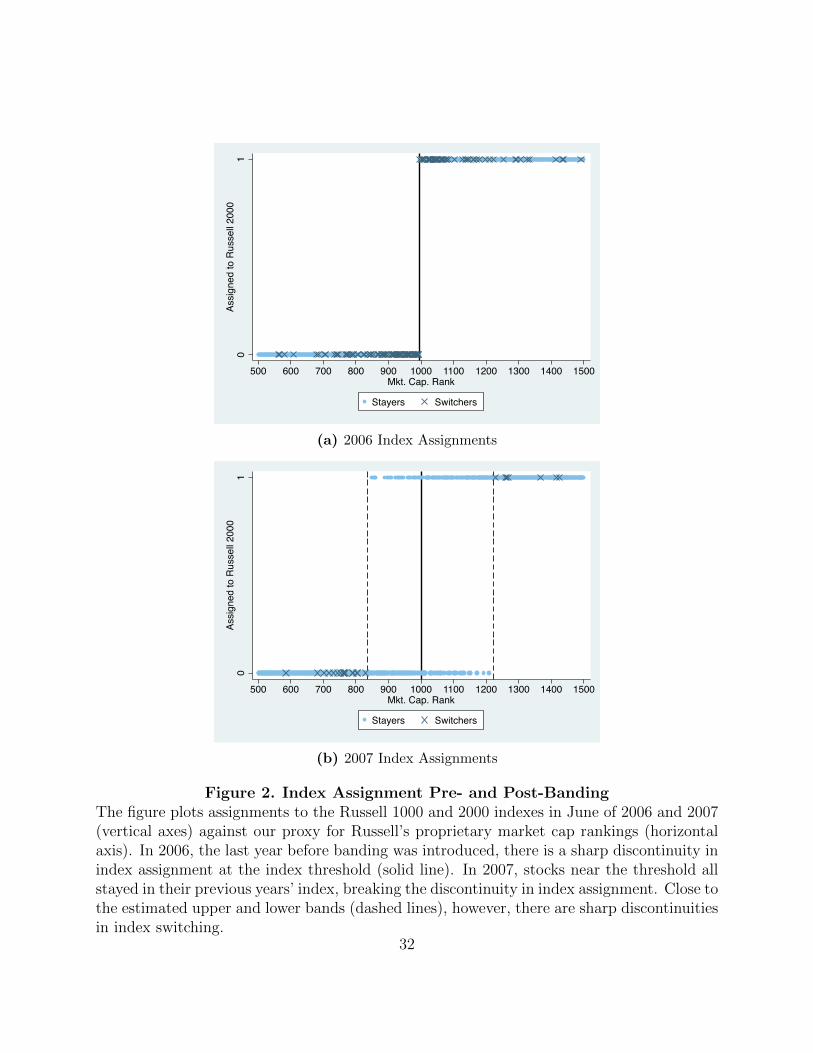
100 ranks around the upper and lower bands. Figure 3 plots the treated and control stocks
in the 2007 cohort by market capitalization ranking. We examine those stocks for three years
pre- and post- index assignment. Importantly, in order to select potential switchers, we only
condition on (i) lagged index membership (i.e., whether the stock was in the Russell 1000 or
2000 last year), and (ii) proximity to the bands.
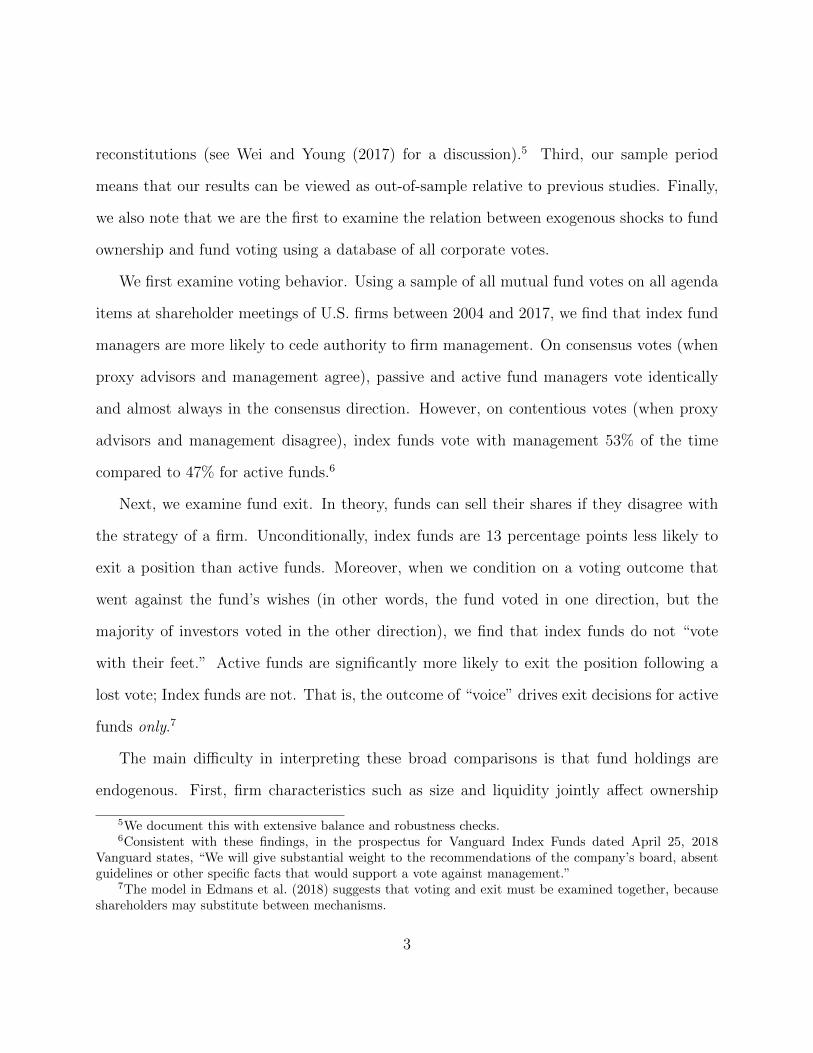
To further confirm that firms close to the bands are similar (besides the index assignment),
in Figure 4 we show the market capitalization of our sample stocks relative to the universe of
13
all Russell 3000 stocks. We observe that both our upper and lower band samples represent
narrow slices of mid-cap stocks whose market capitalization was smooth across the bands.
Finally, in Table II we report summary statistics for firm characteristics in our Russell
cohort sample. The average firm has a market capitalization of 2.4 billion dollars, a total
ownership by mutual funds of 24.44% of the firm’s market cap, and an entrenchment (“E”)-
index of 3.2. The average ownership by Russell 2000 (1000) funds is 1.00% (0.10%) of market
capitalization and the average ownership by active funds is 23.33% of market capitalization.
B. Effects of Index Switching on Fund Ownership
Next, we examine the the effect of Russell index assignment on mutual fund ownership.
In Column 1 of Table III we report results for the effect of index assignment on ownership
by Russell 2000 index funds. We find that ownership by Russell 2000 index funds rises by an
average 1.52% of market capitalization for stocks that switched into the Russell 2000 relative
to nearby stocks that stayed in the Russell 1000. At the same time, we find that ownership
falls by 1.43% of market capitalization for stocks that switched into the Russell 1000 relative
to similar stocks that stayed in the Russell 2000. Note that these two coefficient estimates
are strongly consistent with each other, even though they are estimated from two entirely
disjoint sets of stocks: (i) potential switchers around the lower band and (ii) potential
switchers around the upper band.
In Column 2 of Table III we report the effect of index assignment on ownership by
Russell 1000 index funds. As expected, we find the opposite effect (relative to the change in
ownership by Russell 2000 funds shown in Column 1). However, the coefficient is smaller for
Russell 1000 fund holdings, falling by 0.20% of market capitalization in the first treatment
group and rising by 0.19% of market capitalization in the second treatment group. This is
14
as expected, because both Russell indexes are value-weighted and the weights of stocks near
the bottom of the 1000 are orders of magnitude lower than the weights of stocks near the
top of the Russell 2000.
As a placebo test, in Column 3 of Table III we examine the effect of Russell index
assignment on ownership by index funds that replicate the S&P500 index. (This is by
far the largest category of index funds both numerically and by assets under management).
Russell index assignments should be irrelevant to the holdings of these funds. Indeed, though
the assets under management of the S&P 500 index funds are much larger than those of the
Russell index funds, the changes in S&P 500 index fund holdings are tiny, on the order of
0.04% of the firm’s market capitalization.
In Table III Column 4 we examine the effect of index assignment on ownership by active
funds. The changes in ownership by active funds are opposite in sign and similar in size
to those for the Russell 2000 funds (i.e., Column 1), which suggests that on average, active
mutual funds sell to the index funds that enter a stock and buy from the index funds that
exit. As a result, we find that total holdings by all mutual funds (see Table III Column 5)
does not change significantly for treated stocks near either of the Russell bands.
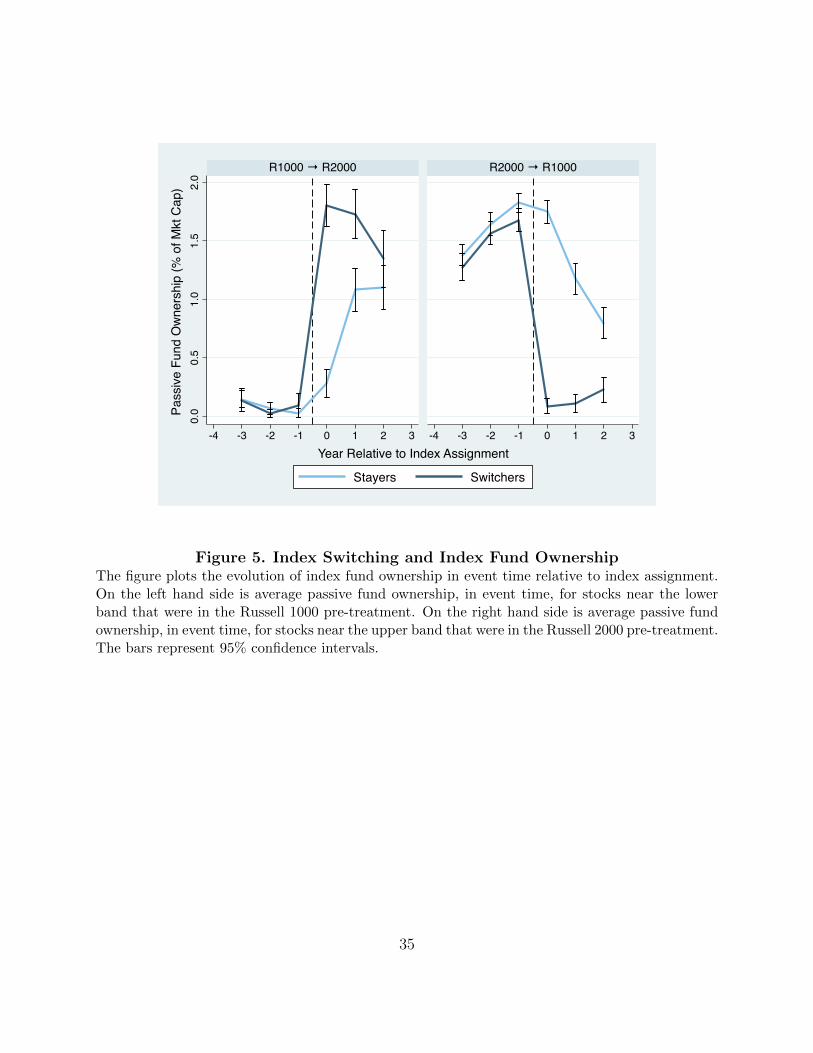
Figure 5 plots index fund ownership across our four groups (switchers vs stayers near the
upper band; switchers vs stayers near the lower band) in event time, that is, the observa-
tion year minus the cohort year. The results are strikingly symmetric. They suggest that,
first, switchers and stayers in both groups had parallel pre-treatment trends in index fund
ownership, and second, switching into the Russell 2000 led to higher passive ownership and
vice versa. To summarize, index switching around both yearly Russell bands is followed by
sharply timed and symmetric shifts in fund ownership.
15

B.1. Balance Tests
It is critical that our research design isolates exogenous variation in fund ownership such
that our sample firms are similar ex ante around the upper and lower bands and differ only
by their index switching status. For example, if the firms just above the upper band were
systematically worse-governed than the firms just below, our results would be biased toward
finding a spurious association between index switching (and index fund investment) and good
governance. We thus check that treated and control firms on either side of the bands are
indistinguishable ex ante on measures of ownership and governance. In Panel A of Table IV
we compare pre-treatment means of fund ownership for switchers versus stayers. Similar to
Table III, we measure Russell 2000 fund ownership (Column 1), Russell 1000 fund ownership
(Column 2), S&P 500 fund ownership (Column 3), active fund ownership (Column 4) and
total mutual fund ownership (Column 5). In each case, we measure the outcome variable
for each firm in the last pre-treatment year. There is no significant difference between firms
that ultimately switched compared to those that stayed, in any of the categories of fund
ownership.
Similarly, Table IV Panel B we compare measures of firm governance in the last pre-
treatment year. Specifically, we examine the entrenchment index of Bebchuk, Cohen, and
Ferrell (2008) (E-Index ) as well as its six individual components. Again, there is no signifi-
cant difference in any of the governance measures between treated and control firms ex ante.
In sum, in Table IV we find no evidence of differences in the pre-treatment levels of (A) fund
ownership or (B) firm governance between treated and control firms.
Complementary with the results in Table IV, Figure 6 presents formal regression disconti-
nuity (RD) plots for fund ownership and firm governance, measured in the last pretreatment
year for each firm, with flexible local polynomials fitted on either side of each band. Again,
16

we observe no significant difference at the treatment cutoff (the upper or lower band re-
spectively). Furthermore, in each case, the treated and control firms have similar overall
pretreatment levels of fund ownership and governance. Hence, we conclude that our treated
and control firms around each band are well-balanced and comparable ex ante, and that our
Russell research design isolates exogenous variation in fund holdings.
IV. Results
In this section, we examine the governance implications of index investing. We start by
examining voting behavior and then we examine exit decisions. Our voting and exit results
suggest that index funds are passive monitors. Accordingly, we then examine whether passive
monitoring behavior has real implications for firm value. We find that passive monitoring
by passive funds has a negative effect on firm value.
A. Voting
We first examine funds’ voting behavior. In Table V Columns 1 and 2 we estimate the
difference in fund voting on contentious votes across the full universe of sample firms. The
dependent variable VotedWithMgmt is an indicator equal to 1 if a fund voted in agreement
with management on a given item and 0 if it voted with ISS.17 Our main independent variable
IndexFund is an indicator equal to 1 if a fund is an index fund and 0 if a fund is an active
fund, as defined in Section II B. The estimates include firm fixed effects, which remove non-
time-varying differences across sample firms in management quality or governance, and year
fixed effects which remove aggregate trends.
17Voting in agreement is defined as voting Yes on a recommendation of Yes, and No or Abstain on arecommendation of No or Withhold.
17

Table V Column 1 says that compared to active funds, index funds are 9.5% more likely
to side with management over ISS. This is a larger difference in fund voting than in the
cross-section. The larger difference comes from adding firm fixed effects, which removes
non-time-varying variation in voting outcomes between firms. Table V Column 2 adds as
an explanatory variable the fund’s yearly expense ratio. We estimate the coefficient on the
expense ratio separately for index and active funds because of the different incentives that
the two types of funds face. Index funds with higher expense ratios are significantly less
likely to side with management. The coefficient of -0.186 means that an index fund with
an expense ratio 25 basis points higher is 4.7% less likely to side with management, about
half of the difference between index and active funds. This observation is consistent with
the predictions of Bebchuk et al. (2017), if index funds that follow a strategy with more
monitoring incur more expenses. By contrast, active funds’ voting varies less with the fund’s
expense ratio, suggesting that other considerations may be more important for their voting,
their expenses, or both.
In Table V Columns 3-6, we compare voting between active and index funds on con-
tentious votes for firms and years in the Russell cohort sample. Columns 3 and 4 repeat the
baseline regressions of Columns 1 and 2; the results are very similar. Next, we present esti-
mates of voting behavior that correct for potential selection bias in fund holdings (Heckman,
18
1979). We estimate the following equations:
Observedijt = Probit(τIndexFundi
+ ξ1R1000→ R2000j × Postt × IndexFundi
+ ξ2R2000→ R1000j × Postt × IndexFundi
+ µ1R1000→ R2000j × Postt + µ2R2000→ R1000j × Postt
+ φj + χt + νijt)
(1)
Yijt = βIndexFundi + αInverseMillsRatioijt
+ δ1R1000→ R2000j × Postt + δ2R2000→ R1000j × Postt
+ λj + κt + εijt
(2)
In Equation (1) Observed is an indicator variable equal to 1 if a fund j holds a stock
i on date t, and zero otherwise; IndexFund is an indicator variable equal to 1 if the fund
is an index fund, and 0 otherwise; R1000 → R2000 is an indicator variable equal to 1 if a
stock switches from the Russell 1000 to the Russell 2000, whereas R2000 → R1000 is an
indicator variable equal to 1 if a stock switches from the Russell 2000 to the Russell 1000.
Postt is an indicator variable equal to 1 if the stock-year is post Russell assignment, and 0
if it is pre-Russell assignment. In Equation (2) the outcome variables are VotedWithMgmt
and Abstained ; InverseMillsRatio is the Heckman correction term from Equation (1). φj, λj
denotes firm fixed effects, and χt, κt denotes year fixed effects.
The results for the first stage (Equation (1)) are reported in Appendix Table A1. The
19
sample for this estimate is the panel of all firm-years in the Russell sample, interacted with
all mutual funds that held at least one firm in the sample. The excluded terms, which
generate the identifying variation in observed status (Observed), are the triple interaction
terms for index switching at the firm level interacted with each fund’s index- versus active-
fund status. This term captures the variation in ownership by index versus active funds due
to index switching, which we have argued is exogenous at the firm level. Consistent with the
results in Table III, switching from the Russell 1000 to the 2000 means a higher likelihood
of being held by an index fund and a lower likelihood of being held by an active fund, and
vice versa.
In Table V Columns 5 and 6 we report the second-stage estimates (2) in which we add
the Heckman correction term (InverseMillsRatio). We find that index funds were 12.1%
more likely than active funds to side with management over ISS, and index funds with lower
expense ratios were significantly more likely to side with management. The coefficient on
the inverse Mills ratio is small and does not significantly change the other coefficients in
Column 5 or 6, which suggests there is limited selection bias in funds’ voting behavior. In
other words, when funds are exogenously induced to hold a firm, they vote on that firm’s
agenda items in a similar fashion as firms that they choose to hold.
In summary, on contentious agenda items, index funds are less likely than active funds to
abstain from voting and more likely to side with management. Moreover, index funds with
lower expense ratios are more likely to side with management. These results are consistent
with the prediction that index funds are passive monitors of the firms in their portfolios.
20
A.1. Types of Agenda Item
Next, we examine how index funds’ voting differs within the set of contentious items. We
first compare voting on contentious items in four distinct subcategories:
1. Board of Directors: Items whose description includes “director” or “board”
2. Compensation: Items whose description includes “
3. Disclosure: Items whose description includes “disclosure” or “reporting”
4. Entrenchment: Items whose description includes “staggered”, “bylaw”, “poison pill”
or “parachute”
The item descriptions are entered by ISS, not the firms themselves, so misreporting is
unlikely.
Table VI Panel A shows the results. Column 1 shows that index funds were 9.3% more
likely to side with management on contentious items relating to the board of directors. A
subset of the items in Column 1 relate to formal proxy battles between the incumbent board
and an activist shareholder. That is, our results in Column 1 are consistent with those
of Brav et al. (2018), who focus on fund voting in proxy battles. The results are similar
for items related to compensation, disclosure and managerial entrenchment (columns 2-4).
Thus, index funds consistently side with management across a wide variety of item types,
suggesting that the rise of passive investing may have consequences for (at least) board
structure, compensation, disclosure, and managerial entrenchment.
Second, we split contentious items between items proposed by shareholders and items
proposed by management. Naturally, this split is perfectly correlated with management’s
and ISS’s recommendations: all contentious shareholder proposals were approved by ISS and
21
opposed by management, and vice versa. Table VI Panel B shows the results. We see that
the pattern that index funds were more likely to side with management over ISS holds true
regardless of who proposed the item. On contentious shareholder proposals, index funds
were 7.6% less likely to vote Yes while on contentious management proposals, index funds
were 10.5% more likely to vote Yes. The results are not perfectly symmetric. On contentious
management proposals, index funds were 5.9% less likely than active funds to vote No or
abstain, while on contentious shareholder proposals, index funds were 7.8% more likely to
vote No, but not more likely to abstain. The asymmetry might relate to the relationship
aspect of fund voting: abstaining may represent a “soft no” which does not support, but
does not explicitly contradict, an unpopular management proposal.
B. Exit
Next we examine the second channel by which shareholders monitor and exert influence:
exit. According to Edmans (2009) and others, in addition to voting, shareholders can influ-
ence a firm’s actions by threatening to sell the stock or selling the stock when management
disobeys.
In Table VII we examine fund exit behavior. The dependent variable for this analysis
is VoluntaryExit, which is equal to 1 if a given fund exits a stock voluntarily as defined
in Section B, and 0 otherwise, while the independent variables of interest are IndexFund,
an indicator equal to 1 if a fund is an index fund and 0 if a fund is an active fund, and
ActiveFund, an indicator equal to 1 if a fund is an active fund and 0 if a fund is an index
fund as defined in Section II B. As in our prior analysis, we include firm and year fixed
effects.
In Column 1 we find that across the full cross-section index funds are 12.8% less likely
22

to voluntarily exit a position relative to active funds. These findings are in line with the
summary statistics in Section B. Hence, our analyses indicate that index funds may use the
exit channel as a monitoring mechanism, but they exit significantly less than active funds.
To further investigate the use of the exit channel by index funds, in Column 2 we examine
the fund’s exit decision conditional on the outcome of a past vote. We find that, if over the
previous year (during which a fund held the position in a firm) the fund “lost” a vote (that
is, the fund voted Yes on an item that failed or No on an item that passed), an active fund
is 1.5% more likely to exit that position the following year. On the other hand, an index
fund that loses a vote is 0.3% less likely to exit and the latter coefficient is not statistically
significant. These results further support the notion that passive funds make less use of the
exit channel compared to active funds. Importantly, that index funds are less likely to use
the exit channel relative to active funds supports the notion that voting in agreement with
management is passive from a principal-agent perspective.
We next examine fund exit behavior using our Russell research design, which allows us to
address the selection bias concerns previously mentioned. Specifically, in Columns 3 and 4 we
estimate the probability of exit within our Russell cohort sample, and in Columns 5 and 6 we
add the Heckman correction term (InverseMillsRatio). Unlike the voting regressions in Table
V, the coefficient on the InverseMillsRatio is large and statistically significant, which suggests
that there is selection bias in comparisons of fund exit behavior. After the correction, index
funds are even less likely to exit a position than active funds (23.7% compared to 14.9% in
the uncorrected OLS estimate). Thus, the OLS estimate understates the difference between
index and active funds in their exit strategy. These findings suggest that active funds prefer
to hold stocks that they are relatively more likely to exit (i.e., active funds have a stronger
preference for liquid stocks). In light of the theoretical arguments and our empirical findings
23

we conclude that via the exit channel, index funds are passive monitors of the firms in their
portfolios.
B.1. Voting and Exit as Strategic Substitutes
In Columns 2, 4 and 6 of Table VII we examine fund exit behavior subsequent to a lost
vote. With this analysis we aim at providing an empirical test to theoretical models that
predict strategic substitution between voice and exit (e.g., Edmans et al. (2018)). Specifi-
cally, when a fund loses a vote (i.e., their vote is unsuccessful), theory would predict that
they are more likely to exit the position subsequently.
Adjusting for both endogeneity and selection bias (Column 6), active funds are more
likely to exit a position subsequent to a vote that went against their wishes. These results
are consistent with strategic substitution between the voting and exit channels, which is
significantly stronger for active funds. That is, after correcting for selection in holdings, we
continue to observe a difference in exit behavior conditioning on previous voting outcomes.
Active funds – who are more likely to oppose management – are also more likely to exit a
position after a vote goes against them. Thus, the difference in exit behavior conditional on
previous voting outcomes is again consistent with weaker monitoring by index funds – given
that voice and exit are strategic substitutes for funds to affect firm policy (e.g., Admati and
Pfleiderer (2009); Edmans et al. (2018)).
C. Announcement Returns
A final concern for our results is that, although we find that index funds are more likely
to vote in agreement with management and less likely to exit, it is possible that index funds
intervene to improve firms’ behavior through unobserved methods, such as corporate en-
24

gagement (i.e., meeting with a firm’s managers). However, the effectiveness of such methods
implicitly rely on the threat of voting or exit. Moreover, if firms simply do not react to fund
voting or exit – at least on the margin – then index funds might be “rationally passive”
monitors, who eschew costly monitoring actions that do not affect firm strategy.
To examine these possibilities, we examine the stock market reaction on the days when
agenda items are decided, conditional on how different funds vote. If index funds affect firm
value positively by other means (e.g., engagement), or if the difference in voting is immaterial
to firm outcomes, there should be no difference in average announcement returns between
active and index funds.
In Table ?? we present results for the comparisons of announcement returns to the firm’s
stock on the day each item was decided. We condition on (i) whether the fund voted for
the item or against it (we use VotedYes, an indicator equal to 1 if a fund voted yes on an
agenda item, and 0 otherwise), (ii) whether the item passed or failed (we use ItemPassed, an
indicator equal to 1 if an agenda item passed, and 0 otherwise), and (iii) whether the fund
was an index fund or active fund (we use IndexFund as previously defined). We estimate
the following equation, where i denotes funds and k denotes agenda items:
DailyRtnik = β1IndexFundi × V otedY esik × ItemPassedk
+ β2IndexFundi × V otedY esik
+ β3ActiveFundi × V otedY esik × ItemPassedk
+ β4ActiveFundi × V otedY esik
+ Main Effects + Fixed Effects + εik
(3)
Thus, the first two coefficients (β1, β2) compare the average announcement return for
25

agenda items which index funds supported when the item passed versus when it failed to
pass. The third and fourth coefficients β3, β4 compare the average return for agenda items
which active funds supported when the item passed versus when it failed to pass.
We see that on average, when an index fund voted for an item that passed the firm’s
stock fell by 7 basis points, while when an index fund voted in favor of an item that failed
the firm’s stock rose by 7 basis points (Column 1). By contrast, we find no difference in
announcement returns conditional on active funds’ voting. These results suggest that the
difference in funds’ voting behavior does have an impact on firm value: on average, the
agenda items that index funds support reduce firm value when they pass, and raise firm
value when they fail.
In Column 2 we repeat the same analysis within the sample of Russell cohort stocks.
When an index fund supports an item, the average announcement return is -9 basis points
if the item passes compared to +7 basis points if the item fails. In Column 3 we add
the Heckman correction term for potential selection bias. The results are similar to those
reported in Column 2. Again, there is no consistent difference in announcement returns
conditional on how active funds voted.
In sum, we find significant differences in the stock market’s reaction when individual
agenda items either pass or fail, conditional on voting by index funds only. When index
funds vote in favor of agenda items that pass, the average daily return to the firm’s stock is
negative. Conversely, when index funds vote in favor of an item that fails, the average return
is positive. These results are inconsistent with a world in which fund voting is irrelevant to
firm strategy or firm value; they are consistent with a world in which index funds’ voting
behavior relative to active funds is detrimental to firm value.
26
V. Conclusion
We examine the implications of the rise of passive investing for monitoring and corporate
governance. A number of recent papers find evidence that passive index funds influence a
variety of corporate outcomes, including dividends and disclosure policy. Yet, it remains
unclear how index funds cause these changes. Instead of looking at firm-level outcomes
of corporate governance, we directly examine the two channels through which investors can
influence corporate policy: voice and exit. To account for the possibilities of reverse causality,
omitted variables, and selection bias we develop a new regression discontinuity design based
on post-2006 Russell index reconstitutions, which enables us to examine index investing over
the period in which it has become most prevalent.
In summary, our results document that index funds are more passive monitors of the
firms in their portfolios, and support theoretical work that argues that index funds have
weak incentives to monitor the firms in their portfolio (e.g., Bebchuk et al. (2017), Edmans
et al. (2018)). We find that, relative to active funds, index funds are significantly more likely
to side with firm management on a wide variety of contentious votes. Moreover, we find that
index funds are less likely to exit their position in a firm, both unconditionally and after
they lose a vote. Overall, our findings show that index funds cede power to firm managers.
In other words, passive investors are (relatively) passive monitors.
27

References
Admati, A. R., & Pfleiderer, P. (2009). The “wall street walk” and shareholder activism:
Exit as a form of voice. The Review of Financial Studies , 22 (7), 2645–2685.
Admati, A. R., Pfleiderer, P., & Zechner, J. (1994). Large shareholder activism, risk sharing,
and financial market equilibrium. journal of Political Economy , 102 (6), 1097–1130.
Aghion, P., Van Reenen, J., & Zingales, L. (2013). Innovation and institutional ownership.
American economic review , 103 (1), 277–304.
Appel, I., Gormley, T. A., & Keim, D. B. (2016). Passive investors, not passive owners.
Journal of Financial Economics , forthcoming .
Azar, J., Tecu, I., & Schmalz, M. C. (2018). Anti-competitive effects of common ownership.
Journal of Finance, 73 (4), –.
Bebchuk, L., Cohen, A., & Ferrell, A. (2008). What matters in corporate governance? The
Review of Financial Studies , 22 (2), 783–827.
Bebchuk, L., Cohen, A., & Hirst, S. (2017). The agency problems of institutional investors.
Journal of Economic Perspectives , 31 (3), 89–102.
Berle, A. A., & Means, G. C. (1932). The modern corporation and private property. New
York: Macmillan Publishing Co.
Boone, A. L., & White, J. T. (2015). The effect of institutional owners on firm transparency
and information production. Journal of Financial Economics , 117 , 508-533.
Brav, A., Jiang, W., & Li, T. (2018). Picking friends before picking (proxy) fights: How
mutual fund voting shapes proxy contests. Working Paper .
Brav, A., Jiang, W., Partnoy, F., & Thomas, R. (2008). Hedge fund activism, corporate
governance, and firm performance. The Journal of Finance, 63 (4), 1729–1775.
Chang, Y.-C., Hong, H., & Liskovich, I. (2015). Regression discontinuity and the price
28

effects of stock market indexing. Review of Financial Studies , 28 , 212-246.
Crane, A. D., Michenaud, S., & Weston, J. P. (2016). The effect of institutional ownership
on payout policy: Evidence from index thresholds. Review of Financial Studies , 29 ,
1377-1408.
Edmans, A. (2009). Blockholder trading, market efficiency, and managerial myopia. The
Journal of Finance, 64 (6), 2481–2513.
Edmans, A. (2014). Blockholders and corporate governance. Annual Review of Financial
Economics , 6 (1), 23-50.
Edmans, A., Levit, D., & Reilly, D. (2018). Governance under common ownership. Working
Paper .
Grinstein, Y., & Michaely, R. (2005). Institutional holdings and payout policy. The Journal
of Finance, 60 (3), 1389–1426.
Heckman, J. J. (1979). Sample selection bias as a specification error. Econometrica, 47 ,
153-161.
Hirschman, A. O. (1970). Exit, voice, and loyalty: Responses to decline in firms, organiza-
tions, and states (Vol. 25). Harvard university press.
Iliev, P., & Lowry, M. (2014). Are mutual funds active voters? The Review of Financial
Studies , 28 (2), 446–485.
Jensen, M., & Meckling, W. (1976). Theory of the firm: Managerial behavior, agency costs
and ownership structure. Journal of Financial Economics , 3 (4), 305-360.
Maug, E. (1998). Large shareholders as monitors: is there a trade-off between liquidity and
control? Journal of Finance, 53 (1), 65–98.
Maug, E., & Rydqvist, K. (2001). What is the function of the shareholder meeting? evidence
from the us proxy voting process. Working Paper .
Schmidt, C., & Fahlenbrach, R. (2017). Do exogenous changes in passive institutional own-
29

ership affect corporate governance and firm value? Journal of Financial Economics ,
124 , 285-306.
Shleifer, A., & Vishny, R. W. (1986). Large shareholders and corporate control. Journal of
political economy , 94 (3, Part 1), 461–488.
Wei, W., & Young, A. (2017). Selection bias or treatment effect? a re-examination of russell
1000/2000 index reconstitution. Working Paper .
30
10%
20%
30%
40%
Frac
tion
of A
sset
s
0.0
1.0
2.0
3.0
4.0
5.0
Asse
ts ($
Tril
lion)
1990 1995 2000 2005 2010 2015year
Total Passive AUM Passive Fraction of AUM
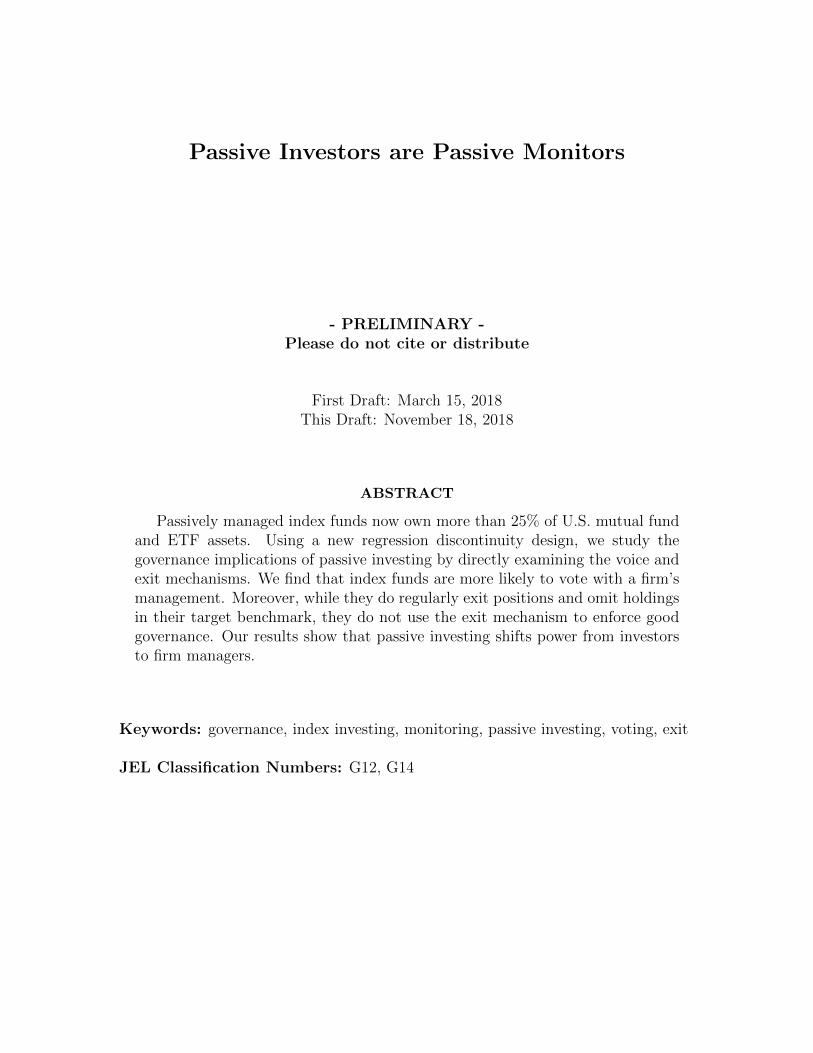
Figure 1. Yearly Passive Assets Under ManagementThe figure plots the total assets under management (AUM) for index funds in the CRSP MutualFund database, by year, as a total dollar figure and as a fraction of AUM across all funds.
31
01
Assi
gned
to R
usse
ll 20
00
500 600 700 800 900 1000 1100 1200 1300 1400 1500Mkt. Cap. Rank
Stayers Switchers
(a) 2006 Index Assignments
01
Assi
gned
to R
usse
ll 20
00
500 600 700 800 900 1000 1100 1200 1300 1400 1500Mkt. Cap. Rank
Stayers Switchers
(b) 2007 Index Assignments
Figure 2. Index Assignment Pre- and Post-BandingThe figure plots assignments to the Russell 1000 and 2000 indexes in June of 2006 and 2007(vertical axes) against our proxy for Russell’s proprietary market cap rankings (horizontalaxis). In 2006, the last year before banding was introduced, there is a sharp discontinuity inindex assignment at the index threshold (solid line). In 2007, stocks near the threshold allstayed in their previous years’ index, breaking the discontinuity in index assignment. Close tothe estimated upper and lower bands (dashed lines), however, there are sharp discontinuitiesin index switching.
32
01
Assi
gned
to R
usse
ll 20
00
500 600 700 800 900 1000 1100 1200 1300 1400 1500Mkt. Cap. Rank
Stayers Switchers
Figure 3. Sample SelectionThe figure plots the sample for the 2007 cohort consisting of all Russell stocks that lay within a+/-100 rank window of the upper and lower bands, and were potential switchers i.e. were in theRussell 2000 in 2006 for those near the upper band or were in the Russell 1000 in 2006 for thosenear the lower band.
33

1.0e
+08
1.0e
+09
1.0e
+10
1.0e
+11
1.0e
+12
log
Mkt
Cap
1 1000 2000 3000MktCap Rank
All Russell Stocks Sample Stocks
Figure 4. Sample SelectionThe figure plots the sample for the 2007 cohort consisting of all Russell stocks that lay within a+/-100 rank window of the upper and lower bands, relative to the entire set of all Russell 3000stocks that were subject to the Russell index assignment in 2007.
34
0.0
0.5
1.0
1.5
2.0
-4 -3 -2 -1 0 1 2 3 -4 -3 -2 -1 0 1 2 3
R1000 → R2000 R2000 → R1000
Stayers Switchers
Pass
ive F
und
Own
ersh
ip (%
of M
kt C
ap)
Year Relative to Index Assignment
Figure 5. Index Switching and Index Fund OwnershipThe figure plots the evolution of index fund ownership in event time relative to index assignment.On the left hand side is average passive fund ownership, in event time, for stocks near the lowerband that were in the Russell 1000 pre-treatment. On the right hand side is average passive fundownership, in event time, for stocks near the upper band that were in the Russell 2000 pre-treatment.The bars represent 95% confidence intervals.
35

01
23
4Pa
ssive
Fun
d O
wner
ship
(% M
ktCa
p)
-100 -50 0 50 100Rank Relative to Upper Band
01
23
4Pa
ssive
Fun
d O
wner
ship
(% M
ktCa
p)
-100 -50 0 50 100Rank Relative to Lower Band
(a) Pretreatment ownership by index funds
010
2030
40Ac
tive
Fund
Own
ersh
ip (%
Mkt
Cap)
-100 -50 0 50 100Rank Relative to Upper Band
010
2030
40Ac
tive
Fund
Own
ersh
ip (%
Mkt
Cap)
-100 -50 0 50 100Rank Relative to Lower Band
(b) Pretreatment ownership by active funds
02
46
Entre
nchm
ent (
E)-In
dex
-100 -50 0 50 100Rank Relative to Upper Band
02
46
Entre
nchm
ent (
E)-In
dex
-100 -50 0 50 100Rank Relative to Lower Band
(c) Pretreatment governance (E-Index)
Figure 6. Balance Tests: Pretreatment Regression DiscontinuityThe figure presents regression discontinuity plots of (a) ownership by index funds, (b) ownershipby active funds, and (c) the Entrenchment Index (E-Index) of Bebchuk Cohen and Ferrell acrossthe upper (left side) and lower (right side) bands as of the last pretreatment year for firms in theRussell switching cohorts. Local polynomial regression lines are in blue. 99% confidence intervalsare in grey.
36

Table ISummary Statistics of Fund Voting
The table summarizes the ISS voting data and presents comparisons of fund voting between active and passiveinvestment funds. The table shows the fraction of each type of fund that voted Yes, No, Abstain or that failedto vote (“did not vote”, DNV) on each agenda item across all shareholder meetings of U.S. firms recorded by ISSfrom 2003-2017. N is the number of individual fund-vote observations.
Management ISS Index funds Active Funds Difference
Recommend Recommend Yes No Abstain DNV Yes No Abstain DNV PctYes N
All 91.3% 4.8% 3.6% 0.3% 90.4% 5.8% 3.3% 0.4% 0.9% 22,393,982
Consensus
Yes Yes 96.8% 1.6% 1.5% 0.1% 97.1% 1.4% 1.3% 0.3% -0.3% 19,875,577
No No 4.5% 80.3% 12.3% 2.8% 5.3% 81.8% 11.2% 1.6% -0.8% 344,402
Contentious
Yes No 51.6% 19.8% 26.7% 1.9% 44.6% 23.6% 29.5% 2.3% 7.0% 1,451,657
No Yes 43.2% 50.1% 6.6% 0.1% 48.1% 45.3% 6.4% 0.3% -4.9% 722,346
37
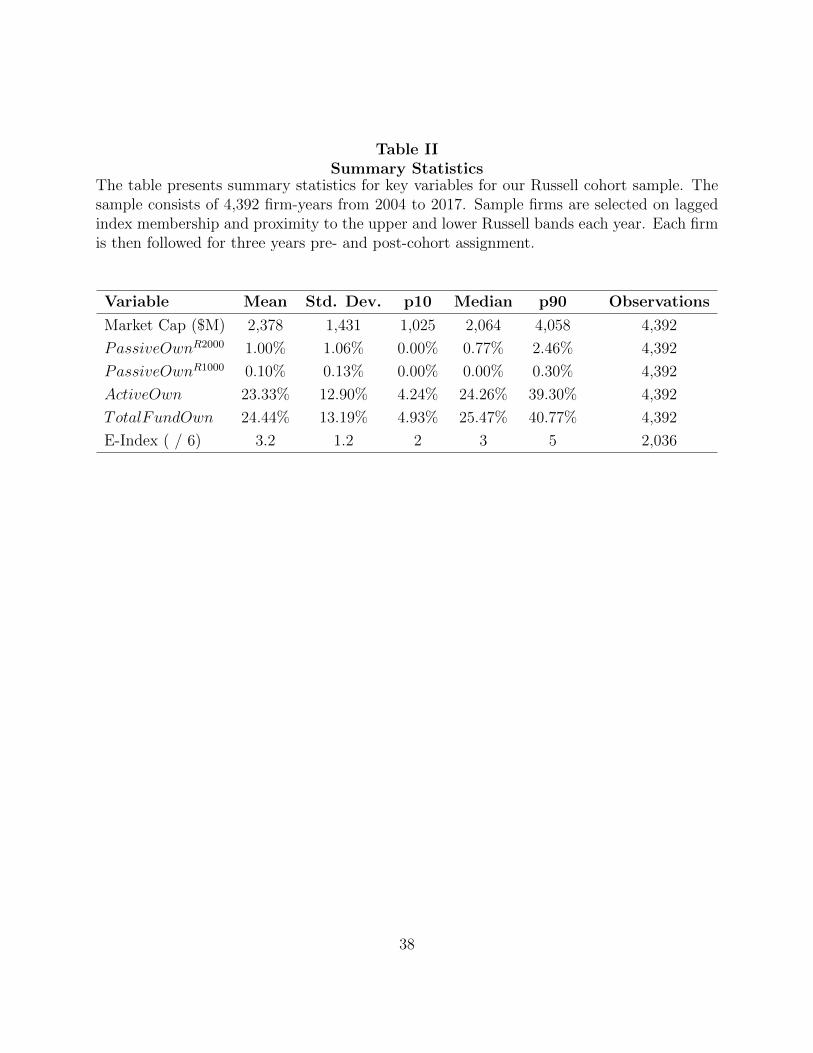
Table IISummary Statistics
The table presents summary statistics for key variables for our Russell cohort sample. Thesample consists of 4,392 firm-years from 2004 to 2017. Sample firms are selected on laggedindex membership and proximity to the upper and lower Russell bands each year. Each firmis then followed for three years pre- and post-cohort assignment.
Variable Mean Std. Dev. p10 Median p90 Observations
Market Cap ($M) 2,378 1,431 1,025 2,064 4,058 4,392
PassiveOwnR2000 1.00% 1.06% 0.00% 0.77% 2.46% 4,392
PassiveOwnR1000 0.10% 0.13% 0.00% 0.00% 0.30% 4,392
ActiveOwn 23.33% 12.90% 4.24% 24.26% 39.30% 4,392
TotalFundOwn 24.44% 13.19% 4.93% 25.47% 40.77% 4,392
E-Index ( / 6) 3.2 1.2 2 3 5 2,036
38

Table IIIIndex Switching and Fund Ownership
The table presents estimates of the effects of Russell index switches on investment fund ownership expressed as apercentage (1=1%) of stocks’ market capitalization. The sample consists of stocks that were “potential switchers”within a +/- 100-rank window of the yearly Russell upper and lower bands from 2007 to 2015, three years beforeand after index assignment for each firm in each cohort. Robust standard errors clustered by firm and year areshown below the estimates in parentheses. *, **, *** indicates statistical significance at the 10%, 5%, and 1%levels, respectively.
(1) (2) (3) (4) (5)PassiveOwnR2000
jt PassiveOwnR1000jt PassiveOwnS&P500
jt ActiveOwnjt TotalFundOwnjt
R1000→ R2000j × 1.52*** -0.20*** -0.04 -2.33** -1.04PostAssignmentt (0.12) (0.02) (0.03) (1.02) (1.07)
R2000→ R1000j × -1.43*** 0.19*** 0.03*** 1.58** 0.38PostAssignmentt (0.09) (0.01) (0.01) (0.67) (0.68)
Observations 4,392 4,392 4,392 4,392 4,392Adjusted R2 0.471 0.486 0.281 0.641 0.639Window 100 100 100 100 100Years 2004-2017 2004-2017 2004-2017 2004-2017 2004-2017Cohorts 2007-2015 2007-2015 2007-2015 2007-2015 2007-2015Year FE Yes Yes Yes Yes YesStock x Cohort FE Yes Yes Yes Yes Yes
39

Table IVBalance Tests: Comparison of Pretreatment Means
The table presents comparisons of pretreatment means between switchers (firms that switched indexes) versusstayers (firms in the same cohort and near the same band that did not switch indexes). Panel A comparesmeasures of fund ownership. Panel B compares the Entrenchment (E)-Index of Bebchuk Cohen Ferrell and itssubcomponents. The sample consists of stocks that were “potential switchers” within a +/- 100-rank window ofthe yearly Russell upper and lower bands from 2007 to 2015. Robust standard errors clustered by firm are shownbelow the estimates in parentheses. *, **, *** indicates statistical significance at the 10%, 5%, and 1% levels,respectively.
Panel A: Fund Ownership
(1) (2) (3) (4) (5)PassiveOwnR2000 PassiveOwnR1000 PassiveOwnS&P500 ActiveOwn TotalFundOwn
R1000→ R2000j -0.02 0.01 -0.06 -2.14 -2.21(0.08) (0.02) (0.05) (3.76) (3.79)
R2000→ R1000j -0.06 0.01 -0.00 1.11 1.05(0.12) (0.01) (0.01) (2.12) (2.18)
Observations 732 732 732 732 732Adjusted R2 0.711 0.829 0.073 0.058 0.068Window 100 100 100 100 100Cohort 2007-2015 2007-2015 2007-2015 2007-2015 2007-2015Control Fn Degree 2 2 2 2Cohort × Band FE Yes Yes Yes Yes Yes
Panel B: Firm Governance
(1) (2) (3) (4) (5) (6) (7)E-Index S/H Chg Bylaws Supmaj. BusComb Supmaj. Charter Poison Pill Conf. Vote Cumul. Vote
R1000→ R2000j 0.34 0.05 0.04 0.14 -0.01 0.15 0.02(0.35) (0.07) (0.14) (0.15) (0.11) (0.11) (0.11)
R2000→ R1000j -0.29 -0.07 0.02 -0.18 0.15 -0.02 -0.07(0.38) (0.10) (0.14) (0.17) (0.14) (0.08) (0.13)
Observations 365 365 365 365 365 365 365Adjusted R2 -0.002 -0.022 0.011 -0.028 0.016 0.016 -0.033Window 100 100 100 100 100 100 100Cohort 2007-2015 2007-2015 2007-2015 2007-2015 2007-2015 2007-2015 2007-2015Control Fn Degree 2 2 2 2 2 2 2Cohort × Band FE Yes Yes Yes Yes Yes Yes Yes
40

Table VFund Voting
The table presents comparisons of fund voting, on contentious items, between index funds versus active funds.Columns 1-2 show estimates for all firms in the sample. Columns 3-6 show estimates for firms that were potentialswitchers near the yearly Russell bands from 2007-2015. The sample consists of votes on only contentious itemsi.e. those on which ISS and firm management were opposed. Robust standard errors clustered by fund are inparentheses. *, **, *** indicates statistical significance at the 10%, 5%, and 1% levels, respectively.
(1) (2) (3) (4) (5) (6)V otedWithMgmt V otedWithMgmt V otedWithMgmt V otedWithMgmt V otedWithMgmt V otedWithMgmt
IndexFundi 0.095*** 0.095*** 0.122*** 0.126*** 0.121*** 0.126***(0.024) (0.025) (0.029) (0.030) (0.041) (0.042)
InverseMillsRatioijt -0.002 0.001(0.083) (0.082)
ExpenseRatioit× -0.186*** -0.141** -0.141**IndexFundi (0.053) (0.061) (0.061)ExpenseRatioit× -0.038 -0.023 -0.023ActiveFundi (0.034) (0.043) (0.043)
Model OLS OLS OLS OLS Heckman HeckmanSample All All Russell Russell Russell RussellObservations 1,831,601 1,756,765 136,857 130,576 136,857 130,576Adjusted R2 0.064 0.073 0.073 0.079 0.073 0.079Firm FE Yes Yes Yes Yes Yes YesYear FE Yes Yes Yes Yes Yes Yes
41

Table VIFund Voting – Split on Item Type
The table presents comparisons of fund voting between passive versus active funds in the fullsample. Panel A splits the set of contentious items into subcategories as defined in the text.Robust standard errors clustered by fund are in parentheses. *, **, *** indicates statisticalsignificance at the 10%, 5%, and 1% levels, respectively.
Panel A: Split on Item Types
(1) (2) (3) (4)Item Type: Board of Directors Compensation Disclosure Entrenchment
V otedwithMgmt V otedwithMgmt V otedwithMgmt V otedwithMgmt
IndexFundi 0.093*** 0.132*** 0.076*** 0.094***(0.029) (0.028) (0.029) (0.025)
Observations 961,983 228,170 88,132 64,283Adjusted R2 0.072 0.085 0.018 0.094Firm FE Yes Yes Yes YesYear FE Yes Yes Yes Yes
Panel B: Management versus Shareholder Proposals
(1) (2) (3) (4) (5) (6)——Shareholder Proposals——– ——Management Proposals——–V otedY es V otedNo Abstained V otedY es V otedNo Abstained
IndexFundi -0.076*** 0.078*** -0.001 0.105*** -0.040*** -0.059***(0.023) (0.020) (0.008) (0.030) (0.012) (0.018)
Observations 641,852 641,852 641,852 1,189,730 1,189,730 1,189,730Adjusted R-squared 0.087 0.071 0.064 0.066 0.234 0.212Firm FE Yes Yes Yes Yes Yes YesYear FE Yes Yes Yes Yes Yes Yes
42
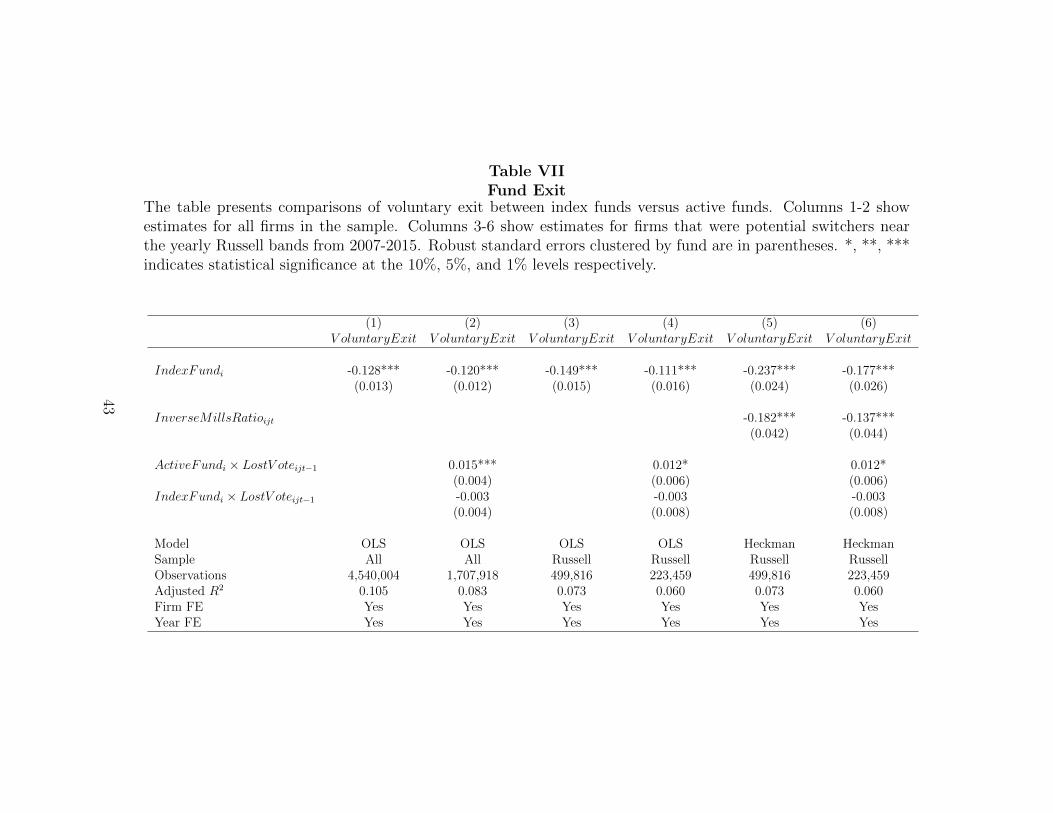
Table VIIFund Exit
The table presents comparisons of voluntary exit between index funds versus active funds. Columns 1-2 showestimates for all firms in the sample. Columns 3-6 show estimates for firms that were potential switchers nearthe yearly Russell bands from 2007-2015. Robust standard errors clustered by fund are in parentheses. *, **, ***indicates statistical significance at the 10%, 5%, and 1% levels respectively.
(1) (2) (3) (4) (5) (6)V oluntaryExit V oluntaryExit V oluntaryExit V oluntaryExit V oluntaryExit V oluntaryExit
IndexFundi -0.128*** -0.120*** -0.149*** -0.111*** -0.237*** -0.177***(0.013) (0.012) (0.015) (0.016) (0.024) (0.026)
InverseMillsRatioijt -0.182*** -0.137***(0.042) (0.044)
ActiveFundi × LostV oteijt−1 0.015*** 0.012* 0.012*(0.004) (0.006) (0.006)
IndexFundi × LostV oteijt−1 -0.003 -0.003 -0.003(0.004) (0.008) (0.008)
Model OLS OLS OLS OLS Heckman HeckmanSample All All Russell Russell Russell RussellObservations 4,540,004 1,707,918 499,816 223,459 499,816 223,459Adjusted R2 0.105 0.083 0.073 0.060 0.073 0.060Firm FE Yes Yes Yes Yes Yes YesYear FE Yes Yes Yes Yes Yes Yes
43
VI. Appendix
A. Stock and Index Data
Russell index membership data come directly from Russell. Stock trading and firm
accounting data are from CRSP and merged CRSP-Compustat. We use the most recent
data for each firm from June 1 to the following May 31 of each year.
Investment fund ownership data comes from the CRSP Mutual Fund database. We
compute the ownership of each sample stock by every fund in December of each year. We
classify funds as passive or active using their index fund flag in CRSP. Both mutual funds
and ETFs are included in our sample. Our measures of fund holdings are defined below.
All holdings measures are for each stock i as of December in year t, and are expressed as a
percent of the stock’s market capitalization.
TotalFundOwnit : The fraction of stock i’s market cap held by all mutual funds
PassiveOwnR2000it : The fraction of stock i’s market cap held by index funds whose name
contains “Russell” and “2000”
PassiveOwnR1000it : The fraction of stock i’s market cap held by index funds whose name
contains “Russell” and “1000”
PassiveOwnS&P500it : The fraction of stock i’s market cap held by index funds whose
name contains “S&P” and “500” in their name
ActiveOwnit : The fraction of stock i’s market cap held by active mutual funds.
B. Selection of the Yearly Cohorts
The following steps describe the selection of the June 2007 cohort:
44
1. Rank all qualifying U.S. common stocks by their unadjusted market capitalization as
of the last business day in May 2007.
2. Select all stocks that i) ranked within +/-N ranks of the upper band and ii) were
members of the Russell 2000 as of May 2007. This is the set of potential switchers near
the upper band.
3. Select all stocks that i) ranked within +/-N ranks of the lower band, and ii) were
members of the Russell 1000 as of May 2007. This is the set of potential switchers near
the lower band.
4. For each selected stock, collect its information from CRSP-Compustat over the 3 years
prior to index assignment (here, 2004-2006) and the 3 years post index assignment
(here, 2007-2009). Add all collected firm-years to the sample.
Thus, our research design is a cohort design that compares outcomes Y for stock i in cohort
c for three years pre-treatment versus three years post-treatment. The pre-vs-post periods
are compared between:
1. Stocks near the upper band that switched out of the Russell 2000 versus those that
stayed (coefficient β1) .
2. Stocks near the lower band that switched into the Russell 2000 versus those that stayed
(coefficient β2).
45

Table A1Observation Equation
The table presents the estimated observation equation (the Heckman first stage, equation (1) in the main text)that a given fund is observed holding a given firm. The sample for this estimate is the panel of all firm-years inthe Russell sample, interacted with all mutual funds that held at least one firm in the sample. The dependentvariable Observedijt is a dummy that equals 1 if fund i held a position in firm j in year t. Robust standard errorsclustered by fund are in parentheses. *, **, *** indicates statistical significance at the 10%, 5%, and 1% levels,respectively.
(1)Observedijt
IndexFundi 0.564***(0.048)
R2000→ R1000j× 0.081***PostAssignmentt (0.016)R1000→ R2000j× -0.148***PostAssignmentt (0.020)
R2000→ R1000j× -0.028PostAssignmentt × IndexFundi (0.029)R1000→ R2000j× 0.087***PostAssignmentt × IndexFundi (0.021)
Model ProbitObservations 12,643,785Pseudo R2 0.054Firm FE YesYear FE Yes
46