passive plus report q1 2020 - standard life · 2020-06-11 · passive plus funds report 3 corporate...
TRANSCRIPT

Investment ReportStandard LifeCorporate Investment Proposition Passive Plus Funds Report Q1 2020

Our Corporate Investment Proposition is made up of a family of carefully constructed risk-based fund of fund portfolios, which offer clients a choice of active and passive investment strategies across five risk levels.
They are designed to help clients achieve the right balance between risk and reward by offering sufficient choice to meet different levels of risk appetite; and providing a risk based QWPS default solution.
Generally, higher risk equates to a greater potential return, whilst lower risk equates to a lower potential return. The strategic asset allocation is set using a 10 year view so the proportion of assets (for example equities or bonds) within each fund is not expected to significantly change in the short term.
The funds are designed to help employers and their advisers demonstrate adherence to the IGG investment governance principles for DC schemes as shown below:
Clear roles and responsibilities - Solutions provided and governed by Standard Life and Aberdeen Standard Investments
Effective decision making - Robust strategic asset allocation, tactical asset allocation and fund selection processes
Appropriate investment options - Range of risk based options and investment styles to suit different risk attitudes
Appropriate default strategy - Risk based lifestyle options
Effective performance assessment - Performance reporting with clear investment objectives with ongoing review and governance at a fund and solution level
Clear and relevant communication - Factsheets (including performance) and customer fund guides
Choice of Investment Style
Standard Life Passive Plus Funds –a lower cost option investing mainly in tracker funds.
Designed to offer a lower-cost investment solution, the Passive Plus funds invest in a carefully-selected portfolio that is mainly made up of tracker funds from Vanguard. For more specialist areas, we have included actively managed commercial property and high yield bond funds.
Standard Life Active Plus Funds - an actively-managed and competitively priced option that invests in funds managed by Aberdeen Standard Investments. Designed to offer a competitively priced actively managed investment solution, the Active Plus funds are diversified, multi-asset portfolios investing in a range of funds actively managed by Aberdeen Standard Investments, one of Europe’s leading investment managers, including commercial property and high yield bond funds. The investment process for the funds’ strategic asset allocations is the same as for the Passive Plus range however has the additional benefit of Tactical Asset Allocation, which aims to take advantage of shorter-term investment opportunities. Tactical Asset Allocation is carried out by Multi-Asset Solutions.
Aberdeen Standard Investments MyFolio Managed Funds – an actively-managed, higher alpha option that invests mainly in funds managed by Aberdeen Standard Investments. Standard Life MyFolio Managed Funds mainly invest in Aberdeen Standard Investments funds, with the manager having the ability to select alternative investments from the rest of the market. The MyFolio Managed Fund suite includes allocations to diversifying funds which offer a different expected return profile to traditional asset classes and as such provide further diversification benefits to the Funds. 10% of the growth and 20% of defensive assets within each Fund have been replaced with these diversifying funds. The funds also benefit from Tactical Asset Allocation carried out by Multi-Asset Solutions.
You can find out more about our Corporate Investment Proposition, including our fund governance processes, at www.standardlifeworkplace.co.uk
Corporate Investment Proposition

Contents
1 Environment and Activity
3 Risk
4 Risk and Return Characteristics
6 Performance
7 Standard Life Passive Plus I Pension Fund
8 Standard Life Passive Plus II Pension Fund
9 Standard Life Passive Plus III Pension Fund
10 Standard Life Passive Plus IV Pension Fund
11 Standard Life Passive Plus V Pension Fund

Corporate Investment Proposition Passive Plus Funds Report
1 Corporate Investment Proposition Passive Plus Funds Report
Environment
After a positive start, global equities suffered a bruising quarter, with losses not seen since the 2008 financial crisis. As the coronavirus outbreak evolved into a global pandemic, the mood changed. Coinciding with this, the main oil-producing nations failed to agree supply cuts, sending oil prices plunging to 18-year lows. Alarmed investors dumped equities, corporate bonds and other riskier assets. Instead, they sought shelter in government bonds, pushing yields back to historic lows. With global growth projections for 2020 in virtual freefall, central banks cut interest rates. Governments also stepped into action with enormous stimulus packages, aiming to tide over individuals and businesses.
Global government bond yields fell sharply, and prices rose. This was caused primarily by the coronavirus outbreak, and fears over the resultant potential damage to global economic growth. Central banks across the world cut interest rates and initiated stimulus programmes to mitigate the economic effects of Covid-19, and yields moved to historic lows in major government bond markets. Like most other risk assets, global corporate bonds had a torrid time in the first quarter. While returns were still positive for most of the first two months, performance became markedly more negative from late-February onwards. This reflected the growing realisation of the hugely damaging economic consequences of the escalating coronavirus pandemic.
It was a slow start to the year for UK property, with transaction volumes quickly losing steam following the outcome of the December 2019 general election. According to the MSCI Monthly Index, total returns in January and February were 0.3%. That said, the performance figures are yet to reflect the significant impact of the covid-19 pandemic and the economic disruption from containment measures put in place by the government. Lending against real estate assets is slowing dramatically and the issuance of new debt is grinding to a halt.
Activity
Strategic Asset Allocation
We review the Strategic Asset Allocation (SAA) for each of the funds every quarter, with the aim of ensuring that we continue to meet investors’ long-term investment expectations. At the most recent review, we made no changes to the SAA model.
Environment and Activity
Corporate Investment Proposition Passive Plus Funds Report
2Corporate Investment Proposition Passive Plus Funds Report
Changes to underlying funds
There were no changes to the underlying fund over the quarter.
Corporate Investment Proposition Passive Plus Funds Report
3 Corporate Investment Proposition Passive Plus Funds Report
Risk
Passive Plus Funds
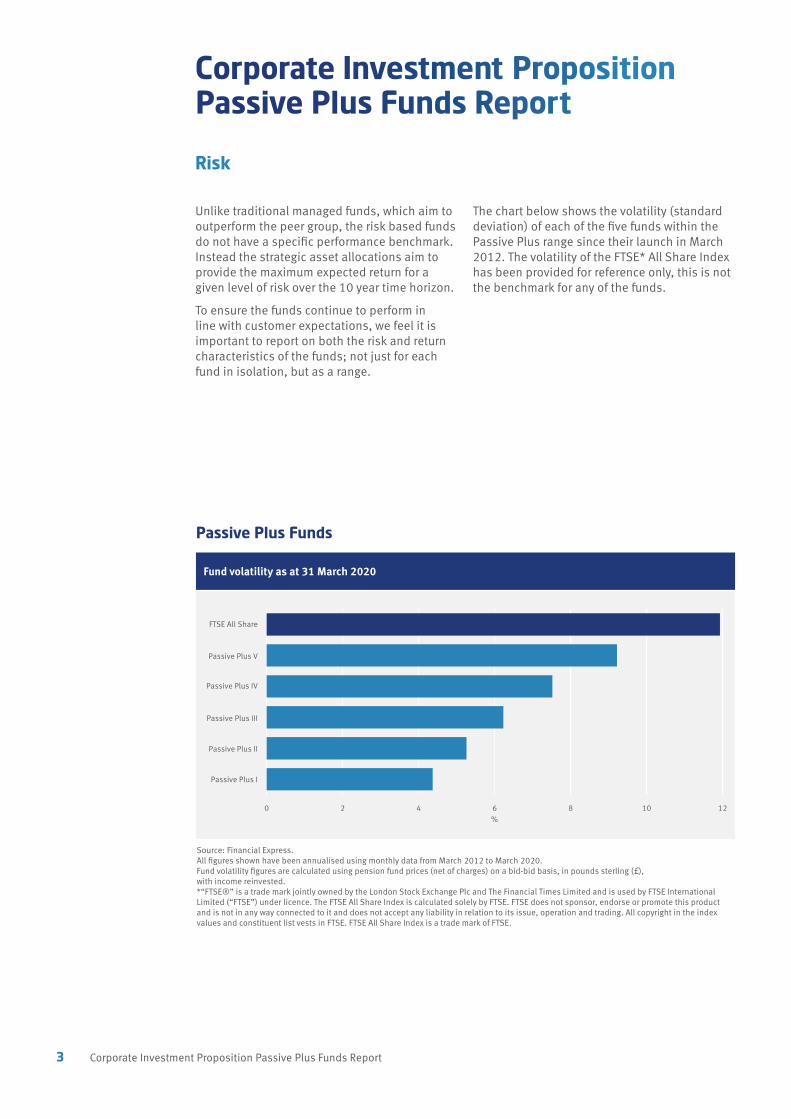
Fund volatility as at 31 March 2020
Source: Financial Express. All figures shown have been annualised using monthly data from March 2012 to March 2020. Fund volatility figures are calculated using pension fund prices (net of charges) on a bid-bid basis, in pounds sterling (£), with income reinvested. *“FTSE®” is a trade mark jointly owned by the London Stock Exchange Plc and The Financial Times Limited and is used by FTSE International Limited (“FTSE”) under licence. The FTSE All Share Index is calculated solely by FTSE. FTSE does not sponsor, endorse or promote this product and is not in any way connected to it and does not accept any liability in relation to its issue, operation and trading. All copyright in the index values and constituent list vests in FTSE. FTSE All Share Index is a trade mark of FTSE.
Unlike traditional managed funds, which aim to outperform the peer group, the risk based funds do not have a specific performance benchmark. Instead the strategic asset allocations aim to provide the maximum expected return for a given level of risk over the 10 year time horizon.
To ensure the funds continue to perform in line with customer expectations, we feel it is important to report on both the risk and return characteristics of the funds; not just for each fund in isolation, but as a range.
The chart below shows the volatility (standard deviation) of each of the five funds within the Passive Plus range since their launch in March 2012. The volatility of the FTSE* All Share Index has been provided for reference only, this is not the benchmark for any of the funds.
0 2 4 6 8 10 12
Passive Plus V
%
Passive Plus IV
Passive Plus III
Passive Plus II
FTSE All Share
Passive Plus I

Corporate Investment Proposition Passive Plus Funds Report
4Corporate Investment Proposition Passive Plus Funds Report
This section illustrates the risk and return characteristics of the Passive Plus range from launch (March 2012) to end March 2020.
The graph below compares the difference between the risk and return of the Passive Plus funds to a range of simple portfolios constructed from four assets that would be traditionally used by UK investors; UK equities, global equities, UK government bonds and global government bonds. These portfolios are represented by the blue line on the chart below.
The blue line displays the historic risk and return characteristics of over 100 sample portfolios, ranging from a 100% allocation to equities (split evenly 50:50 between global and UK equities) at one end (purple dot) to a 100%
allocation to government bonds (teal dot; 50:50 split between global and UK government bonds) at the other, and all the possible combinations in between.
It is widely recognised that over the longer term, investment in equities should achieve a better return than a portfolio of bonds but this comes with a higher level of risk. In this example we can see that over the period under review, equities have outperformed bonds but with increased volatility and that the various combinations of the four assets delivered different risk/return outcomes.
Passive Plus Funds
Risk vs Return
Source: Aberdeen Standard Investments; FTSE All Share Index and FTSE WGBI World All Maturities: Total Return Hedged (£), MSCI All Countries World Index and BOFA ML Global Government Index monthly return data denominated in GBP was sourced from Datastream from 01/03/2012 to 31/03/2020; Active Plus annualised performance was based on monthly net of fees prices. The FTSE All-Share Index is calculated solely by FTSE International Limited (“FTSE”). FTSE does not sponsor, endorse or promote this fund. All copyright in the index values and constituent list vests in FTSE. “FTSE ®” is a trade mark jointly owned by the London Stock Exchange Plc and The Financial Times Limited and is used by FTSE under licence. “All Share” is a trade mark of FTSE. Passive charge assumed to be 0.75% p.a.
Risk and Return Characteristics
% Annualised Risk (Standard Deviation)
% A
nnua
lised
Ret
urn
6
4
2
0
1
3
5
7
0 1 2 3 4 5 6 7 8 9 10 11 12
Passive Plus I
Passive Plus II Passive Plus III
Passive Plus IVPassive Plus V
100% Government Bonds
100% Equities

Corporate Investment Proposition Passive Plus Funds Report
5 Corporate Investment Proposition Passive Plus Funds Report
Risk and Return Characteristics (continued)
What does this mean?By applying our robust investment process, we aim to deliver outperformance on a risk-adjusted basis, i.e. the portfolios appearing to the left and above the theoretical efficient frontier. This frontier is constructed using a combination of equity/bond allocations ranging from 100% equities at one extreme to 100% bonds at the other. Within both the equity and bond allocations the split is 50/50 between UK and non-UK. It is worth highlighting that we recently changed the non-UK component of government bonds from unhedged to hedged, so as to mitigate large movements in Sterling. While the change deals with the sterling movement the change also better reflects the types of bond exposures uses in our solutions.
For a number of years the range of funds outperformed the efficient frontier, however due to an extreme upwards movement during Q2 and Q3 2016, this resulted in a number of funds falling below the efficient frontier. In addition, most recent performance has seen the funds fall further below the efficient frontier as a result of the weaker returns during Q1 2020. Since that period unfortunately the funds have not been able to close this gap, however we remain confident in our ability to deliver outperformance on a risk-adjusted basis over the longer term.

Corporate Investment Proposition Passive Plus Funds Report
6Corporate Investment Proposition Passive Plus Funds Report
The commentary below represents performance across the range of Passive Plus funds (ratings I - V). As these funds are predominantly managed passively, the commentary refers to the active components of each fund, namely absolute return, commercial property and high yield bonds.
After a positive start, global equities suffered a bruising quarter, with losses not seen since the 2008 financial crisis. As the coronavirus outbreak evolved into a global pandemic, the mood changed. Coinciding with this, the main oil-producing nations failed to agree supply cuts, sending oil prices plunging to 18-year lows. Alarmed investors dumped equities, corporate bonds and other riskier assets. Instead, they sought shelter in government bonds, pushing yields back to historic lows. With global growth projections for 2020 in virtual freefall, central banks cut interest rates. Governments also stepped into action with enormous stimulus packages, aiming to tide over individuals and businesses.
The passive components of the Passive Plus funds use tracker funds predominantly managed by Vanguard Asset Management. When analysing the individual performance of each component, it is worth bearing in mind that differences between the fund performance and the underlying index can occur because of timing differences and the inherent process of pricing external funds. Over short periods this can lead to what looks like increased tracking errors (the degree to which the funds deviate from their benchmark indices) but, over the medium term, these differences will even out.
Within the global high yield portfolio, the Fund outperformed its benchmark in January and February but underperformed in March. At the sector level, overweight positions in defensive sectors such as cable, wirelines, and electric contributed positively, as did our lack of exposure to both retail and transportation. However, this was not enough to offset weakness in the energy, banking and technology sectors. Our off-benchmark BBB exposure, which theoretically should have held up relatively well in the market sell-off, failed to do so as investment-grade buyers sought to exit BBB rated credits. While our underweight to lower-quality CCC rated names was a positive contributor, poor performance by a handful of individual credits within this segment of the market offset the contribution from the overall underweight positioning.
Within UK commercial property, our shopping centres had the greatest negative impact on performance, primarily reflecting the ongoing paucity of both investor and occupier demand (exacerbated by the Covid-19 pandemic). Capital value declines were also pronounced in the rest of UK high street portfolio, albeit our exposure here is relatively small. The City and West End of London office portfolios, where we have a broadly neutral weight, were positive contributors once again. They delivered marginally positive total returns of 0.75% and 0.4%, respectively. Total returns from our industrial and alternative portfolios were broadly flat over the quarter, much reduced from previous return levels, but continuing to be one of the best performing sub-sectors.
Performance

Corporate Investment Proposition Passive Plus Funds Report
7 Corporate Investment Proposition Passive Plus Funds Report
Standard Life Passive Plus I Pension Fund
Performance Comparison as at 31 March 2020
Figures quoted are calculated, net of fees basis over periods to 31 March 2020, with gross income reinvested. The Comparative Index shown makes no allowance for charges.
Source: Aberdeen Standard Investments (Fund) and Thomson Reuters Datastream (Comparative Index)Note: Past performance is not a guide to future performance and the value of units can go down as well as up.The Comparative index is made up of representative indices based on the strategic asset allocation of the fund and do not take into account any out-performance targets. Note - as a result ‘Global Absolute Return Strategies’ is currently represented by 6 month LIBOR.
Fund Comparative Index
Composition by Fund Exposure
Fund %*
Defensive Assets
SL Vanguard UK Short-Term Investment Grade Bond Index Pension Fund 22.30SL Vanguard UK Investment Grade Bond Index Pension Fund 21.60SL Vanguard Global Corporate Bond Index Pension Fund 19.30SL Vanguard Global Short-Term Corporate Bond Index Pension Fund 6.40SL Vanguard UK Government Bond Index Pension Fund 3.00Standard Life Money Market Pension Fund 1.00
Growth Assets
SL Vanguard FTSE UK All Share Index Pension Fund 10.20
SL Vanguard US Equity Pension Fund 2.90Standard Life Property Pension Fund 2.80SL ASI Emerging Markets Local Currency Bond Tracker Pension Fund 2.60SL Vanguard Japan Stock Index Pension Fund 2.50SL Vanguard Pacific ex Japan Stock Index Pension Fund 1.20SL Vanguard Emerging Markets Stock Index Pension Fund 1.20SL Vanguard FTSE Developed Europe ex UK Pension Fund 1.00SL SLI Global High Yield Bond Pension Fund 1.00SL Global Property Securities Asset Fund 1.00
* The data is rounded up and therefore small variances to totals may occur. FTSE International Limited (“FTSE”) does not sponsor, endorse, or promote these funds. All copyright in the index values and constituent list vests in FTSE. Standard Life group has obtained a licence from FTSE to use such copyright in the creation of this fund. “FTSE®” is a trade mark jointly owned by the London Stock Exchange Plc and The Financial Times Limited and is used by FTSE under licence.
-8
-6
-4
-2
0
2
4
1 YearQ4 2019 Q1 2020Q2 2019 3 Yearsp.a.
Q3 2019 5 Yearsp.a.
-0.13 -0.03
-7.08
-5.01
2.01 2.27 2.37 2.61
-3.09
-0.35 -0.12
1.54 1.63
3.10

Corporate Investment Proposition Passive Plus Funds Report
8Corporate Investment Proposition Passive Plus Funds Report
Standard Life Passive Plus II Pension Fund
Performance Comparison as at 31 March 2020
Figures quoted are calculated, net of fees basis over periods to 31 March 2020, with gross income reinvested. The Comparative Index shown makes no allowance for charges.
Source: Aberdeen Standard Investments (Fund) and Thomson Reuters Datastream (Comparative Index)Note: Past performance is not a guide to future performance and the value of units can go down as well as up.The Comparative index is made up of representative indices based on the strategic asset allocation of the fund and do not take into account any out-performance targets. Note - as a result ‘Global Absolute Return Strategies’ is currently represented by 6 month LIBOR.
Composition by Fund Exposure
Fund *
Defensive Assets
SL Vanguard Global Corporate Bond Index Pension Fund 19.30SL Vanguard UK Short-Term Investment Grade Bond Index Pension Fund 13.10SL Vanguard UK Investment Grade Bond Index Pension Fund 13.00SL Vanguard Global Short-Term Corporate Bond Index Pension Fund 7.00Standard Life Money Market Pension Fund 1.00
Growth Assets
SL Vanguard FTSE UK All Share Index Pension Fund 17.80Standard Life Property Pension Fund 5.20SL Vanguard US Equity Pension Fund 5.10SL ASI Emerging Markets Local Currency Bond Tracker Pension Fund 4.70SL Vanguard Japan Stock Index Pension Fund 3.60SL Vanguard Pacific ex Japan Stock Index Pension Fund 2.60SL Vanguard Emerging Markets Stock Index Pension Fund 2.60SL Vanguard FTSE Developed Europe ex UK Pension Fund 2.10SL Global Property Securities Asset Fund 1.70SL SLI Global High Yield Bond Pension Fund 1.20
* The data is rounded up and therefore small variances to totals may occur. FTSE International Limited (“FTSE”) does not sponsor, endorse, or promote these funds. All copyright in the index values and constituent list vests in FTSE. Standard Life group has obtained a licence from FTSE to use such copyright in the creation of this fund. “FTSE®” is a trade mark jointly owned by the London Stock Exchange Plc and The Financial Times Limited and is used by FTSE under licence.
Fund Comparative Index
-12
-10
-8
-6
-4
-2
0
2
4
1 YearQ4 2019 Q1 2020Q2 2019 3 Yearsp.a.
Q3 2019 5 Yearsp.a.
0.400.78
-10.47-9.62
2.56 2.76 2.33 2.52
-5.66
-4.04
-0.52
0.791.82
3.15
Corporate Investment Proposition Passive Plus Funds Report
9 Corporate Investment Proposition Passive Plus Funds Report
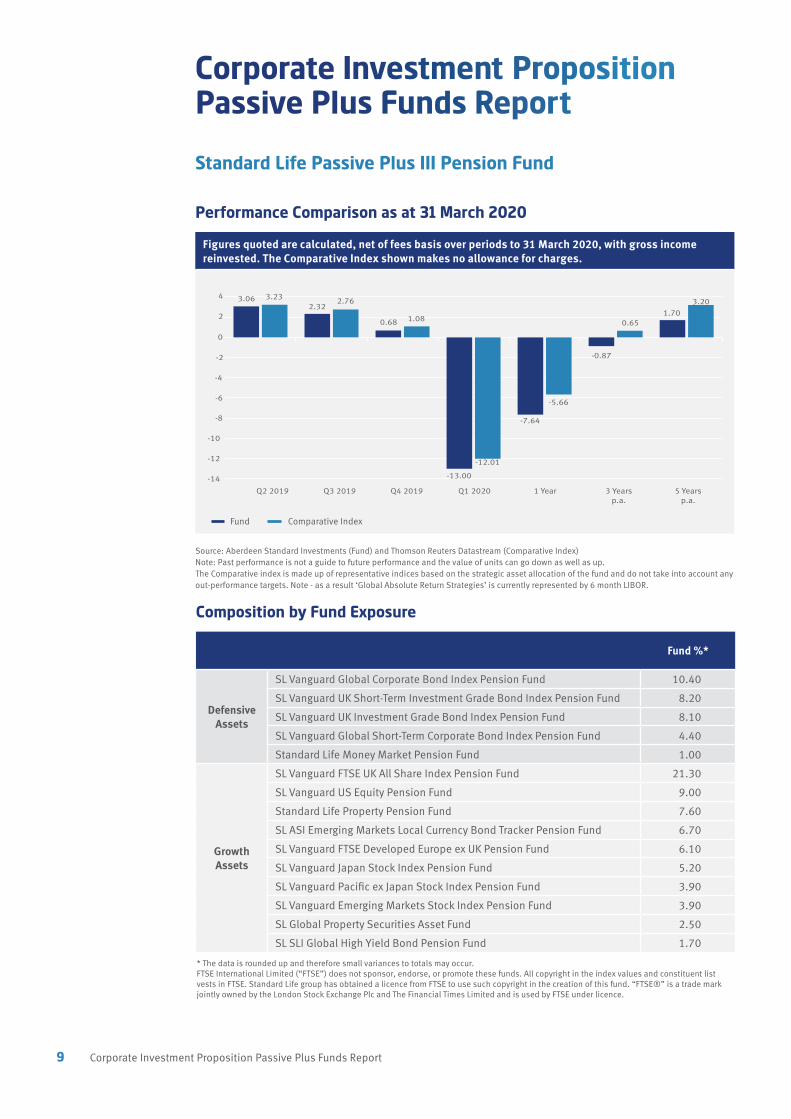
Standard Life Passive Plus III Pension Fund
Performance Comparison as at 31 March 2020
Figures quoted are calculated, net of fees basis over periods to 31 March 2020, with gross income reinvested. The Comparative Index shown makes no allowance for charges.
Source: Aberdeen Standard Investments (Fund) and Thomson Reuters Datastream (Comparative Index)Note: Past performance is not a guide to future performance and the value of units can go down as well as up.The Comparative index is made up of representative indices based on the strategic asset allocation of the fund and do not take into account any out-performance targets. Note - as a result ‘Global Absolute Return Strategies’ is currently represented by 6 month LIBOR.
Composition by Fund Exposure
Fund %*
Defensive Assets
SL Vanguard Global Corporate Bond Index Pension Fund 10.40SL Vanguard UK Short-Term Investment Grade Bond Index Pension Fund 8.20SL Vanguard UK Investment Grade Bond Index Pension Fund 8.10SL Vanguard Global Short-Term Corporate Bond Index Pension Fund 4.40Standard Life Money Market Pension Fund 1.00
Growth Assets
SL Vanguard FTSE UK All Share Index Pension Fund 21.30SL Vanguard US Equity Pension Fund 9.00Standard Life Property Pension Fund 7.60SL ASI Emerging Markets Local Currency Bond Tracker Pension Fund 6.70SL Vanguard FTSE Developed Europe ex UK Pension Fund 6.10SL Vanguard Japan Stock Index Pension Fund 5.20SL Vanguard Pacific ex Japan Stock Index Pension Fund 3.90SL Vanguard Emerging Markets Stock Index Pension Fund 3.90SL Global Property Securities Asset Fund 2.50SL SLI Global High Yield Bond Pension Fund 1.70
* The data is rounded up and therefore small variances to totals may occur. FTSE International Limited (“FTSE”) does not sponsor, endorse, or promote these funds. All copyright in the index values and constituent list vests in FTSE. Standard Life group has obtained a licence from FTSE to use such copyright in the creation of this fund. “FTSE®” is a trade mark jointly owned by the London Stock Exchange Plc and The Financial Times Limited and is used by FTSE under licence.
Fund Comparative Index
-14
-12
-10
-8
-6
-4
-2
0
2
4
1 YearQ4 2019 Q1 2020Q2 2019 3 Yearsp.a.
Q3 2019 5 Yearsp.a.
0.68 1.08
-13.00-12.01
2.322.76
-7.64
-5.66
-0.87
0.651.70
3.203.06 3.23

Corporate Investment Proposition Passive Plus Funds Report
10Corporate Investment Proposition Passive Plus Funds Report
Standard Life Passive Plus IV Pension Fund
Performance Comparison as at 31 March 2020
Figures quoted are calculated, net of fees basis over periods to 31 March 2020, with gross income reinvested. The Comparative Index shown makes no allowance for charges.
Source: Aberdeen Standard Investments (Fund) and Thomson Reuters Datastream (Comparative Index)Note: Past performance is not a guide to future performance and the value of units can go down as well as up.The Comparative index is made up of representative indices based on the strategic asset allocation of the fund and do not take into account any out-performance targets. Note - as a result ‘Global Absolute Return Strategies’ is currently represented by 6 month LIBOR.
Fund Comparative Index
Composition by Fund Exposure
Fund %*
Defensive Assets
SL Vanguard UK Investment Grade Bond Index Pension Fund 4.00SL Vanguard UK Short-Term Investment Grade Bond Index Pension Fund 3.90SL Vanguard Global Corporate Bond Index Pension Fund 1.80SL Vanguard Global Short-Term Corporate Bond Index Pension Fund 1.50Standard Life Money Market Pension Fund 1.00
Growth Assets
SL Vanguard FTSE UK All Share Index Pension Fund 25.90SL Vanguard US Equity Pension Fund 15.00Standard Life Property Pension Fund 8.80SL Vanguard FTSE Developed Europe ex UK Pension Fund 8.00SL Vanguard Japan Stock Index Pension Fund 7.20SL ASI Emerging Markets Local Currency Bond Tracker Pension Fund 6.80SL Vanguard Pacific ex Japan Stock Index Pension Fund 5.30SL Vanguard Emerging Markets Stock Index Pension Fund 5.30SL Global Property Securities Asset Fund 3.30SL SLI Global High Yield Bond Pension Fund 2.20
* The data is rounded up and therefore small variances to totals may occur. FTSE International Limited (“FTSE”) does not sponsor, endorse, or promote these funds. All copyright in the index values and constituent list vests in FTSE. Standard Life group has obtained a licence from FTSE to use such copyright in the creation of this fund. “FTSE®” is a trade mark jointly owned by the London Stock Exchange Plc and The Financial Times Limited and is used by FTSE under licence.
-16
-14
-12
-10
-8
-6
-4
-2
0
2
4
1 YearQ4 2019 Q1 2020Q2 2019 3 Yearsp.a.
Q3 2019 5 Yearsp.a.
1.071.52
-15.51-14.53
3.50 3.56
2.09 2.37
-9.76
-8.01
-1.31
0.13
1.853.38

Corporate Investment Proposition Passive Plus Funds Report
11 Corporate Investment Proposition Passive Plus Funds Report
Standard Life Passive Plus V Pension Fund
Performance Comparison as at 31 March 2020
Figures quoted are calculated, net of fees basis over periods to 31 March 2020, with gross income reinvested. The Comparative Index shown makes no allowance for charges.
Source: Aberdeen Standard Investments (Fund) and Thomson Reuters Datastream (Comparative Index)Note: Past performance is not a guide to future performance and the value of units can go down as well as up.The Comparative index is made up of representative indices based on the strategic asset allocation of the fund and do not take into account any out-performance targets. Note - as a result ‘Global Absolute Return Strategies’ is currently represented by 6 month LIBOR.
Fund Comparative Index
Composition by Fund Exposure
Fund %*
Defensive Assets
SL Vanguard UK Short-Term Investment Grade Bond Index Pension Fund 2.00Standard Life Money Market Pension Fund 1.00
Growth Assets
SL Vanguard FTSE UK All Share Index Pension Fund 35.00SL Vanguard US Equity Pension Fund 22.40SL Vanguard Japan Stock Index Pension Fund 9.80SL Vanguard FTSE Developed Europe ex UK Pension Fund 9.40SL Vanguard Pacific ex Japan Stock Index Pension Fund 7.30SL Vanguard Emerging Markets Stock Index Pension Fund 7.10SL Global Property Securities Asset Fund 5.00SL ASI Emerging Markets Local Currency Bond Tracker Pension Fund 1.00
* The data is rounded up and therefore small variances to totals may occur. FTSE International Limited (“FTSE”) does not sponsor, endorse, or promote these funds. All copyright in the index values and constituent list vests in FTSE. Standard Life group has obtained a licence from FTSE to use such copyright in the creation of this fund. “FTSE®” is a trade mark jointly owned by the London Stock Exchange Plc and The Financial Times Limited and is used by FTSE under licence.
-20
-18
-16
-14
-12
-10
-8
-6
-4
-2
0
2
46
1 YearQ4 2019 Q1 2020Q2 2019 3 Yearsp.a.
Q3 2019 5 Yearsp.a.
1.592.31
-18.96-18.06
4.35 4.38
2.16 2.54
-12.24-10.26
-2.08-0.62
1.913.54

Standard Life Assurance Limited is registered in Scotland (SC286833) at Standard Life House, 30 Lothian Road, Edinburgh EH1 2DH. Standard Life Assurance Limited is authorised by the Prudential Regulation Authority and regulated by the Financial Conduct Authority and the Prudential Regulation Authority. www.standardlife.co.uk
INVP74 Q120 © 2020 Standard Life Aberdeen. Images reproduced under licence. All rights reserved.
Find out moreFor more information speak to your usual Standard Life contact.
www.standardlifeworkplace.co.uk