path to 100% renewables for dominican republic - executive
TRANSCRIPT

TABLE OF CONTENTS
Path to 100% Renewables for Dominican RepublicExecutive Version
The Dominican Republic is considered a leader in energy and policy in the Caribbean. At the end of 2018 the Dominican Republic approved a Nationally Determined Contribution (NDC) Action Plan to reaffirm the countries pledge to maintain the targets set by the Paris Climate Agreement. This being one of the actions showing the Island nation’s commitment to reducing emissions and increasing the amount of renewable energy in their power system.
The country’s dependence on imported fuels, like coal, heavy fuel oil (HFO) and gas, makes utilities, and thereby the nation, vulnerable to increases in fuel prices. The introduction of Renewable Energy Sources (RES) like wind and solar would reduce this dependence on fossil fuels and reduce the country’s carbon footprint. In order to accomplish this, the country has announced a target that at least 27% of energy must come from RES by 2030. In addition, RES must make up 32% of the countries generating capacity by 2023. At the 2019 UN Climate Conference COP25 in Madrid it was announced that Latin America and the Caribbean Region has set a renewable target of 70% by 2030.
The purpose of this paper is to contribute to the conversation in the Dominican Republic and analyse the most cost-effective ways forward for the country’s power sector. This study contemplates several scenarios and compares the outcomes to the country’s current strategy.
This study provides the necessary information to better understand the impact of certain decisions, taken today, on future factors such as the total cost of power, system emissions and reliability, and the ability to reach renewable targets set forth.
MAIN OBJECTIVES .........................2
THE MODEL ..................................2
MODEL INPUTS ..............................3
SUMMARY OF SCENARIOS ............3
BASE CASE ...................................4
BASE CASE – ENGINES ..................4
CASE OPTIMAL ..............................4
COMPARE – OPTIMAL VS BASE CASE ..............................................5
100% RENEWABLE ENERGY VISION ..............................6
COMPARING COSTS AND EMISSIONS BETWEEN SCENARIOS ...................9
CONCLUSIONS ............................12
2
Main Objectives z This Power System Expansion Study will objectively investigate multiple possible scenarios for the Dominican Republic power sector development, searching for the optimal path forward.
z The Study contemplates the addition of renewable resources based on the country’s targets while also optimizing the system to determine how much renewable energy the system is able to incorporate without curtailment and risks for security of supply.
z To provide multiple realistic scenarios to compare and to use for the analysis when selecting future capacity additions.
In order to remain objective, transparent and accurate, the following steps were taken:
z Utilization of globally recognized data sources for forecasting future price curves of wind power, solar PV power, and battery storage.
– Current wind and solar PV prices stated at the International Renewable Energy Agency (IRENA) report for Dominica Republic dated 2016.
– Future price learning curves for Renewable Energy Sources (RES) and storage technologies from Bloomberg New Energy Finance.
z The Model incorporates Power System Flexibility Parameters. These parameters are essential in order to accurately reflect the realities of the future – the capability and behaviour of each asset, and the additional costs that they may have when supporting and balancing the variability or intermittence of wind and solar power. Without these parameters the modelling would give different and unrealistic results and the optimum power system would seem very different. These parameters will also assist in the calculation of emissions generated and security of supply when the share of renewables grows. It is important to note that many modelling software’s do not allow incorporation of all such parameters and are therefore not suitable for analysing power systems with high renewable share.
The Model The Power System Study has been conducted utilizing PLEXOS® Energy Simulation Software. Plexos is a software developed by Energy Exemplar. Plexos has a robust simulation capability across electric, water and gas systems focusing on full user control, transparency and accuracy across numerous constraints and uncertainties. This software is widely used by system operators, utilities and consultants for power system analysis as well as system planning and dispatch optimization.
The studied time span is from year 2020 to 2030. As stated previously, the Capacity Expansion Modelling has the objective to find the optimal power system capacity mix, capable to supply the future electricity demand, with given boundaries such as future price curves for different technologies, fuel prices, and variable operation and maintenance costs (VO&M). The optimal generation capacity will supply the demand at the lowest cost, over the studied period. The reported costs include all three components (1) Capital costs (CapEx) (2) Fixed operation and maintenance costs (FO&M) (3) Variable operating costs (VO&M) such as fuel and start-up costs (OpEx).
The model is based on true chronological dispatch with hourly data for future load, wind and solar production, for the ten-year horizon. This approach provides the most accurate picture of the system´s actual dispatch, and provides accurate analysis of costs, fuel usage, emissions and system reliability. However, current Power Purchase Agreements (PPA) are not considered in the dispatch as the information is not publicly available.
The study allows the software to pick technologies in any quantity as long as this provides the lowest cost option for the power system generation costs. For each technology, characteristics such as size of plant, minimum stable load, part load heat rates, VO&M, FO&M, start-up cost, min up/down times, and investment cost are included.
System level constraints are originated from the demand, which the generating capacity needs to meet chronologically every hour. The model also includes necessary system operational reserves for maintaining the balance and reliability of the system. Primary and contingency (n-1, the biggest unit failure) reserves are included together with additional future reserve requirement for wind and solar PV balancing due to weather forecast errors.

2 3
Model InputsThe Plexos input data was received from the resources below:
Organismo Coordinador (OC)
Comisión Nacional de Energía (CNE)
Bloomberg New Energy Finance (BNEF)
Wärtsilä
z Hourly demandz Load growth forecastz Grid data z Fuel pricing
z DR Renewable targets
z Global trends z Learning curves
z Dynamic parameter for technologies based on global references
The study is a dispatch optimization for energy and operational reserves which comprehensively considers hourly energy balancing and required additional ancillary service needs caused by intermittent renewable generation. Ancillary services are considered by ensuring that 20% of wind and solar production in MWs is always available from fast reacting reserves allocated from thermal power plants to cover possible forecast error in RES production.
The country has a continuous need for load shedding which on a system level makes up approximately 15% of the energy. A high priority on political agenda’s in the DR is to stop load shedding and to ensure that the demand is met. This model assumes a 15% increase on top of current demand in order to provide the necessary electricity to meet increasing energy consumption. Annual 3.7% demand increase is applied to consider demand growth on the island.
Summary of Scenarios The Table below highlights the scenarios explained in the Executive Summary:
Scenario Purpose Added Thermal Capacity RES Capacity
Base case Current plan 600 MW CCGT build in 2024
Buildout targeting 2 GW by 2030 (70% solar and 30% wind)
Base case – engines Alternative thermal technology for base case
600 MW gas engines build in 2024
Buildout targeting 2 GW by 2030 (70% solar and 30% wind)
Optimal Least cost mix of RES and thermal
Thermal optimized – capacity, technology and schedule
RES optimized – capacity, technology and schedule
100% Renewable Energy Vision
Optimal path to 100% renewable DR power system by 2030
Thermal optimized – capacity, technology and schedule
System is forced to reach 100% RES target by 2030. Power to Gas (P2G) *
Table 1. Summary of studied scenarios (*) Power to Gas process outlined in more detail within the 100% Renewable Energy Vision scenario

0
1,000
2,000
3,000
4,000
5,000
6,000
7,000
2020 2021 2022 2023 2024 2025 2026 2027 2028 2029 2030
MW
Installed Capacity 2020-2030 – Base Case
Wind
Solar
Hydro
Engine HFO
Engine Gas
New Engine Gas
CCGT
New CCGT
Steam Turbines
Energy battery
Peak load0
5,000
10,000
15,000
20,000
25,000
30,000
2020 2021 2022 2023 2024 2025 2026 2027 2028 2029 2030G
Wh
Share of Energy 2020-2030 – Base Case
Wind
Solar
Hydro
Engine HFO
Engine Gas
New Engine Gas
New CCGT
CCGT
Steam Turbines
Shifted Energy
Native Load
4
Base Case The Base Case scenario follows the country’s current expansion plan to build 600MW of Combined Cycle Gas Turbine (CCGT) power plant capacity in the year 2024. It also follows the current targets of the DR to install 2GW of Renewable Energy Sources (RES) by 2030. Those RES consist of 70% Solar PV and 30% wind generation, and with those additions the DR renewable share raises to 27% in 2030. This RES capacity is just able to meet demand growth but not to reduce thermal production, fossil fuel imports and CO2 emission.
Figure 1 displays the generating capacity and energy share from 2020-2030.
Wind
Solar
Hydro
Engine HFO
Engine Gas
New Engine Gas
New CCGT
CCGT
Steam Turbines
Shifted Energy
Native Load0
1,000
2,000
3,000
4,000
5,000
6,000
7,000
2020 2021 2022 2023 2024 2025 2026 2027 2028 2029 2030
MW
Installed Capacity 2020-2030 – Base Case-Engines
0
5,000
10,000
15,000
20,000
25,000
30,000
2020 2021 2022 2023 2024 2025 2026 2027 2028 2029 2030
GW
h
Share of Energy 2020-2030 – Base Case-Engines
Wind
Solar
Hydro
Engine HFO
Engine Gas
New Engine Gas
CCGT
New CCGT
Steam Turbines
Energy battery
Peak load
Figure 2. Base Case-Engines installed capacity by technology (left) and share of energy by technology (right) from 2020-2030.
Figure 1. Base Case installed capacity by technology (left) and share of energy by technology (right) from 2020-2030.
Case OptimalCase Optimal displays the optimal capacity mix for the Dominican Republic for the years 2020-2030. In this scenario, Plexos optimises new thermal and RES capacity additions, technology and schedules until 2030. All in order to provide the lowest total cost and emissions for the system 2020-2030. The time line to construct all new capacity by 2030 might be too tight, but nevertheless this scenario demonstrates what would be the optimum power system to build.
Base Case – EnginesBase Case-Engines is a sensitivity scenario that measures how system dispatch and dynamics would change if instead of building the 600 MW CCGT, the DR would add 600MW of flexible capacity (gas engines) by 2024. The RES penetration target (27% of energy by 2030) is the same as Base Case and would meet the country’s clean energy targets.
4 5
0
1,000
2,000
3,000
4,000
5,000
6,000
7,000
8,000
9,000
10,000
2020 2021 2022 2023 2024 2025 2026 2027 2028 2029 2030
MW
Installed Capacity 2020-2030 – Case Optimal
Wind
Solar
Hydro
Engine HFO
Engine Gas
New Engine Gas
CCGT
New CCGT
Steam Turbines
Energy battery
Peak load0
5,000
10,000
15,000
20,000
25,000
30,000
2020 2021 2022 2023 2024 2025 2026 2027 2028 2029 2030
GW
h
Share of Energy 2020-2030 – Case Optimal
Wind
Solar
Hydro
Engine HFO
Engine Gas
New Engine Gas
New CCGT
CCGT
Steam Turbines
Shifted Energy
Native Load
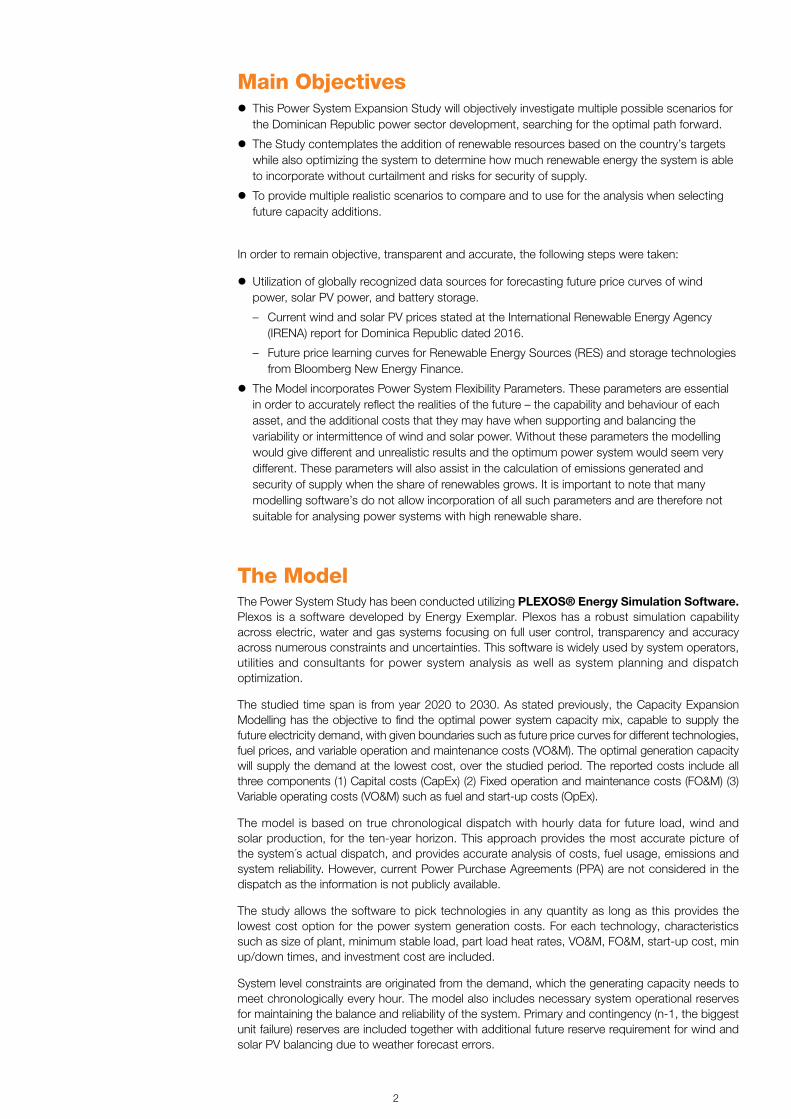
Figure 3. Case Optimal installed capacity by technology (left) and share of dispatched energy by technology (right) from 2020-2030
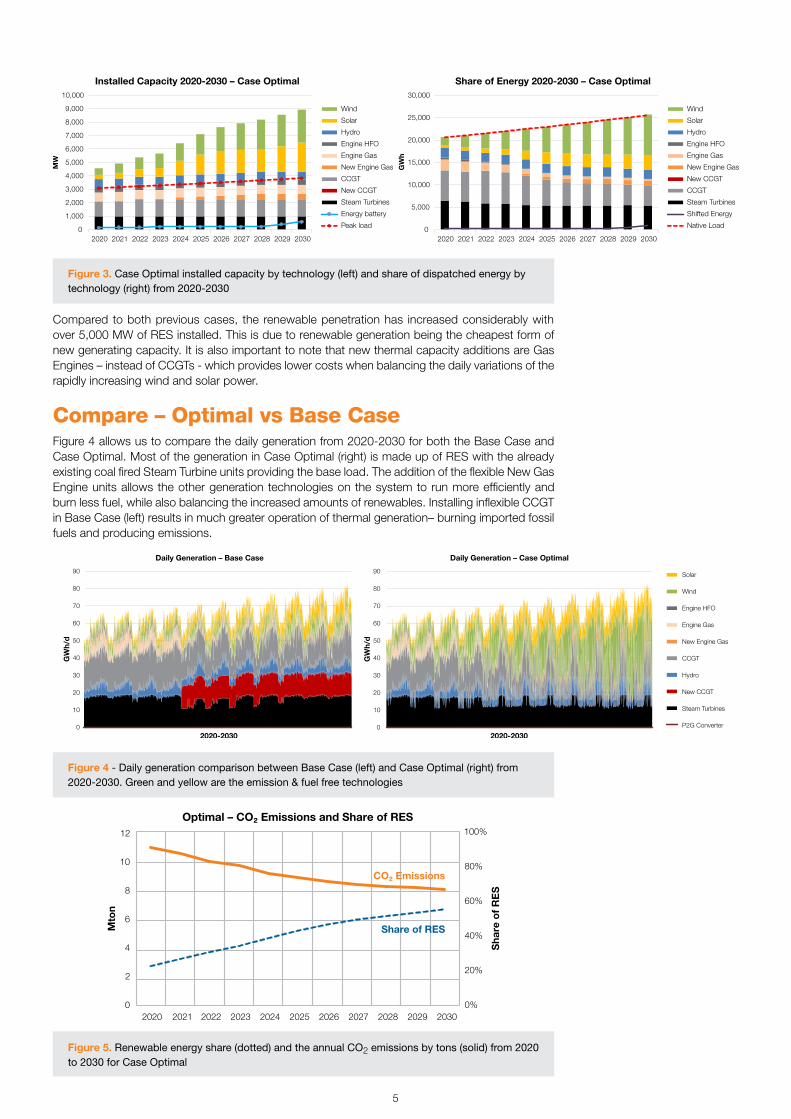
Figure 4 - Daily generation comparison between Base Case (left) and Case Optimal (right) from 2020-2030. Green and yellow are the emission & fuel free technologies
0
10
20
30
40
50
60
70
80
90
GW
h/d
2020-2030
Daily Generation – Base Case
0
10
20
30
40
50
60
70
80
90
GW
h/d
Daily Generation – Case Optimal
Solar
Wind
Engine HFO
Engine Gas
New Engine Gas
CCGT
Hydro
New CCGT
Steam Turbines
P2G Converter
2020-2030
Optimal – CO Emissions and Share of RES₂
0%
20%
40%
60%
80%
100%
0
2
4
6
8
10
12
Sh
are
of
RE
S
Mto
n
2020 2021 2022 2023 2024 2025 2026 2027 2028 2029 2030
Share of RES
CO Emissions₂
Figure 5. Renewable energy share (dotted) and the annual CO2 emissions by tons (solid) from 2020 to 2030 for Case Optimal
Compared to both previous cases, the renewable penetration has increased considerably with over 5,000 MW of RES installed. This is due to renewable generation being the cheapest form of new generating capacity. It is also important to note that new thermal capacity additions are Gas Engines – instead of CCGTs - which provides lower costs when balancing the daily variations of the rapidly increasing wind and solar power.
Compare – Optimal vs Base CaseFigure 4 allows us to compare the daily generation from 2020-2030 for both the Base Case and Case Optimal. Most of the generation in Case Optimal (right) is made up of RES with the already existing coal fired Steam Turbine units providing the base load. The addition of the flexible New Gas Engine units allows the other generation technologies on the system to run more efficiently and burn less fuel, while also balancing the increased amounts of renewables. Installing inflexible CCGT in Base Case (left) results in much greater operation of thermal generation– burning imported fossil fuels and producing emissions.
6
Table 2 below lists the findings and results when comparing Case Optimal to the previous cases.
Base Case Base Case – Engines Optimal
Cumulative savings by 2030 compared to base case - 90 MUSD 1200 MUSD
RES level by 2030 27% 27% 55%
Cumulative fuel cost savings by 2030 compared to base case - 43 MUSD 2350 MUSD
Batteries installed by 2030 317 MW/ 4 hr batteries
159 MW/ 4 hr batteries
470 MW/ 4 hr batteries
Thermal capacity added by 2030 600 MW CCGTs 600 MW engines 510 MW of engines
Wind capacity installed by 2030 600 MW 600 MW 2,450 MW
Solar capacity installed by 2030 1,465 MW 1,465 MW 1,950 MW
0%
25%
50%
75%
100%
Jan Feb Mar Apr May Jun Jul Aug Sep Oct Nov Dec
Relative Monthly Profiles for Dominican Republic
Solar
Wind
Demand
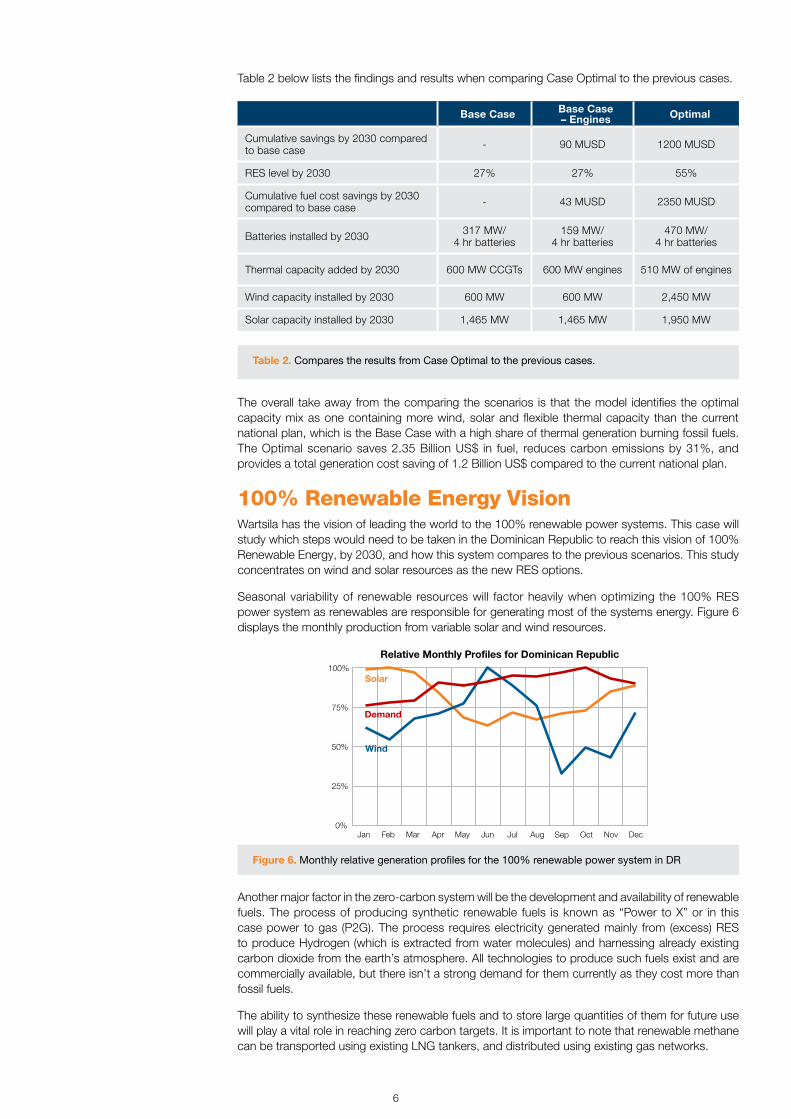
Table 2. Compares the results from Case Optimal to the previous cases.
The overall take away from the comparing the scenarios is that the model identifies the optimal capacity mix as one containing more wind, solar and flexible thermal capacity than the current national plan, which is the Base Case with a high share of thermal generation burning fossil fuels. The Optimal scenario saves 2.35 Billion US$ in fuel, reduces carbon emissions by 31%, and provides a total generation cost saving of 1.2 Billion US$ compared to the current national plan.
100% Renewable Energy VisionWartsila has the vision of leading the world to the 100% renewable power systems. This case will study which steps would need to be taken in the Dominican Republic to reach this vision of 100% Renewable Energy, by 2030, and how this system compares to the previous scenarios. This study concentrates on wind and solar resources as the new RES options.
Seasonal variability of renewable resources will factor heavily when optimizing the 100% RES power system as renewables are responsible for generating most of the systems energy. Figure 6 displays the monthly production from variable solar and wind resources.
Figure 6. Monthly relative generation profiles for the 100% renewable power system in DR
Another major factor in the zero-carbon system will be the development and availability of renewable fuels. The process of producing synthetic renewable fuels is known as “Power to X” or in this case power to gas (P2G). The process requires electricity generated mainly from (excess) RES to produce Hydrogen (which is extracted from water molecules) and harnessing already existing carbon dioxide from the earth’s atmosphere. All technologies to produce such fuels exist and are commercially available, but there isn’t a strong demand for them currently as they cost more than fossil fuels.
The ability to synthesize these renewable fuels and to store large quantities of them for future use will play a vital role in reaching zero carbon targets. It is important to note that renewable methane can be transported using existing LNG tankers, and distributed using existing gas networks.
0
20
40
60
80
100
120
140
160
Daily Generation – 100% RES Energy Vision
GW
h/d
Solar
Wind
Engine HFO
Engine Gas
New Engine Gas
CCGT
Hydro
New CCGT
Steam Turbines
P2G Converter
2020-2030
6 7
Transitioning from the current power systems to 100 % decarbonized systems does not mean there will be no power plants burning fuels. Synthetic Power to X fuels are carbon neutral and will be available in large quantities in the future for aviation, ship transport and other sectors that will also demand such fuels. These fuels will cost a magnitude of 3 to 5 times more than fossil fuels, but as wind and solar will produce most of the electricity, the necessary fuel quantities are relatively small. This extra cost is considered and included in the scenario.
For a system to be zero-carbon or 100% renewable, the dispatchable flexible generating assets must have the ability to use such synthetic renewable fuels. For the model’s purposes this study assumes that all the gas generating assets on the island can run on synthetic methane. Modern gas engines are already able to burn carbon neutral synthetic methane and methanol with high efficiency.
Due to the large amounts of daily and seasonal variance, energy storage will play a vital role in maintaining system reliability. Plexos utilizes energy storage technologies to balance the system on a daily and seasonal level. Lithium-ion batteries are used mainly for solar shifting from day to night, and to balance short term variations. Stored renewable synthetic fuels from the P2G process are used by fuel flexible thermal assets for balancing any large seasonal and daily variances, for instance extreme weather events where wind and solar are unavailable for extended periods. Dispatchable thermal assets are needed for these periods as the energy stored in batteries would not suffice. . The other option would be to build an extremely oversized battery storage, but to do this for only some rare weather events does not make economic sense.
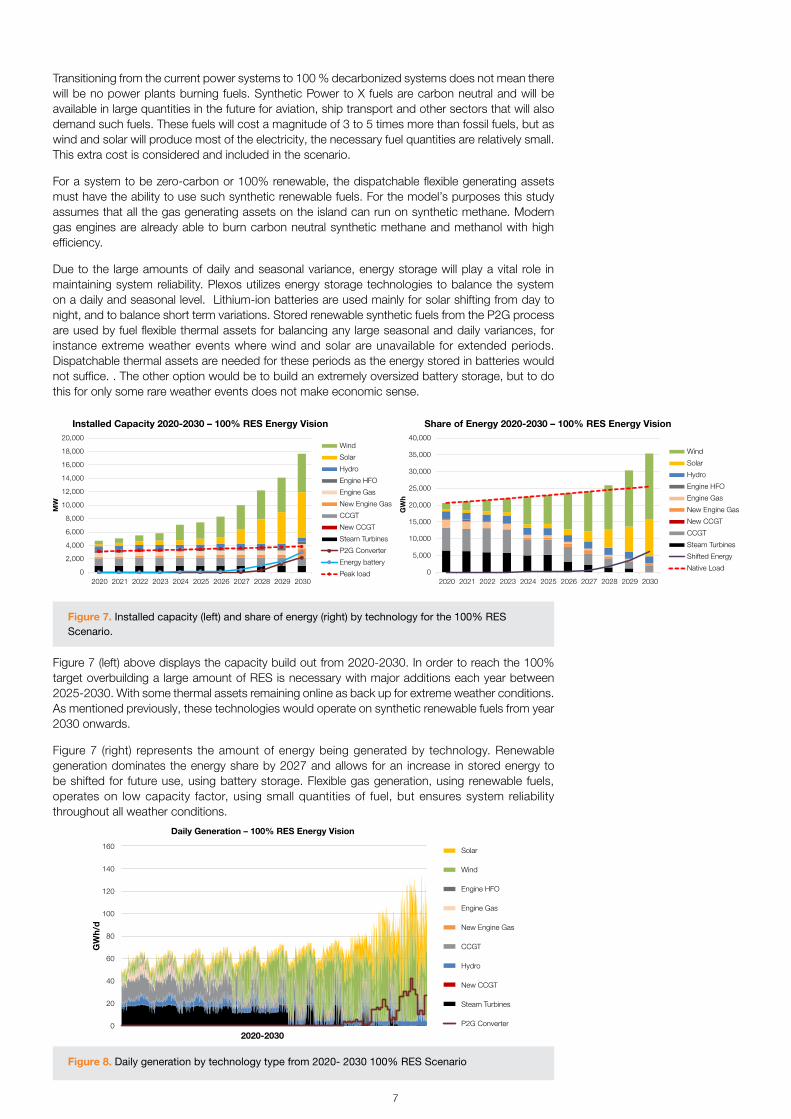
Figure 7. Installed capacity (left) and share of energy (right) by technology for the 100% RES Scenario.
0
2,000
4,000
6,000
8,000
10,000
12,000
14,000
16,000
18,000
20,000
2020 2021 2022 2023 2024 2025 2026 2027 2028 2029 2030
MW
Installed Capacity 2020-2030 – 100% RES Energy Vision
Wind
Solar
Hydro
Engine HFO
Engine Gas
New Engine Gas
CCGT
New CCGT
Steam Turbines
P2G Converter
Energy battery
Peak load 0
5,000
10,000
15,000
20,000
25,000
30,000
35,000
40,000
2020 2021 2022 2023 2024 2025 2026 2027 2028 2029 2030
GW
h
Share of Energy 2020-2030 – 100% RES Energy Vision
Wind
Solar
Hydro
Engine HFO
Engine Gas
New Engine Gas
New CCGT
CCGT
Steam Turbines
Shifted Energy
Native Load
Figure 8. Daily generation by technology type from 2020- 2030 100% RES Scenario
Figure 7 (left) above displays the capacity build out from 2020-2030. In order to reach the 100% target overbuilding a large amount of RES is necessary with major additions each year between 2025-2030. With some thermal assets remaining online as back up for extreme weather conditions. As mentioned previously, these technologies would operate on synthetic renewable fuels from year 2030 onwards.
Figure 7 (right) represents the amount of energy being generated by technology. Renewable generation dominates the energy share by 2027 and allows for an increase in stored energy to be shifted for future use, using battery storage. Flexible gas generation, using renewable fuels, operates on low capacity factor, using small quantities of fuel, but ensures system reliability throughout all weather conditions.

8
Figure 8 shows how thermal generation is on stand-by most of the time by 2030, with RES generating most of the electricity. The excess wind and solar being generated is captured and converted to renewable fuels in the Power-to-gas process.
As mentioned, in the Power to Gas (P2G Converter) process excess wind and solar can be utilised through hydrogen electrolysis and methane synthesis to produce renewable synthetic methane (natural gas). The methane is then fed to the local gas network, or liquefied to LNG, stored, and later regasified for use in flexible thermal power plants as needed. This process is indicated by the dark brown line, which rises when electricity is being consumed and converted into fuel.
Figure 9. Weekly dispatch by technology in the year 2030 for the 100% RES Scenario
0
1000
2000
3000
4000
5000
6000
7000
8000
9000
1
1.2
5
1.5
1.7
5 2
2.2
5
2.5
2.7
5 3
3.2
5
3.5
3.7
5 4
4.2
5
4.5
4.7
5 5
5.2
5
5.5
5.7
5 6
6.2
5
6.5
6.7
5 7
7.2
5
7.5
7.7
5
Mon Tue Wed Thu Fri Sat Sun
MW
Dispatch – 100% RES Energy Vision – Year 2030
Battery
Solar
Wind
Engine HFO
Engine Gas
New Engine Gas
Hydro
CCGT
New CCGT
Steam Turbines
P2G Converter
Battery charging
Demand
Figure 10. Renewable gas storage levels (left) and the monthly dispatch profile for 2030 (right) for the 100% RES Scenario
-0.02
0
0.02
0.04
0.06
0.08
0.1
0
0.25
0.5
0.75
1
Jan Feb Mar Apr May Jun Jul Aug Sep Oct Nov Dec
Ga
s S
tora
ge
le
ve
l %
of
an
nu
al d
em
an
d
Re
lati
ve
mo
nth
lt p
rofi
le
Relative Monthly Profiles for Dominican Republic in 2030
Solar
Wind
Demand
Gas Storage
-0.02
0
0.02
0.04
0.06
0.08
0.1
-500
0
500
1000
1500
2000
2500
46388
46433
46478
46523
46568
46613
46658
46703
46748
46793
46838
46883
46928
46973
47018
47063
47108
47153
47198
47243
47288
47333
47378
47423
47468
47513
47558
47603
47648
47693
47738
47783
47828
% o
f A
nn
ua
l d
em
an
d
GW
h
Renewable Gas Storage Balance
A weekly outlook on how technologies are dispatched is displayed in Figure 9. In addition to the large production of renewable energy, the batteries in the system are being used for balancing renewable variance and shifting excess solar from day to night. Power to Gas is not operating on a daily variance but instead storing fuel for longer term daily, weekly and monthly needs. The charging of batteries is indicated by dotted red line and the P2G Converter consumption is presented by the solid brown line. It should be noted that incorporating the P2G provides an adequate amount of fuel for the DR to be self-sufficient
Observing Saturday and Sunday on the graph gives an indication of how the system operates when not enough renewable energy is being produced to meet the load. During these two days flexible thermal generation is needed to balance the system, operating on renewable fuels produced by the P2G converter earlier in the week. All excess production above the demand line (solid light red line) is used to charge batteries and provide power to the P2G converters creating carbon neutral synthetic fuels, which is the only fuel for any thermal capacity at this time.
Figure 10 helps clarify how the Power-to-Gas process or renewable gas is helping the seasonal variance of wind and solar and demand. The model starts to utilize the Power-to-Gas technology in 2028 and by 2030 the maximum amount of renewable synthetic gas stored is equal to 10% of the demand in the Dominican Republic. The stored renewable gas is vital from August to November as wind production slows dramatically and the demand begins to increase. During
8 9
this period the renewable gas is used frequently in flexible thermal assets to balance the power system. Considering the Islands current LNG storage and the planned additions there is enough fuel storage available for the renewable gas by 2030.
It will be possible to import synthetic renewable fuels and the existing LNG infrastructure on the island can be utilized. This study used the excess renewable electricity to produce the fuel locally, but the cost for importing it would be similar and would not significantly impact the results.
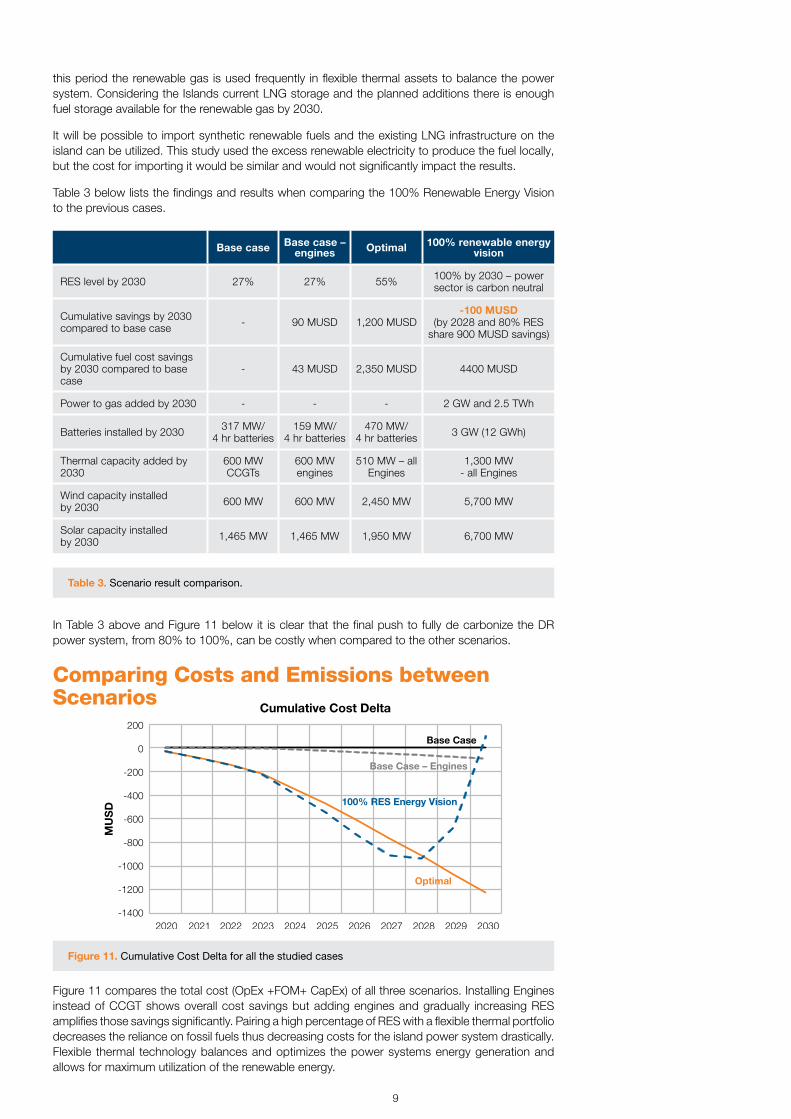
Table 3 below lists the findings and results when comparing the 100% Renewable Energy Vision to the previous cases.
Base case Base case – engines Optimal 100% renewable energy
vision
RES level by 2030 27% 27% 55% 100% by 2030 – power sector is carbon neutral
Cumulative savings by 2030 compared to base case - 90 MUSD 1,200 MUSD
-100 MUSD(by 2028 and 80% RES
share 900 MUSD savings)
Cumulative fuel cost savings by 2030 compared to base case
- 43 MUSD 2,350 MUSD 4400 MUSD
Power to gas added by 2030 - - - 2 GW and 2.5 TWh
Batteries installed by 2030 317 MW/ 4 hr batteries
159 MW/ 4 hr batteries
470 MW/ 4 hr batteries 3 GW (12 GWh)
Thermal capacity added by 2030
600 MW CCGTs
600 MW engines
510 MW – all Engines
1,300 MW - all Engines
Wind capacity installed by 2030 600 MW 600 MW 2,450 MW 5,700 MW
Solar capacity installed by 2030 1,465 MW 1,465 MW 1,950 MW 6,700 MW
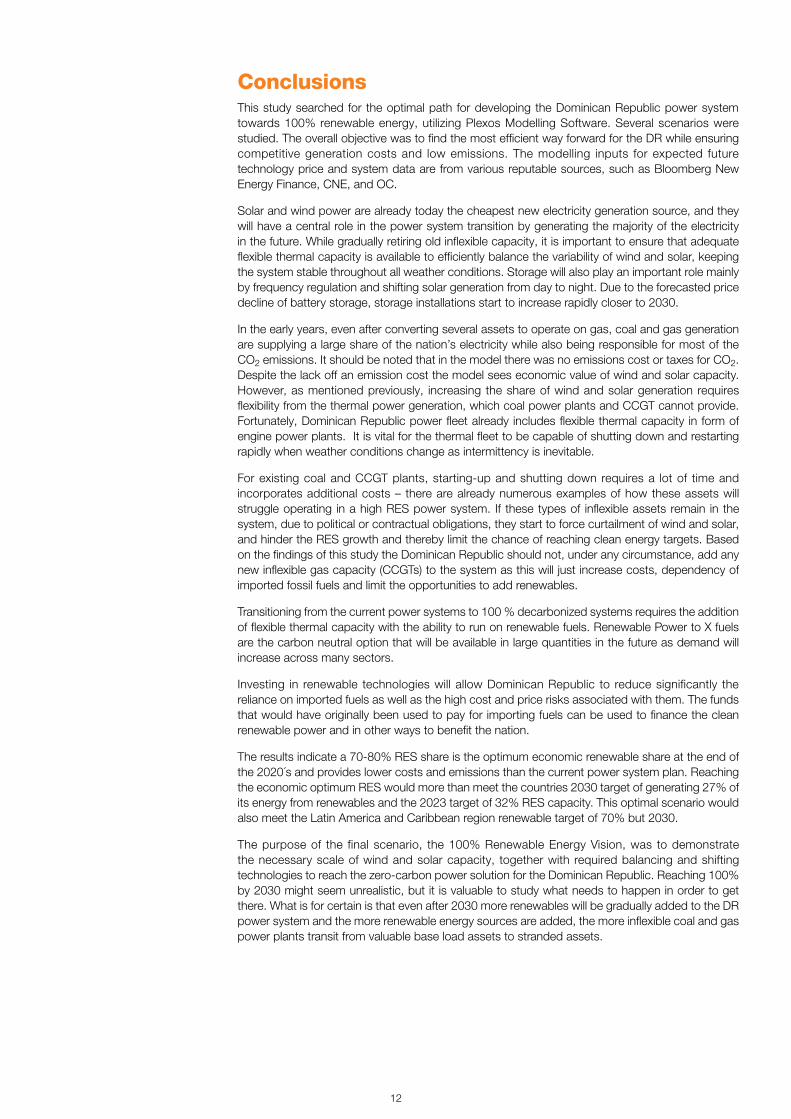
Figure 11. Cumulative Cost Delta for all the studied cases
Table 3. Scenario result comparison.
In Table 3 above and Figure 11 below it is clear that the final push to fully de carbonize the DR power system, from 80% to 100%, can be costly when compared to the other scenarios.
Comparing Costs and Emissions between Scenarios
Figure 11 compares the total cost (OpEx +FOM+ CapEx) of all three scenarios. Installing Engines instead of CCGT shows overall cost savings but adding engines and gradually increasing RES amplifies those savings significantly. Pairing a high percentage of RES with a flexible thermal portfolio decreases the reliance on fossil fuels thus decreasing costs for the island power system drastically. Flexible thermal technology balances and optimizes the power systems energy generation and allows for maximum utilization of the renewable energy.

10
Additionally, the 100% RES vision is the most feasible scenario until 2028 when RES share reaches 80%. After that based on scenario settings the system is rapidly pushed to 100 % RES share (90% by 2029 and 100% by 2030) which is not done based on economics but is forced in, due to political decisions. In these cases, costs are higher than in economically optimized scenarios. To reduce these high costs, the final year of reaching 100 % decarbonization should be moved in to the 2030´s as battery storage and solar power continue becoming more competitive.
Another comparison of costs between scenarios is outlined in Figure 12. By separating the total cost into CapEx, OpEx, and FOM we can see which portions are contributing most to the total cost by 2030. The 100% RES vision sees a large decrease in operating cost due to the amount of RES in the system by 2030. However, this scenario does see a higher CapEX as in order to reach the 100% system large amounts of renewable energy sources must be installed.
Figure 12. Cost Deltas for OpEx, FOM, and CapEx by 2030 for all the studied scenarios
Based on these results it can be said that 70-80% RES share is the optimum economic renewable share at the end of the 2020´s and provides lower costs and much lower emissions than the current power system plan. After that the steps towards carbon neutrality start to become more costly. It should be noted that while this simulation is establishing the Dominican Republic’s 100% Renewable Vision by 2030, the declining cost of technologies like batteries and the improvements of the power to Gas prosses should make the 100% renewable power system more feasible after 2030.
-5,000,000
-4,000,000
-3,000,000
-2,000,000
-1,000,000
–
1,000,000
2,000,000
3,000,000
4,000,000
OPEX FOM CAPEX
$
Total OpEx/FOM/CapEx -Delta
Base Case
Base Case – Engines
Optimal
100% RES Energy vision

10 11
Figure 13 below shows the CO2 emissions from the four studied scenarios. Along with the renewables, storage plays an important role in the emission reduction. Due to the steep decline in the cost curve for batteries, Plexos proposes, in most scenarios, to start installing storage closer to the year 2030.
It should be noted that emissions are not guaranteed to decrease just because more renewable capacity is added to a power system. For a system to decarbonize a combination of renewable energy and flexible thermal generation is required. This allows the portfolio to utilize the carbon free renewable energy without negatively impacting the reliability or operating costs of other assets on the system. This can be seen in the emission for Base Case with Engines.
0
2
4
6
8
10
12
14
2020 2021 2022 2023 2024 2025 2026 2027 2028 2029 2030
Mto
n
CO Emissions₂
0%
10%
20%
30%
40%
50%
60%
70%
80%
90%
100%
2020 2021 2022 2023 2024 2025 2026 2027 2028 2029 2030
RES Share
Base Case
Optimal
100% RES Energy Vision
Optimal
Base Case
Base Case – Engines
Base Case – Engines
100% RES Energy Vision
Figure 13. CO2 Emissions (left) and the amount RES Share (right) for all the studied cases
12
Conclusions This study searched for the optimal path for developing the Dominican Republic power system towards 100% renewable energy, utilizing Plexos Modelling Software. Several scenarios were studied. The overall objective was to find the most efficient way forward for the DR while ensuring competitive generation costs and low emissions. The modelling inputs for expected future technology price and system data are from various reputable sources, such as Bloomberg New Energy Finance, CNE, and OC.
Solar and wind power are already today the cheapest new electricity generation source, and they will have a central role in the power system transition by generating the majority of the electricity in the future. While gradually retiring old inflexible capacity, it is important to ensure that adequate flexible thermal capacity is available to efficiently balance the variability of wind and solar, keeping the system stable throughout all weather conditions. Storage will also play an important role mainly by frequency regulation and shifting solar generation from day to night. Due to the forecasted price decline of battery storage, storage installations start to increase rapidly closer to 2030.
In the early years, even after converting several assets to operate on gas, coal and gas generation are supplying a large share of the nation’s electricity while also being responsible for most of the CO2 emissions. It should be noted that in the model there was no emissions cost or taxes for CO2. Despite the lack off an emission cost the model sees economic value of wind and solar capacity. However, as mentioned previously, increasing the share of wind and solar generation requires flexibility from the thermal power generation, which coal power plants and CCGT cannot provide. Fortunately, Dominican Republic power fleet already includes flexible thermal capacity in form of engine power plants. It is vital for the thermal fleet to be capable of shutting down and restarting rapidly when weather conditions change as intermittency is inevitable.
For existing coal and CCGT plants, starting-up and shutting down requires a lot of time and incorporates additional costs – there are already numerous examples of how these assets will struggle operating in a high RES power system. If these types of inflexible assets remain in the system, due to political or contractual obligations, they start to force curtailment of wind and solar, and hinder the RES growth and thereby limit the chance of reaching clean energy targets. Based on the findings of this study the Dominican Republic should not, under any circumstance, add any new inflexible gas capacity (CCGTs) to the system as this will just increase costs, dependency of imported fossil fuels and limit the opportunities to add renewables.
Transitioning from the current power systems to 100 % decarbonized systems requires the addition of flexible thermal capacity with the ability to run on renewable fuels. Renewable Power to X fuels are the carbon neutral option that will be available in large quantities in the future as demand will increase across many sectors.
Investing in renewable technologies will allow Dominican Republic to reduce significantly the reliance on imported fuels as well as the high cost and price risks associated with them. The funds that would have originally been used to pay for importing fuels can be used to finance the clean renewable power and in other ways to benefit the nation.
The results indicate a 70-80% RES share is the optimum economic renewable share at the end of the 2020´s and provides lower costs and emissions than the current power system plan. Reaching the economic optimum RES would more than meet the countries 2030 target of generating 27% of its energy from renewables and the 2023 target of 32% RES capacity. This optimal scenario would also meet the Latin America and Caribbean region renewable target of 70% but 2030.
The purpose of the final scenario, the 100% Renewable Energy Vision, was to demonstrate the necessary scale of wind and solar capacity, together with required balancing and shifting technologies to reach the zero-carbon power solution for the Dominican Republic. Reaching 100% by 2030 might seem unrealistic, but it is valuable to study what needs to happen in order to get there. What is for certain is that even after 2030 more renewables will be gradually added to the DR power system and the more renewable energy sources are added, the more inflexible coal and gas power plants transit from valuable base load assets to stranded assets.

12 13
0
20
40
60
80
100
120
0
2000
4000
6000
8000
10000
12000
14000
16000
18000
20000
Base case Optimal 100% RES vision
RE
S%
/U
SD
/MW
h
MW
Installed New Capacity, RES share and System LCOE by 2030
P2G converter
New Thermal
Batteries
Solar
Wind
RES% at 2030
System LCOE at 2030
Figure 14. Installed new capacity, RES share and System LCOE by the year 2030 for all scenarios and sub scenarios
The purpose of this paper was to contribute to the conversation in the Dominican Republic and analyse the optional paths to develop the power system towards reduced fuel use and increased clean renewable energy. This study hopefully helps to understand the best ways forward, and the impacts of decisions made today on future cost of power, emissions, system reliability and the ability to reach renewable targets of the future.

WÄRTSILÄ ENERGY BUSINESS IN BRIEF
02.2
020
WÄRTSILÄ® is a registered trademark. Copyright © 2020 Wärtsilä Corporation.Specifications are subject to change without prior notice.
wartsila.com/energy
Wärtsilä Energy leads the transition towards a 100% renewable energy future. We help our customers unlock the value of the energy transition by optimising their energy systems and future-proofing their assets. Our offering comprises flexible power plants, energy management systems, and storage, as well as lifecycle services that enable increased efficiency and guaranteed performance. Wärtsilä has 72 GW of installed power plant capacity in 180 countries around the world.